WO2022149262A1 - 制御装置、制御方法、およびプログラム - Google Patents
制御装置、制御方法、およびプログラム Download PDFInfo
- Publication number
- WO2022149262A1 WO2022149262A1 PCT/JP2021/000482 JP2021000482W WO2022149262A1 WO 2022149262 A1 WO2022149262 A1 WO 2022149262A1 JP 2021000482 W JP2021000482 W JP 2021000482W WO 2022149262 A1 WO2022149262 A1 WO 2022149262A1
- Authority
- WO
- WIPO (PCT)
- Prior art keywords
- service
- service graph
- graph
- update
- control device
- Prior art date
- Legal status (The legal status is an assumption and is not a legal conclusion. Google has not performed a legal analysis and makes no representation as to the accuracy of the status listed.)
- Ceased
Links
Images






Classifications
-
- G—PHYSICS
- G05—CONTROLLING; REGULATING
- G05B—CONTROL OR REGULATING SYSTEMS IN GENERAL; FUNCTIONAL ELEMENTS OF SUCH SYSTEMS; MONITORING OR TESTING ARRANGEMENTS FOR SUCH SYSTEMS OR ELEMENTS
- G05B23/00—Testing or monitoring of control systems or parts thereof
- G05B23/02—Electric testing or monitoring
- G05B23/0205—Electric testing or monitoring by means of a monitoring system capable of detecting and responding to faults
- G05B23/0259—Electric testing or monitoring by means of a monitoring system capable of detecting and responding to faults characterized by the response to fault detection
- G05B23/0283—Predictive maintenance, e.g. involving the monitoring of a system and, based on the monitoring results, taking decisions on the maintenance schedule of the monitored system; Estimating remaining useful life [RUL]
-
- G—PHYSICS
- G05—CONTROLLING; REGULATING
- G05B—CONTROL OR REGULATING SYSTEMS IN GENERAL; FUNCTIONAL ELEMENTS OF SUCH SYSTEMS; MONITORING OR TESTING ARRANGEMENTS FOR SUCH SYSTEMS OR ELEMENTS
- G05B23/00—Testing or monitoring of control systems or parts thereof
- G05B23/02—Electric testing or monitoring
- G05B23/0205—Electric testing or monitoring by means of a monitoring system capable of detecting and responding to faults
- G05B23/0218—Electric testing or monitoring by means of a monitoring system capable of detecting and responding to faults characterised by the fault detection method dealing with either existing or incipient faults
- G05B23/0224—Process history based detection method, e.g. whereby history implies the availability of large amounts of data
- G05B23/024—Quantitative history assessment, e.g. mathematical relationships between available data; Functions therefor; Principal component analysis [PCA]; Partial least square [PLS]; Statistical classifiers, e.g. Bayesian networks, linear regression or correlation analysis; Neural networks
-
- G—PHYSICS
- G06—COMPUTING OR CALCULATING; COUNTING
- G06F—ELECTRIC DIGITAL DATA PROCESSING
- G06F11/00—Error detection; Error correction; Monitoring
- G06F11/30—Monitoring
- G06F11/34—Recording or statistical evaluation of computer activity, e.g. of down time, of input/output operation ; Recording or statistical evaluation of user activity, e.g. usability assessment
Definitions
- the present invention relates to a control device, a control method, and a program.
- microservice architectures have become widespread, in which applications that provide services such as the Web and ICT are divided into components for each function, and the components communicate with each other and operate in a chain.
- management of microservices not only resource-level metrics monitoring and log monitoring, but also application-level monitoring is used together. For example, by aggregating and monitoring logs of events that occur during application execution and metrics in the application (number of HTTP requests, number of transactions, waiting time for each request, etc.), anomaly detection and root causes in complex microservices can be detected. It can be useful for the analysis of.
- Non-Patent Documents 1 and 2 are black box-based tracing software that acquires operation history data without modifying the application itself.
- Non-Patent Documents 3 and 4 are annotation-based tracing software for acquiring operation history data by modifying an application.
- innumerable monitoring data at the application level is accumulated each time the application is used, it is not realistic for a person to check each data in real time.
- in order to discover monitoring data that can be said to be abnormal from the monitoring data it is necessary to discover the discrepancy between the definition of normal and normal, but it is not possible to manually extract a normal operation model from a large amount of monitoring data.
- the inventors estimated the dependency between components in "Proposal of service graph construction method based on trace data of multiple cooperation services" (Shinkyo Giho, vol. 119, no. 438), and Petri net. Proposed a method to build a service graph showing the dependencies between the components of the entire service. As a result, it is possible to construct a service graph showing the dependency between components by using the monitoring data. It is considered that abnormal behavior can be detected by detecting monitoring data that does not follow the constructed service graph.
- the present invention has been made in view of the above, and an object thereof is to keep a graph model showing component dependencies up-to-date.
- the control device of one aspect of the present invention maintains and manages a service that realizes a specific function by operating a plurality of components in a chain using a service graph showing the dependency relationship between the components constituting the service.
- a control device that controls the operation phase of the maintenance management system, the acquisition unit that acquires the update information of the service, the determination unit that determines the update convergence of the service graph, and the operation when the update information is received. It is provided with a control unit in which the phase is a learning phase for updating the service graph and the operation phase is a detection phase for detecting an abnormality using the service graph when it is determined that the update of the service graph has converged. ..
- the graph model representing the component dependency can be kept up to date.
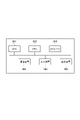
- FIG. 1 is a diagram showing an example of an overall configuration of a maintenance management system including the control device of the present embodiment.
- FIG. 2 is a functional block diagram showing an example of the configuration of the control device.
- FIG. 3 is a sequence diagram showing an example of the processing flow of the maintenance management system.
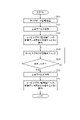
- FIG. 4 is a flowchart showing an example of the processing flow of the control device.
- FIG. 5 is a diagram showing an example of trace data.
- FIG. 6 is a diagram in which the components are represented by Petri nets.
- FIG. 7 is a diagram showing the parent-child relationship between components in Petri net.
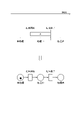
- FIG. 8 is a diagram showing the order relationship between components by petri net.
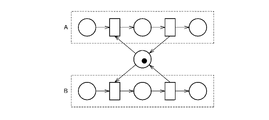
- FIG. 9 is a diagram in which the exclusive relationship between the components is represented by a Petri net.
- FIG. 10 is a diagram showing an example of a service graph.
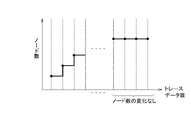
- FIG. 11 is a diagram for explaining that the convergence judgment is made based on the change in the number of nodes.
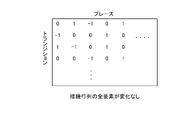
- FIG. 12 is a diagram showing an example of a connection matrix in a Petri net.
- FIG. 13 is a diagram showing an example of the hardware configuration of the control device.
- the maintenance management system of FIG. 1 includes a control device 10, a service monitoring device 20, a monitoring data distribution device 30, a service graph generation device 40, a service graph holding device 50, and a service graph analysis device 60.
- the monitored service 100 includes a plurality of components, and the plurality of components operate in a chain to realize a specific function.
- a component is a program that has an interface that can send and receive requests and responses to and from other components, and is implemented in various programming languages.
- the developer performs development work in the development environment 110 and updates the monitored service 100.
- the development environment 110 notifies the control device 10 of the update timing notification.
- the service monitoring device 20 is a device that monitors the monitored service 100 at the application level, and visualizes the movement of the component for one request.
- the techniques of Non-Patent Documents 1 to 4 can be used for the service monitoring device 20.
- the service monitoring device 20 records the processing in each component of the monitored service 100 in the form of a span, and trace data (hereinafter, also referred to as monitoring data) a series of flow of the operation of the monitored service 100 for one request.
- trace data hereinafter, also referred to as monitoring data
- a code for carrying a label is embedded in each component of the monitored service 100 so that a span can be acquired.
- the service monitoring device 20 displays the visualized monitoring data to the maintenance person. The maintainer can confirm the behavior of the monitored service 100 at the application level with the visualized monitoring data.
- the monitoring data distribution device 30 receives monitoring data from the service monitoring device 20, and distributes the monitoring data to the service graph generation device 40 or to the service graph analysis device 60 according to the operation phase of the maintenance management system. do. Specifically, the monitoring data distribution device 30 distributes the monitoring data to the service graph generation device 40 in the learning phase, and distributes the monitoring data to the service graph analysis device 60 in the detection phase. In the learning phase, the service graph is updated based on the monitoring data by the service graph generation device 40. In the detection phase, the service graph analysis device 60 checks the monitoring data in the service graph.
- the service graph is a graph structure showing the dependency relationships between the components constituting the monitored service 100. The service graph can be used to express the state transition of a series of flows of the operation of the monitored service 100.
- the monitoring data distribution device 30 switches the distribution destination of the monitoring data based on the instruction from the control device 10.
- the service graph generation device 40 receives monitoring data during the learning phase, estimates the dependency between components from the monitoring data, updates the service graph based on the estimated dependency, and services the service graph holding device 50. Store the graph.
- the service graph holding device 50 holds the service graph.
- the service graph held by the service graph holding device 50 is displayed to the maintenance person, or the service graph analysis device 60 is used for analyzing the monitoring data.
- the service graph held by the service graph holding device 50 is given a normal label
- the normal label is deleted from the service graph.
- the service graph with the normal label is a normal model in which the update of the graph has converged and is confirmed.
- the service graph analysis device 60 receives the monitoring data during the detection phase, checks the feasibility of the state transition of the monitoring data in the service graph, determines whether or not the behavior is abnormal, and maintains the analysis result. Present to the person.
- the control device 10 switches the operation phase of the maintenance management system based on the reception of the update information from the development environment 110 and the convergence judgment of the service graph. Specifically, when the control device 10 receives the update information of the monitored service 100 from the development environment 110 during the detection phase, the control device 10 shifts to the learning phase according to the update, and the distribution destination of the monitoring data is the service graph generation device 40. Give instructions to switch. The control device 10 determines that the update of the service graph held by the service graph holding device 50 has converged during the learning phase, and when it determines that the update of the service graph has converged, the control device 10 shifts to the detection phase and services the distribution destination of the monitoring data. Give an instruction to switch to the graph analysis device 60.
- the configuration of the control device 10 will be described with reference to FIG.
- the control device 10 shown in the figure includes an acquisition unit 11, a control unit 12, and a determination unit 13.
- the acquisition unit 11 When the acquisition unit 11 acquires the update information from the development environment 110, the acquisition unit 11 notifies the control unit 12 and the determination unit 13 of the start of learning in accordance with the update of the monitored service 100.
- the acquisition unit 11 may periodically inquire of the development environment 110 for update information, or may notify the control device 10 of the update information when the development environment 110 updates the monitored service 100.
- the learning phase is set.
- the control unit 12 transmits an instruction to switch the distribution destination of the monitoring data to the monitoring data distribution device 30 according to the phase. Specifically, when the control unit 12 receives the notification of the start of learning from the acquisition unit 11, it transmits an instruction to start distribution of the monitoring data to the service graph generation device 40 to the monitoring data distribution device 30, and the determination unit 13 sends an instruction to start distribution to the monitoring data distribution device 30. Upon receiving the notification of the end of learning, an instruction to start distribution of the monitoring data to the service graph analysis device 60 is transmitted to the monitoring data distribution device 30.
- the determination unit 13 Upon receiving the notification of the start of learning, the determination unit 13 deletes the normal label from the service graph held by the service graph holding device 50, starts monitoring the service graph, and checks the update of the service graph.
- the determination unit 13 receives the service graph information from the service graph holding device 50, monitors the service graph, and determines whether or not the update of the service graph has converged.
- the determination unit 13 determines that the update of the service graph has converged when there is no change in the service graph held by the service graph holding device 50 for a predetermined period or longer.
- the determination unit 13 assigns a normal label to the service graph held by the service graph holding device 50 and notifies the control unit 12 of the end of learning.
- the determination unit 13 determines that the update of the service graph has converged and notifies the end of learning, the detection phase is entered.
- step S1 the control device 10 acquires update information from the development environment 110. At this point, it is assumed that the maintenance management system is in the detection phase and the monitoring data distribution device 30 distributes the monitoring data to the service graph analysis device 60.
- step S2 the control device 10 deletes the normal label from the service graph held by the service graph holding device 50, and in step S3, the monitoring data distribution gives an instruction to switch the distribution destination of the monitoring data to the service graph generation device 40. Send to device 30.
- step S3 the learning phase is entered, and the monitoring data is distributed to the service graph generator 40.
- the distribution of the monitoring data to the service graph analysis device 60 is stopped.
- the service graph generation device 40 receives the monitoring data and starts updating the service graph held by the service graph holding device 50.
- step S4 the control device 10 acquires the service graph information from the service graph generation device 40, and in step S5, determines whether or not the update of the service graph has converged.
- the control device 10 repeats the processes of steps S4 and S5 until it is determined that the update of the service graph has converged.
- step S6 the control device 10 assigns a normal label to the service graph held by the service graph holding device 50, and in step S7, the distribution destination of the monitoring data is the service graph analysis device. An instruction to switch to 60 is issued to the monitoring data distribution device 30.
- step S7 the detection phase is entered and the monitoring data is distributed to the service graph analysis device 60.
- the distribution of the monitoring data to the service graph generation device 40 is stopped.
- the service graph analysis device 60 receives the monitoring data and starts abnormality detection of the monitoring data using the service graph held by the service graph holding device 50.
- step S11 the acquisition unit 11 receives the update information. Upon receiving the update information, the acquisition unit 11 notifies the control unit 12 and the determination unit 13 of the start of learning.
- step S12 the determination unit 13 deletes the normal label from the service graph held by the service graph holding device 50.
- step S13 the control unit 12 issues an instruction to start distribution of monitoring data to the service graph generation device 40.
- step S14 the determination unit 13 checks for the update of the service graph.
- step S15 the determination unit 13 determines whether or not the update of the service graph has converged.
- the determination unit 13 repeats the processes of steps S14 and S15.
- step S16 the determination unit 13 assigns a normal label to the service graph held by the service graph holding device 50.
- the determination unit 13 determines that the update of the service graph has converged, the determination unit 13 notifies the control unit 12 of the end of learning.
- step S17 the control unit 12 issues an instruction to start distribution of monitoring data to the service graph analysis device 60.
- Trace data is a set of spans that make up a series of processes from request to response to the monitored service 100. For example, one trace data from one end user's request to the response to the monitored service 100 can be obtained.
- the span is data that records the time data of the processing of each component and the parent-child relationship.
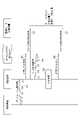
- FIG. 5 shows an example of the visualized trace data. In FIG. 5, time is taken on the horizontal axis, and the processing period of the component is represented by the width of a rectangle. Each of the five rectangles with the letters A to E indicates the span of each component. Arrows indicate sending and receiving requests and responses between components.
- the span includes, for example, component name (Name), trace ID (TraceID), processing start time (StartTime), processing time (Duration), and relationship (Reference) information.
- the service graph generator 40 estimates the dependency between components from the time information of each span of the trace data, and based on the estimated dependency, represents the service graph at the component level of the entire monitored service 100 in Petri net. do.
- Petri nets are two-part directed graphs that have two types of nodes, places and transitions, where places and transitions are connected by an arc. A variable called a token is given to the place. When a transition fires, it transfers the tokens of all places that exist before it to all places that exist after it.
- one component Petri net is defined as shown in FIG. Specifically, there are three types of states that the component can take: “unprocessed”, “processing”, and “processed”, and these three types of states are associated with places.
- the state transition of the component is expressed by moving the token by firing the transition (process start or process end) provided between the places.
- the black circles placed in the unprocessed places of FIG. 6 are tokens. When the component shown in FIG. 6 starts processing, the token is moved to the place being processed.
- Dependencies between components can be expressed by adding arcs and places to the Petri nets of the components shown in FIG. Specifically, as shown in FIGS. 7 to 9, a parent-child relationship, an order relationship, and an exclusive relationship between components are expressed.
- a parent-child relationship is one in which one component calls the other.
- An ordinal relationship is one in which one component is always executed after the processing of the other component.
- An exclusive relationship is a relationship between components that do not execute processing in parallel.
- the parent-child relationship between components A and B can be expressed as shown in FIG.
- the arc is placed from the processing start transition of the parent component A to the unprocessed place of the child component B, and the arc is placed from the processed place of the child component B to the processing end transition of the parent component A.
- the processing of the component B starts after the processing of the component A starts, the processing of the component B ends after the processing of the component B ends, the processing of the component B ends, and then the processing of the component A ends.
- the order relationship between components A and B can be expressed as shown in FIG.
- a new arc and place are placed from the transition at the end of processing of component A, and an arc is placed from the transition at the start of processing of component B from the new place. Thereby, it can be expressed that the processing of the component B starts after the processing of the component A is completed.
- the exclusive relationship between components A and B can be expressed as shown in FIG. Place a new place indicating that neither component A nor component B is being processed, and place a token in the new place.
- An arc is placed in a new place from each of the transitions at the end of processing of the components A and B, and an arc is placed in each of the transitions at the start of processing of the components A and B from the new place.
- FIG. 10 shows an example of a service graph of the monitored service 100.
- the service graph generator 40 compares the time data between the spans of the sibling components for each of the trace data included in the monitoring data, and the order relationship between the components. Or estimate the exclusive relationship and update the service graph.
- the service graph generator 40 adds a graph showing the dependency by the above method for the newly discovered dependency between the components, and deletes the graph showing the dependency for the lost dependency. ..
- the control device 10 can check the number of nodes (number of places + number of transitions) of the service graph and the connection matrix in Petri net to determine whether or not the update of the service graph has converged.
- the control device 10 is a service graph when the number of nodes does not change as shown in FIG. 11 and all the elements of the connection matrix in the petri net shown in FIG. 12 do not change with respect to the circulation of a certain number of trace data. Judge that the update of is converged. Since there is a possibility that the connection matrix has changed even if the number of nodes has not changed, the control device 10 first monitors the number of nodes, and if the number of nodes does not change, confirms each element of the connection matrix.
- the control device 10 of the present embodiment has an acquisition unit 11 for acquiring update information of the monitored service 100, a determination unit 13 for determining update convergence of the service graph, and when the update information is received.
- the control unit 12 is provided with an operation phase as a learning phase for updating the service graph, and an operation phase as a detection phase for detecting an abnormality using the service graph when it is determined that the update of the service graph has converged.
- the control device 10 distributes the monitoring data to the service graph generation device 40 during the learning phase, and distributes the monitoring data to the service graph analysis device 60 during the detection phase.
- the service graph that represents can be kept up to date.
- the control device 10 described above includes, for example, a central processing unit (CPU) 901, a memory 902, a storage 903, a communication device 904, an input device 905, and an output device 906, as shown in FIG.
- CPU central processing unit
- a general-purpose computer system can be used.
- the control device 10 is realized by the CPU 901 executing a predetermined program loaded on the memory 902.
- This program can be recorded on a computer-readable recording medium such as a magnetic disk, an optical disk, or a semiconductor memory, or can be distributed via a network.
Landscapes
- Engineering & Computer Science (AREA)
- Physics & Mathematics (AREA)
- General Physics & Mathematics (AREA)
- Automation & Control Theory (AREA)
- Artificial Intelligence (AREA)
- Evolutionary Computation (AREA)
- Mathematical Physics (AREA)
- General Engineering & Computer Science (AREA)
- Theoretical Computer Science (AREA)
- Computer Hardware Design (AREA)
- Quality & Reliability (AREA)
- Debugging And Monitoring (AREA)
Abstract
Description
11…取得部
12…制御部
13…判定部
20…サービス監視装置
30…監視データ流通装置
40…サービスグラフ生成装置
50…サービスグラフ保持装置
60…サービスグラフ解析装置
100…監視対象サービス
110…開発環境
Claims (6)
- 複数のコンポーネントが連鎖的に動作することで特定の機能を実現するサービスを当該サービスを構成するコンポーネント間の依存関係を表すサービスグラフを利用して保守管理する保守管理システムの動作フェーズを制御する制御装置であって、
前記サービスのアップデート情報を取得する取得部と、
前記サービスグラフの更新収束を判定する判定部と、
前記アップデート情報を受信したときに前記動作フェーズを前記サービスグラフの更新を行う学習フェーズとし、前記サービスグラフの更新が収束したと判定されたときに前記動作フェーズを前記サービスグラフを利用して異常を検知する検知フェーズとする制御部を備える
制御装置。 - 請求項1に記載の制御装置であって、
前記保守管理システムは、前記サービスでの一連の処理に関する情報を含む監視データを用いて前記サービスグラフを更新する生成装置と、前記サービスグラフを利用して前記監視データから異常を検知する解析装置を備え、
前記制御部は、学習フェーズ中は前記監視データを前記生成装置へ流通させ、検知フェーズ中は前記監視データを前記解析装置へ流通させる
制御装置。 - 請求項1または2に記載の制御装置であって、
前記サービスグラフは、前記コンポーネントの処理前、処理中、および処理後の状態をペトリネットのプレースとして表現し、前記コンポーネントの処理開始および処理終了をペトリネットのトランジションとして表現し、前記コンポーネント間の依存関係を前記コンポーネントのペトリネット間に新たなノードとアークを配置して表現したものである
制御装置。 - 請求項3に記載の制御装置であって、
前記判定部は、一定の間、前記サービスグラフのノード数に変化がなく、ペトリネットにおける接続行列に変化がないときに、前記サービスグラフの更新が収束したと判定する
制御装置。 - 複数のコンポーネントが連鎖的に動作することで特定の機能を実現するサービスを当該サービスを構成するコンポーネント間の依存関係を表すサービスグラフを利用して保守管理する保守管理システムの動作フェーズを制御する制御装置による制御方法であって、
前記サービスのアップデート情報を取得するステップと、
前記サービスグラフの更新収束を判定するステップと、
前記アップデート情報を受信したときに前記動作フェーズを前記サービスグラフの更新を行う学習フェーズとするステップと、
前記サービスグラフの更新が収束したと判定されたときに前記動作フェーズを前記サービスグラフを利用して異常を検知する検知フェーズとするステップを有する
制御方法。 - 請求項1ないし4のいずれかに記載の制御装置の各部としてコンピュータを動作させるプログラム。
Priority Applications (3)
| Application Number | Priority Date | Filing Date | Title |
|---|---|---|---|
| PCT/JP2021/000482 WO2022149262A1 (ja) | 2021-01-08 | 2021-01-08 | 制御装置、制御方法、およびプログラム |
| JP2022573877A JP7522369B2 (ja) | 2021-01-08 | 2021-01-08 | 制御装置、制御方法、およびプログラム |
| US18/268,375 US20240019862A1 (en) | 2021-01-08 | 2021-01-08 | Control apparatus, control method, and program |
Applications Claiming Priority (1)
| Application Number | Priority Date | Filing Date | Title |
|---|---|---|---|
| PCT/JP2021/000482 WO2022149262A1 (ja) | 2021-01-08 | 2021-01-08 | 制御装置、制御方法、およびプログラム |
Publications (1)
| Publication Number | Publication Date |
|---|---|
| WO2022149262A1 true WO2022149262A1 (ja) | 2022-07-14 |
Family
ID=82357847
Family Applications (1)
| Application Number | Title | Priority Date | Filing Date |
|---|---|---|---|
| PCT/JP2021/000482 Ceased WO2022149262A1 (ja) | 2021-01-08 | 2021-01-08 | 制御装置、制御方法、およびプログラム |
Country Status (3)
| Country | Link |
|---|---|
| US (1) | US20240019862A1 (ja) |
| JP (1) | JP7522369B2 (ja) |
| WO (1) | WO2022149262A1 (ja) |
Family Cites Families (7)
| Publication number | Priority date | Publication date | Assignee | Title |
|---|---|---|---|---|
| US20070043803A1 (en) * | 2005-07-29 | 2007-02-22 | Microsoft Corporation | Automatic specification of semantic services in response to declarative queries of sensor networks |
| US8738968B2 (en) * | 2011-03-08 | 2014-05-27 | Telefonaktiebolaget L M Ericsson (Publ) | Configuration based service availability analysis of AMF managed systems |
| US20160342453A1 (en) * | 2015-05-20 | 2016-11-24 | Wanclouds, Inc. | System and methods for anomaly detection |
| CN110908855A (zh) | 2018-09-18 | 2020-03-24 | 深圳市鸿合创新信息技术有限责任公司 | 一种微服务运行维护装置及方法、电子设备 |
| US10805171B1 (en) * | 2019-08-01 | 2020-10-13 | At&T Intellectual Property I, L.P. | Understanding network entity relationships using emulation based continuous learning |
| CN110888783B (zh) | 2019-11-21 | 2023-07-07 | 望海康信(北京)科技股份公司 | 微服务系统的监测方法、装置以及电子设备 |
| US11727016B1 (en) * | 2021-04-15 | 2023-08-15 | Splunk Inc. | Surfacing and displaying exemplary spans from a real user session in response to a query |
-
2021
- 2021-01-08 US US18/268,375 patent/US20240019862A1/en active Pending
- 2021-01-08 WO PCT/JP2021/000482 patent/WO2022149262A1/ja not_active Ceased
- 2021-01-08 JP JP2022573877A patent/JP7522369B2/ja active Active
Non-Patent Citations (1)
| Title |
|---|
| SAKAI, MASARU ET AL.: "A service graph construction method based on distributed tracing data of multiple cooperation services", IEICE TECHNICAL REPORT, vol. 119, no. 438, 27 April 2020 (2020-04-27), pages 5 - 10, XP009538591 * |
Also Published As
| Publication number | Publication date |
|---|---|
| JPWO2022149262A1 (ja) | 2022-07-14 |
| US20240019862A1 (en) | 2024-01-18 |
| JP7522369B2 (ja) | 2024-07-25 |
Similar Documents
| Publication | Publication Date | Title |
|---|---|---|
| JP4809772B2 (ja) | コンピュータシステムおよび分散アプリケーションのモデルに基づく管理 | |
| US7493387B2 (en) | Validating software in a grid environment using ghost agents | |
| Trihinas et al. | Monitoring elastically adaptive multi-cloud services | |
| JP2013513860A (ja) | クラウドコンピューティングのモニタリングと管理システム | |
| Amaxilatis et al. | Advancing experimentation-as-a-service through urban IoT experiments | |
| Vizarreta et al. | Dason: Dependability assessment framework for imperfect distributed sdn implementations | |
| Schnorr et al. | Detection and analysis of resource usage anomalies in large distributed systems through multi‐scale visualization | |
| US10122602B1 (en) | Distributed system infrastructure testing | |
| US8271407B2 (en) | Method and monitoring system for the rule-based monitoring of a service-oriented architecture | |
| US12481543B2 (en) | Cloud-distributed application runtime—an emerging layer of multi-cloud application services fabric | |
| Soldani et al. | Failure root cause analysis for microservices, explained | |
| Savant et al. | Cloud-native cdn monitoring using ci/cd | |
| Bellavista et al. | GAMESH: A grid architecture for scalable monitoring and enhanced dependable job scheduling | |
| JP7522368B2 (ja) | 解析装置、解析方法、およびプログラム | |
| JP7522369B2 (ja) | 制御装置、制御方法、およびプログラム | |
| CN112703485A (zh) | 使用机器学习方法支持对分布式系统内的计算环境的修改的实验评估 | |
| US11748226B2 (en) | Service graph generator, service graph generation method, and program | |
| Fernando | Implementing Observability for Enterprise Software Systems | |
| WO2022118427A1 (ja) | 異常検知支援装置、異常検知支援方法及びプログラム | |
| Guo et al. | On the performance and power consumption analysis of elastic clouds | |
| AU2004279195B2 (en) | Model-based management of computer systems and distributed applications | |
| CN112639739A (zh) | 在至少两个不同级别的平台的计算机上分发特定应用的子应用 | |
| Lingamallu et al. | AWS Observability Handbook: Monitor, trace, and alert your cloud applications with AWS'myriad observability tools | |
| Markande et al. | Leveraging potential of cloud for software performance testing | |
| Makiyah et al. | A reinforcement learning framework for self-healing fault recovery in intent-based SDNs |
Legal Events
| Date | Code | Title | Description |
|---|---|---|---|
| 121 | Ep: the epo has been informed by wipo that ep was designated in this application |
Ref document number: 21917488 Country of ref document: EP Kind code of ref document: A1 |
|
| ENP | Entry into the national phase |
Ref document number: 2022573877 Country of ref document: JP Kind code of ref document: A |
|
| WWE | Wipo information: entry into national phase |
Ref document number: 18268375 Country of ref document: US |
|
| NENP | Non-entry into the national phase |
Ref country code: DE |
|
| 122 | Ep: pct application non-entry in european phase |
Ref document number: 21917488 Country of ref document: EP Kind code of ref document: A1 |