WO2022130520A1 - パターン計測装置 - Google Patents
パターン計測装置 Download PDFInfo
- Publication number
- WO2022130520A1 WO2022130520A1 PCT/JP2020/046854 JP2020046854W WO2022130520A1 WO 2022130520 A1 WO2022130520 A1 WO 2022130520A1 JP 2020046854 W JP2020046854 W JP 2020046854W WO 2022130520 A1 WO2022130520 A1 WO 2022130520A1
- Authority
- WO
- WIPO (PCT)
- Prior art keywords
- amount
- pattern
- center
- relationship
- gravity
- Prior art date
- Legal status (The legal status is an assumption and is not a legal conclusion. Google has not performed a legal analysis and makes no representation as to the accuracy of the status listed.)
- Ceased
Links
Images







Classifications
-
- G—PHYSICS
- G01—MEASURING; TESTING
- G01B—MEASURING LENGTH, THICKNESS OR SIMILAR LINEAR DIMENSIONS; MEASURING ANGLES; MEASURING AREAS; MEASURING IRREGULARITIES OF SURFACES OR CONTOURS
- G01B15/00—Measuring arrangements characterised by the use of electromagnetic waves or particle radiation, e.g. by the use of microwaves, X-rays, gamma rays or electrons
- G01B15/04—Measuring arrangements characterised by the use of electromagnetic waves or particle radiation, e.g. by the use of microwaves, X-rays, gamma rays or electrons for measuring contours or curvatures
-
- G—PHYSICS
- G01—MEASURING; TESTING
- G01N—INVESTIGATING OR ANALYSING MATERIALS BY DETERMINING THEIR CHEMICAL OR PHYSICAL PROPERTIES
- G01N23/00—Investigating or analysing materials by the use of wave or particle radiation, e.g. X-rays or neutrons, not covered by groups G01N3/00 – G01N17/00, G01N21/00 or G01N22/00
- G01N23/22—Investigating or analysing materials by the use of wave or particle radiation, e.g. X-rays or neutrons, not covered by groups G01N3/00 – G01N17/00, G01N21/00 or G01N22/00 by measuring secondary emission from the material
- G01N23/225—Investigating or analysing materials by the use of wave or particle radiation, e.g. X-rays or neutrons, not covered by groups G01N3/00 – G01N17/00, G01N21/00 or G01N22/00 by measuring secondary emission from the material using electron or ion
- G01N23/2251—Investigating or analysing materials by the use of wave or particle radiation, e.g. X-rays or neutrons, not covered by groups G01N3/00 – G01N17/00, G01N21/00 or G01N22/00 by measuring secondary emission from the material using electron or ion using incident electron beams, e.g. scanning electron microscopy [SEM]
-
- G—PHYSICS
- G01—MEASURING; TESTING
- G01N—INVESTIGATING OR ANALYSING MATERIALS BY DETERMINING THEIR CHEMICAL OR PHYSICAL PROPERTIES
- G01N23/00—Investigating or analysing materials by the use of wave or particle radiation, e.g. X-rays or neutrons, not covered by groups G01N3/00 – G01N17/00, G01N21/00 or G01N22/00
- G01N23/22—Investigating or analysing materials by the use of wave or particle radiation, e.g. X-rays or neutrons, not covered by groups G01N3/00 – G01N17/00, G01N21/00 or G01N22/00 by measuring secondary emission from the material
- G01N23/225—Investigating or analysing materials by the use of wave or particle radiation, e.g. X-rays or neutrons, not covered by groups G01N3/00 – G01N17/00, G01N21/00 or G01N22/00 by measuring secondary emission from the material using electron or ion
-
- G—PHYSICS
- G01—MEASURING; TESTING
- G01N—INVESTIGATING OR ANALYSING MATERIALS BY DETERMINING THEIR CHEMICAL OR PHYSICAL PROPERTIES
- G01N2223/00—Investigating materials by wave or particle radiation
- G01N2223/30—Accessories, mechanical or electrical features
- G01N2223/303—Accessories, mechanical or electrical features calibrating, standardising
-
- G—PHYSICS
- G01—MEASURING; TESTING
- G01N—INVESTIGATING OR ANALYSING MATERIALS BY DETERMINING THEIR CHEMICAL OR PHYSICAL PROPERTIES
- G01N2223/00—Investigating materials by wave or particle radiation
- G01N2223/30—Accessories, mechanical or electrical features
- G01N2223/306—Accessories, mechanical or electrical features computer control
-
- G—PHYSICS
- G01—MEASURING; TESTING
- G01N—INVESTIGATING OR ANALYSING MATERIALS BY DETERMINING THEIR CHEMICAL OR PHYSICAL PROPERTIES
- G01N2223/00—Investigating materials by wave or particle radiation
- G01N2223/60—Specific applications or type of materials
- G01N2223/611—Specific applications or type of materials patterned objects; electronic devices
- G01N2223/6116—Specific applications or type of materials patterned objects; electronic devices semiconductor wafer
-
- G—PHYSICS
- G01—MEASURING; TESTING
- G01N—INVESTIGATING OR ANALYSING MATERIALS BY DETERMINING THEIR CHEMICAL OR PHYSICAL PROPERTIES
- G01N2223/00—Investigating materials by wave or particle radiation
- G01N2223/60—Specific applications or type of materials
- G01N2223/633—Specific applications or type of materials thickness, density, surface weight (unit area)
Definitions
- the present disclosure relates to a pattern measuring device that measures the size of a pattern formed on a sample.
- the quality of lithography processing, etching processing, and the generation of foreign matter greatly affect the yield of semiconductor devices. Therefore, in order to detect such abnormalities and defects in the manufacturing process at an early stage or in advance, the pattern on the semiconductor wafer is measured and inspected in the manufacturing process. When highly accurate measurement is required, measurement by a scanning electron microscope (SEM) is widely used.
- SEM scanning electron microscope
- Deep holes and deep grooves are processed by the etching process, but as the pattern to be processed becomes deeper, it is becoming more difficult to process the bottom of the etching pattern so that it matches the position of the lower layer pattern. As a result, it is becoming important to measure the bottom dimension of the pattern to be machined and the position deviation (vertical degree) of the center of gravity with respect to the top in the wafer surface and give feedback to the etching apparatus. For example, if the condition of the etcher is not good, the processing uniformity may decrease on the outer periphery of the wafer and the pattern may be inclined. When the pattern is processed at an angle, a misalignment occurs between the center of gravity of the upper surface and the center of gravity of the lower surface of the pattern. By feeding back this information to the etching apparatus, the processing uniformity can be improved.
- Patent Document 1 includes "a calculation device for measuring the dimensions of a pattern formed on a sample based on a signal obtained by a charged particle beam device, and the calculation device has an arbitrary beam tilt angle. From the acquired image, a misalignment amount calculation unit that calculates the misalignment amount in the direction parallel to the wafer surface between two patterns of different heights, and the misalignment amount and the tilt amount of the pattern obtained in advance. A pattern tilt amount calculation unit that calculates the tilt amount of the pattern from the misalignment amount and a beam tilt control amount calculation unit that controls the beam tilt angle so as to match the tilt amount of the pattern. A pattern measuring device that has and sets the calculated beam tilt angle, acquires an image again, and measures the pattern. ⁇ (See summary).
- the present disclosure has been made in view of the above technical problems, and even if the incident angle of the charged particle beam changes depending on the irradiation position of the charged particle beam, the center of gravity of the upper surface of the pattern and the bottom surface of the pattern are changed. It is an object of the present invention to provide a pattern measuring device capable of accurately measuring a positional deviation from a center of gravity of a particle.
- the pattern measuring apparatus acquires the angle deviation amount corresponding to the in-field coordinates of the pattern according to the relationship between the in-field coordinates of the pattern and the angle deviation amount of the charged particle beam, and the angle deviation.
- the amount of misalignment corresponding to the in-field coordinates of the pattern is acquired according to the relationship between the amount and the amount of misalignment of the center of gravity.
- the position between the center of gravity of the upper surface of the pattern and the center of gravity of the bottom surface of the pattern even when the incident angle of the charged particle beam changes depending on the irradiation position of the charged particle beam.
- the deviation can be measured accurately.
- FIG. 1 It is a block diagram of the pattern measuring apparatus 100 which concerns on Embodiment 1.
- FIG. The deflector 7 deflects the primary electron beam. It is a side sectional view of a hole shape pattern. It is an SEM image taken by the incident beam (21a-21c) of FIG. 2b. It is a perspective view which shows the example of a standard sample 12. It is a flowchart which shows the process of calculating the relational expression between a visual field position and a beam inclination change amount. It is a figure which shows the procedure which obtains the beam inclination amount. It is a figure which shows the tilt change amount in the X direction with respect to the position deviation in the X direction from the center of the visual field.
- FIG. 1 is a configuration diagram of a pattern measuring device 100 according to the first embodiment of the present disclosure.
- the pattern measuring device 100 is a device that measures the pattern size formed on the sample by irradiating the sample (wafer 11) with a primary electron beam.
- the pattern measuring device 100 includes a column 1 (electro-optical system) and a sample chamber 2.
- the column 1 includes an electron gun 3, a condenser lens 4, an objective lens 8, a deflector 7, an aligner 5, a secondary electron detector 9, an EXB filter 6 (electromagnetic field orthogonal filter), and a backscattered electron detector 10.
- the primary electron beam (irradiation electron) generated by the electron gun 3 is focused and irradiated on the wafer 11 by the condenser lens 4 and the objective lens 8.
- the aligner 5 aligns the position where the primary electron beam is incident on the objective lens 8.
- the primary electron beam is scanned against the wafer 11 by the deflector 7.
- the deflector 7 scans the wafer 11 with a primary electron beam according to a signal from the beam scanning controller 17.
- the secondary electrons obtained from the wafer 11 by irradiation with the primary electron beam are directed toward the secondary electron detector 9 by the EXB filter 6 and detected by the secondary electron detector 9.
- the backscattered electrons from the wafer 11 are detected by the backscattered electron detector 10.
- the charged particle optical system may include other lenses, electrodes, and detectors, or a part thereof may be different from the above, and the configuration of the charged particle optical system is not limited to this.
- the XY stage 13 installed in the sample chamber 2 moves the wafer 11 with respect to the column 1 according to the signal from the stage controller 18.
- a standard sample 12 for beam calibration is mounted on the XY stage 13.
- the pattern measuring device 100 has an optical microscope 14 for wafer alignment.
- the signals from the secondary electron detector 9 and the backscattered electron detector 10 are signal-converted by the amplifier 15 and the amplifier 16 and sent to the image processing board 19 for imaging.
- the control computer 20 includes an input unit such as a mouse and a keyboard for the user to input instructions, a display unit such as a monitor for displaying a screen, a storage unit such as a hard disk and a memory, and the like.
- the pattern measuring device 100 includes a control unit that controls the operation of each part and an image generation unit that generates an image based on a signal output from the detector (not shown).
- the control unit and the image generation unit may be configured as hardware by a dedicated circuit board, or may be configured by software executed by a computer.
- When configured by hardware it can be realized by integrating a plurality of arithmetic units that execute processing on a wiring board or in a semiconductor chip or a package.
- When configured by software it can be realized by mounting a general-purpose CPU (Central Processing Unit) on a computer and executing a program that executes desired arithmetic processing. It is also possible to upgrade existing equipment with the recording medium on which this program is recorded.
- These devices, circuits, and computers are connected by a wired or wireless network, and data is transmitted and received as appropriate.
- the incident angle of the primary electron beam can be calibrated with respect to the XY stage 13 or the sample.
- the standard sample 12 has a pattern etched into a pyramid shape (square cone shape), and the deflector deflects the electron beam so that the four faces of the pyramid appearing in the image have the same shape.
- the beam trajectory can be aligned with the ideal optical axis. It is also possible to adjust the trajectory of the electron beam so that the desired tilt angle is obtained based on the geometric calculation of each surface of the pyramid.
- the relative angle between the ideal optical axis and the traveling direction of the primary electron beam is defined as the beam tilt angle, but the relative angle between the sample and the electron beam may be defined as the beam tilt angle. ..
- the electron beam trajectory is basically set to be perpendicular (Z direction) to the moving trajectory (X direction and Y direction) of the XY stage.
- the Z direction is defined as zero degree, and the inclination angle is indicated by plus or minus numbers in both the X direction and the Y direction. It is possible to set the angle in all directions by combining X and Y.
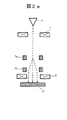
- FIG. 2a shows how the deflector 7 deflects the primary electron beam.
- the deflector 7 deviates the electron beam from the ideal optical axis by the upper deflector 7a, and deflects the electron beam so as to be ideally in the vertical direction by the lower deflector 7b.
- the tilt variation in the visual field occurs due to the influence of the responsiveness of the deflector 7.
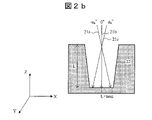
- FIGS. 2b and 2c the principle of generating a measurement error of the amount of displacement of the center of gravity due to the change in the inclination of the incident beam will be described.
- FIG. 2b is a side sectional view of the hole shape pattern.
- the hole 22 is etched in the direction perpendicular to the sample surface (Z-axis), and the hole depth is L.
- the incident beam 21b is perpendicular to the sample plane, the beam that has passed through the center of the top of the pattern reaches the center of the bottom.
- the incident beam 21a is inclined to the ⁇ X side (incident angle ⁇ x °)
- the beam passing through the center of the top reaches a position shifted by L ⁇ tan ⁇ x in the + X direction with respect to the center of the bottom.
- FIG. 2c is an SEM image captured by the incident beam (21a-21c) of FIG. 2b.
- the image is taken so that the center of the top of the hole pattern is the center of the image.
- the incident angle of the incident beam 21b matches the etching method of the pattern (incident angle 0 °)
- the center of gravity 24c at the top and the center of gravity 24d at the bottom match as in the SEM image 23b.
- the incident beam 21a is tilted to the ⁇ X side (incident angle ⁇ x °)
- the center of gravity 24b at the bottom is shifted in the ⁇ X direction by about L ⁇ tan ⁇ x with respect to the center of gravity 24a at the top as in the SEM image 23a.
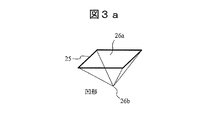
- FIG. 3a is a perspective view showing an example of the standard sample 12.
- the beam inclination amount in the field of view is measured from the center of gravity position and the bottom position 26b of the upper surface 26a of the pyramid by using the standard sample 12 on which the concave pyramid pattern 25 shown in FIG. 3a is formed.
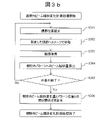
- FIG. 3b is a flowchart showing the process of calculating the relational expression between the visual field position and the amount of change in beam inclination. A procedure for obtaining the relational expression between the visual field position and the amount of change in beam tilt will be described with reference to FIG. 3b.
- FIG. 3b steps S301 to S302
- the control computer 20 sets the visual field position on the sample (S301), and the stage controller 18 moves the XY stage 13 to the visual field position (S302).
- An example of the visual field position will be described with reference to FIG. 3c described later.
- FIG. 3b steps S303 to S304
- the control computer 20 acquires a visual field image obtained by irradiating the visual field range with a primary electron beam (S303).
- the control computer 20 calculates the amount of beam inclination at the visual field position using the visual field image (S304).
- a specific method for calculating the beam inclination amount will be described with reference to FIGS. 3c to 3g.
- step S305 The control computer 20 repeats S301 to S304 until all the preset conditions are completed (for example, until a visual field image is acquired for the entire range on the sample).
- the control computer 20 calculates a relational expression between the visual field position and the beam tilt change amount based on the relationship between the visual field image and the beam tilt amount.
- a relational expression will be described again after FIGS. 3c to 3g.
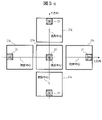
- FIG. 3c is a diagram showing a procedure for obtaining a beam inclination amount.
- images are acquired while changing the positions (X direction, Y direction) of the same pyramid pattern 25 in the visual field, and the amount of change in beam inclination at each visual field position is measured.
- a specific procedure for obtaining the amount of change in beam tilt at each field position will be described below.
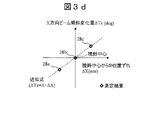
- FIG. 3d is a diagram showing the amount of change in inclination ( ⁇ Tx) in the X direction with respect to the positional deviation in the X direction from the center of the visual field.
- ⁇ Tx the amount of change in inclination
- FIGS. 3c and 3d A procedure for calculating the coefficient of the beam inclination change in the X direction with respect to the visual field position in the X direction will be described with reference to FIGS. 3c and 3d.
- the SEM image 27a of FIG. 3c is an image at a position where the pyramid pattern is deviated from the center of the image in the ⁇ X direction.
- Point 28a in the graph of FIG. 3d is a plot of the amount of misalignment in the field of view of the pyramid pattern in the SEM image 27a and the amount of beam tilt in the X direction.
- the pyramid pattern is the center of the image.
- Point 28b is a plot of the amount of misalignment in the field of view of the pyramid pattern in the SEM image 27b and the amount of beam tilt in the X direction.
- the SEM image 27c is an image at a position where the pyramid pattern is deviated from the center of the image in the + X direction.
- Point 28c is a plot of the amount of misalignment in the field of view of the pyramid pattern in the SEM image 27c and the amount of beam tilt in the X direction.
- the control computer 20 calculates the coefficient A of the beam inclination change (deg / nm) in the X direction due to the position deviation in the X direction from the center of the visual field by the first-order approximation to the plots 28a to 28c.
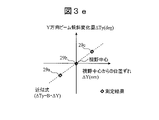
- FIG. 3e is a diagram showing the amount of change in inclination ( ⁇ Ty) in the Y direction with respect to the positional deviation in the Y direction from the center of the visual field.
- ⁇ Ty the amount of change in inclination
- FIGS. 3c and 3e A procedure for calculating the coefficient of the beam inclination change in the Y direction with respect to the visual field position in the Y direction will be described with reference to FIGS. 3c and 3e.
- the SEM image 27e in FIG. 3c is an image at a position where the pyramid pattern is deviated from the center of the image in the ⁇ Y direction.
- Point 29a in the graph of FIG. 3e is a plot of the amount of misalignment in the field of view of the pyramid pattern in the SEM image 27e and the amount of beam inclination in the Y direction.
- the pyramid pattern is the center of the image.
- Point 29b is a plot of the amount of misalignment in the field of view of the pyramid pattern in the SEM image 27b and the amount of beam inclination in the Y direction.
- the SEM image 27d is an image at a position where the pyramid pattern is deviated from the center of the image in the + Y direction.
- Point 29c is a plot of the amount of misalignment in the field of view of the pyramid pattern in the SEM image 27d and the amount of beam tilt in the Y direction.
- the control computer 20 calculates the coefficient B of the beam inclination change (deg / nm) in the Y direction due to the position deviation in the Y direction from the center of the visual field by the first-order approximation to the plots 29a to 29c.
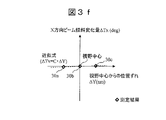
- FIG. 3f is a diagram showing the amount of change in inclination ( ⁇ Tx) in the X direction with respect to the positional deviation in the Y direction from the center of the visual field.
- ⁇ Tx the amount of change in inclination
- FIGS. 3c and 3f A procedure for calculating the coefficient of the beam inclination change in the X direction with respect to the visual field position in the Y direction will be described with reference to FIGS. 3c and 3f.
- the SEM image 27e in FIG. 3c is an image at a position where the pyramid pattern is deviated from the center of the image in the ⁇ Y direction.
- Point 30a in the graph of FIG. 3f is a plot of the amount of misalignment in the field of view of the pyramid pattern in the SEM image 27e and the amount of beam inclination in the X direction.
- the pyramid pattern is the center of the image.
- Point 30b is a plot of the amount of misalignment in the field of view of the pyramid pattern in the SEM image 27b and the amount of beam tilt in the X direction.
- the SEM image 27d is an image at a position where the pyramid pattern is deviated from the center of the image in the + Y direction.
- Point 30c is a plot of the amount of misalignment in the field of view of the pyramid pattern in the SEM image 27d and the amount of beam tilt in the X direction.
- the control computer 20 calculates the coefficient C of the beam inclination change (deg / nm) in the X direction due to the position shift in the Y direction of the center of the visual field by the first-order approximation to the plots 30a to 30c.
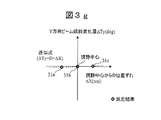
- FIG. 3g is a diagram showing the amount of change in inclination ( ⁇ Ty) in the Y direction with respect to the positional deviation in the X direction from the center of the visual field.
- ⁇ Ty the amount of change in inclination
- the SEM image 27a of FIG. 3c is an image at a position where the pyramid pattern is deviated from the center of the image in the ⁇ X direction.
- Point 31a in the graph of FIG. 3g is a plot of the amount of misalignment in the field of view of the pyramid pattern in the SEM image 27a and the amount of beam inclination in the Y direction.
- the pyramid pattern is the center of the image.
- Point 31b is a plot of the amount of misalignment in the field of view of the pyramid pattern in the SEM image 27b and the amount of beam inclination in the Y direction.
- the SEM image 27c is an image at a position where the pyramid pattern is deviated from the center of the image in the + X direction.
- Point 31c is a plot of the amount of misalignment in the field of view of the pyramid pattern in the SEM image 27c and the amount of beam tilt in the Y direction.
- the control computer 20 calculates the coefficient D of the beam inclination change (deg / nm) in the Y direction due to the position shift in the X direction of the center of the visual field by the first-order approximation to the plots 31a to 31c.
- a linear function is used as the approximate expression, but the format of the approximate expression is not limited to this, and a higher-order function (for example, a cubic expression) may be used.
- ⁇ X be the X-direction positional deviation between the pattern position in the visual field and the visual field center
- ⁇ Y be the Y-direction positional deviation between the pattern position in the visual field and the visual field center.
- FIG. 4a is a flowchart showing a process of calculating the relational expression between the amount of change in the inclination of the primary electron beam and the amount of the displacement of the center of gravity in the pattern at a specific position in the field of view with respect to the wafer to be measured. This flowchart is performed for each position in the field of view (that is, for each pattern in the field of view), and the result is saved in the recipe. Each step of FIG. 4a will be described below.
- the control computer 20 sets the beam gradient amount of the primary electron beam for the pattern at a specific position in the visual field (S401).
- the control computer 20 measures the amount of misalignment of the center of gravity using the set amount of beam inclination (S402).
- the amount of misalignment of the center of gravity can be measured by calculating the difference between the top center of gravity and the bottom center of gravity of the pattern of the measurement target wafer from the observation image of the pattern of the measurement target wafer.
- step S403 The control computer 20 repeats S401 to S402 until all the preset conditions are completed (for example, until all the beam gradient amounts within a certain angle range are used).
- FIG. 4a step S404
- the control computer 20 calculates a relational expression between the amount of change in beam inclination and the amount of displacement of the center of gravity based on a series of measurement results. An example of the relational expression will be described again after FIGS. 4b to 4c.
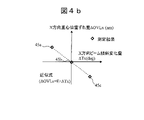
- FIG. 4b is a diagram showing the amount of deviation of the center of gravity in the X direction with respect to the amount of change in beam inclination in the X direction.
- Point 45a in the graph is a plot of the amount of change in inclination and the amount of misalignment of the center of gravity in the X direction when the beam is inclined in the ⁇ X direction from the vertical incident (incident angle 0 °).
- Point 45b is a plot of the amount of misalignment of the center of gravity in the X direction when the beam is vertically incident.
- Point 45c is a plot of the amount of change in inclination and the amount of displacement of the center of gravity in the X direction when the beam is inclined in the + X direction from the vertical incident (incident angle 0 °).
- the coefficient E of the amount of displacement of the center of gravity in the X direction (nm / deg) due to the amount of change in beam inclination in the X direction is calculated by the first-order approximation to
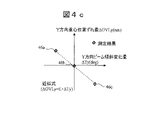
- FIG. 4c is a diagram showing the amount of deviation of the center of gravity in the Y direction with respect to the amount of change in beam inclination in the Y direction.
- Point 46a in the graph is a plot of the amount of change in inclination and the amount of misalignment of the center of gravity in the Y direction when the beam is inclined in the ⁇ Y direction from the vertical incident (incident angle 0 °).
- Point 46b is a plot of the amount of misalignment of the center of gravity in the Y direction when the beam is vertically incident.
- Point 46c is a plot of the amount of change in inclination and the amount of displacement of the center of gravity in the Y direction when the beam is inclined in the + Y direction from the vertical incident (incident angle 0 °).
- the coefficient F of the amount of displacement of the center of gravity in the Y direction (nm / deg) due to the amount of change in beam inclination in the Y direction is calculated by the first-order approximation to
- a linear function is used as the approximate expression, but the format of the approximate expression is not limited to this, and a higher-order function (for example, a cubic expression) may be used.
- ⁇ OVL X and ⁇ OVL Y can be calculated by the following equations.
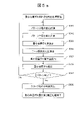
- FIG. 5a is a flowchart showing the center-of-gravity position shift amount measurement and the center-of-gravity position shift correction process for a pattern at a specific position in the visual field. This flowchart is performed for each position in the field of view (that is, for each pattern in the field of view) and the results are saved. Each step of FIG. 5a will be described below.
- FIG. 5a steps S501 to S503
- the control computer 20 measures the center of gravity of the upper layer of the pattern (S501) and measures the center of gravity of the lower layer of the pattern using the observation image of the pattern (S502).
- the control computer 20 calculates the amount of deviation of the center of gravity before correction by obtaining the difference between the coordinates of the center of gravity (S503).
- the control computer 20 calculates the amount of change in beam inclination using the position of the pattern (position of the center of gravity of the upper layer) in the visual field.
- the calculation formula those described with reference to FIGS. 3c to 3g can be used. A specific example of the actual calculation formula will be described later.
- the control computer 20 calculates the amount of change in the position of the center of gravity using the calculated amount of change in beam inclination.
- the calculation formula those described with reference to FIGS. 4a to 4c can be used. A specific example of the actual calculation formula will be described later.
- step S506 The control computer 20 corrects the amount of change in the center of gravity position calculated in S503 by using the calculated amount of change in the position of the center of gravity.
- step S507 The control computer 20 repeats S501 to S506 until all the preset conditions are completed (for example, until the deviation of the center of gravity is corrected for all the patterns).
- step S508 The control computer 20 calculates an average value for each group from a series of measurement results. An example of the group referred to here will be described later.
- FIG. 5b is a schematic diagram for explaining a calculation formula in each step of FIG. 5a.
- the coordinates of the center of the visual field are set to (0,0). It is assumed that the positions of the centers of gravity of the upper and lower layers of the patterns measured in S501 to S502 are (P tX, P tY ) and (P bX, P bY ), respectively, with respect to the pattern 47 at an arbitrary position in the visual field in FIG. 5b.
- the amount of deviation of the center of gravity in the X and Y directions in S503, OVLX and OVLY can be calculated by the following formula.
- the amount of change in beam inclination ⁇ TX and ⁇ TY with respect to the position of the pattern 47 in the visual field (position of the center of gravity of the upper layer) in S504 can be calculated by the following equation.
- the coefficients A, B, C and D are the results calculated by the process of FIG. 3b.
- the center of gravity position deviation correction amounts ⁇ OVL X and ⁇ OVL Y with respect to the pattern 47 in S505 can be calculated by the following equations.
- the coefficients E and F are the results calculated by the process of FIG. 4a. However, since it is assumed that the measurement error amount of the center of gravity position shift is canceled by the correction, it is a negative coefficient.
- the corrected amount of the center of gravity position shift with respect to the pattern 47 in S506 can be calculated by the following formula.
- the corrected amount of the center of gravity position shift is measured for all the patterns 47, 48, 49, 50 in the visual field of FIG. 5b.
- the average value of the corrected amount of the center of gravity position shift of all the patterns is calculated.
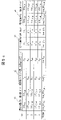
- FIG. 5c shows an example of the measurement result.
- the following values can be calculated: (a) amount of center of gravity misalignment and average value 61 before correction in the X and Y directions in each pattern in the field of view; (b) position of each pattern in the field of view (upper center of gravity). Position) and mean value 62; (c) Beam tilt change amount and average value 63 in the X and Y directions for each pattern in the visual field; (d) Center of gravity misalignment amount after correction in the X and Y directions for each pattern in the visual field And the average value 64.
- the coefficients A, B, C and D for all the setting conditions are calculated in advance and the results are obtained. Is stored in the storage unit of the control computer 20 for each optical condition.
- FIG. 6 is a flowchart of the recipe process carried out by the pattern measuring device 100. Each step of FIG. 6 will be described below.
- Step S601 When the recipe is started, the control computer 20 loads the selected wafer 11 into the sample chamber 2 (S601). The control computer 20 performs alignment with an optical microscope and an SEM image (S602).
- Steps S603 to S605 The control computer 20 controls the XY stage 13 and moves the wafer 11 to the measurement point registered in the recipe (S603).
- the image processing board 19 acquires an SEM image according to a predetermined condition registered in the recipe (S604).
- the control computer 20 executes the center of gravity position deviation amount measurement and the correction process according to the procedure and the calculation formula described up to FIG. 5b (S605).
- Step S606 The control computer 20 repeats S603 to S605 for all the measurement points of the measurement points specified in the recipe.
- Steps S607 to S608 The control computer 20 unloads the wafer 11 (S607) and outputs the recipe execution result (S608).
- the beam tilt change amount in the visual field is calculated by using the linear approximation formula in S306 of FIG. 3c.
- a two-dimensional look-up table is used to between the position in the field of view and the amount of change in beam tilt. It is considered effective to express the relationship. Therefore, in the second embodiment of the present invention, a configuration example in which the relationship between the position in the visual field and the amount of change in beam inclination is described by a two-dimensional data table will be described. Since the other configurations of the pattern measuring device 100 are the same as those in the first embodiment, a two-dimensional data table describing the relationship between the position in the visual field and the amount of change in beam inclination will be mainly described below.
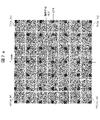
- FIG. 7a shows an example in which the pattern position in the field of view is variously changed.
- the pyramid pattern 25 is used to measure the amount of beam inclination for each pattern position in the field of view.
- the beam tilt measurement as shown in FIG. 7a, by moving the XY stage 13, an image is acquired while shifting the position of the same pyramid pattern 25 from the center of the field of view by a distance n in the XY direction, and the beam at each field of view position is measured. Measure the amount of change in tilt.
- the visual field center position coordinates are set to (0,0)
- the coordinates of each visual field position are determined by the amount of movement from the visual field center and the moving direction.
- the coordinates of the visual field positions 73, 74, 75, and 76 after being shifted by 3n in the XY direction from the center of the visual field are (-3n, -3n), (3n, -3n), (3n, 3n), and (-3n, respectively. , 3n).
- FIG. 7b is a flowchart showing the process of obtaining a two-dimensional map describing the relationship between the position in the visual field and the amount of change in beam inclination.
- S301 to S305 are the same as in FIG. 3b, and S701 is implemented instead of S306.
- the control computer 20 stores in the storage device a two-dimensional data table in which the amount of change in beam inclination is described for each pattern position (lattice point coordinates such as (n, n) in FIG. 7a) in the visual field.
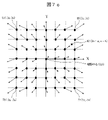
- FIG. 7c is a schematic diagram of a two-dimensional map obtained by the measurement process of FIG. 7b at each field position of FIG. 7a.
- the amount of change in beam tilt at each position in the field of view is schematically shown by arrows.
- the arrows of the beam tilt change amount with respect to the visual field positions 73, 74, 75, and 76 are 78, 79, 80, and 81, respectively.
- the two-dimensional map of FIG. 7c describes the amount of change in the beam tilt angle for each grid point in the field of view.
- the amount of change in beam tilt at the intermediate coordinates between the grid points can be proportionally calculated by proportionally distributing the amount of change in beam tilt in the four peripheral grid points.
- An example of calculating the amount of change in beam gradient ( ⁇ TX , ⁇ TY ) with respect to the position 82 (2n + a, n + b) in FIG. 7c will be described.
- FIG. 7d is a diagram illustrating a procedure for calculating the amount of change in beam inclination at the position 82.
- the beam inclination change amount at the position 82 is calculated by the following formula.
- ( ⁇ Tx 1 , ⁇ T Y1 ), ( ⁇ Tx 2 , ⁇ T Y2 ), ( ⁇ Tx 3 , ⁇ T Y3 ), and ( ⁇ Tx 4 , ⁇ T Y4 ) are beam gradient changes at lattice points 83, 84, 85, and 86, respectively.
- the charged particle beam device broadly includes a device that captures an image of a sample using a charged particle beam.
- Examples of the charged particle beam device include an inspection device using a scanning electron microscope, a review device, a pattern measurement device, and the like.
- the present disclosure is also applicable to a general-purpose scanning electron microscope, a sample processing device equipped with a scanning electron microscope, and a sample analysis device.
- the charged particle beam device shall also include a system in which a plurality of charged particle beam devices are connected by a network.
- the example in which the "sample” is a semiconductor wafer on which a pattern is formed has been described, but the present invention is not limited to this. Further, the "pattern” is not limited to the hole pattern, and the present disclosure can be applied to any pattern in which a positional deviation between the center of gravity of the upper surface and the center of gravity of the bottom surface may occur.
- the relational expression described in the first embodiment and the two-dimensional map described in the second embodiment may be created and held for each optical condition and scanning condition (eg, moving speed of the beam irradiation position) of the charged particle beam. This is because the amount of change in beam tilt at the position in the visual field may differ depending on these conditions.
- the relational expression or the two-dimensional map is obtained in advance for all the conditions, and the result is stored in the storage device of the control computer 20.
- Pattern measuring device 1 Column 2: Sample chamber 3: Electron gun 4: Condenser lens 5: Aligner 6: EXB filter 7: Deflector 8: Objective lens 9: Secondary electron detector 10: Backscattering electron detector 11: Wafer 12: Standard sample 13: XY Stage 14: Optical microscope 15, 16: Amplifier 17: Beam scanning controller 18: Stage controller 19: Image processing board 20: Control computer
Landscapes
- Physics & Mathematics (AREA)
- General Physics & Mathematics (AREA)
- General Health & Medical Sciences (AREA)
- Chemical & Material Sciences (AREA)
- Analytical Chemistry (AREA)
- Biochemistry (AREA)
- Life Sciences & Earth Sciences (AREA)
- Health & Medical Sciences (AREA)
- Immunology (AREA)
- Pathology (AREA)
- Electromagnetism (AREA)
- Length-Measuring Devices Using Wave Or Particle Radiation (AREA)
- Testing Or Measuring Of Semiconductors Or The Like (AREA)
Abstract
Description
図1は、本開示の実施形態1に係るパターン計測装置100の構成図である。パターン計測装置100は、1次電子ビームを試料(ウェハ11)に対して照射することにより、試料上に形成されているパターンサイズを計測する装置である。パターン計測装置100は、カラム1(電子光学系)と試料室2を備える。カラム1は、電子銃3、コンデンサレンズ4、対物レンズ8、ディフレクタ7、アライナ5、2次電子検出器9、EXBフィルタ6(電磁界直交フィルタ)、後方散乱電子検出器10を含む。
制御コンピュータ20は、試料上の視野位置をセットし(S301)、ステージコントローラ18によってXYステージ13をその視野位置へ移動させる(S302)。視野位置の例については後述の図3cを用いて説明する。
制御コンピュータ20は、視野範囲に対して1次電子ビームを照射することによって得られる視野画像を取得する(S303)。制御コンピュータ20は、視野画像を用いて、その視野位置におけるビーム傾斜量を算出する(S304)。ビーム傾斜量を算出する具体的手法については、図3c~図3gを用いて説明する。
制御コンピュータ20は、あらかじめ設定した条件がすべて完了するまで(例えば試料上の全範囲について視野画像を取得するまで)、S301~S304を繰り返す。
制御コンピュータ20は、視野画像とビーム傾斜量との間の関係に基づき、視野位置とビーム傾斜変化量との間の関係式を算出する。関係式の例については、図3c~図3gの後に改めて説明する。
ΔTY = B * ΔY + D * ΔX
制御コンピュータ20は、視野内の特定位置のパターンに対して、1次電子ビームのビーム傾斜量をセットする(S401)。制御コンピュータ20は、セットしたビーム傾斜量を用いて、重心位置ずれ量を計測する(S402)。重心位置ずれ量は、計測対象ウェハのパターンのトップ重心とボトム重心との間の差分を、計測対象ウェハのパターンの観察画像から計算することによって、計測できる。
制御コンピュータ20は、あらかじめ設定した条件がすべて完了するまで(例えばある角度範囲内にわたるビーム傾斜量を全て用いるまで)S401~S402を繰り返す。
制御コンピュータ20は、一連の計測結果に基づき、ビーム傾斜変化量と重心位置ずれ量との間の関係式を算出する。関係式の例については図4b~図4cの後に改めて説明する。
ΔOVLY = F * ΔTY
制御コンピュータ20は、パターンの観察画像を用いて、パターン上層の重心を計測するとともに(S501)、パターン下層の重心を計測する(S502)。制御コンピュータ20は、これらの重心座標間の差分を求めることにより、補正前の重心位置ずれ量を算出する(S503)。
制御コンピュータ20は、視野内におけるパターンの位置(上層重心位置)を用いて、ビーム傾斜変化量を算出する。計算式は、図3c~図3gを用いて説明したものを用いることができる。実際の計算式の具体例は後述する。
制御コンピュータ20は、算出したビーム傾斜変化量を用いて、重心位置ずれ変化量を算出する。計算式は、図4a~図4cを用いて説明したものを用いることができる。実際の計算式の具体例は後述する。
制御コンピュータ20は、算出した重心位置ずれ変化量を用いて、S503において計算した重心位置ずれ量を補正する。
制御コンピュータ20は、あらかじめ設定した条件がすべて完了するまで(例えば全てのパターンについて重心位置ずれを補正するまで)、S501~S506を繰り返す。
制御コンピュータ20は、一連の計測結果からグループ毎の平均値を算出する。ここでいうグループの例については後述する。
OVLY(補正前) = PbY - PtY
ΔTY = B * PtY + D * PtX
ΔOVLY = F * ( B * PtY + D * PtX )
OVLY(補正後) = OVLY(補正前)+ ΔOVLY
レシピが開始されると、制御コンピュータ20は、選択されたウェハ11を試料室2へロードする(S601)。制御コンピュータ20は、光学顕微鏡とSEM像によるアライメントを実行する(S602)。
制御コンピュータ20は、XYステージ13を制御し、レシピに登録された測定点にウェハ11を移動させる(S603)。画像処理ボード19は、レシピに登録された所定の条件にしたがってSEM画像を取得する(S604)。制御コンピュータ20は、図5bまでにおいて説明した手順と計算式にしたがって、重心位置ずれ量計測と補正処理を実行する(S605)。
制御コンピュータ20は、レシピに規定された測定点のすべての測定点について、S603~S605を繰り返す。
制御コンピュータ20は、ウェハ11をアンロードし(S607)、レシピ実行結果を出力する(S608)。
実施形態1では、視野内のビーム傾斜変化量に関して、図3cのS306において1次近似式を用いて算出することを説明した。これに対して、スキャンの応答遅れなどの影響により1次式を用いて近似することが適当ではない場合は、2次元ルックアップテーブルを用いて、視野内位置とビーム傾斜変化量との間の関係を表すことが有効と考えられる。そこで本発明の実施形態2では、視野内位置とビーム傾斜変化量の関係を2次元データテーブルによって記述した構成例を説明する。パターン計測装置100のその他構成は実施形態1と同様であるので、以下では視野内位置とビーム傾斜変化量の関係を記述した2次元データテーブルについて主に説明する。
ΔTY ={ΔTY1 *(1-a/n)+ΔTY2 *a/n}*(1-b/n)+{ΔTY3 *(1-a/n)+ΔTY4 *a/n}* b/n
本開示は、前述した実施形態に限定されるものではなく、様々な変形例が含まれる。例えば、上記した実施形態は本開示を分かりやすく説明するために詳細に説明したものであり、必ずしも説明した全ての構成を備えるものに限定されるものではない。また、ある実施形態の構成の一部を他の実施形態の構成に置き換えることが可能であり、また、ある実施形態の構成に他の実施形態の構成を加えることも可能である。また、各実施形態の構成の一部について、他の構成の追加・削除・置換をすることが可能である。
1:カラム
2:試料室
3:電子銃
4:コンデンサレンズ
5:アライナ
6:EXBフィルタ
7:ディフレクタ
8:対物レンズ
9:2次電子検出器
10:後方散乱電子検出器
11:ウェハ
12:標準試料
13:XYステージ
14:光学顕微鏡
15、16:アンプ
17:ビーム走査コントローラ
18:ステージコントローラ
19:画像処理ボード
20:制御コンピュータ
Claims (13)
- 試料上に形成されたパターンのサイズを計測するパターン計測装置であって、
前記試料に対して荷電粒子ビームを照射することにより得られる観察画像を用いて、前記パターンの上面の重心と前記パターンの底面の重心との間の位置ずれ量を算出する、コンピュータシステム、
前記荷電粒子ビームの照射角度の光軸からの角度ずれ量と前記位置ずれ量との間の第1関係を記述した関係データを記憶する記憶部、
を備え、
前記関係データはさらに、前記パターンの視野内座標と前記角度ずれ量との間の第2関係を記述しており、
前記コンピュータシステムは、前記パターンの視野内座標を用いて前記関係データを参照することにより、前記パターンの視野内座標に対応する前記角度ずれ量を取得し、
前記コンピュータシステムは、前記取得した前記角度ずれ量を用いて前記関係データを参照することにより、前記パターンの視野内座標に対応する前記位置ずれ量を取得し、
前記コンピュータシステムは、前記取得した前記位置ずれ量を用いて、前記パターンの上面の重心と前記パターンの底面の重心との間の計測位置ずれを補正する
ことを特徴とするパターン計測装置。 - 前記第2関係は、
前記パターンの上面の重心の第1方向における座標、
前記第1方向における前記角度ずれ量、
の間の関係を記述するとともに、
前記パターンの上面の重心の前記第1方向に対して直交する第2方向における座標、
前記第2方向における前記角度ずれ量、
の間の関係を記述しており、
前記コンピュータシステムは、前記パターンの前記第1方向と前記第2方向それぞれにおける視野内座標を用いて前記第2関係を参照することにより、前記第1方向と前記第2方向それぞれにおける前記角度ずれ量を取得する
ことを特徴とする請求項1記載のパターン計測装置。 - 前記第2関係はさらに、
前記パターンの上面の重心の前記第2方向における座標、
前記第1方向における前記角度ずれ量、
の間の関係を記述するとともに、
前記パターンの上面の重心の前記第1方向における座標、
前記第2方向における前記角度ずれ量、
の間の関係を記述しており、
前記コンピュータシステムは、前記パターンの前記第1方向と前記第2方向それぞれにおける視野内座標を用いて前記第2関係を参照することにより、前記第1方向と前記第2方向それぞれにおける前記角度ずれ量を取得する
ことを特徴とする請求項2記載のパターン計測装置。 - 前記第1関係は、
前記第1方向における前記角度ずれ量と前記第1方向における前記位置ずれ量との間の関係、
前記第2方向における前記角度ずれ量と前記第2方向における前記位置ずれ量との間の関係、
を記述しており、
前記コンピュータシステムは、前記第1方向と前記第2方向それぞれにおける前記角度ずれ量を用いて前記第1関係を参照することにより、前記第1方向と前記第2方向それぞれにおける前記位置ずれ量を取得する
ことを特徴とする請求項2記載のパターン計測装置。 - 前記第2関係は、
観察視野の中心座標から前記パターンの上面の重心までの前記第1方向におけるずれ量に起因する、前記第1方向における前記角度ずれ量、
観察視野の中心座標から前記パターンの上面の重心までの前記第2方向におけるずれ量に起因する、前記第1方向における前記角度ずれ量、
の合算を、前記第1方向における前記角度ずれ量として記述しており、
前記第2関係は、
観察視野の中心座標から前記パターンの上面の重心までの前記第2方向におけるずれ量に起因する、前記第2方向における前記角度ずれ量、
観察視野の中心座標から前記パターンの上面の重心までの前記第1方向におけるずれ量に起因する、前記第2方向における前記角度ずれ量、
の合算を、前記第2方向における前記角度ずれ量として記述している
ことを特徴とする請求項3記載のパターン計測装置。 - 前記コンピュータシステムは、
観察視野の中心座標を変更しながら、形状とサイズが既知である前記試料の前記観察画像を、前記中心座標ごとに取得するステップ、
前記観察画像を用いて前記上面の重心と前記底面の重心との間のずれ量を算出することにより、前記中心座標ごとに前記角度ずれ量を算出するステップ、
前記中心座標ごとの前記角度ずれ量を用いて前記第2関係を算出するステップ、
を実行する
ことを特徴とする請求項2記載のパターン計測装置。 - 前記コンピュータシステムは、
前記試料を載置したステージを移動させることによって観察視野の中心座標を変更するか、
または、
前記荷電粒子ビームの照射位置を変更することによって観察視野の中心座標を変更する
ことを特徴とする請求項6記載のパターン計測装置。 - 前記コンピュータシステムは、
前記荷電粒子ビームの傾斜角を変化させながら、計測対象ウェハのパターンの観察画像を、前記傾斜角ごとに取得するステップ、
前記観察画像を用いて前記上面の重心と前記底面の重心との間のずれ量を算出することにより、前記傾斜角ごとに前記位置ずれ量を算出するステップ、
前記傾斜角ごとの前記位置ずれ量を用いて前記第1関係を算出するステップ、
を実行する
ことを特徴とする請求項1記載のパターン計測装置。 - 前記コンピュータシステムは、
前記パターンごとの前記位置ずれ量、
前記パターンごとの前記補正における補正量、
前記パターンの種別ごとの前記補正量の平均値、
のうち少なくともいずれかを出力する
ことを特徴とする請求項1記載のパターン計測装置。 - 前記関係データは、前記視野内の格子点ごとに前記角度ずれ量を記述しており、
前記コンピュータシステムは、前記関係データを参照することにより、前記格子点ごとに前記角度ずれ量を取得する
ことを特徴とする請求項1記載のパターン計測装置。 - 前記コンピュータシステムは、4つの前記格子点によって囲まれた中間座標における前記角度ずれ量については、
前記中間座標と前記4つの格子点それぞれとの間の距離にしたがって、前記4つの格子点それぞれにおける前記角度ずれ量を比例配分することにより、前記中間座標における前記角度ずれ量を算出する
ことを特徴とする請求項10記載のパターン計測装置。 - 前記関係データは、前記荷電粒子ビームを照射する荷電粒子ビーム装置の光学条件ごとに前記第1関係と前記第2関係を記述しており、
前記コンピュータシステムは、前記光学条件に対応する前記第1関係と前記第2関係を用いて、前記補正を実施する
ことを特徴とする請求項1記載のパターン計測装置。 - 前記関係データは、前記荷電粒子ビームの照射条件ごとに前記第1関係と前記第2関係を記述しており、
前記コンピュータシステムは、前記照射条件に対応する前記第1関係と前記第2関係を用いて、前記補正を実施する
ことを特徴とする請求項1記載のパターン計測装置。
Priority Applications (4)
| Application Number | Priority Date | Filing Date | Title |
|---|---|---|---|
| US18/034,322 US12422386B2 (en) | 2020-12-16 | 2020-12-16 | Pattern measurement device |
| PCT/JP2020/046854 WO2022130520A1 (ja) | 2020-12-16 | 2020-12-16 | パターン計測装置 |
| KR1020237014208A KR102880958B1 (ko) | 2020-12-16 | 2020-12-16 | 패턴 계측 장치 |
| JP2022569383A JP7445786B2 (ja) | 2020-12-16 | 2020-12-16 | パターン計測装置、パターン計測方法、パターン計測プログラム |
Applications Claiming Priority (1)
| Application Number | Priority Date | Filing Date | Title |
|---|---|---|---|
| PCT/JP2020/046854 WO2022130520A1 (ja) | 2020-12-16 | 2020-12-16 | パターン計測装置 |
Publications (1)
| Publication Number | Publication Date |
|---|---|
| WO2022130520A1 true WO2022130520A1 (ja) | 2022-06-23 |
Family
ID=82059243
Family Applications (1)
| Application Number | Title | Priority Date | Filing Date |
|---|---|---|---|
| PCT/JP2020/046854 Ceased WO2022130520A1 (ja) | 2020-12-16 | 2020-12-16 | パターン計測装置 |
Country Status (4)
| Country | Link |
|---|---|
| US (1) | US12422386B2 (ja) |
| JP (1) | JP7445786B2 (ja) |
| KR (1) | KR102880958B1 (ja) |
| WO (1) | WO2022130520A1 (ja) |
Citations (4)
| Publication number | Priority date | Publication date | Assignee | Title |
|---|---|---|---|---|
| JP2014016174A (ja) * | 2012-07-06 | 2014-01-30 | Hitachi High-Technologies Corp | オーバーレイ誤差測定装置、及びパターン測定をコンピューターに実行させるコンピュータープログラム |
| JP2018045871A (ja) * | 2016-09-14 | 2018-03-22 | 株式会社日立ハイテクノロジーズ | 電子顕微鏡装置及びそれを用いた傾斜ホールの測定方法 |
| JP2019011972A (ja) * | 2017-06-29 | 2019-01-24 | 株式会社 Ngr | パターンエッジ検出方法 |
| JP2019046567A (ja) * | 2017-08-30 | 2019-03-22 | 株式会社日立ハイテクノロジーズ | 荷電粒子線装置 |
Family Cites Families (3)
| Publication number | Priority date | Publication date | Assignee | Title |
|---|---|---|---|---|
| US6259960B1 (en) * | 1996-11-01 | 2001-07-10 | Joel Ltd. | Part-inspecting system |
| US7138629B2 (en) * | 2003-04-22 | 2006-11-21 | Ebara Corporation | Testing apparatus using charged particles and device manufacturing method using the testing apparatus |
| KR102392338B1 (ko) | 2017-10-13 | 2022-05-02 | 주식회사 히타치하이테크 | 패턴 계측 장치 및 패턴 계측 방법 |
-
2020
- 2020-12-16 KR KR1020237014208A patent/KR102880958B1/ko active Active
- 2020-12-16 JP JP2022569383A patent/JP7445786B2/ja active Active
- 2020-12-16 US US18/034,322 patent/US12422386B2/en active Active
- 2020-12-16 WO PCT/JP2020/046854 patent/WO2022130520A1/ja not_active Ceased
Patent Citations (4)
| Publication number | Priority date | Publication date | Assignee | Title |
|---|---|---|---|---|
| JP2014016174A (ja) * | 2012-07-06 | 2014-01-30 | Hitachi High-Technologies Corp | オーバーレイ誤差測定装置、及びパターン測定をコンピューターに実行させるコンピュータープログラム |
| JP2018045871A (ja) * | 2016-09-14 | 2018-03-22 | 株式会社日立ハイテクノロジーズ | 電子顕微鏡装置及びそれを用いた傾斜ホールの測定方法 |
| JP2019011972A (ja) * | 2017-06-29 | 2019-01-24 | 株式会社 Ngr | パターンエッジ検出方法 |
| JP2019046567A (ja) * | 2017-08-30 | 2019-03-22 | 株式会社日立ハイテクノロジーズ | 荷電粒子線装置 |
Also Published As
| Publication number | Publication date |
|---|---|
| JP7445786B2 (ja) | 2024-03-07 |
| KR20230078741A (ko) | 2023-06-02 |
| US20230375338A1 (en) | 2023-11-23 |
| KR102880958B1 (ko) | 2025-11-05 |
| JPWO2022130520A1 (ja) | 2022-06-23 |
| US12422386B2 (en) | 2025-09-23 |
Similar Documents
| Publication | Publication Date | Title |
|---|---|---|
| KR102521799B1 (ko) | 패턴 계측 장치 및 패턴 계측 방법 | |
| KR101730917B1 (ko) | 오버레이 오차 측정 장치 및 컴퓨터 프로그램 | |
| JP5103219B2 (ja) | パターン寸法計測方法 | |
| US9390885B2 (en) | Superposition measuring apparatus, superposition measuring method, and superposition measuring system | |
| JP6511193B2 (ja) | パターン計測装置およびパターン計測方法 | |
| US7834997B2 (en) | Standard component for calibration and calibration method using it and electro beam system | |
| WO2011148975A1 (ja) | 画像処理装置、荷電粒子線装置、荷電粒子線装置調整用試料、およびその製造方法 | |
| TW201239349A (en) | Defect checkup device | |
| JP5439106B2 (ja) | 走査荷電粒子顕微鏡を用いたパターン形状評価装置およびその方法 | |
| JP2021034163A (ja) | 荷電粒子ビームシステム、及び重ね合わせずれ量測定方法 | |
| TWI644289B (zh) | 圖案量測裝置及記憶媒體 | |
| JP7346644B2 (ja) | パターン計測方法、パターン計測装置、およびパターン計測プログラム | |
| JP5813468B2 (ja) | 荷電粒子線装置、及び荷電粒子線のランディング角度の計測補正方法 | |
| US20140312224A1 (en) | Pattern inspection method and pattern inspection apparatus | |
| JP7445786B2 (ja) | パターン計測装置、パターン計測方法、パターン計測プログラム | |
| JP7719865B2 (ja) | 深さ計測装置、深さ計測システム及び深さ指標値算出方法 | |
| KR20260025921A (ko) | 검사 계측 모델을 갖는 주사형 전자 현미경 및 검사 계측 모델의 수정 방법 |
Legal Events
| Date | Code | Title | Description |
|---|---|---|---|
| 121 | Ep: the epo has been informed by wipo that ep was designated in this application |
Ref document number: 20965908 Country of ref document: EP Kind code of ref document: A1 |
|
| ENP | Entry into the national phase |
Ref document number: 2022569383 Country of ref document: JP Kind code of ref document: A |
|
| ENP | Entry into the national phase |
Ref document number: 20237014208 Country of ref document: KR Kind code of ref document: A |
|
| NENP | Non-entry into the national phase |
Ref country code: DE |
|
| 122 | Ep: pct application non-entry in european phase |
Ref document number: 20965908 Country of ref document: EP Kind code of ref document: A1 |
|
| WWG | Wipo information: grant in national office |
Ref document number: 18034322 Country of ref document: US |