WO2022080418A1 - 落葉検出システムおよび落葉検出方法 - Google Patents
落葉検出システムおよび落葉検出方法 Download PDFInfo
- Publication number
- WO2022080418A1 WO2022080418A1 PCT/JP2021/037916 JP2021037916W WO2022080418A1 WO 2022080418 A1 WO2022080418 A1 WO 2022080418A1 JP 2021037916 W JP2021037916 W JP 2021037916W WO 2022080418 A1 WO2022080418 A1 WO 2022080418A1
- Authority
- WO
- WIPO (PCT)
- Prior art keywords
- index value
- mcd43a4
- product
- detection system
- satellite
- Prior art date
- Legal status (The legal status is an assumption and is not a legal conclusion. Google has not performed a legal analysis and makes no representation as to the accuracy of the status listed.)
- Ceased
Links
Images





Classifications
-
- A—HUMAN NECESSITIES
- A01—AGRICULTURE; FORESTRY; ANIMAL HUSBANDRY; HUNTING; TRAPPING; FISHING
- A01G—HORTICULTURE; CULTIVATION OF VEGETABLES, FLOWERS, RICE, FRUIT, VINES, HOPS OR SEAWEED; FORESTRY; WATERING
- A01G7/00—Botany in general
-
- G—PHYSICS
- G06—COMPUTING OR CALCULATING; COUNTING
- G06Q—INFORMATION AND COMMUNICATION TECHNOLOGY [ICT] SPECIALLY ADAPTED FOR ADMINISTRATIVE, COMMERCIAL, FINANCIAL, MANAGERIAL OR SUPERVISORY PURPOSES; SYSTEMS OR METHODS SPECIALLY ADAPTED FOR ADMINISTRATIVE, COMMERCIAL, FINANCIAL, MANAGERIAL OR SUPERVISORY PURPOSES, NOT OTHERWISE PROVIDED FOR
- G06Q50/00—Information and communication technology [ICT] specially adapted for implementation of business processes of specific business sectors, e.g. utilities or tourism
- G06Q50/02—Agriculture; Fishing; Forestry; Mining
Definitions
- the present invention relates to a leaf fall detection system and a leaf fall detection method for evaluating the vegetation state of trees in a farm.
- the present invention relates to a defoliation detection system and a defoliation detection method for detecting the fallen leaves of a rubber tree (Hebra brasiliensis).
- Hevea brasiliensis plantations are widely distributed in the tropics where there is a high probability of clouds and heavy rainfall.
- the optical sensor data of the artificial satellite is very noisy data. Therefore, it is difficult to accurately capture the time-series changes in the state of Hevea brasiliensis with the captured images that are close to the raw data.
- the noise can be reduced, but the signal indicating the time-series change in the state of Hevea brasiliensis disappears. Therefore, the averaged data cannot capture the original state change of Hevea brasiliensis.
- An object of the present invention is to provide a leaf fall detection system and a leaf fall detection method capable of accurately detecting the fallen leaves of a tree and easily and accurately detecting the fallen leaves due to seasonality and disease.
- the defoliation detection system is used to reduce noise by performing predetermined processing on each observation information according to the vegetation of trees acquired at least once a month by an artificial satellite.
- each observation information according to the vegetation of a tree acquired by an artificial satellite at least once a month is subjected to predetermined processing.
- changes in the state of trees due to seasonality and diseases can be achieved by using specific index values that can appropriately evaluate the state of vegetation of trees extracted from observation data by artificial satellites. (Defoliation) can be detected easily and accurately.
- the seasonality of trees and the fallen leaves due to diseases can be easily detected by analysis under a cloud computing environment (cloud analysis) without downloading observation data from artificial satellites.
- FIG. 1 is a schematic view showing a configuration example of a leaf fall detection system according to an embodiment.
- 2 (a), 2 (b), and 2 (c) are graphs showing the normalized difference vegetation index MCD43A4_NDVI used in the leaf litter detection system according to the embodiment in comparison with the vegetation index of other MODES products.
- FIG. 3 is a graph illustrating on-site leaf fall data (actual annual coverage fluctuation).
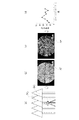
- 4 (a), 4 (b), 4 (c), and 4 (d) are schematic views for explaining the annual change in coverage due to leaf fall.
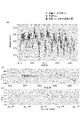
- 5A and 5B show an evaluation example of the leaf fall detection system according to the embodiment, FIG. 5A is a graph of annual coverage fluctuation, and FIG.
- FIG. 5B is a graph of the normalized difference vegetation index MCD43A4_NDVI.
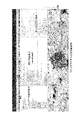
- FIG. 6 is a schematic diagram showing an example of an analysis screen display of the leaf fall detection system according to the embodiment.
- FIG. 7 is a diagram for explaining an analysis environment applicable to the leaf fall detection system according to the embodiment.
- FIG. 8 is a schematic diagram illustrating the prediction of leaf fall using a time series model as another embodiment.
- FIG. 8A is a time-series diagram showing the actual data of the vegetation index and the prediction of leaf fall using a time-series model
- FIG. 8B is a time-series diagram showing the annual fluctuation trend of the vegetation index.
- 8 (c) is a diagram showing changes in the seasonal vegetation index.
- FIG. 9 is a schematic diagram showing an example of screen display in visualization of fallen leaves by a spatial hazard map as another embodiment.
- FIG. 1 shows a configuration example of the leaf fall detection system 1 according to the embodiment.
- the defoliation detection system 1 detects defoliation of trees due to seasonality and disease based on sensor data (artificial satellite data) from the optical sensor IS mounted on the artificial satellite AS for earth observation. It is configured to detect.
- the evaluation target of the vegetation state (leaf overgrowth) of the tree is, for example, the fallen leaves of the Hevea brasiliensis PG of a specific rubber tree plantation GF, which is an arbitrary point on the ground surface in the rainy area RE on the earth BE.
- the fallen leaves of the Hevea brasiliensis PG can be easily detected by the fallen leaf detection system 1.
- the leaf fall detection system 1 is configured such that, for example, the cloud computing environment 21, the local PC (personal computer) 31 of the rubber tree farm GF, the smartphone 32, etc. are connected via the Internet line INC. ..
- the cloud computing environment 21 is an online platform for analyzing satellite images.
- the cloud computing environment 21 for example, "Google Earth Engine (GEE)” developed by Google Inc. is used.
- GEE Google Earth Engine
- the cloud computing environment 21 makes it possible to easily calculate, process, and analyze observation data (sensor data).
- Google Earth Engine is an analysis environment using remote sensing and cloud GIS (Geographic Information System). Therefore, according to “Google Earth Engine”, by sending an instruction from the local PC31 of the rubber tree farm GF to the Google server via the Internet line INC, only the result is returned after all the analysis is performed. Can be made to. Therefore, for example, in the rubber tree farm GF, advanced image analysis such as detection of fallen leaves can be easily performed and shared without preparing expensive satellite image analysis software.
- GIS Geographic Information System
- the cloud computing environment 21 includes, for example, a map vector data storage unit 22 and an acquisition unit 24 for obtaining a normalized difference vegetation index MCD43A4_NDVI as a specific index value described later.
- the vector data storage unit 22 temporarily stores the vector data of the corresponding area when detecting the fallen leaves of the Hevea brasiliensis PG, for example, in response to an instruction from the local PC 31 of the rubber tree plantation GF.
- the vector data is, for example, a map in which contour correction is applied to a map of a predetermined area including a rubber tree plantation GF at a site to be detected, and mass data for displaying a block is superimposed. It is data.
- This vector data is prepared in advance, and is uploaded from, for example, the local PC 31 of the rubber tree plantation GF when the fallen leaves are detected.
- the acquisition unit 24 acquires, for example, a portion corresponding to the vector data stored in the vector data storage unit 22 from a specific product (MCD43A4 product) stored in the cloud computing environment 21. For the acquired part of the product, obtain the normalized difference vegetation index MCD43A4_NDVI that can evaluate the vegetation state of trees.
- the acquisition unit 24 calculates the annual daily variation value (time series data) of the normalized difference vegetation index MCD43A4_NDVI for each section. ..
- the leaves of a tree absorb red light (620-690 nm) and reflect light in the near-infrared region (720-1200 nm). Therefore, the normalized difference vegetation index MCD43A4_NDVI can be obtained by ( RNIR -R Red ) / (R NIR + R Red ).
- R NIR is the spectral reflectance in the near infrared region
- R Red is the spectral reflectance of red light.
- the MCD43A4 product (“Nadir BRDF-Adjusted Reflectance 16-Day L3 Global 500m”, which is a MODES product, is used as an index for detecting the fallen leaves (leaf overgrowth) of Hevea brasiliensis PG due to seasonality and disease. ) Is used for the Normalized Difference Vegetation Index MCD43A4_NDVI.
- the local PC 31 and smartphone 32 of the rubber tree farm GF acquire various products derived from the observation data acquired by the artificial satellite AS from the Internet line INC, and input instructions necessary for detecting fallen leaves. be.
- the detection unit is configured by the local PC 31. That is, the local PC 31 has, for example, a database server, and the annual variation value of the normalized difference vegetation index MCD43A4_NDVI calculated by the acquisition unit 24 is graphed using arbitrary software. Furthermore, by analyzing the increase / decrease in the daily fluctuation value, the fallen leaves of Hevea brasiliensis PG in the rubber tree plantation GF are detected.
- the arbitrary software may be, for example, Excel of Microsoft Corporation.
- the analysis for detecting fallen leaves does not have to be performed on the database server in the local PC 31.
- it may be performed in the cloud computing environment 21 or in another cloud computing environment.
- Examples of the other cloud computing environment include "Microsoft Azure”, “Amazon Web Services (AWS)”, and “Google Cloud Platform”, which will be described later, in addition to GEE.
- the local PC 31 is also used when evaluating the detected leaf fall of Hevea brasiliensis PG using the leaf fall data at the site (details will be described later).
- the observation data acquired by the artificial satellite AS is received at the ground observation center 11 as a management unit.
- the ground-based observation center 11 publishes various products derived from observation data on the Internet line INC.
- MODES Mode Resolution Imaging Spectroradiometer / Medium Resolution Imaging Spectroradiometer
- This MODES is currently mounted on artificial satellites (also called MODES satellites) AS such as Terra satellites and Aqua satellites managed by NASA and others.
- the ground observation center 11 includes a product generation unit 12 that generates various MODES products based on the MODES data captured by the optical sensor IS with the movement of the artificial satellite AS.
- the product generation unit 12 is, for example, a NASA server.
- the product generation unit 12 specifically generates a specific product (MCD43A4 product, 500 m resolution, daily earth surface reflectance) as a MODES product.
- the artificial satellite AS acquires observation information according to the vegetation of trees at least once a month. For example, Moderate Resolution (250 m to 1 km resolution, at least 5 km or less resolution) is used to take pictures of the rubber tree plantation GF on a regular basis every day. Then, MODES data having a resolution of 500 m is acquired as observation information.
- Moderate Resolution 250 m to 1 km resolution, at least 5 km or less resolution
- the specific product (MCD43A4 product) is for 8 days before and after the moving average and cloud image are removed and the observation angle (shooting angle, sunlight angle, etc.) is corrected in order to reduce the noise of MODES data. This is an average of the MODES data of.
- the MCD43A4 product is free from the influence of rain clouds and the like, and noise is reduced to provide clear observation information. According to the MCD43A4 product, when detecting the fallen leaves of the Hevea brasiliensis PG, the main leaf fall detection system 1 can obtain appropriate observation information that more faithfully reproduces the vegetation state of the original Hevea brasiliensis PG.
- the calculated specific index value includes a signal indicating a time-series change in the state due to leaf fall or the like.
- FIG. 2A shows the vegetation index of a MODES product (TERRA_500m_daily) having a low processing level.
- FIG. 2B is a vegetation index (spatial resolution 250 m, time synthesis 16 days) of the MODES product (MOD13Q1), which is processing data whose resolution is twice that of FIG. 2 (a) and is spatially averaged and time-synthesized.
- FIG. 2 (c) is a normalized difference vegetation index MCD43A4_NDVI (spatial resolution 500 m mesh) of the MCD43A4 product, which is the processing data of observation angle correction, spatial average, and 16-day moving average.
- FIG. 3 shows the leaf fall data at the site (leaf exhibition data at the site) using 2019 as an example.
- the on-site leaf fall data is the annual fluctuation (annual coverage fluctuation) of the Hevea brasiliensis PG in the actual rubber tree plantation GF.
- the fluctuation pattern of the normalized difference vegetation index MCD43A4_NDVI of the MCD43A4 product is similar to the fluctuation pattern of the leaf fall data in the field shown in FIG.
- whether the decrease in the normalized difference vegetation index MCD43A4_NDVI in the March period is due to seasonality or disease can be determined, for example, by the recovery status of the normalized difference vegetation index MCD43A4_NDVI after March. In other words, if the decline in the normalized difference vegetation index MCD43A4_NDVI does not recover even in the April period, it can be estimated that the leaf fall in March is not due to mere seasonality.
- FIGS. 4 (a) to 4 (c) are schematic views for explaining the annual change in coverage due to the fall of leaves of Hevea brasiliensis PG.
- FIG. 4A exemplifies a method of taking an all-sky photograph AP.
- FIG. 4B exemplifies an all-sky photograph AP when the canopy coverage is 26.9%.
- FIG. 4C exemplifies an all-sky photograph AP when the canopy coverage is 72.4%.
- FIG. 4D exemplifies a graph of annual coverage fluctuations.
- the all-sky photograph AP is an all-sky image taken at each observation point (block) in the direction directly above the forest floor of the Hevea brasiliensis PG.
- the all-sky photograph AP is the result of fixed-point observation (actual, on-site leaf fall data) of the state of leaf spread / fall of the Hevea brasiliensis PG for each block arbitrarily partitioned.
- the spherical photograph AP may be photographed by a digital camera DC using a circular fisheye lens (omnidirectional lens).
- the canopy coverage is, for example, all-sky photo analysis software free from the all-sky photo AP of each observation point taken once a month (for example, lia32 by Kazuki Yamamoto https: //www.agr.nagoya- It is a ratio (%) that the sky is covered with the leaves of Hevea brasiliensis PG calculated by using u.ac.jp/ ⁇ shinkan/LIA32/) and the like. Therefore, it can be used as a quantitative value of the transition of the amount of leaves in the field.
- the annual coverage fluctuation is the change in canopy coverage for 12 months (time-series data) for each section of mass data at each observation point. Annual coverage fluctuations are graphed using any software (eg Microsoft Excel).
- the detection of the fallen leaves of Hevea brasiliensis PG is evaluated by comparing the graph of the time series data of the normalized difference vegetation index MCD43A4_NDVI with the graph of the fallen leaves data at the site. It becomes possible.
- FIG. 5 shows an evaluation example of the leaf fall detection system according to the embodiment.
- FIG. 5 (a) is a graph of annual coverage fluctuations (field leaf fall data) in 2019, and
- FIG. 5 (b) is a graph of time series data of the 2019 normalized difference vegetation index MCD43A4_NDVI.
- the inventor of the present application for example, the graph of the normalized difference vegetation index MCD43A4_NDVI of the MCD43A4 product when the resolution is 500 m (see FIG. 2 (c)) substantially matches the on-site leaf fall data in FIG. 4 (c). I found that.
- the normalized difference vegetation index MCD43A4_NDVI it is possible to accurately detect the fallen leaves of Hevea brasiliensis PG due to seasonality and disease without using the leaf fall data at the site where it is not easy to obtain the all-sky photograph AP.
- FIG. 6 is a display example of an analysis screen by a web browser displayed on the screen MN of the local PC 31, for example, when trying to detect the fallen leaves of the Hevea brasiliensis PG in the rubber tree farm GF.
- MCD43A4 product based on MODES data including rubber tree plantation GF taken by the optical sensor IS of the artificial satellite AS every day from January 2019 in the product generation unit 12 of the ground observation center 11. Is generated.
- the vector data of the rubber tree farm GF prepared in advance is uploaded from the local PC 31 and read into the vector data storage unit 22 of the cloud computing environment 21 via the Internet line INC.
- the acquisition unit 24 of the cloud computing environment 21 imports a specific product (MCD43A4 product) corresponding to the vector data read into the vector data storage unit 22. Then, the normalized difference vegetation index MCD43A4_NDVI that can evaluate the vegetation state of Hevea brasiliensis PG is extracted.
- the “Google Earth Engine” is used to calculate the annual variation value of the normalized difference vegetation index MCD43A4_NDVI for each block of the rubber tree plantation GF. Then, the annual daily variation value of the normalized difference vegetation index MCD43A4_NDVI is output using, for example, a CSV file (Comma Separated Value File) and transferred to the local PC 31 of the rubber tree plantation GF via the Internet line INC.
- a CSV file Common Separated Value File
- a graph of time series data of the normalized difference vegetation index MCD43A4_NDVI is created based on the received annual daily variation value. Then, from the tendency of the graph of the annual variation value of the time-series data of the normalized difference vegetation index MCD43A4_NDVI, an analysis for detecting the fallen leaves of Hevea brasiliensis PG due to seasonality and disease is performed.
- an analysis screen as shown in FIG. 6, for example, is displayed on the screen MN of the local PC 31.
- the analysis result of the local PC 31 is also displayed on the screen MN. In this way, a series of processes is completed.
- the defoliation of Hevea brasiliensis PG can be accurately detected, and the defoliation due to seasonality and disease can be easily detected without requiring experience or skill. Can be provided.
- the vegetation index NDVI is extracted from the MCD43A4 product, which is a MODES product, by using the MODES data from the MODES satellite capable of daily imaging, and the fallen leaves of the para rubber tree PG of the rubber tree plantation GF are detected. I am doing it.
- the normalized difference vegetation index MCD43A4_NDVI of the MCD43A4 product when the resolution of the MODES data is set to 500 m is used, but the present invention is not limited to this.
- the water condition the amount of water in the vegetation indicated by the normalized water index NDWI, etc.
- the temperature condition as index values
- leaf fall detection system 1 has been described above based on the embodiment, the present invention is not limited to this, and the configuration of each part can be replaced with an arbitrary configuration having the same function.
Landscapes
- Life Sciences & Earth Sciences (AREA)
- Business, Economics & Management (AREA)
- Engineering & Computer Science (AREA)
- Primary Health Care (AREA)
- Tourism & Hospitality (AREA)
- Mining & Mineral Resources (AREA)
- Animal Husbandry (AREA)
- Health & Medical Sciences (AREA)
- Economics (AREA)
- General Health & Medical Sciences (AREA)
- Human Resources & Organizations (AREA)
- Marketing (AREA)
- Agronomy & Crop Science (AREA)
- Strategic Management (AREA)
- Marine Sciences & Fisheries (AREA)
- Physics & Mathematics (AREA)
- General Business, Economics & Management (AREA)
- General Physics & Mathematics (AREA)
- Theoretical Computer Science (AREA)
- Biodiversity & Conservation Biology (AREA)
- Botany (AREA)
- Ecology (AREA)
- Forests & Forestry (AREA)
- Environmental Sciences (AREA)
- Management, Administration, Business Operations System, And Electronic Commerce (AREA)
Abstract
落葉検出システムおよび落葉検出方法は、人工衛星(AS)によって各月に1回以上の頻度で取得された樹木(PG)の植生に応じた各観測情報に対し、所定の処理を施すことによりノイズ低減のための観測角度が適正に補正された特定のプロダクトより算出された、前記樹木の植生の状態を評価可能な特定の指標値を入手する入手部(24)と、入手部(24)で入手した特定の指標値に基づいて、樹木(PG)の落葉状況を検出する検出部(31)と、を具備する。
Description
本発明は、農園内における樹木の植生状態評価を行う落葉検出システムおよび落葉検出方法に関する。特に、ゴムの木(パラゴムノキ)の落葉を検出する落葉検出システムおよび落葉検出方法に関する。
従来、パラゴムノキの植生状態評価を行う方法の1つとして、罹病木(感染木)と健全木(非感染木)との区別が可能な罹病判定方法が提案されている(特許文献1参照)。
特許文献1に記載の罹病判定方法は、人工衛星を使って取得したパラゴムノキの農園内のモノクロ画像と近赤外領域に感度を有する画像とを比較して、パラゴムノキが根白腐病に罹病しているか否かを判定するものであった。この方法によれば、判定作業者に特別な経験や熟練が要求されないため、パラゴムノキが罹病しているかどうかの判定が容易に可能とされる。
しかしながら、葉枯れ病に罹病しているかどうか等、季節性および病害による樹木の落葉の判定には、判定作業者の特別な経験や熟練が必要であった。これは、上記した従来の人工衛星で取得した画像による判定方法では、パラゴムノキが葉枯れ病に罹病しているかどうかを判定することができなかったことによる。
特に、パラゴムノキの農園は、雲が発生する確率が高く雨量が多い熱帯地方に広く分布している。
人工衛星は、通常は光学センサーによって地表面の状態を画像として取得(撮影)する。したがって、搭載された光学センサーにもよるが、人工衛星は、雲があると地表面の状態を撮影することができない。
即ち、パラゴムノキが葉枯れ病に罹病しているかの判定を精度よく行うためには、人工衛星によってパラゴムノキの状態の時系列の変化を撮影できるシステム、あるいは罹病判定方法が必要であった。
そのためには、撮影の頻度が高い光学センサーを利用する必要がある。つまり、多数の撮影画像の中から、雲のない、地表面の状態が良好に撮影された画像だけを選出し、それを平均化することで、パラゴムノキの状態の時系列の変化を正確に捉えることが可能となる。
ところが、人工衛星の光学センサーデータは非常にノイズの多いデータである。そのため、生データに近い撮影画像のままでは、パラゴムノキの状態の時系列の変化を正確に捉えるのが難しい。
また、単に複数日分のセンサーデータを平均化すると、ノイズは低減できるものの、パラゴムノキの状態の時系列の変化を示す信号も消えてしまう。このため、平均化したデータでは、本来のパラゴムノキの状態変化を捉えることができない。
このように、従来から、経験や熟練を必要とせずに、季節性および病害による樹木の落葉を容易に検出可能な技術の確立が要望されていた。
本発明の目的は、樹木の落葉を正確に検出でき、季節性および病害による落葉を容易にかつ精度よく検出することが可能な落葉検出システムおよび落葉検出方法を提供することにある。
本発明の一態様に係る落葉検出システムは、人工衛星によって各月に1回以上の頻度で取得された樹木の植生に応じた各観測情報に対し、所定の処理を施すことによりノイズ低減のための観測角度が適正に補正された特定のプロダクトより算出された、前記樹木の植生の状態を評価可能な特定の指標値を入手する入手部と、前記入手部で入手した前記特定の指標値に基づいて、前記樹木の落葉状況を検出する検出部と、を具備する。
また、本発明の他の一態様に係る落葉検出方法は、人工衛星によって各月に1回以上の頻度で取得された樹木の植生に応じた各観測情報に対し、所定の処理を施すことによりノイズ低減のための観測角度が適正に補正された特定のプロダクトより算出された、前記樹木の植生の状態を評価可能な特定の指標値を入手する工程と、前記入手した前記特定の指標値に基づいて、前記樹木の落葉状況を検出する工程と、を備える。
このような落葉検出システム或いは落葉検出方法によれば、人工衛星による観測データから抽出された樹木の植生の状態を適正に評価できる特定の指標値の利用により、季節性および病害による樹木の状態変化(落葉)を容易に且つ精度よく検出可能となる。
特に、樹木の季節性および病害による落葉を、人工衛星からの観測データをダウンロードしたりせず、クラウドコンピューティング環境下での解析(クラウド解析)により容易に検出することができる。
以下に、実施形態に係る落葉検出システムについて、図面を参照して説明する。
(概略構成)
図1は、実施形態に係る落葉検出システム1の構成例を示す。落葉検出システム1は、例えば図1に示すように、地球観測用の人工衛星ASに搭載された光学センサーISからのセンサーデータ(人工衛星データ)に基づいて、季節性および病害による樹木の落葉を検出するように構成されている。
図1は、実施形態に係る落葉検出システム1の構成例を示す。落葉検出システム1は、例えば図1に示すように、地球観測用の人工衛星ASに搭載された光学センサーISからのセンサーデータ(人工衛星データ)に基づいて、季節性および病害による樹木の落葉を検出するように構成されている。
ここでは、樹木の植生状態(葉の繁茂)の評価対象が、例えば、地球BE上の雨が多い地域REにおける地表面上の任意の地点である特定のゴムノキ農園GFのパラゴムノキPGの落葉である場合について説明する。該パラゴムノキPGの落葉は、落葉検出システム1により簡単に検出できる。
即ち、落葉検出システム1は、例えば、クラウドコンピューティング環境21と、ゴムノキ農園GFのローカルPC(パーソナルコンピュータ)31、スマートフォン32等とが、インターネット回線INCを介して接続されてなる構成とされている。
クラウドコンピューティング環境21は、衛星画像の解析を行うためのオンラインのプラットフォームである。クラウドコンピューティング環境21として、例えば、グーグル(Google)社が開発した「Google Earth Engine(GEE)」などが利用される。このクラウドコンピューティング環境21は、観測データ(センサーデータ)を計算したり、加工したり、画像解析したりすることを容易に可能とする。
なお、「Google Earth Engine」は、リモートセンシングおよびクラウドのGIS(地理情報システム)による解析環境である。このため、「Google Earth Engine」によれば、ゴムノキ農園GFのローカルPC31より、インターネット回線INCを介して、グーグル社のサーバに指示を送ることで、すべての解析が行われた後に結果のみを返送させることができる。よって、例えばゴムノキ農園GFにおいて、高価な衛星画像解析ソフトなどを準備することなく、落葉の検出といった高度な画像解析を簡単に実施・共有できるようになる。
クラウドコンピューティング環境21は、例えば図1に示すように、マップのベクターデータ格納部22や、後述する特定の指標値としての正規化植生指数MCD43A4_NDVIを入手する入手部24など、を備えている。
ベクターデータ格納部22は、パラゴムノキPGの落葉を検出する際に、例えばゴムノキ農園GFのローカルPC31からの指示に応じて、該当する地域のベクターデータを一時的に格納する。
ベクターデータとは、例えば、検出の対象となる現場のゴムノキ農園GFを含む所定の領域の地図に対して輪郭補正が施されるとともに、区画(ブロック)表示のためのマスデータが重ねられた地図データである。このベクターデータは、予め準備されるものであり、例えば、落葉の検出時にゴムノキ農園GFのローカルPC31からアップロードされる。
入手部24は、例えば、クラウドコンピューティング環境21内に保管された特定のプロダクト(MCD43A4プロダクト)から、ベクターデータ格納部22に格納されたベクターデータに応じた部分を取得する。取得した部分のプロダクトについて、樹木の植生の状態を評価可能な正規化植生指数MCD43A4_NDVIを入手する。
また、クラウドコンピューティング環境21では、ベクターデータ格納部22にベクターデータを読み込んだ後、例えば入手部24によって、区画ごとに正規化植生指数MCD43A4_NDVIの年間の日変動値(時系列データ)を算出する。
一般的に、樹木の葉は、赤色光(620~690nm)を吸収し、近赤外域(720~1200nm)の光を反射する。このため、正規化植生指数MCD43A4_NDVIは、(RNIR-RRed)/(RNIR+RRed)によって求めることができる。ここで、RNIRは近赤外域における分光反射率であり、RRedは赤色光の分光反射率である。
即ち、実施形態においては、季節性および病害によるパラゴムノキPGの落葉(葉の繁茂)を検出するための指標として、MODISプロダクトである、MCD43A4プロダクト(“Nadir BRDF-Adjusted Reflectance 16-Day L3 Global 500m”)から算出された正規化植生指数(Normalized Difference Vegetation Index)MCD43A4_NDVIを利用している。
ゴムノキ農園GFのローカルPC31やスマートフォン32は、人工衛星ASによって取得された観測データから派生した各種のプロダクトをインターネット回線INCより獲得したり、落葉の検出に必要な指示などを入力したりするものである。
実施形態においては、ローカルPC31によって検出部が構成されている。即ち、ローカルPC31は、例えばデータベースサーバを有し、該データベースサーバで、入手部24によって算出された正規化植生指数MCD43A4_NDVIの年間の日変動値を、任意のソフトを使ってグラフ化する。さらに、日変動値の増減を解析することで、ゴムノキ農園GF内のパラゴムノキPGの落葉を検出する。なお、任意のソフトは、例えばマイクロソフト(Microsoft)社のエクセルなどでもよい。
なお、落葉を検出するための解析は、ローカルPC31内のデータベースサーバで行われなくてもよい。例えば、クラウドコンピューティング環境21内、あるいは、別のクラウドコンピューティング環境下などで行ってもよい。前記別のクラウドコンピューティング環境下としては、GEE以外の、後述する「Microsoft Azure」や「Amazon Web Services (AWS)」または「Google Cloud Platform」などがあげられる。
また、ローカルPC31は、検出されたパラゴムノキPGの落葉を、現場の落葉データを用いて評価する際にも利用される(詳細については後述する)。
ここで、人工衛星ASによって取得された観測データは、管理部としての地上観測センター11で受信される。地上観測センター11は、観測データから派生した各種のプロダクトをインターネット回線INC上に公開するようになっている。
実施形態においては、光学センサーISとして、MODIS(Moderate Resolution Imaging Spectroradiometer/中分解能撮像分光放射計)が用いられる。このMODISは、現在、アメリカ航空宇宙局(NASA)などにより管理されるテラ(Terra)衛星やアクア(Aqua)衛星といった人工衛星(MODIS衛星ともいう)ASに搭載されている。
即ち、地上観測センター11は、人工衛星ASの移動に伴い光学センサーISで撮影されたMODISデータに基づいて、各種のMODISプロダクトを生成するプロダクト生成部12などを備えている。プロダクト生成部12は、例えばNASAのサーバである。プロダクト生成部12は、特に、MODISプロダクトとして、特定のプロダクト(MCD43A4プロダクト、500m分解能、日別の地球表面反射率)を生成する。
なお、実施形態では、人工衛星ASによって月ごとに1回以上の頻度で樹木の植生に応じた観測情報が取得される。例えば、MODIS(250m~1kmの解像度、少なくとも5km以下の解像度)で1日ごとに定期的にゴムノキ農園GFの撮影が行われる。そして、500m解像度のMODISデータが観測情報として取得される。
例えば、ゴムノキ農園GFの植林区画が広大な場合にも、人工衛星ASを利用することによって、リモートセンシングによる農園全域の撮影が容易に可能とされる。
特定のプロダクト(MCD43A4プロダクト)とは、MODISデータのノイズ低減のために、例えば移動平均や雲画像の除去、および、観測角度(撮影角度および太陽光角度など)の補正がなされた前後8日分のMODISデータを平均化したものである。該MCD43A4プロダクトは、雨雲などの影響が排除され、ノイズも低減されて鮮明な観察情報になっている。MCD43A4プロダクトによれば、パラゴムノキPGの落葉を検出する際に、本落葉検出システム1が、本来のパラゴムノキPGの植生状態をより忠実に再現した適正な観測情報を入手可能になる。したがって、MCD43A4プロダクトから、例えば特定の指標値(MCD43A4_NDVI)を算出することにより、パラゴムノキPGの植生状態の変化を容易に捕捉できるようになる。このとき、算出された特定の指標値(MCD43A4_NDVI)は、落葉などによる状態の時系列の変化を示す信号を含む。
(正規化植生指数MCD43A4_NDVIの評価)
図2(a)~図2(c)は、MODISプロダクトの植生指数の時系列の変動パターンを対比して示すものである。ここでは、2019年の1月期から12月期の観測データを例示して説明する。
図2(a)~図2(c)は、MODISプロダクトの植生指数の時系列の変動パターンを対比して示すものである。ここでは、2019年の1月期から12月期の観測データを例示して説明する。
例えば図2(a)は、処理レベルの低いMODISプロダクト(TERRA_500m_daily)の植生指数である。図2(b)は、解像度が図2(a)の倍で空間平均・時間合成した加工データであるMODISプロダクト(MOD13Q1)の植生指数(空間分解能250m、時間合成16day)である。図2(c)は、観測角度補正、空間平均、16日移動平均した加工データであるMCD43A4プロダクトの正規化植生指数MCD43A4_NDVI(空間分解能500mメッシュ)である。
図3は、現場の落葉データ(現場の展葉データ)を、2019年を例に示すものである。ここで、現場の落葉データ(現場の展葉データ)とは、実際のゴムノキ農園GF内のパラゴムノキPGの被覆率の年間変動(年間被覆率変動)である。
パラゴムノキPGの被覆率は、例えば図3からも明らかなように、乾季の落葉に伴って大きく落ち込む。つまり、図3中矢印で示した3月のデータのように、パラゴムノキPGの落葉は、被覆率の低下として現れる。
図2(c)に示すように、MCD43A4プロダクトの正規化植生指数MCD43A4_NDVIは、その変動パターンが、図3に示した現場の落葉データの変動パターンに類似したものとなっている。
即ち、正規化植生指数MCD43A4_NDVIのグラフは、実際の年間被覆率変動のグラフに類似していることから、季節性によるパラゴムノキPGの落葉を正確に検出できるとともに、例えば葉枯れ病などの病害による落葉も正確に検出可能である。
これに対して、図2(a)のMODISプロダクトではノイズの影響で2019年の時系列の植生指数の傾向を見ることが困難である。また、図2(b)のMODISプロダクトでも、時系列の植生指数に、図3のパラゴムノキPGの被覆率の3月のデータにみられる落葉による植生指数の低下は確認できない。このため、図2(a)、図2(b)に示されたMODISプロダクトでは、2019年の時系列の植生指数の傾向を検出することが困難である。
このように、図2(c)に示した正規化植生指数MCD43A4_NDVIによれば、3月期のような正規化植生指数MCD43A4_NDVIの低下から季節性によるパラゴムノキPGの落葉を判定できる。また、それ以外の月期の正規化植生指数MCD43A4_NDVIの低下から、病害による落葉を判定することができる。
なお、3月期の正規化植生指数MCD43A4_NDVIの低下が、季節性によるものか、病害によるものかの判定は、例えば、3月以降の正規化植生指数MCD43A4_NDVIの回復の状況により判定可能である。つまり、4月期においても正規化植生指数MCD43A4_NDVIの低下が回復しない場合には、3月の落葉は、単なる季節性によるものではないと推定できる。
ここで、現場の落葉データの算出方法について簡単に説明する。
図4(a)~図4(c)は、パラゴムノキPGの落葉による年間被覆率変動について説明するための概略図である。なお、図4(a)は全天写真APの撮影方法を例示するものである。図4(b)は林冠被覆率が26.9%の場合の全天写真APを例示するものである。図4(c)は林冠被覆率が72.4%の場合の全天写真APを例示するものである。図4(d)は年間被覆率変動のグラフを例示するものである。
全天写真APとは、例えば図4(a)に示すように、各観測箇所(ブロック)において、パラゴムノキPGの林木の林床より真上方向を定期的に撮影した全天画像である。つまり、全天写真APとは、任意に区画された各ブロックについて、パラゴムノキPGの展葉/落葉の状況を定点観測した結果(実際の、現場の落葉データ)である。なお、全天写真APは、円形魚眼レンズ(全天レンズ)を用いて、デジタルカメラDCで撮影されてもよい。
林冠被覆率は、例えば月に1回の頻度で撮影された各観測箇所の全天写真APよりフリーの全天写真解析ソフト(例えば、lia32 山本一清氏作 https://www.agr.nagoya-u.ac.jp/~shinkan/LIA32/)などを使って算出された、パラゴムノキPGの葉によって空が覆われている比率(%)である。よって、現場での葉の量の推移の定量値とすることができる。
年間被覆率変動とは、各観測箇所であるマスデータの区画ごとの、12か月分の林冠被覆率の変化(時系列データ)である。年間被覆率変動は、任意のソフト(例えば、Microsoft社のエクセルなど)を使ってグラフ化される。
したがって、他のクラウドコンピューティング環境やローカルPC31などにおいて、正規化植生指数MCD43A4_NDVIの時系列データのグラフを、現場の落葉データのグラフと対比させることで、パラゴムノキPGの落葉の検出についての評価を行うことが可能となる。
図5は、実施形態に係る落葉検出システムの評価例を示すものである。図5(a)は、2019年の年間被覆率変動(現場の落葉データ)のグラフであり、図5(b)は、2019年の正規化植生指数MCD43A4_NDVIの時系列データのグラフである。
図5(a)および図5(b)からも明らかなように、年間被覆率変動のグラフと正規化植生指数MCD43A4_NDVIの時系列データのグラフとは、変動パターンがほぼ一致(同調)する。このことから、正規化植生指数MCD43A4_NDVIの時系列データのグラフに基づいて、季節性および病害によるパラゴムノキPGの落葉を正確に検出できる。
即ち、本願発明者は、例えば、解像度を500mとした際のMCD43A4プロダクトの正規化植生指数MCD43A4_NDVIのグラフ(図2(c)参照)が、図4(c)の現場の落葉データとほぼ一致することを見出した。正規化植生指数MCD43A4_NDVIを利用すれば、全天写真APの取得が容易でない現場の落葉データを用いずとも、季節性および病害によるパラゴムノキPGの落葉を正確に検出することができる。
図6は、ゴムノキ農園GFにおいてパラゴムノキPGの落葉を検出しようとする場合に、例えばローカルPC31の画面MN上に表示されるウェブブラウザによる解析画面の表示例である。
即ち、パラゴムノキPGの落葉の検出時には、解析画面表示として、検出の対象となる現場などを選択するためのデータ選択、指示された解析内容、画像解析のためのデータ&グラフ、および、落葉を検出するための解析画像などが表示される。
このように、ウェブブラウザを経由させることによって、巨大な人工衛星データをダウンロードせずとも、クラウドコンピューティング環境下でクラウド解析することが可能である。つまり、ネットワーククラウド上のコンピュータリソースを利用することで、広大なゴムノキ農園GF内のパラゴムノキPGの落葉の検出を有効に行い得る。
(動作手順)
次に、パラゴムノキPGの落葉を検出する場合の処理の流れ(落葉検出方法)について、具体例を挙げて説明する。
次に、パラゴムノキPGの落葉を検出する場合の処理の流れ(落葉検出方法)について、具体例を挙げて説明する。
例えば、地上観測センター11のプロダクト生成部12において、2019年の1月から毎日、人工衛星ASの光学センサーISによって撮影されたゴムノキ農園GFを含むMODISデータに基づいて、特定のプロダクト(MCD43A4プロダクト)が生成される。
これに対し、まずは、予め用意したゴムノキ農園GFのベクターデータをローカルPC31よりアップロードし、インターネット回線INCを介して、クラウドコンピューティング環境21のベクターデータ格納部22に読み込ませる。
その後、クラウドコンピューティング環境21の入手部24によって、ベクターデータ格納部22に読み込ませたベクターデータに該当する特定のプロダクト(MCD43A4プロダクト)を取り込ませる。そして、パラゴムノキPGの植生の状態を評価可能な正規化植生指数MCD43A4_NDVIを抽出させる。
また、例えばクラウドコンピューティング環境21内の入手部24において、「Google Earth Engine」を利用して、ゴムノキ農園GFの各ブロックについて、正規化植生指数MCD43A4_NDVIの年間の日変動値を算出させる。そして、正規化植生指数MCD43A4_NDVIの年間の日変動値を、例えばCSVファイル(Comma Separated Value File)を用いて出力させ、インターネット回線INCを介して、ゴムノキ農園GFのローカルPC31に転送させる。
一方、ローカルPC31では、受け取った年間の日変動値に基づいて、正規化植生指数MCD43A4_NDVIの時系列データのグラフが作成される。そして、正規化植生指数MCD43A4_NDVIの時系列データの年間日変動値のグラフの増減の傾向から、季節性および病害によるパラゴムノキPGの落葉の検出のための解析が行われる。
その際、ローカルPC31の画面MN上に、例えば図6に示したような解析画面が表示される。また、画面MN上には、ローカルPC31での解析結果も表示される。こうして、一連の処理が終了する。
上記したように、実施形態によれば、パラゴムノキPGの落葉を正確に検出可能であり、季節性および病害による落葉を経験や熟練を必要とすることなしに容易に検出可能である落葉検出システム1を提供できる。
(作用・効果)
上述した実施形態によれば、以下のような作用・効果が得られる。
上述した実施形態によれば、以下のような作用・効果が得られる。
即ち、実施形態においては、毎日の撮影が可能なMODIS衛星からのMODISデータを利用し、MODISのプロダクトであるMCD43A4プロダクトから植生指数NDVIを抽出して、ゴムノキ農園GFのパラゴムノキPGの落葉を検出するようにしている。
これにより、パラゴムノキPGの落葉の検出に、正規化植生指数MCD43A4_NDVIの年間の日変動値の変動パターンを利用できるようになる。
したがって、たとえゴムノキ農園GFが特に雨の多い地域にあったとしても、雨雲によるデータ欠損の影響を軽減できるなど、パラゴムノキPGの落葉状況をより正確に検出できる。
なお、人工衛星ASからの観察情報として、MODIS衛星からのMODISデータを利用する例を挙げたが、ランドサット衛星に搭載された、解像度が30mで、撮影頻度が16日周期の光学センサー等でも、画像解析のスペックとしては十分である。ただし、撮影頻度が非常に高いMODISデータを用いた場合、ノイズの低減時に、パラゴムノキPGの状態の時系列の変化を示す重要な信号が消失するといった不具合をより低減することができる。
しかも、季節性および病害による落葉を特別な経験や熟練を必要とすることなしに、容易に検出可能となる。
特に、パラゴムノキPGの主要な病害の1つであり、有効な診断方法が確立されていない葉枯れ病の、ゴムノキ農園GF内での罹病状態を広範囲にわたって把握することが容易に可能である。
なお、上記した実施形態においては、パラゴムノキPGの落葉を検出するために、MODISデータの解像度を500mとした際のMCD43A4プロダクトの正規化植生指数MCD43A4_NDVIを利用するようにしたが、これに限定されない。
即ち、各種の樹木について、該樹木の落葉を500m以上の解像度で検出する場合など、例えば図7に示すように、異なる衛星や指標値(拡張植生指標EVIや正規化水指数NDWIなど)などを用途に応じて任意に組み合わせることも可能である。
例えば、指標値として、水状態(正規化水指数NDWIなどで示される植生における水分量)や温度状態などを加味することにより、樹木の落葉をより高精度に検出できるようになる。
特に、データ量や解析の容易さなどから「Google Earth Engine」を利用するようにしたが、「Google Earth Engine」以外の解析環境、例えば、アマゾン(amazon)社の「Amazon Web Services(AWS)」、「Earth on AWS」やマイクロソフト社の「AI for Earth」、「Microsoft Azure」、または、「Google Cloud Platform」などを利用するようにしても良い。
このように、衛星の種類、プロダクトのタイプ、指標値、および、解析環境などの組み合わせしだいで、農園管理用途としての樹木の落葉の検出とは異なる、例えば資源管理や探索、災害など、他のサステナブル用途にも適用できる。
また、その他の実施形態としては、例えば、時系列モデルを利用した落葉の予測(図8参照)や、空間的なハザードマップによる落葉の可視化(図9参照)などを行うことも可能である。
以上、落葉検出システム1を実施形態に基づいて説明したが、本発明はこれに限定されるものではなく、各部の構成などは、同様の機能を有する任意の構成のものに置き換えることができる。
特願2020-173119号(出願日:2020年10月14日)の全内容は、ここに援用される。
1 落葉検出システム 11 地上観測センター 21 クラウドコンピューティング環境 22 ベクターデータ格納部 24 入手部 31 ローカルPC(検出部) AS 人工衛星(MODIS衛星) GF ゴムノキ農園 IS 光学センサー(MODIS) INC インターネット回線 NDVI 正規化植生指数(特定の指標値) PG パラゴムノキ(樹木)
Claims (10)
- 人工衛星によって各月に1回以上の頻度で取得された樹木の植生に応じた各観測情報に対して所定の処理を施すことによりノイズ低減のための観測角度が適正に補正された特定のプロダクトより算出された、前記樹木の植生の状態を評価可能な特定の指標値を入手する入手部と、
前記入手部で入手した前記特定の指標値に基づいて、前記樹木の落葉状況を検出する検出部と、
を具備することを特徴とする落葉検出システム。 - 前記入手部は、前記人工衛星であるテラ衛星またはアクア衛星に搭載されたMODISにより5km以下の解像度で撮影された衛星画像を前記観測情報とし、前記観測情報に対する前記所定の処理として前記MODISの撮影角度および太陽光角度の補正がなされるとともに移動平均によりノイズの除去が行われたMCD43A4プロダクトを前記特定のプロダクトとし、前記MCD43A4プロダクトから算出された正規化植生指数を前記特定の指標値として入手することを特徴とする請求項1に記載の落葉検出システム。
- 前記入手部は、クラウドコンピューティング環境下に設けられることを特徴とする請求項1または2に記載の落葉検出システム。
- 前記入手部は、前記特定の指標値として、水状態および温度状態のいずれかをさらに入手することを特徴とする請求項2に記載の落葉検出システム。
- 前記検出部は、ローカルPCあるいはクラウドコンピューティング環境下で前記樹木の落葉状態を解析するものであることを特徴とする請求項1に記載の落葉検出システム。
- 人工衛星によって各月に1回以上の頻度で取得された樹木の植生に応じた各観測情報に対して所定の処理を施すことによりノイズ低減のための観測角度が適正に補正された特定のプロダクトより算出された、前記樹木の植生の状態を評価可能な特定の指標値を入手する工程と、
前記入手した前記特定の指標値に基づいて、前記樹木の落葉状況を検出する工程と、
を備えることを特徴とする落葉検出方法。 - 前記特定の指標値を入手する工程は、前記人工衛星であるテラ衛星またはアクア衛星に搭載されたMODISにより5km以下の解像度で撮影された衛星画像を前記観測情報とし、前記観測情報に対する前記所定の処理として前記MODISの撮影角度および太陽光角度の補正がなされるとともに移動平均によりノイズの除去が行われたMCD43A4プロダクトを前記特定のプロダクトとし、前記MCD43A4プロダクトから算出された正規化植生指数を前記特定の指標値として入手することを特徴とする請求項6に記載の落葉検出方法。
- 前記特定の指標値を入手する工程は、クラウドコンピュータ環境下で行われるものであることを特徴とする請求項6または7に記載の落葉検出方法。
- 前記特定の指標値として、水状態および温度状態のいずれかがさらに入手されることを特徴とする請求項7に記載の落葉検出方法。
- 前記樹木の落葉状況を検出する工程は、ローカルPCあるいはクラウドコンピューティング環境下で前記樹木の落葉状態を解析するものであることを特徴とする請求項6に記載の落葉検出方法。
Priority Applications (3)
| Application Number | Priority Date | Filing Date | Title |
|---|---|---|---|
| JP2022557048A JPWO2022080418A1 (ja) | 2020-10-14 | 2021-10-13 | |
| CN202180069795.XA CN116322303A (zh) | 2020-10-14 | 2021-10-13 | 落叶检测系统和落叶检测方法 |
| JP2024130950A JP7743583B2 (ja) | 2020-10-14 | 2024-08-07 | 落葉検出方法 |
Applications Claiming Priority (2)
| Application Number | Priority Date | Filing Date | Title |
|---|---|---|---|
| JP2020-173119 | 2020-10-14 | ||
| JP2020173119 | 2020-10-14 |
Publications (1)
| Publication Number | Publication Date |
|---|---|
| WO2022080418A1 true WO2022080418A1 (ja) | 2022-04-21 |
Family
ID=81209193
Family Applications (1)
| Application Number | Title | Priority Date | Filing Date |
|---|---|---|---|
| PCT/JP2021/037916 Ceased WO2022080418A1 (ja) | 2020-10-14 | 2021-10-13 | 落葉検出システムおよび落葉検出方法 |
Country Status (3)
| Country | Link |
|---|---|
| JP (2) | JPWO2022080418A1 (ja) |
| CN (1) | CN116322303A (ja) |
| WO (1) | WO2022080418A1 (ja) |
Cited By (1)
| Publication number | Priority date | Publication date | Assignee | Title |
|---|---|---|---|---|
| WO2025041550A1 (ja) * | 2023-08-23 | 2025-02-27 | 株式会社ブリヂストン | 情報処理装置、情報処理方法及びプログラム |
Citations (4)
| Publication number | Priority date | Publication date | Assignee | Title |
|---|---|---|---|---|
| JP2003296702A (ja) * | 2002-04-05 | 2003-10-17 | Japan Science & Technology Corp | 地球観測衛星データのノイズ除去処理方法、ノイズ除去処理プログラム、ノイズ除去処理プログラムを記録した記録媒体 |
| JP2010068719A (ja) * | 2008-09-16 | 2010-04-02 | Hitachi Software Eng Co Ltd | 緑地監視システム及び緑地監視配信方法 |
| CN102629324A (zh) * | 2011-08-02 | 2012-08-08 | 林辉 | Modis生物物理参数森林信息提取方法 |
| US20140081579A1 (en) * | 2009-07-31 | 2014-03-20 | Carbon Auditors Inc. | Greenhouse gas grid and tracking system |
Family Cites Families (3)
| Publication number | Priority date | Publication date | Assignee | Title |
|---|---|---|---|---|
| JP2015128380A (ja) * | 2014-01-06 | 2015-07-16 | 株式会社ブリヂストン | ゴムノキの農業管理支援情報提供方法及び農業管理方法 |
| JP2015188333A (ja) * | 2014-03-27 | 2015-11-02 | 株式会社日立製作所 | 植生生長分析システム及び方法 |
| GB2561845A (en) | 2017-04-24 | 2018-10-31 | Point4Uk Ltd | Determining risk posed by vegetation |
-
2021
- 2021-10-13 JP JP2022557048A patent/JPWO2022080418A1/ja active Pending
- 2021-10-13 WO PCT/JP2021/037916 patent/WO2022080418A1/ja not_active Ceased
- 2021-10-13 CN CN202180069795.XA patent/CN116322303A/zh not_active Withdrawn
-
2024
- 2024-08-07 JP JP2024130950A patent/JP7743583B2/ja active Active
Patent Citations (4)
| Publication number | Priority date | Publication date | Assignee | Title |
|---|---|---|---|---|
| JP2003296702A (ja) * | 2002-04-05 | 2003-10-17 | Japan Science & Technology Corp | 地球観測衛星データのノイズ除去処理方法、ノイズ除去処理プログラム、ノイズ除去処理プログラムを記録した記録媒体 |
| JP2010068719A (ja) * | 2008-09-16 | 2010-04-02 | Hitachi Software Eng Co Ltd | 緑地監視システム及び緑地監視配信方法 |
| US20140081579A1 (en) * | 2009-07-31 | 2014-03-20 | Carbon Auditors Inc. | Greenhouse gas grid and tracking system |
| CN102629324A (zh) * | 2011-08-02 | 2012-08-08 | 林辉 | Modis生物物理参数森林信息提取方法 |
Cited By (1)
| Publication number | Priority date | Publication date | Assignee | Title |
|---|---|---|---|---|
| WO2025041550A1 (ja) * | 2023-08-23 | 2025-02-27 | 株式会社ブリヂストン | 情報処理装置、情報処理方法及びプログラム |
Also Published As
| Publication number | Publication date |
|---|---|
| CN116322303A (zh) | 2023-06-23 |
| JPWO2022080418A1 (ja) | 2022-04-21 |
| JP7743583B2 (ja) | 2025-09-24 |
| JP2024156931A (ja) | 2024-11-06 |
Similar Documents
| Publication | Publication Date | Title |
|---|---|---|
| Lussem et al. | Estimating biomass in temperate grassland with high resolution canopy surface models from UAV-based RGB images and vegetation indices | |
| Aboutalebi et al. | Assessment of different methods for shadow detection in high-resolution optical imagery and evaluation of shadow impact on calculation of NDVI, and evapotranspiration | |
| Waser et al. | Assessing changes of forest area and shrub encroachment in a mire ecosystem using digital surface models and CIR aerial images | |
| US9824276B2 (en) | System and method for assessing rangeland | |
| JP7697061B2 (ja) | 山火事の時間的境界 | |
| Bartalev et al. | Assessment of burned forest areas over the Russian federation from MODIS and Landsat-TM/ETM+ imagery | |
| CN117739925A (zh) | 一种无人机的影像智能分析方法 | |
| JP7859667B2 (ja) | 葉緑素量学習推定システム、葉緑素量推定用モデル生成システム、葉緑素量推定システム、葉緑素量推定方法、およびコンピュータプログラム | |
| Li et al. | An enhanced spatiotemporal fusion method–Implications for DNN based time-series LAI estimation by using Sentinel-2 and MODIS | |
| CN114863369A (zh) | 激光雷达监测玉米倒伏的方法、装置、设备及介质 | |
| Bao et al. | Comparison of relative radiometric normalization methods using pseudo-invariant features for change detection studies in rural and urban landscapes | |
| JP2024528434A (ja) | 画像における山火事識別 | |
| Miller et al. | Analyzing crop health in vineyards through a multispectral imaging and drone system | |
| Santos et al. | Predicting eucalyptus plantation growth and yield using Landsat imagery in Minas Gerais, Brazil | |
| Liang et al. | Utilizing digital image processing and two-source energy balance model for the estimation of evapotranspiration of dry edible beans in western Nebraska | |
| Canisius et al. | Comparison and evaluation of Medium Resolution Imaging Spectrometer leaf area index products across a range of land use | |
| JP7743583B2 (ja) | 落葉検出方法 | |
| Propastin et al. | A physically based approach to model LAI from MODIS 250 m data in a tropical region | |
| Coops et al. | Procedures for predicting habitat and structural attributes in eucalypt forests using high spatial resolution remotely sensed imagery | |
| CN110647781B (zh) | 一种基于谱图融合的农作物生长信息获取方法及装置 | |
| Chen | Remote sensing of leaf area index of vegetation covers | |
| Winn et al. | ForestCrowns: a transparency estimation tool for digital photographs of forest canopies | |
| de Jonge et al. | Camera traps enable the estimation of herbaceous aboveground net primary production (ANPP) in an African savanna at high temporal resolution | |
| US10489894B2 (en) | Image processing device, image processing method, and program recording medium | |
| US20230384158A1 (en) | Information processing device, information processing method, and program |
Legal Events
| Date | Code | Title | Description |
|---|---|---|---|
| 121 | Ep: the epo has been informed by wipo that ep was designated in this application |
Ref document number: 21880155 Country of ref document: EP Kind code of ref document: A1 |
|
| ENP | Entry into the national phase |
Ref document number: 2022557048 Country of ref document: JP Kind code of ref document: A |
|
| NENP | Non-entry into the national phase |
Ref country code: DE |
|
| 122 | Ep: pct application non-entry in european phase |
Ref document number: 21880155 Country of ref document: EP Kind code of ref document: A1 |