WO2021246533A1 - 大腸腫瘍の検出方法 - Google Patents
大腸腫瘍の検出方法 Download PDFInfo
- Publication number
- WO2021246533A1 WO2021246533A1 PCT/JP2021/021647 JP2021021647W WO2021246533A1 WO 2021246533 A1 WO2021246533 A1 WO 2021246533A1 JP 2021021647 W JP2021021647 W JP 2021021647W WO 2021246533 A1 WO2021246533 A1 WO 2021246533A1
- Authority
- WO
- WIPO (PCT)
- Prior art keywords
- feces
- acid
- subject
- large intestine
- corresponding value
- Prior art date
- Legal status (The legal status is an assumption and is not a legal conclusion. Google has not performed a legal analysis and makes no representation as to the accuracy of the status listed.)
- Ceased
Links
Images













Classifications
-
- C—CHEMISTRY; METALLURGY
- C12—BIOCHEMISTRY; BEER; SPIRITS; WINE; VINEGAR; MICROBIOLOGY; ENZYMOLOGY; MUTATION OR GENETIC ENGINEERING
- C12Q—MEASURING OR TESTING PROCESSES INVOLVING ENZYMES, NUCLEIC ACIDS OR MICROORGANISMS; COMPOSITIONS OR TEST PAPERS THEREFOR; PROCESSES OF PREPARING SUCH COMPOSITIONS; CONDITION-RESPONSIVE CONTROL IN MICROBIOLOGICAL OR ENZYMOLOGICAL PROCESSES
- C12Q1/00—Measuring or testing processes involving enzymes, nucleic acids or microorganisms; Compositions therefor; Processes of preparing such compositions
- C12Q1/02—Measuring or testing processes involving enzymes, nucleic acids or microorganisms; Compositions therefor; Processes of preparing such compositions involving viable microorganisms
- C12Q1/04—Determining presence or kind of microorganism; Use of selective media for testing antibiotics or bacteriocides; Compositions containing a chemical indicator therefor
- C12Q1/06—Quantitative determination
-
- C—CHEMISTRY; METALLURGY
- C12—BIOCHEMISTRY; BEER; SPIRITS; WINE; VINEGAR; MICROBIOLOGY; ENZYMOLOGY; MUTATION OR GENETIC ENGINEERING
- C12N—MICROORGANISMS OR ENZYMES; COMPOSITIONS THEREOF; PROPAGATING, PRESERVING, OR MAINTAINING MICROORGANISMS; MUTATION OR GENETIC ENGINEERING; CULTURE MEDIA
- C12N15/00—Mutation or genetic engineering; DNA or RNA concerning genetic engineering, vectors, e.g. plasmids, or their isolation, preparation or purification; Use of hosts therefor
-
- C—CHEMISTRY; METALLURGY
- C12—BIOCHEMISTRY; BEER; SPIRITS; WINE; VINEGAR; MICROBIOLOGY; ENZYMOLOGY; MUTATION OR GENETIC ENGINEERING
- C12Q—MEASURING OR TESTING PROCESSES INVOLVING ENZYMES, NUCLEIC ACIDS OR MICROORGANISMS; COMPOSITIONS OR TEST PAPERS THEREFOR; PROCESSES OF PREPARING SUCH COMPOSITIONS; CONDITION-RESPONSIVE CONTROL IN MICROBIOLOGICAL OR ENZYMOLOGICAL PROCESSES
- C12Q1/00—Measuring or testing processes involving enzymes, nucleic acids or microorganisms; Compositions therefor; Processes of preparing such compositions
- C12Q1/68—Measuring or testing processes involving enzymes, nucleic acids or microorganisms; Compositions therefor; Processes of preparing such compositions involving nucleic acids
- C12Q1/6809—Methods for determination or identification of nucleic acids involving differential detection
Definitions
- the present invention relates to a method for detecting a large intestine tumor such as an adenoma or intramucosal cancer. If colorectal cancer can be detected at a stage before it becomes advanced cancer, it can reduce the mortality rate of patients and improve the quality of life of patients because it can be removed by endoscopy. You can also do it.
- Colorectal cancer is the most common cancer in Japan, overtaking stomach cancer. Westernization of lifestyles such as diet is thought to be the cause, but the mechanism is not clear.
- Non-Patent Document 1 Non-Patent Document 2
- Colorectal cancer progresses to advanced cancer via multiple polyps (adenomas) and intramucosal cancer. So far, several bacteria associated with advanced colorectal cancer have been identified, but no bacteria or metabolites associated with multiple polyps or intramucosal cancer have been identified before the onset of advanced cancer. rice field.
- bacteria such as Actinomyces odontolyticus are related to the early stage of colorectal cancer, and completed the present invention. I came to do.
- a method for detecting a large intestine tumor which comprises the following steps (1) to (3).
- the microorganisms are Actinomyces odontolyticus, Phascolarctobacterium succinatutens, and Actinomyces.
- the process, (2) A step of comparing the value measured in step (1) with the corresponding value in the feces of a healthy person, (3) As a result of the comparison of the step (2), the values measured in the step (1) are Actinomyces odontolyticus, Phascolarctobacterium succinatutens, and Actinomyces.
- the value is lower than the corresponding value in the feces of healthy subjects. Sometimes the process of determining a subject to have a colorectal tumor.
- the microorganisms are Actinomyces odontolyticus, Phascolarctobacterium succinatutens, Actinomyces viscosus, and Actinomyces viscosus. It is at least one type of microorganism selected from the group consisting of Desulfovibrio longreachensis, and the value measured in step (1) in step (3) is higher than the corresponding value in feces of healthy subjects.
- step (1) The microorganism in step (1) is Actinomyces odontolyticus, and the value measured in step (1) in step (3) is higher than the corresponding value in the feces of a healthy person.
- step (A-2) A step of comparing the value measured in the step (a-1) with the corresponding value in the feces of a healthy person, (A-3) As a result of comparison in step (a-2), a step of determining a subject as a colon tumor when the value measured in step (a-1) is higher than the corresponding value in the feces of a healthy person. ..
- [5] The method for detecting a large intestine tumor according to any one of [1] to [3], which further comprises the following steps (b-1) to (b-3).
- (B-1) A step of measuring the amount of an organic acid in the feces of a subject, at least one organic acid selected from the group consisting of succinic acid, fumaric acid, malic acid, and isovaleric acid.
- step (B-2) A step of comparing the value measured in the step (b-1) with the corresponding value in the feces of a healthy person, (B-3) As a result of comparison in step (b-2), a step of determining a subject as a colon tumor when the value measured in step (b-1) is higher than the corresponding value in the feces of a healthy person. ..
- [6] The method for detecting a large intestine tumor according to any one of [1] to [3], which further comprises the following steps (c-1) to (c-3).
- (C-1) A step of measuring the amount of bile acid in the feces of a subject, wherein the bile acid is at least one bile acid selected from the group consisting of deoxycholic acid, glycocholic acid, and taurocholic acid.
- step (C-2) A step of comparing the value measured in the step (c-1) with the corresponding value in the feces of a healthy person, (C-3) As a result of comparison in step (c-2), a step of determining a subject as a colon tumor when the value measured in step (c-1) is higher than the corresponding value in the feces of a healthy person. ..
- the present invention provides a novel method for detecting a large intestine tumor. This method enables the detection of colorectal tumors such as adenomas and intramucosal cancers, which was previously impossible without endoscopy, by non-invasive stool tests.
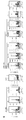
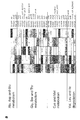
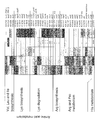
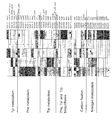
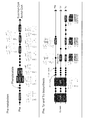
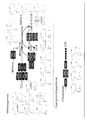
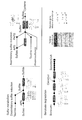
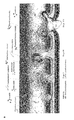
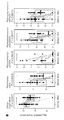
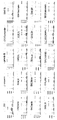
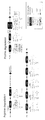
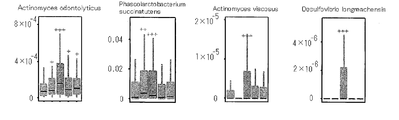
- the bar graph in the figure shows the abundance in healthy subjects, patients with multiple polyps, patients with stage 0 colorectal cancer, patients with stage I and II colorectal cancer, and patients with stage III and IV colorectal cancer.
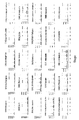
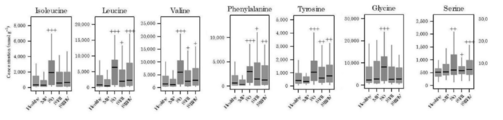
- the bar graph in the figure shows the abundance in healthy subjects, patients with multiple polyps, patients with stage 0 colorectal cancer, patients with stage I and II colorectal cancer, and patients with stage III and IV colorectal cancer.
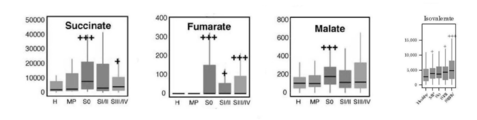
- FIG. 12 is an enlarged view of a diagram relating to succinic acid, fumaric acid, malic acid, and isovaleric acid.
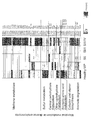
- the bar graph in the figure shows the abundance in healthy subjects, patients with multiple polyps, patients with stage 0 colorectal cancer, patients with stage I and II colorectal cancer, and patients with stage III and IV colorectal cancer.
- DCA deoxycholic acid
- glycocholic acid glycocholic acid
- taurocholic acid in FIG.
- the bar graph in the figure shows the abundance in healthy subjects, patients with multiple polyps, patients with stage 0 colorectal cancer, patients with stage I and II colorectal cancer, and patients with stage III and IV colorectal cancer.
- colonal tumor mainly means, but is not limited to, adenoma (multiple polyps) or intramucosal cancer (stage 0 colorectal cancer).
- the method for detecting a large intestine tumor of the present invention is characterized by including the following steps (1) to (3).
- step (1) the amount of microorganisms in the feces of the subject is measured.
- Group A As microorganisms, Actinomyces odentricus, Fascolarctobacterium succinattus, Actinomyces viscouses, Desulfovibrio longlichensis (hereinafter, these four types of microorganisms are referred to as "Group A”.
- microorganisms Salobacterium moulay, Porphyromonas wenonis, Corinzela aerofaciens, Desulfobibrio Vietnam Ensis, Peptostreptococcus stromatis, Lactobacillus sanfrancisensis, Parvimonas micra , Gemella morbirorum, Serenomonas sproda (hereinafter, these nine types of microorganisms may be referred to as “group B microorganisms”), Bifidobacterium longum subsp.longum, Yubiology erygens, Laknospira multipara (hereinafter, these nine types of microorganisms may be referred to as “group B microorganisms”). Hereinafter, these three types of microorganisms may be referred to as “Group C microorganisms”).
- step (1) the amount of at least one microorganism selected from the group consisting of the above-mentioned microorganisms is measured, preferably Actinomyces odontricus, Fascolarctobacterium succinatutence, and the like.
- the amount of at least one microorganism selected from the group consisting of Actinomyces viscouses and Desulfovibrio longlichensis is measured, and more preferably, the amount of Actinomyces odanthricus is measured.
- Measurement of the amount of microorganisms can be performed according to known methods, for example, by extracting total DNA from a stool sample, reading their sequences, and based on the sequences and the 16S ribosomal RNA database (eg, SILVA). Can be done.
- 16S ribosomal RNA database eg, SILVA
- step (2) the value measured in step (1) is compared with the corresponding value in the feces of a healthy person.
- the corresponding value in the feces of a healthy person may be determined before measuring the index in the feces of the subject, or may be determined at the same time as the measurement of the index in the feces of the subject.
- step (3) as a result of comparison in step (2), when the value measured in step (1) is higher or lower than the corresponding value in the feces of a healthy person, the subject is determined to have a colorectal tumor.
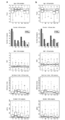
- Group A microorganisms specifically increased in adenomas or intramucosal cancers, and subsequently showed a decreasing tendency (Fig. 2b, Fig. 15). Therefore, when the amount of microorganisms in Group A is measured, the subject is determined to have a large intestine tumor when the measured value is higher than the corresponding value in the feces of a healthy person. In addition, when the amount of microorganisms in Group A is measured, adenoma or intramucosal cancer can be specifically detected among colorectal tumors.
- Group B microorganisms increased in adenomas or intramucosal cancers, and have continued to increase (Fig. 2b). Therefore, when the amount of microorganisms in Group B is measured, the subject is determined to have a large intestine tumor when the measured value is higher than the corresponding value in the feces of a healthy person. In addition, when the amount of group B microorganisms is measured, not only adenomas and intramucosal cancers but also more advanced colorectal cancers (stage I, II, III, IV colorectal cancers) can be detected.
- Group C microorganisms tend to decrease in adenomas (Fig. 2b). Therefore, when the amount of microorganisms in Group C is measured, the subject is determined to have a large intestine tumor when the measured value is lower than the corresponding value in the feces of a healthy person. In addition, when the amount of microorganisms in Group C is measured, adenomas can be specifically detected among colorectal tumors.
- the method for detecting colorectal tumors of the present invention detects colorectal tumors by measuring the amount of microorganisms in the feces of the subject, but in order to improve the detection accuracy, metabolites in the feces of the subject.
- the measurement of the amounts of amino acids, organic acids, and bile acids may be performed in combination.
- the detection of colorectal tumor by the amount of metabolites can be performed in the same manner as the detection of colorectal tumor by the amount of microorganisms described above.
- the amount of metabolite can be measured according to a known method, for example, by using CE-MS or the like.
- amino acids examples include isoleucine, leucine, valine, phenylalanine, tyrosine, glycine, and serine, and at least one selected from the group consisting of these amino acids can be measured.
- organic acid examples include succinic acid, fumaric acid, malic acid, and isovaleric acid, and at least one selected from the group consisting of these organic acids can be measured.
- Succinic acid, fumaric acid, and malic acid are specifically increased in mucosal cancer (Figs. 12 and 17), and isovaleric acid is specifically increased in advanced colorectal cancer (Fig. 2c, Fig. 17).
- the measured value is higher than the corresponding value in the feces of a healthy person, the subject is judged to have a colorectal tumor.
- intramucosal cancer can be specifically detected among colorectal tumors, and when the amount of isovaleric acid is measured, even among colorectal tumors.
- Advanced colorectal cancer can be specifically detected.
- Examples of the bile acid include deoxycholic acid, glycocholic acid, and taurocholic acid, and at least one selected from the group consisting of these bile acids can be measured.
- Deoxycholic acid is specifically increased in adenomas (Fig. 2c, Fig. 18), and glycocholic acid and taurocholic acid are specifically increased in intramucosal cancer (Fig. 2c, Fig. 18).
- the value is higher than the corresponding value in the feces, the subject is judged to have a colorectal tumor.
- adenoma can be specifically detected even in colorectal tumors, and when the amount of glycocholic acid and taurocholic acid is measured, intramucosal cancer is specific among colorectal tumors. Can be detected.
- Colorectal cancer is suffering from the more than 250,000 people worldwide each year 1. Most sporadic CRC develops through the formation of polypoid adenomas, which can be preceded by intramucosal cancer (high-grade dysplastic adenomas), which can progress to malignant form 2 . This process is known as the adenoma-cancer sequence and occurs by a multi-step mechanism with specific mutations 2 . The final malignant tumor because the take tens of years to occur 3, removal by the discovery and the endoscope of early cancer, has become a priority for cancer control.
- the present inventor performed whole-genome shotgun metagenomics and capillary electrophoresis time-of-flight mass analysis (CE-TOFMS) -based metabolomics in feces collected from patients at various stages of neoplastic colons. Evidence of different stage-specific phenotypes of microorganisms and metabolomics was obtained.
- CE-TOFMS capillary electrophoresis time-of-flight mass analysis
- Metabolome data was collected from 616 subjects and metabolome data was collected from 406 subjects (Fig. 5). Based on colonoscopy and histological findings, they were divided into 9 groups. 1) Normal (no prominent colonoscopy), (2) Minority of polyps (up to 2 small polyps of 5 mm or less), (3) Multiple polypoid adenomas with low-grade dysplasia (MP,) 3 or more, most of them 5 or more).
- Intramucosal cancer high-grade dysplastic polypoid adenoma
- stage 0 / pTis CRC S0
- stage I CRC stage I CRC
- stage II CRC stage II CRC
- stage III CRC stage IV CRC based on the 8th Malignant Tumor TNM Classification of the Union for International Cancer Control (UICC).
- UICC International Cancer Control
- MP polypoid adenomas are limited to pathologically proven conventional type colorectal adenomas with low-grade dysplasia (ie, tubular adenomas, follicular adenomas, chorionic adenomas), not serrated adenomas. rice field.
- the subjects in groups (1) and (2) were used as health controls.
- the CRC of stage I and II was analyzed collectively in stage I / II (SI / II), and the CRC of stage III and IV was analyzed collectively in stage III / IV (SIII / IV).
- the clinical features of each group are shown in Figure 6.
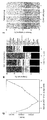
- Figure 1 outlines the taxonomic data obtained from 616 subjects and the metabolome data obtained from 406 subjects.
- Subjects rich in the genus Bacteroides were found to be less in the genus Prevotella.
- the genus Megamonas was frequently detected in 118 (19.2%) of the 616 patients in the entire group, but rarely in the rest of the population, showing a rare distribution within the population. That is.
- the genus Megamonas has not been reported as the predominant genus in gut microbiota studies in Westerners, but has been detected in studies in Chinese, and this genus is characteristic of the Asian population. Possibility suggested 11 .
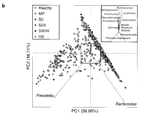
- Principal component analysis identified the two most variable clusters, Bacteroides and Prevotella, in all subjects ( Figure 1b) and 251 healthy controls ( Figure 7b).
- the two clusters is defined as the major components of human intestinal bacteria type 12. Fittings using the Dirichlet multinomial mixture model 13 yielded four community types for all 616 people, one of which was occupied by the genus Prevotella (Fig. 7e).
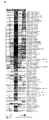
- a total of 65 metabolites showed a significant difference (P ⁇ 0.005) compared to healthy individuals at at least one stage (Fig. 11).
- Bile acids, short-chain fatty acids, amino acids, and central carbon metabolism components were noted because they are closely related to the intestinal flora 16 (Fig. 2c and Fig. 12).
- DCA Deoxycholate
- B. wadsworthia was the only species significantly associated with DCA in MP (Fig. 2d). Correlation coefficients were positive at other stages, but not significant. B. wadsworthia is known to grow in media containing taurocholate 18 , a conjugated form of cholate, a precursor of DCA.
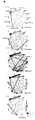
- A. parvulum is significantly increased in MP and S0 and constitutes a network hub of H 2 S-producing bacteria through a high co-occurrence relationship with Streptococcus in patients with inflammatory bowel disease. Therefore, 19 we investigated the correlation between the abundance of this species and other species.
- the number of bacteria correlated with Atopobium increased significantly at S0 at both genus and species levels (Fig. 2e, f).
- A. parvulum and A. odontolyticus, S. anginosus, S. moorei, and G. morbillorum There was a strong correlation between A. parvulum and A. odontolyticus, S. anginosus, S. moorei, and G. morbillorum, and these species increased their relative presence in S0 and beyond. Since Atopobium is increased even in the early stage of CRC, it is possible that it has a strong influence on the H 2 S-producing bacterial group.
- dsrA disimiratry sulfate reductase subunit A
- Random forest and Lasso logistic regression classification were used to identify S0 and SIII / IV cases and healthy controls to investigate the possibility that intestinal metagenomic and metabolome parameters could function as diagnostic markers.
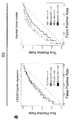
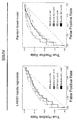
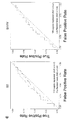
- Four models were constructed based on species-only, KO gene-only, metabolite-only data, or combinations of these three. As a result of comparing the classification ability of the four models, the combined model showed higher performance than the individual models in both S0 and SIII / IV classifications (Fig. 4b, c).
- the area under the ROC curve (AUC) of the random forest classifier was detected at 0.78 and 0.85 for CRC patients with S0 and SIII / IV, respectively.
- the results obtained using the LASSO logistic regression classifier are shown in FIG.
- the high-ranking features were mainly KO genes, such as pheC (encoding cyclohexadienyl dehydratase).
- D. longreachensis, S. moorei, leucine, valine, phenylalanine, succinic acid, etc. were found (Fig. 4b), and these were detected to be distributed differentially (Fig. 2b, c).
- the upper ranks of the SIII / IV classification include oral anaerobes such as P. micra, P. stomatis, F. nucleatum, and P. anaerobius, which have long been identified as CRC marker species. 5,29,30 (Fig. 4b).
- A. parvulum and A. odontolyticus showed a significant increase only in MP or S0.
- network analysis revealed that A. parvulum has a strong correlation with Streptococcus spp., which is known as an H 2 S-producing bacterium 32 .
- A. Odontolyticus often present in the oral cavity and digestive tract of healthy humans, in particular, has been shown to be one of the predominant Actinomyces species form biofilms on the surface of the tooth 33. Previously, although the number of samples is small, it has been reported that there is A. Odontolyticus to adenocarcinoma patients stool sample 34. Further research is needed to clarify the exact mechanism by which these bacteria contribute to tumorigenesis.
- this study includes a large CRC cohort, but a validation cohort is needed in the future.
- Third, in the method of the present invention (fecal sample collected at the time of the first defecation after the start of oral administration of bowel irrigation agent), materials are collected from a subject undergoing colonoscopy at a hospital and stored frozen. However, there are no similar research reports for comparison. In addition, the effect of intestinal lavage on metabolome data in CRC cases has not yet been investigated. Therefore, further research is needed to verify the inventor's sampling protocol.
- the present inventor observed dynamic changes in microbial composition, intestinal flora gene abundance, and metabolites during the multi-step progression of CRC. Although it is not clear whether these species or metabolites directly cause tumorigenesis, structural changes in the gut microbiota can lead to changes in the carcinogenic microenvironment. In addition, the study found that CRC progression may be affected not only by the presence of cancer-related organisms, but also by the metabolic output of the entire microbial community. The present inventor considers CRC to be not only a genetic disease but also a microbial disease.
- Subjects were fed the same commercially available low-residue diet the day before colonoscopy. Data on lifestyle-related habits, including eating habits, were obtained using a detailed questionnaire (475 question items, page 25) with reference to the example used in prospective study 42 based on the Japan Public Health Center.
- Diseases with or suspected hereditary disease eg, familial adenomatous polyposis, hereditary non-polyposis colorectal cancer, high microsatellite instability
- inflammatory bowel disease cases with a history of abdominal surgery, and stool samples Cases with insufficient data collection were excluded from this study.
- the whole genome shotgun sequence sequence library was generated using the Nextera XT DNA Sample Prep Kit (Illumina). The quality of the library was confirmed on the Agilent 4200 Tape Station. Whole-genome shotgun sequencing of fecal samples was performed on the HiSeq2500 platform (Illumina). All samples were paired-end sequenced with a read length of 150 bp and the target data size was 5.0 Gb.
- the primer sequence is "-a CTGTCTTATACATCTGACGCTGCCGACGA -O 32 -q 17"). Reads with quality values of 17 or less in a row were tailcut at the 3'end with the cutadapt program. Next, reads with a length of 50 base pairs or less were discarded. Leads with an average quality of 25 or less were discarded. Next, using Bowtie2 (version 2.2.9), the reads are mapped to the human genome (24 gi number: 568336000-568336023, http://www.ncbi.nlm.nih.gov/nuccore/568336023/, GRCh38). did. The mapped one was judged to be derived from the human genome and was discarded.
- Taxonomic profiling High quality leads are pre-calculated Operational Taxonomic Unit (OTU) data stored in VITCOMIC246 using BLAST + (version2.2.30) 47 (cutoff: E ⁇ 1 x 10 -8). Bacterial and archaeal 16S rRNA sequences were aligned with the set, while tRNA, 23S rRNA, and internal transcription spacer (ITS) sequences were excluded. There are several reference strategies for taxonomic allocation of metagenomic data. The inventor used the All-Species Living Tree Project (LTP) from the SILVA database for two reasons. First, a database of single loci has the advantage of containing more classifications than those that cover multiple loci or the complete genome.
- LTP All-Species Living Tree Project
- the reference genes in this database are composed only of isolated types of strains, they can be cultured under specific conditions and can be relatively easily manipulated in animal experiments.
- Filtered reads are from the SILVA database (version123) 48 using BLASTn (cutoff: E ⁇ 1 ⁇ 10 -8 , sequence identity> 97%, alignment coverage> 80%, bit score> 70) 48,49 . Aligned with LTP. Only top hits were selected. As a result, a total of 8,367 species and 1,941 genera were identified. The relative abundance of a species was calculated for each sample and defined as the number of leads assigned to that species divided by the total number of aligned leads in the sample.
- a lead is aligned to multiple taxonomic sequences in the database and their alignment scores are equal, then these taxonomic sequences should have 1 taxonomic sequence so that the leads can be "shared". Given the value divided by the number of. The relative abundance of a genus was calculated as the sum of all species belonging to that genus.
- seed profile and “genus profile”.
- mOTUs Species-level metagenomic OTUs
- marker genes include those derived from the reference genome and those derived from the metagenomics.
- the inventor used two databases, one with and without OTU from metagenomic data.
- the generated profile contains 651 and 838 species.
- MetaPhlAn2 is based on a species-specific marker gene.
- Gender colonoscopic findings (healthy subjects, MP, S0, SI / II, SIII / IV, HS), tumor site (left large intestine, right large intestine, rectum, double / triple cancer), as well as cancer-free others
- Taxonomic tree was constructed using GraPhlAn (version 0.9.7) 53 . Taxonomic hierarchical information was obtained from the SILVA database. In Figure 2b, seven levels were used: domain, phylum, family, genus, and species. Species were filtered so that those with an average abundance of 10-6 or higher and P ⁇ 0.005 (one-sided Mann-Whitney U test) at any stage were displayed.
- the replication rate was calculated using the Growth Rate Index (GRiD) (version 1.2). This algorithm is based on using a M-estimator with Tukey's weightweight function to estimate the ratio of coverage at the peak (ori) and trough (ter) of the reference bacterial genome.
- the GRiD value shows a positive relationship with the replication rate. 20 of the 22 species shown in Figure 2b (A. odontolyticus, Actinomyces viscosus, A. parvulum, Bifidobacterium longum ssp. Longum, B. wadsworthia, C. aerofaciens, D. longicatena, E. eligens, F. nucleatum ssp.
- nucleatum G. morbillorum, L. multip. Morbillorum, L. multipara, L. sanfranciscensis, P. micra, P. anaerobius, P. stomatis, P. succinatutens, P. uenonis, S. sproda, S. moorei, S. anginosus
- the reference genome was downloaded from the NCBI website, and the reference genome ID and SILVA LTP ID were cross-referenced using the NCBI accession number.
- Genus and Species Network Analysis Spearman's correlation coefficient was calculated using the genus and species relative abundance profiles at each stage (MP, S0, SI / II, SIII / IV).
- the genus correlation network was constructed for species with a correlation coefficient of 0.4 or more or 0.4 or less with the genus Atopobium.
- the network was constructed using yEd Graph Editor (version 3.18.11) (https://www.yworks.com/products/yed).
- each ORF on each scaffold was evaluated and defined as the number of base pairs mapped to the corresponding scaffold region divided by the length of the ORF. If two or more ORFs match one gene, the abundance of each gene was calculated as the average of the score values.
- the total amount of genes is 7,242 KO genes, which is a functional unit defined by KEGG. The profile thus obtained will be referred to as a "KO gene profile".
- 3b and 12b were manually constructed by referring to the literature and modifying the reference map of the KEGG pathway.
- the KO gene with P ⁇ 0.005 was shown at any stage (MP, S0, SI / II, SIII / IV), and the remaining KO genes in the pathway were omitted.
- Genes and KEGG orthology genes are linked by KEGG.
- Organism names are stored in KEGG as a three-letter code.
- A. parvulum by quantitative PCR method The abundance of A. parvulum was verified using quantitative PCR (qPCR) from fecal samples of 73 S0 CRC patients and 73 healthy controls. The number of copies of the target region of the A. parvulum 16S rRNA gene in 1 ⁇ g of the extracted DNA was estimated.
- the PCR product was sequenced using A. parvulum F-primer (5'-TGGATAATACCGAATACTTCGAGACT-3') and A. parvulum R-primer (5'-TGCAGGTACCGTCACTTTCG-3') and Rotor-Gene Q (QIAGEN).
- QPCR was performed using TB Green Premix Ex Taq II (Takara Bio).
- the model was designed with one of three features (species, KO gene, metabolites) alone or in combination.
- a combination model was constructed using the features determined by each model of species, KO gene, and metabolite. Furthermore, features were selected using the recursive feature removal method 60 as above. All analysis was performed using the Python package "scikit-learn". The contribution of features to the model was output as the number of feature imports.
- Figure 4 shows features with non-zero feature imports in at least 50% of the tests.
- features were selected using L1 regularization. The contribution of the feature to the model was calculated using the percent absolute value of the regression coefficient.
- Extended Data Figure 9 shows features with non-zero coefficients in at least 50% of the tests. When the diagnostic potential of known CRC risk factors (age, gender, BMI, smoking, drinking) was evaluated, the prediction accuracy was low (Fig. 13c).
- DRA006684 and DRA008156 Data acquisition method The raw sequence data reported in this paper has been deposited in the DDBJ Sequence Read Archive (DRA) as DRA006684 and DRA008156.
- PC main component.
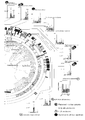
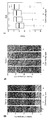
- the innermost circle shows the relative abundance of species averaged across all samples. Species with an average relative amount less than 1 ⁇ 10 -6 were excluded from the phylogenetic tree. Box plots are cancer-related species (green circles), butyric acid producers (yellow circles), hydrogen sulfide producers (pink circles), or four metagenome pipelines reported in other cohorts (see Methods). It shows the relative abundance of species (blue circles) that were newly detected in all of the above and changed significantly (P ⁇ 0.005) compared to healthy controls.
- each box plot The Y-axis of each box plot is the relative abundance.
- Each plot shows the boxes of healthy controls (leftmost bar) and four groups (MP, S0, SI / II, SIII / IV) from left to right.
- MP branched chain fatty acids
- BCAA is a branched chain amino acid
- AAA is an aromatic amino acid.
- KO genes with a prevalence of 5% or more are shown. Significant changes (increase, decrease) are shown as follows. ++, P ⁇ 0.005 increase, ++, P ⁇ 0.01 increase, +, P ⁇ 0.05 increase, ---, P ⁇ 0.005 decrease,-, P ⁇ 0.01 decrease,-, P ⁇ 0.05 Decreased at.
- the representative KO genes shown in b and a are referred to in the KEGG pathway map as "biosynthesis of valine, leucine and isoleucine", “degradation of lysine”, “metabolism of tyrosine”, “metabolism of phenylalanine”, “phenylalanine and tyrosine”.
- Each box in the pathway represents the KO gene, which is shown in red if it rises at any stage and in blue if it falls.
- the bar graph shows the relative gene abundance averaged for each sample in each of the five groups (from left: healthy (H), MP, S0, SI / II, SIII / IV), depending on the order of the values. It is color coded.
- Each KO gene is composed of the genes of an organism represented by a circle. The size and color of the circle is proportional to the relative abundance of the biological gene.
- the genes of an organism are grouped in a row and are indicated by the organism name.
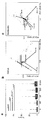
- Figure 4 Microbial dynamics and their diagnostic potential in multi-step CRC progression.
- a Graphical representation of major microbial and metabolome changes in the multi-step progression of CRC.
- S0 classification individual models featured 29 species, 16 KO genes, and 24 metabolites.
- SIII / IV classification individual models featured 55 species, 5 KO genes, and 62 metabolites.
- GABA represents ⁇ -aminobutyric acid
- KO represents the KEGG orthology gene.
- the x-axis shows the contribution of features to the model in each test (see Method). Boxes are 25-75% lines, black lines are median, whiskers extend to maximum and minimum values within 1.5 times the interquartile range, and dots indicate outliers. Boxes are shown in red for S0 or SIII / IV overstatement and light blue for understatement compared to healthy controls, with no significant changes (P ⁇ 0.005; One-sided Mann-Whitney U test) is shown in gray. The performance of the classifier using AUC was evaluated using 10 randomized cross-validations.
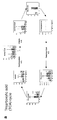
- FIG. 5 Outline of research and pipeline of metagenomic analysis.
- a Outline of research. Whole-genome shotgun sequence data were collected from fecal samples of 616 subjects and functional and taxonomic profiles were created. CE-TOFMS analysis was performed on fecal samples of 406 subjects and a metabolite profile was created. Samples from 347 subjects were available for both sequence analysis and CE-TOFMS data analysis. KO represents the KEGG orthology gene.
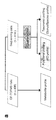
- b Flowchart of the pipeline used for metagenomics analysis. The inventor's metagenomics pipeline consists of three parts: quality control, functional profiling, and taxonomic profiling, and raw leads undergo quality control checks first and then undergo several analytical steps. Finally, it produces functional and taxonomic profiles based on the KEGG orthology gene.
- Figure 6 Subject's clinical information. Distribution of age, gender, BMI, Brinkman index, and alcohol consumption of 616 subjects (a) with metabolome data and 406 subjects (b) with metabolome data.
- the box extends to the 25-75% line, the black line extends to the median, the whisker extends to the maximum and minimum values within 1.5 times the interquartile range, and the points indicate outliers.
- Figure 7 Microbial community structure and human genome content in the fecal metagenomics.
- n 191 for community type 1
- n 172 for community type 2
- n 129 for community type 3
- n 124 for community type 4.
- the box of i is the 25-75% line
- the black line is the median
- the whisker extends to the maximum and minimum values within 1.5 times the interquartile range
- the dots indicate outliers.
- FIG. 8 Distribution of tumor sites and gender in the overall structure of metagenomics and metabolomes.
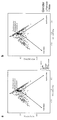
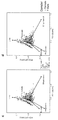
- PCA plot of genus profile (n 616) grouped by a, b, tumor site (a) and gender (b).
- PCA plot of metabolite profile (n 406) grouped by c, d, tumor site (c) and gender (d)
- Figure 9 Comparison of the abundance of A. parvulum in metagenomic analysis and qPCR analysis. Estimated by qPCR (b) using whole-genome shotgun metagenome sequence data (a) and 16S rRNA gene copy count in samples of 73 a, b, S0 CRC patients (green) and 73 healthy controls (red). A. Abundance of parvulum. c, Spearman's correlation coefficient of the abundance of parvulum between the two methods was calculated by P-value calculation using asymptotic approximation. D, qPCR showed that there was a statistically significant difference in the number of A. parvulum genes between healthy controls and S0 CRC patients (one-sided Mann-Whitney U test). Boxes are 25-75% lines, black lines are median, whiskers extend to maximum and minimum values within 1.5 times the interquartile range, and dots indicate outliers.
- FIG. 10 The replication rate was estimated using GRiD.
- the replication rate was plotted for the 20 species shown in Fig. 2.
- the Y-axis (GRiD) is defined as the ratio of coverage at the peak (ori) and trough (ter) of the reference bacterial genome. Samples with sufficient coverage are plotted for mapping to the reference genome (coverage> 0.2). The number of samples depends on the species they depend on and is shown in parentheses.
- the P-value was calculated for each stage (MP, S0, SI / II, SIII / IV) using the one-sided Mann-Whitney U test and compared with healthy controls. Significant increases or decreases are shown as follows.
- Figure 11 Changes in metabolites at the stage of colorectal cancer.
- Significant changes are shown as follows.
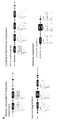
- FIG. 12 Metabolome changes in the tricarboxylic acid (TCA) pathway and metagenomic changes in amino acid metabolism and other typical pathways.
- TCA tricarboxylic acid
- a Quantification levels of metabolites involved in the tricarboxylic acid (TCA) pathway.
- b Metabolism type pathway module omitted from Figure 3b.
- the pathway module is an improved version of the KEGG pathway map "metabolism of alanine, aspartic acid, glutamic acid”, “metabolism of cysteine and methionine", “metabolism of methane” and “metabolism of arginine and proline”.
- Leucine degradation was constructed based on the leucine metabolism of Clostridium difficile because there is no bacterial map in KEGG.
- Each KO gene is composed of the genes of the organism represented by a circle. The size and color of the circle is proportional to the relative abundance of the biological gene. The genes of an organism are grouped in a row and are indicated by the organism name.
- the three most abundant organisms in healthy controls are indicated by a three-letter code (eg, ova for Oscillibacter valericigenes and kpe for Klebsiella pneumoniae 342). Dots in each pathway represent intermediate metabolites.
- the color of the pathway component box was significantly increased (P ⁇ 0.005; one-sided Mann-Whitney U test) at any stage (MP, S0, SI / II, SIII / IV) compared to healthy controls. What was there is shown in red.
- Figure 13 Possibility of metagenomics and metabolomes as diagnostic markers for early (S0) and advanced (SIII / IV) CRC.
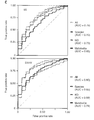
- a ROC curve as a performance evaluation of LASSO logistic regression model and random forest model, samples taken from CRC patients of S0 (left two panels) and SIII / IV (right two panels) of healthy controls. This is to distinguish it from the sample.
- the model was designed based on each of the species (red), KO gene (blue), metabolite (black), or a combination of these three features (green).
- 29 species were used for the species-based model, 16 for the KO gene-based model, and 24 for the metabolite-based model.
- SIII / IV classification 55 species were used for the species-based model, 5 for the KO gene-based model, and 62 for the metabolite-based model.
- species, KO genes, and metabolite characteristics were selected from the individual models. Classification accuracy was assessed by AUC using 10 randomized cross-validation tests.
- the color of the box plot shows a significant increase (red) and decrease (light blue) in each group compared to the healthy control group (P ⁇ 0.005; one-sided Mann-Whitney U test). Dark gray boxes indicate features that are not statistically significant.
- the x-axis shows the contribution of features to the model in each test (see Methods).
- the box is the 25-75% line, the black line is the median, the whisker extends to the maximum and minimum values within 1.5x of the interquartile range, and the points indicate outliers.
- c Analysis of confounding factors that may affect metagenomics and metabolome classification. We analyzed AUC for factors such as age, gender, body mass index, smoking, and alcohol exposure. Smoking and alcohol levels are shown by Brinkman index and alcohol intake, respectively. Patient gender and Brinkman index were significantly different between the groups, but neither the random forest model nor the logistic regression model achieved high accuracy.
- FIG. 14 Correlation between dietary intake and gut microbiota.
- Fusobacterium spp. Akkermansia muciniphila, and sulfide bacteria (B. wadsworthia, Pyramidobacter piscolens), which have been reported to be related to dietary intake, dietary fiber (water-soluble dietary fiber, insoluble dietary fiber, total dietary fiber),
- dietary fiber water-soluble dietary fiber, insoluble dietary fiber, total dietary fiber
- the present invention can be used in the industrial field related to the detection of colorectal tumors.
Landscapes
- Chemical & Material Sciences (AREA)
- Life Sciences & Earth Sciences (AREA)
- Health & Medical Sciences (AREA)
- Organic Chemistry (AREA)
- Engineering & Computer Science (AREA)
- Zoology (AREA)
- Wood Science & Technology (AREA)
- Proteomics, Peptides & Aminoacids (AREA)
- Analytical Chemistry (AREA)
- Toxicology (AREA)
- Immunology (AREA)
- Microbiology (AREA)
- Molecular Biology (AREA)
- Biophysics (AREA)
- Physics & Mathematics (AREA)
- Biotechnology (AREA)
- Biochemistry (AREA)
- Bioinformatics & Cheminformatics (AREA)
- General Engineering & Computer Science (AREA)
- General Health & Medical Sciences (AREA)
- Genetics & Genomics (AREA)
- Measuring Or Testing Involving Enzymes Or Micro-Organisms (AREA)
Abstract
多発ポリープや粘膜内がんと関連する細菌を明らかにし、これらの細菌に基づいた新規な大腸腫瘍の検出手段の確立を目的として、以下の(1)~(3)の工程を含むことを特徴とする大腸腫瘍の検出方法を提供する、 (1)被験者の糞便中におけるアクチノマイセス・オドントリティカス(Actinomyces odontolyticus)などの微生物の量を測定する工程、 (2)工程(1)で測定した値を健常者の糞便中の対応値と比較する工程、 (3)工程(2)の比較の結果、工程(1)で測定した値が健常者の糞便中の対応値よりも高い又は低いときに被験者を大腸腫瘍であると判定する工程。
Description
本発明は、腺腫や粘膜内がんなどの大腸腫瘍の検出方法に関する。大腸がんを進行がんになる前のステージで検出できれば、患者の死亡率を下げることができ、また、内視鏡によるがんの除去が可能になるので、患者の生活の質を向上させることもできる。
大腸がんは胃がんを抜き、日本では一番多いがんである。食事など生活習慣の欧米化がその原因と考えられているが、そのメカニズムは明らかではない。
ヒト一人の細胞数は約37兆個で、ヒト一人あたりの腸内細菌数はおよそ40兆個と言われ、重さにして約1~1.5 kgとされている。これらの腸内細菌叢の乱れが炎症性腸疾患など様々な疾患と関係することが、最近になって分かってきた。2012年に、口腔内で歯周病の原因菌として知られるフソバクテリウム・ヌクレアタム(Fusobacterium nucleatum)が、大腸がんの患者の便中に特徴的に多数存在することが報告され、これまでに検証されている(非特許文献1、非特許文献2)。
Castellarin, M. et al. Fusobacterium nucleatum infection is prevalent in human colorectal carcinoma. Genome Res. 22, 299-306 (2012).
Kostic, A. D. et al. Genomic analysis identifies association of Fusobacterium with colorectal carcinoma. Genome Res. 22, 292-298 (2012).
大腸がんは、多発ポリープ(腺腫)、粘膜内がんを経て進行がんへと進展する。これまで、進行した大腸がんにおいて関連する細菌はいくつか特定されてきたが、進行がんになる前のステージで、多発ポリープや粘膜内がんと関連する細菌や代謝物は知られていなかった。
本発明は、このような背景の下、多発ポリープや粘膜内がんと関連する細菌を明らかにし、これらの細菌に基づいた新規な大腸腫瘍の検出手段を提供することを目的とする。
本発明者は、上記課題を解決するため鋭意検討を重ねた結果、アクチノマイセス・オドントリティカス(Actinomyces odontolyticus)などの細菌が大腸がんの発症初期に関連すること見出し、本発明を完成するに至った。
即ち、本発明は、以下の〔1〕~〔7〕を提供するものである。
〔1〕以下の(1)~(3)の工程を含むことを特徴とする大腸腫瘍の検出方法、
(1)被験者の糞便中における微生物の量を測定する工程であって、微生物がアクチノマイセス・オドントリティカス(Actinomyces odontolyticus)、ファスコラークトバクテリウム・スクシナテュテンス(Phascolarctobacterium succinatutens)、アクチノマイセス・ビスコーズス(Actinomyces viscosus)、デスルホビブリオ・ロングリーチェンシス(Desulfovibrio longreachensis)、サロバクテリウム・ムーレイ(Solobacterium moorei)、ポルフィロモナス・ウエノニス(Porphyromonas uenonis)、コリンゼラ・アエロファシエンス(Colinsella aerofaciens)、デスルホビブリオ・ベトナムエンシス(Desulfovibrio vietnamensis)、ペプトストレプトコッカス・ストマティス(Peptostreptococcus stomatis)、ラクトバチルス・サンフランシセンシス(Lactobacillus sanfranciscensis)、パルビモナス・マイクラ(Parvimonas micra)、ゲメラ・モルビロルム(Gemella morbillorum)、セレノモナス・スプチゲナ(Selenomonas sputigena)、ビフィドバクテリウム・ロンガム(Bifidobacterium longum) subsp.longum、ユウバクテリウム・エリゲンス(Eubacterium eligens)、及びラクノスピラ・マルチパラ(Lachnospira multipara)からなる群から選ばれる少なくとも1種の微生物である工程、
(2)工程(1)で測定した値を健常者の糞便中の対応値と比較する工程、
(3)工程(2)の比較の結果、工程(1)で測定した値がアクチノマイセス・オドントリティカス(Actinomyces odontolyticus)、ファスコラークトバクテリウム・スクシナテュテンス(Phascolarctobacterium succinatutens)、アクチノマイセス・ビスコーズス(Actinomyces viscosus)、デスルホビブリオ・ロングリーチェンシス(Desulfovibrio longreachensis)、サロバクテリウム・ムーレイ(Solobacterium moorei)、ポルフィロモナス・ウエノニス(Porphyromonas uenonis)、コリンゼラ・アエロファシエンス(Colinsella aerofaciens)、デスルホビブリオ・ベトナムエンシス(Desulfovibrio vietnamensis)、ペプトストレプトコッカス・ストマティス(Peptostreptococcus stomatis)、ラクトバチルス・サンフランシセンシス(Lactobacillus sanfranciscensis)、パルビモナス・マイクラ(Parvimonas micra)、ゲメラ・モルビロルム(Gemella morbillorum)、又はセレノモナス・スプチゲナ(Selenomonas sputigena)の量である場合はその値が健常者の糞便中の対応値よりも高いときに被験者を大腸腫瘍であると判定し、工程(1)で測定した値がビフィドバクテリウム・ロンガム(Bifidobacterium longum) subsp.longum、ユウバクテリウム・エリゲンス(Eubacterium eligens)、又はラクノスピラ・マルチパラ(Lachnospira multipara)の量である場合はその値が健常者の糞便中の対応値よりも低いときに被験者を大腸腫瘍であると判定する工程。
〔1〕以下の(1)~(3)の工程を含むことを特徴とする大腸腫瘍の検出方法、
(1)被験者の糞便中における微生物の量を測定する工程であって、微生物がアクチノマイセス・オドントリティカス(Actinomyces odontolyticus)、ファスコラークトバクテリウム・スクシナテュテンス(Phascolarctobacterium succinatutens)、アクチノマイセス・ビスコーズス(Actinomyces viscosus)、デスルホビブリオ・ロングリーチェンシス(Desulfovibrio longreachensis)、サロバクテリウム・ムーレイ(Solobacterium moorei)、ポルフィロモナス・ウエノニス(Porphyromonas uenonis)、コリンゼラ・アエロファシエンス(Colinsella aerofaciens)、デスルホビブリオ・ベトナムエンシス(Desulfovibrio vietnamensis)、ペプトストレプトコッカス・ストマティス(Peptostreptococcus stomatis)、ラクトバチルス・サンフランシセンシス(Lactobacillus sanfranciscensis)、パルビモナス・マイクラ(Parvimonas micra)、ゲメラ・モルビロルム(Gemella morbillorum)、セレノモナス・スプチゲナ(Selenomonas sputigena)、ビフィドバクテリウム・ロンガム(Bifidobacterium longum) subsp.longum、ユウバクテリウム・エリゲンス(Eubacterium eligens)、及びラクノスピラ・マルチパラ(Lachnospira multipara)からなる群から選ばれる少なくとも1種の微生物である工程、
(2)工程(1)で測定した値を健常者の糞便中の対応値と比較する工程、
(3)工程(2)の比較の結果、工程(1)で測定した値がアクチノマイセス・オドントリティカス(Actinomyces odontolyticus)、ファスコラークトバクテリウム・スクシナテュテンス(Phascolarctobacterium succinatutens)、アクチノマイセス・ビスコーズス(Actinomyces viscosus)、デスルホビブリオ・ロングリーチェンシス(Desulfovibrio longreachensis)、サロバクテリウム・ムーレイ(Solobacterium moorei)、ポルフィロモナス・ウエノニス(Porphyromonas uenonis)、コリンゼラ・アエロファシエンス(Colinsella aerofaciens)、デスルホビブリオ・ベトナムエンシス(Desulfovibrio vietnamensis)、ペプトストレプトコッカス・ストマティス(Peptostreptococcus stomatis)、ラクトバチルス・サンフランシセンシス(Lactobacillus sanfranciscensis)、パルビモナス・マイクラ(Parvimonas micra)、ゲメラ・モルビロルム(Gemella morbillorum)、又はセレノモナス・スプチゲナ(Selenomonas sputigena)の量である場合はその値が健常者の糞便中の対応値よりも高いときに被験者を大腸腫瘍であると判定し、工程(1)で測定した値がビフィドバクテリウム・ロンガム(Bifidobacterium longum) subsp.longum、ユウバクテリウム・エリゲンス(Eubacterium eligens)、又はラクノスピラ・マルチパラ(Lachnospira multipara)の量である場合はその値が健常者の糞便中の対応値よりも低いときに被験者を大腸腫瘍であると判定する工程。
〔2〕工程(1)において微生物が、アクチノマイセス・オドントリティカス(Actinomyces odontolyticus)、ファスコラークトバクテリウム・スクシナテュテンス(Phascolarctobacterium succinatutens)、アクチノマイセス・ビスコーズス(Actinomyces viscosus)、及びデスルホビブリオ・ロングリーチェンシス(Desulfovibrio longreachensis)からなる群から選ばれる少なくとも1種の微生物であり、工程(3)において工程(1)で測定した値が健常者の糞便中の対応値よりも高いときに被験者を大腸腫瘍であると判定することを特徴とする〔1〕に記載の大腸腫瘍の検出方法。
〔3〕工程(1)において微生物が、アクチノマイセス・オドントリティカス(Actinomyces odontolyticus)であり、工程(3)において工程(1)で測定した値が健常者の糞便中の対応値よりも高いときに被験者を大腸腫瘍であると判定することを特徴とする〔1〕に記載の大腸腫瘍の検出方法。
〔4〕更に以下の(a-1)~(a-3)の工程を含むことを特徴とする〔1〕乃至〔3〕のいずれかに記載の大腸腫瘍の検出方法、
(a-1)被験者の糞便中におけるアミノ酸の量を測定する工程であって、アミノ酸がイソロイシン、ロイシン、バリン、フェニルアラニン、チロシン、グリシン、及びセリンからなる群から選ばれる少なくとも1種のアミノ酸である工程、
(a-2)工程(a-1)で測定した値を健常者の糞便中の対応値と比較する工程、
(a-3)工程(a-2)の比較の結果、工程(a-1)で測定した値が健常者の糞便中の対応値よりも高いときに被験者を大腸腫瘍であると判定する工程。
(a-1)被験者の糞便中におけるアミノ酸の量を測定する工程であって、アミノ酸がイソロイシン、ロイシン、バリン、フェニルアラニン、チロシン、グリシン、及びセリンからなる群から選ばれる少なくとも1種のアミノ酸である工程、
(a-2)工程(a-1)で測定した値を健常者の糞便中の対応値と比較する工程、
(a-3)工程(a-2)の比較の結果、工程(a-1)で測定した値が健常者の糞便中の対応値よりも高いときに被験者を大腸腫瘍であると判定する工程。
〔5〕更に以下の(b-1)~(b-3)の工程を含むことを特徴とする〔1〕乃至〔3〕のいずれかに記載の大腸腫瘍の検出方法、
(b-1)被験者の糞便中における有機酸の量を測定する工程であって、有機酸がコハク酸、フマル酸、リンゴ酸、及びイソ吉草酸からなる群から選ばれる少なくとも1種の有機酸である工程、
(b-2)工程(b-1)で測定した値を健常者の糞便中の対応値と比較する工程、
(b-3)工程(b-2)の比較の結果、工程(b-1)で測定した値が健常者の糞便中の対応値よりも高いときに被験者を大腸腫瘍であると判定する工程。
(b-1)被験者の糞便中における有機酸の量を測定する工程であって、有機酸がコハク酸、フマル酸、リンゴ酸、及びイソ吉草酸からなる群から選ばれる少なくとも1種の有機酸である工程、
(b-2)工程(b-1)で測定した値を健常者の糞便中の対応値と比較する工程、
(b-3)工程(b-2)の比較の結果、工程(b-1)で測定した値が健常者の糞便中の対応値よりも高いときに被験者を大腸腫瘍であると判定する工程。
〔6〕更に以下の(c-1)~(c-3)の工程を含むことを特徴とする〔1〕乃至〔3〕のいずれかに記載の大腸腫瘍の検出方法、
(c-1)被験者の糞便中における胆汁酸の量を測定する工程であって、胆汁酸がデオキシコール酸、グリココール酸、及びタウロコール酸からなる群から選ばれる少なくとも1種の胆汁酸である工程、
(c-2)工程(c-1)で測定した値を健常者の糞便中の対応値と比較する工程、
(c-3)工程(c-2)の比較の結果、工程(c-1)で測定した値が健常者の糞便中の対応値よりも高いときに被験者を大腸腫瘍であると判定する工程。
(c-1)被験者の糞便中における胆汁酸の量を測定する工程であって、胆汁酸がデオキシコール酸、グリココール酸、及びタウロコール酸からなる群から選ばれる少なくとも1種の胆汁酸である工程、
(c-2)工程(c-1)で測定した値を健常者の糞便中の対応値と比較する工程、
(c-3)工程(c-2)の比較の結果、工程(c-1)で測定した値が健常者の糞便中の対応値よりも高いときに被験者を大腸腫瘍であると判定する工程。
〔7〕大腸腫瘍が、腺腫又は粘膜内がんであることを特徴とする〔1〕乃至〔6〕のいずれかに記載の大腸腫瘍の検出方法。
本明細書は、本願の優先権の基礎である日本国特許出願、特願2020-098956の明細書および/または図面に記載される内容を包含する。
本発明は、大腸腫瘍の新規な検出方法を提供する。この方法により、これまで内視鏡検査でなければ不可能であった腺腫や粘膜内がんなどの大腸腫瘍の発見が、非侵襲的な便検査によって可能となる。
以下、本発明を詳細に説明する。
本発明において「大腸腫瘍」とは、主に腺腫(多発ポリープ)又は粘膜内がん(ステージ0の大腸がん)を意味するが、これらの限定されるわけではない。
本発明において「大腸腫瘍」とは、主に腺腫(多発ポリープ)又は粘膜内がん(ステージ0の大腸がん)を意味するが、これらの限定されるわけではない。
本発明の大腸腫瘍の検出方法は、下記の(1)~(3)の工程を含むことを特徴とするものである。
工程(1)では、被験者の糞便中における微生物の量を測定する。
工程(1)では、被験者の糞便中における微生物の量を測定する。
微生物としては、アクチノマイセス・オドントリティカス、ファスコラークトバクテリウム・スクシナテュテンス、アクチノマイセス・ビスコーズス、デスルホビブリオ・ロングリーチェンシス(以下、これら4種の微生物を「グループAの微生物」という場合がある。)、サロバクテリウム・ムーレイ、ポルフィロモナス・ウエノニス、コリンゼラ・アエロファシエンス、デスルホビブリオ・ベトナムエンシス、ペプトストレプトコッカス・ストマティス、ラクトバチルス・サンフランシセンシス、パルビモナス・マイクラ、ゲメラ・モルビロルム、セレノモナス・スプチゲナ(以下、これら9種の微生物を「グループBの微生物」という場合がある。)、ビフィドバクテリウム・ロンガムsubsp.longum、ユウバクテリウム・エリゲンス、ラクノスピラ・マルチパラ(以下、これら3種の微生物を「グループCの微生物」という場合がある。)を挙げることができる。
工程(1)では、上記の微生物からなる群から選ばれる少なくとも1種の微生物の量を測定するが、好ましくは、アクチノマイセス・オドントリティカス、ファスコラークトバクテリウム・スクシナテュテンス、アクチノマイセス・ビスコーズス、及びデスルホビブリオ・ロングリーチェンシスからなる群から選ばれる少なくとも1種の微生物の量を測定し、より好ましくは、アクチノマイセス・オドントリティカスの量を測定する。
微生物の量の測定は、公知の方法に従って行うことができ、例えば、糞便サンプルから全DNAを抽出し、それらの配列を読み取り、その配列と16SリボソームRNAデータベース(例えば、SILVA)に基づいて行うことができる。
工程(2)では、工程(1)で測定した値を健常者の糞便中の対応値と比較する。健常者の糞便中の対応値は、被験者の糞便中の指標を測定する前に決定しておいてもよく、また、被験者の糞便中の指標の測定と同時に決定してもよい。
工程(3)では、工程(2)の比較の結果、工程(1)で測定した値が健常者の糞便中の対応値よりも高い又は低いときに被験者を大腸腫瘍であると判定する。
グループAの微生物は、腺腫又は粘膜内がんで特異的に増加し、以降減少傾向を示す(図2b、図15)。従って、グループAの微生物の量を測定した場合、その測定値が健常者の糞便中の対応値よりも高いときに被験者を大腸腫瘍であると判定する。また、グループAの微生物の量を測定した場合、大腸腫瘍の中でも腺腫又は粘膜内がんを特異的に検出することができる。
グループBの微生物は、腺腫又は粘膜内がんで増加し、以降も増加傾向を示す(図2b)。従って、グループBの微生物の量を測定した場合、その測定値が健常者の糞便中の対応値よりも高いときに被験者を大腸腫瘍であると判定する。また、グループBの微生物の量を測定した場合、腺腫や粘膜内がんだけでなく、より進行した大腸がん(ステージI、II、III、IVの大腸がん)も検出することができる。
グループCの微生物は、腺腫で減少する傾向を示す(図2b)。従って、グループCの微生物の量を測定した場合、その測定値が健常者の糞便中の対応値よりも低いときに被験者を大腸腫瘍であると判定する。また、グループCの微生物の量を測定した場合、大腸腫瘍の中でも腺腫を特異的に検出することができる。
本発明の大腸腫瘍の検出方法は、上記のように、被験者の糞便中における微生物の量を測定することによって大腸腫瘍を検出するが、より検出精度を高くするため、被験者の糞便中における代謝物、例えば、アミノ酸、有機酸、胆汁酸の量を測定することを組み合わせて行ってもよい。
代謝物の量による大腸腫瘍の検出は、上述した微生物の量による大腸腫瘍の検出と同様に行うことができる。代謝物の量の測定は、公知の方法に従って行うことができ、例えば、CE-MSなどを用いて行うことができる。
アミノ酸としては、イソロイシン、ロイシン、バリン、フェニルアラニン、チロシン、グリシン、セリンを挙げることができ、これらのアミノ酸からなる群から選ばれる少なくとも1種を測定対象とすることができる。
これらのアミノ酸は、粘膜内がんで特異的に増加するので(図2c、図16)、その測定値が健常者の糞便中の対応値よりも高いときに被験者を大腸腫瘍であると判定する。また、これらのアミノ酸の量を測定した場合、大腸腫瘍の中でも粘膜内がんを特異的に検出することができる。
有機酸としては、コハク酸、フマル酸、リンゴ酸、イソ吉草酸を挙げることができ、これらの有機酸からなる群から選ばれる少なくとも1種を測定対象とすることができる。
コハク酸、フマル酸、及びリンゴ酸は粘膜内がんで特異的に増加し(図12、図17)、イソ吉草酸は進行大腸がんで特異的に増加するので(図2c、図17)、その測定値が健常者の糞便中の対応値よりも高いときに被験者を大腸腫瘍であると判定する。また、コハク酸、フマル酸、及びリンゴ酸の量を測定した場合、大腸腫瘍の中でも粘膜内がんを特異的に検出することができ、イソ吉草酸の量を測定した場合、大腸腫瘍の中でも進行大腸がんを特異的に検出することができる。
胆汁酸としては、デオキシコール酸、グリココール酸、タウロコール酸を挙げることができ、これらの胆汁酸からなる群から選ばれる少なくとも1種を測定対象とすることができる。
デオキシコール酸は腺腫で特異的に増加し(図2c、図18)、グリココール酸及びタウロコール酸は粘膜内がんで特異的に増加するので(図2c、図18)、その測定値が健常者の糞便中の対応値よりも高いときに被験者を大腸腫瘍であると判定する。また、デオキシコール酸の量を測定した場合、大腸腫瘍の中でも腺腫を特異的に検出することができ、グリココール酸及びタウロコール酸の量を測定した場合、大腸腫瘍の中でも粘膜内がんを特異的に検出することができる。
以下に、実施例により本発明を更に詳細に説明するが、本発明はこの実施例に限定されるものではない。
大腸がん(CRC)は、世界中で毎年25万人以上の人が罹患している1。ほとんどの散発性CRCは、ポリープ状腺腫の形成を経て発症し、その前に粘膜内がん(高悪性度異形成腺腫)が発生し、これが悪性型に進行することがある2。この過程は、腺腫-がんという一連の流れとして知られており、特異的な変異を伴う多段階のメカニズムで発生する2。最終的な悪性腫瘍が発生するまでには数十年かかるため3、早期がんの発見と内視鏡による除去は、がん対策の優先事項となっている。
腸内生態系の変化は、CRCをはじめとする人間の健康や病気の変化に関与していると言われている4。糞便メタゲノミクスは、腸内マイクロバイオームを定量化するための有用なツールであり、診断の可能性も秘めている5。特に、F. nucleatumはCRCとの関連が指摘されており6,7、そのメカニズムはマウスで解明されつつある8。また、アミノ酸や細菌の代謝物(例えば、胆汁酸や短鎖脂肪酸など)を含む腸内代謝物も、腸内のがん状態と関連していると言われている9,10。したがって、包括的なメタゲノム及びメタボローム解析は、腸内環境の変化に関連したCRCの発症を理解するための別のアプローチになるかもしれない。
本発明者は、大腸新生物の様々なステージの患者から採取した糞便を対象に、全ゲノムショットガンメタゲノミクスとキャピラリー電気泳動飛行時間型質量分析(CE-TOFMS)ベースのメタボロミクスを実施し、糞便中の微生物と代謝物の異なるステージ固有の表現型の証拠を得た。
メタゲノムデータは616人、メタボロームデータは406人の被験者から収集した(図5)。大腸内視鏡及び組織学的所見に基づき、9つのグループに分類した。1)正常(顕著な大腸内視鏡所見なし)、(2)少数のポリープ(5mm以下の小さなポリープが2個まで)、(3)低悪性度異形成を伴う多発性ポリープ状腺腫(MP、3個以上、ほとんどが5個以上)。4)粘膜内がん(高悪性度異形成のポリープ状腺腫)、ステージ0/pTisのCRC(S0)、(5)ステージIのCRC、(6)ステージIIのCRC、(7)ステージIIIのCRC、(8)国際癌制御連合(UICC)の第8回悪性腫瘍TNM分類に基づくステージIVのCRC。残りのグループは、(9)大腸手術歴のある正常者(HS)であった。MPのポリープ状腺腫は、低悪性度異形成を伴う病理学的に証明されたコンベンショナルタイプの大腸腺腫(すなわち、管状腺腫、管胞状腺腫、絨毛状腺腫)に限定し、鋸歯状腺腫は含まなかった。グループ(1)及び(2)の被験者を健康対照とした。ステージI及びIIのCRCをステージI/II(SI/II)に、ステージIII及びIVのCRCをステージIII/IV(SIII/IV)にまとめて解析した。各グループの臨床的特徴を図6に示す。喫煙歴(Brinkman index)は群間で異なり、ステージが進行した患者は早期の患者に比べてBrinkman indexが低い(つまり喫煙量が少ない)傾向にあり、HSの患者はさらに低い値を示した。ステージI~IIIのCRC患者28人から、術前と術後の両方でメタゲノムデータを得た。
616名の被験者から得た分類学的データと、406名の被験者から得たメタボロームデータの概要を図1に示す。Bacteroides属に富む被験者は、Prevotella属が少ないことがわかった。注目すべきは、Megamonas属が、全グループの616名の患者のうち118名(19.2%)で高頻度に検出されたが、残りの患者ではほとんど検出されず、集団内での珍しい分布を示したことである。Megamonas属は、欧米人を対象とした腸内細菌叢研究では優勢な属として報告されていないが、中国人を対象とした研究では検出されており、この属がアジア人集団に特徴的である可能性が示唆された11。 ヒトゲノムの含有量は、CRCの各ステージ(S0, P = 0.00175; SI/II, P = 8.19 × 10⁻⁵; SIII/IV, P = 1.05 × 10⁻⁵; 片側Mann-Whitney U検定)において、健常対照者よりも有意に高かった(図7)。主成分分析(PCA)の結果、すべての被験者(図1b)と251人の健常対照者(図7b)において、最も変化の大きい2つのクラスター、BacteroidesとPrevotellaが同定された。この2つのクラスターは、ヒト腸内細菌型の主要な構成要素と定義されている12。Dirichlet多項混合モデル13を用いてフィッティングを行ったところ、616人全員で4つのコミュニティタイプが得られ、そのうちの1つがPrevotella属で占められていた(図7e)。既知の危険因子(肥満度(P=0.8773)、飲酒度(P=0.2989)、喫煙歴(P=0.3151))に関しては、4つのコミュニティタイプの間に有意な差(P<0.005)は認められなかった。また、大腸内視鏡所見(健常、MP、S0、SI/II、SIII/IV、P = 0.2864)や腫瘍部位(左結腸、右結腸、直腸、P = 0.5231)は、いずれのコミュニティタイプとも関連していなかった。年齢では、男性(79.1%)にPrevotellaクラスターが多く見られた(P = 7.80 × 10⁻¹⁰)。
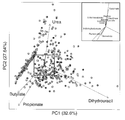
大腸の主要なエネルギー源であるプロピオン酸と酪酸14が、最も豊富な2つの代謝物としてランクインした。PCAでは、プロピオン酸と酪酸に加えて、ジヒドロウラシルと尿素にも大きなばらつきが見られた(図1b)。PCAでは、ステージ、腫瘍部位、性別のいずれも、代謝物プロファイルの変動と関連していなかった(図8)。
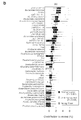
健常対照者と比較して、MPとS0に加えて、SI/IIとSIII/IVでもマイクロバイオームのシフトが見られ、ステージ間で非常に異なることがわかった。S0、SI/II、SIII/IVのサンプルでは、Firmicutes、Fusobacteria、Bacteroidetesの各系統に属する多数の種が優位に上昇しており、悪性度が高くなるにつれて増加していた。Fusobacteriaの上昇種は少なくとも2つのステージで見られたが、FirmicutesとBacteroidetesの上昇種の多くはステージに特異的であった。プロテオバクテリア門では、多くの種がMPでのみ上昇していた(図2a)。Bifidobacterium属は、主にS0で減少した。有意(P < 0.005)な種の増加には2つのパターンがあり、1つ目は初期から後期にかけて増加し、2つ目は初期にのみ増加したものであった。前者はF. nucleatum(例えば、F. nucleatum ssp. nucleatum(S0, P = 7.64 × 10⁻⁵, q = 0.0492; SI/II, P = 1.47 × 10⁻⁸, q = 5.63 × 10⁻⁵; SIII/IV, P = 6.93 × 10⁻¹¹, q = 2.62 × 10⁻⁷))、Solobacterium moorei(S0, P = 1. 18 × 10-5, q = 0.0381; SI/II, P = 0.000601, q = 0.1355; SIII/IV, P = 5.91 × 10⁻⁵, q = 0.0195), Peptostreptococcus stomatis(SI/II, P = 4.62 × 10⁻⁶, q = 3.22 × 10⁻³; SIII/IV, P = 1.98 × 10⁻¹⁰, q = 3. 75 × 10-7)、Peptostreptococcus anaerobius(SI/II, P = 7.57 × 10⁻⁵, q = 2.90 × 10⁻³; SIII/IV, P = 1.83 × 10⁻¹⁰, q = 3. 75 × 10-7)、Lactobacillus sanfranciscensis(S0, P = 0.000616, q = 0.118; SIII/IV, P = 0.00328, q = 0.101)、Parvimonas micra(SI/II, P = 1. 89 × 10-5, q = 1.04 × 10⁻³; SIII/IV, P = 6.15 × 10⁻¹³, q = 4.66 × 10⁻⁹)、Gemella morbillorum(S0, P = 0.000257, q = 0.0800; SI/II, P = 5.62 × 10⁻⁷, q = 6.15 × 10⁻⁴; SIII/IV, P = 1.79 × 10⁻⁹, q = 2.11 × 10⁻⁶)の順であった。後者のパターンの特徴は、Atopobium parvulum(MP, P = 0.00338, q = 0.153; S0, P = 7.03 × 10⁻⁵, q = 0.0492)、Actinomyces odontolyticus(S0, P = 0. 000164, q = 0.0636), Desulfovibrio longreachensis (S0, P = 0.00164, q = 0.188), Phascolarctobacterium succinatutens (S0, P = 0.00236, q = 0.242)であった。また、A. parvulumの存在は、定量的PCRにより検証された(図9)。
さらに、CRCと新たに関連する種を同定した。そのうち、Colinsella aerofaciens(P = 0.000840、q = 0.0544)、Dorea longicatena(P = 0.000925、q = 0.0557)、Porphyromonas uenonis(P = 0.000439、q = 0. 0475)、Selenomonas sputigena(P = 0.00369、q = 0.101)、Streptococcus anginosus(P = 0.00177、q = 0.0788)が、使用した4つの解析パイプラインすべてにおいて、SIII/IVで有意に上昇していた(「方法」参照)。以前の研究5と同様に、酪酸生産菌であるLachnospira multipara(S0, P = 0.000596, q = 0.585; SI/II, P = 0.000801, q = 0.725; SIII/IV, P = 0.000116, q = 0.877)とEubacterium eligens(S0, P = 0.00147, q = 0.698)は、CRCのステージで有意に減少していた。また、Desulfovibrio vietnamensis(SIII/IV, P = 0.00109, q = 0.0565)、D. longreachensis(S0, P = 0.00164, q = 0.188)、Bilophila wadsworthia(SIII/IV, P = 0.00408, q = 0.101)などの硫化物産生菌は上昇していた。
細菌の複製率15は、G. morbillorum(SI/II, P = 0.000436; SIII/IV, P = 5.09 × 10⁻⁷)、P. micra(SI/II, P = 0.000114; SIII/IV, P = 2.00 × 10⁻⁶)、P. stomatis(SI/II, P = 0.00424; SIII/IV, P = 8.07 × 10⁻⁶)では各ステージで有意に高く、F. nucleatum ssp. nucleatum(P = 0.000386)とD. longicatena(P = 0.000246)は、健康なコントロールと比較して、SIII/IVで有意に高かった(図10)。複製率が高いことで種の存在量が多いことが説明でき、これらの細菌が代謝的に活性化している可能性が示唆された。特に、S. moorei(MP、P = 0.000299)とC. aerofaciens(S0、P = 0.000215)は、それぞれMPとS0で有意に高い複製率を示し、その後のステージで相対的な存在感が高まった。以上の結果から、CRCの早期進行には、多くの微生物種の変化が関与している可能性が示唆された。
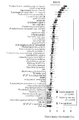
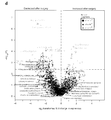
合計65種類の代謝物が、少なくとも1つのステージにおいて、健常者と比較して有意な差(P < 0.005)を示した(図11)。胆汁酸、短鎖脂肪酸、アミノ酸、中心的な炭素代謝の要素は、腸内細菌叢と密接な関係があることから、注目された16(図2c及び図12)。
健常者と比較して、MPのデオキシコレート(DCA)濃度(P = 0.000118, q = 0.0503)、S0のグリココレート(P = 0.00100, q = 0.0508)及びタウロコレート(P = 0.00195, q = 0.0655)の濃度が有意に増加していることがわかった。さらに、分岐鎖アミノ酸の濃度(イソロイシン(S0、P=0.00124、q=0.0508)、ロイシン(S0、P=0.000371、q=0.0507;SIII/IV、P=0.00314、q=0.0931)、バリン(S0、P=0.000483、0. 0508))をはじめ、フェニルアラニン(S0, P = 0.000697, q = 0.0508)、チロシン(S0, P = 0.00136, q = 0.0508)、グリシン(S0, P = 0.00497, q = 0.120)、セリン(SIII/IV, P = 0.00178, q = 0.0900)の濃度が上昇した。ロイシンからバクテリアの発酵によって生成される分岐鎖脂肪酸であるイソベラート17は、S0からSIII/IV(SIII/IV, P = 0.00188, q = 0.0900)まで徐々に増加した。
MPではDCAが上昇していたため、この代謝物と相関があると思われる種を探した。B. wadsworthiaは、MPにおけるDCAと有意に関連する唯一の種であった(図2d)。他のステージでも相関係数は正であったが、有意ではなかった。B. wadsworthiaは、DCAの前駆体であるコラートの共役型であるタウロコラート18を含む培地で生育することが知られている。
A. parvulumがMP及びS0で有意に増加しており、炎症性腸疾患患者においてStreptococcusとの高い共起関係を介してH2S産生菌のネットワークハブを構成していることが報告されていることから19、本種と他の種との存在量の相関を調べた。Atopobiumと相関のある細菌の数は、属・種レベルともにS0で顕著に増加した(図2e,f)。A. parvulumとA. odontolyticus、S. anginosus、S. moorei、G. morbillorumとの間には強い相関関係があり、これらの種はS0及びそれ以降の段階で相対的な存在感が高まった。CRCの初期段階でもAtopobiumが増加していることから、H2S産生菌群に強い影響を与えている可能性が考えられる。
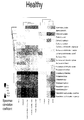
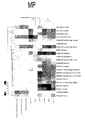
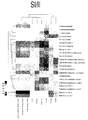
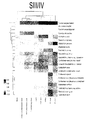
合計1,243個のKyoto Encyclopedia of Genes and Genomes(KEGG)オルソロジー遺伝子(KO遺伝子)が、健常対照者と比較して、少なくとも1つのステージで有意(P < 0.005)に上昇し、96個の有意に減少した。糞便中のアミノ酸濃度がS0から著しく変化していたため(図2c)、アミノ酸代謝における微生物の役割を確認するため、微生物の遺伝子量を調べた(図3a)。
遺伝子量の変化は、パスウェイ表現で示されている(図3b及び図12b)。細菌の生合成と分解の限界を示すパスウェイモジュールは、「多様な環境における微生物の代謝」(map01120)や文献20-23を参照したKEGGパスウェイマップを修正して手動で構築した。
最も発現量に差があったパスウェイのうち、芳香族アミノ酸代謝と硫化物生成パスウェイがCRCと関連していることがわかった。フェニルアラニンやチロシンの生合成に関わる遺伝子が有意に上昇しており、中でもpheC(P = 1.94 × 10⁻⁵, q = 0.0297 in S0)は、S0症例と健常対照者を区別するトップスコアのマーカーとして同定された(図4b及び図13)。異化作用の経路では、毒性のあるフェニルアセテート24-26の産生によるフェニルアラニンの分解に関与する遺伝子が、主にMPで上昇していた。トリプトファンの生合成に関与する遺伝子は、SIII/IVで有意(P < 0.005)に減少した。遺伝毒性のある硫化水素27の生成に関与するジシミラトリー硫酸還元酵素サブユニットA(dsrA)は、SIII/IVで有意に上昇した(P = 0.00499, q = 0.0729)(図3b)。dsrAは、Desulfovibrio spp.28を含む多くの硫酸還元菌で活性があることがわかっており、例えばDesulfovibrio piger(P = 0.0178, q = 0.226)では、SIII/IVで実質的に高い値を示していた。
S0病変のほとんどは内視鏡的アプローチで治癒可能であり、発見の機会も広い3。腸内のメタゲノムやメタボロームのパラメータが診断マーカーとして機能する可能性を検討するため、ランダムフォレスト及びLASSOロジスティック回帰分類法を用いて、S0及びSIII/IVの症例と健常対照者を識別した。種のみ、KO遺伝子のみ、代謝物のみのデータ、又はこれら3つの組み合わせに基づいて、4種類のモデルを構築した。4つのモデルの分類能力を比較した結果、S0とSIII/IVの両方の分類において、個々のモデルよりも組み合わせモデルの方が高い性能を示した(図4b,c)。ランダムフォレスト分類器のROC曲線下面積(AUC)は、S0とSIII/IVのCRC患者をそれぞれ0.78と0.85で検出した。LASSOロジスティック回帰分類器を用いて得られた結果を、図13に示す。
S0分類では、高順位のフィーチャーは、pheC(シクロヘキサジエニルデヒドラターゼをコードする)など、主にKO遺伝子であった。その他、D. longreachensis、S. moorei、ロイシン、バリン、フェニルアラニン、コハク酸などがあり(図4b)、これらは差次的に分布していることが検出された(図2b,c)。SIII/IV分類の上位には、P. micra、P. stomatis、F. nucleatum、P. anaerobiusなどの口腔内嫌気性菌が含まれており、これらは以前からCRCのマーカー種として同定されていた5,29,30(図4b)。
CRC患者28名(SI/II及びSIII/IV)の外科的治療前と治療後約1年間のメタゲノムデータを取得した。図2bで述べた22種のうち、P. stomatis、P. anaerobius、P. micra、P. uenonis、D. longicatenaの相対存在量は、腫瘍摘出後に減少した(図4d,e)。これらの5種をHS被験者の糞便サンプルと比較しても、有意な差は見られなかった(図4f)。本研究で得られた主な結果を図4aに示す。
腸内生態系と多段階の腫瘍形成との関係についての本研究では、CRCにおける微生物及び微生物由来の代謝物プロファイルに関する情報が得られた。その結果、より進行したステージに加えて、MP及びS0における微生物及びメタボロームのシフトが起こったことが明らかになった。このシフトはステージ間で非常に異なっていた。種の上昇には2つのパターンが見られ、1つは初期段階から継続的に上昇するもので、もう1つは初期段階でのみ上昇するものであった。後者のパターンは、腸内細菌叢の状態の変化がCRC発症の素因となる可能性があることから、今回の研究では主に後者のパターンに注目した。特にS0では、F. nucleatumとS. mooreiの存在量が増加しており、これらの種は、進行したCRCとの関連が知られているだけでなく、腫瘍形成の初期過程にも寄与している可能性がある5,31。
特に、A. parvulumとA. odontolyticusは、MP又はS0においてのみ有意な増加を示した。また、A. parvulumはH2S産生菌として知られるStreptococcus spp.と強い相関関係があることがネットワーク解析で明らかになった32。A. parvulumは、炎症性腸疾患の患者において、Streptococcusとの高い共起関係を通じて、H2S産生菌のネットワークハブを構成していることが示されている19。A. odontolyticusは、健康なヒトの口腔内や消化管にしばしば存在し、特に、歯の表面にバイオフィルムを形成する優勢なActinomyces種の一つであることが示されている33。以前、サンプル数は少ないものの、腺がん患者の糞便サンプルにA. odontolyticusが存在することが報告されている34。これらの細菌が腫瘍形成に寄与する正確なメカニズムを明らかにするためには、さらなる研究が必要である。
MP患者では、DCAの濃度が有意に上昇していた。DCAは、DNA損傷や突然変異の増加につながることが知られている35。動物実験では、胆汁酸を投与すると、腸内での腫瘍の発生率が高くなった36。B. wadsworthiaは、胆汁によって成長が促進される18が、本研究では唯一DCAと有意な相関関係を示した(図2d) また、共役胆汁酸(taurocholate及びglycocholate)の濃度もS0で上昇していた。アンケート調査の結果、S0ではB. wadsworthiaが食事のタンパク質(P = 0.00278)及び肉(P = 0.00248)の摂取量と正の相関があることがわかった(図14)。Desulfovibrio属の近縁種であるB. wadsworthiaは、炎症を引き起こすことが知られているが、発がんとの関連性については集中的に研究されていないが29、しばしばdysbiosisの文脈で議論されている9,18。これらの微生物は、腸内生態系の正常な一部であるが、大腸内でこの細菌とその代謝物が過剰に存在すると、炎症やDNAの損傷を引き起こす可能性がある。
今回の研究では、以下のような限界を考慮する必要がある。第一に、本研究には大規模なCRCコホートが含まれているが、今後、検証コホートが必要である。第二に、本研究では糞便サンプル中の総細胞数を決定していない。最近の報告では、微生物負荷がいくつかの疾患で観察される微生物叢の変化の重要な要因であることが示されている37。最近の報告では、微生物負荷がいくつかの疾患で観察される微生物叢の変化の重要な要因であることが示されている37。相対的な量よりも絶対的な量の方が、多段階のCRC発がんのより良い指標となるかもしれない。第三に、本発明者の方法(腸管洗浄剤の経口投与開始後の最初の排便時に採取した糞便サンプル)は、病院で大腸内視鏡検査を受ける被験者から材料を採取して冷凍保存するのに適していると思われるが、比較のための同様の研究報告がない。また、腸管洗浄がCRC症例のメタボロームデータに与える影響については、まだ検討されていない。したがって、本発明者のサンプリングプロトコルを検証するためには、さらなる研究が必要である。
今回の研究では、腺腫が形成される前の段階での微生物の関与の可能性や、マイクロバイオームやメタボロームと腫瘍とのより詳細な因果関係を明らかにすることはできなかった。そこで本発明者は、大腸内視鏡検査を受けた人から定期的に糞便や組織生検を採取し、縦断的にマイクロバイオーム解析を行うことを検討している。また、CRCの発がんにおけるマイクロバイオームの役割を理解するためには、個々のCRC患者における腸内マイクロバイオームと腫瘍の分子特性との関係を明らかにすることが必要である。本研究では、遺伝性疾患又は遺伝性疾患が疑われる症例は除外した。腺腫は、鋸歯状病変を含まない従来型の大腸腺腫に限定した。近年、これらの後者には組織内細菌が関与している可能性が報告されている38-40。遺伝性疾患やその疑いのある患者、鋸歯状病変のある患者の糞便や組織から得られるメタゲノムやメタボロームのデータは、CRCの腫瘍形成の他の側面を明らかにするかもしれない。
結論として、本発明者は、CRCの多段階の進行過程において、微生物の組成、腸内細菌叢の遺伝子量、代謝物の動的な変化を観察した。これらの種や代謝物が直接、腫瘍形成を引き起こすかどうかは明らかではないが、腸内細菌叢の構造的変化は、発がん性微小環境の変化につながる可能性がある。さらに、今回の研究では、CRCの進行は、がん関連生物の存在だけでなく、微生物群全体の代謝出力にも影響を受ける可能性があることが明らかになった。本発明者は、CRCは基本的に遺伝的疾患であるだけでなく、微生物的疾患でもあると考えている。
オンラインコンテンツ:すべての方法、追加の参考文献、Nature Researchの報告概要、ソースデータ、コードとデータの利用可能性に関する陳述、関連するアクセッションコードは、https://doi.org/10.1038/ s41591-019-0458-7で利用可能である。
〔方法〕
研究対象者及びサンプル収集
本研究は、国立がん研究センター中央病院(東京)で全大腸内視鏡検査を受けた被験者を対象とした。本研究で使用したサンプル及び臨床情報は、インフォームドコンセントのもと、各参加機関の機関審査委員会の承認を得て入手した(国立がん研究センター:2013-244、東京工業大学:2014018)。便サンプルは、病院で腸管洗浄剤の経口投与を開始した後、最初の排便時に直ちに採取し、ドライアイスで凍結保存した。本発明者は以前、この種のサンプルと、大腸内視鏡検査の1日前に採取した凍結便例(標準サンプル)41との間で、分類学的プロファイルの高いペアワイズピアソン相関係数と、20の優占属の分類学的存在量に有意差がないことを実証した。被験者には、大腸内視鏡検査の前日に、同じ市販の低残渣食を与えた。食生活を含む生活習慣に関するデータは、日本公衆衛生センターに基づく前向き研究42で用いられた例を参考に、詳細な質問票(475の質問項目、25ページ)を用いて得た。遺伝性疾患又は遺伝性疾患が疑われる疾患(例えば、家族性腺腫性ポリポーシス、遺伝性非ポリポーシス大腸がん、マイクロサテライト不安定性高)、炎症性腸疾患、腹部手術歴を有する症例、及び便サンプルがデータ収集に不十分な症例は、本研究から除外した。体格指数(BMI)、アルコール摂取量(1日あたりのグラム数)、喫煙習慣(Brinkman index)のグループ間(健常者、MP、S0、SI/II、SIII/IV、HS)の分布を、Kruskal-Wallisの順位和検定を用いて分析した。性別のグループ間分布は、ピアソンのχ2検定(d.f.=5)を用いて分析した。
研究対象者及びサンプル収集
本研究は、国立がん研究センター中央病院(東京)で全大腸内視鏡検査を受けた被験者を対象とした。本研究で使用したサンプル及び臨床情報は、インフォームドコンセントのもと、各参加機関の機関審査委員会の承認を得て入手した(国立がん研究センター:2013-244、東京工業大学:2014018)。便サンプルは、病院で腸管洗浄剤の経口投与を開始した後、最初の排便時に直ちに採取し、ドライアイスで凍結保存した。本発明者は以前、この種のサンプルと、大腸内視鏡検査の1日前に採取した凍結便例(標準サンプル)41との間で、分類学的プロファイルの高いペアワイズピアソン相関係数と、20の優占属の分類学的存在量に有意差がないことを実証した。被験者には、大腸内視鏡検査の前日に、同じ市販の低残渣食を与えた。食生活を含む生活習慣に関するデータは、日本公衆衛生センターに基づく前向き研究42で用いられた例を参考に、詳細な質問票(475の質問項目、25ページ)を用いて得た。遺伝性疾患又は遺伝性疾患が疑われる疾患(例えば、家族性腺腫性ポリポーシス、遺伝性非ポリポーシス大腸がん、マイクロサテライト不安定性高)、炎症性腸疾患、腹部手術歴を有する症例、及び便サンプルがデータ収集に不十分な症例は、本研究から除外した。体格指数(BMI)、アルコール摂取量(1日あたりのグラム数)、喫煙習慣(Brinkman index)のグループ間(健常者、MP、S0、SI/II、SIII/IV、HS)の分布を、Kruskal-Wallisの順位和検定を用いて分析した。性別のグループ間分布は、ピアソンのχ2検定(d.f.=5)を用いて分析した。
DNA抽出
凍結した糞便サンプルから、GNOME DNA Isolation Kit (MP Biomedicals)を用いて、以前記述43したようにビーズビート法でDNAを抽出した。DNAの品質はAgilent 4200 TapeStation (Agilent Technologies)で評価した。最終的に沈殿させた後、DNAサンプルをTEバッファーに再懸濁し、さらに分析する前に-80℃で保存した。
凍結した糞便サンプルから、GNOME DNA Isolation Kit (MP Biomedicals)を用いて、以前記述43したようにビーズビート法でDNAを抽出した。DNAの品質はAgilent 4200 TapeStation (Agilent Technologies)で評価した。最終的に沈殿させた後、DNAサンプルをTEバッファーに再懸濁し、さらに分析する前に-80℃で保存した。
全ゲノムショットガンシーケンス
シークエンスライブラリは、Nextera XT DNA Sample Prep Kit(Illumina)を用いて生成した。ライブラリの品質はAgilent 4200 TapeStationで確認した。糞便サンプルの全ゲノムショットガンシーケンスは、HiSeq2500プラットフォーム(Illumina)で実施した。すべてのサンプルは150bpのリード長でペアエンドシーケンスされ、目標データサイズは5.0Gbだった。
シークエンスライブラリは、Nextera XT DNA Sample Prep Kit(Illumina)を用いて生成した。ライブラリの品質はAgilent 4200 TapeStationで確認した。糞便サンプルの全ゲノムショットガンシーケンスは、HiSeq2500プラットフォーム(Illumina)で実施した。すべてのサンプルは150bpのリード長でペアエンドシーケンスされ、目標データサイズは5.0Gbだった。
品質管理
4,772,084,552,120(平均7,410,069,180)塩基対をカバーする合計31,797,649,036(平均49,375,231)個のペアエンドリードについて、以下のように品質管理を行った。「N」(base pair not identified)の文字を含むローリードは廃棄した。バクテリオファージphiXのDNA配列を含むリードは、Bowtie 2(version2.2.9)44を用いて、プリセットのオプションを「-fast-local」にして、リードに対してマッピングすることで同定し、破棄した。cutadapt (version 1.9.1)45 を用いて、アダプター配列とプライマー配列のためにリードをトリミングし、以下のオプションを使用した(フォワードプライマー配列には「-a CTGTCTTATACATCTCCGAGCCCACGAGAC -O 33 -q 17」、リバースプライマー配列には「-a CTGTCTTATACATCTGACGCTGCCGACGA -O 32 -q 17」)。連続して17以下の品質値を含むリードは、cutadaptプログラムで3’末端でテールカットされた。次に、50塩基対以下の長さのリードを廃棄した。平均品質値が25以下のリードは廃棄した。次に、Bowtie2(version2.2.9)を用いて、リードをヒトゲノム(24 gi番号:568336000~568336023、http://www. ncbi.nlm.nih.gov/nuccore/568336023/, GRCh38)に対してマッピングした。マッピングされたものは、ヒトゲノムに由来するものと判断し、破棄した。最後に、対になっていないリードは破棄した。その結果、合計4,114,878,107,497個(平均6,389,562,279個)の塩基対を持つ合計28,482,269,496個(平均44,227,127個)のペアエンドリード(以下、「高品質リード」と呼ぶ)を以下の分析に使用した。
4,772,084,552,120(平均7,410,069,180)塩基対をカバーする合計31,797,649,036(平均49,375,231)個のペアエンドリードについて、以下のように品質管理を行った。「N」(base pair not identified)の文字を含むローリードは廃棄した。バクテリオファージphiXのDNA配列を含むリードは、Bowtie 2(version2.2.9)44を用いて、プリセットのオプションを「-fast-local」にして、リードに対してマッピングすることで同定し、破棄した。cutadapt (version 1.9.1)45 を用いて、アダプター配列とプライマー配列のためにリードをトリミングし、以下のオプションを使用した(フォワードプライマー配列には「-a CTGTCTTATACATCTCCGAGCCCACGAGAC -O 33 -q 17」、リバースプライマー配列には「-a CTGTCTTATACATCTGACGCTGCCGACGA -O 32 -q 17」)。連続して17以下の品質値を含むリードは、cutadaptプログラムで3’末端でテールカットされた。次に、50塩基対以下の長さのリードを廃棄した。平均品質値が25以下のリードは廃棄した。次に、Bowtie2(version2.2.9)を用いて、リードをヒトゲノム(24 gi番号:568336000~568336023、http://www. ncbi.nlm.nih.gov/nuccore/568336023/, GRCh38)に対してマッピングした。マッピングされたものは、ヒトゲノムに由来するものと判断し、破棄した。最後に、対になっていないリードは破棄した。その結果、合計4,114,878,107,497個(平均6,389,562,279個)の塩基対を持つ合計28,482,269,496個(平均44,227,127個)のペアエンドリード(以下、「高品質リード」と呼ぶ)を以下の分析に使用した。
分類学的プロファイリング
高品質リードは、BLAST+(version2.2.30)47(カットオフ:E < 1 × 10⁻⁸)を用いて、VITCOMIC246に保存されている事前に計算されたOperational Taxonomic Unit(OTU)データセットとアラインメントし、細菌及び古細菌の16S rRNA配列をフィルタリングする一方、tRNA、23S rRNA、内部転写スペーサー(ITS)配列は除外した。メタゲノムデータの分類学的割り当てには、いくつかの参照戦略がある。本発明者は2つの理由から、SILVAデータベースのAll-Species Living Tree Project (LTP)を使用した。第一に、単一の遺伝子座のデータベースには、複数の遺伝子座や完全なゲノムをカバーするものよりも多くの分類項目が含まれているという利点がある。第二に、このデータベースの参照遺伝子は、単離されたタイプの菌株のみで構成されているため、特定の条件下で培養することができ、動物実験でも比較的容易に操作することができる。フィルタリングされたリードは、BLASTn(カットオフ:E<1×10-8、配列同一性>97%、アライメントカバレッジ>80%、ビットスコア>70)48,49を用いてSILVAデータベース(version123)48のLTPとアラインメントされた。トップヒットのみを選択した。その結果、合計8,367種、1,941属が同定された。種の相対的な存在量をサンプルごとに計算し、その種に割り当てられたリードの数をサンプル中のアラインメントされたリードの総数で割ったものと定義した。あるリードがデータベース内の複数の分類学上の配列にアラインメントされ、そのアラインメントスコアが等しい場合、これらの分類学上の配列には、リードを「共有」できるように、1を分類学上の配列の数で割った値が与えられた。属の相対的な存在量は、その属に属するすべての種の合計として計算された。以下、生成されたプロファイルを「種のプロファイル」及び「属のプロファイル」と呼ぶ。この種プロファイリング・パイプラインを検証するために、他の3つのパイプラインを用いて種レベルのプロファイルを取得した。上記の高品質リードを用いて、mOTUプロファイラー50による分類学的プロファイリングから種レベルのメタゲノムOTU(mOTU)を取得した。このプロファイラーのデータベースは、10個のユニバーサル・シングルコピー・マーカー遺伝子に基づいている。これらのマーカー遺伝子は、参照ゲノム由来のものとメタゲノム由来のものがある。本発明者は、メタゲノムデータ由来のOTUを含むデータベースと含まないデータベースの2つを使用した。生成されたプロファイルには651種と838種が含まれている。また、高品質リードを用いて、MetaPhlAn251(version2.6.0)をデフォルトのパラメータで使用し、種レベルの分類学的プロファイリングを行ったところ、623種が得られた。MetaPhlAn2は、種特異的なマーカー遺伝子に基づいている。
高品質リードは、BLAST+(version2.2.30)47(カットオフ:E < 1 × 10⁻⁸)を用いて、VITCOMIC246に保存されている事前に計算されたOperational Taxonomic Unit(OTU)データセットとアラインメントし、細菌及び古細菌の16S rRNA配列をフィルタリングする一方、tRNA、23S rRNA、内部転写スペーサー(ITS)配列は除外した。メタゲノムデータの分類学的割り当てには、いくつかの参照戦略がある。本発明者は2つの理由から、SILVAデータベースのAll-Species Living Tree Project (LTP)を使用した。第一に、単一の遺伝子座のデータベースには、複数の遺伝子座や完全なゲノムをカバーするものよりも多くの分類項目が含まれているという利点がある。第二に、このデータベースの参照遺伝子は、単離されたタイプの菌株のみで構成されているため、特定の条件下で培養することができ、動物実験でも比較的容易に操作することができる。フィルタリングされたリードは、BLASTn(カットオフ:E<1×10-8、配列同一性>97%、アライメントカバレッジ>80%、ビットスコア>70)48,49を用いてSILVAデータベース(version123)48のLTPとアラインメントされた。トップヒットのみを選択した。その結果、合計8,367種、1,941属が同定された。種の相対的な存在量をサンプルごとに計算し、その種に割り当てられたリードの数をサンプル中のアラインメントされたリードの総数で割ったものと定義した。あるリードがデータベース内の複数の分類学上の配列にアラインメントされ、そのアラインメントスコアが等しい場合、これらの分類学上の配列には、リードを「共有」できるように、1を分類学上の配列の数で割った値が与えられた。属の相対的な存在量は、その属に属するすべての種の合計として計算された。以下、生成されたプロファイルを「種のプロファイル」及び「属のプロファイル」と呼ぶ。この種プロファイリング・パイプラインを検証するために、他の3つのパイプラインを用いて種レベルのプロファイルを取得した。上記の高品質リードを用いて、mOTUプロファイラー50による分類学的プロファイリングから種レベルのメタゲノムOTU(mOTU)を取得した。このプロファイラーのデータベースは、10個のユニバーサル・シングルコピー・マーカー遺伝子に基づいている。これらのマーカー遺伝子は、参照ゲノム由来のものとメタゲノム由来のものがある。本発明者は、メタゲノムデータ由来のOTUを含むデータベースと含まないデータベースの2つを使用した。生成されたプロファイルには651種と838種が含まれている。また、高品質リードを用いて、MetaPhlAn251(version2.6.0)をデフォルトのパラメータで使用し、種レベルの分類学的プロファイリングを行ったところ、623種が得られた。MetaPhlAn2は、種特異的なマーカー遺伝子に基づいている。
微生物のコミュニティ構造の分析
616個のメタゲノムデータリードと406個のメタボロームデータリードの全体的なコミュニティ構造をPCAを用いて調べた。また、メタゲノムサンプルのコミュニティタイプは、シークエンスリードのカウント数を用いたDirichlet多項混合モデルにより解析した13。Rパッケージの「DirichletMultinomial」52を使用した。最大で4つのクラスターが存在し、そのうち第3クラスターはPrevotellaが優勢であった(図7e)。他の3つのクラスターはより多様な構造をしており、Bacteroides属が優勢であった。がんのステージ、腫瘍の位置、性別を異なるコミュニティタイプで調べた。4つのコミュニティタイプにおける年齢、BMI、喫煙習慣(Brinkman index)、アルコール摂取量(1日あたりのグラム数)の分布を分散分析で検証した。性別、大腸鏡所見(健常者、MP、S0、SI/II、SIII/IV、HS)、腫瘍部位(左大腸、右大腸、直腸、二重・三重がん)に加え、がんのない他の3群(健常者、MP、HS))の分布をPearsonのχ2検定を用いて検定した(性別、d.f.=3、大腸鏡所見、d.f.=15、腫瘍部位、d.f.=18)。
616個のメタゲノムデータリードと406個のメタボロームデータリードの全体的なコミュニティ構造をPCAを用いて調べた。また、メタゲノムサンプルのコミュニティタイプは、シークエンスリードのカウント数を用いたDirichlet多項混合モデルにより解析した13。Rパッケージの「DirichletMultinomial」52を使用した。最大で4つのクラスターが存在し、そのうち第3クラスターはPrevotellaが優勢であった(図7e)。他の3つのクラスターはより多様な構造をしており、Bacteroides属が優勢であった。がんのステージ、腫瘍の位置、性別を異なるコミュニティタイプで調べた。4つのコミュニティタイプにおける年齢、BMI、喫煙習慣(Brinkman index)、アルコール摂取量(1日あたりのグラム数)の分布を分散分析で検証した。性別、大腸鏡所見(健常者、MP、S0、SI/II、SIII/IV、HS)、腫瘍部位(左大腸、右大腸、直腸、二重・三重がん)に加え、がんのない他の3群(健常者、MP、HS))の分布をPearsonのχ2検定を用いて検定した(性別、d.f.=3、大腸鏡所見、d.f.=15、腫瘍部位、d.f.=18)。
分類学的ツリーの構築
GraPhlAn (version 0.9.7)53を用いて分類学上のツリーを構築した。分類学的な階層情報はSILVAデータベースから得た。図2bでは、ドメイン、門、科、属、種の7つのレベルを用いた。種は、平均存在量が10-6以上で、いずれかの段階でP<0.005(片側Mann-Whitney U検定)となったものが表示されるようにフィルターをかけた。
GraPhlAn (version 0.9.7)53を用いて分類学上のツリーを構築した。分類学的な階層情報はSILVAデータベースから得た。図2bでは、ドメイン、門、科、属、種の7つのレベルを用いた。種は、平均存在量が10-6以上で、いずれかの段階でP<0.005(片側Mann-Whitney U検定)となったものが表示されるようにフィルターをかけた。
微生物の複製率の解析
Growth Rate Index(GRiD)(version 1.2)を用いて複製率を算出した。このアルゴリズムは、Tukeyのbiweight関数を用いたM estimatorを使用して、基準となる細菌ゲノムのピーク(ori)とトラフ(ter)におけるカバレッジの比率を推定することに基づいている。GRiDの値は複製率と正の関係を示している。図2bに示した22種のうち20種(A. odontolyticus, Actinomyces viscosus, A. parvulum, Bifidobacterium longum ssp. longum, B. wadsworthia, C. aerofaciens, D. longicatena, E. eligens, F. nucleatum ssp. nucleatum, G. morbillorum, L. multip. morbillorum, L. multipara, L. sanfranciscensis, P. micra, P. anaerobius, P. stomatis, P. succinatutens, P. uenonis, S. sputigena, S. moorei, S. anginosus)をGRiD15を用いて計算し、パラメータを「single」とすることで、各計算において単一の参照ゲノムを参照した。参照ゲノムはNCBIのウェブサイトからダウンロードし、参照ゲノムのIDとSILVA LTPのIDをNCBIのアクセッション番号を用いて相互参照した。SILVAの識別子がNCBIデータベースと相互参照できない場合は、「RefSeqカテゴリー」で「代表的なゲノム」を選択した。D. longreachensisとD. vietnamensisの参照ゲノムは、NCBIデータベースでは見つからなかった。MP、S0、SI/II、SIII/IVの各ステージにおける複製率を健常者と比較し、片側Mann-Whitney U検定を用いて、αレベル0.005で有意に評価した。GRiDのカバレッジ要件に基づき、各リファレンスゲノムにおいてカバレッジが0.2以下のサンプルは統計的検定から除外した。A. odontolyticus, A. viscosus, A. parvulum, L. multipara, S. anginosus, S. sputigenaについては、この解析で高い再現率を示したサンプルはわずかであった。
Growth Rate Index(GRiD)(version 1.2)を用いて複製率を算出した。このアルゴリズムは、Tukeyのbiweight関数を用いたM estimatorを使用して、基準となる細菌ゲノムのピーク(ori)とトラフ(ter)におけるカバレッジの比率を推定することに基づいている。GRiDの値は複製率と正の関係を示している。図2bに示した22種のうち20種(A. odontolyticus, Actinomyces viscosus, A. parvulum, Bifidobacterium longum ssp. longum, B. wadsworthia, C. aerofaciens, D. longicatena, E. eligens, F. nucleatum ssp. nucleatum, G. morbillorum, L. multip. morbillorum, L. multipara, L. sanfranciscensis, P. micra, P. anaerobius, P. stomatis, P. succinatutens, P. uenonis, S. sputigena, S. moorei, S. anginosus)をGRiD15を用いて計算し、パラメータを「single」とすることで、各計算において単一の参照ゲノムを参照した。参照ゲノムはNCBIのウェブサイトからダウンロードし、参照ゲノムのIDとSILVA LTPのIDをNCBIのアクセッション番号を用いて相互参照した。SILVAの識別子がNCBIデータベースと相互参照できない場合は、「RefSeqカテゴリー」で「代表的なゲノム」を選択した。D. longreachensisとD. vietnamensisの参照ゲノムは、NCBIデータベースでは見つからなかった。MP、S0、SI/II、SIII/IVの各ステージにおける複製率を健常者と比較し、片側Mann-Whitney U検定を用いて、αレベル0.005で有意に評価した。GRiDのカバレッジ要件に基づき、各リファレンスゲノムにおいてカバレッジが0.2以下のサンプルは統計的検定から除外した。A. odontolyticus, A. viscosus, A. parvulum, L. multipara, S. anginosus, S. sputigenaについては、この解析で高い再現率を示したサンプルはわずかであった。
属と種のネットワーク分析
各ステージ(MP、S0、SI/II、SIII/IV)における属と種の相対存在量プロファイルを用いて、Spearmanの相関係数を算出した。属相関ネットワークは、Atopobium属との相関係数が0.4以上又は0.4以下の種で構築した。ネットワークの構築は、yEd Graph Editor (version 3.18.11) (https://www.yworks.com/products/yed)を用いて行った。
各ステージ(MP、S0、SI/II、SIII/IV)における属と種の相対存在量プロファイルを用いて、Spearmanの相関係数を算出した。属相関ネットワークは、Atopobium属との相関係数が0.4以上又は0.4以下の種で構築した。ネットワークの構築は、yEd Graph Editor (version 3.18.11) (https://www.yworks.com/products/yed)を用いて行った。
配列アセンブリング
IDBA_UD (version 1.1.1)54 を用いて、パラメータ -mink 20 -maxk 120 -step 10 で高品質リードをサンプルごとにアセンブルした。合計81,002,850個(1サンプルあたり平均125780.8個)のスキャフォールドが生成された。
IDBA_UD (version 1.1.1)54 を用いて、パラメータ -mink 20 -maxk 120 -step 10 で高品質リードをサンプルごとにアセンブルした。合計81,002,850個(1サンプルあたり平均125780.8個)のスキャフォールドが生成された。
機能プロファイリング
MetaGeneMark (version 3.26)55のパラメータ-g 11を用いて、得られたスキャフォールドからオープンリーディングフレーム(ORF)を予測した。その結果、アミノ酸長が50以上の156,163,520個のORFが、DIAMOND(version 0.9.10)を用いてKEGG GENESデータベース(2017年時点)56にアノテーションされ(カットオフ:配列同一性>40、ビットスコア>70、カバレッジ>80)、合計126,761,506個のORF、すなわちアノテーションされた「遺伝子」が得られた。遺伝子の存在量は、以下のようにして算出した。Bowtie 2 version 2.2.944を用いて、高品質リードをスキャフォールドにマッピングした。各スキャフォールド上の各ORFのリードカバレッジを評価し、対応するスキャフォールド領域にマッピングされた塩基対の数をORFの長さで割ったものと定義した。2つ以上のORFが1つの遺伝子に一致する場合、各遺伝子のアバンダンスはスコア値の平均として計算された。遺伝子量の合計は、KEGGで定義された機能単位である7,242個のKO遺伝子になる。このようにして得られたプロファイルを「KO遺伝子プロファイル」と呼ぶことにする。
MetaGeneMark (version 3.26)55のパラメータ-g 11を用いて、得られたスキャフォールドからオープンリーディングフレーム(ORF)を予測した。その結果、アミノ酸長が50以上の156,163,520個のORFが、DIAMOND(version 0.9.10)を用いてKEGG GENESデータベース(2017年時点)56にアノテーションされ(カットオフ:配列同一性>40、ビットスコア>70、カバレッジ>80)、合計126,761,506個のORF、すなわちアノテーションされた「遺伝子」が得られた。遺伝子の存在量は、以下のようにして算出した。Bowtie 2 version 2.2.944を用いて、高品質リードをスキャフォールドにマッピングした。各スキャフォールド上の各ORFのリードカバレッジを評価し、対応するスキャフォールド領域にマッピングされた塩基対の数をORFの長さで割ったものと定義した。2つ以上のORFが1つの遺伝子に一致する場合、各遺伝子のアバンダンスはスコア値の平均として計算された。遺伝子量の合計は、KEGGで定義された機能単位である7,242個のKO遺伝子になる。このようにして得られたプロファイルを「KO遺伝子プロファイル」と呼ぶことにする。
パスウェイの機能的特徴
「Amino acid metabolism」カテゴリーのKEGG BRITE 「ko00001.keg」(list of KO genes with pathway maps)からパスウェイ情報を持つアミノ酸関連KO遺伝子を入手した。また、微生物において知られているパスウェイモジュールを調べるために、「Microbial metabolism in diverse environments」に掲載されているKEGGモジュールを収集した(map01120)。図3aでは、健常対照者と比較して、いずれかのステージ(MP、S0、SI/ II、SIII/IV)において、Mann-Whitney U検定(P < 0.005)で解析した結果、全576サンプル中、有病率が5%以上であったKO遺伝子を示している。図3b及び図12bに示した代表的な反応パスウェイは、文献を参考にしたり、KEGGパスウェイの参照マップを修正したりして、手作業で構築した。図3b及び図12bでは、いずれかのステージ(MP, S0, SI/II, SIII/IV)でP < 0.005のKO遺伝子を示し、パスウェイ内の残りのKO遺伝子は省略した。遺伝子とKEGGオルソロジー遺伝子は、KEGGでリンクされている。各KO遺伝子について、各KO遺伝子の各成分が生物を表すように、微生物遺伝子の存在量を合計した。生物名はKEGGでは3文字のコードで保存されている。
「Amino acid metabolism」カテゴリーのKEGG BRITE 「ko00001.keg」(list of KO genes with pathway maps)からパスウェイ情報を持つアミノ酸関連KO遺伝子を入手した。また、微生物において知られているパスウェイモジュールを調べるために、「Microbial metabolism in diverse environments」に掲載されているKEGGモジュールを収集した(map01120)。図3aでは、健常対照者と比較して、いずれかのステージ(MP、S0、SI/ II、SIII/IV)において、Mann-Whitney U検定(P < 0.005)で解析した結果、全576サンプル中、有病率が5%以上であったKO遺伝子を示している。図3b及び図12bに示した代表的な反応パスウェイは、文献を参考にしたり、KEGGパスウェイの参照マップを修正したりして、手作業で構築した。図3b及び図12bでは、いずれかのステージ(MP, S0, SI/II, SIII/IV)でP < 0.005のKO遺伝子を示し、パスウェイ内の残りのKO遺伝子は省略した。遺伝子とKEGGオルソロジー遺伝子は、KEGGでリンクされている。各KO遺伝子について、各KO遺伝子の各成分が生物を表すように、微生物遺伝子の存在量を合計した。生物名はKEGGでは3文字のコードで保存されている。
定量PCR法によるA. parvulumの検証
S0 CRC患者73名と健常対照者73名の糞便サンプルから、定量的PCR(qPCR)を用いて、A. parvulumの存在量を検証した。抽出したDNA 1μg中のA. parvulum 16S rRNA遺伝子の標的領域のコピー数を推定した。PCR産物はA. parvulum F-primer (5’-TGGATAATACCGAATACTTCGAGACT-3’)とA. parvulum R-primer (5’-TGCAGGTACCGTCACTTTCG-3’)を用いて塩基配列を決定し、Rotor- Gene Q (QIAGEN)でTB Green Premix Ex Taq II (Takara Bio)を用いてqPCRを行った。
S0 CRC患者73名と健常対照者73名の糞便サンプルから、定量的PCR(qPCR)を用いて、A. parvulumの存在量を検証した。抽出したDNA 1μg中のA. parvulum 16S rRNA遺伝子の標的領域のコピー数を推定した。PCR産物はA. parvulum F-primer (5’-TGGATAATACCGAATACTTCGAGACT-3’)とA. parvulum R-primer (5’-TGCAGGTACCGTCACTTTCG-3’)を用いて塩基配列を決定し、Rotor- Gene Q (QIAGEN)でTB Green Premix Ex Taq II (Takara Bio)を用いてqPCRを行った。
メタボローム解析
CE-TOFMSによる電荷を帯びた代謝物の定量的解析は、以前記述57した方法で行った。糞便中の代謝物は、内部標準としてメチオニンスルホンとd-カンフォール-10-スルホン酸をそれぞれ20 μM含むメタノールで激しく振盪して抽出した58。すべてのCE-TOFMS実験は、Agilent CEシステムを用いて行った。CE-TOFMSメタボロームデータは、517化合物について得られた。解析にあたっては、検出限界以下の濃度はゼロで置き換え、すべてのサンプルで検出限界以下のレベルであった代謝物は除外した。
CE-TOFMSによる電荷を帯びた代謝物の定量的解析は、以前記述57した方法で行った。糞便中の代謝物は、内部標準としてメチオニンスルホンとd-カンフォール-10-スルホン酸をそれぞれ20 μM含むメタノールで激しく振盪して抽出した58。すべてのCE-TOFMS実験は、Agilent CEシステムを用いて行った。CE-TOFMSメタボロームデータは、517化合物について得られた。解析にあたっては、検出限界以下の濃度はゼロで置き換え、すべてのサンプルで検出限界以下のレベルであった代謝物は除外した。
大腸がんを検出するためのメタゲノム及びメタボロームマーカーの同定
S0(n = 27)及びSIII/IV(n = 54)のCRC患者から採取したサンプルと健常対照者(n = 127)のサンプルを区別するメタゲノム及びメタボロームマーカーを同定するために、ランダムフォレスト法とLASSOロジスティック回帰法の2つの異なる手法を用いて、生物種、KO遺伝子、代謝物のプロファイルに基づく分類モデルを構築した59。モデルの検証には、10倍の層化交差検定を行った(データセットのパーティションを10回再サンプリングした)。各テストでは、ROCを用いてモデルの精度を検証し、各ステージの平均相対存在量を計算することで、存在量の少ない特徴を除去するために、存在量フィルタリングを行った。存在量の閾値は、AUCを最適化するように決定した。その後、特徴量を標準化した(平均値0にセンターリングし、各特徴量のs.d.で割る)。モデルは、3種類の特徴量(種、KO遺伝子、代謝物)のうち1つを単独で、又は3つを組み合わせて設計した。ランダムフォレストモデルでは、2つのステップが実行された。最初のステップでは、3つのプロファイル(種、KO遺伝子、代謝物のプロファイル)をそれぞれ独立して使用してモデルを構築した。このモデルでは、事前にフィルタリングされたすべての特徴量を使用して、示されたパラメータ(500のツリー、バランスのとれたクラスの重み、最大特徴量=すべての特徴量の平方根)でランダムフォレスト関数を実行して「特徴量の重要性」を計算し(以下の説明を参照)、5つの異なるランダムシードを使用してパラメータstep=0.1の再帰的特徴量消去法60を用いて最適な特徴量の数を決定した。第二段階では、種、KO遺伝子、代謝物の各モデルで決定した特徴量を用いて、組み合わせモデルを構築した。さらに、上記と同様に再帰的特徴除去法60を用いて特徴を選択した。すべての解析は、Pythonパッケージ「scikit-learn」を用いて実施した。モデルに対する特徴の寄与は、特徴のインポート数として出力された。図4は、少なくとも50%のテストにおいて、特徴量のインポータンスがゼロではない特徴量を示している。LASSOロジスティック回帰モデルでは、L1正則化を用いて特徴を選択した。モデルに対する特徴の寄与度は、回帰係数のパーセント絶対値を用いて計算した。拡張データ図9には、少なくとも50%のテストでゼロではない係数を持つ特徴が表示されている。既知のCRC危険因子(年齢、性別、BMI、喫煙、飲酒)の診断可能性を評価したところ、予測精度が低くなった(図13c)。
S0(n = 27)及びSIII/IV(n = 54)のCRC患者から採取したサンプルと健常対照者(n = 127)のサンプルを区別するメタゲノム及びメタボロームマーカーを同定するために、ランダムフォレスト法とLASSOロジスティック回帰法の2つの異なる手法を用いて、生物種、KO遺伝子、代謝物のプロファイルに基づく分類モデルを構築した59。モデルの検証には、10倍の層化交差検定を行った(データセットのパーティションを10回再サンプリングした)。各テストでは、ROCを用いてモデルの精度を検証し、各ステージの平均相対存在量を計算することで、存在量の少ない特徴を除去するために、存在量フィルタリングを行った。存在量の閾値は、AUCを最適化するように決定した。その後、特徴量を標準化した(平均値0にセンターリングし、各特徴量のs.d.で割る)。モデルは、3種類の特徴量(種、KO遺伝子、代謝物)のうち1つを単独で、又は3つを組み合わせて設計した。ランダムフォレストモデルでは、2つのステップが実行された。最初のステップでは、3つのプロファイル(種、KO遺伝子、代謝物のプロファイル)をそれぞれ独立して使用してモデルを構築した。このモデルでは、事前にフィルタリングされたすべての特徴量を使用して、示されたパラメータ(500のツリー、バランスのとれたクラスの重み、最大特徴量=すべての特徴量の平方根)でランダムフォレスト関数を実行して「特徴量の重要性」を計算し(以下の説明を参照)、5つの異なるランダムシードを使用してパラメータstep=0.1の再帰的特徴量消去法60を用いて最適な特徴量の数を決定した。第二段階では、種、KO遺伝子、代謝物の各モデルで決定した特徴量を用いて、組み合わせモデルを構築した。さらに、上記と同様に再帰的特徴除去法60を用いて特徴を選択した。すべての解析は、Pythonパッケージ「scikit-learn」を用いて実施した。モデルに対する特徴の寄与は、特徴のインポート数として出力された。図4は、少なくとも50%のテストにおいて、特徴量のインポータンスがゼロではない特徴量を示している。LASSOロジスティック回帰モデルでは、L1正則化を用いて特徴を選択した。モデルに対する特徴の寄与度は、回帰係数のパーセント絶対値を用いて計算した。拡張データ図9には、少なくとも50%のテストでゼロではない係数を持つ特徴が表示されている。既知のCRC危険因子(年齢、性別、BMI、喫煙、飲酒)の診断可能性を評価したところ、予測精度が低くなった(図13c)。
種とメタボロームの相関
各ステージ(MP(n=40)、S0(n=27)、SI/II(n=69)、SIII/IV(n=54))について、種と代謝物の間のペアワイズ相関係数をSpearmanの相関係数を用いて計算した。健全な対照サンプルと比較して、MP又はS0サンプルで存在量が多く(P < 0.005;片側Mann-Whitney U検定)、MP又はS0で相関係数が0.6以上(P < 0.005)となった種-代謝物ペアに着目した。このようにして、169組のペアができた。これらの中で、種の存在量が10-4以上のペアを選択すると、MPではB. wadsworthiaとDCAのペアが1組だけ残った。
各ステージ(MP(n=40)、S0(n=27)、SI/II(n=69)、SIII/IV(n=54))について、種と代謝物の間のペアワイズ相関係数をSpearmanの相関係数を用いて計算した。健全な対照サンプルと比較して、MP又はS0サンプルで存在量が多く(P < 0.005;片側Mann-Whitney U検定)、MP又はS0で相関係数が0.6以上(P < 0.005)となった種-代謝物ペアに着目した。このようにして、169組のペアができた。これらの中で、種の存在量が10-4以上のペアを選択すると、MPではB. wadsworthiaとDCAのペアが1組だけ残った。
統計解析
各種、KO遺伝子、代謝物の存在量、及び細菌の複製率を、片側Mann-Whitely U検定を用いて健常対照者と一対一で比較することにより、各ステージ(MP、S0、SI/II、SIII/SIV)において有意に増加又は減少しているかどうかを判定した。P<0.005を統計的に有意とした。また、Benjamini-Hochberg false-discovery rate-corrected P値(q値)を推定した。
各種、KO遺伝子、代謝物の存在量、及び細菌の複製率を、片側Mann-Whitely U検定を用いて健常対照者と一対一で比較することにより、各ステージ(MP、S0、SI/II、SIII/SIV)において有意に増加又は減少しているかどうかを判定した。P<0.005を統計的に有意とした。また、Benjamini-Hochberg false-discovery rate-corrected P値(q値)を推定した。
報告のまとめ
研究デザインに関するさらなる情報は、この論文にリンクされているNature Research Reporting Summaryに掲載されてる。
研究デザインに関するさらなる情報は、この論文にリンクされているNature Research Reporting Summaryに掲載されてる。
データの入手方法
本論文で報告されているシーケンス生データは、DRA006684及びDRA008156としてDDBJ Sequence Read Archive(DRA)に寄託されている。
本論文で報告されているシーケンス生データは、DRA006684及びDRA008156としてDDBJ Sequence Read Archive(DRA)に寄託されている。
〔図の説明〕
図1 糞便サンプルのグローバルメタゲノム及びメタボローム特性。a, 健康対照群(正常及び少数のポリープ)(n = 251)、MP群(n = 67)、S0群(n = 73)、SI/II群(n = 111)、SIII/IV群(n = 74)及びHS群(n = 40)の被験者616人について、上位30属(上)及びヒトゲノムのフラクションの相対的な存在量を示した。健常対照群(n=149)、MP群(n=45)、S0群(n=30)、SI/II群(n=80)、SIII/IV群(n=68)、HS群(n=34)の被験者406名の代謝物濃度の割合(下)。b, 属名(n=616)のPCA(左)と代謝物(n=406)のPCA(右)。PC, 主成分。
図1 糞便サンプルのグローバルメタゲノム及びメタボローム特性。a, 健康対照群(正常及び少数のポリープ)(n = 251)、MP群(n = 67)、S0群(n = 73)、SI/II群(n = 111)、SIII/IV群(n = 74)及びHS群(n = 40)の被験者616人について、上位30属(上)及びヒトゲノムのフラクションの相対的な存在量を示した。健常対照群(n=149)、MP群(n=45)、S0群(n=30)、SI/II群(n=80)、SIII/IV群(n=68)、HS群(n=34)の被験者406名の代謝物濃度の割合(下)。b, 属名(n=616)のPCA(左)と代謝物(n=406)のPCA(右)。PC, 主成分。
図2 がんの進行に伴い、ステージごとに異なる分類学的及びメタボローム的シグネチャー。a,b, MP(n=67)、S0(n=73)、SI/II(n=111)、SIII/IV(n=111)の4つのステージにおいて、健常対照者(n=251)と比較して、種の存在量が有意に増加又は減少しているかどうかを評価した(P < 0. 005; 片側Mann-Whitney U検定)。a, 健康なコントロールと比較して、4つのステージのそれぞれで上昇又は減少した種の数の門分布。各門(Proteobacteria、Bacteroidetes、Fusobacteria、Firmicutes、Actinobacteria)について、健康なコントロールと比較して、4つのステージのそれぞれで有意に増加又は減少した種の数を数えた。すべてのステージで変化が観察された種(ユビキタス、緑)の数は非常に少なく、ほとんどの種は、あるステージに特有の変化(ステージ特有、赤)、又は別のステージと共通の変化(共通、青)を示した。b, 系統樹上では、Proteobacteria、Bacteroidetes、 Fusobacteria、Firmicutes、及びActinobacteriaの各系統に分類された361種の異なる生物種が示されている。外側の円の中には、有意(P < 0.005)な上昇(オレンジ色)又は減少(緑色)を示す種が記されている。特に上昇した種(偽発見率補正P < 0.1; 片側Mann-Whitney U検定)は赤で示した。最も内側の円は、全サンプルで平均した種の相対存在量を示している。平均相対量が1×10⁻⁶よりも低い種は、系統樹から除外した。ボックスプロットは、他のコホートで報告されているがん関連種(緑丸)、酪酸生産者(黄丸)、硫化水素生産者(ピンク丸)、あるいは4つのメタゲノムパイプライン(「方法」参照)のすべてで新たに検出され、健常対照者と比較して有意(P < 0.005)に変化した種(青丸)の相対存在量を示している。各ボックスプロットのY軸は相対存在量である。各プロットは、健康なコントロール(左端のバー)と4つのグループ(MP、S0、SI/II、SIII/IV)のボックスを左から右の順に示している。c, メタボローム解析の結果、胆汁酸、分岐鎖脂肪酸(BCFA)、アミノ酸の糞便中の濃度が有意に上昇又は減少した(P < 0. 005;片側Mann-Whitney U検定)、MP(n=45)、S0(n=30)、SI/II(n=80)、SIII/IV(n=68)の各ステージにおいて、健常対照者(n=149)と比較して有意な上昇又は減少が認められた。BCAAは分岐鎖アミノ酸、AAAは芳香族アミノ酸。 d, B. wadsworthiaとDCAの関係。B. wadsworthiaはMPのDCAと最も高いSpearmanの相関係数(CC = 0.63, P = 1.50 × 10⁻⁵、漸近t近似法を用いて計算)を示した。 e, A. parvulumの属ネットワーク分析。健常対照群(n=251)、MP群(n=67)、S0群(n=73)、SI/II群(n=111)、SIII/IV群(n=74)において、属相関ネットワークを構築した。合計で、少なくとも1つのステージでAtopodiumとの間に1×10-4を超える存在量と0.4を超えるSpearmanの相関係数を持つ22属を使用した。ノードの大きさは、属の豊富さに比例する。エッジの幅は相関の強さに比例する。f, 各グループにおけるA. parvulumとの種の相関係数。存在量が1×10⁻⁵以上で、Spearmanの相関係数が0.5以上の種を示した。赤色で示した種はbに示した。有意な変化(上昇と減少)は以下のように示される。+++, P < 0.005で上昇、++, P < 0.01で上昇、+, P < 0.05で上昇、---, P < 0.005で減少, --, P < 0.01で減少, -, P < 0.05で減少。ボックスは25-75%線、黒線は中央値、ウィスカは四分位範囲の1.5倍以内の最大値と最小値を示す。
図3 KO遺伝子とKEGGパスウェイモジュールにまとめられた微生物遺伝子のCRC関連の変化。a,b, MP(n=67)、S0(n=73)、SI/II(n=111)、SIII/IV(n=74)の4つのステージごとに、健常対照者(n=251)と比較して、遺伝子量が有意に増加又は減少しているかどうかを評価した(P < 0.005; 片側Mann-Whitney U検定)。a, アミノ酸代謝及び代表的な微生物代謝(メタン代謝、硫黄代謝、芳香族分解など)に関わるKO遺伝子のうち、4つのステージのうち少なくとも1つのステージで有意差を示した遺伝子の相対的な存在量をヒートマップで示した。有病率5%以上のKO遺伝子(576人のうち5%以上に検出されたKO遺伝子)を示す。有意な変化(上昇、減少)は以下のように示される。++, P < 0.005で上昇、++, P < 0.01で上昇、+, P < 0.05で上昇、---, P < 0.005で減少、--, P < 0.01で減少、-, P < 0.05で減少。b, aで示した代表的なKO遺伝子を、KEGGパスウェイマップの「バリン、ロイシン、イソロイシンの生合成」、「リジンの分解」、「チロシンの代謝」、「フェニルアラニンの代謝」、「フェニルアラニン、チロシン、トリプトファンの生合成」、「メタンの代謝」、「硫黄の代謝」、「安息香酸塩の分解」から改変したパスウェイモジュールで示した。パスウェイ内の各ボックスはKO遺伝子を表し、いずれかのステージで上昇した場合は赤で、減少した場合は青で示している。棒グラフは、5つのグループ(左から健常者(H)、MP、S0、SI/II、SIII/IV)内の各サンプルで平均した相対的な遺伝子量を示しており、値の順番に応じて色分けされている。各KO遺伝子は、円で表された生物の遺伝子で構成されている。丸の大きさと色は、生物遺伝子の相対的な存在量に比例する。生物の遺伝子は1列にまとめられ、生物名で示されている。健常対照者に最も多く存在する3つの生物は、3文字のコードで示されている(例えば、pruはPrevotella ruminicola、bvuはBacteroides vulgatus)。その他のアミノ酸については、図12を参照。各経路のドットは中間代謝物を表す。APS, アデノシン5’-ホスホサルフェート;PASP,3’-ホスホアデノシン5’-ホスホサルフェート。
図4 CRCの多段階進行における微生物の動態とその診断可能性。a, CRCの多段階進行における主要な微生物及びメタボロームの変化のグラフィカルな表示。b,c, 種(赤)、KO遺伝子(青)、代謝物(黒)の単独、又は3つの特徴の組み合わせ(緑)に基づくランダムフォレスト分類法により同定されたS0(n=27)(左)及びSIII/IV(n=54)(右)のCRC患者を健常対照者(n=127)から検出するためのメタゲノム及びメタボロームのマーカー。S0の分類では、個々のモデルが29種の生物種、16種のKO遺伝子、24種の代謝物を特徴として用いた。SIII/IV分類では、個々のモデルが55種の生物種、5種のKO遺伝子、62種の代謝物を特徴として用いた。組み合わせモデルでは、個々のモデルから種、KO遺伝子、代謝物の特徴を選択した。GABAはγ-アミノ酪酸を表し、KOはKEGGオルソロジー遺伝子を表す。x軸は、各テストにおける特徴のモデルへの寄与率を示す(「方法」参照)。ボックスは25-75%線、黒線は中央値、ウィスカは四分位範囲の1.5倍以内の最大値と最小値に伸び、点は外れ値を示す。ボックスは、健常対照者と比較してS0又はSIII/IVで過大表示の場合は赤で示されており、過小表示の場合は水色で示されており、有意な変化がなかった場合(P < 0.005;片側Mann-Whitney U検定)は灰色で示されている。AUCを用いた分類器の性能は、無作為化した10回のクロスバリデーションを用いて評価した。d, 手術前と手術後の種の相対量の比較(n = 28)。x軸は対数変換した発現量の倍数変化、y軸は片側Wilcoxon signed-rank testを用いて解析したP値を示す。横の破線はP値が0.005であることを示す。円の大きさは、術前と術後の状態を平均した各生物種の存在量を示す。図2に示した種のうち、以前にCRCで増加又は減少したと報告された、酪酸生産者、H2S生産者、他のコホートで報告されたがん関連種、又は本研究でCRCと新たに関連して増加又は減少したと報告された種は、赤(増加)と青(減少)で強調されている。e, SI/II/III CRC患者28人において、術前と比較して術後に有意に減少した5種、D. longicatena、P. micra、P. uenonis、P. anaerobius、P. stomatisの相対存在量(P < 0.005; 片側Wilcoxon signedrank test)。ボックスは25-75%線、黒線は中央値、ウィスカは四分位範囲の1.5倍以内の最大値と最小値に伸び、点は外れ値を示す。増加は赤、減少は青で表示される。f, 手術前の糞便サンプルが得られなかったHSサンプル(n = 40)における同じ5種の生物種の相対存在量を健常対照者(n = 251)と比較して示した。
図5 研究の概要とメタゲノム解析のパイプライン。a, 研究の概要。被験者616名の糞便サンプルを用いて全ゲノムショットガンシーケンスデータを収集し、機能及び分類学的プロファイルを作成した。406名の被験者の糞便サンプルを用いてCE-TOFMS分析を行い、代謝物プロファイルを作成した。347名の被験者のサンプルは、シーケンス解析とCE-TOFMSデータ解析の両方に利用できた。KOはKEGGオルソロジー遺伝子を表す。b, メタゲノミクス解析に用いたパイプラインのフローチャート。本発明者のメタゲノミクスパイプラインは、品質管理、機能プロファイリング、分類学的プロファイリングの3つの部分で構成されており、生のリードはまず品質管理チェックを受けた後、いくつかの分析ステップを経て、最終的にKEGGオルソロジー遺伝子に基づく機能プロファイルと分類学的プロファイルを生成する。
図6 被験者の臨床情報。a,b, メタゲノムデータを持つ被験者616名(a)とメタボロームデータを持つ被験者406名(b)の年齢、性別、BMI、Brinkman index、飲酒量の分布。ボックスは25-75%線を、黒線は中央値を、ウィスカは四分位範囲の1.5倍以内の最大値と最小値に伸び、点は外れ値を示す。
図7 糞便メタゲノム中の微生物群集構造とヒトゲノム含有量。a, 大腸がんの進行に伴い、生のリード総数に占めるヒトゲノムリードの割合が変化する。MP群(n = 67)、S0群(n = 73)、SI/II群(n = 111)、SIII/IV群(n = 74)の糞便中のヒトゲノム比率(ヒトゲノムにマッピングされたリードの割合)は、健常群(H, n = 251)に比べて有意に増加している(P < 0.005; 片側Mann-Whitney U検定)ことが明らかになった。ボックスは25-75%線、黒線は中央値、縦線は四分位範囲の1.5倍以内の最大値、点は四分位範囲の1.5倍を超える外れ値を示す。 b,c, 健常対照群における属(n=251)(b)と代謝物(n=149)(c)のPCA。d, Dirichlet多項混合モデルへのフィッティングにより、糞便メタゲノム(n = 616)を4つのコミュニティタイプに最適に分類した。e, 4つのコミュニティタイプそれぞれにおける上位30属の構成。f-i, 4つのコミュニティタイプそれぞれにおけるステージ(健常、MP、S0、SI/II、SIII/IV、HS)(f)、腫瘍部位(右大腸、左大腸、直腸、二重又は三重のがん)(g)、性別(h)、年齢(i)の分布。コミュニティタイプ別の患者分布は、コミュニティタイプ1がn=191、コミュニティタイプ2がn=172、コミュニティタイプ3がn=129、コミュニティタイプ4がn=124である。iのボックスは25-75%線、黒線は中央値、ウィスカは四分位範囲の1.5倍以内の最大値と最小値に伸び、ドットは外れ値を示す。
図8 メタゲノムとメタボロームの全体構造における腫瘍部位と性別の分布。a,b, 腫瘍部位(a)と性別(b)でグループ化された属プロファイル(n = 616)のPCAプロット。c,d, 腫瘍部位(c)と性別(d)でグループ化された代謝物プロファイル(n = 406)のPCAプロット
図9 メタゲノム解析とqPCR解析におけるA. parvulumの存在量の比較。a,b, S0 CRC患者73名(緑)と健常対照者73名(赤)のサンプルにおいて、全ゲノムショットガンメタゲノム配列データ(a)と16S rRNA遺伝子コピー数を用いたqPCR(b)により推定したA. parvulumの存在量。c, 2つの方法の間のA. parvulumの存在量のSpearmanの相関係数を、漸近近似を用いたP値計算により算出した。 d, qPCRにより、健常対照者とS0 CRC患者の間で、A. parvulumの遺伝子数に統計的に有意な差があることが示された(片側Mann-Whitney U検定)。ボックスは25-75%線、黒線は中央値、ウィスカは四分位範囲の1.5倍以内の最大値と最小値に伸び、点は外れ値を示す。
図10 GRiDを用いて複製率を推定した。図2に示した20種について、複製率をプロットした。Y軸(GRiD)は、基準となるバクテリアゲノムのピーク(ori)とトラフ(ter)におけるカバレッジの比率として定義されている。十分なカバレッジを持つサンプルは、参照ゲノムに対するマッピングのためにプロットされている(カバレッジ > 0.2)。サンプル数は依存する生物種によって異なり、括弧内に示した。P値は、各ステージ(MP, S0, SI/II, SIII/IV)について、片側Mann-Whitney U検定を用いて算出し、健常対照者と比較した。有意な上昇又は減少は、以下のように示される。+++, P < 0.005で上昇、++, P < 0.01で上昇、+, P < 0.05で上昇、---, P < 0.005で減少、--, P < 0.01で減少、-, P < 0.05で減少。ボックスは25-75%線、黒線は中央値、ウィスカは四分位範囲の1.5倍以内の最大値と最小値に伸び、点は外れ値を示す。
図11 大腸がんのステージにおける代謝物の変化。キャピラリー電気泳動飛行時間型質量分析計(CE-TOFMS)による分析で、いずれかのステージ(MP, n = 45; S0, n = 30; SI/II, n = 80; SIII/IV, n = 68)について、健常対照者(n = 149)と比較して、統計的に有意な差(P < 0.005; 片側Mann-Whitney U検定)が認められた65の代謝物。有意な変化(上昇及び減少)は以下のように示されている。++はP<0.005で上昇、++はP<0.01で上昇、+はP<0.05で上昇、---はP<0.005で減少、--はP<0.01で減少、-はP<0.05で減少。ボックスは25-75%線、黒線は中央値、ウィスカは四分位範囲の1.5倍以内の最大値と最小値に伸び、点は外れ値を示す。
図12 トリカルボン酸(TCA)経路のメタボローム変化と、アミノ酸代謝やその他の代表的な経路のメタゲノム変化。 a, トリカルボン酸(TCA)経路に関与する代謝物の定量化レベル。コハク酸、フマル酸、リンゴ酸の3種類のTCA代謝物のレベルは、健常対照サンプルと比較して、S0サンプル(フマル酸についてはSIII/IVサンプル)で有意に高かった(P < 0.005; 片側Mann-Whitney U検定)(++, P < 0.005; ++, P < 0.01; +, P < 0.05)。早期大腸がん患者の糞便中には、2-オキソグルタル酸など他のTCA中間体の濃度が極めて低いにもかかわらず、コハク酸、フマル酸、リンゴ酸が蓄積されている原因は不明である。一部の細菌では、コハク酸脱水素酵素の逆反応を利用してATPを合成し、副産物としてコハク酸を生成することが知られている。これは、分子状酸素ではなくフマル酸を電子受容体とするフマル酸呼吸の一部である。ボックスは25-75%線、黒線は中央値、ウィスカは四分位範囲の1.5倍以内の最大値と最小値に伸び、点は外れ値を示す。濃度はy軸(nmol g-1)で示した。健常者(n = 127)、MP(n = 45)、S0(n = 30)、SI/II(n = 80)、SIII/IV(n = 68)。N.Dは「not detected and/or not determined」を表す。 b, 図3bから省略した代謝タイプのパスウェイモジュール。パスウェイモジュールは、KEGGパスウェイマップの「アラニン、アスパラギン酸、グルタミン酸の代謝」、「システイン、メチオニンの代謝」、「メタンの代謝」、「アルギニン、プロリンの代謝」を改良したものである。「ロイシン分解」は、細菌のマップがKEGGに存在しないため、Clostridium difficileのロイシン代謝に基づいて構築した。各KO遺伝子について、棒グラフは、左から順に、健常者(n=251)、MP(n=67)、S0(n=73)、SI/II(n=111)、SIII/IV(n=74)の5つのグループ内の各サンプルで平均したKO遺伝子の存在量を示し、値の順番に応じて色分けしている。それぞれのKO遺伝子は、円で表された生物の遺伝子で構成されている。丸の大きさと色は、生物遺伝子の相対的な存在量に比例する。生物の遺伝子は1列にまとめられ、生物名で示されている。健常対照者に最も多く存在する3つの生物は、3文字のコードで示した(例えば、ovaはOscillibacter valericigenes、kpeはKlebsiella pneumoniae 342)。各経路のドットは中間代謝物を表す。経路成分のボックスの色は、健常対照者と比較して、いずれかのステージ(MP、S0、SI/II、SIII/IV)で有意な上昇(P < 0.005; 片側Mann-Whitney U検定)があったものを赤で示している。
図13 早期(S0)及び進行(SIII/IV)CRCの診断マーカーとしてのメタゲノム及びメタボロームの可能性。a, LASSOロジスティック回帰モデル及びランダムフォレストモデルの性能評価としてのROC曲線であり、S0(左2つのパネル)及びSIII/IV(右2つのパネル)のCRC患者から採取したサンプルを健康な対照群のサンプルと区別するためのものである。モデルは、生物種(赤)、KO遺伝子(青)、代謝物(黒)のそれぞれに基づいて、あるいはこれら3つの特徴の組み合わせ(緑)に基づいて設計された。S0の分類では、種ベースのモデルでは29種、KO遺伝子ベースのモデルでは16種、代謝物ベースのモデルでは24種を使用した。SIII/IVの分類では、種ベースのモデルでは55種、KO遺伝子ベースのモデルでは5種、代謝物ベースのモデルでは62種を使用した。組み合わせモデルでは、種、KO遺伝子、代謝物の特徴を個々のモデルから選択した。分類精度は、無作為化した10回のクロスバリデーションテストを用いて、AUCで評価した。LASSOロジスティック回帰モデルでは、存在量のしきい値を満たすすべての特徴を用いて、個別モデルと組み合わせモデルの両方を構築した。全ての特徴中の識別特徴を示している。b, S0(n = 27)及びSIII/IV(n = 54)の症例を健常対照者(n = 127)から区別するために、LASSOロジスティック回帰分類器及びランダムフォレスト分類器から同定された識別特徴。ボックスプロットの色は、健常対照群と比較して、各群での有意な増加(赤)及び減少(水色)を示す(P < 0.005;片側Mann-Whitney U検定)。濃い灰色のボックスは、統計的に有意でない特徴を示す。x軸は、各テストにおける特徴のモデルへの寄与率を示す(「方法」を参照)。ボックスは25-75%線、黒線は中央値、ウィスカは四分位範囲の1.5×以内の最大値と最小値に伸び、点は外れ値を示す。c, メタゲノム及びメタボローム分類法に影響を与える可能性のある交絡因子の分析。年齢、性別、BMI、喫煙、アルコール暴露などの要因に対するAUCを分析した。喫煙とアルコールの値は、それぞれBrinkman indexとアルコール摂取量で示した。患者の性別とBrinkman indexが群間で有意に異なっていたが、ランダムフォレストモデルもロジスティック回帰モデルも高い精度を達成していなかった。
図14 食事の摂取量と腸内細菌叢との相関関係。これまでに食事摂取量との関係が報告されているFusobacterium spp.、Akkermansia muciniphila、硫化菌(B. wadsworthia、Pyramidobacter piscolens)について、食物繊維(水溶性食物繊維、不溶性食物繊維、総食物繊維)、食物タンパク質摂取量(タンパク質、肉類)、食物脂肪(脂質)、食物カルシウム(カルシウム)、乳製品の摂取量(牛乳)、エネルギー摂取量(エネルギー)とのSpearmanの相関係数を調べた。+++, P < 0.005での相関; +, P < 0.05での相関。食事のデータがないサンプルは、相関係数の計算から除外した。健康, n = 242、MP, n = 67、S0, n = 72、SI/II, n = 109、SIII/IV, n = 71。
〔参考文献〕
1. Brenner, H., Kloor, M. & Pox, C. P. Colorectal cancer. Lancet 383, 1490-1502 (2014).
2. Fearon, E. R. & Vogelstein, B. A genetic model for colorectal tumorigenesis. Cell 61, 759-767 (1990).
3. Jones, S. et al. Comparative lesion sequencing provides insights into tumor evolution. Proc. Natl Acad. Sci. USA 105, 4283-4288 (2008).
4. Ashktorab, H., Kupfer, S. S., Brim, H. & Carethers, J. M. Racial disparity in gastrointestinal cancer risk. Gastroenterology 153, 910-923 (2017).
5. Zeller, G. et al. Potential of fecal microbiota for early-stage detection of colorectal cancer. Mol. Syst. Biol. 10, 766 (2014).
6. Castellarin, M. et al. Fusobacterium nucleatum infection is prevalent in human colorectal carcinoma. Genome Res. 22, 299-306 (2012).
7. Kostic, A. D. et al. Genomic analysis identifies association of Fusobacterium with colorectal carcinoma. Genome Res. 22, 292-298 (2012).
8. Yang, Y. et al. Fusobacterium nucleatum increases proliferation of colorectal cancer cells and tumor development in mice by activating Toll-like receptor 4 signaling to nuclear factor-kB, and up-regulating expression of microRNA-21. Gastroenterology 152, 851-866 (2017).
9. Louis, P., Hold, G. L. & Flint, H. J. The gut microbiota, bacterial metabolites and colorectal cancer. Nat. Rev. Microbiol. 12, 661-672 (2014).
10. Hirayama, A. et al. Quantitative metabolome profiling of colon and stomach cancer microenvironment by capillary electrophoresis time-of-flight mass spectrometry. Cancer Res. 69, 4918-4925 (2009).
11. Liao, M. et al. Comparative analyses of fecal microbiota in Chinese isolated Yao population, minority Zhuang and rural Han by 16sRNA sequencing. Sci. Rep. 8, 1142 (2018).
12. Arumugam, M. et al. Enterotypes of the human gut microbiome. Nature 473, 174-180 (2011).
13. Ding, T. & Schloss, P. D. Dynamics and associations of microbial community types across the human body. Nature 509, 357-360 (2014).
14. Wong, J. M., de Souza, R., Kendall, C. W., Emam, A. & Jenkins, D. J. Colonic health: fermentation and short chain fatty acids. J. Clin. Gastroenterol. 40, 235-243 (2006).
15. Emiola, A. & Oh, J. High throughput in situ metagenomic measurement of bacterial replication at ultra-low sequencing coverage. Nat. Commun. 9, 4956 (2018).
16. Brestoff, J. R. & Artis, D. Commensal bacteria at the interface of host metabolism and the immune system. Nat. Immunol. 14, 676-684 (2013).
17. Zarling, E. J. & Ruchim, M. A. Protein origin of the volatile fatty acids isobutyrate and isovalerate in human stool. J. Lab. Clin. Med. 109, 566-570 (1987).
18. Devkota, S. et al. Dietary-fat-induced taurocholic acid promotes pathobiont expansion and colitis in Il10-/- mice. Nature 487, 104-108 (2012).
19. Mottawea, W. et al. Altered intestinal microbiota-host mitochondria crosstalk in new onset Crohn’s disease. Nat. Commun. 7, 13419 (2016).
20. Xu, H. et al. Isoleucine biosynthesis in Leptospira interrogans serotype lai strain 56601 proceeds via a threonine-independent pathway. J. Bacteriol. 186, 5400-5409 (2004).
21. Bui, T. P. et al. Production of butyrate from lysine and the Amadori product fructoselysine by a human gut commensal. Nat. Commun. 6, 10062 (2015).
22. Prieto, M. A., Diaz, E. & Garcia, J. L. Molecular characterization of the 4-hydroxyphenylacetate catabolic pathway of Escherichia coli W: engineering a mobile aromatic degradative cluster. J. Bacteriol. 178, 111-120 (1996).
23. Teufel, R. et al. Bacterial phenylalanine and phenylacetate catabolic pathway revealed. Proc. Natl Acad. Sci. USA 107, 14390-14395 (2010).
24. Russell, W. R. et al. High-protein, reduced-carbohydrate weight-loss diets promote metabolite profiles likely to be detrimental to colonic health. Am. J. Clin. Nutr. 93, 1062-1072 (2011).
25. Russell, W. R. et al. Major phenylpropanoid-derived metabolites in the human gut can arise from microbial fermentation of protein. Mol. Nutr. Food Res. 57, 523-535 (2013).
26. Windey, K., De Preter, V. & Verbeke, K. Relevance of protein fermentation to gut health. Mol. Nutr. Food Res. 56, 184-196 (2012).
27. Attene-Ramos, M. S., Wagner, E. D., Plewa, M. J. & Gaskins, H. R. Evidence that hydrogen sulfide is a genotoxic agent. Mol. Cancer Res. 4, 9-14 (2006).
28. Loubinoux, J., Bisson-Boutelliez, C., Miller, N. & Le Faou, A. E. Isolation of the provisionally named Desulfovibrio fairfieldensis from human periodontal pockets. Oral Microbiol. Immunol. 17, 321-323 (2002).
29. Feng, Q. et al. Gut microbiome development along the colorectal adenoma- carcinoma sequence. Nat. Commun. 6, 6528 (2015).
30. Yu, J. et al. Metagenomic analysis of faecal microbiome as a tool towards targeted non-invasive biomarkers for colorectal cancer. Gut 66, 70-78 (2017).
31. Bullman, S. et al. Analysis of Fusobacterium persistence and antibiotic response in colorectal cancer. Science 358, 1443-1448 (2017).
32. Carbonero, F., Benefiel, A. C., Alizadeh-Ghamsari, A. H. & Gaskins, H. R. Microbial pathways in colonic sulfur metabolism and links with health and disease. Front. Physiol. 3, 448 (2012).
33. Kononen, E. & Wade, W. G. Actinomyces and related organisms in human infections. Clin. Microbiol. Rev. 28, 419-442 (2015).
34. Kasai, C. et al. Comparison of human gut microbiota in control subjects and patients with colorectal carcinoma in adenoma: terminal restriction fragment length polymorphism and next-generation sequencing analyses. Oncol. Rep. 35, 325-333 (2016).
35. Bernstein, H., Bernstein, C., Payne, C. M. & Dvorak, K. Bile acids as endogenous etiologic agents in gastrointestinal cancer. World J. Gastroenterol. 15, 3329-3340 (2009).
36. Suzuki, K. & Bruce, W. R. Increase by deoxycholic acid of the colonic nuclear damage induced by known carcinogens in C57BL/6J mice. J. Natl Cancer Inst. 76, 1129-1132 (1986).
37. Vandeputte, D. et al. Quantitative microbiome profiling links gut community variation to microbial load. Nature 551, 507-511 (2017).
38. Tahara, T. et al. Fusobacterium in colonic flora and molecular features of colorectal carcinoma. Cancer Res. 74, 1311-1318 (2014).
39. Ito, M. et al. Association of Fusobacterium nucleatum with clinical and molecular features in colorectal serrated pathway. Int J. Cancer 137, 1258-1268 (2015).
40. Mima, K. et al. Fusobacterium nucleatum in colorectal carcinoma tissue and patient prognosis. Gut 65, 1973-1980 (2016).
41. Nishimoto, Y. et al. High stability of faecal microbiome composition in guanidine thiocyanate solution at room temperature and robustness during colonoscopy. Gut 65, 1574-1575 (2016).
42. Tsugane, S. & Sawada, N. The JPHC study: design and some findings on the typical Japanese diet. Jpn J. Clin. Oncol. 44, 777-782 (2014).
43. Furet, J. P. et al. Comparative assessment of human and farm animal faecal microbiota using real-time quantitative PCR. FEMS Microbiol. Ecol. 68, 351-362 (2009).
44. Langmead, B. & Salzberg, S. L. Fast gapped-read alignment with Bowtie 2. Nat. Methods 9, 357-359 (2012).
45. Martin, M. Cutadapt removes adapter sequences from high-throughput sequencing reads. EMBnet J. 17, 10 (2011).
46. Mori, H., Maruyama, T., Yano, M., Yamada, T. & Kurokawa, K. VITCOMIC2: visualization tool for the phylogenetic composition of microbial communities based on 16S rRNA gene amplicons and metagenomic shotgun sequencing. BMC Syst. Biol. 12, 30 (2018).
47. Camacho, C. et al. BLAST+: architecture and applications. BMC Bioinformatics 10, 421 (2009).
48. Yarza, P. et al. Update of the All-Species Living Tree Project based on 16S and 23S rRNA sequence analyses. Syst. Appl. Microbiol. 33, 291-299 (2010).
49. Yarza, P. et al. Uniting the classification of cultured and uncultured bacteria and archaea using 16S rRNA gene sequences. Nat. Rev. Microbiol. 12, 635-645 (2014).
50. Sunagawa, S. et al. Metagenomic species profiling using universal phylogenetic marker genes. Nat. Methods 10, 1196-1199 (2013).
51. Truong, D. T. et al. MetaPhlAn2 for enhanced metagenomic taxonomic profiling. Nat. Methods 12, 902-903 (2015).
52. Holmes, I., Harris, K. & Quince, C. Dirichlet multinomial mixtures: generative models for microbial metagenomics. PLoS ONE 7, e30126 (2012).
53. Asnicar, F., Weingart, G., Tickle, T. L., Huttenhower, C. & Segata, N. Compact graphical representation of phylogenetic data and metadata with GraPhlAn. PeerJ 3, e1029 (2015).
54. Peng, Y., Leung, H. C., Yiu, S. M. & Chin, F. Y. IDBA-UD: a de novo assembler for single-cell and metagenomic sequencing data with highly uneven depth. Bioinformatics 28, 1420-1428 (2012).
55. Besemer, J. & Borodovsky, M. Heuristic approach to deriving models for gene finding. Nucleic Acids Res. 27, 3911-3920 (1999).
56. Kanehisa, M. & Goto, S. KEGG: Kyoto Encyclopedia of Genes and Genomes. Nucleic Acids Res. 28, 27-30 (2000).
57. Soga, T. et al. Quantitative metabolome analysis using capillary electrophoresis mass spectrometry. J. Proteome Res. 2, 488-494 (2003).
58. Mishima, E. et al. Evaluation of the impact of gut microbiota on uremic solute accumulation by a CE-TOFMS-based metabolomics approach. Kidney Int. 92, 634-645 (2017).
59. Tibshirani, R. Regression shrinkage and selection via the LASSO. J. R. Stat. Soc. B 58, 267-288 (1996).
60. Pedregosa, F. et al. Scikit-learn: machine learning in Python. J. Mach. Learn. Res. 12, 2825-2830 (2011).
1. Brenner, H., Kloor, M. & Pox, C. P. Colorectal cancer. Lancet 383, 1490-1502 (2014).
2. Fearon, E. R. & Vogelstein, B. A genetic model for colorectal tumorigenesis. Cell 61, 759-767 (1990).
3. Jones, S. et al. Comparative lesion sequencing provides insights into tumor evolution. Proc. Natl Acad. Sci. USA 105, 4283-4288 (2008).
4. Ashktorab, H., Kupfer, S. S., Brim, H. & Carethers, J. M. Racial disparity in gastrointestinal cancer risk. Gastroenterology 153, 910-923 (2017).
5. Zeller, G. et al. Potential of fecal microbiota for early-stage detection of colorectal cancer. Mol. Syst. Biol. 10, 766 (2014).
6. Castellarin, M. et al. Fusobacterium nucleatum infection is prevalent in human colorectal carcinoma. Genome Res. 22, 299-306 (2012).
7. Kostic, A. D. et al. Genomic analysis identifies association of Fusobacterium with colorectal carcinoma. Genome Res. 22, 292-298 (2012).
8. Yang, Y. et al. Fusobacterium nucleatum increases proliferation of colorectal cancer cells and tumor development in mice by activating Toll-like receptor 4 signaling to nuclear factor-kB, and up-regulating expression of microRNA-21. Gastroenterology 152, 851-866 (2017).
9. Louis, P., Hold, G. L. & Flint, H. J. The gut microbiota, bacterial metabolites and colorectal cancer. Nat. Rev. Microbiol. 12, 661-672 (2014).
10. Hirayama, A. et al. Quantitative metabolome profiling of colon and stomach cancer microenvironment by capillary electrophoresis time-of-flight mass spectrometry. Cancer Res. 69, 4918-4925 (2009).
11. Liao, M. et al. Comparative analyses of fecal microbiota in Chinese isolated Yao population, minority Zhuang and rural Han by 16sRNA sequencing. Sci. Rep. 8, 1142 (2018).
12. Arumugam, M. et al. Enterotypes of the human gut microbiome. Nature 473, 174-180 (2011).
13. Ding, T. & Schloss, P. D. Dynamics and associations of microbial community types across the human body. Nature 509, 357-360 (2014).
14. Wong, J. M., de Souza, R., Kendall, C. W., Emam, A. & Jenkins, D. J. Colonic health: fermentation and short chain fatty acids. J. Clin. Gastroenterol. 40, 235-243 (2006).
15. Emiola, A. & Oh, J. High throughput in situ metagenomic measurement of bacterial replication at ultra-low sequencing coverage. Nat. Commun. 9, 4956 (2018).
16. Brestoff, J. R. & Artis, D. Commensal bacteria at the interface of host metabolism and the immune system. Nat. Immunol. 14, 676-684 (2013).
17. Zarling, E. J. & Ruchim, M. A. Protein origin of the volatile fatty acids isobutyrate and isovalerate in human stool. J. Lab. Clin. Med. 109, 566-570 (1987).
18. Devkota, S. et al. Dietary-fat-induced taurocholic acid promotes pathobiont expansion and colitis in Il10-/- mice. Nature 487, 104-108 (2012).
19. Mottawea, W. et al. Altered intestinal microbiota-host mitochondria crosstalk in new onset Crohn’s disease. Nat. Commun. 7, 13419 (2016).
20. Xu, H. et al. Isoleucine biosynthesis in Leptospira interrogans serotype lai strain 56601 proceeds via a threonine-independent pathway. J. Bacteriol. 186, 5400-5409 (2004).
21. Bui, T. P. et al. Production of butyrate from lysine and the Amadori product fructoselysine by a human gut commensal. Nat. Commun. 6, 10062 (2015).
22. Prieto, M. A., Diaz, E. & Garcia, J. L. Molecular characterization of the 4-hydroxyphenylacetate catabolic pathway of Escherichia coli W: engineering a mobile aromatic degradative cluster. J. Bacteriol. 178, 111-120 (1996).
23. Teufel, R. et al. Bacterial phenylalanine and phenylacetate catabolic pathway revealed. Proc. Natl Acad. Sci. USA 107, 14390-14395 (2010).
24. Russell, W. R. et al. High-protein, reduced-carbohydrate weight-loss diets promote metabolite profiles likely to be detrimental to colonic health. Am. J. Clin. Nutr. 93, 1062-1072 (2011).
25. Russell, W. R. et al. Major phenylpropanoid-derived metabolites in the human gut can arise from microbial fermentation of protein. Mol. Nutr. Food Res. 57, 523-535 (2013).
26. Windey, K., De Preter, V. & Verbeke, K. Relevance of protein fermentation to gut health. Mol. Nutr. Food Res. 56, 184-196 (2012).
27. Attene-Ramos, M. S., Wagner, E. D., Plewa, M. J. & Gaskins, H. R. Evidence that hydrogen sulfide is a genotoxic agent. Mol. Cancer Res. 4, 9-14 (2006).
28. Loubinoux, J., Bisson-Boutelliez, C., Miller, N. & Le Faou, A. E. Isolation of the provisionally named Desulfovibrio fairfieldensis from human periodontal pockets. Oral Microbiol. Immunol. 17, 321-323 (2002).
29. Feng, Q. et al. Gut microbiome development along the colorectal adenoma- carcinoma sequence. Nat. Commun. 6, 6528 (2015).
30. Yu, J. et al. Metagenomic analysis of faecal microbiome as a tool towards targeted non-invasive biomarkers for colorectal cancer. Gut 66, 70-78 (2017).
31. Bullman, S. et al. Analysis of Fusobacterium persistence and antibiotic response in colorectal cancer. Science 358, 1443-1448 (2017).
32. Carbonero, F., Benefiel, A. C., Alizadeh-Ghamsari, A. H. & Gaskins, H. R. Microbial pathways in colonic sulfur metabolism and links with health and disease. Front. Physiol. 3, 448 (2012).
33. Kononen, E. & Wade, W. G. Actinomyces and related organisms in human infections. Clin. Microbiol. Rev. 28, 419-442 (2015).
34. Kasai, C. et al. Comparison of human gut microbiota in control subjects and patients with colorectal carcinoma in adenoma: terminal restriction fragment length polymorphism and next-generation sequencing analyses. Oncol. Rep. 35, 325-333 (2016).
35. Bernstein, H., Bernstein, C., Payne, C. M. & Dvorak, K. Bile acids as endogenous etiologic agents in gastrointestinal cancer. World J. Gastroenterol. 15, 3329-3340 (2009).
36. Suzuki, K. & Bruce, W. R. Increase by deoxycholic acid of the colonic nuclear damage induced by known carcinogens in C57BL/6J mice. J. Natl Cancer Inst. 76, 1129-1132 (1986).
37. Vandeputte, D. et al. Quantitative microbiome profiling links gut community variation to microbial load. Nature 551, 507-511 (2017).
38. Tahara, T. et al. Fusobacterium in colonic flora and molecular features of colorectal carcinoma. Cancer Res. 74, 1311-1318 (2014).
39. Ito, M. et al. Association of Fusobacterium nucleatum with clinical and molecular features in colorectal serrated pathway. Int J. Cancer 137, 1258-1268 (2015).
40. Mima, K. et al. Fusobacterium nucleatum in colorectal carcinoma tissue and patient prognosis. Gut 65, 1973-1980 (2016).
41. Nishimoto, Y. et al. High stability of faecal microbiome composition in guanidine thiocyanate solution at room temperature and robustness during colonoscopy. Gut 65, 1574-1575 (2016).
42. Tsugane, S. & Sawada, N. The JPHC study: design and some findings on the typical Japanese diet. Jpn J. Clin. Oncol. 44, 777-782 (2014).
43. Furet, J. P. et al. Comparative assessment of human and farm animal faecal microbiota using real-time quantitative PCR. FEMS Microbiol. Ecol. 68, 351-362 (2009).
44. Langmead, B. & Salzberg, S. L. Fast gapped-read alignment with Bowtie 2. Nat. Methods 9, 357-359 (2012).
45. Martin, M. Cutadapt removes adapter sequences from high-throughput sequencing reads. EMBnet J. 17, 10 (2011).
46. Mori, H., Maruyama, T., Yano, M., Yamada, T. & Kurokawa, K. VITCOMIC2: visualization tool for the phylogenetic composition of microbial communities based on 16S rRNA gene amplicons and metagenomic shotgun sequencing. BMC Syst. Biol. 12, 30 (2018).
47. Camacho, C. et al. BLAST+: architecture and applications. BMC Bioinformatics 10, 421 (2009).
48. Yarza, P. et al. Update of the All-Species Living Tree Project based on 16S and 23S rRNA sequence analyses. Syst. Appl. Microbiol. 33, 291-299 (2010).
49. Yarza, P. et al. Uniting the classification of cultured and uncultured bacteria and archaea using 16S rRNA gene sequences. Nat. Rev. Microbiol. 12, 635-645 (2014).
50. Sunagawa, S. et al. Metagenomic species profiling using universal phylogenetic marker genes. Nat. Methods 10, 1196-1199 (2013).
51. Truong, D. T. et al. MetaPhlAn2 for enhanced metagenomic taxonomic profiling. Nat. Methods 12, 902-903 (2015).
52. Holmes, I., Harris, K. & Quince, C. Dirichlet multinomial mixtures: generative models for microbial metagenomics. PLoS ONE 7, e30126 (2012).
53. Asnicar, F., Weingart, G., Tickle, T. L., Huttenhower, C. & Segata, N. Compact graphical representation of phylogenetic data and metadata with GraPhlAn. PeerJ 3, e1029 (2015).
54. Peng, Y., Leung, H. C., Yiu, S. M. & Chin, F. Y. IDBA-UD: a de novo assembler for single-cell and metagenomic sequencing data with highly uneven depth. Bioinformatics 28, 1420-1428 (2012).
55. Besemer, J. & Borodovsky, M. Heuristic approach to deriving models for gene finding. Nucleic Acids Res. 27, 3911-3920 (1999).
56. Kanehisa, M. & Goto, S. KEGG: Kyoto Encyclopedia of Genes and Genomes. Nucleic Acids Res. 28, 27-30 (2000).
57. Soga, T. et al. Quantitative metabolome analysis using capillary electrophoresis mass spectrometry. J. Proteome Res. 2, 488-494 (2003).
58. Mishima, E. et al. Evaluation of the impact of gut microbiota on uremic solute accumulation by a CE-TOFMS-based metabolomics approach. Kidney Int. 92, 634-645 (2017).
59. Tibshirani, R. Regression shrinkage and selection via the LASSO. J. R. Stat. Soc. B 58, 267-288 (1996).
60. Pedregosa, F. et al. Scikit-learn: machine learning in Python. J. Mach. Learn. Res. 12, 2825-2830 (2011).
本明細書で引用した全ての刊行物、特許および特許出願をそのまま参考として本明細書にとり入れるものとする。
本発明は、大腸腫瘍の検出に関連する産業分野において利用可能である。
Claims (7)
- 以下の(1)~(3)の工程を含むことを特徴とする大腸腫瘍の検出方法、
(1)被験者の糞便中における微生物の量を測定する工程であって、微生物がアクチノマイセス・オドントリティカス(Actinomyces odontolyticus)、ファスコラークトバクテリウム・スクシナテュテンス(Phascolarctobacterium succinatutens)、アクチノマイセス・ビスコーズス(Actinomyces viscosus)、デスルホビブリオ・ロングリーチェンシス(Desulfovibrio longreachensis)、サロバクテリウム・ムーレイ(Solobacterium moorei)、ポルフィロモナス・ウエノニス(Porphyromonas uenonis)、コリンゼラ・アエロファシエンス(Colinsella aerofaciens)、デスルホビブリオ・ベトナムエンシス(Desulfovibrio vietnamensis)、ペプトストレプトコッカス・ストマティス(Peptostreptococcus stomatis)、ラクトバチルス・サンフランシセンシス(Lactobacillus sanfranciscensis)、パルビモナス・マイクラ(Parvimonas micra)、ゲメラ・モルビロルム(Gemella morbillorum)、セレノモナス・スプチゲナ(Selenomonas sputigena)、ビフィドバクテリウム・ロンガム(Bifidobacterium longum) subsp.longum、ユウバクテリウム・エリゲンス(Eubacterium eligens)、及びラクノスピラ・マルチパラ(Lachnospira multipara)からなる群から選ばれる少なくとも1種の微生物である工程、
(2)工程(1)で測定した値を健常者の糞便中の対応値と比較する工程、
(3)工程(2)の比較の結果、工程(1)で測定した値がアクチノマイセス・オドントリティカス(Actinomyces odontolyticus)、ファスコラークトバクテリウム・スクシナテュテンス(Phascolarctobacterium succinatutens)、アクチノマイセス・ビスコーズス(Actinomyces viscosus)、デスルホビブリオ・ロングリーチェンシス(Desulfovibrio longreachensis)、サロバクテリウム・ムーレイ(Solobacterium moorei)、ポルフィロモナス・ウエノニス(Porphyromonas uenonis)、コリンゼラ・アエロファシエンス(Colinsella aerofaciens)、デスルホビブリオ・ベトナムエンシス(Desulfovibrio vietnamensis)、ペプトストレプトコッカス・ストマティス(Peptostreptococcus stomatis)、ラクトバチルス・サンフランシセンシス(Lactobacillus sanfranciscensis)、パルビモナス・マイクラ(Parvimonas micra)、ゲメラ・モルビロルム(Gemella morbillorum)、又はセレノモナス・スプチゲナ(Selenomonas sputigena)の量である場合はその値が健常者の糞便中の対応値よりも高いときに被験者を大腸腫瘍であると判定し、工程(1)で測定した値がビフィドバクテリウム・ロンガム(Bifidobacterium longum) subsp.longum、ユウバクテリウム・エリゲンス(Eubacterium eligens)、又はラクノスピラ・マルチパラ(Lachnospira multipara)の量である場合はその値が健常者の糞便中の対応値よりも低いときに被験者を大腸腫瘍であると判定する工程。 - 工程(1)において微生物が、アクチノマイセス・オドントリティカス(Actinomyces odontolyticus)、ファスコラークトバクテリウム・スクシナテュテンス(Phascolarctobacterium succinatutens)、アクチノマイセス・ビスコーズス(Actinomyces viscosus)、及びデスルホビブリオ・ロングリーチェンシス(Desulfovibrio longreachensis)からなる群から選ばれる少なくとも1種の微生物であり、工程(3)において工程(1)で測定した値が健常者の糞便中の対応値よりも高いときに被験者を大腸腫瘍であると判定することを特徴とする請求項1に記載の大腸腫瘍の検出方法。
- 工程(1)において微生物が、アクチノマイセス・オドントリティカス(Actinomyces odontolyticus)であり、工程(3)において工程(1)で測定した値が健常者の糞便中の対応値よりも高いときに被験者を大腸腫瘍であると判定することを特徴とする請求項1に記載の大腸腫瘍の検出方法。
- 更に以下の(a-1)~(a-3)の工程を含むことを特徴とする請求項1乃至3のいずれか一項に記載の大腸腫瘍の検出方法、
(a-1)被験者の糞便中におけるアミノ酸の量を測定する工程であって、アミノ酸がイソロイシン、ロイシン、バリン、フェニルアラニン、チロシン、グリシン、及びセリンからなる群から選ばれる少なくとも1種のアミノ酸である工程、
(a-2)工程(a-1)で測定した値を健常者の糞便中の対応値と比較する工程、
(a-3)工程(a-2)の比較の結果、工程(a-1)で測定した値が健常者の糞便中の対応値よりも高いときに被験者を大腸腫瘍であると判定する工程。 - 更に以下の(b-1)~(b-3)の工程を含むことを特徴とする請求項1乃至3のいずれか一項に記載の大腸腫瘍の検出方法、
(b-1)被験者の糞便中における有機酸の量を測定する工程であって、有機酸がコハク酸、フマル酸、リンゴ酸、及びイソ吉草酸からなる群から選ばれる少なくとも1種の有機酸である工程、
(b-2)工程(b-1)で測定した値を健常者の糞便中の対応値と比較する工程、
(b-3)工程(b-2)の比較の結果、工程(b-1)で測定した値が健常者の糞便中の対応値よりも高いときに被験者を大腸腫瘍であると判定する工程。 - 更に以下の(c-1)~(c-3)の工程を含むことを特徴とする請求項1乃至3のいずれか一項に記載の大腸腫瘍の検出方法、
(c-1)被験者の糞便中における胆汁酸の量を測定する工程であって、胆汁酸がデオキシコール酸、グリココール酸、及びタウロコール酸からなる群から選ばれる少なくとも1種の胆汁酸である工程、
(c-2)工程(c-1)で測定した値を健常者の糞便中の対応値と比較する工程、
(c-3)工程(c-2)の比較の結果、工程(c-1)で測定した値が健常者の糞便中の対応値よりも高いときに被験者を大腸腫瘍であると判定する工程。 - 大腸腫瘍が、腺腫又は粘膜内がんであることを特徴とする請求項1乃至6のいずれか一項に記載の大腸腫瘍の検出方法。
Priority Applications (1)
| Application Number | Priority Date | Filing Date | Title |
|---|---|---|---|
| JP2022528924A JP7854661B2 (ja) | 2020-06-05 | 2021-06-07 | 大腸腫瘍の検出方法 |
Applications Claiming Priority (2)
| Application Number | Priority Date | Filing Date | Title |
|---|---|---|---|
| JP2020098956 | 2020-06-05 | ||
| JP2020-098956 | 2020-06-05 |
Publications (1)
| Publication Number | Publication Date |
|---|---|
| WO2021246533A1 true WO2021246533A1 (ja) | 2021-12-09 |
Family
ID=78830295
Family Applications (1)
| Application Number | Title | Priority Date | Filing Date |
|---|---|---|---|
| PCT/JP2021/021647 Ceased WO2021246533A1 (ja) | 2020-06-05 | 2021-06-07 | 大腸腫瘍の検出方法 |
Country Status (1)
| Country | Link |
|---|---|
| WO (1) | WO2021246533A1 (ja) |
-
2021
- 2021-06-07 WO PCT/JP2021/021647 patent/WO2021246533A1/ja not_active Ceased
Non-Patent Citations (2)
| Title |
|---|
| MIZUTANI SAYAKA, YAMADA TAKUJI, YACHIDA SHINICHI: "Significance of the gut microbiome in multistep colorectal carcinogenesis", CANCER SCIENCE, vol. 111, no. 3, 7 January 2020 (2020-01-07), pages 766 - 773, XP055879621 * |
| YACHIDA, S. ET AL.: "Metagenomic and metabolomic analyses reveal distinct stage-specific phenotypes of the gut microbiota in colorectal cancer", NATURE MEDICINE, vol. 25, 2019, pages 968 - 976, XP036901080, DOI: 10.1038/s41591-019-0458-7 * |
Also Published As
| Publication number | Publication date |
|---|---|
| JPWO2021246533A1 (ja) | 2021-12-09 |
Similar Documents
| Publication | Publication Date | Title |
|---|---|---|
| Yachida et al. | Metagenomic and metabolomic analyses reveal distinct stage-specific phenotypes of the gut microbiota in colorectal cancer | |
| Piccinno et al. | Pooled analysis of 3,741 stool metagenomes from 18 cohorts for cross-stage and strain-level reproducible microbial biomarkers of colorectal cancer | |
| Zhang et al. | Human oral microbiome dysbiosis as a novel non-invasive biomarker in detection of colorectal cancer | |
| Park et al. | Dysbiotic change in gastric microbiome and its functional implication in gastric carcinogenesis | |
| Li et al. | Signatures within esophageal microbiota with progression of esophageal squamous cell carcinoma | |
| Thomas et al. | Metagenomic analysis of colorectal cancer datasets identifies cross-cohort microbial diagnostic signatures and a link with choline degradation | |
| Coker et al. | Altered gut archaea composition and interaction with bacteria are associated with colorectal cancer | |
| Mukherjee et al. | Bacteriome and mycobiome associations in oral tongue cancer | |
| Lopetuso et al. | Esophageal microbiome signature in patients with Barrett’s esophagus and esophageal adenocarcinoma | |
| Senthakumaran et al. | Microbial dynamics with CRC progression: a study of the mucosal microbiota at multiple sites in cancers, adenomatous polyps, and healthy controls | |
| Liu et al. | Identification of colorectal cancer progression-associated intestinal microbiome and predictive signature construction | |
| Smith et al. | Experimentally derived metastasis gene expression profile predicts recurrence and death in patients with colon cancer | |
| Wang et al. | A preliminary study of microbiota diversity in saliva and bronchoalveolar lavage fluid from patients with primary bronchogenic carcinoma | |
| Russo et al. | From adenoma to CRC stages: the oral-gut microbiome axis as a source of potential microbial and metabolic biomarkers of malignancy | |
| Tang et al. | Prospective study reveals a microbiome signature that predicts the occurrence of post-operative enterocolitis in Hirschsprung disease (HSCR) patients | |
| Young et al. | Microbiome analysis of more than 2,000 NHS bowel cancer screening programme samples shows the potential to improve screening accuracy | |
| Zhu et al. | Convergent dysbiosis of upper aerodigestive microbiota between patients with esophageal and oral cavity squamous cell carcinoma | |
| Lan et al. | Compositional and functional changes in the salivary microbiota related to oral leukoplakia and oral squamous cell carcinoma: a case control study | |
| Nomburg et al. | An international report on bacterial communities in esophageal squamous cell carcinoma | |
| Hu et al. | Faecal microbiome and metabolic signatures in rectal neuroendocrine tumors | |
| Chen et al. | Characteristics of gastric cancer gut microbiome according to tumor stage and age segmentation | |
| Park et al. | Fecal microbiota changes with fermented kimchi intake regulated either formation or advancement of colon adenoma | |
| Ji et al. | Characterizing the oral and gastrointestinal microbiome associated with healthy aging: insights from long-lived populations in Northeastern China | |
| Cao et al. | Changes in Bacteroides and the microbiota in patients with obstructed colorectal cancer: retrospective cohort study | |
| Katona et al. | Microbiota and metabolite-based prediction tool for colonic polyposis with and without a known genetic driver |
Legal Events
| Date | Code | Title | Description |
|---|---|---|---|
| 121 | Ep: the epo has been informed by wipo that ep was designated in this application |
Ref document number: 21818601 Country of ref document: EP Kind code of ref document: A1 |
|
| ENP | Entry into the national phase |
Ref document number: 2022528924 Country of ref document: JP Kind code of ref document: A |
|
| NENP | Non-entry into the national phase |
Ref country code: DE |
|
| 122 | Ep: pct application non-entry in european phase |
Ref document number: 21818601 Country of ref document: EP Kind code of ref document: A1 |