WO2021156957A1 - 監視装置及び監視方法 - Google Patents
監視装置及び監視方法 Download PDFInfo
- Publication number
- WO2021156957A1 WO2021156957A1 PCT/JP2020/004235 JP2020004235W WO2021156957A1 WO 2021156957 A1 WO2021156957 A1 WO 2021156957A1 JP 2020004235 W JP2020004235 W JP 2020004235W WO 2021156957 A1 WO2021156957 A1 WO 2021156957A1
- Authority
- WO
- WIPO (PCT)
- Prior art keywords
- sound
- rotation speed
- abnormality
- monitoring
- diagnosed
- Prior art date
- Legal status (The legal status is an assumption and is not a legal conclusion. Google has not performed a legal analysis and makes no representation as to the accuracy of the status listed.)
- Ceased
Links
Images


Classifications
-
- G—PHYSICS
- G01—MEASURING; TESTING
- G01M—TESTING STATIC OR DYNAMIC BALANCE OF MACHINES OR STRUCTURES; TESTING OF STRUCTURES OR APPARATUS, NOT OTHERWISE PROVIDED FOR
- G01M99/00—Subject matter not provided for in other groups of this subclass
Definitions
- This disclosure relates to a monitoring device and a monitoring method.
- the sound generated from the device is acquired by a microphone or the like, and the position and intensity of the sound source are specified based on the acquired acoustic data.
- Patent Document 1 describes that acoustic data of sound generated from a measurement object is acquired by a microphone array, and an acoustic map showing the relationship between the position and intensity of a sound source is generated from the acoustic data. Further, Patent Document 1 discloses an imaging device that displays the above-mentioned acoustic map in association with a reference image (camera image or the like) of a measurement object.
- the sound pressure level data acquired by a microphone or the like is a mixture of sounds from a plurality of devices, and therefore an acoustic map generated using the sound pressure level data. Becomes complicated. Therefore, it is difficult to efficiently monitor a plurality of devices using an acoustic map.
- At least one embodiment of the present invention aims to provide a monitoring device and a monitoring method capable of efficiently monitoring a plurality of devices.
- the monitoring device for monitoring multiple devices located in the monitored area.
- a sound collecting unit for collecting sound in the monitored area and
- An acoustic map generation unit for generating an acoustic map showing the relationship between the positions of a plurality of sound sources included in the monitored area and the sound pressure level of each sound source based on the sound collected by the sound collecting unit.
- An abnormality diagnosis unit configured to diagnose an abnormality in at least one of the plurality of devices to be diagnosed, and an abnormality diagnosis unit.
- the acoustic map generated by the acoustic map generation unit and the diagnosis result of the diagnosis target device by the abnormality diagnosis unit are received, and the diagnosis is made on the acoustic map in association with the position of the diagnosis target device on the acoustic map.
- a monitoring device and a monitoring method capable of efficiently monitoring a plurality of devices.
- FIG. 1 is a schematic diagram showing an example of equipment including a plurality of devices to be monitored by the monitoring devices according to some embodiments.
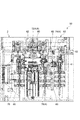
- FIG. 2 is a schematic view showing a rolling mill to be monitored in some embodiments.
- the equipment 1 includes a plurality of devices 4 arranged in the monitored area 2. Of the plurality of devices 4 arranged in the monitoring target area 2, one or more devices 4 are monitoring targets (diagnosis target devices 6) by the monitoring device described later.
- the equipment 1 may include other equipment (not shown) arranged outside the monitored area 2.
- the plurality of devices 4 may include a rotating machine.
- the rotating machine may be a motor.
- the plurality of devices 4 may include a rolling mill 10.
- the rolling mill 10 is a device for rolling the metal strip 9, and includes a motor 12, a gear 14, a spindle 16, and a rolling roll 18 driven by the motor 12.
- the rolling roll 18 is configured to roll the metal strip 9, and is a pair of work rolls 22A and 22B for sandwiching the metal strip 9 from above and below and applying a load to the metal strip 9, and a pair of workpieces.
- the metal strip 9 with the rolls 22A and 22B sandwiched therein includes a pair of intermediate rolls 24A and 24B and a pair of backup rolls 26A and 26B provided on opposite sides of the rolls 22A and 22B, respectively.
- the intermediate rolls 24A and 24B are provided between the work rolls 22A and 22B and the backup rolls 26A and 26B, respectively.
- the gear 14 is connected to the motor 12, and the spindle 16 is connected to the motor 12 via the gear 14. Further, the rolling roll 18 is connected to the motor 12 via a gear 14 and a spindle 16. That is, the power of the motor 12 is transmitted to the rolling roll 18 via the gear 14 and the spindle 16.
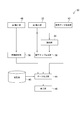
- the monitoring device 30 includes a first sound collecting unit 32 (“sound collecting unit” of the present invention), an acoustic map generation unit 36, an abnormality diagnosis unit 38, and a data generation unit 44. And have. Further, the monitoring device 30 shown in FIGS. 3 to 5 has a storage unit 40 for storing various information and a display unit 46 (described later) for displaying the monitoring image data (described later) generated by the data generation unit 44. Display etc.).
- the acoustic map generation unit 36, the abnormality diagnosis unit 38, and the data generation unit 44 may be configured by a computer including a processor, a memory (RAM), an auxiliary storage unit, an interface, and the like.
- the processing contents of the acoustic map generation unit 36, the abnormality diagnosis unit 38, and the data generation unit 44 may be implemented as a program executed by the processor and stored in the auxiliary storage unit. When the programs are executed, these programs are expanded in memory.
- the processor reads the program from the memory and executes the instructions contained in the program.
- the storage unit 40 is a device capable of storing and / or storing various types of data, and is a memory device such as a RAM (Random Access Memory) or a storage device such as an HDD (Hard Disk Drive) or an SSD (Solid State Drive). There may be.
- a RAM Random Access Memory
- HDD Hard Disk Drive
- SSD Solid State Drive
- the first sound collecting unit 32 is configured to collect the sound in the monitored area 2, that is, the sound generated by the plurality of devices 4 arranged in the monitored area 2. As shown in FIG. 1, the first sound collecting unit 32 is provided corresponding to the monitored area 2. That is, a plurality of first sound collecting units 32 are not provided so as to correspond to the plurality of devices 4.
- the first sound collecting unit 32 has a configuration that enables the acoustic map generation unit 36 to generate an acoustic map (described later).
- the first sound collecting unit 32 may be, for example, a microphone array in which a plurality of microphones are arranged.
- the microphone array may include one or more beams in which a plurality of microphones are arranged at linear intervals, or may include a plurality of microphones arranged in a grid pattern.
- the acoustic map generation unit 36 generates an acoustic map showing the relationship between the positions of a plurality of sound sources included in the monitored area 2 and the sound pressure of each sound source, based on the sound collected by the first sound collection unit 32. do. Since the plurality of sound sources in the monitored area 2 are a plurality of devices 4, it is possible to know the sound pressure generated in any of the plurality of devices 4 by referring to this acoustic map. can. However, since the acoustic map does not consider the position of each device 4 (that is, the position of each sound source and the position of each device 4 are not linked), the acoustic map is used to obtain a certain sound pressure.
- the sound pressure can also be expressed as a sound pressure level using the common logarithm of the ratio to the reference sound pressure (for example, 20 ⁇ Pa in the atmosphere), and the sound map can be expressed as the position of multiple sound sources and the sound pressure level of each sound source. It may be created as showing the relationship between.
- sound pressure levels will be used for description.
- the abnormality diagnosis unit 38 is configured to diagnose an abnormality in at least one of the plurality of devices 4 to be diagnosed. When a plurality of diagnostic target devices 6 are targeted for diagnosis, the abnormality diagnosis unit 38 may be provided for each diagnosis target device 6.
- the data generation unit 44 receives the acoustic map generated by the acoustic map generation unit 36 and the diagnosis result of the diagnosis target device 6 by the abnormality diagnosis unit 38, and associates the acoustic map with the position of the diagnosis target device 6 on the acoustic map. Generates surveillance image data with the diagnosis results superimposed on. For example, the data generation unit 44 associates the position of each sound source included in the acoustic map with the position of the diagnosis target device 6 on the acoustic map based on the association information that links the position of the diagnosis target device 6. It may be configured so that the diagnosis result of the device 6 to be diagnosed is superimposed on the acoustic map.
- the above-mentioned association information may be stored in the storage unit 40 in advance, and the data generation unit 44 may be configured to acquire the association information from the storage unit 40.
- the monitoring image data generated by the data generation unit 44 is sent to the display unit 46 (display or the like) and displayed by the display unit 46. From the monitoring image data displayed on the display unit 46, it is possible to know the sound state of the plurality of devices 4 arranged in the monitoring target area 2 and the diagnosis result of the diagnosis target device 6.
- the above-mentioned acoustic map and surveillance image data may be generated at predetermined time intervals.
- the data generation unit 44 may be configured to receive an acoustic map from the acoustic map generation unit 36 at each predetermined time, or the abnormality diagnosis unit 38 may diagnose the device 6 to be diagnosed at each predetermined time. It may be configured to receive results.
- the surveillance image data displayed on the display unit 46 may be updated at predetermined time intervals. In this way, it is possible to monitor a plurality of devices 4 arranged in the monitoring target area 2 in real time.
- an acoustic map showing the relationship between the positions of a plurality of sound sources and the sound pressure level of each sound source is generated based on the sound collected in the monitored area 2, and the diagnosis target on the acoustic map is generated.
- a monitoring image data in which the acoustic map and the abnormality diagnosis result of the device 6 to be diagnosed are superimposed is generated in association with the position of the device 6. Therefore, by displaying the monitoring image data generated in this way, the sound status from the plurality of devices 4 and the diagnosis result of the diagnosis target device 6 can be visually recognized, whereby a plurality of devices in the monitoring target area 2 can be visually recognized.
- the device 4 (device to be diagnosed 6) can be efficiently monitored.
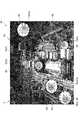
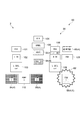
- FIGS. 6 to 11 are diagrams showing an example of monitoring image data displayed on the display unit of the monitoring device according to the embodiment, respectively.
- the data generation unit 44 acquires device configuration visual data 52, 54, 56 (see FIGS. 6 to 11) that visually indicate the configurations of the plurality of devices 4 in the monitored area 2.
- the device configuration visual data is overlaid with acoustic map information 60 (see FIGS. 6 to 11) corresponding to each position of the plurality of devices 4, and the diagnosis result by the abnormality diagnosis unit 38 is overlaid and monitored. It is configured to generate image data 50.
- the data generation unit 44 may acquire the device configuration visual data by reading the device configuration visual data stored in the storage unit 40, or the visual data acquisition unit 42 for acquiring the device configuration visual data (FIG. FIG.
- the device configuration visual data acquired in (3 to 5) may be received from the visual data acquisition unit 42.
- the data generation unit 44 adds the plurality of devices 4 to the device configuration visual data based on the linking information that links the position of each sound source included in the acoustic map with the positions of the plurality of devices 4 on the device configuration visual data.
- the information 60 of the acoustic map corresponding to each position of the above may be superimposed.
- the above-mentioned association information may be stored in the storage unit 40 in advance, and the data generation unit 44 may be configured to acquire the association information from the storage unit 40.
- the diagnosis result of the device 6 to be diagnosed is superimposed on the device configuration acoustic map in which the information of the acoustic map corresponding to each position of the plurality of devices 4 is superimposed on the device configuration visual data 52, 54, 56.
- the monitoring image data 50 it is possible to more easily visually recognize the sound status and the diagnosis result of the plurality of devices 4 in the monitoring target area 2. As a result, it is possible to more efficiently monitor the equipment including the plurality of devices 4.
- the rolling roll 72, the gear 74, the motor 76, the first pump 78, the fan 80, and the second pump 82 are shown as the plurality of devices 4 arranged in the monitored area 2. Is displayed.
- motors 90, 101, 104, 106, spindle 105, gear 92, rolling roll 94, tension reel 102, 107, Coil cars 103, 108, payoff reels 109, pumps 84, 86, 110, and fans 88 are displayed.
- the rolling rolls 72, 94, gears 74, 92 and motors 76, 90, 101, 104, 106 may each constitute a rolling mill 10 (see FIG. 2). That is, the rolling rolls 72 and 94 may correspond to the rolling roll 18 shown in FIG. 2, and the gears 74 and 92 may correspond to the gear 14 shown in FIG.
- the motors 76, 76, 90, 101, 104, 106 may correspond to the motor 12 of FIG.
- information 60 of the acoustic map corresponding to each position of the plurality of devices 4 is displayed.
- the information 60 of the acoustic map indicates the sound pressure level of the sound generated from each device 4, and may be, for example, character information such as a hue, a shade of color, and a numerical value.
- the information 60 of the acoustic map is shown as a figure (a plurality of ellipses overlapped in the figure), and the loudness of the sound is determined by the shade of color of the figure. Is expressed, and the range in which sound is generated is expressed by the size of the figure.
- the information 60 of the acoustic map is represented by colors (color types and shades) superimposed on the iconography showing each device 4.
- information 62 indicating an abnormality of the device to be diagnosed 6 is displayed as a diagnosis result by the abnormality diagnosis unit 38.
- the information 62 indicating an abnormality may be a mark including a shape or color that can be recognized to indicate an abnormality of the device.
- the monitoring image data 50 of FIGS. 7 and 8 is attached to the rolling roll 72
- the monitoring image data 50 of FIGS. 7, 9 and 10 is attached to the fan 80
- the monitoring image data 50 of FIG. 11 is attached to the fan 88.
- Information 62 indicating the above-mentioned abnormality is attached, and it is shown that there is an abnormality in these diagnosis target devices 6 (device 4).
- the device configuration visual data includes iconographic data indicating the outer shape of the plurality of devices 4 and the arrangement of the plurality of devices 4 in the monitored area 2.
- the device configuration visual data 52 in the monitoring image data 50 shown in FIGS. 6 to 9 is a plan view of a plurality of devices 4 in the monitoring target area 2, that is, a plan view shape of the plurality of devices 4, and the monitoring target area 2. It is a layout drawing (iconographic data) showing the layout in.
- the device configuration visual data may include a graphic that simplifies the shape of the device 4, such as the outer shape of the device 4. In this way, by using the device configuration visual data including the figure that simplifies the shape of the device 4, it becomes easy to prevent misidentification by the operator.
- the device configuration visual data 52 including the above-mentioned iconographic data may be stored in the storage unit 40 in advance.
- the data generation unit 44 may acquire the device configuration visual data 52 by reading the device configuration visual data 52 stored in the storage unit 40.
- the device configuration visual data includes image data (moving image data, still image data, etc.) obtained by photographing the monitored area 2 with a camera (visual data acquisition unit 42).
- the device configuration visual data 54 in the monitoring image data 50 shown in FIG. 10 is moving image data (image data) obtained by capturing a monitoring target area 2 in which a plurality of devices 4 are arranged with a camera (visual data acquisition unit 42). ).
- the monitoring image data 50 based on the device configuration visual data 54 including the iconographic data
- the sound status and the diagnosis result of the plurality of devices 4 in the monitoring target area 2 can be easily visually recognized.
- moving image data is used as the device configuration visual data
- image data is acquired every predetermined time by the visual data acquisition unit 42, so that such moving image data can be used for real-time monitoring.
- the sound is continuously collected by the microphone and the image (video data) continuously shot as described above is used
- the sound source is used as the actual image at the time of sound collection when the abnormality is judged. Because the position of is displayed in association with each other, for example, if it is a judgment of only sound, such as a sound made by something that should not be there or a sound made by an operator for consultation, Even if there is a risk of erroneous determination as an abnormality, it can be easily visually recognized that the captured image is not abnormal by visually determining the captured image.
- the device configuration visual data including the still image data may be stored in the storage unit 40 in advance.
- the data generation unit 44 may acquire the device configuration visual data 52 by reading out the device configuration visual data stored in the storage unit 40.
- the monitoring device 30 can be more convenient than the case where the image data is acquired by using the camera (visual data acquisition unit 42) as described above.
- the device configuration visual data includes character information indicating the configuration of the plurality of devices 4.
- the device configuration visual data 56 in the monitoring image data 50 shown in FIG. 11 includes character information indicating the names (or abbreviations) of a plurality of devices 4 in the monitored area 2, and the names (or abbreviations) of the devices 4 are used.
- the arrangement of each device 4 is schematically shown.
- the above-mentioned character information may include a number indicating the type and arrangement of the device 4.
- the sound status and the diagnosis result of the plurality of devices 4 in the monitoring target area 2 can be easily visually recognized.
- the equipment including the plurality of equipment 4 When the operator is familiar with the position of each device 4, it may be possible to quickly determine the diagnosis result of the device 4 by indicating the device configuration with character information such as the device name. Further, since the device 4 in the monitored area 2 is represented by the character information, the display space in the display unit 46 can be reduced, and the space for displaying other information can be increased.
- the device configuration visual data 56 including the above-mentioned character information may be stored in the storage unit 40 in advance.
- the data generation unit 44 may acquire the device configuration visual data 52 by reading the device configuration visual data 56 stored in the storage unit 40.
- the plurality of devices 4 include a rotating machine (eg, a motor), and the monitoring device 30 includes an extraction unit 34 (see FIGS. 3 to 5).
- the extraction unit 34 is a sound whose frequency changes according to the rotation speed of the above-mentioned rotating machine, or a sound among the sounds generated by each of the plurality of sound sources (that is, the sound collected by the first sound collecting unit 32). It is configured to extract sounds whose frequency does not change according to the number of revolutions.
- the acoustic map generation unit 36 is configured to generate an acoustic map for the sound source of the sound extracted by the extraction unit 34.
- the motor 76 is a rotating machine.
- the gear 74 and the rolling roll 72 constituting the rolling mill are configured to be driven by a motor (rotary machine).
- the motor may be accelerated or decelerated during operation.
- a reverse mill usually, every time the rolled material reciprocates between a pair of tension reels, acceleration operation, constant speed operation, and deceleration operation of the motor, gear, and rolling roll are repeated. Therefore, the frequency of the sound from the gear and the rolling roll changes according to the rotation speed of the motor.
- the extraction unit 34 changes the frequency of the sounds generated by each of the plurality of sound sources (that is, the sounds collected by the first sound collecting unit 32) according to the rotation of the motor (rotating machine). Extract the sound. As a result, only the sound from the sound source whose frequency changes according to the rotation speed of the motor is extracted.
- the acoustic map information 60 displayed in the monitoring image data 50 is used according to the rotation speed of the motor. Only the acoustic map information 60 for the device 4 (in FIG. 8, the motor 76, the gear 74, and the rolling roll 72) corresponding to the sound source whose sound frequency changes is included.
- the first pump 78, the fan 80, and the second pump 82 are motors arranged outside the monitoring target area 2. It is designed to be driven by (may be), but the operating speed is usually constant. Therefore, the frequencies of the sounds from the first pump 78, the fan 80, and the second pump 82 do not change according to the rotation speed of the motor (rotation speed) as the device 4 arranged in the monitoring target area 2.
- the extraction unit 34 does not change the frequency of the sounds generated by each of the plurality of sound sources (that is, the sounds collected by the first sound collecting unit 32) according to the rotation of the motor (rotating machine). Extract the sound. As a result, only the sound from the sound source whose frequency does not change according to the rotation speed of the motor is extracted.
- the acoustic map information 60 displayed in the monitoring image data 50 is used according to the rotation speed of the motor. Only the acoustic map information 60 for the device 4 (in FIG. 9, the first pump 78, the fan 80 and the second pump 82) corresponding to the sound source whose sound frequency does not change is included.
- this acoustic map for example, as shown in FIGS. 8 and 9, it relates to either the device 4 in which the frequency of the sound generated according to the rotation speed of the rotating machine (motor or the like) changes or the device 4 in which the frequency does not change.
- Surveillance image data 50 containing only information is generated. Therefore, since the device 4 to be monitored displayed by the monitoring image data 50 is limited, the operator can quickly grasp the sound status and the diagnosis result from the device 4 to be monitored.
- the extraction unit 34 is, for example, in the first sound collecting unit 32 in each of a plurality of rotation speed conditions (for example, rotation speed conditions at two different time points when the rotation speed increases) in which the rotation speed of the rotating machine (motor or the like) is different. Sound is collected, and the sound data acquired for each of a plurality of rotation speed conditions is frequency-analyzed. Then, by extracting components having a common frequency from the frequency analysis result regardless of the rotation speed condition, it is possible to extract sound data whose frequency does not change according to the rotation speed of a rotating machine (motor or the like). Alternatively, by removing components having a common frequency from the frequency analysis result regardless of the rotation speed condition, sound data whose frequency changes according to the rotation speed of a rotating machine (motor or the like) can be extracted.
- a plurality of rotation speed conditions for example, rotation speed conditions at two different time points when the rotation speed increases
- Sound is collected, and the sound data acquired for each of a plurality of rotation speed conditions is frequency-analyzed. Then, by extracting components having a
- the abnormality diagnosis unit 38 may be configured to diagnose an abnormality of the diagnosis target device 6 based on the sound generated by the diagnosis target device 6.
- the sound from the device 6 to be diagnosed is shown by the second sound collecting unit 48, which is different from the first sound collecting unit 32 for collecting the sound used for generating the acoustic map.
- the sound data is acquired, and the abnormality diagnosis unit 38 diagnoses the device 6 to be diagnosed based on the sound data.
- the second sound collecting unit 48 may include a microphone. When a plurality of diagnostic target devices 6 exist, a separate second sound collecting unit 48 may be provided for each diagnosis target device 6. Further, the sound may be collected by using a plurality of the first sound collecting units 32.
- the abnormality diagnosis unit 38 uses the sound collected by the first sound collection unit 32 for collecting the sound used for generating the acoustic map, and uses the sound collected by the first sound collection unit 32 to diagnose the device 6. It is configured to diagnose abnormalities in.
- the abnormality diagnosis procedure of the device 6 to be diagnosed using the sound collected by the first sound collecting unit 32 can be described as follows, for example, with reference to FIG.
- the acoustic map generation unit 36 Based on the sound collected by the first sound collecting unit 32, the acoustic map generation unit 36 generates an acoustic map showing the relationship between each sound source in the monitored area 2 and the sound pressure level in the sound source.
- the abnormality diagnosis unit 38 acquires the sound map generated by the sound map generation unit 36, and based on the link information that links the position of each sound source included in the sound map with the position of the device 6 to be diagnosed, the sound map. From, the sound pressure level data corresponding to the device 6 to be diagnosed is extracted.
- the abnormality diagnosis unit 38 may make a diagnosis of the device 6 to be diagnosed based on the sound pressure level data extracted in this way.
- the above-mentioned association information may be stored in the storage unit 40 in advance, and the data generation unit 44 may be configured to acquire the association information from the storage unit 40.
- the diagnosis target device 6 since the abnormality of the diagnosis target device 6 is diagnosed based on the sound collected by the first sound collection unit 32 used for generating the acoustic map, the diagnosis target device 6 (device 4) It is not necessary to provide a sound collecting means (microphone or the like) different from the first sound collecting unit 32 for the abnormality diagnosis. Therefore, the monitoring image data can be generated with a simple configuration, and the plurality of devices 4 in the monitoring target area 2 can be efficiently monitored.
- the abnormality diagnosis unit 38 is configured to diagnose the abnormality of the diagnosis target device 6 based on the sound pressure level generated by the diagnosis target device 6.
- the abnormality of the device 6 to be diagnosed can be appropriately diagnosed based on the sound pressure level generated by the device 6 to be diagnosed.
- the device 6 to be diagnosed is a rotary machine (for example, a motor or a rotary machine driven by a motor), and the abnormality diagnosis unit 38 is a sound pressure at a specific rotation speed when the rotation speed of the rotary machine is increased. It is configured to diagnose an abnormality of the device 6 (rotating machine) to be diagnosed based on at least one of the level or the sound pressure level at the specific rotation speed when the rotation speed of the rotating machine decreases.
- the sound pressure level may increase sharply in relation to the natural frequency of the rotating machine.
- the presence or absence of an abnormality in the device is determined based on the sound pressure level at a specific rotation speed at which the sound suddenly increases in the process of increasing or decreasing the rotation speed of the rotating machine. Therefore, it is possible to accurately diagnose the device 6 to be diagnosed. In addition, it is possible to easily diagnose an abnormality of a device whose rotation speed increases or decreases during operation based on the loudness of the sound at a specific rotation speed.
- the abnormality diagnosis unit 38 determines the sound pressure level at a specific rotation speed when the rotation speed of the rotating machine (for example, a motor or a rotating machine driven by the motor) which is the diagnosis target device 6 is increased, and the sound pressure level described above. When the difference from the sound pressure level at the specific rotation speed when the rotation speed of the rotating machine decreases is equal to or less than the threshold value, it is determined that the device 6 to be diagnosed has an abnormality.
- the load torque increases due to frictional heat, and the sound tends to become louder at a specific rotation speed not only when the rotation speed increases but also when the rotation speed decreases.
- the difference between the sound pressure level at a specific rotation speed when the rotation speed of the rotating machine increases and the sound pressure level at the same specific rotation speed when the rotation speed decreases occurs. Therefore, when the difference in sound pressure level generated at the natural frequency when the rotation speed increases and decreases is equal to or less than the threshold value, it is determined that the device 6 to be diagnosed has an abnormality. Can be diagnosed with high accuracy. In addition, it is possible to effectively diagnose an abnormality in a rotating machine whose rotation speed is repeatedly increased and decreased during operation.
- the abnormality diagnosis unit 38 determines the sound pressure level and the threshold value at a specific rotation speed when the rotation speed of the rotating machine (for example, a motor or a rotating machine driven by the motor) which is the diagnosis target device 6 is increased. Based on the comparison with, it is configured to diagnose the abnormality of the device 6 to be diagnosed.
- the rotating machine for example, a motor or a rotating machine driven by the motor
- the presence or absence of an abnormality in the device is determined based on the comparison between the sound pressure level at a specific rotation speed at which the sound suddenly increases in the process of increasing or decreasing the rotation speed of the rotating machine and the comparison value. Since the determination is made, the diagnosis of the device 6 to be diagnosed can be performed easily and accurately.
- the rotating machine which is the device 6 to be diagnosed
- the abnormality diagnosis unit 38 obtains sound pressure level data indicating the sound of the device 6 to be diagnosed with respect to the sound pressure level. It is configured to be normalized by the torque of the motor and to diagnose the abnormality of the device 6 to be diagnosed by using the normalized sound pressure level data.
- the influence of the increase or decrease in the torque of the motor on the sound pressure level is reduced. It can be converted into the sound data. Therefore, by diagnosing the device 6 to be diagnosed based on the sound pressure level data normalized in this way, the accuracy of the diagnosis can be improved.
- FIG. 12 and 13 are flowcharts showing the procedure of abnormality diagnosis by the abnormality diagnosis unit 38 according to the embodiment, respectively.
- FIG. 14 shows the motor rotation speed, the sound pressure level of the sound generated by the device 6 to be diagnosed, and the time change of the motor torque at the time of acquiring the sound pressure level data used in the abnormality diagnosis by the flowchart shown in FIG. It is a graph which shows an example.
- step S2 sound data indicating the sound generated by the gear 14 which is the diagnosis target device 6 is acquired.
- sound data the sound pressure level (see FIG. 14) of the sound generated by the gear 14 is acquired.
- step S2 at least a period in which the rotation speed of the motor 12 for driving the gear 14 increases (between time t0 and t4 in FIG. 14) and a period in which the rotation speed of the motor 12 increases (FIG. 14).
- the sound pressure level data at the time t5 to t9) is acquired.
- the rotational speed of the motor 12 during the period from time t0 to t4 is increased from zero to r S, the rotation speed of the motor 12 during the period from time t5 to t9 from r S to zero Decrease.
- the rotation speed r S of the motor 12 is constant.
- the rotation speed of the gear 14 changes depending on the rotation speed of the motor 12. That is, when the rotation speed of the motor 12 increases, the rotation speed of the gear 14 also increases, and when the rotation speed of the motor 12 decreases, the rotation speed of the gear 14 also decreases.
- the rotation speed of the gear 14 is also constant.
- the motor torque T1 when the rotation speed of the motor 12 increases (time t0 to t4)
- the motor torque T2 when the rotation speed of the motor 12 is constant (time t4 to t5)
- the motor torque T3 when the number of revolutions decreases (from time t5 to t9) is constant, and the relationship is T1> T2> T3.
- step S4 While the rotation speed of the motor 12 is increasing (that is, the rotation speed of the gear 14 (rotating machine as the device to be diagnosed 6) is increasing; between the times t0 and t4 in FIG. 14), the specific rotation in which the characteristic sound is generated is generated.
- the number (R1) and the sound pressure level (A1) of the characteristic sound are acquired (step S4).
- the characteristic sound is a sound whose sound pressure suddenly increases with a change in the number of rotations (a sound whose intensity peaks).
- the characteristic sound appears when the rotation speeds are r1 (time t1), r2 (time t2), and r3 (time t3).
- the rotation speeds r1 to r3 are specific rotation speeds (R1).
- R1 specific rotation speed
- the sound pressure level at the time of increasing the rotation speed corresponds to each of the rotation speeds r1 to r3 is A1-1_1 to A1_3, and the sound pressure level at the time of decreasing the rotation speed is A2_1 to A2_3 (see FIG. 14).
- step S4 specifically, the rotation speed r1 (specific rotation speed R1) at which the characteristic sound is generated and the sound pressure level A1_1 (sound pressure level A1 of the characteristic sound) at the rotation speed r1 (see FIG. 14). get.
- step S6 While the rotation speed of the motor 12 is decreasing (that is, the rotation speed of the gear 14 is decreasing; between times t5 and t9 in FIG. 14), the sound pressure level A2_1 (characteristic sound pressure) at the above-mentioned specific rotation speed r1. Obtain level A2) (step S6).
- Step S8 the difference (A1-1-1-A2_1) between the sound pressure level A1_1 of the characteristic sound acquired when the motor rotation speed is increased in step S2 and the sound pressure level A2_1 of the characteristic sound acquired when the motor rotation speed is decreased in step S4 is set as a threshold value.
- step S8 if the above difference (A1-1-1-A2_1) is larger than the threshold value (No in step S8), it is determined that there is no abnormality in the gear 14 (diagnosis target device 6) (step S14), and the gear 14 End the abnormality diagnosis.
- step S8 if the above difference (A1-1-1-A2-1) is equal to or less than the threshold value (Yes in step S8), it is determined that the gear 14 (diagnosis target device 6) has an abnormality (step S10).
- the diagnosis result is output to the data generation unit 44 (step S12). Based on the diagnosis result passed to the data generation unit 44 in this way, the above-mentioned monitoring image data is generated.
- step S8 The difference between the loudness (A1_1, etc.) of the specific rotational speed (r1 etc.) in the process of increasing the rotational speed of the motor 12 and the loudness (A2_1) of the specific rotational speed (r1 etc.) in the process of decreasing the rotational speed.
- the sound is relatively loud even in the process of decreasing the rotation speed when the load (motor torque) is small, so it can be determined that the gear 14 (rotating machine) is not in a normal state.
- the sound pressure level (A1-1) at a specific rotation speed for example, rotation speed r1 when the rotation speed of the gear 14 (rotating machine) increases and the same specific rotation speed (rotation) when the rotation speed decreases.
- the difference (A1-1-1-A2_1) from the sound pressure level (A2_1) in the number r1) is equal to or less than the threshold value, it is determined that the diagnostic target device 6 has an abnormality. It can be done with high accuracy. Further, it is effective for a rotating machine whose rotation speed is repeatedly increased and decreased during operation (for example, a rotating machine such as a gear 14 of a reverse mill that rolls while reciprocating a metal plate between a pair of tension reels). Abnormality diagnosis can be performed.
- step S22 sound pressure level data indicating the sound generated by the gear 14 which is the diagnosis target device 6 is acquired (step S22).
- the rotation speed of the motor 12 is increasing (that is, the rotation speed of the gear 14 (rotating machine as the device to be diagnosed 6) is increasing; between the times t0 and t4 in FIG. 14), the specific rotation in which the characteristic sound is generated is generated.
- the number (R1; here, r1 is used as an example) and the sound pressure level (A1; here, A1_1 is used as an example) of the characteristic sound are acquired (step S24).
- step S26 the torque T1 of the motor corresponding to the specific rotation speed r1 when the rotation speed of the motor 12 increases (that is, when the rotation speed of the gear 14 increases) is acquired (step S26).
- the sound pressure level A1_1 at the specific rotation speed r1 when the rotation speed of the motor 12 increases is normalized by the torque T1 of the motor (step S28). That is, the normalized sound pressure level A1-1 / T1 obtained by dividing the sound pressure level A1-11 at the specific rotation speed r1 by the torque T1 of the motor is acquired.
- step S30 the normalized sound pressure level A1-1 / T1 obtained in step S28 is compared with the threshold value (step S30).
- the normalized sound pressure level A1-1 / T1 is equal to or less than the threshold value (Yes in step S30)
- the abnormality diagnosis of the gear 14 is performed. finish.
- step S30 when the normalized sound pressure level A1-1 / T1 is larger than the threshold value (No in step S30), it is determined that the gear 14 (diagnosis target device 6) has an abnormality (step S32), and this diagnosis is made.
- the result is output to the data generation unit 44 (step S34). Based on the diagnosis result passed to the data generation unit 44 in this way, the above-mentioned monitoring image data is generated.
- the sound pressure level data indicating the sound of the gear 14 is normalized by the torque (T1) of the motor 12 with respect to the sound pressure level, so that the torque of the motor 12 is normalized. It can be converted into sound pressure level data in which the influence of the increase / decrease on the sound pressure level is reduced. Therefore, by diagnosing the gear 14 (diagnosis target device 6) based on the sound pressure level data normalized in this way, the accuracy of the diagnosis can be improved.
- the monitoring device is A monitoring device for monitoring multiple devices located in the monitored area.
- a sound collecting unit for collecting sound in the monitored area and
- An acoustic map generation unit for generating an acoustic map showing the relationship between the positions of a plurality of sound sources included in the monitored area and the sound pressure of each sound source based on the sound collected by the sound collecting unit.
- An abnormality diagnosis unit configured to diagnose an abnormality in at least one of the plurality of devices to be diagnosed, and an abnormality diagnosis unit.
- the acoustic map generated by the acoustic map generation unit and the diagnosis result of the diagnosis target device by the abnormality diagnosis unit are received, and the diagnosis is made on the acoustic map in association with the position of the diagnosis target device on the acoustic map.
- an acoustic map showing the relationship between the positions of a plurality of sound sources and the sound pressure of each sound source is generated based on the sound collected in the monitored area, and the diagnosis target on the acoustic map is generated.
- a monitoring image data in which the acoustic map and the abnormality diagnosis result of the device to be diagnosed are superimposed is generated in association with the position of the device. Therefore, by displaying the monitoring image data generated in this way, it is possible to visually recognize the sound status and the diagnosis result from a plurality of devices, thereby efficiently monitoring a plurality of devices in the monitored area. Can be done.
- the data generation unit Acquire device configuration visual data that visually shows the configurations of the plurality of devices, and obtain It is configured to generate the monitoring image data in which the diagnosis result is superimposed on the device configuration acoustic map in which the information of the acoustic map corresponding to each position of the plurality of devices is superimposed on the device configuration visual data. ..
- a monitoring image in which the diagnosis result of the device to be diagnosed is superimposed on the device configuration acoustic map in which the information of the acoustic map corresponding to each position of a plurality of devices is superimposed on the device configuration visual data.
- the device configuration visual data includes moving image data or still image data obtained by photographing the monitored area with a camera.
- the device configuration visual data the moving image data or the still image data obtained by shooting the monitored area with the camera is acquired, so that it is based on the moving image data or the still image data. Surveillance image data is generated. Therefore, by using this monitoring image data, it is possible to easily visually recognize the sound status and the diagnosis result of a plurality of devices in the monitored area, thereby efficiently monitoring the equipment including the plurality of devices. be able to.
- the device configuration visual data includes iconographic data showing the outer shapes of the plurality of devices and the arrangement of the plurality of devices in the monitored area.
- the iconographic data indicating the outer shape of the plurality of devices and the arrangement of the plurality of devices in the monitored area is acquired, and thus is based on the iconographic data.
- Surveillance image data is generated. Therefore, by using this monitoring image data, it is possible to easily visually recognize the sound status and the diagnosis result of a plurality of devices in the monitored area, thereby efficiently monitoring the equipment including the plurality of devices. be able to.
- the device configuration visual data includes character information indicating the configuration of the plurality of devices.
- the monitoring image data based on the character information is generated. Therefore, by using this monitoring image data, it is possible to easily visually recognize the sound status and the diagnosis result of a plurality of devices in the monitored area, thereby efficiently monitoring the equipment including the plurality of devices. be able to.
- the plurality of devices include a rotating machine.
- the monitoring device is Extraction configured to extract a sound whose frequency changes according to the rotation speed of the rotating machine or a sound whose frequency does not change according to the rotation speed among the sounds generated by each of the plurality of sound sources.
- Department equipped with The acoustic map generation unit is configured to generate the acoustic map for the sound source of the sound extracted by the extraction unit.
- the sound whose frequency changes according to the rotation speed of the rotating machine or the sound whose frequency does not change according to the rotation speed is extracted, and an acoustic map is generated for the sound source (equipment) extracted in this way.
- monitoring image data including only information about either a device in which the frequency of the sound generated according to the rotation speed of the rotating machine changes or a device in which the frequency does not change is generated. Therefore, since the monitored device displayed by the monitored image data is limited, the operator can quickly grasp the sound status and the diagnosis result from the monitored device.
- the abnormality diagnosis unit is configured to diagnose an abnormality of the diagnosis target device based on the sound generated by the diagnosis target device.
- the abnormality diagnosis unit is configured to diagnose an abnormality of the device to be diagnosed based on the sound collected by the sound collection unit.
- the abnormality of the device to be diagnosed is diagnosed based on the sound collected by the sound collecting unit used for generating the acoustic map. It is not necessary to provide a sound collecting means (microphone or the like) different from the above-mentioned sound collecting unit. Therefore, the monitoring image data can be generated with a simple configuration, and a plurality of devices in the monitoring target area can be efficiently monitored.
- the abnormality diagnosis unit is configured to diagnose an abnormality of the device to be diagnosed based on the sound pressure level generated by the device to be diagnosed.
- the device to be diagnosed is a rotating machine.
- the abnormality diagnosis unit is based on at least one of the sound pressure level at a specific rotation speed when the rotation speed of the rotating machine increases or the sound pressure level at the specific rotation speed when the rotation speed of the rotating machine decreases. It is configured to diagnose an abnormality of the device to be diagnosed.
- the sound pressure level may increase sharply in relation to the natural frequency of the rotating machine.
- the presence or absence of an abnormality in the device is determined based on the sound pressure level at a specific rotation speed at which the sound suddenly increases in the process of increasing or decreasing the rotation speed of the rotating machine. Therefore, it is possible to accurately diagnose the device to be diagnosed. In addition, it is possible to easily diagnose an abnormality of a device whose rotation speed increases or decreases during operation based on the loudness of the sound at a specific rotation speed.
- the device to be diagnosed is a rotating machine.
- the abnormality diagnosis unit the difference between the sound pressure level at a specific rotation speed when the rotation speed of the rotating machine increases and the sound pressure level at the specific rotation speed when the rotation speed of the rotating machine decreases is equal to or less than a threshold value. In some cases, it is configured to determine that the device to be diagnosed has an abnormality.
- the sound tends to be louder at a specific rotation speed not only when the rotation speed increases but also when the rotation speed decreases.
- the difference between the sound pressure level at a specific rotation speed when the rotation speed of the rotating machine increases and the sound pressure level at the same specific rotation speed when the rotation speed decreases is a threshold value.
- the device to be diagnosed is a rotating machine.
- the abnormality diagnosis unit is configured to diagnose an abnormality of the device to be diagnosed based on a comparison between a sound pressure level at a specific rotation speed when the rotation speed of the rotating machine is increased and a threshold value.
- the sound pressure level at a specific rotation speed at which the sound suddenly increases in the process of increasing or decreasing the rotation speed of the rotating machine is compared with the comparison value, and the abnormality of the device is abnormal. Since the presence or absence is determined, the device to be diagnosed can be diagnosed easily and accurately.
- the rotating machine is configured to be driven by a motor.
- the abnormality diagnosis unit normalizes the sound pressure level data indicating the sound of the device to be diagnosed with the torque of the motor with respect to the sound pressure level, and uses the normalized sound pressure level data to make an abnormality of the device to be diagnosed. Is configured to diagnose.
- the plurality of devices include a motor and a rolling mill driven by the motor.
- monitoring is efficient as described in (1) above for a rolling mill including a motor and equipment driven by the motor (for example, gears, spindles, rolling rolls, etc.). Can be done
- the monitoring method is It is a monitoring method for multiple devices placed in the monitored area.
- the step of collecting sound in the monitored area and Based on the sound collected in the sound collecting step a step of generating an acoustic map showing the relationship between the positions of a plurality of sound sources included in the monitored area and the sound pressure of each sound source, and A step of diagnosing an abnormality in at least one device to be diagnosed among the plurality of devices, A step of associating the diagnosis result of the diagnosis target device with the
- an acoustic map showing the relationship between the positions of a plurality of sound sources and the sound pressure of each sound source is generated based on the sound collected in the monitored area, and the diagnosis target on the acoustic map is generated.
- a monitoring image data in which the acoustic map and the abnormality diagnosis result of the device to be diagnosed are superimposed is generated in association with the position of the device. Therefore, by displaying the monitoring image data generated in this way, it is possible to visually recognize the sound status and the diagnosis result from a plurality of devices, thereby efficiently monitoring a plurality of devices in the monitored area. Can be done.
- the present invention is not limited to the above-described embodiments, and includes a modified form of the above-described embodiments and a combination of these embodiments as appropriate.
- the expression representing a shape such as a quadrangular shape or a cylindrical shape not only represents a shape such as a quadrangular shape or a cylindrical shape in a geometrically strict sense, but also within a range in which the same effect can be obtained.
- the shape including the uneven portion, the chamfered portion, etc. shall also be represented.
- the expression “comprising”, “including”, or “having” one component is not an exclusive expression excluding the existence of another component.
Landscapes
- Physics & Mathematics (AREA)
- General Physics & Mathematics (AREA)
- Testing Of Devices, Machine Parts, Or Other Structures Thereof (AREA)
- Testing And Monitoring For Control Systems (AREA)
Priority Applications (2)
| Application Number | Priority Date | Filing Date | Title |
|---|---|---|---|
| JP2021575145A JP7261325B2 (ja) | 2020-02-05 | 2020-02-05 | 監視装置、異常診断装置、監視方法及び異常診断方法 |
| PCT/JP2020/004235 WO2021156957A1 (ja) | 2020-02-05 | 2020-02-05 | 監視装置及び監視方法 |
Applications Claiming Priority (1)
| Application Number | Priority Date | Filing Date | Title |
|---|---|---|---|
| PCT/JP2020/004235 WO2021156957A1 (ja) | 2020-02-05 | 2020-02-05 | 監視装置及び監視方法 |
Publications (1)
| Publication Number | Publication Date |
|---|---|
| WO2021156957A1 true WO2021156957A1 (ja) | 2021-08-12 |
Family
ID=77200446
Family Applications (1)
| Application Number | Title | Priority Date | Filing Date |
|---|---|---|---|
| PCT/JP2020/004235 Ceased WO2021156957A1 (ja) | 2020-02-05 | 2020-02-05 | 監視装置及び監視方法 |
Country Status (2)
| Country | Link |
|---|---|
| JP (1) | JP7261325B2 (https=) |
| WO (1) | WO2021156957A1 (https=) |
Citations (5)
| Publication number | Priority date | Publication date | Assignee | Title |
|---|---|---|---|---|
| JPS5868626A (ja) * | 1981-10-21 | 1983-04-23 | Hitachi Ltd | 回転機械の異常検出装置 |
| JPH05256690A (ja) * | 1992-03-11 | 1993-10-05 | Hitachi Ltd | 回転機械の異常音診断方法、その装置及び回転機械の製造ライン |
| JPH06300619A (ja) * | 1993-04-16 | 1994-10-28 | Hitachi Ltd | 機械の異常音診断方法とその装置 |
| JP2013015468A (ja) * | 2011-07-06 | 2013-01-24 | Hitachi Engineering & Services Co Ltd | 異音診断装置および異音診断方法 |
| WO2018096640A1 (ja) * | 2016-11-25 | 2018-05-31 | 株式会社日立製作所 | 電力変換装置 |
Family Cites Families (1)
| Publication number | Priority date | Publication date | Assignee | Title |
|---|---|---|---|---|
| JPH01234083A (ja) * | 1988-03-11 | 1989-09-19 | Nippon Denso Co Ltd | 回転機のための異常検査装置 |
-
2020
- 2020-02-05 JP JP2021575145A patent/JP7261325B2/ja active Active
- 2020-02-05 WO PCT/JP2020/004235 patent/WO2021156957A1/ja not_active Ceased
Patent Citations (5)
| Publication number | Priority date | Publication date | Assignee | Title |
|---|---|---|---|---|
| JPS5868626A (ja) * | 1981-10-21 | 1983-04-23 | Hitachi Ltd | 回転機械の異常検出装置 |
| JPH05256690A (ja) * | 1992-03-11 | 1993-10-05 | Hitachi Ltd | 回転機械の異常音診断方法、その装置及び回転機械の製造ライン |
| JPH06300619A (ja) * | 1993-04-16 | 1994-10-28 | Hitachi Ltd | 機械の異常音診断方法とその装置 |
| JP2013015468A (ja) * | 2011-07-06 | 2013-01-24 | Hitachi Engineering & Services Co Ltd | 異音診断装置および異音診断方法 |
| WO2018096640A1 (ja) * | 2016-11-25 | 2018-05-31 | 株式会社日立製作所 | 電力変換装置 |
Also Published As
| Publication number | Publication date |
|---|---|
| JPWO2021156957A1 (https=) | 2021-08-12 |
| JP7261325B2 (ja) | 2023-04-19 |
Similar Documents
| Publication | Publication Date | Title |
|---|---|---|
| EP2570879B1 (en) | Condition monitoring system and method | |
| JP7077426B2 (ja) | 診断装置及びこれを備えた設備並びに診断方法 | |
| US6801864B2 (en) | System and method for analyzing vibration signals | |
| US11783467B1 (en) | Monitoring of objects based on frequency spectrum of motion and frequency filtering | |
| EP3842780B1 (en) | Method and device for diagnosing abnormality in rolling bearing | |
| CN113092114B (zh) | 一种轴承故障诊断方法、装置及存储介质 | |
| JP2019095346A (ja) | 送り軸の異常診断方法及び異常診断装置 | |
| JP2011145295A (ja) | 振動測定及び回転機械の診断の機器及び方法 | |
| JP2018205213A (ja) | 故障予知機能を備えた複合加工機械 | |
| US20240159623A1 (en) | Vibration diagnosis device | |
| JP2017194371A (ja) | 回転駆動装置における診断対象部の異常診断方法と、それに用いる異常診断装置 | |
| JP7035178B2 (ja) | 圧延設備の診断装置及び診断方法 | |
| JP3092453B2 (ja) | 遊星歯車機構の診断方法 | |
| JP7261325B2 (ja) | 監視装置、異常診断装置、監視方法及び異常診断方法 | |
| CN112557036A (zh) | 诊断装置与方法以及计算机可读取存储媒介 | |
| JP2021076450A (ja) | 送り軸装置の異常診断方法及び異常診断装置 | |
| JP3876976B2 (ja) | 評価装置および評価方法 | |
| JP2918683B2 (ja) | 軸受疲労によるae信号の特定方法およびこの特定方法を用いた軸受破壊予知方法 | |
| JP3776343B2 (ja) | 異常監視装置 | |
| WO2018083746A1 (ja) | 設備診断装置および設備診断方法 | |
| JPWO2021156957A5 (https=) | ||
| JP2003166908A (ja) | 回転機械の異常診断システム | |
| JPH07260564A (ja) | 回転機器の異常診断装置及び方法 | |
| JPS63167222A (ja) | 回転機械の異常診断装置 | |
| JPS59173720A (ja) | 低速回転機の振動診断方法および装置 |
Legal Events
| Date | Code | Title | Description |
|---|---|---|---|
| 121 | Ep: the epo has been informed by wipo that ep was designated in this application |
Ref document number: 20917472 Country of ref document: EP Kind code of ref document: A1 |
|
| ENP | Entry into the national phase |
Ref document number: 2021575145 Country of ref document: JP Kind code of ref document: A |
|
| NENP | Non-entry into the national phase |
Ref country code: DE |
|
| 122 | Ep: pct application non-entry in european phase |
Ref document number: 20917472 Country of ref document: EP Kind code of ref document: A1 |