WO2020197659A1 - Signature for diagnosis of bacterial vs viral infections - Google Patents
Signature for diagnosis of bacterial vs viral infections Download PDFInfo
- Publication number
- WO2020197659A1 WO2020197659A1 PCT/US2020/018414 US2020018414W WO2020197659A1 WO 2020197659 A1 WO2020197659 A1 WO 2020197659A1 US 2020018414 W US2020018414 W US 2020018414W WO 2020197659 A1 WO2020197659 A1 WO 2020197659A1
- Authority
- WO
- WIPO (PCT)
- Prior art keywords
- subject
- rna
- bacterial
- viral
- genes
- Prior art date
Links
- 208000036142 Viral infection Diseases 0.000 title claims abstract description 57
- 230000009385 viral infection Effects 0.000 title claims abstract description 54
- 230000001580 bacterial effect Effects 0.000 title description 25
- 238000003745 diagnosis Methods 0.000 title description 6
- 208000035143 Bacterial infection Diseases 0.000 claims abstract description 60
- 208000022362 bacterial infectious disease Diseases 0.000 claims abstract description 60
- 238000000034 method Methods 0.000 claims abstract description 60
- 230000014509 gene expression Effects 0.000 claims abstract description 39
- 101000840275 Homo sapiens Interferon alpha-inducible protein 27, mitochondrial Proteins 0.000 claims description 20
- 102100029604 Interferon alpha-inducible protein 27, mitochondrial Human genes 0.000 claims description 20
- 102100038006 High affinity immunoglobulin epsilon receptor subunit alpha Human genes 0.000 claims description 19
- 102100034633 Homeobox expressed in ES cells 1 Human genes 0.000 claims description 19
- 101000878611 Homo sapiens High affinity immunoglobulin epsilon receptor subunit alpha Proteins 0.000 claims description 19
- 101001067288 Homo sapiens Homeobox expressed in ES cells 1 Proteins 0.000 claims description 19
- 101000599852 Homo sapiens Intercellular adhesion molecule 1 Proteins 0.000 claims description 19
- 101000852964 Homo sapiens Interleukin-27 subunit beta Proteins 0.000 claims description 19
- 101000691574 Homo sapiens Junction plakoglobin Proteins 0.000 claims description 19
- 101000687634 Homo sapiens SWI/SNF-related matrix-associated actin-dependent regulator of chromatin subfamily D member 3 Proteins 0.000 claims description 19
- 101000661451 Homo sapiens Succinate-CoA ligase [GDP-forming] subunit beta, mitochondrial Proteins 0.000 claims description 19
- 102100037877 Intercellular adhesion molecule 1 Human genes 0.000 claims description 19
- 102100036712 Interleukin-27 subunit beta Human genes 0.000 claims description 19
- 102100026153 Junction plakoglobin Human genes 0.000 claims description 19
- 102100024837 SWI/SNF-related matrix-associated actin-dependent regulator of chromatin subfamily D member 3 Human genes 0.000 claims description 19
- 102100037788 Succinate-CoA ligase [GDP-forming] subunit beta, mitochondrial Human genes 0.000 claims description 19
- 239000002299 complementary DNA Substances 0.000 claims description 12
- 210000003819 peripheral blood mononuclear cell Anatomy 0.000 claims description 12
- 238000002560 therapeutic procedure Methods 0.000 claims description 10
- 239000003242 anti bacterial agent Substances 0.000 claims description 9
- 210000004369 blood Anatomy 0.000 claims description 9
- 239000008280 blood Substances 0.000 claims description 9
- 239000003443 antiviral agent Substances 0.000 claims description 8
- 239000003153 chemical reaction reagent Substances 0.000 claims description 8
- 108091034117 Oligonucleotide Proteins 0.000 claims description 5
- 238000011901 isothermal amplification Methods 0.000 claims description 5
- 230000000844 anti-bacterial effect Effects 0.000 claims description 4
- 230000003115 biocidal effect Effects 0.000 claims description 4
- 238000006243 chemical reaction Methods 0.000 claims description 4
- 230000000840 anti-viral effect Effects 0.000 claims description 3
- 210000000265 leukocyte Anatomy 0.000 claims description 3
- 210000000440 neutrophil Anatomy 0.000 claims description 3
- 238000003757 reverse transcription PCR Methods 0.000 claims description 3
- 238000002372 labelling Methods 0.000 claims description 2
- 229940121357 antivirals Drugs 0.000 claims 1
- 238000012163 sequencing technique Methods 0.000 claims 1
- 108090000623 proteins and genes Proteins 0.000 description 71
- 101150044182 8 gene Proteins 0.000 description 17
- 230000003834 intracellular effect Effects 0.000 description 17
- 239000000523 sample Substances 0.000 description 17
- 238000010200 validation analysis Methods 0.000 description 14
- -1 Ampligen Chemical compound 0.000 description 10
- 241000283077 Trichechus manatus Species 0.000 description 9
- 238000002493 microarray Methods 0.000 description 9
- 238000003491 array Methods 0.000 description 8
- 235000013162 Cocos nucifera Nutrition 0.000 description 7
- 244000060011 Cocos nucifera Species 0.000 description 7
- JGSARLDLIJGVTE-MBNYWOFBSA-N Penicillin G Chemical compound N([C@H]1[C@H]2SC([C@@H](N2C1=O)C(O)=O)(C)C)C(=O)CC1=CC=CC=C1 JGSARLDLIJGVTE-MBNYWOFBSA-N 0.000 description 7
- 229940088710 antibiotic agent Drugs 0.000 description 7
- 238000010606 normalization Methods 0.000 description 7
- 238000004458 analytical method Methods 0.000 description 6
- 239000011324 bead Substances 0.000 description 6
- 238000010198 multi-cohort analysis Methods 0.000 description 6
- 230000003612 virological effect Effects 0.000 description 6
- JFPVXVDWJQMJEE-QMTHXVAHSA-N Cefuroxime Chemical compound N([C@@H]1C(N2C(=C(COC(N)=O)CS[C@@H]21)C(O)=O)=O)C(=O)C(=NOC)C1=CC=CO1 JFPVXVDWJQMJEE-QMTHXVAHSA-N 0.000 description 5
- 238000004422 calculation algorithm Methods 0.000 description 5
- MYSWGUAQZAJSOK-UHFFFAOYSA-N ciprofloxacin Chemical compound C12=CC(N3CCNCC3)=C(F)C=C2C(=O)C(C(=O)O)=CN1C1CC1 MYSWGUAQZAJSOK-UHFFFAOYSA-N 0.000 description 5
- 201000010099 disease Diseases 0.000 description 5
- 208000037265 diseases, disorders, signs and symptoms Diseases 0.000 description 5
- 239000003814 drug Substances 0.000 description 5
- 208000015181 infectious disease Diseases 0.000 description 5
- 108020005187 Oligonucleotide Probes Proteins 0.000 description 4
- 206010057190 Respiratory tract infections Diseases 0.000 description 4
- MQTOSJVFKKJCRP-BICOPXKESA-N azithromycin Chemical compound O([C@@H]1[C@@H](C)C(=O)O[C@@H]([C@@]([C@H](O)[C@@H](C)N(C)C[C@H](C)C[C@@](C)(O)[C@H](O[C@H]2[C@@H]([C@H](C[C@@H](C)O2)N(C)C)O)[C@H]1C)(C)O)CC)[C@H]1C[C@@](C)(OC)[C@@H](O)[C@H](C)O1 MQTOSJVFKKJCRP-BICOPXKESA-N 0.000 description 4
- 238000002405 diagnostic procedure Methods 0.000 description 4
- 230000000694 effects Effects 0.000 description 4
- AEUTYOVWOVBAKS-UWVGGRQHSA-N ethambutol Chemical compound CC[C@@H](CO)NCCN[C@@H](CC)CO AEUTYOVWOVBAKS-UWVGGRQHSA-N 0.000 description 4
- 239000000463 material Substances 0.000 description 4
- 238000005259 measurement Methods 0.000 description 4
- 239000002751 oligonucleotide probe Substances 0.000 description 4
- 244000052769 pathogen Species 0.000 description 4
- JQXXHWHPUNPDRT-WLSIYKJHSA-N rifampicin Chemical compound O([C@](C1=O)(C)O/C=C/[C@@H]([C@H]([C@@H](OC(C)=O)[C@H](C)[C@H](O)[C@H](C)[C@@H](O)[C@@H](C)\C=C\C=C(C)/C(=O)NC=2C(O)=C3C([O-])=C4C)C)OC)C4=C1C3=C(O)C=2\C=N\N1CC[NH+](C)CC1 JQXXHWHPUNPDRT-WLSIYKJHSA-N 0.000 description 4
- UCSJYZPVAKXKNQ-HZYVHMACSA-N streptomycin Chemical compound CN[C@H]1[C@H](O)[C@@H](O)[C@H](CO)O[C@H]1O[C@@H]1[C@](C=O)(O)[C@H](C)O[C@H]1O[C@@H]1[C@@H](NC(N)=N)[C@H](O)[C@@H](NC(N)=N)[C@H](O)[C@H]1O UCSJYZPVAKXKNQ-HZYVHMACSA-N 0.000 description 4
- SEEPANYCNGTZFQ-UHFFFAOYSA-N sulfadiazine Chemical compound C1=CC(N)=CC=C1S(=O)(=O)NC1=NC=CC=N1 SEEPANYCNGTZFQ-UHFFFAOYSA-N 0.000 description 4
- 238000012360 testing method Methods 0.000 description 4
- WZRJTRPJURQBRM-UHFFFAOYSA-N 4-amino-n-(5-methyl-1,2-oxazol-3-yl)benzenesulfonamide;5-[(3,4,5-trimethoxyphenyl)methyl]pyrimidine-2,4-diamine Chemical compound O1C(C)=CC(NS(=O)(=O)C=2C=CC(N)=CC=2)=N1.COC1=C(OC)C(OC)=CC(CC=2C(=NC(N)=NC=2)N)=C1 WZRJTRPJURQBRM-UHFFFAOYSA-N 0.000 description 3
- 101150101112 7 gene Proteins 0.000 description 3
- GSDSWSVVBLHKDQ-UHFFFAOYSA-N 9-fluoro-3-methyl-10-(4-methylpiperazin-1-yl)-7-oxo-2,3-dihydro-7H-[1,4]oxazino[2,3,4-ij]quinoline-6-carboxylic acid Chemical compound FC1=CC(C(C(C(O)=O)=C2)=O)=C3N2C(C)COC3=C1N1CCN(C)CC1 GSDSWSVVBLHKDQ-UHFFFAOYSA-N 0.000 description 3
- 241000894006 Bacteria Species 0.000 description 3
- HJLSLZFTEKNLFI-UHFFFAOYSA-N Tinidazole Chemical compound CCS(=O)(=O)CCN1C(C)=NC=C1[N+]([O-])=O HJLSLZFTEKNLFI-UHFFFAOYSA-N 0.000 description 3
- 229960004150 aciclovir Drugs 0.000 description 3
- MKUXAQIIEYXACX-UHFFFAOYSA-N aciclovir Chemical compound N1C(N)=NC(=O)C2=C1N(COCCO)C=N2 MKUXAQIIEYXACX-UHFFFAOYSA-N 0.000 description 3
- 230000000692 anti-sense effect Effects 0.000 description 3
- WZPBZJONDBGPKJ-VEHQQRBSSA-N aztreonam Chemical compound O=C1N(S([O-])(=O)=O)[C@@H](C)[C@@H]1NC(=O)C(=N/OC(C)(C)C(O)=O)\C1=CSC([NH3+])=N1 WZPBZJONDBGPKJ-VEHQQRBSSA-N 0.000 description 3
- XIURVHNZVLADCM-IUODEOHRSA-N cefalotin Chemical compound N([C@H]1[C@@H]2N(C1=O)C(=C(CS2)COC(=O)C)C(O)=O)C(=O)CC1=CC=CS1 XIURVHNZVLADCM-IUODEOHRSA-N 0.000 description 3
- 229940079593 drug Drugs 0.000 description 3
- 230000004547 gene signature Effects 0.000 description 3
- 206010022000 influenza Diseases 0.000 description 3
- 239000003112 inhibitor Substances 0.000 description 3
- 230000015654 memory Effects 0.000 description 3
- NXFQHRVNIOXGAQ-YCRREMRBSA-N nitrofurantoin Chemical compound O1C([N+](=O)[O-])=CC=C1\C=N\N1C(=O)NC(=O)C1 NXFQHRVNIOXGAQ-YCRREMRBSA-N 0.000 description 3
- 239000013610 patient sample Substances 0.000 description 3
- 230000000241 respiratory effect Effects 0.000 description 3
- 230000004044 response Effects 0.000 description 3
- SKIVFJLNDNKQPD-UHFFFAOYSA-N sulfacetamide Chemical compound CC(=O)NS(=O)(=O)C1=CC=C(N)C=C1 SKIVFJLNDNKQPD-UHFFFAOYSA-N 0.000 description 3
- JLKIGFTWXXRPMT-UHFFFAOYSA-N sulphamethoxazole Chemical compound O1C(C)=CC(NS(=O)(=O)C=2C=CC(N)=CC=2)=N1 JLKIGFTWXXRPMT-UHFFFAOYSA-N 0.000 description 3
- 230000009897 systematic effect Effects 0.000 description 3
- OHKOGUYZJXTSFX-KZFFXBSXSA-N ticarcillin Chemical compound C=1([C@@H](C(O)=O)C(=O)N[C@H]2[C@H]3SC([C@@H](N3C2=O)C(O)=O)(C)C)C=CSC=1 OHKOGUYZJXTSFX-KZFFXBSXSA-N 0.000 description 3
- IEDVJHCEMCRBQM-UHFFFAOYSA-N trimethoprim Chemical compound COC1=C(OC)C(OC)=CC(CC=2C(=NC(N)=NC=2)N)=C1 IEDVJHCEMCRBQM-UHFFFAOYSA-N 0.000 description 3
- 229960002555 zidovudine Drugs 0.000 description 3
- HBOMLICNUCNMMY-XLPZGREQSA-N zidovudine Chemical compound O=C1NC(=O)C(C)=CN1[C@@H]1O[C@H](CO)[C@@H](N=[N+]=[N-])C1 HBOMLICNUCNMMY-XLPZGREQSA-N 0.000 description 3
- VCOPTHOUUNAYKQ-WBTCAYNUSA-N (3s)-3,6-diamino-n-[[(2s,5s,8e,11s,15s)-15-amino-11-[(6r)-2-amino-1,4,5,6-tetrahydropyrimidin-6-yl]-8-[(carbamoylamino)methylidene]-2-(hydroxymethyl)-3,6,9,12,16-pentaoxo-1,4,7,10,13-pentazacyclohexadec-5-yl]methyl]hexanamide;(3s)-3,6-diamino-n-[[(2s,5s,8 Chemical compound N1C(=O)\C(=C/NC(N)=O)NC(=O)[C@H](CNC(=O)C[C@@H](N)CCCN)NC(=O)[C@H](C)NC(=O)[C@@H](N)CNC(=O)[C@@H]1[C@@H]1NC(N)=NCC1.N1C(=O)\C(=C/NC(N)=O)NC(=O)[C@H](CNC(=O)C[C@@H](N)CCCN)NC(=O)[C@H](CO)NC(=O)[C@@H](N)CNC(=O)[C@@H]1[C@@H]1NC(N)=NCC1 VCOPTHOUUNAYKQ-WBTCAYNUSA-N 0.000 description 2
- FFTVPQUHLQBXQZ-KVUCHLLUSA-N (4s,4as,5ar,12ar)-4,7-bis(dimethylamino)-1,10,11,12a-tetrahydroxy-3,12-dioxo-4a,5,5a,6-tetrahydro-4h-tetracene-2-carboxamide Chemical compound C1C2=C(N(C)C)C=CC(O)=C2C(O)=C2[C@@H]1C[C@H]1[C@H](N(C)C)C(=O)C(C(N)=O)=C(O)[C@@]1(O)C2=O FFTVPQUHLQBXQZ-KVUCHLLUSA-N 0.000 description 2
- WDLWHQDACQUCJR-ZAMMOSSLSA-N (6r,7r)-7-[[(2r)-2-azaniumyl-2-(4-hydroxyphenyl)acetyl]amino]-8-oxo-3-[(e)-prop-1-enyl]-5-thia-1-azabicyclo[4.2.0]oct-2-ene-2-carboxylate Chemical compound C1([C@@H](N)C(=O)N[C@H]2[C@@H]3N(C2=O)C(=C(CS3)/C=C/C)C(O)=O)=CC=C(O)C=C1 WDLWHQDACQUCJR-ZAMMOSSLSA-N 0.000 description 2
- MINDHVHHQZYEEK-UHFFFAOYSA-N (E)-(2S,3R,4R,5S)-5-[(2S,3S,4S,5S)-2,3-epoxy-5-hydroxy-4-methylhexyl]tetrahydro-3,4-dihydroxy-(beta)-methyl-2H-pyran-2-crotonic acid ester with 9-hydroxynonanoic acid Natural products CC(O)C(C)C1OC1CC1C(O)C(O)C(CC(C)=CC(=O)OCCCCCCCCC(O)=O)OC1 MINDHVHHQZYEEK-UHFFFAOYSA-N 0.000 description 2
- UBCHPRBFMUDMNC-UHFFFAOYSA-N 1-(1-adamantyl)ethanamine Chemical compound C1C(C2)CC3CC2CC1(C(N)C)C3 UBCHPRBFMUDMNC-UHFFFAOYSA-N 0.000 description 2
- 101150029062 15 gene Proteins 0.000 description 2
- ACTOXUHEUCPTEW-CEUOBAOPSA-N 2-[(4r,5s,6s,7r,9r,10r,11e,13e,16r)-6-[(2s,3r,4r,5s,6r)-5-[(2s,4r,5s,6s)-4,5-dihydroxy-4,6-dimethyloxan-2-yl]oxy-4-(dimethylamino)-3-hydroxy-6-methyloxan-2-yl]oxy-10-[(2r,5s,6r)-5-(dimethylamino)-6-methyloxan-2-yl]oxy-4-hydroxy-5-methoxy-9,16-dimethyl-2-o Chemical compound O([C@H]1/C=C/C=C/C[C@@H](C)OC(=O)C[C@@H](O)[C@@H]([C@H]([C@@H](CC=O)C[C@H]1C)O[C@H]1[C@@H]([C@H]([C@H](O[C@@H]2O[C@@H](C)[C@H](O)[C@](C)(O)C2)[C@@H](C)O1)N(C)C)O)OC)[C@H]1CC[C@H](N(C)C)[C@@H](C)O1 ACTOXUHEUCPTEW-CEUOBAOPSA-N 0.000 description 2
- 102100022970 Basic leucine zipper transcriptional factor ATF-like Human genes 0.000 description 2
- 102100021703 C3a anaphylatoxin chemotactic receptor Human genes 0.000 description 2
- 108010062802 CD66 antigens Proteins 0.000 description 2
- 108010065839 Capreomycin Proteins 0.000 description 2
- 102100024533 Carcinoembryonic antigen-related cell adhesion molecule 1 Human genes 0.000 description 2
- HZZVJAQRINQKSD-UHFFFAOYSA-N Clavulanic acid Natural products OC(=O)C1C(=CCO)OC2CC(=O)N21 HZZVJAQRINQKSD-UHFFFAOYSA-N 0.000 description 2
- DYDCUQKUCUHJBH-UWTATZPHSA-N D-Cycloserine Chemical compound N[C@@H]1CONC1=O DYDCUQKUCUHJBH-UWTATZPHSA-N 0.000 description 2
- MQJKPEGWNLWLTK-UHFFFAOYSA-N Dapsone Chemical compound C1=CC(N)=CC=C1S(=O)(=O)C1=CC=C(N)C=C1 MQJKPEGWNLWLTK-UHFFFAOYSA-N 0.000 description 2
- 108010013198 Daptomycin Proteins 0.000 description 2
- FMTDIUIBLCQGJB-UHFFFAOYSA-N Demethylchlortetracyclin Natural products C1C2C(O)C3=C(Cl)C=CC(O)=C3C(=O)C2=C(O)C2(O)C1C(N(C)C)C(O)=C(C(N)=O)C2=O FMTDIUIBLCQGJB-UHFFFAOYSA-N 0.000 description 2
- XQSPYNMVSIKCOC-NTSWFWBYSA-N Emtricitabine Chemical compound C1=C(F)C(N)=NC(=O)N1[C@H]1O[C@@H](CO)SC1 XQSPYNMVSIKCOC-NTSWFWBYSA-N 0.000 description 2
- 108010032976 Enfuvirtide Proteins 0.000 description 2
- ULGZDMOVFRHVEP-RWJQBGPGSA-N Erythromycin Chemical compound O([C@@H]1[C@@H](C)C(=O)O[C@@H]([C@@]([C@H](O)[C@@H](C)C(=O)[C@H](C)C[C@@](C)(O)[C@H](O[C@H]2[C@@H]([C@H](C[C@@H](C)O2)N(C)C)O)[C@H]1C)(C)O)CC)[C@H]1C[C@@](C)(OC)[C@@H](O)[C@H](C)O1 ULGZDMOVFRHVEP-RWJQBGPGSA-N 0.000 description 2
- UIOFUWFRIANQPC-JKIFEVAISA-N Floxacillin Chemical compound N([C@@H]1C(N2[C@H](C(C)(C)S[C@@H]21)C(O)=O)=O)C(=O)C1=C(C)ON=C1C1=C(F)C=CC=C1Cl UIOFUWFRIANQPC-JKIFEVAISA-N 0.000 description 2
- IECPWNUMDGFDKC-UHFFFAOYSA-N Fusicsaeure Natural products C12C(O)CC3C(=C(CCC=C(C)C)C(O)=O)C(OC(C)=O)CC3(C)C1(C)CCC1C2(C)CCC(O)C1C IECPWNUMDGFDKC-UHFFFAOYSA-N 0.000 description 2
- CEAZRRDELHUEMR-URQXQFDESA-N Gentamicin Chemical compound O1[C@H](C(C)NC)CC[C@@H](N)[C@H]1O[C@H]1[C@H](O)[C@@H](O[C@@H]2[C@@H]([C@@H](NC)[C@@](C)(O)CO2)O)[C@H](N)C[C@@H]1N CEAZRRDELHUEMR-URQXQFDESA-N 0.000 description 2
- AIJTTZAVMXIJGM-UHFFFAOYSA-N Grepafloxacin Chemical compound C1CNC(C)CN1C(C(=C1C)F)=CC2=C1C(=O)C(C(O)=O)=CN2C1CC1 AIJTTZAVMXIJGM-UHFFFAOYSA-N 0.000 description 2
- 102100023954 Guanine nucleotide-binding protein subunit alpha-15 Human genes 0.000 description 2
- 101000903742 Homo sapiens Basic leucine zipper transcriptional factor ATF-like Proteins 0.000 description 2
- 101000896583 Homo sapiens C3a anaphylatoxin chemotactic receptor Proteins 0.000 description 2
- 101000904080 Homo sapiens Guanine nucleotide-binding protein subunit alpha-15 Proteins 0.000 description 2
- 101000623667 Homo sapiens Mitochondrial carrier homolog 1 Proteins 0.000 description 2
- 101000633302 Homo sapiens Nicotinamide riboside kinase 1 Proteins 0.000 description 2
- 101000818425 Homo sapiens Palmitoyltransferase ZDHHC19 Proteins 0.000 description 2
- 101000911541 Homo sapiens Protein FAM214A Proteins 0.000 description 2
- 101000894525 Homo sapiens Transforming growth factor-beta-induced protein ig-h3 Proteins 0.000 description 2
- 101001104110 Homo sapiens X-linked retinitis pigmentosa GTPase regulator-interacting protein 1 Proteins 0.000 description 2
- 108010050904 Interferons Proteins 0.000 description 2
- 102000014150 Interferons Human genes 0.000 description 2
- JUZNIMUFDBIJCM-ANEDZVCMSA-N Invanz Chemical compound O=C([C@H]1NC[C@H](C1)SC=1[C@H](C)[C@@H]2[C@H](C(N2C=1C(O)=O)=O)[C@H](O)C)NC1=CC=CC(C(O)=O)=C1 JUZNIMUFDBIJCM-ANEDZVCMSA-N 0.000 description 2
- GSDSWSVVBLHKDQ-JTQLQIEISA-N Levofloxacin Chemical compound C([C@@H](N1C2=C(C(C(C(O)=O)=C1)=O)C=C1F)C)OC2=C1N1CCN(C)CC1 GSDSWSVVBLHKDQ-JTQLQIEISA-N 0.000 description 2
- TYMRLRRVMHJFTF-UHFFFAOYSA-N Mafenide Chemical compound NCC1=CC=C(S(N)(=O)=O)C=C1 TYMRLRRVMHJFTF-UHFFFAOYSA-N 0.000 description 2
- RJQXTJLFIWVMTO-TYNCELHUSA-N Methicillin Chemical compound COC1=CC=CC(OC)=C1C(=O)N[C@@H]1C(=O)N2[C@@H](C(O)=O)C(C)(C)S[C@@H]21 RJQXTJLFIWVMTO-TYNCELHUSA-N 0.000 description 2
- 102100023198 Mitochondrial carrier homolog 1 Human genes 0.000 description 2
- 102100029562 Nicotinamide riboside kinase 1 Human genes 0.000 description 2
- 102100021068 Palmitoyltransferase ZDHHC19 Human genes 0.000 description 2
- UOZODPSAJZTQNH-UHFFFAOYSA-N Paromomycin II Natural products NC1C(O)C(O)C(CN)OC1OC1C(O)C(OC2C(C(N)CC(N)C2O)OC2C(C(O)C(O)C(CO)O2)N)OC1CO UOZODPSAJZTQNH-UHFFFAOYSA-N 0.000 description 2
- 229930182555 Penicillin Natural products 0.000 description 2
- 102100026957 Protein FAM214A Human genes 0.000 description 2
- 238000003559 RNA-seq method Methods 0.000 description 2
- NHUHCSRWZMLRLA-UHFFFAOYSA-N Sulfisoxazole Chemical compound CC1=NOC(NS(=O)(=O)C=2C=CC(N)=CC=2)=C1C NHUHCSRWZMLRLA-UHFFFAOYSA-N 0.000 description 2
- 108010053950 Teicoplanin Proteins 0.000 description 2
- 239000004098 Tetracycline Substances 0.000 description 2
- 102100021398 Transforming growth factor-beta-induced protein ig-h3 Human genes 0.000 description 2
- HDOVUKNUBWVHOX-QMMMGPOBSA-N Valacyclovir Chemical compound N1C(N)=NC(=O)C2=C1N(COCCOC(=O)[C@@H](N)C(C)C)C=N2 HDOVUKNUBWVHOX-QMMMGPOBSA-N 0.000 description 2
- 108010059993 Vancomycin Proteins 0.000 description 2
- 102100040089 X-linked retinitis pigmentosa GTPase regulator-interacting protein 1 Human genes 0.000 description 2
- 230000009471 action Effects 0.000 description 2
- 230000001154 acute effect Effects 0.000 description 2
- 239000000556 agonist Substances 0.000 description 2
- 229960003805 amantadine Drugs 0.000 description 2
- DKNWSYNQZKUICI-UHFFFAOYSA-N amantadine Chemical compound C1C(C2)CC3CC2CC1(N)C3 DKNWSYNQZKUICI-UHFFFAOYSA-N 0.000 description 2
- LKCWBDHBTVXHDL-RMDFUYIESA-N amikacin Chemical compound O([C@@H]1[C@@H](N)C[C@H]([C@@H]([C@H]1O)O[C@@H]1[C@@H]([C@@H](N)[C@H](O)[C@@H](CO)O1)O)NC(=O)[C@@H](O)CCN)[C@H]1O[C@H](CN)[C@@H](O)[C@H](O)[C@H]1O LKCWBDHBTVXHDL-RMDFUYIESA-N 0.000 description 2
- 150000001413 amino acids Chemical class 0.000 description 2
- LSQZJLSUYDQPKJ-NJBDSQKTSA-N amoxicillin Chemical compound C1([C@@H](N)C(=O)N[C@H]2[C@H]3SC([C@@H](N3C2=O)C(O)=O)(C)C)=CC=C(O)C=C1 LSQZJLSUYDQPKJ-NJBDSQKTSA-N 0.000 description 2
- AVKUERGKIZMTKX-NJBDSQKTSA-N ampicillin Chemical compound C1([C@@H](N)C(=O)N[C@H]2[C@H]3SC([C@@H](N3C2=O)C(O)=O)(C)C)=CC=CC=C1 AVKUERGKIZMTKX-NJBDSQKTSA-N 0.000 description 2
- 230000000798 anti-retroviral effect Effects 0.000 description 2
- VLAXZGHHBIJLAD-UHFFFAOYSA-N arsphenamine Chemical compound [Cl-].[Cl-].C1=C(O)C([NH3+])=CC([As]=[As]C=2C=C([NH3+])C(O)=CC=2)=C1 VLAXZGHHBIJLAD-UHFFFAOYSA-N 0.000 description 2
- 230000005540 biological transmission Effects 0.000 description 2
- 239000000090 biomarker Substances 0.000 description 2
- PPKJUHVNTMYXOD-PZGPJMECSA-N c49ws9n75l Chemical compound O=C([C@@H]1N(C2=O)CC[C@H]1S(=O)(=O)CCN(CC)CC)O[C@H](C(C)C)[C@H](C)\C=C\C(=O)NC\C=C\C(\C)=C\[C@@H](O)CC(=O)CC1=NC2=CO1.N([C@@H]1C(=O)N[C@@H](C(N2CCC[C@H]2C(=O)N(C)[C@@H](CC=2C=CC(=CC=2)N(C)C)C(=O)N2C[C@@H](CS[C@H]3C4CCN(CC4)C3)C(=O)C[C@H]2C(=O)N[C@H](C(=O)O[C@@H]1C)C=1C=CC=CC=1)=O)CC)C(=O)C1=NC=CC=C1O PPKJUHVNTMYXOD-PZGPJMECSA-N 0.000 description 2
- 238000004364 calculation method Methods 0.000 description 2
- FPPNZSSZRUTDAP-UWFZAAFLSA-N carbenicillin Chemical compound N([C@H]1[C@H]2SC([C@@H](N2C1=O)C(O)=O)(C)C)C(=O)C(C(O)=O)C1=CC=CC=C1 FPPNZSSZRUTDAP-UWFZAAFLSA-N 0.000 description 2
- 229960005361 cefaclor Drugs 0.000 description 2
- QYIYFLOTGYLRGG-GPCCPHFNSA-N cefaclor Chemical compound C1([C@H](C(=O)N[C@@H]2C(N3C(=C(Cl)CS[C@@H]32)C(O)=O)=O)N)=CC=CC=C1 QYIYFLOTGYLRGG-GPCCPHFNSA-N 0.000 description 2
- ZCCUWMICIWSJIX-NQJJCJBVSA-N ceftaroline fosamil Chemical compound S([C@@H]1[C@@H](C(N1C=1C([O-])=O)=O)NC(=O)\C(=N/OCC)C=2N=C(NP(O)(O)=O)SN=2)CC=1SC(SC=1)=NC=1C1=CC=[N+](C)C=C1 ZCCUWMICIWSJIX-NQJJCJBVSA-N 0.000 description 2
- VOAZJEPQLGBXGO-SDAWRPRTSA-N ceftobiprole Chemical compound S1C(N)=NC(C(=N\O)\C(=O)N[C@@H]2C(N3C(=C(\C=C/4C(N([C@H]5CNCC5)CC\4)=O)CS[C@@H]32)C(O)=O)=O)=N1 VOAZJEPQLGBXGO-SDAWRPRTSA-N 0.000 description 2
- ZAIPMKNFIOOWCQ-UEKVPHQBSA-N cephalexin Chemical compound C1([C@@H](N)C(=O)N[C@H]2[C@@H]3N(C2=O)C(=C(CS3)C)C(O)=O)=CC=CC=C1 ZAIPMKNFIOOWCQ-UEKVPHQBSA-N 0.000 description 2
- WIIZWVCIJKGZOK-RKDXNWHRSA-N chloramphenicol Chemical compound ClC(Cl)C(=O)N[C@H](CO)[C@H](O)C1=CC=C([N+]([O-])=O)C=C1 WIIZWVCIJKGZOK-RKDXNWHRSA-N 0.000 description 2
- AGOYDEPGAOXOCK-KCBOHYOISA-N clarithromycin Chemical compound O([C@@H]1[C@@H](C)C(=O)O[C@@H]([C@@]([C@H](O)[C@@H](C)C(=O)[C@H](C)C[C@](C)([C@H](O[C@H]2[C@@H]([C@H](C[C@@H](C)O2)N(C)C)O)[C@H]1C)OC)(C)O)CC)[C@H]1C[C@@](C)(OC)[C@@H](O)[C@H](C)O1 AGOYDEPGAOXOCK-KCBOHYOISA-N 0.000 description 2
- KDLRVYVGXIQJDK-AWPVFWJPSA-N clindamycin Chemical compound CN1C[C@H](CCC)C[C@H]1C(=O)N[C@H]([C@H](C)Cl)[C@@H]1[C@H](O)[C@H](O)[C@@H](O)[C@@H](SC)O1 KDLRVYVGXIQJDK-AWPVFWJPSA-N 0.000 description 2
- WDQPAMHFFCXSNU-BGABXYSRSA-N clofazimine Chemical compound C12=CC=CC=C2N=C2C=C(NC=3C=CC(Cl)=CC=3)C(=N/C(C)C)/C=C2N1C1=CC=C(Cl)C=C1 WDQPAMHFFCXSNU-BGABXYSRSA-N 0.000 description 2
- 229960004287 clofazimine Drugs 0.000 description 2
- LQOLIRLGBULYKD-JKIFEVAISA-N cloxacillin Chemical compound N([C@@H]1C(N2[C@H](C(C)(C)S[C@@H]21)C(O)=O)=O)C(=O)C1=C(C)ON=C1C1=CC=CC=C1Cl LQOLIRLGBULYKD-JKIFEVAISA-N 0.000 description 2
- 229940047766 co-trimoxazole Drugs 0.000 description 2
- 230000002596 correlated effect Effects 0.000 description 2
- 230000000875 corresponding effect Effects 0.000 description 2
- 229960002488 dalbavancin Drugs 0.000 description 2
- 108700009376 dalbavancin Proteins 0.000 description 2
- KGPGQDLTDHGEGT-SZUNQUCBSA-N dalbavancin Chemical compound C=1C([C@@H]2C(=O)N[C@H](C(N[C@@H](C3=CC(O)=C4)C(=O)NCCCN(C)C)=O)[C@H](O)C5=CC=C(C(=C5)Cl)OC=5C=C6C=C(C=5O[C@H]5[C@@H]([C@@H](O)[C@H](O)[C@H](O5)C(O)=O)NC(=O)CCCCCCCCC(C)C)OC5=CC=C(C=C5)C[C@@H]5C(=O)N[C@H](C(N[C@H]6C(=O)N2)=O)C=2C(Cl)=C(O)C=C(C=2)OC=2C(O)=CC=C(C=2)[C@H](C(N5)=O)NC)=CC=C(O)C=1C3=C4O[C@H]1O[C@H](CO)[C@@H](O)[C@H](O)[C@@H]1O KGPGQDLTDHGEGT-SZUNQUCBSA-N 0.000 description 2
- DOAKLVKFURWEDJ-QCMAZARJSA-N daptomycin Chemical compound C([C@H]1C(=O)O[C@H](C)[C@@H](C(NCC(=O)N[C@@H](CCCN)C(=O)N[C@@H](CC(O)=O)C(=O)N[C@H](C)C(=O)N[C@@H](CC(O)=O)C(=O)NCC(=O)N[C@H](CO)C(=O)N[C@H](C(=O)N1)[C@H](C)CC(O)=O)=O)NC(=O)[C@H](CC(O)=O)NC(=O)[C@@H](CC(N)=O)NC(=O)[C@H](CC=1C2=CC=CC=C2NC=1)NC(=O)CCCCCCCCC)C(=O)C1=CC=CC=C1N DOAKLVKFURWEDJ-QCMAZARJSA-N 0.000 description 2
- 230000003247 decreasing effect Effects 0.000 description 2
- WHBIGIKBNXZKFE-UHFFFAOYSA-N delavirdine Chemical compound CC(C)NC1=CC=CN=C1N1CCN(C(=O)C=2NC3=CC=C(NS(C)(=O)=O)C=C3C=2)CC1 WHBIGIKBNXZKFE-UHFFFAOYSA-N 0.000 description 2
- YFAGHNZHGGCZAX-JKIFEVAISA-N dicloxacillin Chemical compound N([C@@H]1C(N2[C@H](C(C)(C)S[C@@H]21)C(O)=O)=O)C(=O)C1=C(C)ON=C1C1=C(Cl)C=CC=C1Cl YFAGHNZHGGCZAX-JKIFEVAISA-N 0.000 description 2
- WLOHNSSYAXHWNR-DWIOZXRMSA-N dirithromycin Chemical compound O([C@@H]1[C@@H](C)C(=O)O[C@@H]([C@@]([C@@H]2O[C@H](COCCOC)N[C@H]([C@@H]2C)[C@H](C)C[C@@](C)(O)[C@H](O[C@H]2[C@@H]([C@H](C[C@@H](C)O2)N(C)C)O)[C@H]1C)(C)O)CC)[C@H]1C[C@@](C)(OC)[C@@H](O)[C@H](C)O1 WLOHNSSYAXHWNR-DWIOZXRMSA-N 0.000 description 2
- NOPFSRXAKWQILS-UHFFFAOYSA-N docosan-1-ol Chemical compound CCCCCCCCCCCCCCCCCCCCCCO NOPFSRXAKWQILS-UHFFFAOYSA-N 0.000 description 2
- AVAACINZEOAHHE-VFZPANTDSA-N doripenem Chemical compound C=1([C@H](C)[C@@H]2[C@H](C(N2C=1C(O)=O)=O)[C@H](O)C)S[C@@H]1CN[C@H](CNS(N)(=O)=O)C1 AVAACINZEOAHHE-VFZPANTDSA-N 0.000 description 2
- PEASPLKKXBYDKL-FXEVSJAOSA-N enfuvirtide Chemical compound C([C@@H](C(=O)N[C@@H](CO)C(=O)N[C@@H](CC(C)C)C(=O)N[C@@H]([C@@H](C)CC)C(=O)N[C@@H](CCC(O)=O)C(=O)N[C@@H](CCC(O)=O)C(=O)N[C@@H](CO)C(=O)N[C@@H](CCC(N)=O)C(=O)N[C@@H](CC(N)=O)C(=O)N[C@@H](CCC(N)=O)C(=O)N[C@@H](CCC(N)=O)C(=O)N[C@@H](CCC(O)=O)C(=O)N[C@@H](CCCCN)C(=O)N[C@@H](CC(N)=O)C(=O)N[C@@H](CCC(O)=O)C(=O)N[C@@H](CCC(N)=O)C(=O)N[C@@H](CCC(O)=O)C(=O)N[C@@H](CC(C)C)C(=O)N[C@@H](CC(C)C)C(=O)N[C@@H](CCC(O)=O)C(=O)N[C@@H](CC(C)C)C(=O)N[C@@H](CC(O)=O)C(=O)N[C@@H](CCCCN)C(=O)N[C@@H](CC=1C2=CC=CC=C2NC=1)C(=O)N[C@@H](C)C(=O)N[C@@H](CO)C(=O)N[C@@H](CC(C)C)C(=O)N[C@@H](CC=1C2=CC=CC=C2NC=1)C(=O)N[C@@H](CC(N)=O)C(=O)N[C@@H](CC=1C2=CC=CC=C2NC=1)C(=O)N[C@@H](CC=1C=CC=CC=1)C(N)=O)NC(=O)[C@@H](NC(=O)[C@H](CC(C)C)NC(=O)[C@H](CO)NC(=O)[C@@H](NC(=O)[C@H](CC=1C=CC(O)=CC=1)NC(C)=O)[C@@H](C)O)[C@@H](C)CC)C1=CN=CN1 PEASPLKKXBYDKL-FXEVSJAOSA-N 0.000 description 2
- IDYZIJYBMGIQMJ-UHFFFAOYSA-N enoxacin Chemical compound N1=C2N(CC)C=C(C(O)=O)C(=O)C2=CC(F)=C1N1CCNCC1 IDYZIJYBMGIQMJ-UHFFFAOYSA-N 0.000 description 2
- AEOCXXJPGCBFJA-UHFFFAOYSA-N ethionamide Chemical compound CCC1=CC(C(N)=S)=CC=N1 AEOCXXJPGCBFJA-UHFFFAOYSA-N 0.000 description 2
- 238000002474 experimental method Methods 0.000 description 2
- 229960001447 fomivirsen Drugs 0.000 description 2
- XCWFZHPEARLXJI-UHFFFAOYSA-N fomivirsen Chemical compound C1C(N2C3=C(C(NC(N)=N3)=O)N=C2)OC(CO)C1OP(O)(=S)OCC1OC(N(C)C(=O)\N=C(\N)C=C)CC1OP(O)(=S)OCC1OC(N2C3=C(C(NC(N)=N3)=O)N=C2)CC1OP(O)(=S)OCC1OC(N2C(NC(=O)C(C)=C2)=O)CC1OP(O)(=S)OCC1OC(N2C(NC(=O)C(C)=C2)=O)CC1OP(O)(=S)OCC1OC(N2C(NC(=O)C(C)=C2)=O)CC1OP(O)(=S)OCC1OC(N2C3=C(C(NC(N)=N3)=O)N=C2)CC1OP(O)(=S)OCC1OC(N2C(N=C(N)C=C2)=O)CC1OP(O)(=S)OCC(C(C1)OP(S)(=O)OCC2C(CC(O2)N2C(N=C(N)C=C2)=O)OP(O)(=S)OCC2C(CC(O2)N2C(NC(=O)C(C)=C2)=O)OP(O)(=S)OCC2C(CC(O2)N2C(NC(=O)C(C)=C2)=O)OP(O)(=S)OCC2C(CC(O2)N2C(N=C(N)C=C2)=O)OP(O)(=S)OCC2C(CC(O2)N2C(NC(=O)C(C)=C2)=O)OP(O)(=S)OCC2C(CC(O2)N2C(NC(=O)C(C)=C2)=O)OP(O)(=S)OCC2C(CC(O2)N2C(N=C(N)C=C2)=O)OP(O)(=S)OCC2C(CC(O2)N2C(NC(=O)C(C)=C2)=O)OP(O)(=S)OCC2C(CC(O2)N2C(NC(=O)C(C)=C2)=O)OP(O)(=S)OCC2C(CC(O2)N2C3=C(C(NC(N)=N3)=O)N=C2)OP(O)(=S)OCC2C(CC(O2)N2C(N=C(N)C=C2)=O)OP(O)(=S)OCC2C(CC(O2)N2C3=C(C(NC(N)=N3)=O)N=C2)O)OC1N1C=C(C)C(=O)NC1=O XCWFZHPEARLXJI-UHFFFAOYSA-N 0.000 description 2
- YMDXZJFXQJVXBF-STHAYSLISA-N fosfomycin Chemical compound C[C@@H]1O[C@@H]1P(O)(O)=O YMDXZJFXQJVXBF-STHAYSLISA-N 0.000 description 2
- 229960001625 furazolidone Drugs 0.000 description 2
- PLHJDBGFXBMTGZ-WEVVVXLNSA-N furazolidone Chemical compound O1C([N+](=O)[O-])=CC=C1\C=N\N1C(=O)OCC1 PLHJDBGFXBMTGZ-WEVVVXLNSA-N 0.000 description 2
- 230000036541 health Effects 0.000 description 2
- 238000007912 intraperitoneal administration Methods 0.000 description 2
- 229960001627 lamivudine Drugs 0.000 description 2
- JTEGQNOMFQHVDC-NKWVEPMBSA-N lamivudine Chemical compound O=C1N=C(N)C=CN1[C@H]1O[C@@H](CO)SC1 JTEGQNOMFQHVDC-NKWVEPMBSA-N 0.000 description 2
- OJMMVQQUTAEWLP-KIDUDLJLSA-N lincomycin Chemical compound CN1C[C@H](CCC)C[C@H]1C(=O)N[C@H]([C@@H](C)O)[C@@H]1[C@H](O)[C@H](O)[C@@H](O)[C@@H](SC)O1 OJMMVQQUTAEWLP-KIDUDLJLSA-N 0.000 description 2
- TYZROVQLWOKYKF-ZDUSSCGKSA-N linezolid Chemical compound O=C1O[C@@H](CNC(=O)C)CN1C(C=C1F)=CC=C1N1CCOCC1 TYZROVQLWOKYKF-ZDUSSCGKSA-N 0.000 description 2
- ZEKZLJVOYLTDKK-UHFFFAOYSA-N lomefloxacin Chemical compound FC1=C2N(CC)C=C(C(O)=O)C(=O)C2=CC(F)=C1N1CCNC(C)C1 ZEKZLJVOYLTDKK-UHFFFAOYSA-N 0.000 description 2
- 229960001977 loracarbef Drugs 0.000 description 2
- JAPHQRWPEGVNBT-UTUOFQBUSA-M loracarbef anion Chemical compound C1([C@H](C(=O)N[C@@H]2C(N3C(=C(Cl)CC[C@@H]32)C([O-])=O)=O)N)=CC=CC=C1 JAPHQRWPEGVNBT-UTUOFQBUSA-M 0.000 description 2
- DMJNNHOOLUXYBV-PQTSNVLCSA-N meropenem Chemical compound C=1([C@H](C)[C@@H]2[C@H](C(N2C=1C(O)=O)=O)[C@H](O)C)S[C@@H]1CN[C@H](C(=O)N(C)C)C1 DMJNNHOOLUXYBV-PQTSNVLCSA-N 0.000 description 2
- 229960003085 meticillin Drugs 0.000 description 2
- VAOCPAMSLUNLGC-UHFFFAOYSA-N metronidazole Chemical compound CC1=NC=C([N+]([O-])=O)N1CCO VAOCPAMSLUNLGC-UHFFFAOYSA-N 0.000 description 2
- YPBATNHYBCGSSN-VWPFQQQWSA-N mezlocillin Chemical compound N([C@@H](C(=O)N[C@H]1[C@H]2SC([C@@H](N2C1=O)C(O)=O)(C)C)C=1C=CC=CC=1)C(=O)N1CCN(S(C)(=O)=O)C1=O YPBATNHYBCGSSN-VWPFQQQWSA-N 0.000 description 2
- FABPRXSRWADJSP-MEDUHNTESA-N moxifloxacin Chemical compound COC1=C(N2C[C@H]3NCCC[C@H]3C2)C(F)=CC(C(C(C(O)=O)=C2)=O)=C1N2C1CC1 FABPRXSRWADJSP-MEDUHNTESA-N 0.000 description 2
- DDHVILIIHBIMQU-YJGQQKNPSA-L mupirocin calcium hydrate Chemical compound O.O.[Ca+2].C[C@H](O)[C@H](C)[C@@H]1O[C@H]1C[C@@H]1[C@@H](O)[C@@H](O)[C@H](C\C(C)=C\C(=O)OCCCCCCCCC([O-])=O)OC1.C[C@H](O)[C@H](C)[C@@H]1O[C@H]1C[C@@H]1[C@@H](O)[C@@H](O)[C@H](C\C(C)=C\C(=O)OCCCCCCCCC([O-])=O)OC1 DDHVILIIHBIMQU-YJGQQKNPSA-L 0.000 description 2
- GPXLMGHLHQJAGZ-JTDSTZFVSA-N nafcillin Chemical compound C1=CC=CC2=C(C(=O)N[C@@H]3C(N4[C@H](C(C)(C)S[C@@H]43)C(O)=O)=O)C(OCC)=CC=C21 GPXLMGHLHQJAGZ-JTDSTZFVSA-N 0.000 description 2
- MHWLWQUZZRMNGJ-UHFFFAOYSA-N nalidixic acid Chemical compound C1=C(C)N=C2N(CC)C=C(C(O)=O)C(=O)C2=C1 MHWLWQUZZRMNGJ-UHFFFAOYSA-N 0.000 description 2
- 229960000808 netilmicin Drugs 0.000 description 2
- NQDJXKOVJZTUJA-UHFFFAOYSA-N nevirapine Chemical compound C12=NC=CC=C2C(=O)NC=2C(C)=CC=NC=2N1C1CC1 NQDJXKOVJZTUJA-UHFFFAOYSA-N 0.000 description 2
- OGJPXUAPXNRGGI-UHFFFAOYSA-N norfloxacin Chemical compound C1=C2N(CC)C=C(C(O)=O)C(=O)C2=CC(F)=C1N1CCNCC1 OGJPXUAPXNRGGI-UHFFFAOYSA-N 0.000 description 2
- 229940127073 nucleoside analogue Drugs 0.000 description 2
- 210000000056 organ Anatomy 0.000 description 2
- 108010006945 oritavancin Proteins 0.000 description 2
- 229960003752 oseltamivir Drugs 0.000 description 2
- VSZGPKBBMSAYNT-RRFJBIMHSA-N oseltamivir Chemical compound CCOC(=O)C1=C[C@@H](OC(CC)CC)[C@H](NC(C)=O)[C@@H](N)C1 VSZGPKBBMSAYNT-RRFJBIMHSA-N 0.000 description 2
- PGZUMBJQJWIWGJ-ONAKXNSWSA-N oseltamivir phosphate Chemical compound OP(O)(O)=O.CCOC(=O)C1=C[C@@H](OC(CC)CC)[C@H](NC(C)=O)[C@@H](N)C1 PGZUMBJQJWIWGJ-ONAKXNSWSA-N 0.000 description 2
- UWYHMGVUTGAWSP-JKIFEVAISA-N oxacillin Chemical compound N([C@@H]1C(N2[C@H](C(C)(C)S[C@@H]21)C(O)=O)=O)C(=O)C1=C(C)ON=C1C1=CC=CC=C1 UWYHMGVUTGAWSP-JKIFEVAISA-N 0.000 description 2
- UOZODPSAJZTQNH-LSWIJEOBSA-N paromomycin Chemical compound N[C@@H]1[C@@H](O)[C@H](O)[C@H](CN)O[C@@H]1O[C@H]1[C@@H](O)[C@H](O[C@H]2[C@@H]([C@@H](N)C[C@@H](N)[C@@H]2O)O[C@@H]2[C@@H]([C@@H](O)[C@H](O)[C@@H](CO)O2)N)O[C@@H]1CO UOZODPSAJZTQNH-LSWIJEOBSA-N 0.000 description 2
- 229940056360 penicillin g Drugs 0.000 description 2
- BPLBGHOLXOTWMN-MBNYWOFBSA-N phenoxymethylpenicillin Chemical compound N([C@H]1[C@H]2SC([C@@H](N2C1=O)C(O)=O)(C)C)C(=O)COC1=CC=CC=C1 BPLBGHOLXOTWMN-MBNYWOFBSA-N 0.000 description 2
- ZJAOAACCNHFJAH-UHFFFAOYSA-N phosphonoformic acid Chemical compound OC(=O)P(O)(O)=O ZJAOAACCNHFJAH-UHFFFAOYSA-N 0.000 description 2
- IVBHGBMCVLDMKU-GXNBUGAJSA-N piperacillin Chemical compound O=C1C(=O)N(CC)CCN1C(=O)N[C@H](C=1C=CC=CC=1)C(=O)N[C@@H]1C(=O)N2[C@@H](C(O)=O)C(C)(C)S[C@@H]21 IVBHGBMCVLDMKU-GXNBUGAJSA-N 0.000 description 2
- 229960000471 pleconaril Drugs 0.000 description 2
- KQOXLKOJHVFTRN-UHFFFAOYSA-N pleconaril Chemical compound O1N=C(C)C=C1CCCOC1=C(C)C=C(C=2N=C(ON=2)C(F)(F)F)C=C1C KQOXLKOJHVFTRN-UHFFFAOYSA-N 0.000 description 2
- ABBQGOCHXSPKHJ-WUKNDPDISA-N prontosil Chemical compound NC1=CC(N)=CC=C1\N=N\C1=CC=C(S(N)(=O)=O)C=C1 ABBQGOCHXSPKHJ-WUKNDPDISA-N 0.000 description 2
- IPEHBUMCGVEMRF-UHFFFAOYSA-N pyrazinecarboxamide Chemical compound NC(=O)C1=CN=CC=N1 IPEHBUMCGVEMRF-UHFFFAOYSA-N 0.000 description 2
- 229960001225 rifampicin Drugs 0.000 description 2
- WDZCUPBHRAEYDL-GZAUEHORSA-N rifapentine Chemical compound O([C@](C1=O)(C)O/C=C/[C@@H]([C@H]([C@@H](OC(C)=O)[C@H](C)[C@H](O)[C@H](C)[C@@H](O)[C@@H](C)\C=C\C=C(C)/C(=O)NC=2C(O)=C3C(O)=C4C)C)OC)C4=C1C3=C(O)C=2\C=N\N(CC1)CCN1C1CCCC1 WDZCUPBHRAEYDL-GZAUEHORSA-N 0.000 description 2
- NZCRJKRKKOLAOJ-XRCRFVBUSA-N rifaximin Chemical compound OC1=C(C(O)=C2C)C3=C4N=C5C=C(C)C=CN5C4=C1NC(=O)\C(C)=C/C=C/[C@H](C)[C@H](O)[C@@H](C)[C@@H](O)[C@@H](C)[C@H](OC(C)=O)[C@H](C)[C@@H](OC)\C=C\O[C@@]1(C)OC2=C3C1=O NZCRJKRKKOLAOJ-XRCRFVBUSA-N 0.000 description 2
- 229960000888 rimantadine Drugs 0.000 description 2
- 238000013515 script Methods 0.000 description 2
- DZZWHBIBMUVIIW-DTORHVGOSA-N sparfloxacin Chemical compound C1[C@@H](C)N[C@@H](C)CN1C1=C(F)C(N)=C2C(=O)C(C(O)=O)=CN(C3CC3)C2=C1F DZZWHBIBMUVIIW-DTORHVGOSA-N 0.000 description 2
- 229960000268 spectinomycin Drugs 0.000 description 2
- UNFWWIHTNXNPBV-WXKVUWSESA-N spectinomycin Chemical compound O([C@@H]1[C@@H](NC)[C@@H](O)[C@H]([C@@H]([C@H]1O1)O)NC)[C@]2(O)[C@H]1O[C@H](C)CC2=O UNFWWIHTNXNPBV-WXKVUWSESA-N 0.000 description 2
- 229960005322 streptomycin Drugs 0.000 description 2
- 238000007920 subcutaneous administration Methods 0.000 description 2
- ZZORFUFYDOWNEF-UHFFFAOYSA-N sulfadimethoxine Chemical compound COC1=NC(OC)=CC(NS(=O)(=O)C=2C=CC(N)=CC=2)=N1 ZZORFUFYDOWNEF-UHFFFAOYSA-N 0.000 description 2
- VACCAVUAMIDAGB-UHFFFAOYSA-N sulfamethizole Chemical compound S1C(C)=NN=C1NS(=O)(=O)C1=CC=C(N)C=C1 VACCAVUAMIDAGB-UHFFFAOYSA-N 0.000 description 2
- NCEXYHBECQHGNR-QZQOTICOSA-N sulfasalazine Chemical compound C1=C(O)C(C(=O)O)=CC(\N=N\C=2C=CC(=CC=2)S(=O)(=O)NC=2N=CC=CC=2)=C1 NCEXYHBECQHGNR-QZQOTICOSA-N 0.000 description 2
- 229940061367 tamiflu Drugs 0.000 description 2
- 108010089019 telavancin Proteins 0.000 description 2
- LJVAJPDWBABPEJ-PNUFFHFMSA-N telithromycin Chemical compound O([C@@H]1[C@@H](C)C(=O)[C@@H](C)C(=O)O[C@@H]([C@]2(OC(=O)N(CCCCN3C=C(N=C3)C=3C=NC=CC=3)[C@@H]2[C@@H](C)C(=O)[C@H](C)C[C@@]1(C)OC)C)CC)[C@@H]1O[C@H](C)C[C@H](N(C)C)[C@H]1O LJVAJPDWBABPEJ-PNUFFHFMSA-N 0.000 description 2
- BVCKFLJARNKCSS-DWPRYXJFSA-N temocillin Chemical compound N([C@]1(OC)C(N2[C@H](C(C)(C)S[C@@H]21)C(O)=O)=O)C(=O)C(C(O)=O)C=1C=CSC=1 BVCKFLJARNKCSS-DWPRYXJFSA-N 0.000 description 2
- 235000019364 tetracycline Nutrition 0.000 description 2
- 150000003522 tetracyclines Chemical class 0.000 description 2
- 229960004659 ticarcillin Drugs 0.000 description 2
- 229960000707 tobramycin Drugs 0.000 description 2
- MYPYJXKWCTUITO-LYRMYLQWSA-N vancomycin Chemical compound O([C@@H]1[C@@H](O)[C@H](O)[C@@H](CO)O[C@H]1OC1=C2C=C3C=C1OC1=CC=C(C=C1Cl)[C@@H](O)[C@H](C(N[C@@H](CC(N)=O)C(=O)N[C@H]3C(=O)N[C@H]1C(=O)N[C@H](C(N[C@@H](C3=CC(O)=CC(O)=C3C=3C(O)=CC=C1C=3)C(O)=O)=O)[C@H](O)C1=CC=C(C(=C1)Cl)O2)=O)NC(=O)[C@@H](CC(C)C)NC)[C@H]1C[C@](C)(N)[C@H](O)[C@H](C)O1 MYPYJXKWCTUITO-LYRMYLQWSA-N 0.000 description 2
- MYPYJXKWCTUITO-UHFFFAOYSA-N vancomycin Natural products O1C(C(=C2)Cl)=CC=C2C(O)C(C(NC(C2=CC(O)=CC(O)=C2C=2C(O)=CC=C3C=2)C(O)=O)=O)NC(=O)C3NC(=O)C2NC(=O)C(CC(N)=O)NC(=O)C(NC(=O)C(CC(C)C)NC)C(O)C(C=C3Cl)=CC=C3OC3=CC2=CC1=C3OC1OC(CO)C(O)C(O)C1OC1CC(C)(N)C(O)C(C)O1 MYPYJXKWCTUITO-UHFFFAOYSA-N 0.000 description 2
- ARAIBEBZBOPLMB-UFGQHTETSA-N zanamivir Chemical compound CC(=O)N[C@@H]1[C@@H](N=C(N)N)C=C(C(O)=O)O[C@H]1[C@H](O)[C@H](O)CO ARAIBEBZBOPLMB-UFGQHTETSA-N 0.000 description 2
- BJNLLBUOHPVGFT-CAYRISATSA-N (1S,2R,19R,22R,34S,37R,40R,52S)-2-[(2R,3R,4R,5S,6R)-3-acetamido-4,5-dihydroxy-6-(hydroxymethyl)oxan-2-yl]oxy-22-amino-5,15-dichloro-64-[(2S,3R,4R,5S,6R)-3-(decanoylamino)-4,5-dihydroxy-6-(hydroxymethyl)oxan-2-yl]oxy-26,31,44,49-tetrahydroxy-21,35,38,54,56,59-hexaoxo-47-[(3S,4S,5S,6R)-3,4,5-trihydroxy-6-(hydroxymethyl)oxan-2-yl]oxy-7,13,28-trioxa-20,36,39,53,55,58-hexazaundecacyclo[38.14.2.23,6.214,17.219,34.18,12.123,27.129,33.141,45.010,37.046,51]hexahexaconta-3,5,8,10,12(64),14,16,23(61),24,26,29(60),30,32,41(57),42,44,46(51),47,49,62,65-henicosaene-52-carboxylic acid Chemical compound CCCCCCCCCC(=O)N[C@@H]1[C@@H](O)[C@H](O)[C@@H](CO)O[C@H]1Oc1c2Oc3ccc(C[C@H]4NC(=O)[C@H](N)c5ccc(O)c(Oc6cc(O)cc(c6)[C@H](NC4=O)C(=O)N[C@@H]4c(c2)cc1Oc1ccc(cc1Cl)[C@@H](O[C@@H]1O[C@H](CO)[C@@H](O)[C@H](O)[C@H]1NC(C)=O)[C@@H]1NC(=O)[C@H](NC4=O)c2ccc(O)c(c2)-c2c(OC4O[C@H](CO)[C@@H](O)[C@H](O)[C@@H]4O)cc(O)cc2[C@H](NC1=O)C(O)=O)c5)cc3Cl BJNLLBUOHPVGFT-CAYRISATSA-N 0.000 description 1
- OIXVKQDWLFHVGR-GQTDVWSESA-N (2r,3s,4r,5r,6r)-5-amino-2-(aminomethyl)-6-[(1r,2r,3s,4r,6s)-4,6-diamino-2-[(2s,3r,4s,5r)-4-[(3r,4r,5s,6s)-3-amino-6-(aminomethyl)-4,5-dihydroxyoxan-2-yl]oxy-3-hydroxy-5-(hydroxymethyl)oxolan-2-yl]oxy-3-hydroxycyclohexyl]oxyoxane-3,4-diol;sulfuric acid Chemical compound OS(O)(=O)=O.N[C@@H]1[C@@H](O)[C@H](O)[C@H](CN)OC1O[C@H]1[C@@H](O)[C@H](O[C@H]2[C@@H]([C@@H](N)C[C@@H](N)[C@@H]2O)O[C@@H]2[C@@H]([C@@H](O)[C@H](O)[C@@H](CN)O2)N)O[C@@H]1CO OIXVKQDWLFHVGR-GQTDVWSESA-N 0.000 description 1
- NZKFUBQRAWPZJP-BXKLGIMVSA-N (2s,3r,4s,5s,6r)-4-amino-2-[(1s,2s,3r,4s,6r)-4,6-diamino-3-[(2r,3r,5s,6r)-3-amino-6-(aminomethyl)-5-hydroxyoxan-2-yl]oxy-2-hydroxycyclohexyl]oxy-6-(hydroxymethyl)oxane-3,5-diol;sulfuric acid Chemical compound OS(O)(=O)=O.OS(O)(=O)=O.OS(O)(=O)=O.OS(O)(=O)=O.OS(O)(=O)=O.N[C@@H]1C[C@H](O)[C@@H](CN)O[C@@H]1O[C@H]1[C@H](O)[C@@H](O[C@@H]2[C@@H]([C@@H](N)[C@H](O)[C@@H](CO)O2)O)[C@H](N)C[C@@H]1N.N[C@@H]1C[C@H](O)[C@@H](CN)O[C@@H]1O[C@H]1[C@H](O)[C@@H](O[C@@H]2[C@@H]([C@@H](N)[C@H](O)[C@@H](CO)O2)O)[C@H](N)C[C@@H]1N NZKFUBQRAWPZJP-BXKLGIMVSA-N 0.000 description 1
- LITBAYYWXZOHAW-XDZRHBBOSA-N (2s,5r,6r)-6-[[(2r)-2-[(4-ethyl-2,3-dioxopiperazine-1-carbonyl)amino]-2-phenylacetyl]amino]-3,3-dimethyl-7-oxo-4-thia-1-azabicyclo[3.2.0]heptane-2-carboxylic acid;(2s,3s,5r)-3-methyl-4,4,7-trioxo-3-(triazol-1-ylmethyl)-4$l^{6}-thia-1-azabicyclo[3.2.0]hept Chemical compound C([C@]1(C)S([C@H]2N(C(C2)=O)[C@H]1C(O)=O)(=O)=O)N1C=CN=N1.O=C1C(=O)N(CC)CCN1C(=O)N[C@H](C=1C=CC=CC=1)C(=O)N[C@@H]1C(=O)N2[C@@H](C(O)=O)C(C)(C)S[C@@H]21 LITBAYYWXZOHAW-XDZRHBBOSA-N 0.000 description 1
- CNPVJJQCETWNEU-CYFREDJKSA-N (4,6-dimethyl-5-pyrimidinyl)-[4-[(3S)-4-[(1R)-2-methoxy-1-[4-(trifluoromethyl)phenyl]ethyl]-3-methyl-1-piperazinyl]-4-methyl-1-piperidinyl]methanone Chemical compound N([C@@H](COC)C=1C=CC(=CC=1)C(F)(F)F)([C@H](C1)C)CCN1C(CC1)(C)CCN1C(=O)C1=C(C)N=CN=C1C CNPVJJQCETWNEU-CYFREDJKSA-N 0.000 description 1
- SGKRLCUYIXIAHR-AKNGSSGZSA-N (4s,4ar,5s,5ar,6r,12ar)-4-(dimethylamino)-1,5,10,11,12a-pentahydroxy-6-methyl-3,12-dioxo-4a,5,5a,6-tetrahydro-4h-tetracene-2-carboxamide Chemical compound C1=CC=C2[C@H](C)[C@@H]([C@H](O)[C@@H]3[C@](C(O)=C(C(N)=O)C(=O)[C@H]3N(C)C)(O)C3=O)C3=C(O)C2=C1O SGKRLCUYIXIAHR-AKNGSSGZSA-N 0.000 description 1
- UHHHTIKWXBRCLT-VDBOFHIQSA-N (4s,4ar,5s,5ar,6r,12ar)-4-(dimethylamino)-1,5,10,11,12a-pentahydroxy-6-methyl-3,12-dioxo-4a,5,5a,6-tetrahydro-4h-tetracene-2-carboxamide;ethanol;hydrate;dihydrochloride Chemical compound O.Cl.Cl.CCO.C1=CC=C2[C@H](C)[C@@H]([C@H](O)[C@@H]3[C@](C(O)=C(C(N)=O)C(=O)[C@H]3N(C)C)(O)C3=O)C3=C(O)C2=C1O.C1=CC=C2[C@H](C)[C@@H]([C@H](O)[C@@H]3[C@](C(O)=C(C(N)=O)C(=O)[C@H]3N(C)C)(O)C3=O)C3=C(O)C2=C1O UHHHTIKWXBRCLT-VDBOFHIQSA-N 0.000 description 1
- SOVUOXKZCCAWOJ-HJYUBDRYSA-N (4s,4as,5ar,12ar)-9-[[2-(tert-butylamino)acetyl]amino]-4,7-bis(dimethylamino)-1,10,11,12a-tetrahydroxy-3,12-dioxo-4a,5,5a,6-tetrahydro-4h-tetracene-2-carboxamide Chemical compound C1C2=C(N(C)C)C=C(NC(=O)CNC(C)(C)C)C(O)=C2C(O)=C2[C@@H]1C[C@H]1[C@H](N(C)C)C(=O)C(C(N)=O)=C(O)[C@@]1(O)C2=O SOVUOXKZCCAWOJ-HJYUBDRYSA-N 0.000 description 1
- NWXMGUDVXFXRIG-WESIUVDSSA-N (4s,4as,5as,6s,12ar)-4-(dimethylamino)-1,6,10,11,12a-pentahydroxy-6-methyl-3,12-dioxo-4,4a,5,5a-tetrahydrotetracene-2-carboxamide Chemical compound C1=CC=C2[C@](O)(C)[C@H]3C[C@H]4[C@H](N(C)C)C(=O)C(C(N)=O)=C(O)[C@@]4(O)C(=O)C3=C(O)C2=C1O NWXMGUDVXFXRIG-WESIUVDSSA-N 0.000 description 1
- GUXHBMASAHGULD-SEYHBJAFSA-N (4s,4as,5as,6s,12ar)-7-chloro-4-(dimethylamino)-1,6,10,11,12a-pentahydroxy-3,12-dioxo-4a,5,5a,6-tetrahydro-4h-tetracene-2-carboxamide Chemical compound C1([C@H]2O)=C(Cl)C=CC(O)=C1C(O)=C1[C@@H]2C[C@H]2[C@H](N(C)C)C(=O)C(C(N)=O)=C(O)[C@@]2(O)C1=O GUXHBMASAHGULD-SEYHBJAFSA-N 0.000 description 1
- OAPVUSSHCBRCOL-KBHRXELFSA-N (4s,4as,5as,6s,12ar)-7-chloro-4-(dimethylamino)-1,6,10,11,12a-pentahydroxy-3,12-dioxo-4a,5,5a,6-tetrahydro-4h-tetracene-2-carboxamide;hydrochloride Chemical compound Cl.C1([C@H]2O)=C(Cl)C=CC(O)=C1C(O)=C1[C@@H]2C[C@H]2[C@H](N(C)C)C(=O)C(C(N)=O)=C(O)[C@@]2(O)C1=O OAPVUSSHCBRCOL-KBHRXELFSA-N 0.000 description 1
- HBUJYEUPIIJJOS-PBHICJAKSA-N (5r)-3-[4-[1-[(2s)-2,3-dihydroxypropanoyl]-3,6-dihydro-2h-pyridin-4-yl]-3,5-difluorophenyl]-5-(1,2-oxazol-3-yloxymethyl)-1,3-oxazolidin-2-one Chemical compound C1N(C(=O)[C@@H](O)CO)CCC(C=2C(=CC(=CC=2F)N2C(O[C@@H](COC3=NOC=C3)C2)=O)F)=C1 HBUJYEUPIIJJOS-PBHICJAKSA-N 0.000 description 1
- RXZBMPWDPOLZGW-XMRMVWPWSA-N (E)-roxithromycin Chemical compound O([C@@H]1[C@@H](C)C(=O)O[C@@H]([C@@]([C@H](O)[C@@H](C)C(=N/OCOCCOC)/[C@H](C)C[C@@](C)(O)[C@H](O[C@H]2[C@@H]([C@H](C[C@@H](C)O2)N(C)C)O)[C@H]1C)(C)O)CC)[C@H]1C[C@@](C)(OC)[C@@H](O)[C@H](C)O1 RXZBMPWDPOLZGW-XMRMVWPWSA-N 0.000 description 1
- QKDHBVNJCZBTMR-LLVKDONJSA-N (R)-temafloxacin Chemical compound C1CN[C@H](C)CN1C(C(=C1)F)=CC2=C1C(=O)C(C(O)=O)=CN2C1=CC=C(F)C=C1F QKDHBVNJCZBTMR-LLVKDONJSA-N 0.000 description 1
- XUBOMFCQGDBHNK-JTQLQIEISA-N (S)-gatifloxacin Chemical compound FC1=CC(C(C(C(O)=O)=CN2C3CC3)=O)=C2C(OC)=C1N1CCN[C@@H](C)C1 XUBOMFCQGDBHNK-JTQLQIEISA-N 0.000 description 1
- NCCJWSXETVVUHK-ZYSAIPPVSA-N (z)-7-[(2r)-2-amino-2-carboxyethyl]sulfanyl-2-[[(1s)-2,2-dimethylcyclopropanecarbonyl]amino]hept-2-enoic acid;(5r,6s)-3-[2-(aminomethylideneamino)ethylsulfanyl]-6-[(1r)-1-hydroxyethyl]-7-oxo-1-azabicyclo[3.2.0]hept-2-ene-2-carboxylic acid Chemical compound C1C(SCC\N=C/N)=C(C(O)=O)N2C(=O)[C@H]([C@H](O)C)[C@H]21.CC1(C)C[C@@H]1C(=O)N\C(=C/CCCCSC[C@H](N)C(O)=O)C(O)=O NCCJWSXETVVUHK-ZYSAIPPVSA-N 0.000 description 1
- QKDHBVNJCZBTMR-UHFFFAOYSA-N 1-(2,4-difluorophenyl)-6-fluoro-7-(3-methylpiperazin-1-yl)-4-oxo-1,4-dihydroquinoline-3-carboxylic acid Chemical compound C1CNC(C)CN1C(C(=C1)F)=CC2=C1C(=O)C(C(O)=O)=CN2C1=CC=C(F)C=C1F QKDHBVNJCZBTMR-UHFFFAOYSA-N 0.000 description 1
- IZXIZTKNFFYFOF-UHFFFAOYSA-N 2-Oxazolidone Chemical class O=C1NCCO1 IZXIZTKNFFYFOF-UHFFFAOYSA-N 0.000 description 1
- NWXMGUDVXFXRIG-UHFFFAOYSA-N 2-carbamoyl-4-(dimethylazaniumyl)-6,10,11,12a-tetrahydroxy-6-methyl-3,12-dioxo-4,4a,5,5a-tetrahydrotetracen-1-olate Chemical compound C1=CC=C2C(O)(C)C3CC4C(N(C)C)C(=O)C(C(N)=O)=C(O)C4(O)C(=O)C3=C(O)C2=C1O NWXMGUDVXFXRIG-UHFFFAOYSA-N 0.000 description 1
- FUBFWTUFPGFHOJ-UHFFFAOYSA-N 2-nitrofuran Chemical class [O-][N+](=O)C1=CC=CO1 FUBFWTUFPGFHOJ-UHFFFAOYSA-N 0.000 description 1
- YLDCUKJMEKGGFI-QCSRICIXSA-N 4-acetamidobenzoic acid;9-[(2r,3r,4s,5r)-3,4-dihydroxy-5-(hydroxymethyl)oxolan-2-yl]-3h-purin-6-one;1-(dimethylamino)propan-2-ol Chemical compound CC(O)CN(C)C.CC(O)CN(C)C.CC(O)CN(C)C.CC(=O)NC1=CC=C(C(O)=O)C=C1.CC(=O)NC1=CC=C(C(O)=O)C=C1.CC(=O)NC1=CC=C(C(O)=O)C=C1.O[C@@H]1[C@H](O)[C@@H](CO)O[C@H]1N1C(NC=NC2=O)=C2N=C1 YLDCUKJMEKGGFI-QCSRICIXSA-N 0.000 description 1
- HLOFWGGVFLUZMZ-UHFFFAOYSA-N 4-hydroxy-4-(6-methoxynaphthalen-2-yl)butan-2-one Chemical compound C1=C(C(O)CC(C)=O)C=CC2=CC(OC)=CC=C21 HLOFWGGVFLUZMZ-UHFFFAOYSA-N 0.000 description 1
- WZPBZJONDBGPKJ-UHFFFAOYSA-N Antibiotic SQ 26917 Natural products O=C1N(S(O)(=O)=O)C(C)C1NC(=O)C(=NOC(C)(C)C(O)=O)C1=CSC(N)=N1 WZPBZJONDBGPKJ-UHFFFAOYSA-N 0.000 description 1
- AXRYRYVKAWYZBR-UHFFFAOYSA-N Atazanavir Natural products C=1C=C(C=2N=CC=CC=2)C=CC=1CN(NC(=O)C(NC(=O)OC)C(C)(C)C)CC(O)C(NC(=O)C(NC(=O)OC)C(C)(C)C)CC1=CC=CC=C1 AXRYRYVKAWYZBR-UHFFFAOYSA-N 0.000 description 1
- 108010019625 Atazanavir Sulfate Proteins 0.000 description 1
- 108010001478 Bacitracin Proteins 0.000 description 1
- 206010006448 Bronchiolitis Diseases 0.000 description 1
- QAGYKUNXZHXKMR-UHFFFAOYSA-N CPD000469186 Natural products CC1=C(O)C=CC=C1C(=O)NC(C(O)CN1C(CC2CCCCC2C1)C(=O)NC(C)(C)C)CSC1=CC=CC=C1 QAGYKUNXZHXKMR-UHFFFAOYSA-N 0.000 description 1
- 229930186147 Cephalosporin Natural products 0.000 description 1
- VWFCHDSQECPREK-LURJTMIESA-N Cidofovir Chemical compound NC=1C=CN(C[C@@H](CO)OCP(O)(O)=O)C(=O)N=1 VWFCHDSQECPREK-LURJTMIESA-N 0.000 description 1
- 108010078777 Colistin Proteins 0.000 description 1
- 206010048843 Cytomegalovirus chorioretinitis Diseases 0.000 description 1
- DYDCUQKUCUHJBH-UHFFFAOYSA-N D-Cycloserine Natural products NC1CONC1=O DYDCUQKUCUHJBH-UHFFFAOYSA-N 0.000 description 1
- BXZVVICBKDXVGW-NKWVEPMBSA-N Didanosine Chemical compound O1[C@H](CO)CC[C@@H]1N1C(NC=NC2=O)=C2N=C1 BXZVVICBKDXVGW-NKWVEPMBSA-N 0.000 description 1
- XPOQHMRABVBWPR-UHFFFAOYSA-N Efavirenz Natural products O1C(=O)NC2=CC=C(Cl)C=C2C1(C(F)(F)F)C#CC1CC1 XPOQHMRABVBWPR-UHFFFAOYSA-N 0.000 description 1
- 241000709661 Enterovirus Species 0.000 description 1
- QZJIMDIBFFHQDW-LMLSDSMGSA-N Fosfomycin tromethamine Chemical compound C[C@@H]1O[C@@H]1P(O)([O-])=O.OCC([NH3+])(CO)CO QZJIMDIBFFHQDW-LMLSDSMGSA-N 0.000 description 1
- JRZJKWGQFNTSRN-UHFFFAOYSA-N Geldanamycin Natural products C1C(C)CC(OC)C(O)C(C)C=C(C)C(OC(N)=O)C(OC)CCC=C(C)C(=O)NC2=CC(=O)C(OC)=C1C2=O JRZJKWGQFNTSRN-UHFFFAOYSA-N 0.000 description 1
- 229930182566 Gentamicin Natural products 0.000 description 1
- 108010015899 Glycopeptides Proteins 0.000 description 1
- 102000002068 Glycopeptides Human genes 0.000 description 1
- XQFRJNBWHJMXHO-RRKCRQDMSA-N IDUR Chemical compound C1[C@H](O)[C@@H](CO)O[C@H]1N1C(=O)NC(=O)C(I)=C1 XQFRJNBWHJMXHO-RRKCRQDMSA-N 0.000 description 1
- UGQMRVRMYYASKQ-KQYNXXCUSA-N Inosine Chemical compound O[C@@H]1[C@H](O)[C@@H](CO)O[C@H]1N1C2=NC=NC(O)=C2N=C1 UGQMRVRMYYASKQ-KQYNXXCUSA-N 0.000 description 1
- 229930010555 Inosine Natural products 0.000 description 1
- 108010014726 Interferon Type I Proteins 0.000 description 1
- 102000002227 Interferon Type I Human genes 0.000 description 1
- 108010074328 Interferon-gamma Proteins 0.000 description 1
- 102000008070 Interferon-gamma Human genes 0.000 description 1
- UETNIIAIRMUTSM-UHFFFAOYSA-N Jacareubin Natural products CC1(C)OC2=CC3Oc4c(O)c(O)ccc4C(=O)C3C(=C2C=C1)O UETNIIAIRMUTSM-UHFFFAOYSA-N 0.000 description 1
- KJHKTHWMRKYKJE-SUGCFTRWSA-N Kaletra Chemical compound N1([C@@H](C(C)C)C(=O)N[C@H](C[C@H](O)[C@H](CC=2C=CC=CC=2)NC(=O)COC=2C(=CC=CC=2C)C)CC=2C=CC=CC=2)CCCNC1=O KJHKTHWMRKYKJE-SUGCFTRWSA-N 0.000 description 1
- 206010024238 Leptospirosis Diseases 0.000 description 1
- OJMMVQQUTAEWLP-UHFFFAOYSA-N Lincomycin Natural products CN1CC(CCC)CC1C(=O)NC(C(C)O)C1C(O)C(O)C(O)C(SC)O1 OJMMVQQUTAEWLP-UHFFFAOYSA-N 0.000 description 1
- 108010028921 Lipopeptides Proteins 0.000 description 1
- YXOLAZRVSSWPPT-UHFFFAOYSA-N Morin Chemical compound OC1=CC(O)=CC=C1C1=C(O)C(=O)C2=C(O)C=C(O)C=C2O1 YXOLAZRVSSWPPT-UHFFFAOYSA-N 0.000 description 1
- KJHOZAZQWVKILO-UHFFFAOYSA-N N-(diaminomethylidene)-4-morpholinecarboximidamide Chemical compound NC(N)=NC(=N)N1CCOCC1 KJHOZAZQWVKILO-UHFFFAOYSA-N 0.000 description 1
- 101150007813 NIH gene Proteins 0.000 description 1
- 229930193140 Neomycin Natural products 0.000 description 1
- 229940123424 Neuraminidase inhibitor Drugs 0.000 description 1
- 239000004100 Oxytetracycline Substances 0.000 description 1
- JNTOCHDNEULJHD-UHFFFAOYSA-N Penciclovir Chemical compound N1C(N)=NC(=O)C2=C1N(CCC(CO)CO)C=N2 JNTOCHDNEULJHD-UHFFFAOYSA-N 0.000 description 1
- 229930195708 Penicillin V Natural products 0.000 description 1
- 206010035664 Pneumonia Diseases 0.000 description 1
- 108010093965 Polymyxin B Proteins 0.000 description 1
- 108010048233 Procalcitonin Proteins 0.000 description 1
- 229940124158 Protease/peptidase inhibitor Drugs 0.000 description 1
- CZPWVGJYEJSRLH-UHFFFAOYSA-N Pyrimidine Chemical compound C1=CN=CN=C1 CZPWVGJYEJSRLH-UHFFFAOYSA-N 0.000 description 1
- 108020004511 Recombinant DNA Proteins 0.000 description 1
- 241000725643 Respiratory syncytial virus Species 0.000 description 1
- 206010061603 Respiratory syncytial virus infection Diseases 0.000 description 1
- 206010062106 Respiratory tract infection viral Diseases 0.000 description 1
- IWUCXVSUMQZMFG-AFCXAGJDSA-N Ribavirin Chemical compound N1=C(C(=O)N)N=CN1[C@H]1[C@H](O)[C@H](O)[C@@H](CO)O1 IWUCXVSUMQZMFG-AFCXAGJDSA-N 0.000 description 1
- NCDNCNXCDXHOMX-UHFFFAOYSA-N Ritonavir Natural products C=1C=CC=CC=1CC(NC(=O)OCC=1SC=NC=1)C(O)CC(CC=1C=CC=CC=1)NC(=O)C(C(C)C)NC(=O)N(C)CC1=CSC(C(C)C)=N1 NCDNCNXCDXHOMX-UHFFFAOYSA-N 0.000 description 1
- 206010040047 Sepsis Diseases 0.000 description 1
- 239000004187 Spiramycin Substances 0.000 description 1
- XNKLLVCARDGLGL-JGVFFNPUSA-N Stavudine Chemical compound O=C1NC(=O)C(C)=CN1[C@H]1C=C[C@@H](CO)O1 XNKLLVCARDGLGL-JGVFFNPUSA-N 0.000 description 1
- 238000000692 Student's t-test Methods 0.000 description 1
- DQDZQHMCPDUUPC-UHFFFAOYSA-N Sulfadimethoxine sodium Chemical compound [Na+].COC1=NC(OC)=CC([N-]S(=O)(=O)C=2C=CC(N)=CC=2)=N1 DQDZQHMCPDUUPC-UHFFFAOYSA-N 0.000 description 1
- SUJUHGSWHZTSEU-UHFFFAOYSA-N Tipranavir Natural products C1C(O)=C(C(CC)C=2C=C(NS(=O)(=O)C=3N=CC(=CC=3)C(F)(F)F)C=CC=2)C(=O)OC1(CCC)CCC1=CC=CC=C1 SUJUHGSWHZTSEU-UHFFFAOYSA-N 0.000 description 1
- WPVFJKSGQUFQAP-GKAPJAKFSA-N Valcyte Chemical compound N1C(N)=NC(=O)C2=C1N(COC(CO)COC(=O)[C@@H](N)C(C)C)C=N2 WPVFJKSGQUFQAP-GKAPJAKFSA-N 0.000 description 1
- OIRDTQYFTABQOQ-UHTZMRCNSA-N Vidarabine Chemical compound C1=NC=2C(N)=NC=NC=2N1[C@@H]1O[C@H](CO)[C@@H](O)[C@@H]1O OIRDTQYFTABQOQ-UHTZMRCNSA-N 0.000 description 1
- 206010047468 Viral lower respiratory tract infections Diseases 0.000 description 1
- 241000700605 Viruses Species 0.000 description 1
- WREGKURFCTUGRC-POYBYMJQSA-N Zalcitabine Chemical compound O=C1N=C(N)C=CN1[C@@H]1O[C@H](CO)CC1 WREGKURFCTUGRC-POYBYMJQSA-N 0.000 description 1
- ZWBTYMGEBZUQTK-PVLSIAFMSA-N [(7S,9E,11S,12R,13S,14R,15R,16R,17S,18S,19E,21Z)-2,15,17,32-tetrahydroxy-11-methoxy-3,7,12,14,16,18,22-heptamethyl-1'-(2-methylpropyl)-6,23-dioxospiro[8,33-dioxa-24,27,29-triazapentacyclo[23.6.1.14,7.05,31.026,30]tritriaconta-1(32),2,4,9,19,21,24,26,30-nonaene-28,4'-piperidine]-13-yl] acetate Chemical compound CO[C@H]1\C=C\O[C@@]2(C)Oc3c(C2=O)c2c4NC5(CCN(CC(C)C)CC5)N=c4c(=NC(=O)\C(C)=C/C=C/[C@H](C)[C@H](O)[C@@H](C)[C@@H](O)[C@@H](C)[C@H](OC(C)=O)[C@@H]1C)c(O)c2c(O)c3C ZWBTYMGEBZUQTK-PVLSIAFMSA-N 0.000 description 1
- DLGSOJOOYHWROO-WQLSENKSSA-N [(z)-(1-methyl-2-oxoindol-3-ylidene)amino]thiourea Chemical compound C1=CC=C2N(C)C(=O)\C(=N/NC(N)=S)C2=C1 DLGSOJOOYHWROO-WQLSENKSSA-N 0.000 description 1
- KIPLYOUQVMMOHB-MXWBXKMOSA-L [Ca++].CN(C)[C@H]1[C@@H]2[C@@H](O)[C@H]3C(=C([O-])[C@]2(O)C(=O)C(C(N)=O)=C1O)C(=O)c1c(O)cccc1[C@@]3(C)O.CN(C)[C@H]1[C@@H]2[C@@H](O)[C@H]3C(=C([O-])[C@]2(O)C(=O)C(C(N)=O)=C1O)C(=O)c1c(O)cccc1[C@@]3(C)O Chemical compound [Ca++].CN(C)[C@H]1[C@@H]2[C@@H](O)[C@H]3C(=C([O-])[C@]2(O)C(=O)C(C(N)=O)=C1O)C(=O)c1c(O)cccc1[C@@]3(C)O.CN(C)[C@H]1[C@@H]2[C@@H](O)[C@H]3C(=C([O-])[C@]2(O)C(=O)C(C(N)=O)=C1O)C(=O)c1c(O)cccc1[C@@]3(C)O KIPLYOUQVMMOHB-MXWBXKMOSA-L 0.000 description 1
- GLWHPRRGGYLLRV-XLPZGREQSA-N [[(2s,3s,5r)-3-azido-5-(5-methyl-2,4-dioxopyrimidin-1-yl)oxolan-2-yl]methoxy-hydroxyphosphoryl] phosphono hydrogen phosphate Chemical compound O=C1NC(=O)C(C)=CN1[C@@H]1O[C@H](COP(O)(=O)OP(O)(=O)OP(O)(O)=O)[C@@H](N=[N+]=[N-])C1 GLWHPRRGGYLLRV-XLPZGREQSA-N 0.000 description 1
- 229960004748 abacavir Drugs 0.000 description 1
- MCGSCOLBFJQGHM-SCZZXKLOSA-N abacavir Chemical compound C=12N=CN([C@H]3C=C[C@@H](CO)C3)C2=NC(N)=NC=1NC1CC1 MCGSCOLBFJQGHM-SCZZXKLOSA-N 0.000 description 1
- YQNQNVDNTFHQSW-UHFFFAOYSA-N acetic acid [2-[[(5-nitro-2-thiazolyl)amino]-oxomethyl]phenyl] ester Chemical compound CC(=O)OC1=CC=CC=C1C(=O)NC1=NC=C([N+]([O-])=O)S1 YQNQNVDNTFHQSW-UHFFFAOYSA-N 0.000 description 1
- 229940049505 achromycin v Drugs 0.000 description 1
- 229960001997 adefovir Drugs 0.000 description 1
- WOZSCQDILHKSGG-UHFFFAOYSA-N adefovir depivoxil Chemical compound N1=CN=C2N(CCOCP(=O)(OCOC(=O)C(C)(C)C)OCOC(=O)C(C)(C)C)C=NC2=C1N WOZSCQDILHKSGG-UHFFFAOYSA-N 0.000 description 1
- 229940006546 albon Drugs 0.000 description 1
- 229960004821 amikacin Drugs 0.000 description 1
- 229940126575 aminoglycoside Drugs 0.000 description 1
- 229960003022 amoxicillin Drugs 0.000 description 1
- 229940038195 amoxicillin / clavulanate Drugs 0.000 description 1
- 229940090588 amoxil Drugs 0.000 description 1
- 229960000723 ampicillin Drugs 0.000 description 1
- 229940043312 ampicillin / sulbactam Drugs 0.000 description 1
- 229960001830 amprenavir Drugs 0.000 description 1
- YMARZQAQMVYCKC-OEMFJLHTSA-N amprenavir Chemical compound C([C@@H]([C@H](O)CN(CC(C)C)S(=O)(=O)C=1C=CC(N)=CC=1)NC(=O)O[C@@H]1COCC1)C1=CC=CC=C1 YMARZQAQMVYCKC-OEMFJLHTSA-N 0.000 description 1
- 230000000845 anti-microbial effect Effects 0.000 description 1
- 238000013459 approach Methods 0.000 description 1
- 229940003446 arsphenamine Drugs 0.000 description 1
- 238000003556 assay Methods 0.000 description 1
- 229960003277 atazanavir Drugs 0.000 description 1
- AXRYRYVKAWYZBR-GASGPIRDSA-N atazanavir Chemical compound C([C@H](NC(=O)[C@@H](NC(=O)OC)C(C)(C)C)[C@@H](O)CN(CC=1C=CC(=CC=1)C=1N=CC=CC=1)NC(=O)[C@@H](NC(=O)OC)C(C)(C)C)C1=CC=CC=C1 AXRYRYVKAWYZBR-GASGPIRDSA-N 0.000 description 1
- 229940068561 atripla Drugs 0.000 description 1
- 229940098164 augmentin Drugs 0.000 description 1
- 229940062316 avelox Drugs 0.000 description 1
- 229940073066 azactam Drugs 0.000 description 1
- 229960004099 azithromycin Drugs 0.000 description 1
- 229960003623 azlocillin Drugs 0.000 description 1
- JTWOMNBEOCYFNV-NFFDBFGFSA-N azlocillin Chemical compound N([C@@H](C(=O)N[C@H]1[C@H]2SC([C@@H](N2C1=O)C(O)=O)(C)C)C=1C=CC=CC=1)C(=O)N1CCNC1=O JTWOMNBEOCYFNV-NFFDBFGFSA-N 0.000 description 1
- 229960003644 aztreonam Drugs 0.000 description 1
- 229940064856 azulfidine Drugs 0.000 description 1
- 229960003071 bacitracin Drugs 0.000 description 1
- 229930184125 bacitracin Natural products 0.000 description 1
- CLKOFPXJLQSYAH-ABRJDSQDSA-N bacitracin A Chemical compound C1SC([C@@H](N)[C@@H](C)CC)=N[C@@H]1C(=O)N[C@@H](CC(C)C)C(=O)N[C@H](CCC(O)=O)C(=O)N[C@@H]([C@@H](C)CC)C(=O)N[C@@H]1C(=O)N[C@H](CCCN)C(=O)N[C@@H]([C@@H](C)CC)C(=O)N[C@H](CC=2C=CC=CC=2)C(=O)N[C@@H](CC=2N=CNC=2)C(=O)N[C@H](CC(O)=O)C(=O)N[C@@H](CC(N)=O)C(=O)NCCCC1 CLKOFPXJLQSYAH-ABRJDSQDSA-N 0.000 description 1
- 238000003705 background correction Methods 0.000 description 1
- 201000005008 bacterial sepsis Diseases 0.000 description 1
- 230000003385 bacteriostatic effect Effects 0.000 description 1
- 229940098166 bactrim Drugs 0.000 description 1
- 229940028420 bactroban Drugs 0.000 description 1
- 230000008901 benefit Effects 0.000 description 1
- 229940087430 biaxin Drugs 0.000 description 1
- 229940057194 bleph-10 Drugs 0.000 description 1
- 238000004820 blood count Methods 0.000 description 1
- 238000009640 blood culture Methods 0.000 description 1
- 229940063703 capastat Drugs 0.000 description 1
- 229960004602 capreomycin Drugs 0.000 description 1
- 229940041011 carbapenems Drugs 0.000 description 1
- 229960003669 carbenicillin Drugs 0.000 description 1
- 108060001132 cathelicidin Proteins 0.000 description 1
- POIUWJQBRNEFGX-XAMSXPGMSA-N cathelicidin Chemical compound C([C@@H](C(=O)N[C@@H](CCCNC(N)=N)C(=O)N[C@@H](CCCCN)C(=O)N[C@@H](CO)C(=O)N[C@@H](CCCCN)C(=O)N[C@@H](CCC(O)=O)C(=O)N[C@@H](CCCCN)C(=O)N[C@@H]([C@@H](C)CC)C(=O)NCC(=O)N[C@@H](CCCCN)C(=O)N[C@@H](CCC(O)=O)C(=O)N[C@@H](CC=1C=CC=CC=1)C(=O)N[C@@H](CCCCN)C(=O)N[C@@H](CCCNC(N)=N)C(=O)N[C@@H]([C@@H](C)CC)C(=O)N[C@@H](C(C)C)C(=O)N[C@@H](CCC(N)=O)C(=O)N[C@@H](CCCNC(N)=N)C(=O)N[C@@H]([C@@H](C)CC)C(=O)N[C@@H](CCCCN)C(=O)N[C@@H](CC(O)=O)C(=O)N[C@@H](CC=1C=CC=CC=1)C(=O)N[C@@H](CC(C)C)C(=O)N[C@@H](CCCNC(N)=N)C(=O)N[C@@H](CC(N)=O)C(=O)N[C@@H](CC(C)C)C(=O)N[C@@H](C(C)C)C(=O)N1[C@@H](CCC1)C(=O)N[C@@H](CCCNC(N)=N)C(=O)N[C@@H]([C@@H](C)O)C(=O)N[C@@H](CCC(O)=O)C(=O)N[C@@H](CO)C(O)=O)NC(=O)[C@H](CC=1C=CC=CC=1)NC(=O)[C@H](CC(O)=O)NC(=O)CNC(=O)[C@H](CC(C)C)NC(=O)[C@@H](N)CC(C)C)C1=CC=CC=C1 POIUWJQBRNEFGX-XAMSXPGMSA-N 0.000 description 1
- 102000014509 cathelicidin Human genes 0.000 description 1
- 239000012677 causal agent Substances 0.000 description 1
- 229960004841 cefadroxil Drugs 0.000 description 1
- NBFNMSULHIODTC-CYJZLJNKSA-N cefadroxil monohydrate Chemical compound O.C1([C@@H](N)C(=O)N[C@H]2[C@@H]3N(C2=O)C(=C(CS3)C)C(O)=O)=CC=C(O)C=C1 NBFNMSULHIODTC-CYJZLJNKSA-N 0.000 description 1
- 229960000603 cefalotin Drugs 0.000 description 1
- OLVCFLKTBJRLHI-AXAPSJFSSA-N cefamandole Chemical compound CN1N=NN=C1SCC1=C(C(O)=O)N2C(=O)[C@@H](NC(=O)[C@H](O)C=3C=CC=CC=3)[C@H]2SC1 OLVCFLKTBJRLHI-AXAPSJFSSA-N 0.000 description 1
- 229960003012 cefamandole Drugs 0.000 description 1
- ICZOIXFFVKYXOM-YCLOEFEOSA-M cefamandole nafate Chemical compound [Na+].CN1N=NN=C1SCC1=C(C([O-])=O)N2C(=O)[C@@H](NC(=O)[C@H](OC=O)C=3C=CC=CC=3)[C@H]2SC1 ICZOIXFFVKYXOM-YCLOEFEOSA-M 0.000 description 1
- 229960001139 cefazolin Drugs 0.000 description 1
- MLYYVTUWGNIJIB-BXKDBHETSA-N cefazolin Chemical compound S1C(C)=NN=C1SCC1=C(C(O)=O)N2C(=O)[C@@H](NC(=O)CN3N=NN=C3)[C@H]2SC1 MLYYVTUWGNIJIB-BXKDBHETSA-N 0.000 description 1
- FLKYBGKDCCEQQM-WYUVZMMLSA-M cefazolin sodium Chemical compound [Na+].S1C(C)=NN=C1SCC1=C(C([O-])=O)N2C(=O)[C@@H](NC(=O)CN3N=NN=C3)[C@H]2SC1 FLKYBGKDCCEQQM-WYUVZMMLSA-M 0.000 description 1
- 229960003719 cefdinir Drugs 0.000 description 1
- RTXOFQZKPXMALH-GHXIOONMSA-N cefdinir Chemical compound S1C(N)=NC(C(=N\O)\C(=O)N[C@@H]2C(N3C(=C(C=C)CS[C@@H]32)C(O)=O)=O)=C1 RTXOFQZKPXMALH-GHXIOONMSA-N 0.000 description 1
- 229960004069 cefditoren Drugs 0.000 description 1
- KMIPKYQIOVAHOP-YLGJWRNMSA-N cefditoren Chemical compound S([C@@H]1[C@@H](C(N1C=1C(O)=O)=O)NC(=O)\C(=N/OC)C=2N=C(N)SC=2)CC=1\C=C/C=1SC=NC=1C KMIPKYQIOVAHOP-YLGJWRNMSA-N 0.000 description 1
- 229960002100 cefepime Drugs 0.000 description 1
- HVFLCNVBZFFHBT-ZKDACBOMSA-N cefepime Chemical compound S([C@@H]1[C@@H](C(N1C=1C([O-])=O)=O)NC(=O)\C(=N/OC)C=2N=C(N)SC=2)CC=1C[N+]1(C)CCCC1 HVFLCNVBZFFHBT-ZKDACBOMSA-N 0.000 description 1
- 229960002129 cefixime Drugs 0.000 description 1
- OKBVVJOGVLARMR-QSWIMTSFSA-N cefixime Chemical compound S1C(N)=NC(C(=N\OCC(O)=O)\C(=O)N[C@@H]2C(N3C(=C(C=C)CS[C@@H]32)C(O)=O)=O)=C1 OKBVVJOGVLARMR-QSWIMTSFSA-N 0.000 description 1
- 229960004682 cefoperazone Drugs 0.000 description 1
- GCFBRXLSHGKWDP-XCGNWRKASA-N cefoperazone Chemical compound O=C1C(=O)N(CC)CCN1C(=O)N[C@H](C=1C=CC(O)=CC=1)C(=O)N[C@@H]1C(=O)N2C(C(O)=O)=C(CSC=3N(N=NN=3)C)CS[C@@H]21 GCFBRXLSHGKWDP-XCGNWRKASA-N 0.000 description 1
- 229960004261 cefotaxime Drugs 0.000 description 1
- GPRBEKHLDVQUJE-VINNURBNSA-N cefotaxime Chemical compound N([C@@H]1C(N2C(=C(COC(C)=O)CS[C@@H]21)C(O)=O)=O)C(=O)/C(=N/OC)C1=CSC(N)=N1 GPRBEKHLDVQUJE-VINNURBNSA-N 0.000 description 1
- 229960002682 cefoxitin Drugs 0.000 description 1
- WZOZEZRFJCJXNZ-ZBFHGGJFSA-N cefoxitin Chemical compound N([C@]1(OC)C(N2C(=C(COC(N)=O)CS[C@@H]21)C(O)=O)=O)C(=O)CC1=CC=CS1 WZOZEZRFJCJXNZ-ZBFHGGJFSA-N 0.000 description 1
- WYUSVOMTXWRGEK-HBWVYFAYSA-N cefpodoxime Chemical compound N([C@H]1[C@@H]2N(C1=O)C(=C(CS2)COC)C(O)=O)C(=O)C(=N/OC)\C1=CSC(N)=N1 WYUSVOMTXWRGEK-HBWVYFAYSA-N 0.000 description 1
- 229960005090 cefpodoxime Drugs 0.000 description 1
- 229960002580 cefprozil Drugs 0.000 description 1
- 229960004828 ceftaroline fosamil Drugs 0.000 description 1
- 229960000484 ceftazidime Drugs 0.000 description 1
- NMVPEQXCMGEDNH-TZVUEUGBSA-N ceftazidime pentahydrate Chemical compound O.O.O.O.O.S([C@@H]1[C@@H](C(N1C=1C([O-])=O)=O)NC(=O)\C(=N/OC(C)(C)C(O)=O)C=2N=C(N)SC=2)CC=1C[N+]1=CC=CC=C1 NMVPEQXCMGEDNH-TZVUEUGBSA-N 0.000 description 1
- 229960004086 ceftibuten Drugs 0.000 description 1
- UNJFKXSSGBWRBZ-BJCIPQKHSA-N ceftibuten Chemical compound S1C(N)=NC(C(=C\CC(O)=O)\C(=O)N[C@@H]2C(N3C(=CCS[C@@H]32)C(O)=O)=O)=C1 UNJFKXSSGBWRBZ-BJCIPQKHSA-N 0.000 description 1
- 229940047496 ceftin Drugs 0.000 description 1
- 229960001991 ceftizoxime Drugs 0.000 description 1
- NNULBSISHYWZJU-LLKWHZGFSA-N ceftizoxime Chemical compound N([C@@H]1C(N2C(=CCS[C@@H]21)C(O)=O)=O)C(=O)\C(=N/OC)C1=CSC(N)=N1 NNULBSISHYWZJU-LLKWHZGFSA-N 0.000 description 1
- 229950004259 ceftobiprole Drugs 0.000 description 1
- 229960004755 ceftriaxone Drugs 0.000 description 1
- VAAUVRVFOQPIGI-SPQHTLEESA-N ceftriaxone Chemical compound S([C@@H]1[C@@H](C(N1C=1C(O)=O)=O)NC(=O)\C(=N/OC)C=2N=C(N)SC=2)CC=1CSC1=NC(=O)C(=O)NN1C VAAUVRVFOQPIGI-SPQHTLEESA-N 0.000 description 1
- 229960001668 cefuroxime Drugs 0.000 description 1
- JFPVXVDWJQMJEE-IZRZKJBUSA-N cefuroxime Chemical compound N([C@@H]1C(N2C(=C(COC(N)=O)CS[C@@H]21)C(O)=O)=O)C(=O)\C(=N/OC)C1=CC=CO1 JFPVXVDWJQMJEE-IZRZKJBUSA-N 0.000 description 1
- 229940099237 cefzil Drugs 0.000 description 1
- 210000004027 cell Anatomy 0.000 description 1
- 238000005119 centrifugation Methods 0.000 description 1
- 229940106164 cephalexin Drugs 0.000 description 1
- 229940124587 cephalosporin Drugs 0.000 description 1
- 150000001780 cephalosporins Chemical class 0.000 description 1
- 230000008859 change Effects 0.000 description 1
- DDTDNCYHLGRFBM-YZEKDTGTSA-N chembl2367892 Chemical compound CC(=O)N[C@H]1[C@@H](O)[C@H](O)[C@H](CO)O[C@H]1O[C@@H]([C@H]1C(N[C@@H](C2=CC(O)=CC(O[C@@H]3[C@H]([C@H](O)[C@H](O)[C@@H](CO)O3)O)=C2C=2C(O)=CC=C(C=2)[C@@H](NC(=O)[C@@H]2NC(=O)[C@@H]3C=4C=C(O)C=C(C=4)OC=4C(O)=CC=C(C=4)[C@@H](N)C(=O)N[C@H](CC=4C=C(Cl)C(O5)=CC=4)C(=O)N3)C(=O)N1)C(O)=O)=O)C(C=C1Cl)=CC=C1OC1=C(O[C@H]3[C@H]([C@@H](O)[C@H](O)[C@H](CO)O3)NC(C)=O)C5=CC2=C1 DDTDNCYHLGRFBM-YZEKDTGTSA-N 0.000 description 1
- 229960005091 chloramphenicol Drugs 0.000 description 1
- 229940097572 chloromycetin Drugs 0.000 description 1
- 229960000724 cidofovir Drugs 0.000 description 1
- DHSUYTOATWAVLW-WFVMDLQDSA-N cilastatin Chemical compound CC1(C)C[C@@H]1C(=O)N\C(=C/CCCCSC[C@H](N)C(O)=O)C(O)=O DHSUYTOATWAVLW-WFVMDLQDSA-N 0.000 description 1
- 229940088516 cipro Drugs 0.000 description 1
- 229960003405 ciprofloxacin Drugs 0.000 description 1
- 229960002626 clarithromycin Drugs 0.000 description 1
- 229940090805 clavulanate Drugs 0.000 description 1
- HZZVJAQRINQKSD-PBFISZAISA-N clavulanic acid Chemical compound OC(=O)[C@H]1C(=C/CO)/O[C@@H]2CC(=O)N21 HZZVJAQRINQKSD-PBFISZAISA-N 0.000 description 1
- 229940063193 cleocin Drugs 0.000 description 1
- 229960002227 clindamycin Drugs 0.000 description 1
- 229960003326 cloxacillin Drugs 0.000 description 1
- 229960003346 colistin Drugs 0.000 description 1
- 239000003086 colorant Substances 0.000 description 1
- 229940000425 combination drug Drugs 0.000 description 1
- 229940014461 combivir Drugs 0.000 description 1
- 238000004891 communication Methods 0.000 description 1
- 230000001276 controlling effect Effects 0.000 description 1
- 238000007796 conventional method Methods 0.000 description 1
- 229940021392 cubicin Drugs 0.000 description 1
- 229960003077 cycloserine Drugs 0.000 description 1
- 208000001763 cytomegalovirus retinitis Diseases 0.000 description 1
- 229960000860 dapsone Drugs 0.000 description 1
- 229960005484 daptomycin Drugs 0.000 description 1
- 229960005107 darunavir Drugs 0.000 description 1
- CJBJHOAVZSMMDJ-HEXNFIEUSA-N darunavir Chemical compound C([C@@H]([C@H](O)CN(CC(C)C)S(=O)(=O)C=1C=CC(N)=CC=1)NC(=O)O[C@@H]1[C@@H]2CCO[C@@H]2OC1)C1=CC=CC=C1 CJBJHOAVZSMMDJ-HEXNFIEUSA-N 0.000 description 1
- 229940088965 declomycin Drugs 0.000 description 1
- 229960005319 delavirdine Drugs 0.000 description 1
- 230000003111 delayed effect Effects 0.000 description 1
- 229960002398 demeclocycline Drugs 0.000 description 1
- 238000009795 derivation Methods 0.000 description 1
- 238000001514 detection method Methods 0.000 description 1
- 229960001585 dicloxacillin Drugs 0.000 description 1
- 229960002656 didanosine Drugs 0.000 description 1
- 229960004100 dirithromycin Drugs 0.000 description 1
- NWOYIVRVSJDTLK-YSDBFZIDSA-L disodium;(2s,5r,6r)-6-[[(2r)-2-amino-2-phenylacetyl]amino]-3,3-dimethyl-7-oxo-4-thia-1-azabicyclo[3.2.0]heptane-2-carboxylate;(1r,4s)-3,3-dimethyl-2,2,6-trioxo-2$l^{6}-thiabicyclo[3.2.0]heptane-4-carboxylate Chemical compound [Na+].[Na+].O=S1(=O)C(C)(C)[C@H](C([O-])=O)C2C(=O)C[C@H]21.C1([C@@H](N)C(=O)N[C@H]2[C@H]3SC([C@@H](N3C2=O)C([O-])=O)(C)C)=CC=CC=C1 NWOYIVRVSJDTLK-YSDBFZIDSA-L 0.000 description 1
- 229960000735 docosanol Drugs 0.000 description 1
- 229960002542 dolutegravir Drugs 0.000 description 1
- RHWKPHLQXYSBKR-BMIGLBTASA-N dolutegravir Chemical compound C([C@@H]1OCC[C@H](N1C(=O)C1=C(O)C2=O)C)N1C=C2C(=O)NCC1=CC=C(F)C=C1F RHWKPHLQXYSBKR-BMIGLBTASA-N 0.000 description 1
- 229940111539 doribax Drugs 0.000 description 1
- 229960000895 doripenem Drugs 0.000 description 1
- 229960003722 doxycycline Drugs 0.000 description 1
- 229940099739 duricef Drugs 0.000 description 1
- 229960002030 edoxudine Drugs 0.000 description 1
- XACKNLSZYYIACO-DJLDLDEBSA-N edoxudine Chemical compound O=C1NC(=O)C(CC)=CN1[C@@H]1O[C@H](CO)[C@@H](O)C1 XACKNLSZYYIACO-DJLDLDEBSA-N 0.000 description 1
- XPOQHMRABVBWPR-ZDUSSCGKSA-N efavirenz Chemical compound C([C@]1(C2=CC(Cl)=CC=C2NC(=O)O1)C(F)(F)F)#CC1CC1 XPOQHMRABVBWPR-ZDUSSCGKSA-N 0.000 description 1
- 229960003804 efavirenz Drugs 0.000 description 1
- 229960000366 emtricitabine Drugs 0.000 description 1
- 229960002062 enfuvirtide Drugs 0.000 description 1
- 239000003623 enhancer Substances 0.000 description 1
- 229960002549 enoxacin Drugs 0.000 description 1
- 229960000980 entecavir Drugs 0.000 description 1
- YXPVEXCTPGULBZ-WQYNNSOESA-N entecavir hydrate Chemical compound O.C1=NC=2C(=O)NC(N)=NC=2N1[C@H]1C[C@H](O)[C@@H](CO)C1=C YXPVEXCTPGULBZ-WQYNNSOESA-N 0.000 description 1
- YJGVMLPVUAXIQN-UHFFFAOYSA-N epipodophyllotoxin Natural products COC1=C(OC)C(OC)=CC(C2C3=CC=4OCOC=4C=C3C(O)C3C2C(OC3)=O)=C1 YJGVMLPVUAXIQN-UHFFFAOYSA-N 0.000 description 1
- 229960002770 ertapenem Drugs 0.000 description 1
- 229960003276 erythromycin Drugs 0.000 description 1
- NSYZCCDSJNWWJL-YXOIYICCSA-N erythromycin ethylsuccinate Chemical compound O1[C@H](C)C[C@H](N(C)C)[C@@H](OC(=O)CCC(=O)OCC)[C@@H]1O[C@H]1[C@@](O)(C)C[C@@H](C)C(=O)[C@H](C)[C@@H](O)[C@](C)(O)[C@@H](CC)OC(=O)[C@H](C)[C@@H](O[C@@H]2O[C@@H](C)[C@H](O)[C@](C)(OC)C2)[C@@H]1C NSYZCCDSJNWWJL-YXOIYICCSA-N 0.000 description 1
- 229960000285 ethambutol Drugs 0.000 description 1
- 229960002001 ethionamide Drugs 0.000 description 1
- 230000007717 exclusion Effects 0.000 description 1
- 238000010195 expression analysis Methods 0.000 description 1
- 229940107247 factive Drugs 0.000 description 1
- 229960004396 famciclovir Drugs 0.000 description 1
- GGXKWVWZWMLJEH-UHFFFAOYSA-N famcyclovir Chemical compound N1=C(N)N=C2N(CCC(COC(=O)C)COC(C)=O)C=NC2=C1 GGXKWVWZWMLJEH-UHFFFAOYSA-N 0.000 description 1
- 238000001914 filtration Methods 0.000 description 1
- 229940063190 flagyl Drugs 0.000 description 1
- 229960004273 floxacillin Drugs 0.000 description 1
- 229940072686 floxin Drugs 0.000 description 1
- 229940124307 fluoroquinolone Drugs 0.000 description 1
- DLKYYJFLRUUGHJ-SSJCJZGYSA-A fomivirsen sodium Chemical compound [Na+].[Na+].[Na+].[Na+].[Na+].[Na+].[Na+].[Na+].[Na+].[Na+].[Na+].[Na+].[Na+].[Na+].[Na+].[Na+].[Na+].[Na+].[Na+].[Na+].O=C1NC(=O)C(C)=CN1[C@@H]1O[C@H](COP([O-])(=S)O[C@@H]2[C@H](O[C@H](C2)N2C(NC(=O)C(C)=C2)=O)COP([O-])(=S)O[C@@H]2[C@H](O[C@H](C2)N2C(N=C(N)C=C2)=O)COP([O-])(=S)O[C@@H]2[C@H](O[C@H](C2)N2C(NC(=O)C(C)=C2)=O)COP([O-])(=S)O[C@@H]2[C@H](O[C@H](C2)N2C(NC(=O)C(C)=C2)=O)COP([O-])(=S)O[C@@H]2[C@H](O[C@H](C2)N2C(N=C(N)C=C2)=O)COP([O-])(=S)O[C@@H]2[C@H](O[C@H](C2)N2C(NC(=O)C(C)=C2)=O)COP([O-])(=S)O[C@@H]2[C@H](O[C@H](C2)N2C(NC(=O)C(C)=C2)=O)COP([O-])(=S)O[C@@H]2[C@H](O[C@H](C2)N2C(N=C(N)C=C2)=O)COP([O-])(=S)O[C@@H]2[C@H](O[C@H](C2)N2C(NC(=O)C(C)=C2)=O)COP([O-])(=S)O[C@@H]2[C@H](O[C@H](C2)N2C(N=C(N)C=C2)=O)COP([O-])(=S)O[C@@H]2[C@H](O[C@H](C2)N2C3=C(C(NC(N)=N3)=O)N=C2)COP([O-])(=S)O[C@@H]2[C@H](O[C@H](C2)N2C(NC(=O)C(C)=C2)=O)COP([O-])(=S)O[C@@H]2[C@H](O[C@H](C2)N2C(NC(=O)C(C)=C2)=O)COP([O-])(=S)O[C@@H]2[C@H](O[C@H](C2)N2C(NC(=O)C(C)=C2)=O)COP([O-])(=S)O[C@@H]2[C@H](O[C@H](C2)N2C3=C(C(NC(N)=N3)=O)N=C2)COP([S-])(=O)O[C@@H]2[C@H](O[C@H](C2)N2C(N=C(N)C=C2)=O)COP([O-])(=S)O[C@@H]2[C@H](O[C@H](C2)N2C3=C(C(NC(N)=N3)=O)N=C2)CO)[C@@H](OP([O-])(=S)OC[C@@H]2[C@H](C[C@@H](O2)N2C3=C(C(NC(N)=N3)=O)N=C2)OP([O-])(=S)OC[C@@H]2[C@H](C[C@@H](O2)N2C(N=C(N)C=C2)=O)OP([O-])(=S)OC[C@@H]2[C@H](C[C@@H](O2)N2C3=C(C(NC(N)=N3)=O)N=C2)O)C1 DLKYYJFLRUUGHJ-SSJCJZGYSA-A 0.000 description 1
- 229960003142 fosamprenavir Drugs 0.000 description 1
- MLBVMOWEQCZNCC-OEMFJLHTSA-N fosamprenavir Chemical compound C([C@@H]([C@H](OP(O)(O)=O)CN(CC(C)C)S(=O)(=O)C=1C=CC(N)=CC=1)NC(=O)O[C@@H]1COCC1)C1=CC=CC=C1 MLBVMOWEQCZNCC-OEMFJLHTSA-N 0.000 description 1
- 229960005102 foscarnet Drugs 0.000 description 1
- 229960000308 fosfomycin Drugs 0.000 description 1
- 229940112424 fosfonet Drugs 0.000 description 1
- 229940048400 fucidin Drugs 0.000 description 1
- 230000006870 function Effects 0.000 description 1
- 229960004675 fusidic acid Drugs 0.000 description 1
- IECPWNUMDGFDKC-MZJAQBGESA-N fusidic acid Chemical compound O[C@@H]([C@@H]12)C[C@H]3\C(=C(/CCC=C(C)C)C(O)=O)[C@@H](OC(C)=O)C[C@]3(C)[C@@]2(C)CC[C@@H]2[C@]1(C)CC[C@@H](O)[C@H]2C IECPWNUMDGFDKC-MZJAQBGESA-N 0.000 description 1
- 229940125777 fusion inhibitor Drugs 0.000 description 1
- 229940099052 fuzeon Drugs 0.000 description 1
- 229960002963 ganciclovir Drugs 0.000 description 1
- IRSCQMHQWWYFCW-UHFFFAOYSA-N ganciclovir Chemical compound O=C1NC(N)=NC2=C1N=CN2COC(CO)CO IRSCQMHQWWYFCW-UHFFFAOYSA-N 0.000 description 1
- 229940072360 garamycin Drugs 0.000 description 1
- 229960003923 gatifloxacin Drugs 0.000 description 1
- XUBOMFCQGDBHNK-UHFFFAOYSA-N gatifloxacin Chemical compound FC1=CC(C(C(C(O)=O)=CN2C3CC3)=O)=C2C(OC)=C1N1CCNC(C)C1 XUBOMFCQGDBHNK-UHFFFAOYSA-N 0.000 description 1
- QTQAWLPCGQOSGP-GBTDJJJQSA-N geldanamycin Chemical compound N1C(=O)\C(C)=C/C=C\[C@@H](OC)[C@H](OC(N)=O)\C(C)=C/[C@@H](C)[C@@H](O)[C@H](OC)C[C@@H](C)CC2=C(OC)C(=O)C=C1C2=O QTQAWLPCGQOSGP-GBTDJJJQSA-N 0.000 description 1
- 229960003170 gemifloxacin Drugs 0.000 description 1
- ZRCVYEYHRGVLOC-HYARGMPZSA-N gemifloxacin Chemical compound C1C(CN)C(=N/OC)/CN1C(C(=C1)F)=NC2=C1C(=O)C(C(O)=O)=CN2C1CC1 ZRCVYEYHRGVLOC-HYARGMPZSA-N 0.000 description 1
- JIYMVSQRGZEYAX-CWUUNJJBSA-N gemifloxacin mesylate Chemical compound CS(O)(=O)=O.C1C(CN)C(=N/OC)/CN1C(C(=C1)F)=NC2=C1C(=O)C(C(O)=O)=CN2C1CC1 JIYMVSQRGZEYAX-CWUUNJJBSA-N 0.000 description 1
- 229960002518 gentamicin Drugs 0.000 description 1
- 230000005484 gravity Effects 0.000 description 1
- 229960000642 grepafloxacin Drugs 0.000 description 1
- MCAHMSDENAOJFZ-BVXDHVRPSA-N herbimycin Chemical compound N1C(=O)\C(C)=C\C=C/[C@H](OC)[C@@H](OC(N)=O)\C(C)=C\[C@H](C)[C@@H](OC)[C@@H](OC)C[C@H](C)[C@@H](OC)C2=CC(=O)C=C1C2=O MCAHMSDENAOJFZ-BVXDHVRPSA-N 0.000 description 1
- 229930193320 herbimycin Natural products 0.000 description 1
- 229960000374 ibacitabine Drugs 0.000 description 1
- WEVJJMPVVFNAHZ-RRKCRQDMSA-N ibacitabine Chemical compound C1=C(I)C(N)=NC(=O)N1[C@@H]1O[C@H](CO)[C@@H](O)C1 WEVJJMPVVFNAHZ-RRKCRQDMSA-N 0.000 description 1
- 229960004716 idoxuridine Drugs 0.000 description 1
- 229960002751 imiquimod Drugs 0.000 description 1
- DOUYETYNHWVLEO-UHFFFAOYSA-N imiquimod Chemical compound C1=CC=CC2=C3N(CC(C)C)C=NC3=C(N)N=C21 DOUYETYNHWVLEO-UHFFFAOYSA-N 0.000 description 1
- 210000000987 immune system Anatomy 0.000 description 1
- 230000036039 immunity Effects 0.000 description 1
- 238000000126 in silico method Methods 0.000 description 1
- 229960001936 indinavir Drugs 0.000 description 1
- CBVCZFGXHXORBI-PXQQMZJSSA-N indinavir Chemical compound C([C@H](N(CC1)C[C@@H](O)C[C@@H](CC=2C=CC=CC=2)C(=O)N[C@H]2C3=CC=CC=C3C[C@H]2O)C(=O)NC(C)(C)C)N1CC1=CC=CN=C1 CBVCZFGXHXORBI-PXQQMZJSSA-N 0.000 description 1
- 229960003786 inosine Drugs 0.000 description 1
- 229940124524 integrase inhibitor Drugs 0.000 description 1
- 239000002850 integrase inhibitor Substances 0.000 description 1
- 230000010354 integration Effects 0.000 description 1
- 229940079322 interferon Drugs 0.000 description 1
- 108010018844 interferon type III Proteins 0.000 description 1
- 229940028894 interferon type ii Drugs 0.000 description 1
- 229940047124 interferons Drugs 0.000 description 1
- 238000007918 intramuscular administration Methods 0.000 description 1
- 229940054114 invanz Drugs 0.000 description 1
- 238000011835 investigation Methods 0.000 description 1
- 230000005865 ionizing radiation Effects 0.000 description 1
- 229960003350 isoniazid Drugs 0.000 description 1
- QRXWMOHMRWLFEY-UHFFFAOYSA-N isoniazide Chemical compound NNC(=O)C1=CC=NC=C1 QRXWMOHMRWLFEY-UHFFFAOYSA-N 0.000 description 1
- 229960000318 kanamycin Drugs 0.000 description 1
- 229930027917 kanamycin Natural products 0.000 description 1
- SBUJHOSQTJFQJX-NOAMYHISSA-N kanamycin Chemical compound O[C@@H]1[C@@H](O)[C@H](O)[C@@H](CN)O[C@@H]1O[C@H]1[C@H](O)[C@@H](O[C@@H]2[C@@H]([C@@H](N)[C@H](O)[C@@H](CO)O2)O)[C@H](N)C[C@@H]1N SBUJHOSQTJFQJX-NOAMYHISSA-N 0.000 description 1
- 229930182823 kanamycin A Natural products 0.000 description 1
- 229940090589 keflex Drugs 0.000 description 1
- 229940083668 ketek Drugs 0.000 description 1
- 229940089519 levaquin Drugs 0.000 description 1
- 229960003376 levofloxacin Drugs 0.000 description 1
- 229940033683 lincocin Drugs 0.000 description 1
- 229960005287 lincomycin Drugs 0.000 description 1
- 229940041028 lincosamides Drugs 0.000 description 1
- 229960003907 linezolid Drugs 0.000 description 1
- 229960002422 lomefloxacin Drugs 0.000 description 1
- 229960004525 lopinavir Drugs 0.000 description 1
- 229950006243 loviride Drugs 0.000 description 1
- CJPLEFFCVDQQFZ-UHFFFAOYSA-N loviride Chemical compound CC(=O)C1=CC=C(C)C=C1NC(C(N)=O)C1=C(Cl)C=CC=C1Cl CJPLEFFCVDQQFZ-UHFFFAOYSA-N 0.000 description 1
- 210000004698 lymphocyte Anatomy 0.000 description 1
- 229940110128 macrobid Drugs 0.000 description 1
- 229940090037 macrodantin Drugs 0.000 description 1
- 239000003120 macrolide antibiotic agent Substances 0.000 description 1
- 229940041033 macrolides Drugs 0.000 description 1
- 229960003640 mafenide Drugs 0.000 description 1
- 229960004710 maraviroc Drugs 0.000 description 1
- GSNHKUDZZFZSJB-QYOOZWMWSA-N maraviroc Chemical compound CC(C)C1=NN=C(C)N1[C@@H]1C[C@H](N2CC[C@H](NC(=O)C3CCC(F)(F)CC3)C=3C=CC=CC=3)CC[C@H]2C1 GSNHKUDZZFZSJB-QYOOZWMWSA-N 0.000 description 1
- 229940103196 maxaquin Drugs 0.000 description 1
- 229940021422 maxipime Drugs 0.000 description 1
- 229940087515 mefoxin Drugs 0.000 description 1
- 229960002260 meropenem Drugs 0.000 description 1
- 229940032713 merrem Drugs 0.000 description 1
- 229960003152 metisazone Drugs 0.000 description 1
- 229960000282 metronidazole Drugs 0.000 description 1
- 229960000198 mezlocillin Drugs 0.000 description 1
- 229940110254 minocin Drugs 0.000 description 1
- 229960004023 minocycline Drugs 0.000 description 1
- 239000000203 mixture Substances 0.000 description 1
- 238000010369 molecular cloning Methods 0.000 description 1
- 229940041009 monobactams Drugs 0.000 description 1
- 210000001616 monocyte Anatomy 0.000 description 1
- 229940112659 monurol Drugs 0.000 description 1
- UXOUKMQIEVGVLY-UHFFFAOYSA-N morin Natural products OC1=CC(O)=CC(C2=C(C(=O)C3=C(O)C=C(O)C=C3O2)O)=C1 UXOUKMQIEVGVLY-UHFFFAOYSA-N 0.000 description 1
- 235000007708 morin Nutrition 0.000 description 1
- 229960005389 moroxydine Drugs 0.000 description 1
- 125000004573 morpholin-4-yl group Chemical group N1(CCOCC1)* 0.000 description 1
- 229960003702 moxifloxacin Drugs 0.000 description 1
- 229960003128 mupirocin Drugs 0.000 description 1
- 229930187697 mupirocin Natural products 0.000 description 1
- 229940052202 myambutol Drugs 0.000 description 1
- 229940027817 mycobutin Drugs 0.000 description 1
- JORAUNFTUVJTNG-BSTBCYLQSA-N n-[(2s)-4-amino-1-[[(2s,3r)-1-[[(2s)-4-amino-1-oxo-1-[[(3s,6s,9s,12s,15r,18s,21s)-6,9,18-tris(2-aminoethyl)-3-[(1r)-1-hydroxyethyl]-12,15-bis(2-methylpropyl)-2,5,8,11,14,17,20-heptaoxo-1,4,7,10,13,16,19-heptazacyclotricos-21-yl]amino]butan-2-yl]amino]-3-h Chemical compound CC(C)CCCCC(=O)N[C@@H](CCN)C(=O)N[C@H]([C@@H](C)O)CN[C@@H](CCN)C(=O)N[C@H]1CCNC(=O)[C@H]([C@@H](C)O)NC(=O)[C@H](CCN)NC(=O)[C@H](CCN)NC(=O)[C@H](CC(C)C)NC(=O)[C@@H](CC(C)C)NC(=O)[C@H](CCN)NC1=O.CCC(C)CCCCC(=O)N[C@@H](CCN)C(=O)N[C@H]([C@@H](C)O)CN[C@@H](CCN)C(=O)N[C@H]1CCNC(=O)[C@H]([C@@H](C)O)NC(=O)[C@H](CCN)NC(=O)[C@H](CCN)NC(=O)[C@H](CC(C)C)NC(=O)[C@@H](CC(C)C)NC(=O)[C@H](CCN)NC1=O JORAUNFTUVJTNG-BSTBCYLQSA-N 0.000 description 1
- ZJIWRHLZXQPFAD-LRYSGCCDSA-N n-[(2s)-4-amino-1-[[(2s,3r)-1-[[(2s)-4-amino-1-oxo-1-[[(3s,6s,9s,12s,15r,18s,21s)-6,9,18-tris(2-aminoethyl)-3-[(1r)-1-hydroxyethyl]-12,15-bis(2-methylpropyl)-2,5,8,11,14,17,20-heptaoxo-1,4,7,10,13,16,19-heptazacyclotricos-21-yl]amino]butan-2-yl]amino]-3-h Chemical compound OS(O)(=O)=O.CCC(C)CCCCC(=O)N[C@@H](CCN)C(=O)N[C@@H]([C@@H](C)O)C(=O)N[C@@H](CCN)C(=O)N[C@H]1CCNC(=O)[C@H]([C@@H](C)O)NC(=O)[C@H](CCN)NC(=O)[C@H](CCN)NC(=O)[C@H](CC(C)C)NC(=O)[C@@H](CC(C)C)NC(=O)[C@H](CCN)NC1=O ZJIWRHLZXQPFAD-LRYSGCCDSA-N 0.000 description 1
- ZESIAEVDVPWEKB-ORCFLVBFSA-N n-[(2s)-4-amino-1-[[(2s,3r)-1-[[(2s)-4-amino-1-oxo-1-[[(3s,6s,9s,12s,15r,18s,21s)-6,9,18-tris(2-aminoethyl)-3-[(1r)-1-hydroxyethyl]-12,15-bis(2-methylpropyl)-2,5,8,11,14,17,20-heptaoxo-1,4,7,10,13,16,19-heptazacyclotricos-21-yl]amino]butan-2-yl]amino]-3-h Chemical compound OS(O)(=O)=O.OS(O)(=O)=O.CC(C)CCCCC(=O)N[C@@H](CCN)C(=O)N[C@H]([C@@H](C)O)CN[C@@H](CCN)C(=O)N[C@H]1CCNC(=O)[C@H]([C@@H](C)O)NC(=O)[C@H](CCN)NC(=O)[C@H](CCN)NC(=O)[C@H](CC(C)C)NC(=O)[C@@H](CC(C)C)NC(=O)[C@H](CCN)NC1=O.CCC(C)CCCCC(=O)N[C@@H](CCN)C(=O)N[C@H]([C@@H](C)O)CN[C@@H](CCN)C(=O)N[C@H]1CCNC(=O)[C@H]([C@@H](C)O)NC(=O)[C@H](CCN)NC(=O)[C@H](CCN)NC(=O)[C@H](CC(C)C)NC(=O)[C@@H](CC(C)C)NC(=O)[C@H](CCN)NC1=O ZESIAEVDVPWEKB-ORCFLVBFSA-N 0.000 description 1
- 229960000515 nafcillin Drugs 0.000 description 1
- 229960000210 nalidixic acid Drugs 0.000 description 1
- 229960000884 nelfinavir Drugs 0.000 description 1
- QAGYKUNXZHXKMR-HKWSIXNMSA-N nelfinavir Chemical compound CC1=C(O)C=CC=C1C(=O)N[C@H]([C@H](O)CN1[C@@H](C[C@@H]2CCCC[C@@H]2C1)C(=O)NC(C)(C)C)CSC1=CC=CC=C1 QAGYKUNXZHXKMR-HKWSIXNMSA-N 0.000 description 1
- 229960004927 neomycin Drugs 0.000 description 1
- AGFWIZQEWFGATK-UNZHCMSXSA-N netilmicin sulfate Chemical compound OS(O)(=O)=O.OS(O)(=O)=O.OS(O)(=O)=O.OS(O)(=O)=O.OS(O)(=O)=O.O([C@@H]1[C@@H](N)C[C@H]([C@@H]([C@H]1O)O[C@@H]1[C@@H]([C@@H](NC)[C@@](C)(O)CO1)O)NCC)[C@H]1OC(CN)=CC[C@H]1N.O([C@@H]1[C@@H](N)C[C@H]([C@@H]([C@H]1O)O[C@@H]1[C@@H]([C@@H](NC)[C@@](C)(O)CO1)O)NCC)[C@H]1OC(CN)=CC[C@H]1N AGFWIZQEWFGATK-UNZHCMSXSA-N 0.000 description 1
- ZBGPYVZLYBDXKO-HILBYHGXSA-N netilmycin Chemical compound O([C@@H]1[C@@H](N)C[C@H]([C@@H]([C@H]1O)O[C@@H]1[C@]([C@H](NC)[C@@H](O)CO1)(C)O)NCC)[C@H]1OC(CN)=CC[C@H]1N ZBGPYVZLYBDXKO-HILBYHGXSA-N 0.000 description 1
- 229960000689 nevirapine Drugs 0.000 description 1
- 229940101771 nexavir Drugs 0.000 description 1
- 229960002480 nitazoxanide Drugs 0.000 description 1
- 229960000564 nitrofurantoin Drugs 0.000 description 1
- 229960001180 norfloxacin Drugs 0.000 description 1
- 229940064764 noroxin Drugs 0.000 description 1
- 239000002773 nucleotide Substances 0.000 description 1
- 125000003729 nucleotide group Chemical group 0.000 description 1
- 229940099980 ocuflox Drugs 0.000 description 1
- 229960001699 ofloxacin Drugs 0.000 description 1
- 229940022146 orbactiv Drugs 0.000 description 1
- 229960001607 oritavancin Drugs 0.000 description 1
- VHFGEBVPHAGQPI-MYYQHNLBSA-N oritavancin Chemical compound O([C@@H]1C2=CC=C(C(=C2)Cl)OC=2C=C3C=C(C=2O[C@H]2[C@@H]([C@@H](O)[C@H](O)[C@@H](CO)O2)O[C@@H]2O[C@@H](C)[C@H](O)[C@@](C)(NCC=4C=CC(=CC=4)C=4C=CC(Cl)=CC=4)C2)OC2=CC=C(C=C2Cl)[C@@H](O)[C@H](C(N[C@@H](CC(N)=O)C(=O)N[C@H]3C(=O)N[C@H]2C(=O)N[C@@H]1C(N[C@H](C1=CC(O)=CC(O)=C1C=1C(O)=CC=C2C=1)C(O)=O)=O)=O)NC(=O)[C@@H](CC(C)C)NC)[C@H]1C[C@](C)(N)[C@@H](O)[C@H](C)O1 VHFGEBVPHAGQPI-MYYQHNLBSA-N 0.000 description 1
- PWTROOMOPLCZHB-BHYQHFGMSA-N oritavancin bisphosphate Chemical compound OP(O)(O)=O.OP(O)(O)=O.O([C@@H]1C2=CC=C(C(=C2)Cl)OC=2C=C3C=C(C=2O[C@H]2[C@@H]([C@@H](O)[C@H](O)[C@@H](CO)O2)O[C@@H]2O[C@@H](C)[C@H](O)[C@@](C)(NCC=4C=CC(=CC=4)C=4C=CC(Cl)=CC=4)C2)OC2=CC=C(C=C2Cl)[C@@H](O)[C@H](C(N[C@@H](CC(N)=O)C(=O)N[C@H]3C(=O)N[C@H]2C(=O)N[C@@H]1C(N[C@@H](C1=CC(O)=CC(O)=C1C=1C(O)=CC=C2C=1)C(O)=O)=O)=O)NC(=O)[C@@H](CC(C)C)NC)[C@H]1C[C@](C)(N)[C@@H](O)[C@H](C)O1 PWTROOMOPLCZHB-BHYQHFGMSA-N 0.000 description 1
- 229960001019 oxacillin Drugs 0.000 description 1
- 229960000625 oxytetracycline Drugs 0.000 description 1
- IWVCMVBTMGNXQD-PXOLEDIWSA-N oxytetracycline Chemical compound C1=CC=C2[C@](O)(C)[C@H]3[C@H](O)[C@H]4[C@H](N(C)C)C(O)=C(C(N)=O)C(=O)[C@@]4(O)C(O)=C3C(=O)C2=C1O IWVCMVBTMGNXQD-PXOLEDIWSA-N 0.000 description 1
- 235000019366 oxytetracycline Nutrition 0.000 description 1
- LSQZJLSUYDQPKJ-UHFFFAOYSA-N p-Hydroxyampicillin Natural products O=C1N2C(C(O)=O)C(C)(C)SC2C1NC(=O)C(N)C1=CC=C(O)C=C1 LSQZJLSUYDQPKJ-UHFFFAOYSA-N 0.000 description 1
- 229960001914 paromomycin Drugs 0.000 description 1
- 230000008506 pathogenesis Effects 0.000 description 1
- 230000001717 pathogenic effect Effects 0.000 description 1
- 229960003930 peginterferon alfa-2a Drugs 0.000 description 1
- 108010092853 peginterferon alfa-2a Proteins 0.000 description 1
- 229960001179 penciclovir Drugs 0.000 description 1
- 229940049954 penicillin Drugs 0.000 description 1
- 229940056367 penicillin v Drugs 0.000 description 1
- 150000002960 penicillins Chemical class 0.000 description 1
- 239000000137 peptide hydrolase inhibitor Substances 0.000 description 1
- 229960001084 peramivir Drugs 0.000 description 1
- XRQDFNLINLXZLB-CKIKVBCHSA-N peramivir Chemical compound CCC(CC)[C@H](NC(C)=O)[C@@H]1[C@H](O)[C@@H](C(O)=O)C[C@H]1NC(N)=N XRQDFNLINLXZLB-CKIKVBCHSA-N 0.000 description 1
- 229940066843 pfizerpen Drugs 0.000 description 1
- XUYJLQHKOGNDPB-UHFFFAOYSA-N phosphonoacetic acid Chemical compound OC(=O)CP(O)(O)=O XUYJLQHKOGNDPB-UHFFFAOYSA-N 0.000 description 1
- 229960002292 piperacillin Drugs 0.000 description 1
- 229940104641 piperacillin / tazobactam Drugs 0.000 description 1
- 229940099765 pipracil Drugs 0.000 description 1
- CSOMAHTTWTVBFL-OFBLZTNGSA-N platensimycin Chemical compound C([C@]1([C@@H]2[C@@H]3C[C@@H]4C[C@@]2(C=CC1=O)C[C@@]4(O3)C)C)CC(=O)NC1=C(O)C=CC(C(O)=O)=C1O CSOMAHTTWTVBFL-OFBLZTNGSA-N 0.000 description 1
- CSOMAHTTWTVBFL-UHFFFAOYSA-N platensimycin Natural products O1C2(C)CC3(C=CC4=O)CC2CC1C3C4(C)CCC(=O)NC1=C(O)C=CC(C(O)=O)=C1O CSOMAHTTWTVBFL-UHFFFAOYSA-N 0.000 description 1
- 229960001237 podophyllotoxin Drugs 0.000 description 1
- YJGVMLPVUAXIQN-XVVDYKMHSA-N podophyllotoxin Chemical compound COC1=C(OC)C(OC)=CC([C@@H]2C3=CC=4OCOC=4C=C3[C@H](O)[C@@H]3[C@@H]2C(OC3)=O)=C1 YJGVMLPVUAXIQN-XVVDYKMHSA-N 0.000 description 1
- YVCVYCSAAZQOJI-UHFFFAOYSA-N podophyllotoxin Natural products COC1=C(O)C(OC)=CC(C2C3=CC=4OCOC=4C=C3C(O)C3C2C(OC3)=O)=C1 YVCVYCSAAZQOJI-UHFFFAOYSA-N 0.000 description 1
- 229920000024 polymyxin B Polymers 0.000 description 1
- XDJYMJULXQKGMM-UHFFFAOYSA-N polymyxin E1 Natural products CCC(C)CCCCC(=O)NC(CCN)C(=O)NC(C(C)O)C(=O)NC(CCN)C(=O)NC1CCNC(=O)C(C(C)O)NC(=O)C(CCN)NC(=O)C(CCN)NC(=O)C(CC(C)C)NC(=O)C(CC(C)C)NC(=O)C(CCN)NC1=O XDJYMJULXQKGMM-UHFFFAOYSA-N 0.000 description 1
- KNIWPHSUTGNZST-UHFFFAOYSA-N polymyxin E2 Natural products CC(C)CCCCC(=O)NC(CCN)C(=O)NC(C(C)O)C(=O)NC(CCN)C(=O)NC1CCNC(=O)C(C(C)O)NC(=O)C(CCN)NC(=O)C(CCN)NC(=O)C(CC(C)C)NC(=O)C(CC(C)C)NC(=O)C(CCN)NC1=O KNIWPHSUTGNZST-UHFFFAOYSA-N 0.000 description 1
- 229960005266 polymyxin b Drugs 0.000 description 1
- 229920001184 polypeptide Polymers 0.000 description 1
- 229950004447 posizolid Drugs 0.000 description 1
- 229940087661 priftin Drugs 0.000 description 1
- 229940027836 primaxin Drugs 0.000 description 1
- CWCXERYKLSEGEZ-KDKHKZEGSA-N procalcitonin Chemical compound C([C@@H](C(=O)N1CCC[C@H]1C(=O)N[C@@H](CCC(N)=O)C(=O)N[C@H](C(=O)N[C@@H](C)C(=O)N[C@@H]([C@@H](C)CC)C(=O)NCC(=O)N[C@@H](C(C)C)C(=O)NCC(=O)N[C@@H](C)C(=O)N1[C@@H](CCC1)C(=O)NCC(O)=O)[C@@H](C)O)NC(=O)[C@@H](NC(=O)[C@H](CC=1NC=NC=1)NC(=O)[C@H](CC=1C=CC=CC=1)NC(=O)[C@H](CCCCN)NC(=O)[C@H](CC(N)=O)NC(=O)[C@H](CC=1C=CC=CC=1)NC(=O)[C@H](CC(O)=O)NC(=O)[C@H](CCC(N)=O)NC(=O)[C@@H](NC(=O)[C@H](CC=1C=CC(O)=CC=1)NC(=O)[C@@H](NC(=O)CNC(=O)[C@H](CC(C)C)NC(=O)[C@H](CCSC)NC(=O)[C@H]1NC(=O)[C@H]([C@@H](C)O)NC(=O)[C@H](CO)NC(=O)[C@H](CC(C)C)NC(=O)[C@H](CC(N)=O)NC(=O)CNC(=O)[C@@H](N)CSSC1)[C@@H](C)O)[C@@H](C)O)[C@@H](C)O)C1=CC=CC=C1 CWCXERYKLSEGEZ-KDKHKZEGSA-N 0.000 description 1
- 102000004196 processed proteins & peptides Human genes 0.000 description 1
- 108090000765 processed proteins & peptides Proteins 0.000 description 1
- 238000012545 processing Methods 0.000 description 1
- 238000004393 prognosis Methods 0.000 description 1
- 208000008128 pulmonary tuberculosis Diseases 0.000 description 1
- 229960005206 pyrazinamide Drugs 0.000 description 1
- 150000007660 quinolones Chemical class 0.000 description 1
- 108010071077 quinupristin-dalfopristin Proteins 0.000 description 1
- 229940052337 quinupristin/dalfopristin Drugs 0.000 description 1
- BTTNOGHPGJANSW-IBGZPJMESA-N radezolid Chemical compound O=C1O[C@@H](CNC(=O)C)CN1C1=CC=C(C=2C=CC(CNCC=3NN=NC=3)=CC=2)C(F)=C1 BTTNOGHPGJANSW-IBGZPJMESA-N 0.000 description 1
- 229950009965 radezolid Drugs 0.000 description 1
- 229960004742 raltegravir Drugs 0.000 description 1
- CZFFBEXEKNGXKS-UHFFFAOYSA-N raltegravir Chemical compound O1C(C)=NN=C1C(=O)NC(C)(C)C1=NC(C(=O)NCC=2C=CC(F)=CC=2)=C(O)C(=O)N1C CZFFBEXEKNGXKS-UHFFFAOYSA-N 0.000 description 1
- 230000009467 reduction Effects 0.000 description 1
- 238000011160 research Methods 0.000 description 1
- 208000030925 respiratory syncytial virus infectious disease Diseases 0.000 description 1
- 238000012552 review Methods 0.000 description 1
- 229960000329 ribavirin Drugs 0.000 description 1
- HZCAHMRRMINHDJ-DBRKOABJSA-N ribavirin Natural products O[C@@H]1[C@H](O)[C@@H](CO)O[C@H]1N1N=CN=C1 HZCAHMRRMINHDJ-DBRKOABJSA-N 0.000 description 1
- ATEBXHFBFRCZMA-VXTBVIBXSA-N rifabutin Chemical compound O([C@](C1=O)(C)O/C=C/[C@@H]([C@H]([C@@H](OC(C)=O)[C@H](C)[C@H](O)[C@H](C)[C@@H](O)[C@@H](C)\C=C\C=C(C)/C(=O)NC(=C2N3)C(=O)C=4C(O)=C5C)C)OC)C5=C1C=4C2=NC13CCN(CC(C)C)CC1 ATEBXHFBFRCZMA-VXTBVIBXSA-N 0.000 description 1
- 229960000885 rifabutin Drugs 0.000 description 1
- 229940063639 rifadin Drugs 0.000 description 1
- 229960002599 rifapentine Drugs 0.000 description 1
- 229960003040 rifaximin Drugs 0.000 description 1
- 229940049560 rimactane Drugs 0.000 description 1
- 229960000311 ritonavir Drugs 0.000 description 1
- NCDNCNXCDXHOMX-XGKFQTDJSA-N ritonavir Chemical compound N([C@@H](C(C)C)C(=O)N[C@H](C[C@H](O)[C@H](CC=1C=CC=CC=1)NC(=O)OCC=1SC=NC=1)CC=1C=CC=CC=1)C(=O)N(C)CC1=CSC(C(C)C)=N1 NCDNCNXCDXHOMX-XGKFQTDJSA-N 0.000 description 1
- 239000003419 rna directed dna polymerase inhibitor Substances 0.000 description 1
- 229960005224 roxithromycin Drugs 0.000 description 1
- 229960001852 saquinavir Drugs 0.000 description 1
- QWAXKHKRTORLEM-UGJKXSETSA-N saquinavir Chemical compound C([C@@H]([C@H](O)CN1C[C@H]2CCCC[C@H]2C[C@H]1C(=O)NC(C)(C)C)NC(=O)[C@H](CC(N)=O)NC(=O)C=1N=C2C=CC=CC2=CC=1)C1=CC=CC=C1 QWAXKHKRTORLEM-UGJKXSETSA-N 0.000 description 1
- 229940048278 septra Drugs 0.000 description 1
- 229940099992 seromycin Drugs 0.000 description 1
- 239000002911 sialidase inhibitor Substances 0.000 description 1
- 229940099261 silvadene Drugs 0.000 description 1
- 229960003600 silver sulfadiazine Drugs 0.000 description 1
- ORVLUIMCZUPAPB-LBTQIPEASA-M sodium (4S,4aS,5aS,6S,12aR)-4-(dimethylamino)-1,6,10,11,12a-pentahydroxy-6-methyl-3,12-dioxo-4,4a,5,5a-tetrahydrotetracene-2-carboxamide dioxido(oxo)phosphanium phosphenic acid Chemical compound [Na+].O[P+]([O-])=O.O[P+]([O-])=O.O[P+]([O-])=O.O[P+]([O-])=O.O[P+]([O-])=O.[O-][P+]([O-])=O.CN(C)[C@H]1[C@@H]2C[C@H]3C(=C(O)c4c(O)cccc4[C@@]3(C)O)C(=O)[C@]2(O)C(O)=C(C(N)=O)C1=O.CN(C)[C@H]1[C@@H]2C[C@H]3C(=C(O)c4c(O)cccc4[C@@]3(C)O)C(=O)[C@]2(O)C(O)=C(C(N)=O)C1=O.CN(C)[C@H]1[C@@H]2C[C@H]3C(=C(O)c4c(O)cccc4[C@@]3(C)O)C(=O)[C@]2(O)C(O)=C(C(N)=O)C1=O.CN(C)[C@H]1[C@@H]2C[C@H]3C(=C(O)c4c(O)cccc4[C@@]3(C)O)C(=O)[C@]2(O)C(O)=C(C(N)=O)C1=O.CN(C)[C@H]1[C@@H]2C[C@H]3C(=C(O)c4c(O)cccc4[C@@]3(C)O)C(=O)[C@]2(O)C(O)=C(C(N)=O)C1=O ORVLUIMCZUPAPB-LBTQIPEASA-M 0.000 description 1
- TUPFOYXHAYOHIB-YCAIQWGJSA-M sodium;(2s,5r,6r)-6-[[(2r)-2-[(4-ethyl-2,3-dioxopiperazine-1-carbonyl)amino]-2-phenylacetyl]amino]-3,3-dimethyl-7-oxo-4-thia-1-azabicyclo[3.2.0]heptane-2-carboxylate;(2s,3s,5r)-3-methyl-4,4,7-trioxo-3-(triazol-1-ylmethyl)-4$l^{6}-thia-1-azabicyclo[3.2.0]h Chemical compound [Na+].C([C@]1(C)S([C@H]2N(C(C2)=O)[C@H]1C(O)=O)(=O)=O)N1C=CN=N1.O=C1C(=O)N(CC)CCN1C(=O)N[C@H](C=1C=CC=CC=1)C(=O)N[C@@H]1C(=O)N2[C@@H](C([O-])=O)C(C)(C)S[C@@H]21 TUPFOYXHAYOHIB-YCAIQWGJSA-M 0.000 description 1
- HJHVQCXHVMGZNC-JCJNLNMISA-M sodium;(2z)-2-[(3r,4s,5s,8s,9s,10s,11r,13r,14s,16s)-16-acetyloxy-3,11-dihydroxy-4,8,10,14-tetramethyl-2,3,4,5,6,7,9,11,12,13,15,16-dodecahydro-1h-cyclopenta[a]phenanthren-17-ylidene]-6-methylhept-5-enoate Chemical compound [Na+].O[C@@H]([C@@H]12)C[C@H]3\C(=C(/CCC=C(C)C)C([O-])=O)[C@@H](OC(C)=O)C[C@]3(C)[C@@]2(C)CC[C@@H]2[C@]1(C)CC[C@@H](O)[C@H]2C HJHVQCXHVMGZNC-JCJNLNMISA-M 0.000 description 1
- 229960002063 sofosbuvir Drugs 0.000 description 1
- TTZHDVOVKQGIBA-IQWMDFIBSA-N sofosbuvir Chemical compound N1([C@@H]2O[C@@H]([C@H]([C@]2(F)C)O)CO[P@@](=O)(N[C@@H](C)C(=O)OC(C)C)OC=2C=CC=CC=2)C=CC(=O)NC1=O TTZHDVOVKQGIBA-IQWMDFIBSA-N 0.000 description 1
- 229960004954 sparfloxacin Drugs 0.000 description 1
- 229960001294 spiramycin Drugs 0.000 description 1
- 235000019372 spiramycin Nutrition 0.000 description 1
- 229930191512 spiramycin Natural products 0.000 description 1
- 238000010561 standard procedure Methods 0.000 description 1
- 229960001203 stavudine Drugs 0.000 description 1
- 229960002673 sulfacetamide Drugs 0.000 description 1
- 229960004306 sulfadiazine Drugs 0.000 description 1
- 229960000973 sulfadimethoxine Drugs 0.000 description 1
- 229960000654 sulfafurazole Drugs 0.000 description 1
- 229960005158 sulfamethizole Drugs 0.000 description 1
- 229960005404 sulfamethoxazole Drugs 0.000 description 1
- 229950008188 sulfamidochrysoidine Drugs 0.000 description 1
- 229940091629 sulfamylon Drugs 0.000 description 1
- 229960001940 sulfasalazine Drugs 0.000 description 1
- NCEXYHBECQHGNR-UHFFFAOYSA-N sulfasalazine Natural products C1=C(O)C(C(=O)O)=CC(N=NC=2C=CC(=CC=2)S(=O)(=O)NC=2N=CC=CC=2)=C1 NCEXYHBECQHGNR-UHFFFAOYSA-N 0.000 description 1
- 229950006904 sulfisoxazole acetyl Drugs 0.000 description 1
- 229940124530 sulfonamide Drugs 0.000 description 1
- 150000003456 sulfonamides Chemical class 0.000 description 1
- OPYGFNJSCUDTBT-PMLPCWDUSA-N sultamicillin Chemical compound C1([C@@H](N)C(=O)N[C@H]2[C@H]3SC([C@@H](N3C2=O)C(=O)OCOC(=O)[C@H]2C(S(=O)(=O)[C@H]3N2C(C3)=O)(C)C)(C)C)=CC=CC=C1 OPYGFNJSCUDTBT-PMLPCWDUSA-N 0.000 description 1
- 229940020707 synercid Drugs 0.000 description 1
- 230000002195 synergetic effect Effects 0.000 description 1
- 238000012353 t test Methods 0.000 description 1
- 229940049565 targocid Drugs 0.000 description 1
- 229950006081 taribavirin Drugs 0.000 description 1
- NHKZSTHOYNWEEZ-AFCXAGJDSA-N taribavirin Chemical compound N1=C(C(=N)N)N=CN1[C@H]1[C@H](O)[C@H](O)[C@@H](CO)O1 NHKZSTHOYNWEEZ-AFCXAGJDSA-N 0.000 description 1
- XFALPSLJIHVRKE-GFCCVEGCSA-N tedizolid Chemical compound CN1N=NC(C=2N=CC(=CC=2)C=2C(=CC(=CC=2)N2C(O[C@@H](CO)C2)=O)F)=N1 XFALPSLJIHVRKE-GFCCVEGCSA-N 0.000 description 1
- 229940036731 teflaro Drugs 0.000 description 1
- 229960001608 teicoplanin Drugs 0.000 description 1
- 229960002935 telaprevir Drugs 0.000 description 1
- 108010017101 telaprevir Proteins 0.000 description 1
- BBAWEDCPNXPBQM-GDEBMMAJSA-N telaprevir Chemical compound N([C@H](C(=O)N[C@H](C(=O)N1C[C@@H]2CCC[C@@H]2[C@H]1C(=O)N[C@@H](CCC)C(=O)C(=O)NC1CC1)C(C)(C)C)C1CCCCC1)C(=O)C1=CN=CC=N1 BBAWEDCPNXPBQM-GDEBMMAJSA-N 0.000 description 1
- 229960005240 telavancin Drugs 0.000 description 1
- ONUMZHGUFYIKPM-MXNFEBESSA-N telavancin Chemical compound O1[C@@H](C)[C@@H](O)[C@](NCCNCCCCCCCCCC)(C)C[C@@H]1O[C@H]1[C@H](OC=2C3=CC=4[C@H](C(N[C@H]5C(=O)N[C@H](C(N[C@@H](C6=CC(O)=C(CNCP(O)(O)=O)C(O)=C6C=6C(O)=CC=C5C=6)C(O)=O)=O)[C@H](O)C5=CC=C(C(=C5)Cl)O3)=O)NC(=O)[C@H](CC(N)=O)NC(=O)[C@H](NC(=O)[C@@H](CC(C)C)NC)[C@H](O)C3=CC=C(C(=C3)Cl)OC=2C=4)O[C@H](CO)[C@@H](O)[C@@H]1O ONUMZHGUFYIKPM-MXNFEBESSA-N 0.000 description 1
- GSSIWSIRBWAZHG-ACOPVEIWSA-N telavancin hydrochloride Chemical compound Cl.O1[C@@H](C)[C@@H](O)[C@](NCCNCCCCCCCCCC)(C)C[C@@H]1O[C@H]1[C@H](OC=2C3=CC=4[C@H](C(N[C@H]5C(=O)N[C@H](C(N[C@@H](C6=CC(O)=C(CNCP(O)(O)=O)C(O)=C6C=6C(O)=CC=C5C=6)C(O)=O)=O)[C@H](O)C5=CC=C(C(=C5)Cl)O3)=O)NC(=O)[C@H](CC(N)=O)NC(=O)[C@H](NC(=O)[C@@H](CC(C)C)NC)[C@H](O)C3=CC=C(C(=C3)Cl)OC=2C=4)O[C@H](CO)[C@@H](O)[C@@H]1O GSSIWSIRBWAZHG-ACOPVEIWSA-N 0.000 description 1
- 229960003250 telithromycin Drugs 0.000 description 1
- 229960004576 temafloxacin Drugs 0.000 description 1
- 229960001114 temocillin Drugs 0.000 description 1
- 229960004556 tenofovir Drugs 0.000 description 1
- SGOIRFVFHAKUTI-ZCFIWIBFSA-N tenofovir (anhydrous) Chemical compound N1=CN=C2N(C[C@@H](C)OCP(O)(O)=O)C=NC2=C1N SGOIRFVFHAKUTI-ZCFIWIBFSA-N 0.000 description 1
- 229960001355 tenofovir disoproxil Drugs 0.000 description 1
- JFVZFKDSXNQEJW-CQSZACIVSA-N tenofovir disoproxil Chemical compound N1=CN=C2N(C[C@@H](C)OCP(=O)(OCOC(=O)OC(C)C)OCOC(=O)OC(C)C)C=NC2=C1N JFVZFKDSXNQEJW-CQSZACIVSA-N 0.000 description 1
- VCMJCVGFSROFHV-WZGZYPNHSA-N tenofovir disoproxil fumarate Chemical compound OC(=O)\C=C\C(O)=O.N1=CN=C2N(C[C@@H](C)OCP(=O)(OCOC(=O)OC(C)C)OCOC(=O)OC(C)C)C=NC2=C1N VCMJCVGFSROFHV-WZGZYPNHSA-N 0.000 description 1
- 229940061354 tequin Drugs 0.000 description 1
- 229940063650 terramycin Drugs 0.000 description 1
- IWVCMVBTMGNXQD-UHFFFAOYSA-N terramycin dehydrate Natural products C1=CC=C2C(O)(C)C3C(O)C4C(N(C)C)C(O)=C(C(N)=O)C(=O)C4(O)C(O)=C3C(=O)C2=C1O IWVCMVBTMGNXQD-UHFFFAOYSA-N 0.000 description 1
- 229960002180 tetracycline Drugs 0.000 description 1
- 229930101283 tetracycline Natural products 0.000 description 1
- 229940040944 tetracyclines Drugs 0.000 description 1
- 229960003053 thiamphenicol Drugs 0.000 description 1
- OTVAEFIXJLOWRX-NXEZZACHSA-N thiamphenicol Chemical compound CS(=O)(=O)C1=CC=C([C@@H](O)[C@@H](CO)NC(=O)C(Cl)Cl)C=C1 OTVAEFIXJLOWRX-NXEZZACHSA-N 0.000 description 1
- RYYWUUFWQRZTIU-UHFFFAOYSA-K thiophosphate Chemical compound [O-]P([O-])([O-])=S RYYWUUFWQRZTIU-UHFFFAOYSA-K 0.000 description 1
- 229960004089 tigecycline Drugs 0.000 description 1
- 229940027257 timentin Drugs 0.000 description 1
- 229940063418 tindamax Drugs 0.000 description 1
- 229960005053 tinidazole Drugs 0.000 description 1
- 229960000838 tipranavir Drugs 0.000 description 1
- SUJUHGSWHZTSEU-FYBSXPHGSA-N tipranavir Chemical compound C([C@@]1(CCC)OC(=O)C([C@H](CC)C=2C=C(NS(=O)(=O)C=3N=CC(=CC=3)C(F)(F)F)C=CC=2)=C(O)C1)CC1=CC=CC=C1 SUJUHGSWHZTSEU-FYBSXPHGSA-N 0.000 description 1
- NLVFBUXFDBBNBW-PBSUHMDJSA-N tobramycin Chemical compound N[C@@H]1C[C@H](O)[C@@H](CN)O[C@@H]1O[C@H]1[C@H](O)[C@@H](O[C@@H]2[C@@H]([C@@H](N)[C@H](O)[C@@H](CO)O2)O)[C@H](N)C[C@@H]1N NLVFBUXFDBBNBW-PBSUHMDJSA-N 0.000 description 1
- 238000012549 training Methods 0.000 description 1
- 230000002103 transcriptional effect Effects 0.000 description 1
- 238000012085 transcriptional profiling Methods 0.000 description 1
- 238000002054 transplantation Methods 0.000 description 1
- 229940079342 trecator Drugs 0.000 description 1
- 229960003962 trifluridine Drugs 0.000 description 1
- VSQQQLOSPVPRAZ-RRKCRQDMSA-N trifluridine Chemical compound C1[C@H](O)[C@@H](CO)O[C@H]1N1C(=O)NC(=O)C(C(F)(F)F)=C1 VSQQQLOSPVPRAZ-RRKCRQDMSA-N 0.000 description 1
- 229960001082 trimethoprim Drugs 0.000 description 1
- 229940111527 trizivir Drugs 0.000 description 1
- 229960005041 troleandomycin Drugs 0.000 description 1
- LQCLVBQBTUVCEQ-QTFUVMRISA-N troleandomycin Chemical compound O1[C@@H](C)[C@H](OC(C)=O)[C@@H](OC)C[C@@H]1O[C@@H]1[C@@H](C)C(=O)O[C@H](C)[C@H](C)[C@H](OC(C)=O)[C@@H](C)C(=O)[C@@]2(OC2)C[C@H](C)[C@H](O[C@H]2[C@@H]([C@H](C[C@@H](C)O2)N(C)C)OC(C)=O)[C@H]1C LQCLVBQBTUVCEQ-QTFUVMRISA-N 0.000 description 1
- 229960000832 tromantadine Drugs 0.000 description 1
- UXQDWARBDDDTKG-UHFFFAOYSA-N tromantadine Chemical compound C1C(C2)CC3CC2CC1(NC(=O)COCCN(C)C)C3 UXQDWARBDDDTKG-UHFFFAOYSA-N 0.000 description 1
- 229960000497 trovafloxacin Drugs 0.000 description 1
- WVPSKSLAZQPAKQ-CDMJZVDBSA-N trovafloxacin Chemical compound C([C@H]1[C@@H]([C@H]1C1)N)N1C(C(=CC=1C(=O)C(C(O)=O)=C2)F)=NC=1N2C1=CC=C(F)C=C1F WVPSKSLAZQPAKQ-CDMJZVDBSA-N 0.000 description 1
- DYNZICQDCVYXFW-AHZSKCOESA-N trovafloxacin mesylate Chemical compound CS(O)(=O)=O.C([C@H]1[C@@H]([C@H]1C1)N)N1C(C(=CC=1C(=O)C(C(O)=O)=C2)F)=NC=1N2C1=CC=C(F)C=C1F DYNZICQDCVYXFW-AHZSKCOESA-N 0.000 description 1
- 229940055820 trovan Drugs 0.000 description 1
- 229940008349 truvada Drugs 0.000 description 1
- 201000008297 typhoid fever Diseases 0.000 description 1
- 229960004626 umifenovir Drugs 0.000 description 1
- KCFYEAOKVJSACF-UHFFFAOYSA-N umifenovir Chemical compound CN1C2=CC(Br)=C(O)C(CN(C)C)=C2C(C(=O)OCC)=C1CSC1=CC=CC=C1 KCFYEAOKVJSACF-UHFFFAOYSA-N 0.000 description 1
- 229940020930 unasyn Drugs 0.000 description 1
- 230000024275 uncoating of virus Effects 0.000 description 1
- 229940093257 valacyclovir Drugs 0.000 description 1
- 229960002149 valganciclovir Drugs 0.000 description 1
- 229940108442 valtrex Drugs 0.000 description 1
- 229940072335 vancocin Drugs 0.000 description 1
- 229960003165 vancomycin Drugs 0.000 description 1
- 229940020733 vibativ Drugs 0.000 description 1
- 229940063678 vibramycin Drugs 0.000 description 1
- 229950009860 vicriviroc Drugs 0.000 description 1
- 229960003636 vidarabine Drugs 0.000 description 1
- 230000007502 viral entry Effects 0.000 description 1
- 229960004854 viral vaccine Drugs 0.000 description 1
- 229940064406 xifaxan Drugs 0.000 description 1
- 229940049589 zagam Drugs 0.000 description 1
- 229960000523 zalcitabine Drugs 0.000 description 1
- 229940072251 zithromax Drugs 0.000 description 1
- 229940104666 zosyn Drugs 0.000 description 1
- 229940061740 zyvox Drugs 0.000 description 1
Classifications
-
- C—CHEMISTRY; METALLURGY
- C12—BIOCHEMISTRY; BEER; SPIRITS; WINE; VINEGAR; MICROBIOLOGY; ENZYMOLOGY; MUTATION OR GENETIC ENGINEERING
- C12Q—MEASURING OR TESTING PROCESSES INVOLVING ENZYMES, NUCLEIC ACIDS OR MICROORGANISMS; COMPOSITIONS OR TEST PAPERS THEREFOR; PROCESSES OF PREPARING SUCH COMPOSITIONS; CONDITION-RESPONSIVE CONTROL IN MICROBIOLOGICAL OR ENZYMOLOGICAL PROCESSES
- C12Q1/00—Measuring or testing processes involving enzymes, nucleic acids or microorganisms; Compositions therefor; Processes of preparing such compositions
- C12Q1/68—Measuring or testing processes involving enzymes, nucleic acids or microorganisms; Compositions therefor; Processes of preparing such compositions involving nucleic acids
- C12Q1/6876—Nucleic acid products used in the analysis of nucleic acids, e.g. primers or probes
- C12Q1/6888—Nucleic acid products used in the analysis of nucleic acids, e.g. primers or probes for detection or identification of organisms
- C12Q1/689—Nucleic acid products used in the analysis of nucleic acids, e.g. primers or probes for detection or identification of organisms for bacteria
-
- C—CHEMISTRY; METALLURGY
- C12—BIOCHEMISTRY; BEER; SPIRITS; WINE; VINEGAR; MICROBIOLOGY; ENZYMOLOGY; MUTATION OR GENETIC ENGINEERING
- C12Q—MEASURING OR TESTING PROCESSES INVOLVING ENZYMES, NUCLEIC ACIDS OR MICROORGANISMS; COMPOSITIONS OR TEST PAPERS THEREFOR; PROCESSES OF PREPARING SUCH COMPOSITIONS; CONDITION-RESPONSIVE CONTROL IN MICROBIOLOGICAL OR ENZYMOLOGICAL PROCESSES
- C12Q1/00—Measuring or testing processes involving enzymes, nucleic acids or microorganisms; Compositions therefor; Processes of preparing such compositions
- C12Q1/68—Measuring or testing processes involving enzymes, nucleic acids or microorganisms; Compositions therefor; Processes of preparing such compositions involving nucleic acids
- C12Q1/6844—Nucleic acid amplification reactions
- C12Q1/686—Polymerase chain reaction [PCR]
-
- C—CHEMISTRY; METALLURGY
- C12—BIOCHEMISTRY; BEER; SPIRITS; WINE; VINEGAR; MICROBIOLOGY; ENZYMOLOGY; MUTATION OR GENETIC ENGINEERING
- C12Q—MEASURING OR TESTING PROCESSES INVOLVING ENZYMES, NUCLEIC ACIDS OR MICROORGANISMS; COMPOSITIONS OR TEST PAPERS THEREFOR; PROCESSES OF PREPARING SUCH COMPOSITIONS; CONDITION-RESPONSIVE CONTROL IN MICROBIOLOGICAL OR ENZYMOLOGICAL PROCESSES
- C12Q1/00—Measuring or testing processes involving enzymes, nucleic acids or microorganisms; Compositions therefor; Processes of preparing such compositions
- C12Q1/70—Measuring or testing processes involving enzymes, nucleic acids or microorganisms; Compositions therefor; Processes of preparing such compositions involving virus or bacteriophage
-
- G—PHYSICS
- G06—COMPUTING; CALCULATING OR COUNTING
- G06N—COMPUTING ARRANGEMENTS BASED ON SPECIFIC COMPUTATIONAL MODELS
- G06N20/00—Machine learning
-
- C—CHEMISTRY; METALLURGY
- C12—BIOCHEMISTRY; BEER; SPIRITS; WINE; VINEGAR; MICROBIOLOGY; ENZYMOLOGY; MUTATION OR GENETIC ENGINEERING
- C12Q—MEASURING OR TESTING PROCESSES INVOLVING ENZYMES, NUCLEIC ACIDS OR MICROORGANISMS; COMPOSITIONS OR TEST PAPERS THEREFOR; PROCESSES OF PREPARING SUCH COMPOSITIONS; CONDITION-RESPONSIVE CONTROL IN MICROBIOLOGICAL OR ENZYMOLOGICAL PROCESSES
- C12Q1/00—Measuring or testing processes involving enzymes, nucleic acids or microorganisms; Compositions therefor; Processes of preparing such compositions
- C12Q1/68—Measuring or testing processes involving enzymes, nucleic acids or microorganisms; Compositions therefor; Processes of preparing such compositions involving nucleic acids
- C12Q1/6876—Nucleic acid products used in the analysis of nucleic acids, e.g. primers or probes
- C12Q1/6883—Nucleic acid products used in the analysis of nucleic acids, e.g. primers or probes for diseases caused by alterations of genetic material
-
- C—CHEMISTRY; METALLURGY
- C12—BIOCHEMISTRY; BEER; SPIRITS; WINE; VINEGAR; MICROBIOLOGY; ENZYMOLOGY; MUTATION OR GENETIC ENGINEERING
- C12Q—MEASURING OR TESTING PROCESSES INVOLVING ENZYMES, NUCLEIC ACIDS OR MICROORGANISMS; COMPOSITIONS OR TEST PAPERS THEREFOR; PROCESSES OF PREPARING SUCH COMPOSITIONS; CONDITION-RESPONSIVE CONTROL IN MICROBIOLOGICAL OR ENZYMOLOGICAL PROCESSES
- C12Q2600/00—Oligonucleotides characterized by their use
- C12Q2600/158—Expression markers
Definitions
- PCR-based molecular diagnostics can profile pathogens directly from a blood culture, such methods rely on the presence of adequate numbers of pathogens in the blood. Moreover, they are limited to detecting a discrete range of pathogens. As a result, there is growing interest in molecular diagnostics that profile the host gene response. These include diagnostics that can distinguish the presence of infection as compared to inflamed but non- infected patients. Overall, while great promise has been shown in this field, no host gene expression infection diagnostic has yet made it into clinical practice.
- Patients can be classified as having a viral infection or bacterial infection based on the expression of eight genes: by JUP, SUCLG2, IFI27, FCER1A, HESX1, SMARCD3, ICAM1, and EBI3.
- Increased JUP, SUCLG2, IFI27, FCER1A, HESX1 expression indicates that the subject has a viral infection and increased SMARCD3, ICAM1, EBI3 indicates that the subject has a bacterial infection.
- a method of analyzing a sample may comprise: (a) obtaining a sample of RNA from a subject; and (b) measuring the amount of RNA transcripts encoded by JUP, SUCLG2, IFI27, FCER1A, HESX1, SMARCD3, ICAM1, and EBI3 in the sample, to produce gene expression data.
- This method may further comprise, based on the gene expression data, providing a report indicating whether the subject has a viral infection or a bacterial infection, wherein: (i) increased JUP, SUCLG2, IFI27, FCER1A, HESX1 expression indicates that the subject has a viral infection; and (ii) increased SMARCD3, ICAM1, EBI3 indicates that the subject has a bacterial infection.
- a method of treatment may comprise (a) receiving a report indicating whether the subject has a viral infection or a bacterial infection, wherein the report is based on the gene expression data obtained by measuring the amount of RNA transcripts encoded by JUP, SUCLG2, IFI27, FCER1A, HESX1, SMARCD3, ICAM1, and EBI3, and (b) identifying the patient as having increased JUP, SUCLG2, IFI27, and FCER1A, and HESX1 expression, and treating the subject with anti-viral therapy; or (c) identifying the patient as having increased SMARCD3, ICAM1, EBI3 expression; and treating the subject with an anti-bacterial therapy.
- Kits for performing the method are also provided.
- FIG. 1 provides an overview of MANATEE.
- FIG. 2 provides an 8-gene signature that distinguishes viral infections from intracellular and extracellular bacterial infections with high accuracy in the discovery and held-out validation data.
- FIG. 3 provides an 8-gene signature that distinguishes viral infections from intracellular and extracellular bacterial infections with high accuracy in independent whole blood datasets.
- FIG. 4 provides an 8-gene signature that distinguishes viral infections from intracellular and extracellular bacterial infections with high accuracy in independent PBMC datasets.
- FIG. 5 provides an 8-gene signature that distinguishes viral infections from intracellular and extracellular bacterial infections with high accuracy in a prospectively enrolled cohort of patients with bacterial or viral infections in Nepal.
- a method of analyzing a sample comprises (a) obtaining a sample of RNA from a subject; and (b) measuring the amount of RNA transcripts encoded by JUP, SUCLG2, IFI27, FCER1A, HESX1,
- SMARCD3, ICAM1, and EBI3 in the sample, to produce gene expression data.
- the method may be used in a variety of diagnostic and therapeutic methods, as described below.
- the method may be used to determine if a subject has a viral infection or bacterial infection.
- the method may comprise: (a) obtaining a sample of RNA from a subject; (b) measuring the amount of RNA transcripts encoded by JUP, SUCLG2, IFI27, FCER1A, HESX1, SMARCD3, ICAM1, and EBI3 in the sample, to produce gene expression data and (c) providing a report indicating whether the subject has a viral infection or a bacterial infection, wherein: (i) increased JUP, SUCLG2, IFI27, FCER1A, HESX1 expression indicates that the subject has a viral infection; and (ii) increased SMARCD3, ICAM1, EBI3 indicates that the subject has a bacterial infection.
- the measuring step can be done using any suitable method.
- the amount of the RNA transcripts in the sample may be measured by RNA-seq (see, e.g., Morin et al BioTechniques 2008 45: 81-94; Wang et al 2009 Nature Reviews Genetics 10 : 57-63), RT- PCR (Freeman et al BioTechniques 1999 26 : 112-22, 124-5), or by labeling the RNA or cDNA made from the same and hybridizing the labeled RNA or cDNA to an array.
- An array may contain spatially- addressable or optically-addressable sequence-specific
- oligonucleotide probes that specifically hybridize to transcripts being measured, or cDNA made from the same.
- Spatially-addressable arrays (which are commonly referred to as “microarrays” in the art) are described in, e.g., Sealfon et al (see, e.g., Methods Mol Biol. 2011;671:3-34).
- Optically-addressable arrays (which are commonly referred to as “bead arrays” in the art) use beads that internally dyed with fluorophores of differing colors, intensities and/or ratios such that the beads can be distinguished from each other, where the beads are also attached to an oligonucleotide probe.
- Exemplary bead-based assays are described in Dupont et al (J. Reprod Immunol. 2005 66:175-91) and Khalifian et al (J Invest Dermatol. 2015 135: 1-5).
- the abundance of transcripts in a sample can also be analyzed by quantitative RT-PCR or isothermal amplification method such as those described in Gao et al (J. Virol Methods. 2018 255: 71-75), Pease et al (Biomed Microdevices (2016) 20: 56) or Nixon et (Biomol. Det. and Quant 2014 2: 4-10), for example.
- Many other methods for measuring the amount of an RNA transcript in a sample are known in the art.
- the sample of RNA obtained from the subject may comprise RNA isolated from whole blood, white blood cells, peripheral blood mononuclear cells (PBMC), neutrophils or buffy coat, for example.
- PBMC peripheral blood mononuclear cells
- Methods for making total RNA, polyA-i- RNA, RNA that has been depleted for abundant transcripts, and RNA that has been enriched for the transcripts being measured are well known (see, e.g., Hitchen et al J Biomol Tech. 2013 24: S43-S44).
- the method involves making cDNA from the RNA, then the cDNA may be made using an oligo(d)T primer, a random primer or a population of gene-specific primers that hybridize to the transcripts being analyzed.
- the absolute amount of each transcript may be determined, or the amount of each transcript relative to one or more control transcript may be determined. Whether the amount of a transcript is increased or decreased may be in relation to the amount of the transcript (e.g., the average amount of the transcript) in control samples (e.g., in blood samples collected from a population of at least 100, at least 200, or at least 500 subjects that are known or not known to have viral and/or bacterial infections).
- control samples e.g., in blood samples collected from a population of at least 100, at least 200, or at least 500 subjects that are known or not known to have viral and/or bacterial infections.
- the method may comprise providing a report indicating whether the subject has a viral or bacterial infection based on the measurements of the amounts of the transcripts. In some embodiments, this step may involve calculating a score based on the weighted amounts of each of the transcripts, where the scores correlates with the phenotype and can be a number such as a probability, likelihood or score out of 10, for example. In these embodiments, the method may comprise inputting the amounts of each of the transcripts into one or more algorithms, executing the algorithms, and receiving a score for each phenotype based on the calculations.
- other measurements from the subject e.g., whether the subject is male, the age of the subject, white blood cell count, neutrophils count, band count, lymphocyte count, monocyte count, whether the subject is immunosuppressed, and/or whether there are Gram-negative bacteria present, etc., may be input into the algorithm.
- the method may involve creating the report e.g., in an electronic form, and forwarding the report to a doctor or other medical professional to help identify a suitable course of action, e.g., to identify a suitable therapy for the subject.
- the report may be used along with other metrics as a diagnostic to determine whether the subject has a viral of bacterial infection.
- report can be forwarded to a“remote location”, where“remote location,” means a location other than the location at which the image is examined.
- a remote location could be another location (e.g., office, lab, etc.) in the same city, another location in a different city, another location in a different state, another location in a different country, etc.
- office e.g., lab, etc.
- the two items can be in the same room but separated, or at least in different rooms or different buildings, and can be at least one mile, ten miles, or at least one hundred miles apart.
- “Communicating” information references transmitting the data representing that information as electrical signals over a suitable communication channel (e.g., a private or public network).
- “Forwarding" an item refers to any means of getting that item from one location to the next, whether by physically transporting that item or otherwise (where that is possible) and includes, at least in the case of data, physically transporting a medium carrying the data or communicating the data. Examples of communicating media include radio or infra-red transmission channels as well as a network connection to another computer or networked device, and the internet or including email transmissions and information recorded on websites and the like.
- the report may be analyzed by an MD or other qualified medical professional, and a report based on the results of the analysis of the image may be forwarded to the subject from which the sample was obtained.
- a system may include a computer containing a processor, a storage component (i.e., memory), a display component, and other components typically present in general purpose computers.
- the storage component stores information accessible by the processor, including instructions that may be executed by the processor and data that may be retrieved, manipulated or stored by the processor.
- the storage component includes instructions for determining whether the subject has a viral or bacterial infection using the measurements described above as inputs.
- the computer processor is coupled to the storage component and configured to execute the instructions stored in the storage component in order to receive patient data and analyze patient data according to one or more algorithms.
- the display component may display information regarding the diagnosis of the patient.
- the storage component may be of any type capable of storing information accessible by the processor, such as a hard-drive, memory card, ROM, RAM, DVD, CD-ROM, USB Flash drive, write-capable, and read-only memories.
- the processor may be any well-known processor, such as processors from Intel Corporation. Alternatively, the processor may be a dedicated controller such as an ASIC.
- the instructions may be any set of instructions to be executed directly (such as machine code) or indirectly (such as scripts) by the processor.
- instructions such as machine code
- steps such as scripts
- programs may be used interchangeably herein.
- the instructions may be stored in object code form for direct processing by the processor, or in any other computer language including scripts or collections of independent source code modules that are interpreted on demand or compiled in advance.
- Data may be retrieved, stored or modified by the processor in accordance with the instructions.
- the data may be stored in computer registers, in a relational database as a table having a plurality of different fields and records, XML documents, or flat files.
- the data may also be formatted in any computer-readable format such as, but not limited to, binary values, ASCII or Unicode.
- the data may comprise any information sufficient to identify the relevant information, such as numbers, descriptive text, proprietary codes, pointers, references to data stored in other memories (including other network locations) or information which is used by a function to calculate the relevant data.
- Therapeutic methods are also provided.
- these methods may comprise identifying a subject as having a viral infection or a bacterial infection using the methods described above, and treating a subject based on whether the subject is indicated as having a viral infection or bacterial infection.
- this method may comprise receiving a report indicating whether the subject has a viral infection or a bacterial infection, wherein the report is based on the gene expression data obtained by measuring the amount of RNA transcripts encoded by JUP, SUCLG2, IFI27, FCER1A, HESX1,
- the method may comprise: (a) identifying the patient as having increased JUP, SUCLG2, IFI27, and FCER1A, and HESX1 expression, and treating the subject with anti-viral therapy; or (b) identifying the patient as having increased SMARCD3, ICAM1, EBI3 expression, and treating the subject with an anti-bacterial therapy.
- a subject indicated as having a viral infection may be treated by administering a therapeutically effective dose of an antiviral agent, such as a broad-spectrum antiviral agent, an antiviral vaccine, a neuraminidase inhibitor (e.g., zanamivir (Relenza) and oseltamivir (Tamiflu)), a nucleoside analogue (e.g., acyclovir, zidovudine (AZT), and lamivudine), an antisense antiviral agent (e.g., phosphorothioate antisense antiviral agents (e.g., Fomivirsen (Vitravene) for cytomegalovirus retinitis), morpholino antisense antiviral agents), an inhibitor of viral uncoating (e.g., Amantadine and rimantadine for influenza, Pleconaril for rhinoviruses), an inhibitor of viral entry (e.g., Fuzeon for HIV),
- Podophyllotoxin Protease inhibitor, Raltegravir, Reverse transcriptase inhibitor, Ribavirin, Rimantadine, Ritonavir, Pyramidine, Saquinavir, Sofosbuvir, Stavudine, Synergistic enhancer (antiretroviral), Telaprevir, Tenofovir, Tenofovir disoproxil, Tipranavir,
- Trifluridine Trizivir, Tromantadine, Truvada, Valaciclovir (Valtrex), Valganciclovir, Vicriviroc, Vidarabine, Viramidine, Zalcitabine, Zanamivir (Relenza), and Zidovudine.
- a subject indicated as having a bacterial infection may be treated by administering a therapeutically effective dose of an antibiotic.
- Antibiotics may include broad spectrum, bactericidal, or bacteriostatic antibiotics.
- Exemplary antibiotics include aminoglycosides such as Amikacin, Amikin, Gentamicin, Garamycin, Kanamycin, Kantrex, Neomycin, Neo- Fradin, Netilmicin, Netromycin, Tobramycin, Nebcin, Paromomycin, Humatin,
- Streptomycin Spectinomycin(Bs), and Trobicin
- ansamycins such as Geldanamycin, Herbimycin, Rifaximin, and Xifaxan
- carbacephems such as Loracarbef and Lorabid
- carbapenems such as Ertapenem, Invanz, Doripenem, Doribax, Imipenem/Cilastatin, Primaxin, Meropenem, and Merrem; cephalosporins such as Cefadroxil, Duricef, Cefazolin, Ancef, Cefalotin or Cefalothin, Keflin, Cefalexin, Keflex, Cefaclor, Distaclor, Cefamandole, Mandol, Cefoxitin, Mefoxin, Cefprozil, Cefzil, Cefuroxime, Ceftin, Zinnat, Cefixime, Cefdinir, Cefditoren, Cefoperazone, Cefotaxime, Cefpodoxime, Ceftazidime, Ceftibuten, Ceftizoxime, Ceftriaxone, Cefepime, Maxipime, Ceftaroline fosamil, Teflaro, Ce
- lincosamides such as Clindamycin, Cleocin, Lincomycin, and Lincocin
- lipopeptides such as Daptomycin and Cubicin
- macrolides such as Azithromycin, Zithromax, Sumamed, Xithrone, Clarithromycin, Biaxin, Dirithromycin, Dynabac, Erythromycin, Erythocin, Erythroped, Roxithromycin, Troleandomycin, Tao, Telithromycin, Ketek, Spiramycin, and Rovamycine
- monobactams such as Aztreonam and Azactam
- nitrofurans such as Furazolidone, Furoxone,
- Nitrofurantoin, Macrodantin, and Macrobid Nitrofurantoin, Macrodantin, and Macrobid
- oxazolidinones such as Linezolid, Zyvox, VRSA, Posizolid, Radezolid, and Torezolid
- penicillins such as Penicillin V, Veetids (Pen- Vee-K), Piperacillin, Pipracil, Penicillin G, Pfizerpen, Temocillin, Negaban, Ticarcillin, and Ticar
- penicillin combinations such as Amoxicillin/clavulanate, Augmentin,
- quinolones/fluoroquinolones such as Ciprofloxacin, Cipro, Ciproxin, Ciprobay, Enoxacin, Penetrex, Gatifloxacin, Tequin, Gemifloxacin, Factive, Levofloxacin, Levaquin,
- Tetracycline and Sumycin, Achromycin V, and Steclin drugs against mycobacteria such as Clofazimine, Lamprene, Dapsone, Avlosulfon, Capreomycin, Capastat, Cycloserine, Seromycin, Ethambutol, Myambutol, Ethionamide, Trecator, Isoniazid, I.N.H.,
- kits for practicing the subject methods may contain reagents for measuring the amount of RNA transcripts encoded by JUP, SUCLG2, IFI27, FCER1A, HESX1,
- the kit may comprise, for each RNA transcript, a sequence-specific oligonucleotide that hybridizes to the transcript.
- the sequence-specific oligonucleotide may be biotinylated and/or labeled with an optically-detectable moiety.
- the kit may comprise, for each RNA transcript, a pair of PCR primers that amplify a sequence from the RNA transcript, or cDNA made from the same.
- the kit may comprise an array of
- oligonucleotide probes wherein the array comprises, for each RNA transcript, at least one sequence- specific oligonucleotide that hybridizes to the transcript.
- the oligonucleotide probes may be spatially addressable on the surface of a planar support, or tethered to optically addressable beads, for example.
- the kit may comprise reagents comprise multiple reaction vessels, each vessel comprising at least one (e.g., 2, 3,4, 5, or 6) sequence- specific isothermal amplification primer that hybridizes to a single transcript, e.g., a transcript from a single gene selected from JUP, SUCLG2, IFI27, FCER1A, HESX1, SMARCD3, ICAM1, and EBI3, or cDNA made from the same.
- the kit may contain at least 8 reaction vessels, where each reaction vessels contain one or more primers for detection of an RNA transcript encoded by a single gene.
- the kit may contain reagents for measuring the amount of up to a total of 30 or 50 RNA transcripts.
- the kit may contain reagents for measuring the amount of RNA transcripts of a set of any number of genes (e.g., at least 2, at least 3, at least 4, at least 5, at least 6, or at least 7 genes, up to 30 or 50 genes), where the set of genes includes any pair of genes listed in Table 2 as well as optionally other genes (e.g., at least 2, at least 3, at least 4, at least 5, at least 6, or at least 7 other genes) that independently are or are not listed on Table 1.
- the kit may comprise, for each RNA transcript, a pair of PCR primers that amplify a sequence from the RNA transcript, or cDNA made from the same.
- kit may be present in separate containers or certain compatible components may be precombined into a single container, as desired.
- the subject kit may further include instructions for using the components of the kit to practice the subject method.
- the method can be practiced by measuring the amount of RNA transcripts encoded by than the eight listed genes, e.g., by measuring the amount of RNA transcripts encoded by 2, 3, 4, 5, 6, or 7 of the listed genes.
- the total number of transcripts measured in some embodiments may be 30 or 50 RNA in some embodiments.
- the method may further comprise measuring the amount of RNA transcripts of other genes listed in Table 1 below.
- the method may be practiced by measuring the amount of RNA transcripts of a set of any number of genes (e.g., at least 2, at least 3, at least 4, at least 5, at least 6, or at least 7 genes, up to 30 or 50 genes), where the set of genes includes any pair of genes listed in Table 2 as well as optionally other genes (e.g., at least 2, at least 3, at least 4, at least 5, at least 6, or at least 7 other genes) that are independently listed or not listed in Table 1.
- a set of any number of genes e.g., at least 2, at least 3, at least 4, at least 5, at least 6, or at least 7 genes, up to 30 or 50 genes
- the set of genes includes any pair of genes listed in Table 2 as well as optionally other genes (e.g., at least 2, at least 3, at least 4, at least 5, at least 6, or at least 7 other genes) that are independently listed or not listed in Table 1.
- the method may further comprise measuring the amount of RNA transcripts encoded by CEACAM1, ZDHHC19, C9orf95, GNA15, BATF, C3AR1, KIAA1370, TGFBI, MTCH1, RPGRIP1, and HLA-DPB 1 in addition to the listed genes.
- increased expression of the CEACAM1, ZDHHC19, C9orf95, GNA15, BATF, and C3AR1 biomarkers and decreased expression of the KIAA1370, TGFBI, MTCH1, RPGRIP1, and HLA-DPB 1 indicate that the subject has sepsis as described in WO2016145426.
- the present method can be used as an integrated decision model for the treatment of both bacterial and viral infections.
- Standard abbreviations may be used, e.g., room temperature (RT); base pairs (bp); kilobases (kb); picoliters (pi); seconds (s or sec); minutes (m or min); hours (h or hr); days (d); weeks (wk or wks); nanoliters (nl); microliters (ul); milliliters (ml); liters (L); nanograms (ng); micrograms (ug); milligrams (mg); grams ((g), in the context of mass); kilograms (kg); equivalents of the force of gravity ((g), in the context of centrifugation); nanomolar (nM); micromolar (uM), millimolar (mM); molar (M); amino acids (aa);
- kilobases kb
- base pairs bp
- nucleotides nt
- intramuscular i.m.
- intraperitoneal i.p.
- subcutaneous s.c.
- microarray data were renormalized from raw data (when available) using standard methods.
- Affymetrix arrays were normalized using GC robust multiarray average (gcRMA) (on arrays with mismatch probes) or RMA.
- Illumina, Agilent, GE, and other commercial arrays were normalized via normal-exponential background correction followed by quantile normalization. Custom arrays were not renormalized and were used as is.
- Data were log2-transformed, and a fixed-effect model was used to summarize probes to genes within each study. Within each study, cohorts assayed with different microarray types were treated as independent.
- Signature score A previously described signature score 1,2,5,24,25 was used to perform disease classification.
- the signature score (Si) is calculated as the geometric mean of the genes that are positively correlated with the response variable (in this case, bacterial infections) minus the geometric mean of the negatively correlated genes (Eq. 1).
- This method combines a greedy backward search with an exhaustive search.
- Abridged Best Subset Selection is a way to combine the strengths of both of these methods.
- a greedy backward search on the initial gene list was run.
- the search involves taking the starting gene set and calculating the AUROC after individually removing each of the genes.
- the search further involves identifying which gene’s removal leads to the largest increase in AUROC, and then permanently removing that gene from the set.
- This same strategy is then applied to the new gene set, once again removing the gene whose exclusion results in the largest increase in AUROC.
- this step would be repeated until a point where removing any gene results in a reduction of AUROC that is greater than some pre-defined threshold is reached.
- the greedy backward search is simply run until enough genes are eliminated to be able to perform best subset selection (in this case, this cutoff was 20 genes).
- the best subset selection can be run on the abridged gene list. Briefly, the diagnostic power of every possible combination of the genes is assessed by calculating the signature scores for each combination and reporting the corresponding AUROC. Next, for every unique number of total genes, the subset of genes that produces the best AUC is reported. This results in a list of the best signatures for each number of total genes, from which the final gene signature can be selected. Derivation of the 8 gene signature using MANATEE
- MANATEE Multicohort ANalysis of AggregaTed gEne Expression or MANATEE (Fig. 1).
- MANATEE was developed as a multicohort analysis framework to allow integration of a large number of independent heterogeneous datasets in a single gene expression analyses than was possible with the previous workflow.
- MANATEE starts by randomly splitting data into discovery and held-out validation. Here 70% of the data was assigned to discovery and the remaining 30% to held-out validation. Next, the discovery and held-out validation data are independently normalize using COCONUT.
- MANATEE it must not only pass the set thresholds in the statistics calculated in the full discovery data, but it must also pass the thresholds for each iteration of the discovery data with one dataset removed. This prevents any single dataset from exerting too strong of a presence on the selection of genes.
- the top 100 genes with the highest SAM score were selected.
- an Abridged BSS (described above) was performed on these genes. From the results of the Abridged BSS, a 15-gene signature (the signature with the max AUROC) and an 8-gene signature (the smallest signature that was within the 95% Cl of the max AUROC signature) were selected to test in Hold-out
- the systematic search for gene expression microarray or RNA-seq cohorts that profiled patients with intracellular bacterial, extracellular bacterial, or viral infections resulting in febrile symptoms 3,4 identified 43 whole blood (WB) cohorts and 9 peripheral blood mononuclear cell (PBMC) that met the inclusion criteria. 5 22
- the 43 independent WB cohorts were comprised of 1963 non-healthy patient samples (562 extracellular bacterial infections, 320 intracellular bacterial infections, and 1081 viral infections), whereas the 9 independent PBMC cohorts were comprised of 417 non-healthy patient samples (172 extracellular bacterial infections, 11 intracellular bacterial infections, and 234 viral infections). These data included both children and adults from a broad spectrum of geographic regions.
- Multicohort ANalysis of AggregaTed gEne Expression MANATEE
- Fig. 1 was developed. In this framework, 70% of the data was randomly assigned to the “discovery” cohort and the other 30% as“hold-out validation”. Next, COCONUT normalization was applied across all discovery cohorts. 2 COCONUT was applied separately to the discovery and held-out validation data. After co-normalization, there were 6086 common genes across all datasets. After calculating differential expression statistics for each gene, the framework involved filtering by selecting the top 100 genes (58 up in bacterial infection, 42 up in viral infection) with the highest SAM (Significance Analysis of
- Microarrays score. Using the previously described signature score model 1 2,5 24,25 , these 100 genes were used to classify samples as having bacterial or viral infections, resulting in an AUROC of 0.874 (95% Cl 0.854 to 0.894) in Discovery data.
- Abridged BSS Abridged Best Subset Selection
- the next step involved running an Abridged Best Subset Selection (Abridged BSS) on the list of 100 genes, which consists of first running a greedy backward search to select the top 20 best genes, and then running an exhaustive search on those 20 genes.
- the 15-gene signature had an AUROC of 0.948 (95% Cl 0.926 to 0.969) and the 8-gene signature had an AUROC of 0.947 (95% Cl 0.925 to 0.969) (Fig. 2 B). Because both signatures had virtually equivalent AUROCs in held-out validation, the smaller 8-gene signature was chosen for further investigation. In this signature, there were 3 genes that were higher in bacterial infections ( SMARCD3 , ICAM1, EBI3 ) and 5 genes that were higher in viral infections (JUP, SUCLG2, IFI27, FCER1A, HESX1).
- the 8-signature had an AUROC of 0.948 (95% Cl 0.929 to 0.967), 0.943 (95% Cl 0.921 to 0.966), and 0.978 (95% Cl 0.945 to 1) for distinguishing all bacterial vs. viral infections, extracellular bacterial vs. viral infections, and intracellular bacterial vs. viral infections, respectively (Fig.
- the 8-gene signature had an AUROC of 0.91 (95% Cl 0.816 to 0.1) and 0.915 (95% Cl 0.859 to 0.971) for distinguishing viral infections from extracellular and intracellular bacterial infections, respectively.
Landscapes
- Chemical & Material Sciences (AREA)
- Life Sciences & Earth Sciences (AREA)
- Organic Chemistry (AREA)
- Proteomics, Peptides & Aminoacids (AREA)
- Health & Medical Sciences (AREA)
- Engineering & Computer Science (AREA)
- Zoology (AREA)
- Wood Science & Technology (AREA)
- Analytical Chemistry (AREA)
- Immunology (AREA)
- Genetics & Genomics (AREA)
- General Engineering & Computer Science (AREA)
- Physics & Mathematics (AREA)
- Biophysics (AREA)
- Microbiology (AREA)
- Biotechnology (AREA)
- Biochemistry (AREA)
- Bioinformatics & Cheminformatics (AREA)
- General Health & Medical Sciences (AREA)
- Molecular Biology (AREA)
- Virology (AREA)
- Software Systems (AREA)
- Chemical Kinetics & Catalysis (AREA)
- Theoretical Computer Science (AREA)
- Pathology (AREA)
- Data Mining & Analysis (AREA)
- Medical Informatics (AREA)
- Evolutionary Computation (AREA)
- Computing Systems (AREA)
- General Physics & Mathematics (AREA)
- Mathematical Physics (AREA)
- Computer Vision & Pattern Recognition (AREA)
- Artificial Intelligence (AREA)
- Measuring Or Testing Involving Enzymes Or Micro-Organisms (AREA)
- Medicines That Contain Protein Lipid Enzymes And Other Medicines (AREA)
Abstract
Description


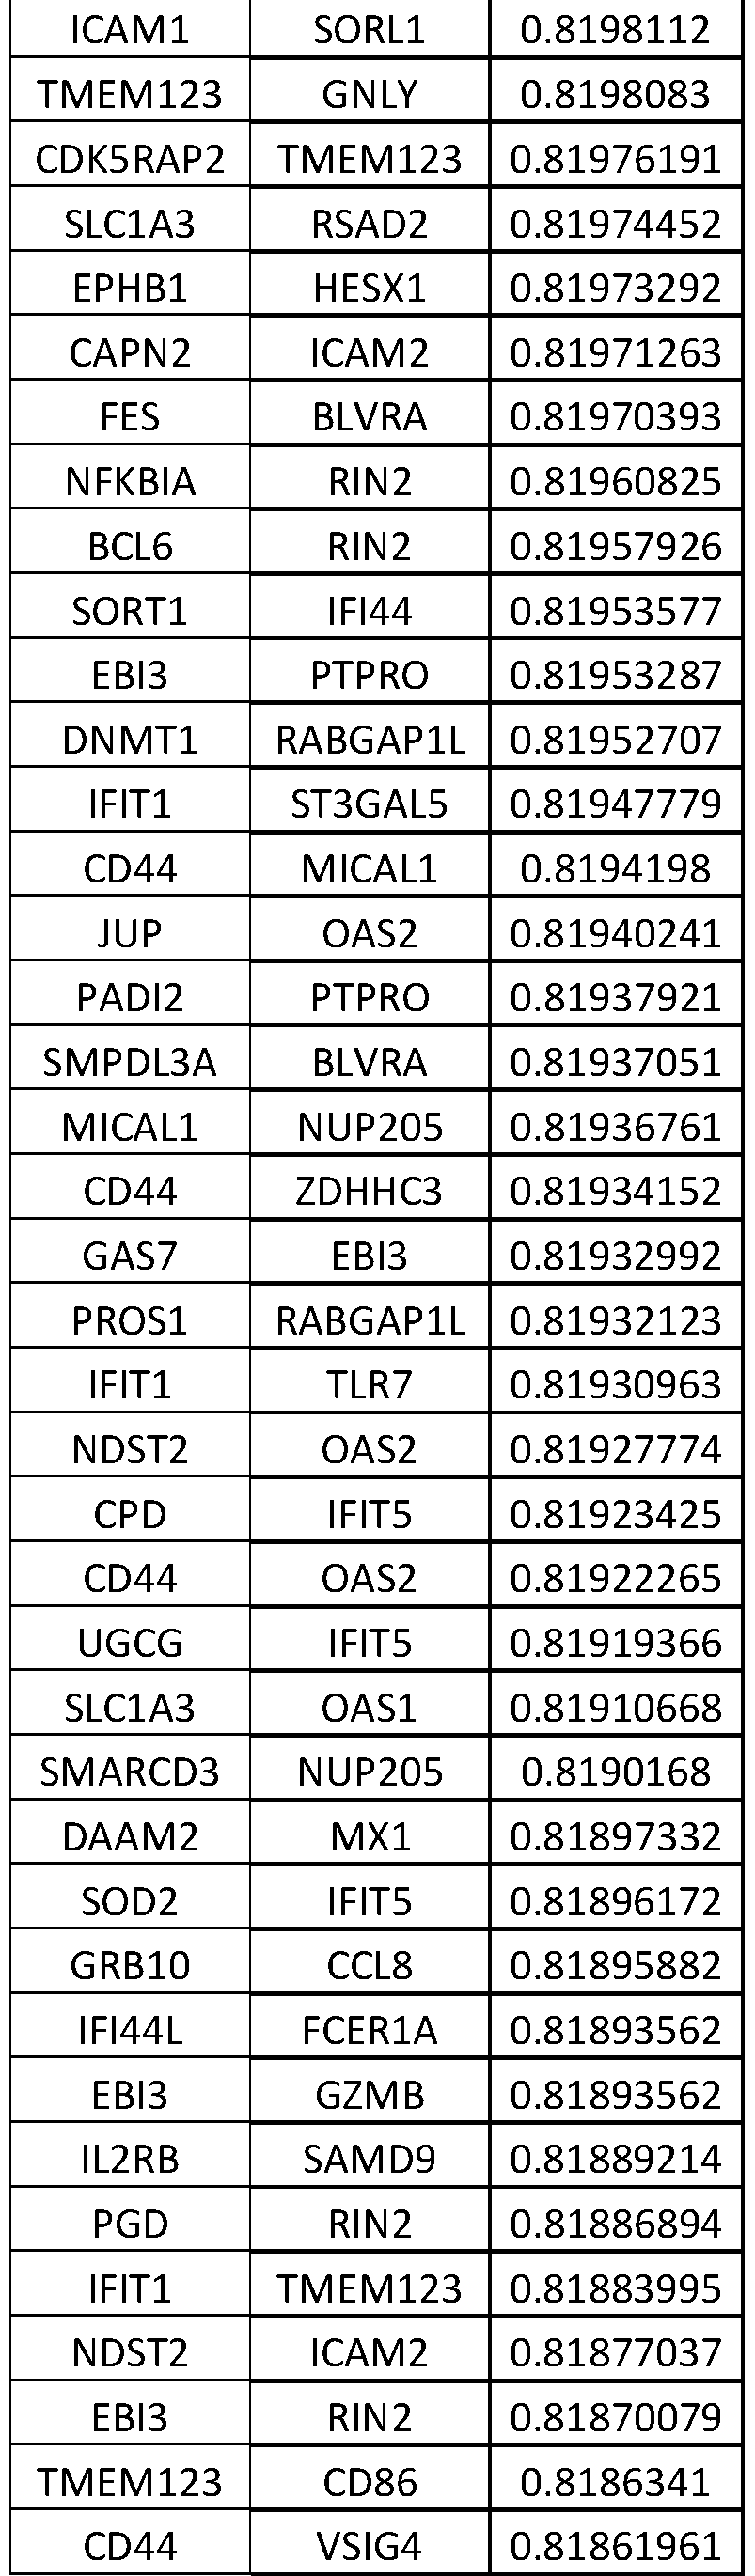


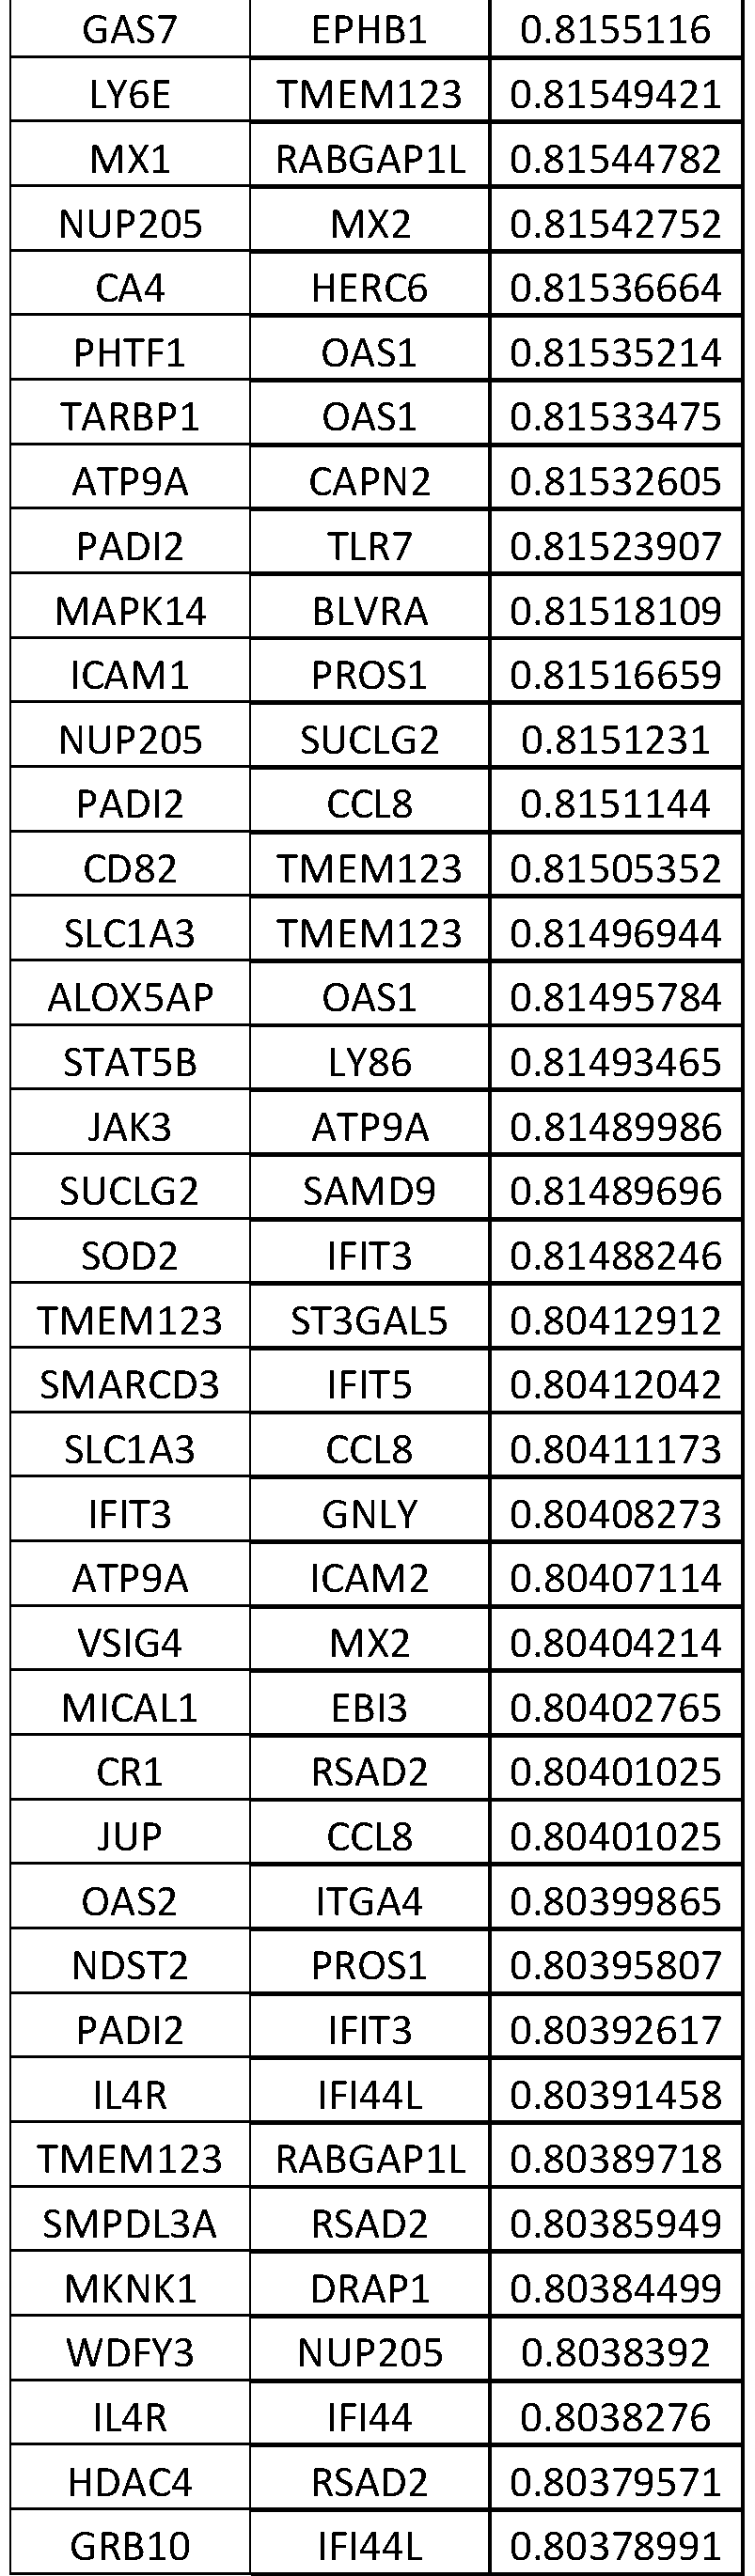


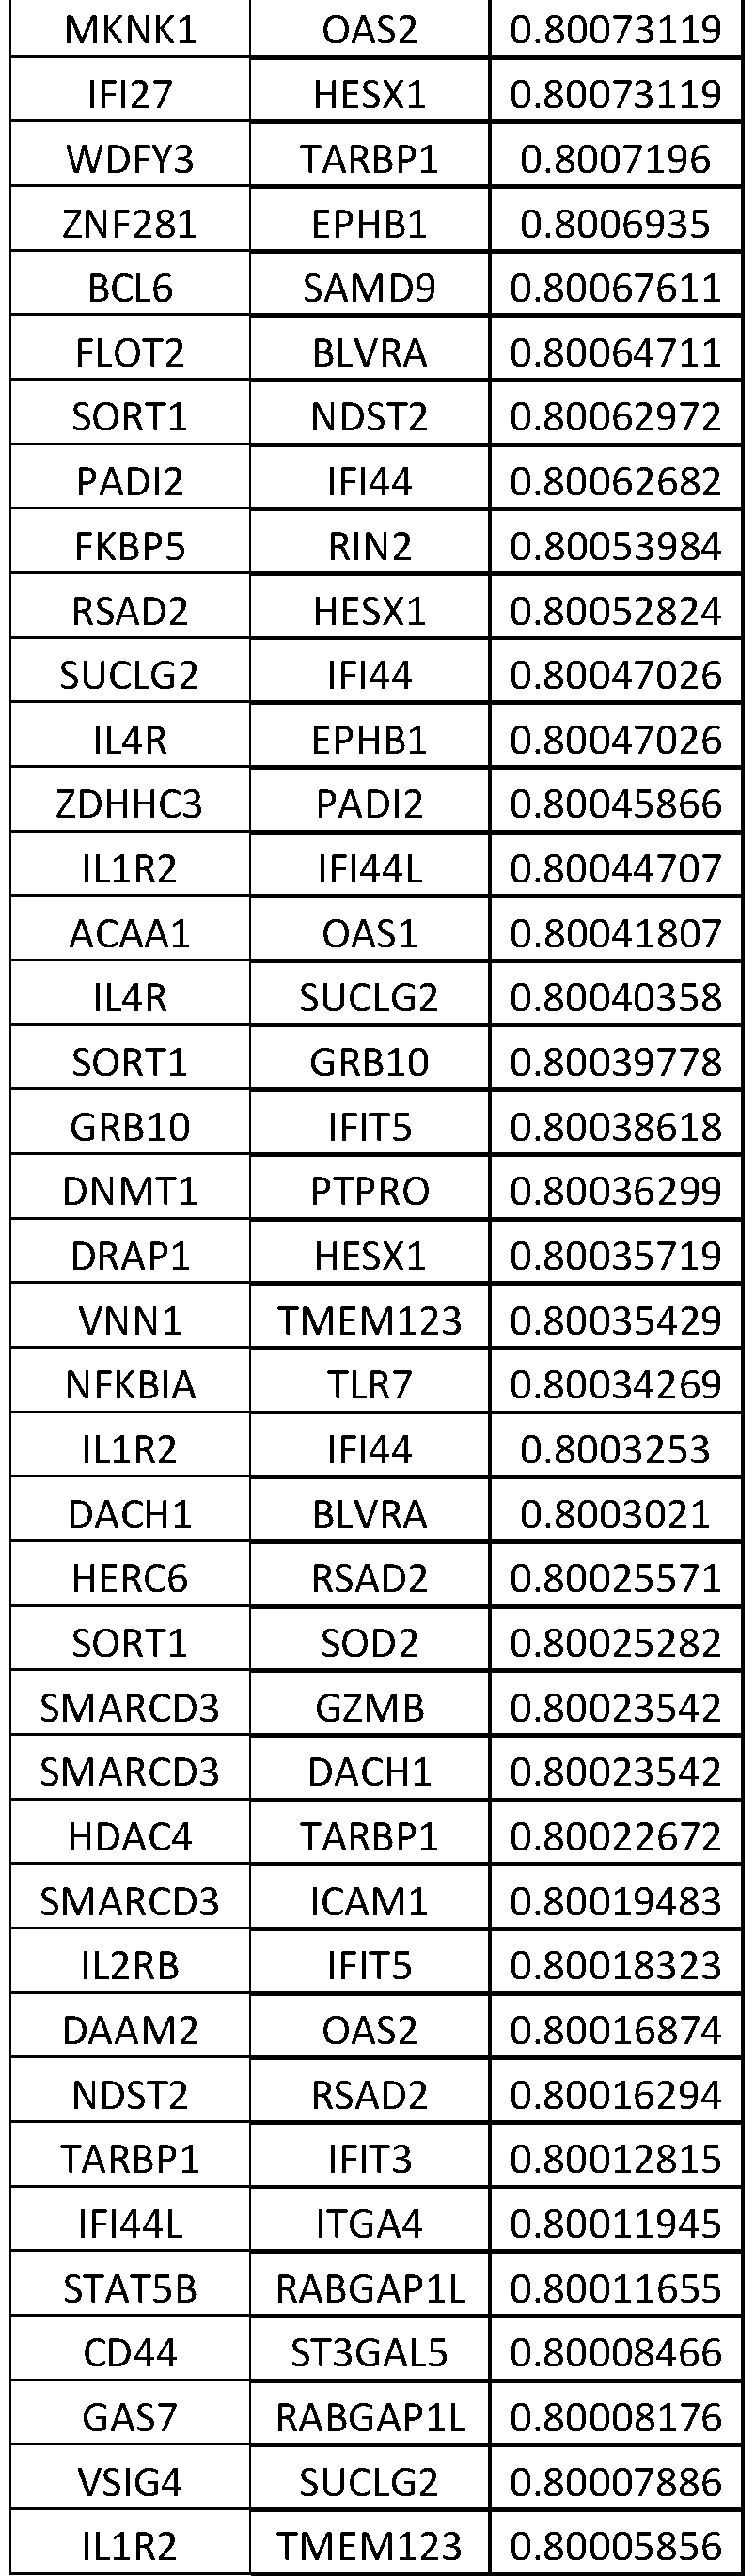


Claims
Priority Applications (10)
| Application Number | Priority Date | Filing Date | Title |
|---|---|---|---|
| CN202080032337.4A CN113785074A (en) | 2019-03-25 | 2020-02-14 | Features used to diagnose bacterial versus viral infections |
| KR1020217034254A KR20210143854A (en) | 2019-03-25 | 2020-02-14 | Signatures for diagnosing bacterial versus viral infections |
| AU2020247700A AU2020247700A1 (en) | 2019-03-25 | 2020-02-14 | Signature for diagnosis of bacterial VS viral infections |
| CA3134617A CA3134617A1 (en) | 2019-03-25 | 2020-02-14 | Signature for diagnosis of bacterial vs viral infections |
| US17/441,670 US20220112542A1 (en) | 2019-03-25 | 2020-02-14 | Signature for diagnosis of bacterial vs viral infections |
| BR112021018823A BR112021018823A2 (en) | 2019-03-25 | 2020-02-14 | Signature for diagnosis of bacterial vs viral infections |
| MX2021011694A MX2021011694A (en) | 2019-03-25 | 2020-02-14 | Signature for diagnosis of bacterial vs viral infections. |
| JP2021557068A JP2022528343A (en) | 2019-03-25 | 2020-02-14 | Signature for Diagnosis of Bacterial Infection vs. Viral Infection |
| EP20777654.3A EP3947735A4 (en) | 2019-03-25 | 2020-02-14 | SIGNATURE FOR THE DISCRIMINATIVE DIAGNOSIS BETWEEN DISEASES OF BACTERIAL AND VIRAL ORIGIN |
| IL286559A IL286559A (en) | 2019-03-25 | 2021-09-22 | A signature for the diagnosis of bacterial versus viral infections |
Applications Claiming Priority (2)
| Application Number | Priority Date | Filing Date | Title |
|---|---|---|---|
| US201962823460P | 2019-03-25 | 2019-03-25 | |
| US62/823,460 | 2019-03-25 |
Publications (1)
| Publication Number | Publication Date |
|---|---|
| WO2020197659A1 true WO2020197659A1 (en) | 2020-10-01 |
Family
ID=72610258
Family Applications (1)
| Application Number | Title | Priority Date | Filing Date |
|---|---|---|---|
| PCT/US2020/018414 WO2020197659A1 (en) | 2019-03-25 | 2020-02-14 | Signature for diagnosis of bacterial vs viral infections |
Country Status (11)
| Country | Link |
|---|---|
| US (1) | US20220112542A1 (en) |
| EP (1) | EP3947735A4 (en) |
| JP (1) | JP2022528343A (en) |
| KR (1) | KR20210143854A (en) |
| CN (1) | CN113785074A (en) |
| AU (1) | AU2020247700A1 (en) |
| BR (1) | BR112021018823A2 (en) |
| CA (1) | CA3134617A1 (en) |
| IL (1) | IL286559A (en) |
| MX (1) | MX2021011694A (en) |
| WO (1) | WO2020197659A1 (en) |
Families Citing this family (3)
| Publication number | Priority date | Publication date | Assignee | Title |
|---|---|---|---|---|
| US20250015353A1 (en) | 2021-10-26 | 2025-01-09 | Lg Energy Solution, Ltd. | Non-Aqueous Electrolyte Solution for Lithium Secondary Battery and Lithium Secondary Battery Comprising the Same |
| AU2023323860A1 (en) * | 2022-08-12 | 2025-03-27 | bioMérieux | Method for determining the viral or bacterial nature of an infection |
| EP4365308A1 (en) * | 2022-11-03 | 2024-05-08 | Biomérieux | Method for determining the viral or bacterial nature of an infection |
Citations (9)
| Publication number | Priority date | Publication date | Assignee | Title |
|---|---|---|---|---|
| US20020197611A1 (en) * | 2001-06-21 | 2002-12-26 | Chagovetz Alexander Michael | Method for real-time detection and quantification of nucleic acid sequences using fluorescent primers |
| US20140038188A1 (en) * | 2001-03-09 | 2014-02-06 | Nurith Kurn | Methods and compositions for amplification of rna sequences |
| WO2016145426A1 (en) | 2015-03-12 | 2016-09-15 | The Board Of Trustees Of The Leland | Methods for diagnosis of sepsis |
| WO2017149548A1 (en) * | 2016-03-03 | 2017-09-08 | Memed Diagnostics Ltd. | Rna determinants for distinguishing between bacterial and viral infections |
| WO2017214061A1 (en) | 2016-06-07 | 2017-12-14 | The Board Of Trustees Of The Leland Stanford Junior University | Methods for diagnosis of bacterial and viral infections |
| WO2018011316A1 (en) * | 2016-07-12 | 2018-01-18 | Imperial Innovations Ltd | Method of identifying a subject having a bacterial infection |
| WO2018064229A1 (en) * | 2016-09-27 | 2018-04-05 | Caris Science, Inc. | Oligonucleotide probes and uses thereof |
| US20180305689A1 (en) * | 2015-04-22 | 2018-10-25 | Mina Therapeutics Limited | Sarna compositions and methods of use |
| WO2019008415A1 (en) * | 2017-07-05 | 2019-01-10 | Datar Rajan | Exosome and pbmc based gene expression analysis for cancer management |
Family Cites Families (2)
| Publication number | Priority date | Publication date | Assignee | Title |
|---|---|---|---|---|
| GB2547034A (en) * | 2016-02-05 | 2017-08-09 | Imp Innovations Ltd | Biological methods and materials for use therein |
| US20170327874A1 (en) * | 2016-05-11 | 2017-11-16 | University Of Rochester | Methods of Diagnosing Bacterial Infections |
-
2020
- 2020-02-14 JP JP2021557068A patent/JP2022528343A/en active Pending
- 2020-02-14 US US17/441,670 patent/US20220112542A1/en active Pending
- 2020-02-14 AU AU2020247700A patent/AU2020247700A1/en active Pending
- 2020-02-14 WO PCT/US2020/018414 patent/WO2020197659A1/en unknown
- 2020-02-14 EP EP20777654.3A patent/EP3947735A4/en active Pending
- 2020-02-14 CA CA3134617A patent/CA3134617A1/en active Pending
- 2020-02-14 MX MX2021011694A patent/MX2021011694A/en unknown
- 2020-02-14 KR KR1020217034254A patent/KR20210143854A/en active Pending
- 2020-02-14 CN CN202080032337.4A patent/CN113785074A/en active Pending
- 2020-02-14 BR BR112021018823A patent/BR112021018823A2/en unknown
-
2021
- 2021-09-22 IL IL286559A patent/IL286559A/en unknown
Patent Citations (9)
| Publication number | Priority date | Publication date | Assignee | Title |
|---|---|---|---|---|
| US20140038188A1 (en) * | 2001-03-09 | 2014-02-06 | Nurith Kurn | Methods and compositions for amplification of rna sequences |
| US20020197611A1 (en) * | 2001-06-21 | 2002-12-26 | Chagovetz Alexander Michael | Method for real-time detection and quantification of nucleic acid sequences using fluorescent primers |
| WO2016145426A1 (en) | 2015-03-12 | 2016-09-15 | The Board Of Trustees Of The Leland | Methods for diagnosis of sepsis |
| US20180305689A1 (en) * | 2015-04-22 | 2018-10-25 | Mina Therapeutics Limited | Sarna compositions and methods of use |
| WO2017149548A1 (en) * | 2016-03-03 | 2017-09-08 | Memed Diagnostics Ltd. | Rna determinants for distinguishing between bacterial and viral infections |
| WO2017214061A1 (en) | 2016-06-07 | 2017-12-14 | The Board Of Trustees Of The Leland Stanford Junior University | Methods for diagnosis of bacterial and viral infections |
| WO2018011316A1 (en) * | 2016-07-12 | 2018-01-18 | Imperial Innovations Ltd | Method of identifying a subject having a bacterial infection |
| WO2018064229A1 (en) * | 2016-09-27 | 2018-04-05 | Caris Science, Inc. | Oligonucleotide probes and uses thereof |
| WO2019008415A1 (en) * | 2017-07-05 | 2019-01-10 | Datar Rajan | Exosome and pbmc based gene expression analysis for cancer management |
Non-Patent Citations (41)
| Title |
|---|
| ANDRES-TERRE, M ET AL.: "Integrated, Multi-cohort Analysis Identifies Conserved Transcriptional Signatures across Multiple Respiratory Viruses", IMMUNITY, vol. 43, 2015, pages 1199 - 1211, XP029351827, DOI: 10.1016/j.immuni.2015.11.003 |
| ARDURA, M. I ET AL.: "Enhanced monocyte response and decreased central memory T cells in children with invasive Staphylococcus aureus infections", PLOS ONE, vol. 4, 2009, pages 5446 |
| BANCHEREAU, R ET AL.: "Host immune transcriptional profiles reflect the variability in clinical disease manifestations in patients with Staphylococcus aureus infections", PLOS ONE, vol. 7, 2012, pages 34390 |
| BENJAMINI, YHOCHBERG, Y: "Controlling the False Discovery Rate: A Practical and Powerful Approach to Multiple Testing", J R STAT SOC SERIES B STAT METHODOL, vol. 57, 1995, pages 289 - 300 |
| BERDAL, J. E ET AL.: "Excessive innate immune response and mutant D222G/N in severe A (H1N1) pandemic influenza", J INFECT, vol. 63, pages 308 - 316, XP028296070, DOI: 10.1016/j.jinf.2011.07.004 |
| DE STEENHUIJSEN PITERS, W. A ET AL.: "Nasopharyngeal Microbiota, Host Transcriptome, and Disease Severity in Children with Respiratory Syncytial Virus Infection", AM J RESPIR CRIT CARE MED, vol. 194, pages 1104 - 1115 |
| DUPONT ET AL., J. REPROD IMMUNOL, vol. 66, 2005, pages 175 - 91 |
| EDGAR, RDOMRACHEV, MLASH, A. E: "Gene Expression Omnibus: NCBI gene expression and hybridization array data repository", NUCLEIC ACIDS RES, vol. 30, 2002, pages 207 - 210 |
| FREEMAN ET AL., BIOTECHNIQUES, vol. 199926, no. 112-22, pages 124 - 5 |
| GAO ET AL., J. VIROL METHODS, vol. 255, 2018, pages 71 - 75 |
| HEINONEN, S.: " Rhinovirus Detection in Symptomatic and Asymptomatic Children:", AM J RESPIR CRIT CARE MED, vol. 193, pages 772 - 782 |
| HERBERG, J. A ET AL.: "Transcriptomic profiling in childhood H1N1/09 influenza reveals reduced expression of protein synthesis genes", J INFECT DIS, vol. 208, 2013, pages 1664 - 1668, XP055234869, DOI: 10.1093/infdis/jit348 |
| HITCHEN ET AL., J BIOMOL TECH, vol. 24, 2013, pages S43 - S44 |
| IOANNIDIS, I ET AL.: "Plasticity and virus specificity of the airway epithelial cell immune response during respiratory virus infection", J VIROL, vol. 86, 2012, pages 5422 - 5436, XP055178785, DOI: 10.1128/JVI.06757-11 |
| JOHNSON, W. EFAU, L. CRABINOVIC, A: "Adjusting batch effects in microarray expression data using empirical Bayes methods", BIOSTATISTICS, 2006 |
| JONG, V. L ET AL.: "Transcriptome assists prognosis of disease severity in respiratory syncytial virus infected infants", SCI REP, vol. 6, no. 36603, 2016 |
| KHALIFIAN ET AL., J INVEST DERMATOL, vol. 135, 2015, pages 1 - 5 |
| KHATRI, P ET AL.: "A common rejection module (CRM) for acute rejection across multiple organs identifies novel therapeutics for organ transplantation", J EXP MED, vol. 210, 2013, pages 2205 - 2221, XP055327589, DOI: 10.1084/jem.20122709 |
| KOLESNIKOV, N ET AL.: "ArrayExpress update--simplifying data submissions", NUCLEIC ACIDS RES, vol. 43, 2015, pages D1113 - 1116 |
| LINDOW, J. C.: "Cathelicidin Insufficiency in Patients with Fatal Leptospirosis", PLOS PATHOG, vol. 12, 2016, pages 1005943 |
| LIU, T. Y ET AL.: "An individualized predictor of health and disease using paired reference and target samples", BMC BIOINFORMATICS, vol. 17, 2016, pages 47 |
| MEJIAS, A ET AL.: "Whole blood gene expression profiles to assess pathogenesis and disease severity in infants with respiratory syncytial virus infection", PLOS MED, vol. 10, pages 10015249 |
| MORIN ET AL., BIOTECHNIQUES, vol. 45, 2008, pages 81 - 94 |
| MORTAZAVI ET AL.: "Mapping and quantifying mammalian transcriptomes by RNA-Seq", NATURE METHODS, vol. 5, no. 7, 30 May 2008 (2008-05-30), pages 621 - 628, XP008148418, DOI: 10.1038/nmeth.1226 * |
| NIXON, BIOMOL. DET. AND QUANT, vol. 2, 2014, pages 4 - 10 |
| PARNELL, G. P ET AL.: "A distinct influenza infection signature in the blood transcriptome of patients with severe community-acquired pneumonia", CRIT CARE, vol. 16, 2012, pages R157, XP021129459, DOI: 10.1186/cc11477 |
| PARNELL, G.: " Aberrant cell cycle and apoptotic changes characterise severe influenza A infection--a meta-analysis of genomic signatures in circulating leukocytes.", PLOS ONE, vol. 6, 2011, pages 17186 |
| PEASE ET AL., BIOMED MICRODEVICES, vol. 20, 2018, pages 56 |
| RODRIGUEZ-FERNANDEZ, R ET AL.: "Respiratory Syncytial Virus Genotypes, Host Immune Profiles, and Disease Severity in Young Children Hospitalized With Bronchiolitis", J INFECT DIS, vol. 217, 2017, pages 24 - 34 |
| SAMBROOK ET AL.: "Molecular Cloning: A Laboratory Manual", vol. I-IV, 1989, BLACKWELL SCIENTIFIC PUBLICATIONS |
| SEALFON ET AL., METHODS MOL BIOL, vol. 671, 2011, pages 3 - 34 |
| See also references of EP3947735A4 |
| SUAREZ, N. M ET AL.: "Superiority of transcriptional profiling over procalcitonin for distinguishing bacterial from viral lower respiratory tract infections in hospitalized adults", J INFECT DIS, vol. 212, 2015, pages 213 - 222, XP055718783, DOI: 10.1093/infdis/jiv047 |
| SWEENEY, T. EBRAVIAK, LTATO, C. MKHATRI, P: "Genome-wide expression for diagnosis of pulmonary tuberculosis: a multi cohort analysis", LANCET RESPIR MED, vol. 4, 2016, pages 213 - 224 |
| SWEENEY, T. ESHIDHAM, AWONG, H. RKHATRI, P: "A comprehensive time-course-based multicohort analysis of sepsis and sterile inflammation reveals a robust diagnostic gene set", SCI TRANSL, vol. 7, 2015, pages 287ra271 |
| SWEENEY, T. EWONG, H. RKHATRI, P: "Robust classification of bacterial and viral infections via integrated host gene expression diagnostics", SCI TRANSLMED, vol. 8, pages 346ra391 |
| TANG, B. M. ET AL.: "A novel immune biomarker IFI27 discriminates between influenza and bacteria in patients with suspected respiratory infection", EUR RESPIR J, 2017, pages 49 |
| TSALIK, E. L ET AL.: "Host gene expression classifiers diagnose acute respiratory illness etiology", SCI TRANSL MED, vol. 8, 2016, pages 322ra311 |
| TUSHER, V. GTIBSHIRANI, RCHU, G: "Significance analysis of microarrays applied to the ionizing radiation response", PROC NATL ACAD SCI U S A, vol. 98, 2001, pages 5116 - 5121, XP002967440, DOI: 10.1073/pnas.091062498 |
| WANG ET AL., NATURE REVIEWS GENETICS, vol. 10, pages 57 - 63 |
| ZAAS, A. K ET AL.: "Gene expression signatures diagnose influenza and other symptomatic respiratory viral infections in humans", CELL HOST MICROBE, vol. 6, 2009, pages 207 - 217 |
Also Published As
| Publication number | Publication date |
|---|---|
| BR112021018823A2 (en) | 2021-11-23 |
| EP3947735A4 (en) | 2022-12-28 |
| EP3947735A1 (en) | 2022-02-09 |
| CN113785074A (en) | 2021-12-10 |
| IL286559A (en) | 2021-10-31 |
| KR20210143854A (en) | 2021-11-29 |
| MX2021011694A (en) | 2022-01-06 |
| JP2022528343A (en) | 2022-06-10 |
| CA3134617A1 (en) | 2020-10-01 |
| AU2020247700A1 (en) | 2021-10-14 |
| US20220112542A1 (en) | 2022-04-14 |
Similar Documents
| Publication | Publication Date | Title |
|---|---|---|
| US20220127673A1 (en) | Methods for diagnosis of bacterial and viral infections | |
| US20240401107A1 (en) | Methods and systems for processing a nucleic acid sample | |
| US11248259B2 (en) | Method of identifying a subject having a bacterial infection | |
| US20240011096A1 (en) | Biomarkers for use in prognosis of mortality in critically ill patients | |
| US20220112542A1 (en) | Signature for diagnosis of bacterial vs viral infections | |
| US20220399116A1 (en) | Systems and methods for assessing a bacterial or viral status of a sample | |
| Hou et al. | Aging‐related cell type‐specific pathophysiologic immune responses that exacerbate disease severity in aged COVID‐19 patients | |
| US20230212699A1 (en) | Methods to detect and treat sars-cov-2 (covid19) infection | |
| Walsh et al. | Variants and vaccines impact nasal immunity over three waves of SARS-CoV-2 | |
| WO2020096796A1 (en) | Method for predicting severe dengue |
Legal Events
| Date | Code | Title | Description |
|---|---|---|---|
| 121 | Ep: the epo has been informed by wipo that ep was designated in this application |
Ref document number: 20777654 Country of ref document: EP Kind code of ref document: A1 |
|
| ENP | Entry into the national phase |
Ref document number: 3134617 Country of ref document: CA |
|
| ENP | Entry into the national phase |
Ref document number: 2021557068 Country of ref document: JP Kind code of ref document: A |
|
| NENP | Non-entry into the national phase |
Ref country code: DE |
|
| REG | Reference to national code |
Ref country code: BR Ref legal event code: B01A Ref document number: 112021018823 Country of ref document: BR |
|
| ENP | Entry into the national phase |
Ref document number: 2020247700 Country of ref document: AU Date of ref document: 20200214 Kind code of ref document: A |
|
| ENP | Entry into the national phase |
Ref document number: 20217034254 Country of ref document: KR Kind code of ref document: A |
|
| ENP | Entry into the national phase |
Ref document number: 2020777654 Country of ref document: EP Effective date: 20211025 |
|
| ENP | Entry into the national phase |
Ref document number: 112021018823 Country of ref document: BR Kind code of ref document: A2 Effective date: 20210921 |