WO2020196405A1 - 監視装置、表示装置、監視方法及び監視プログラム - Google Patents
監視装置、表示装置、監視方法及び監視プログラム Download PDFInfo
- Publication number
- WO2020196405A1 WO2020196405A1 PCT/JP2020/012724 JP2020012724W WO2020196405A1 WO 2020196405 A1 WO2020196405 A1 WO 2020196405A1 JP 2020012724 W JP2020012724 W JP 2020012724W WO 2020196405 A1 WO2020196405 A1 WO 2020196405A1
- Authority
- WO
- WIPO (PCT)
- Prior art keywords
- process data
- plant
- change amount
- change
- unit
- Prior art date
- Legal status (The legal status is an assumption and is not a legal conclusion. Google has not performed a legal analysis and makes no representation as to the accuracy of the status listed.)
- Ceased
Links
Images





Classifications
-
- G—PHYSICS
- G05—CONTROLLING; REGULATING
- G05B—CONTROL OR REGULATING SYSTEMS IN GENERAL; FUNCTIONAL ELEMENTS OF SUCH SYSTEMS; MONITORING OR TESTING ARRANGEMENTS FOR SUCH SYSTEMS OR ELEMENTS
- G05B23/00—Testing or monitoring of control systems or parts thereof
- G05B23/02—Electric testing or monitoring
Definitions
- the present invention relates to a monitoring device, a display device, a monitoring method, and a monitoring program.
- process data which is time-series data related to the operating status of a plant, may be measured and compared with past process data to determine the status of the plant.
- observation data is acquired from a plurality of sensors, training data consisting of normal data is modeled, and the presence or absence of abnormality in the observation data is detected by the similarity between the observation data and the modeled training data.
- an abnormality detection method for evaluating the degree of influence of each sensor signal, constructing a judgment condition rule, and selecting and displaying a sensor signal according to an abnormality is described.
- a feature vector is extracted based on a time-series sensor signal output by the equipment or device, and a feature to be used and a learning data to be used are selected based on the data check of the feature vector and selected.
- a facility condition monitoring method is described in which a normal model is created based on the training data, a threshold value is set according to the sufficiency of the training data, and an abnormality measurement is calculated by comparing the normal model and the feature vector.
- Patent Document 1 or 2 a technique for determining the state of a plant by comparing past normal process data with current process data is used. However, if the normal process data used as the comparison standard is not properly set, the change of state of the plant may be overlooked or erroneously detected.
- the present invention provides a monitoring device, a display device, a monitoring method, and a monitoring program in which changes in the state of the plant are less likely to be overlooked or erroneously detected.
- the monitoring device compares the process data of the process data with the acquisition unit for acquiring the process data related to the plant and the process data at the time of the first reference time, which is the first period back from the present time.
- the first change detection unit that detects the first change amount and the current process data are compared with the process data at the second reference time that goes back the second period from the current time, and the second change amount of the process data is detected. 2. It includes a change detection unit and a determination unit that determines the operating state of the plant based on the first change amount and the second change amount.
- the display device compares the process data relating to the current plant with the process data at the first reference time retroactively for the first period from the present time, and detects the first change amount of the process data.
- the current process data is compared with the process data at the second reference time, which is the second period back from the current time, the second change amount of the process data is detected, and the plant is based on the first change amount and the second change amount.
- the judgment result of judging the operating state of is displayed.
- a monitoring method is to acquire process data related to the plant in a monitoring device that monitors the plant, and to obtain the current process data in the first reference time retroactively for the first period from the current time.
- the first change amount of the process data is detected, and the current process data is compared with the process data at the second reference time, which is two periods back from the current time, and the second change amount of the process data. Is detected, and the operating state of the plant is determined based on the first change amount and the second change amount.
- the monitoring program acquires process data related to the plant to a monitoring device that monitors the plant, and obtains the current process data from the current process data in the first reference time retroactively for the first period.
- the first change amount of the process data is detected, and the current process data is compared with the process data at the second reference time, which is two periods back from the current time, and the second change amount of the process data. Is detected, and the operating state of the plant is determined based on the first change amount and the second change amount.
- a monitoring device it is possible to provide a monitoring device, a display device, a monitoring method, and a monitoring program in which changes in the state of a plant are less likely to be overlooked or erroneously detected.
- FIG. 1 It is a figure which shows the functional block of the monitoring apparatus which concerns on embodiment of this invention. It is a figure which shows the physical configuration of the monitoring apparatus which concerns on this embodiment. It is a figure which shows an example of the process data acquired by the monitoring apparatus which concerns on this embodiment. It is a figure which shows an example of the degree of change calculated by the monitoring apparatus which concerns on this embodiment. It is a figure which shows the outline of the individual determination and the comprehensive determination by the monitoring device which concerns on this embodiment. It is a figure which shows an example of the determination result report displayed by the monitoring apparatus which concerns on this embodiment. It is a figure which shows the screen example which is displayed when the input of the change span is received by the monitoring device which concerns on this embodiment. It is a flowchart of the monitoring process executed by the monitoring apparatus which concerns on this embodiment.
- FIG. 1 is a diagram showing a functional block of the monitoring device 10 according to the embodiment of the present invention.
- the monitoring device 10 includes an acquisition unit 11, a filter unit 12, a change detection unit 13, an individual determination unit 14, an integrated determination unit 15, an input unit 10e, and a display unit 10f.
- the acquisition unit 11 acquires at least one type of process data related to the plant 100.
- the plant 100 may be any plant, but may be, for example, a power plant including a boiler, an incineration plant, or a chemical plant.
- the process data may be arbitrary data relating to the plant 100, but may be, for example, data obtained by measuring the state of the plant 100 with a sensor, and more specifically, the temperature, pressure, flow rate, etc. of the plant 100. May include measurements of.
- the acquisition unit 11 may acquire process data at predetermined time intervals or continuously acquire process data to acquire time-series data relating to the plant 100.
- the acquisition unit 11 may acquire a plurality of types of process data related to the plant 100.
- the acquisition unit 11 may acquire a plurality of types of process data measured by a plurality of sensors installed in the plant 100.
- the plurality of types of process data may be, for example, data representing different physical quantities such as temperature and pressure, or data representing the same physical quantity such as temperatures measured at different points in the plant 100. Good.
- the acquisition unit 11 acquires the signal A and the signal B related to the plant 100 as a plurality of types of process data.
- the acquisition unit 11 is not limited to acquiring two types of process data, and may acquire three or more types of process data. By acquiring a plurality of types of process data, it is possible to monitor the state change of the plant 100 in more detail.
- the filter unit 12 filters the process data by signal processing.
- the filter unit 12 includes a filter unit (for signal A) 12A and a filter unit (for signal B) 12B.
- the filter unit (for signal A) 12A filters the signal A
- the filter unit (for signal B) 12B filters the signal B.
- the filtering by the filter unit 12 may be realized by a known process, and may be a combination of a high-pass filter, a low-pass filter, a band-pass filter, and a band-stop filter, for example.
- the change detection unit 13 includes a change detection unit that uses at least two or more periods as a reference, and in the present embodiment, the short-term change detection unit (for signal A) 131A, the medium-term change detection unit (for signal A) 132A, and the long-term change. It includes a detection unit (for signal A) 133A, a short-term change detection unit (for signal B) 131B, a medium-term change detection unit (for signal B) 132B, and a long-term change detection unit (for signal B) 133B.
- the change detection unit 13 may include a change detection unit that uses a period of 4 or more as a reference for each of the 3 or more signals. That is, the change detection unit 13 is not limited to the case where three types of periods of "short-term”, “medium-term” and “long-term” are used as a reference, and may include a change detection unit that uses four or more types of periods as a reference. .. By using a plurality of types of periods as a reference, it is possible to grasp the state change of the plant 100 in various time spans in more detail.
- any two of the short-term change detection unit (for signal A) 131A, the medium-term change detection unit (for signal A) 132A, and the long-term change detection unit (for signal A) 133A are the first change detection unit and the first change detection unit of the present invention. 2 Corresponds to the change detection unit. Further, any two of the short-term change detection unit (for signal B) 131B, the medium-term change detection unit (for signal B) 132B, and the long-term change detection unit (for signal B) 133B are the first change detection units of the present invention. And corresponds to the second change detection unit.
- the first change detection unit compares the current process data with the process data at the first reference time retroactively for the first period from the current time, and detects the first change amount of the process data.
- the second change detection unit detects the second change amount of the process data by comparing the current process data with the process data at the second reference time retroactively for the second period from the current time.
- the short-term change detection unit (for signal A) 131A may detect the first change amount by comparing the current signal A with, for example, the signal A at the first reference time, which is one hour back from the current time.
- the medium-term change detection unit (for signal A) 132A may detect the second change amount by comparing the current signal A with, for example, the signal A at the second reference time, which is one day back from the current time.
- the long-term change detection unit (for signal A) 133A may detect the third change amount by comparing the current signal A with, for example, the signal A at the third reference time, which is one week back from the current time.
- the short-term change detection unit (for signal B) 131B may detect the first change amount by comparing the current signal B with, for example, the signal B at the first reference time, which is one hour back from the current time.
- the medium-term change detection unit (for signal B) 132B may detect the second change amount by comparing the current signal B with, for example, the signal B at the second reference time, which is one day back from the current time.
- the long-term change detection unit (for signal B) 133B may detect the third change amount by comparing the current signal B with, for example, the signal B at the third reference time, which is one week back from the current time.
- the first change detection unit and the second change detection unit are configured for each of a plurality of types of process data. That is, the change detection unit 13 includes a short-term change detection unit 131A, a medium-term change detection unit 132A, and a long-term change detection unit 133A for the signal A, and a short-term change detection unit 131B, a medium-term change detection unit 132B, and a long-term change detection unit for the signal B. Includes part 133B. In this way, by using a plurality of types of process data, the state change of the plant 100, which is difficult to capture with one type of process data, can be captured by another type of process data.
- the individual determination unit 14 includes a short-term individual determination unit (for signal A) 141A, a medium-term individual determination unit (for signal A) 142A, a long-term individual determination unit (for signal A) 143A, and a short-term individual determination unit (for signal B) 141B. It includes a medium-term individual determination unit (for signal B) 142B and a long-term individual determination unit (for signal B) 143B.
- “short-term”, “medium-term”, and “long-term” are periods that can be arbitrarily set by the user, and may be the same period as the setting in the change detection unit 13.
- the individual determination unit 14 may include an individual determination unit that uses the amount of change detected with reference to a period of 4 or more for each of the 3 or more signals. By including a plurality of types of individual determination units that detect the amount of change based on a plurality of types of periods, the individual determination unit 14 can determine the state change of the plant 100 in various time spans.
- any two of the short-term individual determination unit (for signal A) 141A, the medium-term individual determination unit (for signal A) 142A, and the long-term individual determination unit (for signal A) 143A are the first individual determination unit and the first individual determination unit of the present invention. 2 Corresponds to the individual judgment unit. Further, any two of the short-term individual determination unit (for signal B) 141B, the medium-term individual determination unit (for signal B) 142B, and the long-term individual determination unit (for signal B) 143B are the first individual determination units of the present invention. And corresponds to the second individual determination unit.
- the first individual determination unit determines the operating state of the plant 100 based on the first change amount detected by the first change detection unit.
- the second individual determination unit determines the operating state of the plant 100 based on the second change amount detected by the second change detection unit.
- the short-term individual determination unit (for signal A) 141A determines the operating state of the plant 100 based on the first change amount detected by the short-term change detection unit (for signal A) 131A.
- the medium-term individual determination unit (for signal A) 142A determines the operating state of the plant 100 based on the second change amount detected by the medium-term change detection unit (for signal A) 132A.
- the long-term individual determination unit (for signal A) 143A determines the operating state of the plant 100 based on the third change amount detected by the long-term change detection unit (for signal A) 133A.
- the short-term individual judgment unit (for signal A) 141A, the medium-term individual judgment unit (for signal A) 142A, and the long-term individual judgment unit (for signal A) 143A are, for example, whether the operating state of the plant 100 is normal or abnormal. May be determined.
- the short-term individual determination unit (for signal B) 141B determines the operating state of the plant 100 based on the first change amount detected by the short-term change detection unit (for signal B) 131B.
- the medium-term individual determination unit (for signal B) 142B determines the operating state of the plant 100 based on the second change amount detected by the medium-term change detection unit (for signal B) 132B.
- the long-term individual determination unit (for signal B) 143B determines the operating state of the plant 100 based on the third change amount detected by the long-term change detection unit (for signal B) 133B.
- the short-term individual determination unit (for signal B) 141B, the medium-term individual determination unit (for signal B) 142B, and the long-term individual determination unit (for signal B) 143B are, for example, whether the operating state of the plant 100 is normal or abnormal. May be determined.
- the integrated determination unit 15 integrates the determination result by the first individual determination unit and the determination result by the second individual determination unit to determine the operating state of the plant 100.
- the integrated determination unit 15 includes a determination result by the short-term individual determination unit (for signal A) 141A, a determination result by the medium-term individual determination unit (for signal A) 142A, and a long-term individual determination unit (signal A).
- Judgment result by 143A (for A) judgment result by short-term individual judgment unit (for signal B) 141B, judgment result by medium-term individual judgment unit (for signal B) 142B, and judgment result by long-term individual judgment unit (for signal B) 143B Integrate to determine the operating state of the plant 100.
- the integrated determination unit 15 integrates the determination results determined using the amount of change detected with reference to the period of 4 or more for each of the 3 or more signals, and determines the operating state of the plant 100. Good. By measuring the state change of the plant 100 in more detail with a plurality of types of signals and using the amount of change detected with reference to a plurality of types of periods, it is possible to determine the state change of the plant 100 in various time spans. , The integrated determination unit 15 can integrate those determination results to more appropriately determine the operating state of the plant 100.
- It is equipped with an individual determination unit 14 and an integrated determination unit 15, and performs individual determination specialized for the first change amount based on the first reference time and the second change amount based on the second reference time. By integrating the results of the individual determinations, it is possible to make a more stable determination of the operating state of the plant 100.
- the monitoring device 10 by using the process data as the comparison reference as the process data at the first reference time and the process data at the second reference time, changes that are difficult to grasp with one reference can be detected by the other. You will be able to catch it by the standard. Further, even if it is difficult to distinguish whether or not the change is caused by noise with only one standard, an appropriate judgment can be made with the other standard. For example, a change that is difficult for the short-term change detection unit (for signal A) 131A may be captured by the medium-term change detection unit (for signal A) 132A or the long-term change detection unit (for signal A) 133A.
- the medium-term change detection unit (signal B) Appropriate judgment may be made by the medium-term individual determination unit (for signal B) 142B or the long-term change detection unit (for signal B) 133B and the long-term individual determination unit (for signal B) 143B. Therefore, according to the monitoring device 10 according to the present embodiment, it is less likely that the state change of the plant 100 is overlooked or erroneously detected.
- the input unit 10e accepts inputs for the first period and the second period.
- the input unit 10e is a first period and a second period set in the change detection unit 13 from a plurality of options such as 1 hour, 12 hours, 1 day, 1 week, 1 month, 6 months, and 1 year. Input may be accepted, or numerical values representing the first period and the second period may be accepted from the user.
- the input unit 10e includes a short-term change detection unit (for signal A) 131A, a medium-term change detection unit (for signal A) 132A, a long-term change detection unit (for signal A) 133A, and a short-term.
- Inputs for the period used by the change detection unit (for signal B) 131B, the medium-term change detection unit (for signal B) 132B, and the long-term change detection unit (for signal B) 133B may be accepted. Further, the input unit 10e may accept input for addition or deletion of a change detection unit that uses different periods as comparison criteria. The input unit 10e can adjust the comparison standard according to the characteristics of the plant 100 to be monitored, and can more appropriately detect the state change of the plant 100 to be monitored.
- the display unit 10f displays the determination result of determining the operating state of the plant 100.
- the display unit 10f may display both the individual determination result by the individual determination unit 14 and the comprehensive determination result (final determination result) by the integrated determination unit 15, or may display either one. .. Further, the display unit 10f may display the amount of change detected by the change detection unit 13.
- FIG. 2 is a diagram showing a physical configuration of the monitoring device 10 according to the present embodiment.
- the monitoring device 10 includes a CPU (Central Processing Unit) 10a corresponding to a calculation unit, a RAM (Random Access Memory) 10b corresponding to a storage unit, a ROM (Read only Memory) 10c corresponding to a storage unit, and a communication unit 10d. And an input unit 10e and a display unit 10f.
- Each of these configurations is connected to each other via a bus so that data can be transmitted and received.
- the monitoring device 10 is composed of one computer will be described, but the monitoring device 10 may be realized by combining a plurality of computers.
- the configuration shown in FIG. 2 is an example, and the monitoring device 10 may have configurations other than these, or may not have a part of these configurations.
- the CPU 10a is a control unit that controls execution of a program stored in the RAM 10b or ROM 10c, calculates data, and processes data.
- the CPU 10a is a calculation unit that executes a program (monitoring program) for determining the operating state of the plant 100 based on the amount of change in process data related to the plant 100.
- the CPU 10a receives various data from the input unit 10e and the communication unit 10d, displays the calculation result of the data on the display unit 10f, and stores it in the RAM 10b or ROM 10c.
- the RAM 10b is a storage unit in which data can be rewritten, and may be composed of, for example, a semiconductor storage element.
- the RAM 10b may store data such as a program executed by the CPU 10a and process data related to the plant 100. It should be noted that these are examples, and data other than these may be stored in the RAM 10b, or a part of these may not be stored.
- the ROM 10c is a storage unit capable of reading data, and may be composed of, for example, a semiconductor storage element.
- the ROM 10c may store, for example, a monitoring program or data that is not rewritten.
- the communication unit 10d is an interface for connecting the monitoring device 10 to another device.
- the communication unit 10d may be connected to a communication network N such as the Internet.
- the input unit 10e receives data input from the user, and may include, for example, a keyboard and a touch panel.
- the display unit 10f visually displays the calculation result by the CPU 10a, and may be configured by, for example, an LCD (Liquid Crystal Display).
- the display unit 10f may display the above-mentioned determination result or display the determination result report which will be described in detail later.
- the monitoring program may be stored in a storage medium readable by a computer such as RAM 10b or ROM 10c and provided, or may be provided via a communication network connected by the communication unit 10d.
- the CPU 10a executes the monitoring program to realize the operations of the acquisition unit 11, the filter unit 12, the change detection unit 13, the individual determination unit 14, and the integrated determination unit 15 described with reference to FIG. ..
- these physical configurations are examples and do not necessarily have to be independent configurations.
- the monitoring device 10 may include an LSI (Large-Scale Integration) in which the CPU 10a and the RAM 10b or ROM 10c are integrated.
- LSI Large-Scale Integration
- FIG. 3 is a diagram showing an example of process data acquired by the monitoring device 10 according to the present embodiment.
- the vertical axis shows the value of the process data
- the horizontal axis shows the time (time)
- the time change of the process data is shown.
- the monitoring device 10 estimates the probability distribution P1 of the process data (first process data D1) and the probability distribution P2 of the current process data (second process data) at the time of the first reference time, which goes back the first period ⁇ 1 from the present time. To do.
- the monitoring device 10 may estimate the probability distribution at each time point by, for example, estimating the average of the process data by the following mathematical formula (1) and estimating the variance of the process data by the following mathematical formula (2). ..
- x (n) is the value of the process data at time n
- x (n) with a bar is the average of x (n).
- ⁇ 2 (n) is the variance of the process data at time n.
- ⁇ is a memory coefficient of 0 or more and 1 or less.
- the first change detection unit may detect the first change amount based on the statistic calculated from the probability distribution of the current process data and the probability distribution of the process data at the time of the first reference time. Further, the second change detection unit may detect the second change amount based on the statistic calculated from the probability distribution of the current process data and the probability distribution of the process data at the time of the second reference time. Specifically, the change detection unit 13 first uses the following mathematical formula (3) based on the probability distribution P2 of the current process data and the probability distribution P1 of the process data at the first reference time, based on the calculated average and variance. The amount of change d ⁇ 1 (n) may be calculated.
- the change detection unit 13 calculates the second change amount d ⁇ 2 (n) not only for the first period ⁇ 1 but also for the second period ⁇ 2 by the mathematical formula (3), and for the third period ⁇ 3, the third change detection unit 13 uses the mathematical formula (3).
- the amount of change d ⁇ 3 (n) may be calculated. In this way, by calculating the amount of change based on the statistics calculated from the probability distribution of the process data instead of the process data itself, the influence of noise can be further reduced, and the operating state of the plant 100 can be further reduced. A stable judgment can be made.
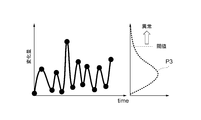
- FIG. 4 is a diagram showing an example of the amount of change calculated by the monitoring device 10 according to the present embodiment.
- the vertical axis shows the value of the amount of change
- the horizontal axis shows the time (time)
- the time change of the amount of change is shown.
- the individual determination unit 14 may estimate the probability distribution of the amount of change based on the history of the amount of change detected by the change detection unit 13.
- FIG. 4 shows the probability distribution P3 of the estimated amount of change.
- the individual determination unit 14 sets a threshold value based on the probability distribution P3, and may determine that the operating state of the plant 100 is abnormal when the amount of change is equal to or greater than the threshold value.
- the threshold value may be set on the basis of 1%, for example.
- the individual determination unit 14 may estimate the probability distribution of the amount of change by assuming, for example, a lognormal distribution.
- the individual determination unit 14 may calculate the first anomaly degree a ⁇ 1 (n) by the following mathematical formula (4) based on the first change amount d ⁇ 1 (n) and the threshold value Th.
- the first anomaly degree a ⁇ 1 (n) becomes 0.
- the first anomaly degree a ⁇ 1 (n) Increases by (d ⁇ 1 (n) -Th) and increases cumulatively.
- the individual determination unit 14 may determine that the operating state of the plant 100 is abnormal from the viewpoint of the first period ⁇ 1.
- the individual determination unit 14 calculates the second anomaly degree a ⁇ 2 (n) not only for the first period ⁇ 1 but also for the second period ⁇ 2 by the mathematical formula (4), and for the third period ⁇ 3, the third is the third by the mathematical formula (4).
- the degree of anomaly a ⁇ 3 (n) may be calculated. In this way, by calculating the degree of abnormality by the cumulative sum of the values obtained by subtracting the threshold value from the amount of change, the momentary increase in the amount of change due to the influence of noise is excluded, and a more stable determination of the operating state of the plant 100 is made. It can be performed.
- FIG. 5 is a diagram showing an outline of individual determination and comprehensive determination by the monitoring device 10 according to the present embodiment.
- the first graph G1 showing the determination value (signal A ⁇ ⁇ 1) for determining the operating state of the plant 100 in the first period ⁇ 1 for the signal A and the operating state of the plant 100 in the first period ⁇ 1 for the signal B.
- the second graph G2 showing the determined judgment value (signal B ⁇ ⁇ 1)
- the third graph G3 showing the result of filtering the judgment value (signal A ⁇ ⁇ 1)
- the result of filtering the judgment value signal B ⁇ ⁇ 1
- the fourth graph G4 showing the above and the fifth graph G5 showing the determination value obtained by comprehensively determining the operating state of the plant 100 are shown.
- the first graph G1 may be output with the value set to 0.
- the individual determination unit 14 sets the determination value to 1 when, for example, the first abnormality degree a ⁇ 1 (n) relating to the signal B is greater than 0, and the first abnormality degree a ⁇ 1 (n) relating to the signal B is 0 or less. If, the determination value is set to 0, and the second graph G2 may be output.
- the first graph G1 and the second graph G2 each include spike-shaped determination values. These are considered to be due to the influence of noise, and false alarms can be prevented by removing them.
- the individual determination unit 14 keeps the determination value at 1 when the determination value is continuously 1 over a predetermined period, and sets the determination value to 0 when the determination value is 1 only for a period shorter than the predetermined period. , The determination value may be filtered. As a result of filtering the first graph G1, the third graph G3 is obtained, and the third graph G3 does not include spike-shaped determination values. Similarly, as a result of filtering the second graph G2, the fourth graph G4 is obtained, and the fourth graph G4 does not include the spike-shaped determination value.
- the integrated determination unit 15 may output the fifth graph G5 indicating the integrated determination value by the logical sum of the third graph G3 and the fourth graph G4.
- the integration determination unit 15 may output the fifth graph G5 indicating the integration determination value by the logical product of the third graph G3 and the fourth graph G4.
- the monitoring device 10 has described an individual for a plurality of periods for a plurality of types of process data.
- the determination results may be filtered and the integrated determination result may be output.
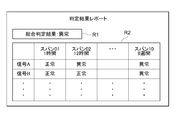
- FIG. 6 is a diagram showing an example of a determination result report displayed by the monitoring device 10 according to the present embodiment.
- the determination result report includes the integrated determination result R1 and the individual determination result R2.
- the integration determination result R1 is "abnormal", indicating that the operating state of the plant 100 is abnormal.
- the individual judgment result R2 is an individual judgment regarding a plurality of types of process data such as signal A, signal B, etc. for 10 different periods of "span 01 1 hour”, “span 02 12 hours” ... "span 10 8 weeks”. The results are displayed together.
- the individual judgment result for "span 01 1 hour” is “normal”
- the individual judgment result for "span 02 12 hours” is “abnormal”
- the individual judgment result for "span 10 8 weeks is "abnormal”. From this, it can be read that the signal A is abnormal when observed in a medium to long-term period of 12 hours or more, and is normal when observed in a short period of about 1 hour.
- signal B the individual judgment result for "span 01 1 hour” is "normal”
- the individual judgment result for "span 02 12 hours” is "normal”
- the individual judgment result for "span 10 8 weeks is “abnormal”. From this, it can be read that the signal B is abnormal when observed in a long-term period and normal when observed in a short-term to medium-term period such as 1 hour to 12 hours.
- the final judgment result can be immediately grasped, and at what time span the plurality of types of process data show abnormal values. It can be easily analyzed, and the operating state of the plant 100 can be determined more accurately.
- FIG. 7 is a diagram showing an example of a screen displayed when the monitoring device 10 according to the present embodiment accepts an input of a change span.
- the explanatory text "change detector number input unit” is displayed, and the detector number display field B1, the span input field generation button B2, the adoption button B3, the first span display field T1, and the second span
- the display column T2 and the tenth span display column T10 are displayed.
- the change detector is an individual detector included in the change detection unit 13.
- the number of change detectors currently set is displayed in the detector number display column B1. In the case of this example, the number of change detectors currently set is "10".
- the first span display column T1 In the "change span input unit” column, the first span display column T1, the second span display column T2 ... the tenth span display column T10 is displayed.
- “span 01: 1 hour” is displayed in the first span display column T1
- "span 02:12 hours” is displayed in the second span display column T2
- “span 02:12 hours” is displayed in the tenth span display column T10. It is displayed as "Span 10: 8 weeks”.
- the change detector displayed in the "change span input unit” column is set in the change detection unit 13 of the monitoring device 10.
- the input of the change span may be accepted for each of a plurality of types of process data, or may be collectively accepted, and a change detector having the same time span may be set for the plurality of types of process data.
- FIG. 8 is a flowchart of the monitoring process executed by the monitoring device 10 according to the present embodiment.
- the monitoring device 10 first receives the input of the change detection span (S10).
- the monitoring device 10 receives the input of the number of change detectors set in the change detection unit 13 and the change span used in each change detector (S11), and changes. Set the detection unit 13.
- the monitoring device 10 acquires a plurality of types of process data relating to the plant 100 (S12), filters the plurality of types of process data, respectively (S13), and changes the plurality of types of process data in the short-term, medium-term, and long-term amounts. Is detected (S14).
- the three change spans of short-term, medium-term, and long-term are examples, and the monitoring device 10 may calculate the amount of change using an arbitrary time span.
- the monitoring device 10 individually determines the operating state of the plant 100 based on the short-term, medium-term, and long-term changes in the plurality of types of process data (S15). Then, the monitoring device 10 integrates the individual determination results and determines the operating state of the plant 100 (S16).
- the monitoring device 10 displays a determination result report including the individual determination result and the integrated determination result (S17).
- the monitoring device 10 may continuously execute the processes S12 to S17, and may perform the process S11 in response to an input from the user.
- the display unit 10f of the monitoring device 10 compares the process data related to the plant between the present time and the first reference time retroactively for the first period from the present time, and displays the first change amount and the process data from the present time and the second from the present time. It is also a display device that displays the determination result of determining the operating state of the plant 100 based on the second change amount detected in comparison with the second reference time retroactive in the period.
- the display device may display at least one of the individual determination result and the integrated determination result. By displaying at least one of the individual determination result and the integrated determination result, the operating state of the plant 100 can be easily grasped.
- 10 Monitoring device, 10a ... CPU, 10b ... RAM, 10c ... ROM, 10d ... Communication unit, 10e ... Input unit, 10f ... Display unit, 11 ... Acquisition unit, 12 ... Filter unit, 12A ... Filter unit (for signal A) ), 12B ... Filter unit (for signal B), 13 ... Change detection unit, 131A ... Short-term change detection unit (for signal A), 132A ... Medium-term change detection unit (for signal A) 133A ... Long-term change detection unit (signal A) A), 131B ... Short-term change detection unit (for signal B), 132B ... Medium-term change detection unit (for signal B), 133B ...
- Long-term change detection unit for signal B
- 14 Individual judgment unit, 141A ... Short-term individual Judgment unit (for signal A), 142A ... Medium-term individual judgment unit (for signal A), 143A ... Long-term individual judgment unit (for signal A), 141B ... Short-term individual judgment unit (for signal B), 142B ... Medium-term individual judgment unit (For signal B), 143B ... Long-term individual judgment unit (for signal B), 15 ... Integrated judgment unit, 100 ... Plant
Landscapes
- Physics & Mathematics (AREA)
- General Physics & Mathematics (AREA)
- Engineering & Computer Science (AREA)
- Automation & Control Theory (AREA)
- Testing And Monitoring For Control Systems (AREA)
Abstract
監視装置は、プラントに関するプロセスデータを取得する取得部と、現時点のプロセスデータを、現時点から第1期間遡った第1基準時におけるプロセスデータと比較して、プロセスデータの第1変化量を検出する第1変化検出部と、現時点のプロセスデータを、現時点から第2期間遡った第2基準時におけるプロセスデータと比較して、プロセスデータの第2変化量を検出する第2変化検出部と、第1変化量及び第2変化量に基づいて、プラントの運転状態を判定する判定部と、を備える。
Description
本発明は、監視装置、表示装置、監視方法及び監視プログラムに関する。
従来、プラントの運転状態に関する時系列データであるプロセスデータを測定し、過去のプロセスデータと比較して、プラントの状態を判定することがある。
例えば、下記特許文献1には、複数のセンサから観測データを取得し、正常データからなる学習データをモデル化し、観測データとモデル化した学習データとの類似度により観測データの異常の有無を検知し、各センサ信号の影響度の評価、判定条件ルールの構築、異常に応じたセンサ信号の選択と表示を行う異常検知方法が記載されている。
また、下記特許文献2には、設備または装置の出力する時系列のセンサ信号に基づき特徴ベクトルを抽出し、特徴ベクトルのデータチェックに基づき使用する特徴及び使用する学習データを選択し、選択された学習データに基づき正常モデルを作成し、学習データの十分性に応じてしきい値を設定して、正常モデルと特徴ベクトルの比較により異常測度を算出する設備状態監視方法が記載されている。
特許文献1又は2に記載のように、過去の正常なプロセスデータを現在のプロセスデータと比較して、プラントの状態を判定する技術が用いられている。しかしながら、比較基準とする正常なプロセスデータをどの程度過去のものとするかを適切に設定しなければ、プラントの状態変化を見逃したり、誤検出してしまったりすることがある。
そこで、本発明は、プラントの状態変化を見逃したり、誤検出してしまったりすることがより少なくなる監視装置、表示装置、監視方法及び監視プログラムを提供する。
本発明の一態様に係る監視装置は、プラントに関するプロセスデータを取得する取得部と、現時点のプロセスデータを、現時点から第1期間遡った第1基準時におけるプロセスデータと比較して、プロセスデータの第1変化量を検出する第1変化検出部と、現時点のプロセスデータを、現時点から第2期間遡った第2基準時におけるプロセスデータと比較して、プロセスデータの第2変化量を検出する第2変化検出部と、第1変化量及び第2変化量に基づいて、プラントの運転状態を判定する判定部と、を備える。
この態様によれば、比較基準とするプロセスデータを、第1基準時におけるプロセスデータ及び第2基準時におけるプロセスデータとすることで、一方の基準では捉えづらい変化を他方の基準で捉えられるようになる。また、一方の基準だけではノイズに起因する変化であるか否かを見分けづらい場合であっても、他方の基準で適切な判定ができるようになる。そのため、プラントの状態変化を見逃したり、誤検出してしまったりすることがより少なくなる。
本発明の他の態様に係る表示装置は、現時点のプラントに関するプロセスデータを、現時点から第1期間遡った第1基準時におけるプロセスデータと比較して、プロセスデータの第1変化量を検出し、現時点のプロセスデータを、現時点から第2期間遡った第2基準時におけるプロセスデータと比較して、プロセスデータの第2変化量を検出し、第1変化量及び第2変化量に基づいて、プラントの運転状態を判定した判定結果を表示する。
本発明の他の態様に係る監視方法は、プラントを監視する監視装置に、プラントに関するプロセスデータを取得することと、現時点のプロセスデータを、現時点から第1期間遡った第1基準時におけるプロセスデータと比較して、プロセスデータの第1変化量を検出することと、現時点のプロセスデータを、現時点から第2期間遡った第2基準時におけるプロセスデータと比較して、プロセスデータの第2変化量を検出することと、第1変化量及び第2変化量に基づいて、プラントの運転状態を判定することと、を実行させる。
本発明の他の態様に係る監視プログラムは、プラントを監視する監視装置に、プラントに関するプロセスデータを取得することと、現時点のプロセスデータを、現時点から第1期間遡った第1基準時におけるプロセスデータと比較して、プロセスデータの第1変化量を検出することと、現時点のプロセスデータを、現時点から第2期間遡った第2基準時におけるプロセスデータと比較して、プロセスデータの第2変化量を検出することと、第1変化量及び第2変化量に基づいて、プラントの運転状態を判定することと、を実行させる。
本発明によれば、プラントの状態変化を見逃したり、誤検出してしまったりすることがより少なくなる監視装置、表示装置、監視方法及び監視プログラムを提供することができる。
添付図面を参照して、本発明の実施形態について説明する。なお、各図において、同一の符号を付したものは、同一又は同様の構成を有する。
図1は、本発明の実施形態に係る監視装置10の機能ブロックを示す図である。監視装置10は、取得部11、フィルタ部12、変化検出部13、個別判定部14、統合判定部15、入力部10e及び表示部10fを備える。
取得部11は、プラント100に関する少なくとも1種類のプロセスデータを取得する。ここで、プラント100は、任意のプラントであってよいが、例えば、ボイラを含む発電プラントや焼却プラントであったり、化学プラントであったりしてよい。また、プロセスデータは、プラント100に関する任意のデータであってよいが、例えば、プラント100の状態をセンサで測定したデータであってよく、より具体的には、プラント100の温度、圧力及び流量等の測定値を含んでよい。取得部11は、所定の時間間隔でプロセスデータを取得したり、連続的にプロセスデータを取得したりして、プラント100に関する時系列データを取得してよい。
取得部11は、プラント100に関する複数種類のプロセスデータを取得してよい。取得部11は、プラント100に設置された複数のセンサにより測定された複数種類のプロセスデータを取得してよい。ここで、複数種類のプロセスデータは、例えば、温度と圧力のように異なる物理量を表すデータであったり、プラント100の異なる箇所で測定された温度のように同じ物理量を表すデータであったりしてよい。本実施形態では、取得部11は、プラント100に関する信号A及び信号Bを複数種類のプロセスデータとして取得する。なお、取得部11は、2種類のプロセスデータを取得する場合に限定されず、3種類以上のプロセスデータを取得してもよい。複数種類のプロセスデータを取得することで、プラント100の状態変化をより詳細に監視することができる。
フィルタ部12は、プロセスデータを信号処理によってフィルタリングする。フィルタ部12は、フィルタ部(信号A用)12A及びフィルタ部(信号B用)12Bを含む。フィルタ部(信号A用)12Aは、信号Aのフィルタリングを行い、フィルタ部(信号B用)12Bは、信号Bのフィルタリングを行う。フィルタ部12によるフィルタリングは、公知の処理によって実現されてよく、例えば、ハイパスフィルタ、ローパスフィルタ、バンドパスフィルタ及びバンドストップフィルタを組み合わせたフィルタリングであってよい。
変化検出部13は、少なくとも2以上の期間を基準として用いる変化検出部を含み、本実施形態では、短期変化検出部(信号A用)131A、中期変化検出部(信号A用)132A、長期変化検出部(信号A用)133A、短期変化検出部(信号B用)131B、中期変化検出部(信号B用)132B及び長期変化検出部(信号B用)133Bを含む。ここで、「短期」、「中期」及び「長期」は、ユーザによって任意に設定することができる期間であり、例えば、1時間、12時間、1日、1週間、1ヶ月、6ヶ月及び1年のように設定することができる。なお、変化検出部13は、3以上の信号それぞれについて、4以上の期間を基準として用いる変化検出部を含んでよい。すなわち、変化検出部13は、「短期」、「中期」及び「長期」の3種類の期間を基準として用いる場合に限定されず、4種類以上の期間を基準として用いる変化検出部を含んでよい。複数種類の期間を基準として用いることで、様々なタイムスパンにおけるプラント100の状態変化をより詳細に
捉えることができる。
捉えることができる。
短期変化検出部(信号A用)131A、中期変化検出部(信号A用)132A及び長期変化検出部(信号A用)133Aのうち任意の2つは、本発明の第1変化検出部及び第2変化検出部に相当する。また、短期変化検出部(信号B用)131B、中期変化検出部(信号B用)132B及び長期変化検出部(信号B用)133Bのうち任意の2つは、本発明の第1変化検出部及び第2変化検出部に相当する。第1変化検出部は、現時点のプロセスデータを、現時点から第1期間遡った第1基準時におけるプロセスデータと比較して、プロセスデータの第1変化量を検出する。また、第2変化検出部は、現時点のプロセスデータを、現時点から第2期間遡った第2基準時におけるプロセスデータと比較して、プロセスデータの第2変化量を検出する。
短期変化検出部(信号A用)131Aは、現時点の信号Aを、例えば、現時点から1時間遡った第1基準時における信号Aと比較して、第1変化量を検出してよい。同様に、中期変化検出部(信号A用)132Aは、現時点の信号Aを、例えば、現時点から1日遡った第2基準時における信号Aと比較して、第2変化量を検出してよい。また、長期変化検出部(信号A用)133Aは、現時点の信号Aを、例えば、現時点から1週間遡った第3基準時における信号Aと比較して、第3変化量を検出してよい。
短期変化検出部(信号B用)131Bは、現時点の信号Bを、例えば、現時点から1時間遡った第1基準時における信号Bと比較して、第1変化量を検出してよい。同様に、中期変化検出部(信号B用)132Bは、現時点の信号Bを、例えば、現時点から1日遡った第2基準時における信号Bと比較して、第2変化量を検出してよい。また、長期変化検出部(信号B用)133Bは、現時点の信号Bを、例えば、現時点から1週間遡った第3基準時における信号Bと比較して、第3変化量を検出してよい。
本実施形態に係る監視装置10では、第1変化検出部及び第2変化検出部は、複数種類のプロセスデータ毎に構成されている。すなわち、変化検出部13は、信号A用の短期変化検出部131A、中期変化検出部132A及び長期変化検出部133Aと、信号B用の短期変化検出部131B、中期変化検出部132B及び長期変化検出部133Bとを含む。このように、複数種類のプロセスデータを用いることで、ある種類のプロセスデータでは捉えづらいプラント100の状態変化を他の種類のプロセスデータによって捉えられるようになる。また、ある種類のプロセスデータだけではノイズに起因する変化であるか否かを見分けづらい場合であっても、他の種類のプロセスデータを用いることで適切な判定ができるようになる。そのため、プラント100の状態変化を見逃したり、誤検出してしまったりすることがより少なくなる。
個別判定部14は、短期個別判定部(信号A用)141A、中期個別判定部(信号A用)142A、長期個別判定部(信号A用)143A、短期個別判定部(信号B用)141B、中期個別判定部(信号B用)142B及び長期個別判定部(信号B用)143Bを含む。ここで、「短期」、「中期」及び「長期」は、ユーザによって任意に設定することができる期間であり、変化検出部13における設定と同じ期間であってよい。なお、個別判定部14は、3以上の信号それぞれについて、4以上の期間を基準として検出された変化量を用いる個別判定部を含んでよい。個別判定部14が、複数種類の期間を基準として変化量を検出する複数種類の個別判定部を含むことで、様々なタイムスパンにおけるプラント100の状態変化を判定することができる。
短期個別判定部(信号A用)141A、中期個別判定部(信号A用)142A及び長期個別判定部(信号A用)143Aのうち任意の2つは、本発明の第1個別判定部及び第2個別判定部に相当する。また、短期個別判定部(信号B用)141B、中期個別判定部(信号B用)142B及び長期個別判定部(信号B用)143Bのうち任意の2つは、本発明の第1個別判定部及び第2個別判定部に相当する。第1個別判定部は、第1変化検出部により検出された第1変化量に基づいて、プラント100の運転状態を判定する。第2個別判定部は、第2変化検出部により検出された第2変化量に基づいて、プラント100の運転状態を判定する。
短期個別判定部(信号A用)141Aは、短期変化検出部(信号A用)131Aにより検出された第1変化量に基づいて、プラント100の運転状態を判定する。同様に、中期個別判定部(信号A用)142Aは、中期変化検出部(信号A用)132Aにより検出された第2変化量に基づいて、プラント100の運転状態を判定する。また、長期個別判定部(信号A用)143Aは、長期変化検出部(信号A用)133Aにより検出された第3変化量に基づいて、プラント100の運転状態を判定する。短期個別判定部(信号A用)141A、中期個別判定部(信号A用)142A及び長期個別判定部(信号A用)143Aは、例えば、プラント100の運転状態が正常であるか異常であるかを判定してよい。
短期個別判定部(信号B用)141Bは、短期変化検出部(信号B用)131Bにより検出された第1変化量に基づいて、プラント100の運転状態を判定する。同様に、中期個別判定部(信号B用)142Bは、中期変化検出部(信号B用)132Bにより検出された第2変化量に基づいて、プラント100の運転状態を判定する。また、長期個別判定部(信号B用)143Bは、長期変化検出部(信号B用)133Bにより検出された第3変化量に基づいて、プラント100の運転状態を判定する。短期個別判定部(信号B用)141B、中期個別判定部(信号B用)142B及び長期個別判定部(信号B用)143Bは、例えば、プラント100の運転状態が正常であるか異常であるかを判定してよい。
統合判定部15は、第1個別判定部による判定結果及び第2個別判定部による判定結果を統合して、プラント100の運転状態を判定する。本実施形態に係る監視装置10では、統合判定部15は、短期個別判定部(信号A用)141Aによる判定結果、中期個別判定部(信号A用)142Aによる判定結果、長期個別判定部(信号A用)143Aによる判定結果、短期個別判定部(信号B用)141Bによる判定結果、中期個別判定部(信号B用)142Bによる判定結果及び長期個別判定部(信号B用)143Bによる判定結果を統合して、プラント100の運転状態を判定する。なお、統合判定部15は、3以上の信号それぞれについて、4以上の期間を基準として検出された変化量を用いて判定された判定結果を統合して、プラント100の運転状態を判定してもよい。複数種類の信号によってプラント100の状態変化をより詳細に測定し、複数種類の期間を基準として検出された変化量を用いることで、様々なタイムスパンにおけるプラント100の状態変化を判定することができ、統合判定部15によってそれらの判定結果を統合して、プラント100の運転状態をより適切に判定することができる。
個別判定部14及び統合判定部15を備え、第1基準時を比較基準とした第1変化量と、第2基準時を比較基準とした第2変化量とにそれぞれ特化した個別判定を行い、個別判定の結果を統合することで、プラント100の運転状態についてより安定した判定を行うことができる。
本実施形態に係る監視装置10によれば、比較基準とするプロセスデータを、第1基準時におけるプロセスデータ及び第2基準時におけるプロセスデータとすることで、一方の基準では捉えづらい変化を他方の基準で捉えられるようになる。また、一方の基準だけではノイズに起因する変化であるか否かを見分けづらい場合であっても、他方の基準で適切な判定ができるようになる。例えば、短期変化検出部(信号A用)131Aでは捉えづらい変化を、中期変化検出部(信号A用)132A又は長期変化検出部(信号A用)133Aで捉えられる場合がある。また、短期変化検出部(信号B用)131B及び短期個別判定部(信号B用)141Bだけではノイズに起因する変化であるか否かを見分けづらい場合であっても、中期変化検出部(信号B用)132B及び中期個別判定部(信号B用)142B又は長期変化検出部(信号B用)133B及び長期個別判定部(信号B用)143Bで適切な判定ができる場合がある。そのため、本実施形態に係る監視装置10によれば、プラント100の状態変化を見逃したり、誤検出してしまったりすることがより少なくなる。
入力部10eは、第1期間及び第2期間の入力を受け付ける。入力部10eは、例えば、1時間、12時間、1日、1週間、1ヶ月、6ヶ月及び1年等の複数の選択肢の中から変化検出部13に設定する第1期間及び第2期間の入力を受け付けてもよいし、ユーザから第1期間及び第2期間を表す数値の入力を受け付けてもよい。本実施形態に係る監視装置10の場合、入力部10eは、短期変化検出部(信号A用)131A、中期変化検出部(信号A用)132A、長期変化検出部(信号A用)133A、短期変化検出部(信号B用)131B、中期変化検出部(信号B用)132B及び長期変化検出部(信号B用)133Bで用いる期間の入力を受け付けてよい。また、入力部10eは、異なる期間を比較基準として用いる変化検出部の追加や削除の入力を受け付けてもよい。入力部10eによって、監視対象とするプラント100の特性に応じて比較基準を調整することができ、監視対象とするプラント100の状態変化をより適切に検出することができるようになる。
表示部10fは、プラント100の運転状態を判定した判定結果を表示する。表示部10fは、個別判定部14による個別の判定結果と、統合判定部15による総合的な判定結果(最終判定結果)と両方を表示してもよいし、いずれか一方を表示してもよい。また、表示部10fは、変化検出部13により検出された変化量を表示してもよい。
図2は、本実施形態に係る監視装置10の物理的構成を示す図である。監視装置10は、演算部に相当するCPU(Central Processing Unit)10aと、記憶部に相当するRAM(Random Access Memory)10bと、記憶部に相当するROM(Read only Memory)10cと、通信部10dと、入力部10eと、表示部10fと、を有する。これらの各構成は、バスを介して相互にデータ送受信可能に接続される。なお、本例では監視装置10が一台のコンピュータで構成される場合について説明するが、監視装置10は、複数のコンピュータが組み合わされて実現されてもよい。また、図2で示す構成は一例であり、監視装置10はこれら以外の構成を有してもよいし、これらの構成のうち一部を有さなくてもよい。
CPU10aは、RAM10b又はROM10cに記憶されたプログラムの実行に関する制御やデータの演算、加工を行う制御部である。CPU10aは、プラント100に関するプロセスデータの変化量に基づいて、プラント100の運転状態を判定するプログラム(監視プログラム)を実行する演算部である。CPU10aは、入力部10eや通信部10dから種々のデータを受け取り、データの演算結果を表示部10fに表示したり、RAM10bやROM10cに格納したりする。
RAM10bは、記憶部のうちデータの書き換えが可能なものであり、例えば半導体記憶素子で構成されてよい。RAM10bは、CPU10aが実行するプログラム、プラント100に関するプロセスデータといったデータを記憶してよい。なお、これらは例示であって、RAM10bには、これら以外のデータが記憶されていてもよいし、これらの一部が記憶されていなくてもよい。
ROM10cは、記憶部のうちデータの読み出しが可能なものであり、例えば半導体記憶素子で構成されてよい。ROM10cは、例えば監視プログラムや、書き換えが行われないデータを記憶してよい。
通信部10dは、監視装置10を他の機器に接続するインターフェースである。通信部10dは、インターネット等の通信ネットワークNに接続されてよい。
入力部10eは、ユーザからデータの入力を受け付けるものであり、例えば、キーボード及びタッチパネルを含んでよい。
表示部10fは、CPU10aによる演算結果を視覚的に表示するものであり、例えば、LCD(Liquid Crystal Display)により構成されてよい。表示部10fは、前述の判定結果を表示したり、後に詳細に説明する判定結果レポートを表示したりしてよい。
監視プログラムは、RAM10bやROM10c等のコンピュータによって読み取り可能な記憶媒体に記憶されて提供されてもよいし、通信部10dにより接続される通信ネットワークを介して提供されてもよい。監視装置10では、CPU10aが監視プログラムを実行することにより、図1を用いて説明した取得部11、フィルタ部12、変化検出部13、個別判定部14及び統合判定部15の動作が実現される。なお、これらの物理的な構成は例示であって、必ずしも独立した構成でなくてもよい。例えば、監視装置10は、CPU10aとRAM10bやROM10cが一体化したLSI(Large-Scale Integration)を備えていてもよい。
図3は、本実施形態に係る監視装置10により取得されるプロセスデータの一例を示す図である。同図では、縦軸にプロセスデータの値を示し、横軸に時間(time)を示して、プロセスデータの時間変化を示している。
監視装置10は、現時点から第1期間τ1遡った第1基準時におけるプロセスデータ(第1プロセスデータD1)の確率分布P1と、現時点のプロセスデータ(第2プロセスデータ)の確率分布P2とを推定する。監視装置10は、例えば、以下の数式(1)によってプロセスデータの平均を推定し、以下の数式(2)によってプロセスデータの分散を推定することで、各時点での確率分布を推定してよい。


ここで、x(n)は、時間nにおけるプロセスデータの値であり、バー付きのx(n)は、x(n)の平均である。また、σ2(n)は、時間nにおけるプロセスデータの分散である。また、γは、0以上1以下のメモリ係数である。
第1変化検出部は、現時点のプロセスデータの確率分布及び第1基準時におけるプロセスデータの確率分布から算出される統計量に基づいて、第1変化量を検出してよい。また、第2変化検出部は、現時点のプロセスデータの確率分布及び第2基準時におけるプロセスデータの確率分布から算出される統計量に基づいて、第2変化量を検出してよい。具体的には、変化検出部13は、現時点のプロセスデータの確率分布P2及び第1基準時におけるプロセスデータの確率分布P1算出される平均及び分散に基づいて、以下の数式(3)によって第1変化量dτ1(n)を算出してよい。

変化検出部13は、第1期間τ1のみならず、第2期間τ2について数式(3)によって第2変化量dτ2(n)を算出したり、第3期間τ3について数式(3)によって第3変化量dτ3(n)を算出したりしてよい。このように、プロセスデータそのものではなく、プロセスデータの確率分布から算出される統計量に基づいて変化量を算出することで、ノイズの影響をより低減することができ、プラント100の運転状態についてより安定した判定を行うことができる。
図4は、本実施形態に係る監視装置10により算出される変化量の一例を示す図である。同図では、縦軸に変化量の値を示し、横軸に時間(time)を示して、変化量の時間変化を示している。
個別判定部14は、変化検出部13により検出された変化量の履歴に基づいて、変化量の確率分布を推定してよい。図4では、推定された変化量の確率分布P3を示している。個別判定部14は、確率分布P3に基づいて、閾値を設定し、変化量が閾値以上となる場合に、プラント100の運転状態が異常であると判定してよい。ここで、閾値は、例えば、1%基準で設定されてよい。また、個別判定部14は、例えば対数正規分布を仮定して、変化量の確率分布を推定してよい。
個別判定部14は、第1変化量dτ1(n)及び閾値Thに基づいて、以下の数式(4)によって第1異常度aτ1(n)を算出してよい。

数式(4)によれば、過去の第1異常度aτ1(n-1)が0であって、現時点の第1変化量dτ1(n)が閾値Thより小さい場合、第1異常度aτ1(n)は0となる。一方、過去の第1異常度aτ1(n-1)が正の値であって、現時点の第1変化量dτ1(n)が閾値Thより大きい場合、第1異常度aτ1(n)は(dτ1(n)-Th)だけ増え、累積的に増加していく。個別判定部14は、第1異常度aτ1(n)が0より大きい場合に、第1期間τ1の観点でプラント100の運転状態が異常であると判定してよい。
個別判定部14は、第1期間τ1のみならず、第2期間τ2について数式(4)によって第2異常度aτ2(n)を算出したり、第3期間τ3について数式(4)によって第3異常度aτ3(n)を算出したりしてよい。このように、変化量から閾値を引いた値の累積和によって異常度を算出することで、ノイズの影響による瞬間的な変化量の増加を除外して、プラント100の運転状態についてより安定した判定を行うことができる。
図5は、本実施形態に係る監視装置10による個別判定及び総合判定の概要を示す図である。同図では、信号Aについて第1期間τ1でプラント100の運転状態を判定した判定値(信号A×τ1)を示す第1グラフG1と、信号Bについて第1期間τ1でプラント100の運転状態を判定した判定値(信号B×τ1)を示す第2グラフG2と、判定値(信号A×τ1)をフィルタリングした結果を示す第3グラフG3と、判定値(信号B×τ1)をフィルタリングした結果を示す第4グラフG4と、プラント100の運転状態を総合判定した判定値を示す第5グラフG5と、を示している。
個別判定部14は、信号Aに関する第1異常度aτ1(n)が0より大きい場合に判定値を1として、信号Aに関する第1異常度aτ1(n)が0以下である場合に判定値を0として、第1グラフG1を出力してよい。同様に、個別判定部14は、例えば、信号Bに関する第1異常度aτ1(n)が0より大きい場合に判定値を1として、信号Bに関する第1異常度aτ1(n)が0以下である場合に判定値を0として、第2グラフG2を出力してよい。
ここで、第1グラフG1及び第2グラフG2は、それぞれスパイク状の判定値を含む。これらはノイズの影響によるものと考えられ、除去することで誤報を防止することができる。
個別判定部14は、判定値が所定期間にわたって継続的に1である場合に判定値を1のままとし、判定値が所定期間より短い期間だけ1である場合に判定値を0とすることで、判定値のフィルタリングを行ってよい。第1グラフG1についてフィルタリングを行った結果、第3グラフG3が得られ、第3グラフG3にはスパイク状の判定値が含まれていない。同様に、第2グラフG2についてフィルタリングを行った結果、第4グラフG4が得られ、第4グラフG4にはスパイク状の判定値が含まれていない。
統合判定部15は、第3グラフG3及び第4グラフG4の論理和によって、統合判定値を示す第5グラフG5を出力してよい。なお、統合判定部15は、第3グラフG3及び第4グラフG4の論理積によって、統合判定値を示す第5グラフG5を出力してもよい。
ここでは、信号A及び信号Bについて第1期間τ1に関する個別判定結果をフィルタリングし、統合判定結果を出力する例について説明したが、監視装置10は、複数種類のプロセスデータについて、複数の期間に関する個別判定結果をそれぞれフィルタリングして、統合判定結果を出力してよい。
図6は、本実施形態に係る監視装置10により表示される判定結果レポートの一例を示す図である。判定結果レポートは、統合判定結果R1と、個別判定結果R2とを含む。
本例では、統合判定結果R1は「異常」であり、プラント100の運転状態が異常であることを示している。また、個別判定結果R2は、「スパン01 1時間」、「スパン02 12時間」…「スパン10 8週間」という10の異なる期間について、信号A、信号B…という複数種類のプロセスデータに関する個別判定結果をまとめて表示している。
具体的には、信号Aについて、「スパン01 1時間」についての個別判定結果は「正常」であり、「スパン02 12時間」についての個別判定結果は「異常」であり、「スパン10 8週間」についての個別判定結果は「異常」である。このことから、信号Aは、12時間以上の中~長期の期間で観察した場合に異常であり、1時間程度の短期で観察した場合には正常であることが読み取れる。また、信号Bについて、「スパン01 1時間」についての個別判定結果は「正常」であり、「スパン02 12時間」についての個別判定結果は「正常」であり、「スパン10 8週間」についての個別判定結果は「異常」である。このことから、信号Bは、長期の期間で観察した場合に異常であり、1時間~12時間といった短期~中期で観察した場合には正常であることが読み取れる。
このように、統合判定結果R1と、個別判定結果R2とを一覧表示することで、最終的な判定結果を直ちに把握できるとともに、複数種類のプロセスデータがどのタイムスパンで異常値を示しているかを容易に分析することができ、プラント100の運転状態をより的確に判定できるようになる。
図7は、本実施形態に係る監視装置10により変化スパンの入力を受け付ける場合に表示される画面例を示す図である。本例の画面には、「変化検出器個数入力部」という説明テキストが表示され、検出器個数表示欄B1、スパン入力欄生成ボタンB2、採用ボタンB3、第1スパン表示欄T1、第2スパン表示欄T2及び第10スパン表示欄T10が表示されている。なお、変化検出器は、変化検出部13に含まれる個別の検出器である。
検出器個数表示欄B1には、現在設定されている変化検出器の個数が表示される。本例の場合、現在設定されている変化検出器の個数は「10コ」である。
スパン入力欄生成ボタンB2を押下すると、新しい期間を基準時とする変化検出器が新設される。本例の場合、既に10コの変化検出器が設定されているため、スパン入力欄生成ボタンB2を押下すると、11コ目の変化検出器が新設される。
「変化スパン入力部」の欄には、第1スパン表示欄T1、第2スパン表示欄T2…第10スパン表示欄T10が表示されている。本例において、第1スパン表示欄T1には「スパン01:1時間」と表示され、第2スパン表示欄T2には「スパン02:12時間」と表示され、第10スパン表示欄T10には「スパン10:8週間」と表示されている。
採用ボタンB3を押下すると、「変化スパン入力部」の欄に表示された変化検出器が監視装置10の変化検出部13に設定される。
このように、監視対象とするプラント100の特性に応じて変化検出に用いるタイムスパンの長さと数を調整することができ、監視対象とするプラント100の状態変化をより適切に検出することができるようになる。なお、変化スパンの入力は、複数種類のプロセスデータ毎に受け付けてもよいし、まとめて受け付けて、複数種類のプロセスデータに対して同じタイムスパンの変化検出器を設定してもよい。
図8は、本実施形態に係る監視装置10により実行される監視処理のフローチャートである。監視装置10は、はじめに、変化検出スパンの入力を受け付ける(S10)。変化検出スパンの入力を行う場合(S10:YES)、監視装置10は、変化検出部13に設定する変化検出器の数及びそれぞれの変化検出器で用いる変化スパンの入力を受け付け(S11)、変化検出部13の設定を行う。
その後、監視装置10は、プラント100に関する複数種類のプロセスデータを取得し(S12)、複数種類のプロセスデータをそれぞれフィルタリングし(S13)、複数種類のプロセスデータについて、短期、中期、長期の変化量を検出する(S14)。なお、短期、中期、長期という3つの変化スパンは一例であり、監視装置10は、任意のタイムスパンを用いて変化量を算出してよい。
監視装置10は、複数種類のプロセスデータについて、短期、中期、長期の変化量に基づいて、個別にプラント100の運転状態を判定する(S15)。そして、監視装置10は、個別の判定結果を統合して、プラント100の運転状態を判定する(S16)。
最後に、監視装置10は、個別判定結果及び統合判定結果を含む判定結果レポートを表示する(S17)。監視装置10は、処理S12~S17を継続的に実行してよく、ユーザからの入力に応じて、処理S11を行ってよい。
以上説明した実施形態は、本発明の理解を容易にするためのものであり、本発明を限定して解釈するためのものではない。実施形態が備える各要素並びにその配置、材料、条件、形状及びサイズ等は、例示したものに限定されるわけではなく適宜変更することができる。また、異なる実施形態で示した構成同士を部分的に置換し又は組み合わせることが可能である。
監視装置10の表示部10fは、プラントに関するプロセスデータを現時点と現時点から第1期間遡った第1基準時とで比較して検出された第1変化量と、プロセスデータを現時点と現時点から第2期間遡った第2基準時とで比較して検出された第2変化量とに基づいて、プラント100の運転状態を判定した判定結果を表示する、表示装置でもある。表示装置は、個別判定結果及び統合判定結果の少なくともいずれかを表示してよい。個別判定結果及び統合判定結果の少なくともいずれかを表示することで、プラント100の運転状態を容易に把握することができるようになる。
10…監視装置、10a…CPU、10b…RAM、10c…ROM、10d…通信部、10e…入力部、10f…表示部、11…取得部、12…フィルタ部、12A…フィルタ部(信号A用)、12B…フィルタ部(信号B用)、13…変化検出部、131A…短期変化検出部(信号A用)、132A…中期変化検出部(信号A用)、133A…長期変化検出部(信号A用)、131B…短期変化検出部(信号B用)、132B…中期変化検出部(信号B用)、133B…長期変化検出部(信号B用)、14…個別判定部、141A…短期個別判定部(信号A用)、142A…中期個別判定部(信号A用)、143A…長期個別判定部(信号A用)、141B…短期個別判定部(信号B用)、142B…中期個別判定部(信号B用)、143B…長期個別判定部(信号B用)、15…統合判定部、100…プラント
Claims (9)
- プラントに関するプロセスデータを取得する取得部と、
現時点の前記プロセスデータを、現時点から第1期間遡った第1基準時における前記プロセスデータと比較して、前記プロセスデータの第1変化量を検出する第1変化検出部と、
現時点の前記プロセスデータを、現時点から第2期間遡った第2基準時における前記プロセスデータと比較して、前記プロセスデータの第2変化量を検出する第2変化検出部と、
前記第1変化量及び前記第2変化量に基づいて、前記プラントの運転状態を判定する判定部と、
を備える監視装置。 - 前記判定部は、
前記第1変化量に基づいて、前記プラントの運転状態を判定する第1個別判定部と、
前記第2変化量に基づいて、前記プラントの運転状態を判定する第2個別判定部と、
前記第1個別判定部による判定結果及び前記第2個別判定部による判定結果を統合して、前記プラントの運転状態を判定する統合判定部と、を含む、
請求項1に記載の監視装置。 - 前記取得部は、前記プラントに関する複数種類のプロセスデータを取得し、
前記第1変化検出部及び前記第2変化検出部は、前記複数種類のプロセスデータ毎に構成されている、
請求項1又は2に記載の監視装置。 - 前記第1期間及び前記第2期間の入力を受け付ける入力部をさらに備える、
請求項1から3のいずれか一項に記載の監視装置。 - 前記第1変化検出部は、現時点の前記プロセスデータの確率分布及び前記第1基準時における前記プロセスデータの確率分布から算出される統計量に基づいて、前記第1変化量を検出し、
前記第2変化検出部は、現時点の前記プロセスデータの確率分布及び前記第2基準時における前記プロセスデータの確率分布から算出される統計量に基づいて、前記第2変化量を検出する、
請求項1から4のいずれか一項に記載の監視装置。 - 前記判定部による判定結果を少なくとも表示する表示部をさらに備える、
請求項1から5のいずれか一項に記載の監視装置。 - プラントに関するプロセスデータを現時点と前記現時点から第1期間遡った第1基準時とで比較して検出された第1変化量と、前記プロセスデータを前記現時点と前記現時点から第2期間遡った第2基準時とで比較して検出された第2変化量とに基づいて、前記プラントの運転状態を判定した判定結果を表示する、
表示装置。 - プラントを監視する監視装置に、
前記プラントに関するプロセスデータを取得することと、
現時点の前記プロセスデータを、現時点から第1期間遡った第1基準時における前記プロセスデータと比較して、前記プロセスデータの第1変化量を検出することと、
現時点の前記プロセスデータを、現時点から第2期間遡った第2基準時における前記プロセスデータと比較して、前記プロセスデータの第2変化量を検出することと、
前記第1変化量及び前記第2変化量に基づいて、前記プラントの運転状態を判定することと、
を実行させる監視方法。 - プラントを監視する監視装置に、
前記プラントに関するプロセスデータを取得することと、
現時点の前記プロセスデータを、現時点から第1期間遡った第1基準時における前記プロセスデータと比較して、前記プロセスデータの第1変化量を検出することと、
現時点の前記プロセスデータを、現時点から第2期間遡った第2基準時における前記プロセスデータと比較して、前記プロセスデータの第2変化量を検出することと、
前記第1変化量及び前記第2変化量に基づいて、前記プラントの運転状態を判定することと、
を実行させる監視プログラム。
Priority Applications (1)
| Application Number | Priority Date | Filing Date | Title |
|---|---|---|---|
| JP2021509392A JP7490637B2 (ja) | 2019-03-25 | 2020-03-23 | 監視装置、表示装置、監視方法及び監視プログラム |
Applications Claiming Priority (2)
| Application Number | Priority Date | Filing Date | Title |
|---|---|---|---|
| JP2019056599 | 2019-03-25 | ||
| JP2019-056599 | 2019-03-25 |
Publications (1)
| Publication Number | Publication Date |
|---|---|
| WO2020196405A1 true WO2020196405A1 (ja) | 2020-10-01 |
Family
ID=72609841
Family Applications (1)
| Application Number | Title | Priority Date | Filing Date |
|---|---|---|---|
| PCT/JP2020/012724 Ceased WO2020196405A1 (ja) | 2019-03-25 | 2020-03-23 | 監視装置、表示装置、監視方法及び監視プログラム |
Country Status (3)
| Country | Link |
|---|---|
| JP (1) | JP7490637B2 (ja) |
| TW (1) | TWI794583B (ja) |
| WO (1) | WO2020196405A1 (ja) |
Cited By (1)
| Publication number | Priority date | Publication date | Assignee | Title |
|---|---|---|---|---|
| TWI920161B (zh) | 2021-01-25 | 2026-04-01 | 日商日本製鋼所股份有限公司 | 異常探測系統、成形機系統、異常探測裝置、異常探測方法以及記錄並可讀取電腦程式的記錄媒體 |
Citations (2)
| Publication number | Priority date | Publication date | Assignee | Title |
|---|---|---|---|---|
| JP2000099333A (ja) * | 1998-09-17 | 2000-04-07 | Ishikawajima Harima Heavy Ind Co Ltd | プラント用インタフェースエージェント及びプラントの運転状態監視方法 |
| WO2008087968A1 (ja) * | 2007-01-17 | 2008-07-24 | Nec Corporation | 変化点検出方法および装置 |
Family Cites Families (2)
| Publication number | Priority date | Publication date | Assignee | Title |
|---|---|---|---|---|
| US20080010531A1 (en) * | 2006-06-12 | 2008-01-10 | Mks Instruments, Inc. | Classifying faults associated with a manufacturing process |
| JP5625935B2 (ja) * | 2011-01-18 | 2014-11-19 | オムロン株式会社 | 判定基準値の適否判定方法およびその適正値の特定方法ならびに適正値への変更方法、部品実装基板の検査システム、生産現場におけるシミュレーション方法およびシミュレーションシステム |
-
2020
- 2020-02-07 TW TW109103829A patent/TWI794583B/zh active
- 2020-03-23 WO PCT/JP2020/012724 patent/WO2020196405A1/ja not_active Ceased
- 2020-03-23 JP JP2021509392A patent/JP7490637B2/ja active Active
Patent Citations (2)
| Publication number | Priority date | Publication date | Assignee | Title |
|---|---|---|---|---|
| JP2000099333A (ja) * | 1998-09-17 | 2000-04-07 | Ishikawajima Harima Heavy Ind Co Ltd | プラント用インタフェースエージェント及びプラントの運転状態監視方法 |
| WO2008087968A1 (ja) * | 2007-01-17 | 2008-07-24 | Nec Corporation | 変化点検出方法および装置 |
Cited By (1)
| Publication number | Priority date | Publication date | Assignee | Title |
|---|---|---|---|---|
| TWI920161B (zh) | 2021-01-25 | 2026-04-01 | 日商日本製鋼所股份有限公司 | 異常探測系統、成形機系統、異常探測裝置、異常探測方法以及記錄並可讀取電腦程式的記錄媒體 |
Also Published As
| Publication number | Publication date |
|---|---|
| TW202036191A (zh) | 2020-10-01 |
| JPWO2020196405A1 (ja) | 2020-10-01 |
| TWI794583B (zh) | 2023-03-01 |
| JP7490637B2 (ja) | 2024-05-27 |
Similar Documents
| Publication | Publication Date | Title |
|---|---|---|
| JP4046309B2 (ja) | プラント監視装置 | |
| JP6861564B2 (ja) | 監視制御装置 | |
| Li | Nonparametric adaptive CUSUM chart for detecting arbitrary distributional changes | |
| JP5621967B2 (ja) | 異常データ分析システム | |
| WO2016039805A1 (en) | Apparatus and method for ensembles of kernel regression models | |
| EP2347311A1 (en) | Robust filtering and prediction using switching models for machine condition monitoring | |
| CN104849360A (zh) | 用于监测色谱仪的操作状态的系统 | |
| KR20100042293A (ko) | 화학 플랜트 또는 정제소를 연속해서 온라인 모니터하는 시스템 및 방법 | |
| IL303793A (en) | System and method for monitoring water quality | |
| CN112463646A (zh) | 一种传感器异常检测方法及装置 | |
| JP2011065337A (ja) | トレーサビリティシステムおよび製造工程異常検出方法 | |
| US10613830B2 (en) | Data processing device, data processing method, and storage medium | |
| JP7203085B2 (ja) | 異常監視装置、異常監視方法、プログラム、制御装置およびプラント | |
| JP2009110262A (ja) | フィルタ装置、フィルタ装置のフィルタリング方法およびフィルタリングプログラム | |
| JP7490637B2 (ja) | 監視装置、表示装置、監視方法及び監視プログラム | |
| WO2024247102A1 (ja) | 外れ値検出方法、プログラム、データ処理装置、及びデータ処理システム | |
| CN108804282B (zh) | 显示装置、显示方法和存储介质 | |
| JP6885321B2 (ja) | プロセスの状態診断方法及び状態診断装置 | |
| KR102871121B1 (ko) | 감시장치, 표시장치, 감시방법 및 감시프로그램 | |
| CN116698323B (zh) | 一种基于pca和扩展卡尔曼滤波的桥梁健康监测方法及系统 | |
| CN112288126A (zh) | 一种采样数据异常变化在线监测与诊断方法 | |
| EP3862834B1 (en) | Design support system | |
| JP2023114670A (ja) | 異常検知装置、異常検知システム、異常検知方法およびプログラム | |
| JP3401514B2 (ja) | プラント監視システム | |
| TWI734330B (zh) | 支援裝置、支援方法及記錄媒體 |
Legal Events
| Date | Code | Title | Description |
|---|---|---|---|
| 121 | Ep: the epo has been informed by wipo that ep was designated in this application |
Ref document number: 20779585 Country of ref document: EP Kind code of ref document: A1 |
|
| ENP | Entry into the national phase |
Ref document number: 2021509392 Country of ref document: JP Kind code of ref document: A |
|
| NENP | Non-entry into the national phase |
Ref country code: DE |
|
| 122 | Ep: pct application non-entry in european phase |
Ref document number: 20779585 Country of ref document: EP Kind code of ref document: A1 |