WO2020185918A1 - Method for automated stratigraphy interpretation from borehole images - Google Patents
Method for automated stratigraphy interpretation from borehole images Download PDFInfo
- Publication number
- WO2020185918A1 WO2020185918A1 PCT/US2020/022131 US2020022131W WO2020185918A1 WO 2020185918 A1 WO2020185918 A1 WO 2020185918A1 US 2020022131 W US2020022131 W US 2020022131W WO 2020185918 A1 WO2020185918 A1 WO 2020185918A1
- Authority
- WO
- WIPO (PCT)
- Prior art keywords
- images
- synthetic images
- training set
- borehole
- sedimentary
- Prior art date
- Legal status (The legal status is an assumption and is not a legal conclusion. Google has not performed a legal analysis and makes no representation as to the accuracy of the status listed.)
- Ceased
Links
Classifications
-
- E—FIXED CONSTRUCTIONS
- E21—EARTH OR ROCK DRILLING; MINING
- E21B—EARTH OR ROCK DRILLING; OBTAINING OIL, GAS, WATER, SOLUBLE OR MELTABLE MATERIALS OR A SLURRY OF MINERALS FROM WELLS
- E21B47/00—Survey of boreholes or wells
- E21B47/02—Determining slope or direction
- E21B47/022—Determining slope or direction of the borehole, e.g. using geomagnetism
-
- G—PHYSICS
- G06—COMPUTING OR CALCULATING; COUNTING
- G06F—ELECTRIC DIGITAL DATA PROCESSING
- G06F18/00—Pattern recognition
- G06F18/20—Analysing
- G06F18/28—Determining representative reference patterns, e.g. by averaging or distorting; Generating dictionaries
-
- G—PHYSICS
- G06—COMPUTING OR CALCULATING; COUNTING
- G06V—IMAGE OR VIDEO RECOGNITION OR UNDERSTANDING
- G06V10/00—Arrangements for image or video recognition or understanding
- G06V10/70—Arrangements for image or video recognition or understanding using pattern recognition or machine learning
- G06V10/77—Processing image or video features in feature spaces; using data integration or data reduction, e.g. principal component analysis [PCA] or independent component analysis [ICA] or self-organising maps [SOM]; Blind source separation
- G06V10/772—Determining representative reference patterns, e.g. averaging or distorting patterns; Generating dictionaries
-
- G—PHYSICS
- G06—COMPUTING OR CALCULATING; COUNTING
- G06F—ELECTRIC DIGITAL DATA PROCESSING
- G06F18/00—Pattern recognition
- G06F18/20—Analysing
- G06F18/21—Design or setup of recognition systems or techniques; Extraction of features in feature space; Blind source separation
- G06F18/214—Generating training patterns; Bootstrap methods, e.g. bagging or boosting
-
- G—PHYSICS
- G06—COMPUTING OR CALCULATING; COUNTING
- G06F—ELECTRIC DIGITAL DATA PROCESSING
- G06F18/00—Pattern recognition
- G06F18/20—Analysing
- G06F18/21—Design or setup of recognition systems or techniques; Extraction of features in feature space; Blind source separation
- G06F18/214—Generating training patterns; Bootstrap methods, e.g. bagging or boosting
- G06F18/2148—Generating training patterns; Bootstrap methods, e.g. bagging or boosting characterised by the process organisation or structure, e.g. boosting cascade
-
- G—PHYSICS
- G06—COMPUTING OR CALCULATING; COUNTING
- G06F—ELECTRIC DIGITAL DATA PROCESSING
- G06F18/00—Pattern recognition
- G06F18/20—Analysing
- G06F18/24—Classification techniques
- G06F18/243—Classification techniques relating to the number of classes
- G06F18/2431—Multiple classes
-
- G—PHYSICS
- G06—COMPUTING OR CALCULATING; COUNTING
- G06V—IMAGE OR VIDEO RECOGNITION OR UNDERSTANDING
- G06V10/00—Arrangements for image or video recognition or understanding
- G06V10/70—Arrangements for image or video recognition or understanding using pattern recognition or machine learning
- G06V10/77—Processing image or video features in feature spaces; using data integration or data reduction, e.g. principal component analysis [PCA] or independent component analysis [ICA] or self-organising maps [SOM]; Blind source separation
- G06V10/774—Generating sets of training patterns; Bootstrap methods, e.g. bagging or boosting
-
- G—PHYSICS
- G06—COMPUTING OR CALCULATING; COUNTING
- G06V—IMAGE OR VIDEO RECOGNITION OR UNDERSTANDING
- G06V10/00—Arrangements for image or video recognition or understanding
- G06V10/70—Arrangements for image or video recognition or understanding using pattern recognition or machine learning
- G06V10/82—Arrangements for image or video recognition or understanding using pattern recognition or machine learning using neural networks
-
- G—PHYSICS
- G06—COMPUTING OR CALCULATING; COUNTING
- G06F—ELECTRIC DIGITAL DATA PROCESSING
- G06F18/00—Pattern recognition
- G06F18/20—Analysing
- G06F18/24—Classification techniques
- G06F18/241—Classification techniques relating to the classification model, e.g. parametric or non-parametric approaches
- G06F18/2415—Classification techniques relating to the classification model, e.g. parametric or non-parametric approaches based on parametric or probabilistic models, e.g. based on likelihood ratio or false acceptance rate versus a false rejection rate
-
- G—PHYSICS
- G06—COMPUTING OR CALCULATING; COUNTING
- G06F—ELECTRIC DIGITAL DATA PROCESSING
- G06F18/00—Pattern recognition
- G06F18/20—Analysing
- G06F18/24—Classification techniques
- G06F18/243—Classification techniques relating to the number of classes
- G06F18/24323—Tree-organised classifiers
-
- G—PHYSICS
- G06—COMPUTING OR CALCULATING; COUNTING
- G06V—IMAGE OR VIDEO RECOGNITION OR UNDERSTANDING
- G06V10/00—Arrangements for image or video recognition or understanding
- G06V10/40—Extraction of image or video features
- G06V10/44—Local feature extraction by analysis of parts of the pattern, e.g. by detecting edges, contours, loops, corners, strokes or intersections; Connectivity analysis, e.g. of connected components
- G06V10/443—Local feature extraction by analysis of parts of the pattern, e.g. by detecting edges, contours, loops, corners, strokes or intersections; Connectivity analysis, e.g. of connected components by matching or filtering
- G06V10/449—Biologically inspired filters, e.g. difference of Gaussians [DoG] or Gabor filters
- G06V10/451—Biologically inspired filters, e.g. difference of Gaussians [DoG] or Gabor filters with interaction between the filter responses, e.g. cortical complex cells
- G06V10/454—Integrating the filters into a hierarchical structure, e.g. convolutional neural networks [CNN]
Definitions
- the present disclosure relates to automatic stratigraphy interpretation from borehole images, more specifically, to a system and method for automatic stratigraphy interpretation from borehole images.
- the geological structures of sedimentary origin may include a sedimentary facies having a specific depositional environment, also referred to as a depositional facies.
- the depositional facies may be interpreted qualitatively based on log shape.
- this approach is often non-unique and requires supporting information from core description, regional geology, seismic attributes, and/or borehole images.
- borehole images can provide additional information to better characterize depositional environments, such as the geometry of sedimentary bodies, grain size variation, and paleo- current direction.
- Embodiments of the present disclosure are directed towards a method for automated stratigraphy interpretation from borehole images.
- the method may include constructing, using at least one processor, a training set of synthetic images corresponding to a borehole, wherein the training set includes one or more of synthetic images, real images, and modified images.
- the method may further include automatically classifying, using the at least one processor, the training set into one or more individual sedimentary geometries using one or more machine learning techniques.
- the method may also include automatically classifying, using the at least one processor, the training set into one or more priors for depositional environments.
- constructing a training set may include a forward model to generate the synthetic images and/or an addition of noise to the synthetic images.
- Automatically classifying one or more individual sedimentary geometries may include applying one or more machine learning techniques.
- Automatically classifying into priors for depositional environments may include applying one or more machine learning techniques.
- Automatically classifying into priors may include building one or more tables of sedimentary geometry successions that represent one or more depositional
- An addition of noise may include at least one of adding one or more masking stripes on the one or more synthetic images, adding one stripe on the one or more synthetic images, adding a one-pixel stripe to the one or more synthetic images, adding white noise to the one or more synthetic images, translating patterns on the one or more synthetic images, truncating the one or more synthetic images, or adding geometric noise.
- the method may include utilizing one or more automated individual sedimentary geometry predictions to establish a depositional environment predictor.
- the depositional environment predictor may include a decision tree-based machine-learning, fuzzy-logic based algorithms, or a probabilistic graphical model.
- the method may include identifying a longer than standard borehole image and applying a sliding window as a spatial sampling technique.
- the system may include a memory configured to store one or more borehole images and at least one processor configured to construct a training set of synthetic images corresponding to a borehole, wherein the training set includes one or more of synthetic images, real images, and modified images.
- the at least one processor may be further configured to automatically classify the training set into one or more individual sedimentary geometries using one or more machine learning techniques.
- the at least one processor may be further configured to automatically classify the training set into one or more priors for depositional environments.
- constructing a training set may include a forward model to generate the synthetic images and/or an addition of noise to the synthetic images.
- Automatically classifying one or more individual sedimentary geometries may include applying one or more machine learning techniques.
- Automatically classifying into priors for depositional environments may include applying one or more machine learning techniques.
- Automatically classifying into priors may include building one or more tables of sedimentary geometry successions that represent one or more depositional
- An addition of noise may include at least one of adding one or more masking stripes on the one or more synthetic images, adding one stripe on the one or more synthetic images, adding a one-pixel stripe to the one or more synthetic images, adding white noise to the one or more synthetic images, translating patterns on the one or more synthetic images, truncating the one or more synthetic images, or adding geometric noise.
- the system may include utilizing one or more automated individual sedimentary geometry predictions to establish a depositional environment predictor.
- the depositional environment predictor may include a decision tree-based machine-learning, fuzzy-logic based algorithms, or a probabilistic graphical model.
- the system may include identifying a longer than standard borehole image and applying a sliding window as a spatial sampling technique.
- FIG. 1 is a system in accordance with the automated interpretation process of the present disclosure
- FIG. 2 is a diagram illustrating interpreted causes of steepening-upward and shallowing-upward dip trends in sedimentary strata
- FIG. 3 is a diagram illustrating a determination of one or more paleoflow directions using down hole scan images
- FIG. 4 is a diagram illustrating bedform morphology and vertical sections, horizontal and
- FIG. 5 is a block diagram illustrating how different computer images are arranged according to classification parameters
- FIG. 6 is a diagram depicting examples of various computer models with matching field
- FIG. 7 is a diagram depicting an embodiment of a method of automated interpretation process in accordance with the present disclosure.
- FIG. 8 is a diagram depicting examples of sequences of sedimentary geometries defining
- FIG. 9 is a block diagram depicting an embodiment of a method of automated interpretation process in accordance with the present disclosure.
- FIG. 10 is a diagram depicting an embodiment of an automated interpretation process in
- FIG. 11 is a diagram depicting an embodiment of an automated interpretation process in
- FIG. 12 is a diagram depicting an embodiment of an automated interpretation process in
- FIG. 13 is a diagram depicting an embodiment of an automated interpretation process in
- FIG. 14 is a diagram depicting an embodiment of an automated interpretation process in
- FIG. 15 a diagram depicting an embodiment of an automated interpretation process in
- FIG. 16 is a diagram depicting an embodiment of an automated interpretation process in
- FIG. 17 is a diagram depicting the LeNet-5 architecture.
- first object or step could be termed a second object or step, and, similarly, a second object or step could be termed a first object or step, without departing from the scope of the disclosure.
- the first object or step, and the second object or step are both objects or steps, respectively, but they are not to be considered a same object or step.
- FIG. 1 there is shown a method for automated stratigraphy interpretation from
- automated interpretation process 10 may be implemented in a variety of ways.
- automated interpretation process 10 may be implemented as a server-side process, a client-side process, or a server-side / client-side process.
- automated interpretation process 10 may be implemented as a purely server-side process via automated interpretation process 10s.
- automated interpretation process 10 may be implemented as a purely client-side process via one or more of client-side application lOcl, client-side application 10c2, client-side application 10c3, and client-side application 10c4.
- automated interpretation process 10 may be implemented as a server-side / client-side process via server-side automated interpretation process 10s in combination with one or more of client-side application lOcl, client-side application 10c2, client-side application 10c3, client-side application 10c4, and client-side application 10c5.
- automated interpretation process 10 may be performed by automated interpretation process 10s and at least a portion of the functionality of automated interpretation process 10 may be performed by one or more of client-side application lOcl, 10c2, 10c3, 10c4, and 10c5.
- automated interpretation process 10 may include any combination of automated interpretation process 10s, client-side application lOcl, client-side application 10c2, client-side application 10c3, client-side application 10c4, and client-side application 10c5.
- Automated interpretation process 10s may be a server application and may reside on and may be executed by computing device 12, which may be connected to network 14 (e.g., the Internet or a local area network).
- Examples of computing device 12 may include, but are not limited to: a personal computer, a server computer, a series of server computers, a mini computer, a mainframe computer, or a dedicated network device.
- storage device 16 stored on storage device 16 coupled to computing device 12, may be executed by one or more processors (not shown) and one or more memory architectures (not shown) included within computing device 12.
- Examples of storage device 16 may include but are not limited to: a hard disk drive; a tape drive; an optical drive; a RAID device; an NAS device, a Storage Area
- Network 14 may be connected to one or more secondary networks (e.g., network 18), examples of which may include but are not limited to: a local area network; a wide area network; or an intranet, for example.
- secondary networks e.g., network 18
- storage devices 20, 22, 24, 26, 28 which may be stored on storage devices 20, 22, 24, 26, 28 (respectively) coupled to client electronic devices 30, 32, 34, 36, 38 (respectively), may be executed by one or more processors (not shown) and one or more memory architectures (not shown) incorporated into client electronic devices 30, 32, 34, 36, 38 (respectively).
- Examples of storage devices 20, 22, 24, 26, 28 may include but are not limited to: hard disk drives; tape drives; optical drives; RAID devices; random access memories (RAM); read-only memories (ROM), and all forms of flash memory storage devices.
- client electronic devices 30, 32, 34, 36, 38 may include, but are not limited to, personal computer 30, 36, laptop computer 32, mobile computing device 34, notebook computer 36, a netbook computer (not shown), a server computer (not shown), an Internet of Things (IoT) device (not shown), a gaming console (not shown), a data-enabled television console (not shown), and a dedicated network device (not shown).
- client electronic devices 30, 32, 34, 36, 38 may each execute an operating system.
- automated interpretation process 10 may be accessed through secondary network 18 via link line 50.
- the various client electronic devices may be any suitable client electronic devices.
- client electronic devices 28, 30, 32, 34 may be any suitable client electronic devices.
- WAP 48 may be, for example, an IEEE 802.11a, 802.1 lb, 802.1 lg,
- automated interpretation process 10 may be provided by one or more of client side applications 10cl-10c5.
- client side applications 10cl-10c5 may be included within and/or interactive with client-side applications 10cl-10c5, which may include client side electronic applications, web browsers, or another application.
- client side applications 10cl-10c5 may include client side electronic applications, web browsers, or another application.
- bedform refers to an overall bed
- bed configuration geometry that exists at a given time in response to the flow
- bed configuration is composed of individual topographic elements (i.e., bed forms).
- An ensemble of like bed configurations that can be produced by a given mean flow over a given sediment is denoted as a bed state.
- bed phase may further be used to denote different kinds of bed configurations that are produced over a range of flow and sediment conditions and are closely related in geometry and dynamics.
- bedform is indiscriminately used herein to denote all four aspects of the bed geometry. While sedimentologists have given attention to bedforms mostly because of their role in the development of stratification in sedimentary deposits, bedforms are one of the most useful tools available for interpreting ancient sedimentary environments.
- ripples refers to stronger the grain transport, the sooner the bed forms appear, and the faster they approach equilibrium.
- These bedforms, classified as ripples, show generally triangular cross sections.
- the region around the highest point on the ripple profile is the crest, and the region around the lowest point is the trough.
- the upstream-facing surface of the ripple is the toss surface, the downstream-facing surface is the lee surface.
- the average spacing of ripples is of the order of 10-20 cm, and the average height is a few centimeters.
- dunes refers to where at a flow velocity that’s a middling fraction of a meter a second, ripples are replaced by larger bedforms called dunes. Dunes are broadly similar to ripples in geometry and movement, but they are about an order of magnitude larger.
- cross-stratification is best defined as stratification that is locally inclined at some angle to the overall plane of stratification as a consequence of changes in the geometry of the depositional surface during deposition.
- the best way to interpret those terms is to assume that cross-stratification is associated with the behavior of individual flow-molded geometrical elements on a transport surface within some broader flow.
- Cross-stratification is formed by the erosion and deposition associated with a train of bed forms as the average bed elevation increases by net addition of sediment to some area of the bed. They are arranged as sets of conformable laminae, planar or curving, that are separated from adjacent sets by erosional set boundaries or truncation surfaces.
- the classifications may include bed boundary, sedimentary dip, erosive surface, cross bedding, and/or deformed bed.
- bedform geometry In contrast, bedform geometry
- FIG. 2 illustrates interpreted cause of steepening-upward and shallowing-upward dip trends in sedimentary strata
- FIG. 3 illustrates determination of paleoflow directions using down-hole scan images.
- planar tabular cross stratification 304 may include straight crested transverse bar migration, which may include low gamma ray response, blocky to fining upwards motif, planner cross beds, high to moderate angle dip (i.e., 10-30°), 1-3 meter thick bed sets with common basal scour, and dip direction (i.e., SW).
- Inclined heterolithic stratification (HS) 306 may include pointbar lateral accretion, which may include moderate gamma ray response, heterolithic and fining upwards motif, dip direction rotates counter clockwise upwards as point bar apex migrates downstream, bimodal dip (i.e., west for left bank, east for right bank) and 2-3 meter thick bed sets.
- a borehole image on which one or more dips of sedimentary features may be required as a main input of data.
- an approach to automated dip picking on borehole images is known and is used on processed borehole images to provide necessary images to run the new automated classification.
- a goal of the present disclosure is to include a catalog of 3D bedform geometries and to create, from the 3D models, one or more synthetic borehole images for wells with various diameters, orientations, and inclinations.
- computer images may be used to build a forward model.
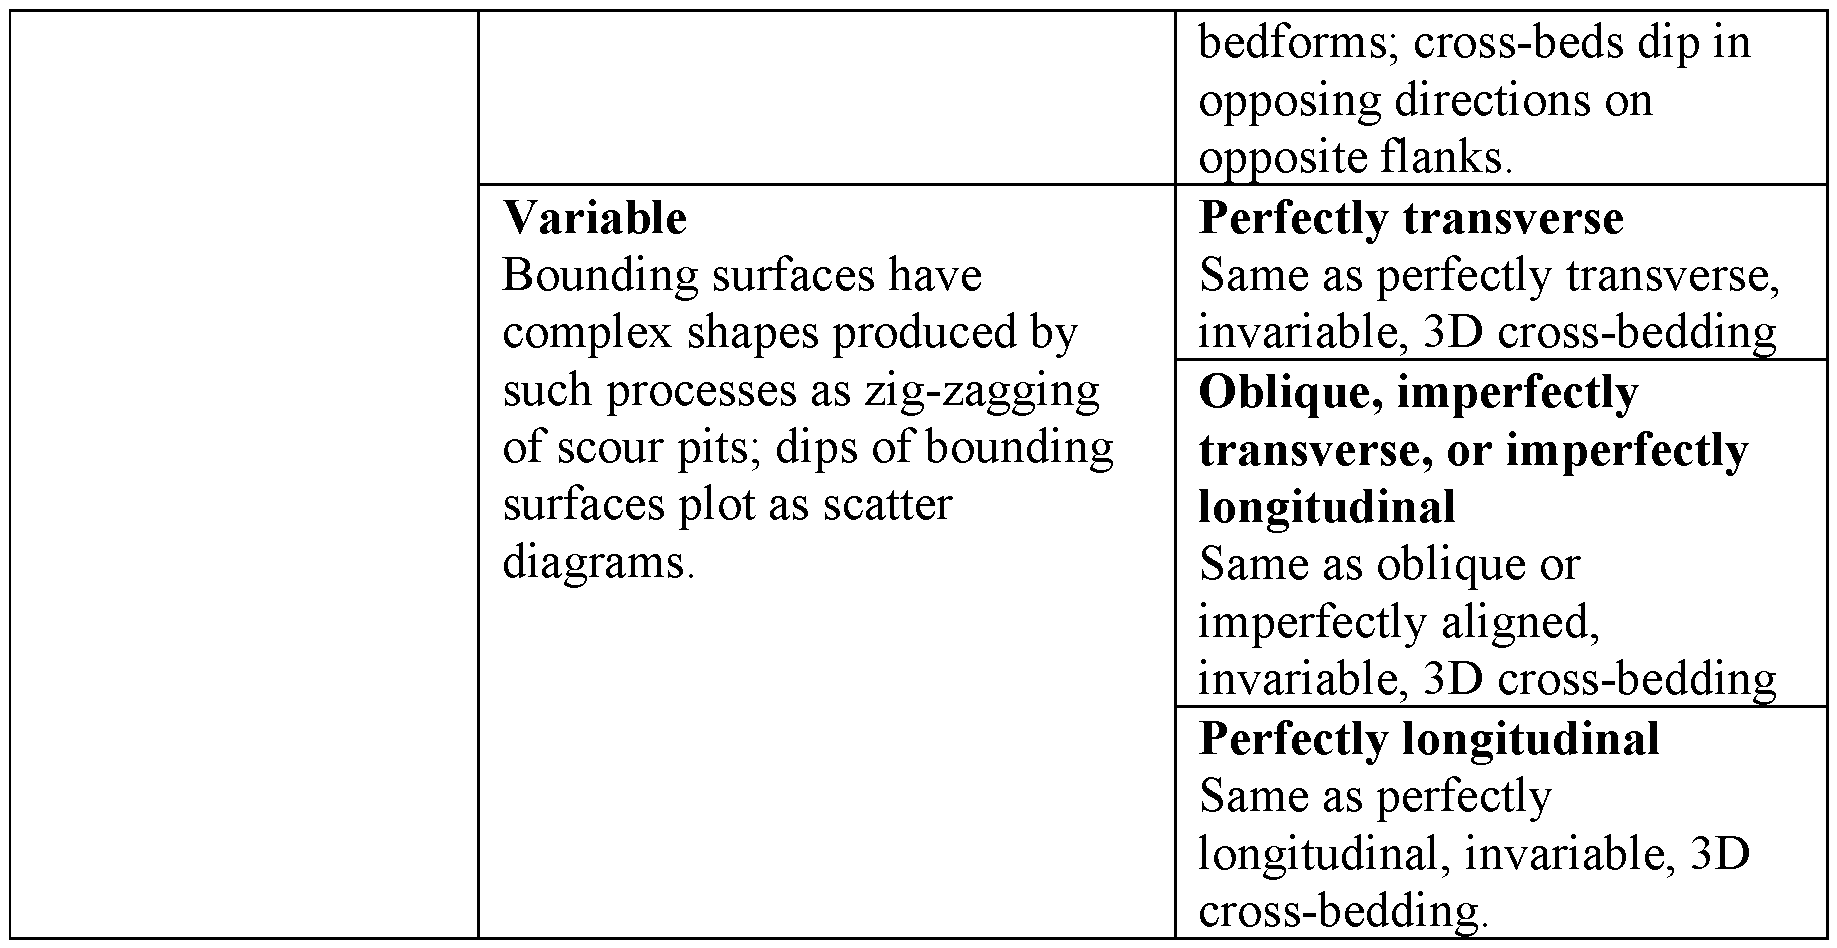
- Table 1 illustrates parameters specified for each experiment including the spacing, steepness, asymmetry, migration direction, migration speed, planform shape, and along-crest migration speed of planform sinuosities of each set of bedforms. Further, table illustrates 2D and 3D dimensionality, variability, and orientation relative to transport parameters used in classifying bedforms.
- a computer model may account for variation of bedform morphology and behavior through time.
- a total of 75 geometric parameters may control different geometries of the bedforms.
- Three separate computer programs were used to produce the images shown in FIG. 4.
- FIG. 4 further illustrates bedform morphology and vertical sections, horizontal and vertical sections and polar plots of cross beds and bounding-surface dip directions.
- each computer program model may model different depositional situations, as illustrated in FIG. 5.
- a first computer program may calculate a topography of a bed surfaces and display the surface in a 3D perspective. The resulting image may include both bed morphology and internal structures.
- a second computer program may produce perspective block diagrams with horizontal sections instead of bed morphology at the top of the block.
- a third computer program may plot vectors that represent a migration of bedforms and scour pits. Specifically, the third computer program may plot a direction of sediment transport represented by bedform migration azimuth. It may also plot inclination of cross-bed and bounding-surface planes.
- CNN has been combined with a gradient-based learning method called backpropagation, it has led to a new way for efficient image classification as demonstrated with LeNet architecture (CNN-based).
- CNN-based LeNet architecture
- FIG. 6 classifying hand-written digits with CNNs is illustrated in FIG. 6 along with examples of the above mentioned compute models with matching field examples.
- CNNs may be preferred, as they tend to be easier to train than fully- connected neural networks, and various improvements to CNNs proposed as well as larger, deeper architectures for applications in various fields.
- sets of images are provided that include one or more images of a specific rock formation with an associated computer model rendering of the specific rock formation.
- Arizona sample 602 shows a structure formed by reversing ripples with modern fluvial deposits from the Colorado River, Grand Canyon National Park, Arizona.
- Utah sample 604 shows structures including a relatively complicated cross-bedding formed by irregular, 3D dunes from eolian deposits in the Temple Cap Sandstone (Jurassic), Zion National Park, Utah.
- Utah sample 606 shows structures formed with along-crest-migration superimposed dunes from Navajo Sandstone (Upper Tirassic and Jurassic), Zion National Park, Utah.
- Utah sample 608 shows a structure produced by sinuous, out-of-phase bedform from eolian deposits in the Navajo
- Utah sample 610 includes a structure formed by a dune with a sinuous lee slope but without scour pots in the trough from Navajo Sandstone (Upper Tirassic and Jurassic), Zio National Park, Utah.
- CNNs play a crucial role in advancing the field.
- CNN based architectures R-CNN, Fast R-CNN, and Faster R-CNN consist of a region proposal algorithm and CNNs working on the proposed regions for object detection.
- the main drawback is the speed of execution, which has been improved with newer versions of the algorithm.
- a YOLO algorithm is a fully convolutional neural networks-based method and provides very fast detection at the expense of small accuracy reduction.
- known methods include classifying three
- CNNs are the preferred choice for seismic image processing, there are not many known applications of CNNs for use with borehole images. This may be because labeled datasets on borehole images are extremely expensive to obtain.
- Automated interpretation process 10 may describe a method, using machine learning algorithms, to automatically interpret bedform geometries and depositional environments from cross-bed data and sedimentary features on borehole images. Automated interpretation process 10 may initially require construction of one or more forward models to generate one or more labeled images for each sedimentary geometry. Once a training set is built, one or more DL algorithms may be used to automatically classify one or more sedimentary structures (i.e., bedform geometries) and provide priors for depositional environments.
- automated interpretation process 10 may include constructing 702, using at least one processor, a training set of synthetic images corresponding to a borehole, wherein the training set includes one or more of synthetic images, real images, and modified images, as illustrated in FIG. 7.
- the training set may include one or more of synthetic images, real images, and modified images similar to real borehole images. Further, this may include using a forward model used to generate the synthetic images, and the addition of‘noise’ to the synthetic images to better mimic real images.
- Automated interpretation process 10 may further include automatically classifying 704, using the at least one processor, the training set into one or more individual sedimentary geometries using one or machine learning techniques. Automatically classifying one or more individual sedimentary geometries may include using one or more DL algorithm.
- automated interpretation process 10 may include automatically classifying 706 into priors for depositional environments. This may include developing specific machine learning techniques to provide a prior for depositional environments. Additionally, automatically classifying into priors for depositional environments may include building or more tables of sedimentary geometry successions that represent each depositional environment. The tables may illustrate one or more different sequences of sedimentary geometries defining specific depositional environments. Further, the creation of the tables may require extensive literature review by domain experts in order to generate a review data set. The one or more tables may then be used to automatically obtain depositional environments from borehole images.
- FIG. 8 illustrates sequences of sedimentary geometries defining depositional environments.
- floodplain 802 illustrates six layers of sedimentary geometries, including: (1) mud layer 804, which may be finely laminated; (2) convolute bedding layer 806, which may be comprised of finely laminated mud; (3) climbing ripple lamination layer 808; (4) finely laminated mud layer 810; (5) convolute bedding layer 812, which may include a sandy layer; and (6) climbing ripple lamination layer 814.
- point bar 816 may include: (1) mud layer 818; (2) small ripple layer 820, which may include cross bedding; (3) climbing ripple lamination layer 822; (4) horizontal lamination layer 824; (5) lapse- scale cross-bedding layer 826; and (6) channel last deposit layer 828.
- levee 830 may include: (1) parallel bedded salty clay layer 832, which may include burrows; (2) climbing ripple lamination layer 834; (3) small ripple cross-bedding layer 836; (4) horizontal bedding layer 838; (5) large-scale cross-bedding layer 840; and (6) salt and sand layer 842, where the salt and sand may be poorly sorted with no internal structure and occasional ripples.
- One or more borehole images may be required to be combined with one or more other types of measurements to more accurately define a depositional environment in an effort to provide priors for depositional environments.
- one or more automated individual sedimentary geometry predictions may be utilized to establish a depositional environment predictor.
- the depositional environment predictor may include the following forms. First, the depositional environment predictor may utilize a decision tree-based machine-learning algorithm that is trained on extensive literature review data set generated by the domain experts. Once trained, decision-tree based algorithms may be very fast in inference and easy to interpret. Second, one or more fuzzy- logic based algorithms may be utilized that can utilize one or more uncertainty measures created during the automated individual sedimentary prediction to construct one or more fuzzy-logic decision rules for depositional environments. Third, a probabilistic graphical model may be built on the domain expert’s knowledge data set and utilized with one or more uncertainty estimations of the automated individual sedimentary prediction.
- automated interpretation process 10 may include allowing one or more borehole image interpretations to be integrated into 3D subsurface modeling. Specifically, a depositional environment from dips interpreted on borehole images may be automatically estimated.
- automated interpretation process 10 may include automatically providing both classification of sedimentary geometries regardless of borehole deviation as well as priors for depositional environment interpretations, and their associated uncertainties using one or more machine learning techniques.
- automated interpretation process 10 may be applied to interpretation of one or more borehole images, which may help a borehole geologist to interpret borehole images faster, to decrease user bias, and/or to add a level of interpretation to known borehole images analysis.
- Automated interpretation process 10 may also be applied to 3D faciess modeling where the outputs from automated interpretation process 10 may be used directly as input to build one or more 3D faciess models. Specifically, it is a crucial step to include borehole image interpretation in 3D subsurface models. Further, automated interpretation process 10 may be used with exploration as the use of the depositional environment logs, combined with stratigraphic sequences from seismic will enhance exploration studies by facilitating identification of new drilling targets.
- FIG. 9 a method and system in accordance with the present disclosure is shown.
- Forward model 902 may be used with training set 904 where individual sedimentary structures 906 may then be recognized. Further, priors for depositional environments 908 may be acquired.
- FIG. 10 illustrates an example of automated interpretation process 10 with intermediate surfaces, computational of an intersection between surfaces and a vertical cylinder and creation of one or more resulting synthetic images with subsurface intersections denoted as 1002 and an azimuth in degrees denoted as 1004.
- FIG. 10 illustrates an example of automated interpretation process 10 with intermediate surfaces, computational of an intersection between surfaces and a vertical cylinder and creation of one or more resulting synthetic images with subsurface intersections denoted as 1002 and an azimuth in degrees denoted as 1004.
- the one or more computer models may include one or more of the following extract all intermediate surfaces, for each computer model, respecting rules of deposition, create a cylinder, representing a well drilled through the structures, compute intersections between the surfaces and the cylinder, and create a synthetic, oriented image representing the intersections between the surfaces and the cylinder/well.
- a sinusoid may represent and intersection between a planar surface and a well.
- the one or more synthetic images may represent results a borehole geologist would obtain after picking features on a real processed borehole image.
- automated interpretation process 10 may be trained using one or more images generated from wells with multiple deviations in attempt to automatically recognize one or more sedimentary geometries from one or more borehole images, regardless of the borehole deviation. Further,
- FIG. 12 illustrates use of one or more different well parameters used to generate one or more synthetic images including one or more of well orientation, well deviation, well location, and well azimuth.
- FIG. 12 includes the following parameters: (1) two different well locations in the 3D model; (2) three different well diameters (i.e., representing diameters of 4”, 8.5” and 12.25”; (3) multiple well deviations (i.e., every 10°, from 0 0 to 90 °); and (4) multiple well orientations (i.e., every 10 °, from 0 0 to 360 °).
- FIG. 13 illustrates examples of synthetic images (i.e. 1302, 1304, 1306, 1308, 1310, 1312 and 1314), generated from vertical wells and their associated 3D models.
- FIG. 14 illustrates examples of synthetic images created from vertical wells in different 3D models (i.e., 1402, 1404, 1406, 1408, 1410, 1412, 1414, 1416, 1418, 1420, 1422, 1424, 1426, 1428, 1430, 1432, 1434, 1436, 1438 and 1440).
- FIG. 15 illustrates examples of synthetic images generated from 1412, with a vertical well and highly deviated wells with different orientations.
- the cylinder in the demi- sphere illustrates the orientation of the well in the model. Further, the intersections between the surfaces and the cylinder/well are also represented.
- FIG. 16 illustrates the addition of one or more noisy images to the training set and, specifically, adding noise to the synthetic images to be closer from real images, including stripes, ‘salt’, and truncations.
- sample 1602 illustrates no noise.
- Sample 1604 illustrates an 8.5” hole with 50%‘white’ noise added.
- Sample 1604 illustrates a 12.25” hole with 60% coverage with stripes like formation micro-imager (FMI) FMI images along with 40% white noise added.
- Sample 1608 illustrates an 8.5” hole with 80% coverage and stripes like FMI images.
- Sample 1610 illustrates an 8.5” hole with one white stripe (i.e., one flap/pad not working).
- Sample 1612 illustrates a 12.25” hole with 50%‘white’ noise added.
- sample 1614 illustrates an 8.5” hole with 40%‘white’ noise added.
- Sample 1616 illustrates a 12.25” hole with 60% coverage and stripes like FMI images. Additionally, sample 1618 illustrates a 12.25” hole with one white stripe (i.e., one flap/pad not working).
- Sample 1620 illustrates an 8.5” hole with 80% coverage, stripes like FMI images, and 40%‘white’ noise added.
- Sample 1622 illustrates a 12.25” hole with a 40%‘white’ noise added.
- sample 1624 illustrates a truncated image.
- noise may be added to the one or more synthetic images.
- Different levels of noise considered may include one or more of: (1) adding one or more masking stripes on the one or more synthetic images, thus reproducing limited coverage of certain types of pad-based imaging tools with, for example, 60% coverage in 12.25” hole diameter, or 80% coverage in 8.5” hole diameter; (2) adding one stripe on the one or more synthetic images, which may be equivalent to one pad or one flap not functioning; (3) adding a one-pixel stripe to one or more of the one or more synthetic images, which may be equivalent to a dead button; (4) adding‘white’ noise to the one or more synthetic images to represent discontinuous interpretation obtained when the discontinuous (i.e., segment) extraction of sedimentary surfaces is used to automatically pick one or more features on the one or more synthetic images, or results when other patterns like breakouts and fractures are present also on the borehole images where different percentages of noise may be added to the one or more synthetic images (i.e., up to 50%); (5) translating patterns on the one or more synthetic images; (6) t
- multiple noise levels may be used.
- FIG. 17 illustrates a LeNet-5 architecture.
- automated interpretation process 10 may include using one or more ResNet classification modules with different settings and combined into an ensemble method where results of multiple models are voted on, and the most voted class may be selected as the prediction providing a confidence score among all votes.
- Automated interpretation process 10 may train the one or more ResNet classification modules on an 2D input image that is 40 to 200 pixels tall and 140 pixels wide. Such a small window of input may enable one or more small features to be captured and becomes crucial in the application of a sliding window.
- a sliding window may be applied as a spatial sampling method where a long borehole image is provided.
- a sliding window may include defining a step of 5 to 10 pixel. At each step, a 50-pixel window of a long borehole image may be cropped around the step point. This cropped image may be fed into the one or more ResNet classification models and a classification prediction may be obtained. Stepping through an entire borehole image, one or more classes of which the borehole image belongs to may be determined.
- a more advanced method of identification and localization may be performed using the YOLO (You-Only-Look-Once) algorithm.
- YOLO You-Only-Look-Once
- an entire borehole image may be fed into the automated interpretation process 10 and the YOLO algorithm may provide one or more coordinates of individual sedimentary geometries by placing boxes around each in addition to the class labels. Since the YOLO algorithm is a fully-convolutional approach (i.e., it does not utilize sliding windows explicitly), it is may be significantly faster than above described method using one or more ResNet classification models.
- each block in the flowchart or block diagrams may represent a module, segment, or portion of code, which comprises one or more executable instructions for implementing the specified logical function(s).
- the functions noted in the block may occur out of the order noted in the figures. For example, two blocks shown in succession may, in fact, be executed substantially concurrently, or the blocks may sometimes be executed in the reverse order, depending upon the functionality involved.
Landscapes
- Engineering & Computer Science (AREA)
- Theoretical Computer Science (AREA)
- Evolutionary Computation (AREA)
- Physics & Mathematics (AREA)
- Artificial Intelligence (AREA)
- Computer Vision & Pattern Recognition (AREA)
- General Physics & Mathematics (AREA)
- Data Mining & Analysis (AREA)
- General Health & Medical Sciences (AREA)
- Software Systems (AREA)
- Medical Informatics (AREA)
- Health & Medical Sciences (AREA)
- Databases & Information Systems (AREA)
- Multimedia (AREA)
- Computing Systems (AREA)
- Life Sciences & Earth Sciences (AREA)
- General Engineering & Computer Science (AREA)
- Evolutionary Biology (AREA)
- Bioinformatics & Cheminformatics (AREA)
- Bioinformatics & Computational Biology (AREA)
- Geology (AREA)
- Mining & Mineral Resources (AREA)
- Probability & Statistics with Applications (AREA)
- Geophysics (AREA)
- Fluid Mechanics (AREA)
- General Life Sciences & Earth Sciences (AREA)
- Geochemistry & Mineralogy (AREA)
- Environmental & Geological Engineering (AREA)
- Image Analysis (AREA)
- Analysing Materials By The Use Of Radiation (AREA)
Abstract
Description


Claims
Priority Applications (4)
| Application Number | Priority Date | Filing Date | Title |
|---|---|---|---|
| GB2113153.7A GB2596443B (en) | 2019-03-11 | 2020-03-11 | Method for automated stratigraphy interpretation from borehole images |
| BR112021018121A BR112021018121A2 (en) | 2019-03-11 | 2020-03-11 | Method for automated stratigraphy interpretation of well images |
| US17/593,011 US11900658B2 (en) | 2019-03-11 | 2020-03-11 | Method for automated stratigraphy interpretation from borehole images |
| NO20211154A NO347792B1 (en) | 2019-03-11 | 2021-09-27 | Method for automated stratigraphy interpretation from borehole images |
Applications Claiming Priority (2)
| Application Number | Priority Date | Filing Date | Title |
|---|---|---|---|
| US201962816466P | 2019-03-11 | 2019-03-11 | |
| US62/816,466 | 2019-03-11 |
Publications (1)
| Publication Number | Publication Date |
|---|---|
| WO2020185918A1 true WO2020185918A1 (en) | 2020-09-17 |
Family
ID=72427714
Family Applications (1)
| Application Number | Title | Priority Date | Filing Date |
|---|---|---|---|
| PCT/US2020/022131 Ceased WO2020185918A1 (en) | 2019-03-11 | 2020-03-11 | Method for automated stratigraphy interpretation from borehole images |
Country Status (5)
| Country | Link |
|---|---|
| US (1) | US11900658B2 (en) |
| BR (1) | BR112021018121A2 (en) |
| GB (1) | GB2596443B (en) |
| NO (1) | NO347792B1 (en) |
| WO (1) | WO2020185918A1 (en) |
Cited By (8)
| Publication number | Priority date | Publication date | Assignee | Title |
|---|---|---|---|---|
| CN112183643A (en) * | 2020-09-29 | 2021-01-05 | 广西大学 | Hard rock tension-shear fracture identification method and device based on acoustic emission |
| CN112860926A (en) * | 2021-01-29 | 2021-05-28 | 北京城建勘测设计研究院有限责任公司 | Graphics superposition generation method applied to geotechnical engineering investigation industry |
| US20220098972A1 (en) * | 2020-09-25 | 2022-03-31 | Halliburton Energy Services, Inc. | Correcting borehole images using machine-learning models |
| EP4244756A4 (en) * | 2020-11-13 | 2024-08-07 | Chevron U.S.A., Inc. | SUBSURFACE CHARACTERIZATION BASED ON MULTIPLE CORRELATION SCENARIOS |
| US12091960B2 (en) | 2019-09-04 | 2024-09-17 | Schlumberger Technology Corporation | Autonomous wireline operations in oil and gas fields |
| US12287447B2 (en) | 2022-07-15 | 2025-04-29 | Chevron U.S.A. Inc. | Synthesis of multiple boundary location scenarios for wells |
| US12372683B2 (en) | 2019-09-04 | 2025-07-29 | Schlumberger Technology Corporation | Autonomous operations in oil and gas fields |
| EP4405721A4 (en) * | 2021-09-20 | 2025-07-30 | Services Petroliers Schlumberger | Method for automated stratigraphic interpretation from borehole logs and cone penetration test data |
Families Citing this family (1)
| Publication number | Priority date | Publication date | Assignee | Title |
|---|---|---|---|---|
| US12142024B2 (en) * | 2021-12-28 | 2024-11-12 | King Fahd University Of Petroleum And Minerals | Automated bioturbation image classification using deep learning |
Citations (5)
| Publication number | Priority date | Publication date | Assignee | Title |
|---|---|---|---|---|
| US20060161406A1 (en) * | 2004-11-12 | 2006-07-20 | Baker Hughes Incorporated | Method and system for predictive stratigraphy images |
| US20090103677A1 (en) * | 2004-05-12 | 2009-04-23 | Rachel Wood | Classification method for sedimentary rocks |
| US20090259446A1 (en) * | 2008-04-10 | 2009-10-15 | Schlumberger Technology Corporation | Method to generate numerical pseudocores using borehole images, digital rock samples, and multi-point statistics |
| US20140177947A1 (en) * | 2012-12-24 | 2014-06-26 | Google Inc. | System and method for generating training cases for image classification |
| US20160019459A1 (en) * | 2014-07-18 | 2016-01-21 | University Of Southern California | Noise-enhanced convolutional neural networks |
Family Cites Families (7)
| Publication number | Priority date | Publication date | Assignee | Title |
|---|---|---|---|---|
| US9939548B2 (en) | 2014-02-24 | 2018-04-10 | Saudi Arabian Oil Company | Systems, methods, and computer medium to produce efficient, consistent, and high-confidence image-based electrofacies analysis in stratigraphic interpretations across multiple wells |
| TWI797699B (en) * | 2015-12-22 | 2023-04-01 | 以色列商應用材料以色列公司 | Method of deep learning - based examination of a semiconductor specimen and system thereof |
| EP3264335A1 (en) * | 2016-06-28 | 2018-01-03 | Services Pétroliers Schlumberger | Automatic dip picking in borehole images |
| US10825167B2 (en) * | 2017-04-28 | 2020-11-03 | Siemens Healthcare Gmbh | Rapid assessment and outcome analysis for medical patients |
| US10990882B2 (en) * | 2017-07-28 | 2021-04-27 | International Business Machines Corporation | Stratigraphic layer identification from seismic and well data with stratigraphic knowledge base |
| CN110945528B (en) * | 2018-02-07 | 2021-04-02 | 应用材料以色列公司 | Method and system for generating a training set useful for examining semiconductor samples |
| EP3894903A1 (en) * | 2018-12-11 | 2021-10-20 | ExxonMobil Upstream Research Company | Automated reservoir modeling using deep generative networks |
-
2020
- 2020-03-11 WO PCT/US2020/022131 patent/WO2020185918A1/en not_active Ceased
- 2020-03-11 BR BR112021018121A patent/BR112021018121A2/en unknown
- 2020-03-11 GB GB2113153.7A patent/GB2596443B/en active Active
- 2020-03-11 US US17/593,011 patent/US11900658B2/en active Active
-
2021
- 2021-09-27 NO NO20211154A patent/NO347792B1/en unknown
Patent Citations (5)
| Publication number | Priority date | Publication date | Assignee | Title |
|---|---|---|---|---|
| US20090103677A1 (en) * | 2004-05-12 | 2009-04-23 | Rachel Wood | Classification method for sedimentary rocks |
| US20060161406A1 (en) * | 2004-11-12 | 2006-07-20 | Baker Hughes Incorporated | Method and system for predictive stratigraphy images |
| US20090259446A1 (en) * | 2008-04-10 | 2009-10-15 | Schlumberger Technology Corporation | Method to generate numerical pseudocores using borehole images, digital rock samples, and multi-point statistics |
| US20140177947A1 (en) * | 2012-12-24 | 2014-06-26 | Google Inc. | System and method for generating training cases for image classification |
| US20160019459A1 (en) * | 2014-07-18 | 2016-01-21 | University Of Southern California | Noise-enhanced convolutional neural networks |
Cited By (12)
| Publication number | Priority date | Publication date | Assignee | Title |
|---|---|---|---|---|
| US12091960B2 (en) | 2019-09-04 | 2024-09-17 | Schlumberger Technology Corporation | Autonomous wireline operations in oil and gas fields |
| US12372683B2 (en) | 2019-09-04 | 2025-07-29 | Schlumberger Technology Corporation | Autonomous operations in oil and gas fields |
| US12601250B2 (en) | 2019-09-04 | 2026-04-14 | Schlumberger Technology Corporation | Monitoring a well barrier |
| US20220098972A1 (en) * | 2020-09-25 | 2022-03-31 | Halliburton Energy Services, Inc. | Correcting borehole images using machine-learning models |
| WO2022066235A1 (en) * | 2020-09-25 | 2022-03-31 | Halliburton Energy Services, Inc. | Correcting borehole images using machine-learning models |
| US11898435B2 (en) | 2020-09-25 | 2024-02-13 | Halliburton Energy Services, Inc. | Correcting borehole images using machine-learning models |
| CN112183643A (en) * | 2020-09-29 | 2021-01-05 | 广西大学 | Hard rock tension-shear fracture identification method and device based on acoustic emission |
| CN112183643B (en) * | 2020-09-29 | 2022-06-21 | 广西大学 | Method and device for identifying tensile shear fracture of hard rock based on acoustic emission |
| EP4244756A4 (en) * | 2020-11-13 | 2024-08-07 | Chevron U.S.A., Inc. | SUBSURFACE CHARACTERIZATION BASED ON MULTIPLE CORRELATION SCENARIOS |
| CN112860926A (en) * | 2021-01-29 | 2021-05-28 | 北京城建勘测设计研究院有限责任公司 | Graphics superposition generation method applied to geotechnical engineering investigation industry |
| EP4405721A4 (en) * | 2021-09-20 | 2025-07-30 | Services Petroliers Schlumberger | Method for automated stratigraphic interpretation from borehole logs and cone penetration test data |
| US12287447B2 (en) | 2022-07-15 | 2025-04-29 | Chevron U.S.A. Inc. | Synthesis of multiple boundary location scenarios for wells |
Also Published As
| Publication number | Publication date |
|---|---|
| GB2596443A (en) | 2021-12-29 |
| BR112021018121A2 (en) | 2021-11-16 |
| GB2596443B (en) | 2023-08-30 |
| US20220164594A1 (en) | 2022-05-26 |
| GB202113153D0 (en) | 2021-10-27 |
| NO20211154A1 (en) | 2021-09-27 |
| US11900658B2 (en) | 2024-02-13 |
| NO347792B1 (en) | 2024-03-25 |
Similar Documents
| Publication | Publication Date | Title |
|---|---|---|
| US11900658B2 (en) | Method for automated stratigraphy interpretation from borehole images | |
| Rafik et al. | Prediction of permeability and porosity from well log data using the nonparametric regression with multivariate analysis and neural network, Hassi R’Mel Field, Algeria | |
| EP3682269B1 (en) | Seismic image data interpretation system | |
| Ghinassi et al. | Plan‐form evolution of ancient meandering rivers reconstructed from longitudinal outcrop sections | |
| US9081918B2 (en) | Methods and systems regarding models of underground formations | |
| Di et al. | Accelerating seismic fault and stratigraphy interpretation with deep CNNs: A case study of the Taranaki Basin, New Zealand | |
| US20240127039A1 (en) | Geologic learning framework | |
| Caers et al. | Stochastic integration of seismic data and geologic scenarios: A West Africa submarine channel saga | |
| US12405974B2 (en) | Geologic search framework | |
| Moradi et al. | Inversion of well logs into rock types, lithofacies and environmental facies, using pattern recognition, a case study of carbonate Sarvak Formation | |
| Bhattacharya | Unsupervised time series clustering, class-based ensemble machine learning, and petrophysical modeling for predicting shear sonic wave slowness in heterogeneous rocks | |
| Jain et al. | Class-based machine learning for next-generation wellbore data processing and interpretation | |
| Liu et al. | Machine learning assisted recovery of subsurface energy: A review | |
| Michie et al. | Assessing the accuracy of fault interpretation using machine-learning techniques when risking faults for CO2 storage site assessment | |
| WO2024229082A2 (en) | Seismic survey framework | |
| RU2619803C2 (en) | Determining fluid motion path | |
| US20240368980A1 (en) | Characterization of Reservoir Features and Fractures Using Artificial Intelligence | |
| Zhang et al. | Advanced machine learning framework for enhanced lithology classification and identification | |
| US20240418696A1 (en) | Source determination of produced water from oilfields with artificial intelligence techniques | |
| You et al. | Automatic facies classification from acoustic image logs using deep neural networks | |
| Ebrahimi et al. | Young’s modulus estimation using machine learning methods and daily drilling reports | |
| US20240393488A1 (en) | Seismic feature detection using denoising diffusion probabilistic model | |
| Zhang et al. | Enhancing lithology classification through a deep learning framework | |
| Emelyanova et al. | Unsupervised identification of electrofacies employing machine learning | |
| US20250341647A1 (en) | Subsurface stratigraphic framework |
Legal Events
| Date | Code | Title | Description |
|---|---|---|---|
| 121 | Ep: the epo has been informed by wipo that ep was designated in this application |
Ref document number: 20769082 Country of ref document: EP Kind code of ref document: A1 |
|
| NENP | Non-entry into the national phase |
Ref country code: DE |
|
| ENP | Entry into the national phase |
Ref document number: 202113153 Country of ref document: GB Kind code of ref document: A Free format text: PCT FILING DATE = 20200311 |
|
| WWE | Wipo information: entry into national phase |
Ref document number: 2113153.7 Country of ref document: GB |
|
| REG | Reference to national code |
Ref country code: BR Ref legal event code: B01A Ref document number: 112021018121 Country of ref document: BR |
|
| ENP | Entry into the national phase |
Ref document number: 112021018121 Country of ref document: BR Kind code of ref document: A2 Effective date: 20210913 |
|
| 122 | Ep: pct application non-entry in european phase |
Ref document number: 20769082 Country of ref document: EP Kind code of ref document: A1 |
|
| WWG | Wipo information: grant in national office |
Ref document number: 2113153.7 Country of ref document: GB |