WO2020170102A1 - Feature generation based on eigenfunctions of the schrödinger operator - Google Patents
Feature generation based on eigenfunctions of the schrödinger operator Download PDFInfo
- Publication number
- WO2020170102A1 WO2020170102A1 PCT/IB2020/051275 IB2020051275W WO2020170102A1 WO 2020170102 A1 WO2020170102 A1 WO 2020170102A1 IB 2020051275 W IB2020051275 W IB 2020051275W WO 2020170102 A1 WO2020170102 A1 WO 2020170102A1
- Authority
- WO
- WIPO (PCT)
- Prior art keywords
- input data
- feature
- signal
- operator
- schrodinger
- Prior art date
- Legal status (The legal status is an assumption and is not a legal conclusion. Google has not performed a legal analysis and makes no representation as to the accuracy of the status listed.)
- Ceased
Links
Classifications
-
- G—PHYSICS
- G16—INFORMATION AND COMMUNICATION TECHNOLOGY [ICT] SPECIALLY ADAPTED FOR SPECIFIC APPLICATION FIELDS
- G16H—HEALTHCARE INFORMATICS, i.e. INFORMATION AND COMMUNICATION TECHNOLOGY [ICT] SPECIALLY ADAPTED FOR THE HANDLING OR PROCESSING OF MEDICAL OR HEALTHCARE DATA
- G16H50/00—ICT specially adapted for medical diagnosis, medical simulation or medical data mining; ICT specially adapted for detecting, monitoring or modelling epidemics or pandemics
- G16H50/20—ICT specially adapted for medical diagnosis, medical simulation or medical data mining; ICT specially adapted for detecting, monitoring or modelling epidemics or pandemics for computer-aided diagnosis, e.g. based on medical expert systems
-
- A—HUMAN NECESSITIES
- A61—MEDICAL OR VETERINARY SCIENCE; HYGIENE
- A61B—DIAGNOSIS; SURGERY; IDENTIFICATION
- A61B5/00—Measuring for diagnostic purposes; Identification of persons
- A61B5/72—Signal processing specially adapted for physiological signals or for diagnostic purposes
- A61B5/7271—Specific aspects of physiological measurement analysis
- A61B5/7285—Specific aspects of physiological measurement analysis for synchronizing or triggering a physiological measurement or image acquisition with a physiological event or waveform, e.g. an ECG signal
-
- A—HUMAN NECESSITIES
- A61—MEDICAL OR VETERINARY SCIENCE; HYGIENE
- A61B—DIAGNOSIS; SURGERY; IDENTIFICATION
- A61B5/00—Measuring for diagnostic purposes; Identification of persons
- A61B5/24—Detecting, measuring or recording bioelectric or biomagnetic signals of the body or parts thereof
- A61B5/242—Detecting biomagnetic fields, e.g. magnetic fields produced by bioelectric currents
- A61B5/245—Detecting biomagnetic fields, e.g. magnetic fields produced by bioelectric currents specially adapted for magnetoencephalographic [MEG] signals
-
- A—HUMAN NECESSITIES
- A61—MEDICAL OR VETERINARY SCIENCE; HYGIENE
- A61B—DIAGNOSIS; SURGERY; IDENTIFICATION
- A61B5/00—Measuring for diagnostic purposes; Identification of persons
- A61B5/72—Signal processing specially adapted for physiological signals or for diagnostic purposes
- A61B5/7235—Details of waveform analysis
- A61B5/7253—Details of waveform analysis characterised by using transforms
- A61B5/726—Details of waveform analysis characterised by using transforms using Wavelet transforms
-
- A—HUMAN NECESSITIES
- A61—MEDICAL OR VETERINARY SCIENCE; HYGIENE
- A61B—DIAGNOSIS; SURGERY; IDENTIFICATION
- A61B5/00—Measuring for diagnostic purposes; Identification of persons
- A61B5/72—Signal processing specially adapted for physiological signals or for diagnostic purposes
- A61B5/7271—Specific aspects of physiological measurement analysis
- A61B5/7278—Artificial waveform generation or derivation, e.g. synthesizing signals from measured signals
-
- G—PHYSICS
- G16—INFORMATION AND COMMUNICATION TECHNOLOGY [ICT] SPECIALLY ADAPTED FOR SPECIFIC APPLICATION FIELDS
- G16H—HEALTHCARE INFORMATICS, i.e. INFORMATION AND COMMUNICATION TECHNOLOGY [ICT] SPECIALLY ADAPTED FOR THE HANDLING OR PROCESSING OF MEDICAL OR HEALTHCARE DATA
- G16H50/00—ICT specially adapted for medical diagnosis, medical simulation or medical data mining; ICT specially adapted for detecting, monitoring or modelling epidemics or pandemics
- G16H50/70—ICT specially adapted for medical diagnosis, medical simulation or medical data mining; ICT specially adapted for detecting, monitoring or modelling epidemics or pandemics for mining of medical data, e.g. analysing previous cases of other patients
Definitions
- Embodiments of the subject matter disclosed herein generally relate to generating a feature that characterizes input data, and more specifically, to extracting discriminative properties of signals that make up the input data and to use these properties to classify the input data.
- MEG Magnetoencephalography
- the MEG is a functional neuroimaging modality that measures the magnetic activity of the brain. It uses an array of highly sensitive sensors or magnetometers, called superconducting quantum interference devices (SQUIDs).
- SQUIDs superconducting quantum interference devices
- the MEG signal is less distorted by the intervening tissues between the neural source and the SQUIDs comparing to electroencephalogram (EEG) signal.
- EEG electroencephalogram
- the MEG signals are very useful for the detection and the treatment of various diseases in the brain as the MEG signals help in localizing the region of the brain which produces the abnormal electrical activities which causes the neurological disorder.
- the method employs dynamic time warping.
- the previously cited works reported a maximum sensitivity and specificity of 92.4% and 95.8%, respectively.
- Most of these methods study the MEG signal in its time domain, and some of them do not take advantage of recent advances in machine learning classifiers due to the complexity of the MEG signal.
- the method includes receiving the input data; projecting the input data with a set of square functions of the Schrodinger
- a computing device for generating a feature associated with input data.
- the computing device includes an interface for receiving the input data; and a processor connected to the interface.
- the processor is configured to project the input data with a set of square functions of the Schrodinger operator; select the feature to be a number of the negative eigenvalues l nh of the Schrodinger operator; and classify the input data based on the feature.
- non-transitory computer readable medium including computer executable instructions, wherein the instructions, when executed by a processor, implement instructions for generating a feature as in the method discussed above.
- Figure 1 is a schematic illustration of a method that applies the Schrodinger operator for reconstructing a signal
- Figure 2 is a flowchart of a method for generating a feature associated with a signal, by using the Schrodinger operator;
- Figure 3 schematically illustrates as the input data is analyzed using the Schrodinger operator for generating a feature and then classifying the input data based on the feature;
- Figure 4 illustrates MEG signals that are noisy and have multiple peaks
- Figure 5 illustrates an algorithm that uses the Schrodinger operator for reconstructing a signal
- Figure 6 illustrates actual results obtained with the novel method discussed herein when applied to a number of patients
- Figure 7 illustrates the results obtained with the novel method versus the existing methods
- Figure 8 illustrates the spectrum of the Schrodinger operator for positive and negative eigenvalues
- Figure 9 is a flowchart of a method for generating a feature based on a signal
- Figure 10 is a schematic diagram of a computing device that implements the novel methods discussed herein.
- MEG signals For simplicity, the following embodiments are discussed with regard to MEG signals. However, the methods and systems discussed herein are equally applicable to any signal that exhibits peaks. For example, the methods discussed herein can be applied to water peak estimation, water suppression signal in magnetic resonance spectroscopy (MRS) signals, MRS signal denoising, pulse-shaped signal
- MRS magnetic resonance spectroscopy
- novel methods can be integrated in any processing unit to process biomedical signals such as MRS signals,
- EEG electroencephalogram
- the signals may be spectrum data, biomedical signals or any other type of signal.
- This new characterization generates new features that can be used for the classification of the signals.
- the proposed feature generation technique is based on the semi-classical analysis (SCSA) method, which includes the projection of the input signal into a set of functions given by the squared eigenfunctions of the Schrodinger operator associated to the negative eigenvalues, and whose potential is given by the input signal.
- SCSA semi-classical analysis
- the computed eigenvalues, eigenfunctions and their different combinations introduce new types of features, which can be used all together or in different combination forms to provide a suitable and accurate discrimination of the data signals.
- input data 1 10 is collected in the time domain.
- the input data 1 10 includes at least one noisy signal 1 12.
- the input data is used with the Schrodinger operator 1 14 to generate plural
- a signal 120 is constructed based on the selected eigenfunctions and the corresponding eigenvalues.
- the signal 120 has the noise removed and its peak 122 can be easily identified. Having identified the peak of the signal, the classification of the signal can now be performed.
- FIG 2 is a flowchart of a method for generating a feature that characterizes a set of signals (called herein the input data) and uses the generated feature to classify the input data.
- actual MEG input data 300 (see Figure 3) was received in step 200.
- the MEG input data has been collected from nine healthy subjects (see data 302) and nine epileptic subjects (see data 304).
- a total of 18 MEG data segments, each of 15 minutes duration and 26 channels was recorded with a sampling frequency of 1 kHz.
- the data was then filtered by Spatiotemporal signal space separation method and off-line band-pass filtered for 1 - 50 Hz.
- the input data was analyzed by neurologists, which marked the MEG spike locations. The total number of spikes in this input data was found by the neurologists to be about 166.
- a signal 303 from the input data 302 i.e., an MEG signal from a healthy subject
- a signal 305 from the input data 304 i.e., an MEG signal from an epileptic subject
- the signals are illustrated in this figure as a normalized intensity versus a recording time.
- the insert of Figure 4 shows approximately a second worth of the two signals 303 and 305. It is noted that signal 305 exhibits plural spikes 307.
- the input signal 300 is split into frames, for example, using sliding frames.
- a sliding frame 306 includes 100 sample points and the sliding frame slides with a step of 2 samples, i.e., the frame 306 is moved 2 samples and another 100 samples points are considered for a second sliding frame, and so on.
- the inset of Figure 4 corresponds to a single sliding frame. Other numbers may be used for the size of the sliding frame and for the step of moving the frame.
- the signals from each frame 306 are then concatenated in step 204 to build a classification dataset 310.
- the MEG signals include 26 channels, i.e., 26 different sensors have been used to collect each MEG signal.
- the number of sensors may be fewer or more. Regardless of the number of sensors, the signals in each channel are concatenated for each given frame, to generate a single signal.
- Two different classes are defined in this embodiment, the negative samples 312 and the positive samples 314.
- the negative samples 312 include the frames from the healthy subjects 302 and the positive samples 314 include the frames from the epileptic subjects 304.
- Each class includes the same number of frames.
- step 206 one or more features is generated for these signals.
- the semi-classical signal analysis (SCSA) 320 is applied.
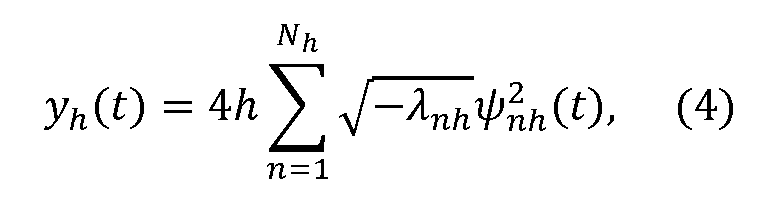
- SCSA uses signal-dependent functions given by the squared eigenfunctions of the Schrodinger operator to decompose the signal (see, for example, [4] and [5]).
- V is the potential
- h is a constant
- t is the time
- d indicates a derivative.
- V is selected to be the positive function y(t) representing the signal, which means that equation (1 ) becomes:
- ⁇ (t) is the eigenfunction of the Schrodinger operator
- l is the eigenvalue of the Schrodinger operator
- Equation (4) provides an exact reconstruction of the original signal y(t) when h converges to zero. When the value of h decreases, the number of eigenvalues l nh increases and the reconstruction improves.
- FIG. 5 schematically illustrates the SCSA reconstruction algorithm.
- the SCSA analysis is used in step 206 to generate a feature associated with the signals 302 and 304.
- the SCSA analysis has been used for reconstruction and de-noising of some biomedical signals such as the Magnetic Resonance Spectroscopy (MRS) spectra and the Arterial Blood Pressure (ABP) [6], [7] Due to the localized and shape-dependent structure of the squared
- MRS Magnetic Resonance Spectroscopy
- ABS Arterial Blood Pressure
- the feature 330 is related to the number of negative eigenvalues that are used to reconstruct the signal for each frame 306.
- the parameter is introduced as being the lower feature size and it is
- N hi is the number of negative eigenvalues of the i th frame for a given value h
- M is number of frames. This means that for each frame i, a corresponding number N hi of negative eigenvalues l nh is selected in step 206 to reconstruct the signal for that frame, and then, based on equation (5), the minimum number of negative eigenvalues is selected for all the frames. Thus, for each frame of the M frames used in these calculations, only negative eigenvalues are used for reconstructing the signals, and the negative eigenvalues is the generated feature 330.
- One way to select the number N hi of negative eigenvalues l nh that is used to reconstruct the signal for each frame, is to define a set threshold value.
- the signal with a given number of negative eigenvalues l nh reconstructs the signal with a given number of negative eigenvalues l nh and calculate a different between the original signal and the reconstructed signal at the given instant. If the difference is smaller than the set threshold value, the given number of negative eigenvalues corresponds to N hi . If not, increase the given number of negative eigenvalues and evaluate again the difference between the original signal and the reconstructed signal. Repeat this process until the difference is smaller than the set threshold value and that is the value of the given number of negative eigenvalues. This is only one way to determine the N hi for each frame. Other criteria may be used for selecting the negative eigenvalues l nh that reproduce the original signal for each frame.
- the feature 330 is fed in step 208 to a classifier 340 for classifying the reconstructed signals.
- the classifier 340 may be, for example, a Support Vector Machine (SVM) predictive model.
- SVM Support Vector Machine
- the SVM model may be developed in 5-fold cross- validation (CV) process with the following subjects: 1734 spiky frames and 1734 healthy frames from different MEG test sessions of the eight healthy and eight epileptic patients.
- the performance of the classifier 340 has been measured using the average accuracy, the sensitivity, the specificity and other metrics defined as follows:
- TP n , FP n , TN n , and FN n are the True Positive, False Positive, True Negative, and False Negative values, respectively, for the n th fold. Note that these values are calculated by comparing the results of the classifier 340 made in step 208, and the actual peaks determined by the expert neurologists based on the input data 300.
- Table 1 shows that with the same average number of negative eigenvalues lower values of h improves the classification performance.
- a method for generating a feature having a small size is now discussed with regard to Figure 9.
- The includes a step 900 of receiving the input data, a step 902 of projecting the input data with a set of square functions of the Schrodinger
- the method may also include a step of splitting the input data into frames, and/or concatenating plural signals from a frame to form a single signal, and/or using the single signal as a potential for the Schrodinger operator, and/or reconstructing the single signal using the set of square functions of the
- the step of classifying includes classifying the input data based on the peak.
- the methods discussed herein advantageously present a new feature generation and dimensionality reduction algorithm. While the algorithm has been presented as a specific application for epileptic spikes detection in MEG signals, the same algorithm may be used for any signal that requires spike identification.
- the algorithm projects an input signal into the discrete spectrum of the Schrodinger operator and then selects a number of eigenvalues to be used for regenerating the signal from the eigenfunctions of the Schrodinger operator. As illustrated in Figures 6 and 7, the novel algorithm obtains the highest sensitivity up to 92.52% with a specificity of 89.10% for a given dataset.
- Computing device 1000 suitable for performing the activities described in the embodiments discussed above may include a server 1001.
- a server 1001 may include a central processor (CPU) 1002 coupled to a random access memory (RAM) 1004 and to a read-only memory (ROM) 1006.
- ROM 1006 may also be other types of storage media to store programs, such as programmable ROM (PROM), erasable PROM (EPROM), etc.
- Processor 1002 may communicate with other internal and external components through input/output (I/O) circuitry 1008 and bussing 1010 to provide control signals and the like.
- I/O input/output
- Processor 1002 carries out a variety of functions as are known in the art, as dictated by software and/or firmware instructions.
- Server 1001 may also include one or more data storage devices, including hard drives 1012, CD-ROM drives 1014 and other hardware capable of reading and/or storing information, such as DVD, etc.
- software for carrying out the above-discussed steps may be stored and distributed on a CD- ROM or DVD 1016, a USB storage device 1018 or other form of media capable of portably storing information. These storage media may be inserted into, and read by, devices such as CD-ROM drive 1014, disk drive 1012, etc.
- Server 1001 may be coupled to a display 1020, which may be any type of known display or presentation screen, such as LCD, plasma display, cathode ray tube (CRT), etc.
- a user input interface 1022 is provided, including one or more user interface mechanisms such as a mouse, keyboard, microphone, touchpad, touch screen, voice-recognition system, etc.
- Server 1001 may be coupled to other devices, such as medical instruments, detectors, sensors, etc.
- the server may be part of a larger network configuration as in a global area network (GAN) such as the Internet 1028, which allows ultimate connection to various landline and/or mobile computing devices.
- GAN global area network
- the disclosed embodiments provide a method and system that is capable to detect and classify peaks associated with one or more signals.
- the embodiments are intended to cover alternatives, modifications and equivalents, which are included in the spirit and scope of the invention as defined by the appended claims. Further, in the detailed description of the embodiments, numerous specific details are set forth in order to provide a comprehensive understanding of the claimed invention. However, one skilled in the art would understand that various embodiments may be practiced without such specific details.
Landscapes
- Health & Medical Sciences (AREA)
- Life Sciences & Earth Sciences (AREA)
- Engineering & Computer Science (AREA)
- Public Health (AREA)
- Medical Informatics (AREA)
- Biomedical Technology (AREA)
- General Health & Medical Sciences (AREA)
- Pathology (AREA)
- Heart & Thoracic Surgery (AREA)
- Surgery (AREA)
- Physics & Mathematics (AREA)
- Veterinary Medicine (AREA)
- Biophysics (AREA)
- Animal Behavior & Ethology (AREA)
- Molecular Biology (AREA)
- Computer Vision & Pattern Recognition (AREA)
- Physiology (AREA)
- Psychiatry (AREA)
- Artificial Intelligence (AREA)
- Signal Processing (AREA)
- Data Mining & Analysis (AREA)
- Databases & Information Systems (AREA)
- Epidemiology (AREA)
- Primary Health Care (AREA)
- Measurement And Recording Of Electrical Phenomena And Electrical Characteristics Of The Living Body (AREA)
Abstract
Description




Claims


Priority Applications (1)
| Application Number | Priority Date | Filing Date | Title |
|---|---|---|---|
| US17/430,111 US20220133242A1 (en) | 2019-02-19 | 2020-02-14 | Feature generation based on eigenfunctions of the schrödinger operator |
Applications Claiming Priority (4)
| Application Number | Priority Date | Filing Date | Title |
|---|---|---|---|
| US201962807515P | 2019-02-19 | 2019-02-19 | |
| US62/807,515 | 2019-02-19 | ||
| US201962867370P | 2019-06-27 | 2019-06-27 | |
| US62/867,370 | 2019-06-27 |
Publications (1)
| Publication Number | Publication Date |
|---|---|
| WO2020170102A1 true WO2020170102A1 (en) | 2020-08-27 |
Family
ID=70189995
Family Applications (1)
| Application Number | Title | Priority Date | Filing Date |
|---|---|---|---|
| PCT/IB2020/051275 Ceased WO2020170102A1 (en) | 2019-02-19 | 2020-02-14 | Feature generation based on eigenfunctions of the schrödinger operator |
Country Status (2)
| Country | Link |
|---|---|
| US (1) | US20220133242A1 (en) |
| WO (1) | WO2020170102A1 (en) |
-
2020
- 2020-02-14 US US17/430,111 patent/US20220133242A1/en not_active Abandoned
- 2020-02-14 WO PCT/IB2020/051275 patent/WO2020170102A1/en not_active Ceased
Non-Patent Citations (15)
| Title |
|---|
| A. OSSADTCHI ET AL: "Automated interictal spike detection and source localization in magnetoencephalography using independent components analysis and spatio-temporal clustering", CLINICAL NEUROPHYSIOLOGY, vol. 115, no. 3, 19 February 2004 (2004-02-19), IE, pages 508 - 522, XP055694011, ISSN: 1388-2457, DOI: 10.1016/j.clinph.2003.10.036 * |
| A. OSSADTCHIS. BAILLETJ. C. MOSHERD. THYERLEIW. SUTHERLINGR. M. LEAHY: "Automated interictal spike detection and source localization in magnetoencephalography using independent components analysis and spatiotemporal clustering", CLINICAL NEUROPHYSIOLOGY, vol. 115, no. 3, 2004, pages 508 - 522 |
| B. HELFFERT.-M. LALEG-KIRATI: "On semi-classical questions related to signal analysis", ASYMPTOTIC ANALYSIS |
| CHAHID ABDERRAZAK ET AL: "Feature Generation and Dimensionality Reduction using the Discrete Spectrum of the Schrödinger Operator for Epileptic Spikes Detection", 2019 41ST ANNUAL INTERNATIONAL CONFERENCE OF THE IEEE ENGINEERING IN MEDICINE AND BIOLOGY SOCIETY (EMBC), IEEE, 23 July 2019 (2019-07-23), pages 2373 - 2376, XP033624619, DOI: 10.1109/EMBC.2019.8856702 * |
| KHALID MUHAMMAD IMRAN ET AL: "Epileptic MEG Spikes Detection Using Amplitude Thresholding and Dynamic Time Warping", IEEE ACCESS, vol. 5, 21 June 2017 (2017-06-21), pages 11658 - 11667, XP011656632, DOI: 10.1109/ACCESS.2017.2718044 * |
| KHALID MUHAMMAD IMRAN ET AL: "Epileptic MEG Spikes Detection Using Common Spatial Patterns and Linear Discriminant Analysis", IEEE ACCESS, vol. 4, 25 August 2016 (2016-08-25), pages 4629 - 4634, XP011622882, DOI: 10.1109/ACCESS.2016.2602354 * |
| M. I. KHALIDT. ALOTAIBYS. A. ALDOSARIS. A. ALSHEBEILIM. H. AL-HAMEEDF. S. Y. ALMOHAMMEDT. S. ALOTAIBI: "Epileptic MEG Spikes Detection Using Common Spatial Patterns and Linear Discriminant Analysis", IEEE ACCESS, vol. 4, 2016, pages 4629 - 4634, XP011622882, DOI: 10.1109/ACCESS.2016.2602354 |
| M. I. KHALIDT. N. ALOTAIBYS. A. ALDOSARIS. A. ALSHEBEILIM. H. ALHAMEEDV. POGHOSYAN: "Epileptic MEG Spikes Detection Using Amplitude Thresholding and Dynamic Time Warping", IEEE ACCESS, vol. 5, 2017, pages 11 658 - 11 667 |
| T. LALEG-KIRATIJ. ZHANGE. ACHTENH. SERRAI: "Spectral data de-noising using semi-classical signal analysis: application to localized MRS", NMR IN BIOMEDICINE, vol. 29, no. 10, 2016, pages 1477 - 1485, XP055484150, DOI: 10.1002/nbm.3590 |
| T.-M. LALEGE. CREPEAUY. PAPELIERM. SORINE: "Engineering in Medicine and Biology Society, 2007. EMBS 2007. 29th Annual International Conference of the IEEE", 2007, IEEE, article "Arterial blood pressure analysis based on scattering transform i", pages: 5326 - 5329 |
| T.-M. LALEG-KIRATIE. CREPEAUM. SORINE: "Semi-classical signal analysis", MATHEMATICS OF CONTROL, SIGNALS, AND SYSTEMS, vol. 25, no. 1, 2013, pages 37 - 61, XP055483889, DOI: 10.1007/s00498-012-0091-1 |
| TAOUS-MERIEM LALEG-KIRATI ET AL: "Semi-classical signal analysis", MATHEMATICS OF CONTROL, SIGNALS, AND SYSTEMS, vol. 25, no. 1, 30 September 2012 (2012-09-30), London, pages 37 - 61, XP055483889, ISSN: 0932-4194, DOI: 10.1007/s00498-012-0091-1 * |
| TAOUS-MERIEM LALEG-KIRATI ET AL: "Validation of a Semi-Classical Signal Analysis Method for Stroke Volume Variation Assessment: A Comparison with the PiCCO Technique", ANNALS OF BIOMEDICAL ENGINEERING, KLUWER ACADEMIC PUBLISHERS-PLENUM PUBLISHERS, NE, vol. 38, no. 12, 8 July 2010 (2010-07-08), pages 3618 - 3629, XP019860711, ISSN: 1573-9686, DOI: 10.1007/S10439-010-0118-Z * |
| T-M LALEG ET AL: "Arterial blood pressure analysis based on scattering transform I", 2007 ANNUAL INTERNATIONAL CONFERENCE OF THE IEEE ENGINEERING IN MEDICINE AND BIOLOGY SOCIETY : [EMBC '07] ; LYON, FRANCE, 22 - 26 AUGUST 2007 ; [IN CONJUNCTION WITH THE BIENNIAL CONFERENCE OF THE SOCIÉTÉ FRANÇAISE DE GÉNIE BIOLOGIQUE ET MÉDICAL (SFGB, 22 August 2007 (2007-08-22), pages 5326 - 5329, XP031337423, ISBN: 978-1-4244-0787-3 * |
| T-M LALEG ET AL: "Arterial blood pressure analysis based on scattering transform II", 2007 ANNUAL INTERNATIONAL CONFERENCE OF THE IEEE ENGINEERING IN MEDICINE AND BIOLOGY SOCIETY : [EMBC '07] ; LYON, FRANCE, 22 - 26 AUGUST 2007 ; [IN CONJUNCTION WITH THE BIENNIAL CONFERENCE OF THE SOCIÉTÉ FRANÇAISE DE GÉNIE BIOLOGIQUE ET MÉDICAL (SFGB, 22 August 2007 (2007-08-22), pages 5330 - 5333, XP031337424, ISBN: 978-1-4244-0787-3 * |
Also Published As
| Publication number | Publication date |
|---|---|
| US20220133242A1 (en) | 2022-05-05 |
Similar Documents
| Publication | Publication Date | Title |
|---|---|---|
| Safara et al. | Multi-level basis selection of wavelet packet decomposition tree for heart sound classification | |
| Daud et al. | Wavelet based filters for artifact elimination in electroencephalography signal: A review | |
| Chen et al. | Removing muscle artifacts from EEG data: Multichannel or single-channel techniques? | |
| McKeown et al. | Independent component analysis of functional MRI: what is signal and what is noise? | |
| JP6367442B2 (en) | Method and system for disease analysis based on conversion of diagnostic signals | |
| Mantini et al. | A signal-processing pipeline for magnetoencephalography resting-state networks | |
| Mehla et al. | A novel approach for automated alcoholism detection using Fourier decomposition method | |
| Chen et al. | ReMAE: User-friendly toolbox for removing muscle artifacts from EEG | |
| Abibullaev et al. | A new QRS detection method using wavelets and artificial neural networks | |
| Maiorana et al. | EEG signal preprocessing for biometric recognition | |
| De Lucia et al. | A novel method for automated classification of epileptiform activity in the human electroencephalogram-based on independent component analysis | |
| Issa et al. | Automatic ECG artefact removal from EEG signals | |
| Krishnaveni et al. | Comparison of independent component analysis algorithms for removal of ocular artifacts from electroencephalogram | |
| Chashmi et al. | An efficient and automatic ECG arrhythmia diagnosis system using DWT and HOS features and entropy-based feature selection procedure | |
| Charupanit et al. | Detection of anomalous high‐frequency events in human intracranial EEG | |
| Haloi et al. | Selection of appropriate statistical features of EEG signals for detection of Parkinson’s disease | |
| Maggioni et al. | Removal of pulse artefact from EEG data recorded in MR environment at 3T. Setting of ICA parameters for marking artefactual components: application to resting-state data | |
| Shams et al. | Comparison of BCG artifact removal methods for evoked responses in simultaneous EEG–fMRI | |
| Chahid et al. | Feature generation and dimensionality reduction using the discrete spectrum of the schrödinger operator for epileptic spikes detection | |
| Bairagi et al. | Early diagnosis of Alzheimer disease using EEG signals: the role of pre-processing | |
| Abbasi et al. | Time-frequency analysis of resting state and evoked EEG data recorded at higher magnetic fields up to 9.4 T | |
| US20220133242A1 (en) | Feature generation based on eigenfunctions of the schrödinger operator | |
| Anastasiadou et al. | Automatic detection and removal of muscle artifacts from scalp EEG recordings in patients with epilepsy | |
| Khatter et al. | Study of various automatic eeg artifact removal techniques | |
| Maiorana et al. | EEG-based biometric recognition using EigenBrains |
Legal Events
| Date | Code | Title | Description |
|---|---|---|---|
| 121 | Ep: the epo has been informed by wipo that ep was designated in this application |
Ref document number: 20717259 Country of ref document: EP Kind code of ref document: A1 |
|
| NENP | Non-entry into the national phase |
Ref country code: DE |
|
| 122 | Ep: pct application non-entry in european phase |
Ref document number: 20717259 Country of ref document: EP Kind code of ref document: A1 |
|
| WWE | Wipo information: entry into national phase |
Ref document number: 521430080 Country of ref document: SA |
|
| WWR | Wipo information: refused in national office |
Ref document number: 521430080 Country of ref document: SA |