WO2020116405A1 - 学習装置、推定装置、パラメータ算出方法、及びプログラム - Google Patents
学習装置、推定装置、パラメータ算出方法、及びプログラム Download PDFInfo
- Publication number
- WO2020116405A1 WO2020116405A1 PCT/JP2019/047093 JP2019047093W WO2020116405A1 WO 2020116405 A1 WO2020116405 A1 WO 2020116405A1 JP 2019047093 W JP2019047093 W JP 2019047093W WO 2020116405 A1 WO2020116405 A1 WO 2020116405A1
- Authority
- WO
- WIPO (PCT)
- Prior art keywords
- data
- value
- parameter
- objective function
- degree
- Prior art date
- Legal status (The legal status is an assumption and is not a legal conclusion. Google has not performed a legal analysis and makes no representation as to the accuracy of the status listed.)
- Ceased
Links
Images


Classifications
-
- G—PHYSICS
- G06—COMPUTING OR CALCULATING; COUNTING
- G06N—COMPUTING ARRANGEMENTS BASED ON SPECIFIC COMPUTATIONAL MODELS
- G06N5/00—Computing arrangements using knowledge-based models
- G06N5/02—Knowledge representation; Symbolic representation
- G06N5/022—Knowledge engineering; Knowledge acquisition
-
- G—PHYSICS
- G06—COMPUTING OR CALCULATING; COUNTING
- G06N—COMPUTING ARRANGEMENTS BASED ON SPECIFIC COMPUTATIONAL MODELS
- G06N20/00—Machine learning
-
- G—PHYSICS
- G06—COMPUTING OR CALCULATING; COUNTING
- G06N—COMPUTING ARRANGEMENTS BASED ON SPECIFIC COMPUTATIONAL MODELS
- G06N3/00—Computing arrangements based on biological models
- G06N3/02—Neural networks
- G06N3/04—Architecture, e.g. interconnection topology
- G06N3/045—Combinations of networks
- G06N3/0455—Auto-encoder networks; Encoder-decoder networks
-
- G—PHYSICS
- G06—COMPUTING OR CALCULATING; COUNTING
- G06N—COMPUTING ARRANGEMENTS BASED ON SPECIFIC COMPUTATIONAL MODELS
- G06N3/00—Computing arrangements based on biological models
- G06N3/02—Neural networks
- G06N3/04—Architecture, e.g. interconnection topology
- G06N3/0499—Feedforward networks
-
- G—PHYSICS
- G06—COMPUTING OR CALCULATING; COUNTING
- G06N—COMPUTING ARRANGEMENTS BASED ON SPECIFIC COMPUTATIONAL MODELS
- G06N3/00—Computing arrangements based on biological models
- G06N3/02—Neural networks
- G06N3/08—Learning methods
- G06N3/09—Supervised learning
-
- G—PHYSICS
- G06—COMPUTING OR CALCULATING; COUNTING
- G06N—COMPUTING ARRANGEMENTS BASED ON SPECIFIC COMPUTATIONAL MODELS
- G06N5/00—Computing arrangements using knowledge-based models
- G06N5/04—Inference or reasoning models
-
- G—PHYSICS
- G06—COMPUTING OR CALCULATING; COUNTING
- G06N—COMPUTING ARRANGEMENTS BASED ON SPECIFIC COMPUTATIONAL MODELS
- G06N7/00—Computing arrangements based on specific mathematical models
- G06N7/01—Probabilistic graphical models, e.g. probabilistic networks
-
- G—PHYSICS
- G06—COMPUTING OR CALCULATING; COUNTING
- G06N—COMPUTING ARRANGEMENTS BASED ON SPECIFIC COMPUTATIONAL MODELS
- G06N3/00—Computing arrangements based on biological models
- G06N3/02—Neural networks
- G06N3/04—Architecture, e.g. interconnection topology
- G06N3/045—Combinations of networks
-
- G—PHYSICS
- G06—COMPUTING OR CALCULATING; COUNTING
- G06N—COMPUTING ARRANGEMENTS BASED ON SPECIFIC COMPUTATIONAL MODELS
- G06N3/00—Computing arrangements based on biological models
- G06N3/02—Neural networks
- G06N3/04—Architecture, e.g. interconnection topology
- G06N3/047—Probabilistic or stochastic networks
-
- G—PHYSICS
- G06—COMPUTING OR CALCULATING; COUNTING
- G06N—COMPUTING ARRANGEMENTS BASED ON SPECIFIC COMPUTATIONAL MODELS
- G06N3/00—Computing arrangements based on biological models
- G06N3/02—Neural networks
- G06N3/08—Learning methods
- G06N3/088—Non-supervised learning, e.g. competitive learning
-
- G—PHYSICS
- G06—COMPUTING OR CALCULATING; COUNTING
- G06N—COMPUTING ARRANGEMENTS BASED ON SPECIFIC COMPUTATIONAL MODELS
- G06N5/00—Computing arrangements using knowledge-based models
- G06N5/01—Dynamic search techniques; Heuristics; Dynamic trees; Branch-and-bound
Definitions
- the present invention relates to a technique for estimating an abnormality degree included in data when the data is given.
- anomaly detection The task of detecting anomalies when given data is called anomaly detection.
- Anomaly detection technology is used, for example, to detect equipment abnormalities, network abnormalities, and credit card fraud.
- An unsupervised method has been proposed as a method of detecting an abnormality (for example, Non-Patent Reference 1).
- an abnormal label indicating whether each data is abnormal or not is given, there is a problem that the conventional unsupervised method cannot effectively utilize the abnormal label.
- a supervised method has been proposed as an abnormality detection method (for example, Non-Patent Reference 2).
- the conventional supervised method has a problem that high performance cannot be achieved when the amount of abnormal data is small.
- the present invention has been made in view of the above points, and when a data and an abnormality label are given, provides a technique that enables effective utilization of the abnormality label and estimation of the abnormality degree with high performance.
- the purpose is to do.
- an input data reading unit that inputs data and a label indicating whether the data is abnormal
- An objective function calculation unit that calculates a value of an objective function based on a predetermined function for calculating the abnormality degree of data by applying a parameter relating to the abnormality degree and the label, using the data and the value of the parameter
- a parameter updating unit that calculates the value of the parameter that maximizes the value of the objective function by repeatedly executing the processing by the objective function calculating unit while updating the value of the parameter.
- a learning device is provided.
- the technology when the data and the abnormality label are given, the technology that effectively utilizes the abnormality label and can estimate the abnormality degree with high performance is provided.
- FIG. 1 It is a block diagram of the system in an embodiment of the invention. It is a figure which shows the example of the hardware constitutions of an apparatus. It is a flow chart of processing of a learning device. It is a figure which shows the evaluation result of this invention.
- multidimensional vectors are used as data, but the present invention is not limited to multidimensional vectors and can be applied to arbitrary data such as structural data such as time series data and graph data. is there.
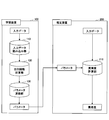
- FIG. 1 shows a configuration example of a system according to an embodiment of the present invention.
- the present system uses a learning device 100 that calculates a value of a parameter relating to an abnormality degree from input data, and an estimation that calculates an abnormality degree from input data using the value of the parameter calculated by the learning device 100.
- Device 200 uses a learning device 100 that calculates a value of a parameter relating to an abnormality degree from input data, and an estimation that calculates an abnormality degree from input data using the value of the parameter calculated by the learning device 100.
- the learning device 100 includes an input data reading unit 110, an objective function calculating unit 120, and a parameter updating unit 130.
- the estimation device 200 also includes an abnormality degree calculation unit 210. The operation content of each unit will be described later.
- the learning device 100 and the estimation device 200 may be one device (for convenience, referred to as a learning estimation device).
- the learning estimation device includes an input data reading unit 110, an objective function calculating unit 120, a parameter updating unit 130, and an abnormality degree calculating unit 210.
- the learning device 100, the estimation device 200, and the learning estimation device can all be realized by a computer. That is, the device can be realized by using a hardware resource such as a CPU and a memory built in the computer to execute a program corresponding to the process executed by the device.
- the above program can be recorded in a computer-readable recording medium (portable memory or the like), and can be stored or distributed. It is also possible to provide the above program through a network such as the Internet or electronic mail.
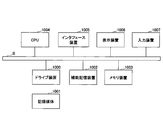
- FIG. 2 is a diagram showing a hardware configuration example of the computer.
- the computer in FIG. 2 includes a drive device 1000, an auxiliary storage device 1002, a memory device 1003, a CPU 1004, an interface device 1005, a display device 1006, an input device 1007, and the like, which are connected to each other by a bus B.
- the program that realizes the processing in the computer is provided by a recording medium 1001 such as a CD-ROM or a memory card.
- a recording medium 1001 such as a CD-ROM or a memory card.
- the program is installed from the recording medium 1001 to the auxiliary storage device 1002 via the drive device 1000.
- the program does not necessarily have to be installed from the recording medium 1001 and may be downloaded from another computer via a network.
- the auxiliary storage device 1002 stores the installed program and also stores necessary files and data.
- the memory device 1003 reads out and stores the program from the auxiliary storage device 1002 when a program activation instruction is given.
- the CPU 1004 realizes functions related to the learning device 100, the estimation device 200, the learning estimation device, and the like according to the program stored in the memory device 1003.
- the interface device 1005 is used as an interface for connecting to a network and functions as an input unit and an output unit via the network.
- the display device 1006 displays a GUI (Graphical User Interface) or the like according to a program.
- the display device 1006 is also an example of an output unit.
- the input device 1007 includes a keyboard and a mouse, buttons, a touch panel, or the like, and is used to input various operation instructions.
- x n (x n1 ,..., X nD ) is a D-dimensional feature vector of the n-th data
- N is an integer of 1 or more.
- an abnormality degree that is low when the probability of occurrence of the data is high and is high when the probability of occurrence of the data is low is used.
- a negative logarithmic likelihood function can be used as shown in the following expression (1).
- ⁇ is a parameter of the degree of abnormality.
- ⁇ is also a parameter of the likelihood function p(x
- the degree of abnormality may be expressed by a function other than the likelihood function.
- an abnormality degree represented by a function used for unsupervised abnormality detection such as reconstruction error of an auto encoder may be used.
- the function for expressing the degree of abnormality may be called a "predetermined function".
- ⁇ ) is an example of a predetermined function.
- ⁇ )” is also an example of the predetermined function.
- the "predetermined function” may be a function other than the likelihood function.
- the parameter ⁇ is a parameter related to the degree of abnormality, and is not limited to a particular one. For example, the probability of occurrence of abnormal data (or normal data), the mean and variance for expressing the distribution of data, and the parameters of neural network And so on.
- ⁇ ) represents the likelihood (likelihood) of observing the data x under the parameter ⁇ .
- any density function such as normal distribution, mixed normal distribution, variational auto encoder, neural autoregressive density function can be used as the likelihood function when calculating the anomaly degree using the likelihood function.
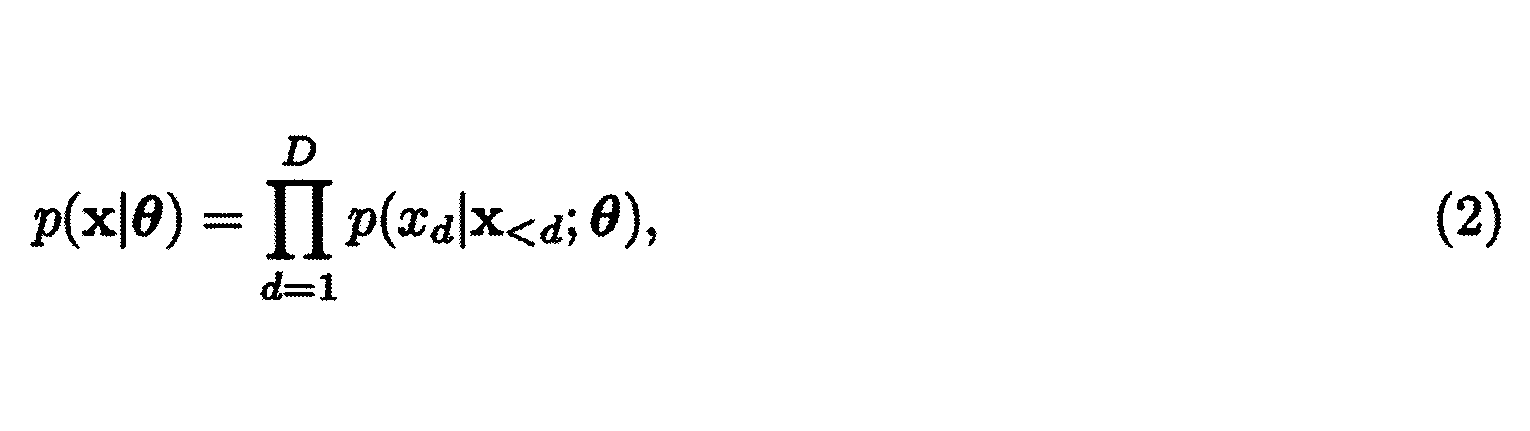
- ⁇ ) is expressed by the following equation (2).
- x ⁇ d [x 1 ,..., X d-1 ] is each feature vector before the d-th, and as a model of each feature, for example, the following formula (3) A mixed normal distribution represented by can be used.
- K is a mixture number
- ⁇ , ⁇ 2 ) is a mean ⁇
- ⁇ 2 dk (x ⁇ d ; ⁇ ) is a normal distribution of variance ⁇ 2
- ⁇ dk (x ⁇ d ; ⁇ ) is a normal distribution of variance ⁇ 2
- ⁇ dk (x ⁇ d ; ⁇ ) is a normal distribution of variance ⁇ 2
- ⁇ dk (x ⁇ d ; ⁇ ) and ⁇ 2 dk (x ⁇ d ; ⁇ ) are neural networks that define the mixing ratio, mean, and variance for the d-th feature of the k-th component, respectively.
- the learning device 100 estimates the parameter ⁇ of the abnormality degree so that the abnormality degree of the normal data is low and the abnormality degree of the abnormal data is higher than the abnormality degree of the normal data. Therefore, for example, in order to reduce the abnormal degree of normal data, ⁇ is estimated so as to maximize the objective function shown in the following equation (4).
- the objective function calculation unit 120 calculates an objective function using the input data and a certain value of ⁇ for estimating ⁇ .
- the constraint is a constraint when the parameter updating unit 130 updates the parameter.
- A indicates an abnormal data index set
- a bar ⁇ n ⁇ D
- y n 0 ⁇ indicates a normal data index set. That is, the equation (4) represents a value obtained by dividing the sum of log likelihoods of only normal data by the number of normal data. Further, the formula (5) is, as described above, abnormality of the abnormality data (-logp (x n
- labeled data and unlabeled data may be given.
- normal data has a lower anomaly level than unlabeled data so that abnormal data has a higher anomaly level than unlabeled data, instead of the constraint of equation (5). It is sufficient to use a constraint that
- the parameter ⁇ may be estimated by maximizing the objective function represented by the following equation (6).
- ⁇ 0 is a hyperparameter
- f( ⁇ ) is a sigmoid function represented by the following equation (7).
- the second term of the equation (6) takes a large value when the abnormal degree of abnormal data is higher than that of normal data, and a small value when the abnormal degree of abnormal data is lower than that of normal data.
- f( ⁇ ) is a function that takes a large value when the abnormal degree of abnormal data is higher than the abnormal degree of normal data, and takes a small value when the abnormal degree of abnormal data is lower than the abnormal degree of normal data.
- a function other than equation (6) may be used.
- the hyperparameter can be set by using development data, for example.
- the method of maximizing the above objective function is not limited to a particular method, but can be realized by using the stochastic gradient method, for example.
- the parameter updating unit 130 estimates the parameter ⁇ by the stochastic gradient method using the value of the objective function and the differential value of the objective function with the parameter ⁇ .
- ⁇ be the value of the parameter estimated by the learning device 100.
- the parameter ⁇ and the data x * are input to the estimation apparatus 200 as input data for which the degree of abnormality is to be obtained.
- the degree-of-abnormality calculation unit 210 calculates the degree of abnormality with respect to the data x * by the following equation (8) using the parameter ⁇ and outputs the degree of abnormality.
- FIG. 3 is a flowchart showing the processing of the learning device 100.
- the input data reading unit 110 reads the input data.
- the read input data is passed to the objective function calculation unit 120.
- the input data may be observation data received in real time from a certain system, or the observed data may be stored in advance in a storage unit (HDD, memory, etc.) in the learning device 100. Good.
- the objective function calculation unit 120 obtains the value of the objective function by calculating the objective function using the input data and the current value of the parameter ⁇ (initial value is a preset initial value), and the objective function parameter is calculated. Find the differential value with respect to ⁇ . The value of the objective function and the differential position are passed to the parameter updating unit 130.
- the parameter updating unit 130 updates the parameter ⁇ so that the value of the objective function becomes high by using the value of the objective function and the differential value calculated in S102.
- S102 and S103 are repeated until the end condition is satisfied. That is, in S104, the parameter updating unit 130 (or the objective function calculating unit 120) determines whether or not the end condition is satisfied. If not satisfied, the process proceeds to S102, and if satisfied, the process ends.
- the termination condition it is possible to use, for example, that the number of repetitions exceeds a certain value, the amount of change in the objective function value is smaller than a certain value, or the amount of change in the parameter is smaller than a certain value.
- the abnormality degree calculation unit 210 of the estimation device 200 calculates the abnormality degree of the target data using the estimated value of the parameter ⁇ . To do.
- evaluation results In order to evaluate the technique according to the present invention described using the above-described embodiment, evaluation was performed using 16 data. The result is shown in FIG. In the evaluation shown in FIG. 4, Area Under the ROC Curve (AUC) was used as an evaluation index. The closer the AUC value is to 1, the higher the performance.
- AUC Area Under the ROC Curve
- 16 data names are shown at the left end of the table in FIG.
- the local outlier factor LEF
- one-class support vector machine OCSVM
- isolation forest IF
- variational autoencoder VAE
- deep masked auto encoder MADE
- KNN k-nearest neighbor
- SVM support vector machine
- RF random forest
- neural network NN
- An input data reading unit for inputting data and a label indicating whether the data is abnormal
- a predetermined function for calculating the degree of abnormality of data by applying a parameter relating to the degree of abnormality
- an objective function calculation unit that calculates the value of the objective function based on the label, using the data and the value of the parameter.
- a parameter updating unit that calculates the value of the parameter that maximizes the value of the objective function by repeatedly executing the processing by the objective function calculating unit while updating the value of the parameter. Learning device.
- the anomaly degree calculated using the predetermined function is such an anomaly degree that the value is low for data with a high probability of occurrence and high for data with a low probability of appearance.
- the learning device according to item 1, wherein: (Section 3) The learning according to claim 1 or 2, wherein the parameter updating unit updates the value of the parameter using a constraint for making the degree of abnormality of abnormal data higher than the degree of abnormality of normal data. apparatus. (Section 4)
- the objective function includes a function that takes a large value when the abnormal degree of abnormal data is higher than the abnormal degree of normal data and takes a small value when the abnormal degree of abnormal data is lower than the abnormal degree of normal data.
- the learning device according to the first or second aspect.
- An estimating apparatus By inputting data to the predetermined function to which the value of the parameter that maximizes the value of the objective function obtained by the learning device according to any one of the first to fourth terms is applied
- An estimating apparatus comprising: an abnormality degree calculating unit that calculates an abnormality degree of the data.
- (Section 6) A parameter calculation method executed by the learning device, An input step of inputting data and a label indicating whether or not the data is abnormal, A predetermined function for calculating the abnormality degree of data by applying a parameter relating to the abnormality degree, and an objective function calculation step of calculating the value of the objective function based on the label using the data and the value of the parameter
- a parameter calculation step of calculating the value of the parameter that maximizes the value of the objective function by repeatedly executing the objective function calculation step while updating the value of the parameter.
- Method. A program for causing a computer to function as each unit in the learning device according to any one of items 1 to 4.
- (Section 8) A program for causing a computer to function as the abnormality degree calculation unit in the estimation device according to item 5.
Landscapes
- Engineering & Computer Science (AREA)
- Theoretical Computer Science (AREA)
- Physics & Mathematics (AREA)
- General Engineering & Computer Science (AREA)
- General Physics & Mathematics (AREA)
- Software Systems (AREA)
- Computing Systems (AREA)
- Artificial Intelligence (AREA)
- Data Mining & Analysis (AREA)
- Evolutionary Computation (AREA)
- Mathematical Physics (AREA)
- Computational Linguistics (AREA)
- General Health & Medical Sciences (AREA)
- Life Sciences & Earth Sciences (AREA)
- Molecular Biology (AREA)
- Biophysics (AREA)
- Biomedical Technology (AREA)
- Health & Medical Sciences (AREA)
- Probability & Statistics with Applications (AREA)
- Computational Mathematics (AREA)
- Algebra (AREA)
- Mathematical Optimization (AREA)
- Mathematical Analysis (AREA)
- Pure & Applied Mathematics (AREA)
- Computer Vision & Pattern Recognition (AREA)
- Medical Informatics (AREA)
- Testing And Monitoring For Control Systems (AREA)
Abstract
学習装置において、データと、データが異常か否かを示すラベルとを入力する入力データ読み込み部と、異常度に関するパラメータを適用してデータの異常度を算出するための所定の関数と、前記ラベルとに基づく目的関数の値を、前記データと前記パラメータの値とを用いて算出する目的関数計算部と、前記パラメータの値を更新しながら、前記目的関数計算部による処理を繰り返し実行することにより、前記目的関数の値を最大化する前記パラメータの値を算出するパラメータ更新部とを備える。
Description
本発明は、データが与えられたときに、当該データに含まれる異常度を推定するための技術に関連するものである。
データが与えられたときに異常を検知するタスクは、異常検知と呼ばれる。異常検知の技術は、例えば、機器異常やネットワーク異常、クレジットカード詐欺の検知に利用されている。
異常検知の方法として、教師なし手法が提案されている(例えば非特許参考文献1)。しかし、 各データが異常か異常でないかを表す異常ラベルが与えられている場合、従来の教師なし手法では、その異常ラベルを有効に活用できないという問題がある。
異常検知の方法として、教師なし手法が提案されている(例えば非特許参考文献1)。しかし、 各データが異常か異常でないかを表す異常ラベルが与えられている場合、従来の教師なし手法では、その異常ラベルを有効に活用できないという問題がある。
また、異常検知の方法として、教師あり手法も提案されている(例えば非特許参考文献2)。しかし、従来の教師あり手法では、異常データが少ない場合、高い性能が達成できないという問題がある。
Liu, Fei Tony, Kai Ming Ting, and Zhi-Hua Zhou. "Isolation forest." 2008 Eighth IEEE International Conference on Data Mining. IEEE, 2008.
Zhang, J., Zulkernine, M., & Haque, A. (2008). Random-forests-based network intrusion detection systems. IEEE Transactions on Systems, Man, and Cybernetics, Part C (Applications and Reviews), 38(5), 649-659.
本発明は上記の点に鑑みてなされたものであり、データ及び異常ラベルが与えられたときに、異常ラベルを有効に活用し、高い性能で異常度を推定することを可能とする技術を提供することを目的とする。
開示の技術によれば、データと、データが異常か否かを示すラベルとを入力する入力データ読み込み部と、
異常度に関するパラメータを適用してデータの異常度を算出するための所定の関数と、前記ラベルとに基づく目的関数の値を、前記データと前記パラメータの値とを用いて算出する目的関数計算部と、
前記パラメータの値を更新しながら、前記目的関数計算部による処理を繰り返し実行することにより、前記目的関数の値を最大化する前記パラメータの値を算出するパラメータ更新部と
を備えることを特徴とする学習装置が提供される。
異常度に関するパラメータを適用してデータの異常度を算出するための所定の関数と、前記ラベルとに基づく目的関数の値を、前記データと前記パラメータの値とを用いて算出する目的関数計算部と、
前記パラメータの値を更新しながら、前記目的関数計算部による処理を繰り返し実行することにより、前記目的関数の値を最大化する前記パラメータの値を算出するパラメータ更新部と
を備えることを特徴とする学習装置が提供される。
開示の技術によれば、データ及び異常ラベルが与えられたときに、異常ラベルを有効に活用し、高い性能で異常度を推定することを可能とする技術が提供される。
以下、図面を参照して本発明の実施の形態を説明する。以下で説明する実施の形態は一例に過ぎず、本発明が適用される実施の形態は、以下の実施の形態に限られるわけではない。例えば、以下の説明では、データとして多次元ベクトルを用いているが、本発明は、多次元ベクトルに限らず、時系列データやグラフデータなどの構造データなど、任意のデータに対して適用可能である。
なお、以下の明細書のテキストにおいて、「Aバー」は、「A」の頭にバー「-」が付された記号を意味し、θ^は、「θ」の頭に「^」が付された記号を意味する。
(システム構成例)
図1に、本発明の実施の形態におけるシステムの構成例を示す。図1に示すように、本システムは、入力データから異常度に関するパラメータの値を算出する学習装置100と、学習装置100で算出されたパラメータの値を用いて入力データから異常度を算出する推定装置200とを有する。
図1に、本発明の実施の形態におけるシステムの構成例を示す。図1に示すように、本システムは、入力データから異常度に関するパラメータの値を算出する学習装置100と、学習装置100で算出されたパラメータの値を用いて入力データから異常度を算出する推定装置200とを有する。
図1に示すように、学習装置100は、入力データ読み込み部110、目的関数計算部120、パラメータ更新部130を有する。また、推定装置200は、異常度計算部210を有する。各部の動作内容については後述する。
なお、学習装置100と推定装置200が1つの装置(便宜上、学習推定装置と呼ぶ)であってもよい。当該学習推定装置は、入力データ読み込み部110、目的関数計算部120、パラメータ更新部130、異常度計算部210を有する。
学習装置100、推定装置200、及び学習推定装置は、いずれもコンピュータにより実現することができる。すなわち、当該装置は、コンピュータに内蔵されるCPUやメモリ等のハードウェア資源を用いて、当該装置で実施される処理に対応するプログラムを実行することによって実現することが可能である。上記プログラムは、コンピュータが読み取り可能な記録媒体(可搬メモリ等)に記録して、保存したり、配布したりすることが可能である。また、上記プログラムをインターネットや電子メール等、ネットワークを通して提供することも可能である。
図2は、上記コンピュータのハードウェア構成例を示す図である。図2のコンピュータは、それぞれバスBで相互に接続されているドライブ装置1000、補助記憶装置1002、メモリ装置1003、CPU1004、インタフェース装置1005、表示装置1006、及び入力装置1007等を有する。
当該コンピュータでの処理を実現するプログラムは、例えば、CD-ROM又はメモリカード等の記録媒体1001によって提供される。プログラムを記憶した記録媒体1001がドライブ装置1000にセットされると、プログラムが記録媒体1001からドライブ装置1000を介して補助記憶装置1002にインストールされる。但し、プログラムのインストールは必ずしも記録媒体1001より行う必要はなく、ネットワークを介して他のコンピュータよりダウンロードするようにしてもよい。補助記憶装置1002は、インストールされたプログラムを格納すると共に、必要なファイルやデータ等を格納する。
メモリ装置1003は、プログラムの起動指示があった場合に、補助記憶装置1002からプログラムを読み出して格納する。CPU1004は、メモリ装置1003に格納されたプログラムに従って、学習装置100、推定装置200、学習推定装置などに係る機能を実現する。インタフェース装置1005は、ネットワークに接続するためのインタフェースとして用いられ、ネットワークを介した入力手段及び出力手段として機能する。表示装置1006はプログラムによるGUI(Graphical User Interface)等を表示する。表示装置1006は出力手段の例でもある。入力装置1007はキーボード及びマウス、ボタン、又はタッチパネル等で構成され、様々な操作指示を入力させるために用いられる。
以下、各部の処理内容を説明する。まず、学習装置100について説明する。
(学習装置100の入力データ読み込み部110)
入力データ読み込み部110には、入力データとしてX={(xn,yn)}N n=1が与えられ、当該入力データは目的関数計算部120に渡される。ここで、xn=(xn1,・・・,xnD)はn番目のデータのD次元の特徴ベクトル、ynはその異常ラベルである。データxnが異常の場合yn=1、異常でない場合(正常の場合)yn=0となる。また、Nは1以上の整数である。
入力データ読み込み部110には、入力データとしてX={(xn,yn)}N n=1が与えられ、当該入力データは目的関数計算部120に渡される。ここで、xn=(xn1,・・・,xnD)はn番目のデータのD次元の特徴ベクトル、ynはその異常ラベルである。データxnが異常の場合yn=1、異常でない場合(正常の場合)yn=0となる。また、Nは1以上の整数である。
(学習装置100の目的関数計算部120、パラメータ更新部130)
本実施の形態では、データの異常度として、そのデータが発生する確率が高い場合に低くなり、発生する確率が低い場合に高くなるような異常度を用いる。例えば、異常度として、以下の式(1)に示すように負の対数尤度関数を用いることができる。
本実施の形態では、データの異常度として、そのデータが発生する確率が高い場合に低くなり、発生する確率が低い場合に高くなるような異常度を用いる。例えば、異常度として、以下の式(1)に示すように負の対数尤度関数を用いることができる。

なお、異常度は、尤度関数以外の関数で表わすようにしても良い。例えば、オートエンコーダの再構成誤差などの教師なし異常検知で用いられる関数で表わされる異常度を用いることとしてもよい。
異常度を表すための関数を"所定の関数"と呼んでもよい。例えば、尤度関数p(x|θ)は所定の関数の例である。「-logp(x|θ)」も所定の関数の例である。また、"所定の関数"は、尤度関数以外の関数であってもよい。
パラメータθは、異常度に関連するパラメータであり、特定のものに限定されないが、例えば、異常データ(あるいは正常データ)の発生確率や、データの分布を表すための平均及び分散、ニューラルネットのパラメータなどである。また、尤度関数p(x|θ)の値は、パラメータθのもとで、データxが観測される尤度(尤もらしさ)を表す。
異常度を尤度関数を用いて算出する場合における当該尤度関数として、正規分布、混合正規分布、変分オートエンコーダ、ニューラル自己回帰密度関数など、任意の密度関数を用いることができる。例えば、尤度関数として、ニューラル自己回帰密度関数を用いる場合、尤度関数p(x|θ)は下記の式(2)で表わされる。
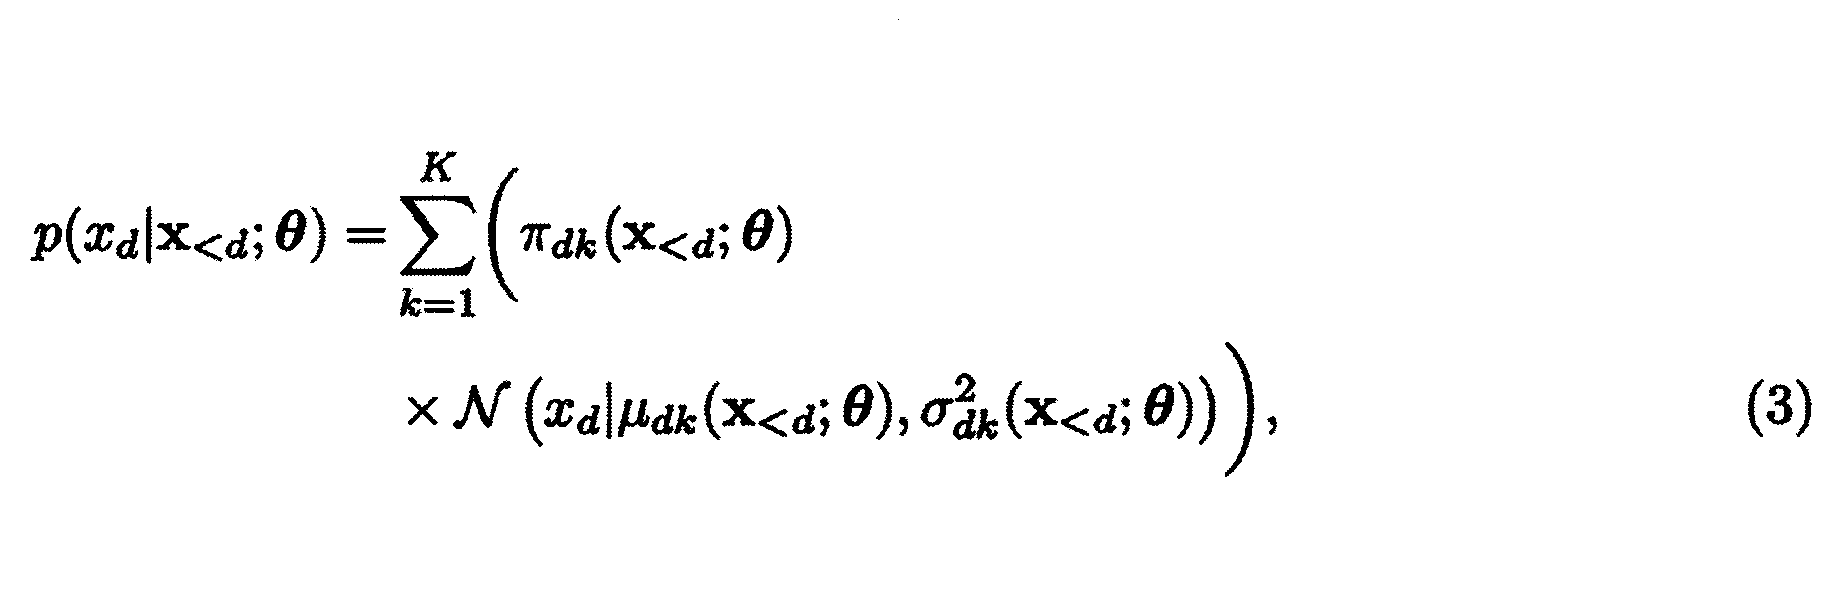
なお、上記の分布を用いることは一例であり、例えば、データが二値変数の場合はベルヌーイ分布、データが非負の整数の場合はポワソン分布、データが非負の実数の場合はガンマ分布などの他の分布を用いることもできる。
学習装置100は、正常データに対しては異常度が低く、かつ、異常データの異常度が正常データの異常度よりも高くなるように、異常度のパラメータθを推定する。そのために、例えば、正常データの異常度を低くするために、以下の式(4)に示す目的関数を最大化するようにθを推定する。目的関数計算部120は、θの推定のために、入力データと、ある値のθを用いて目的関数の計算を行う。

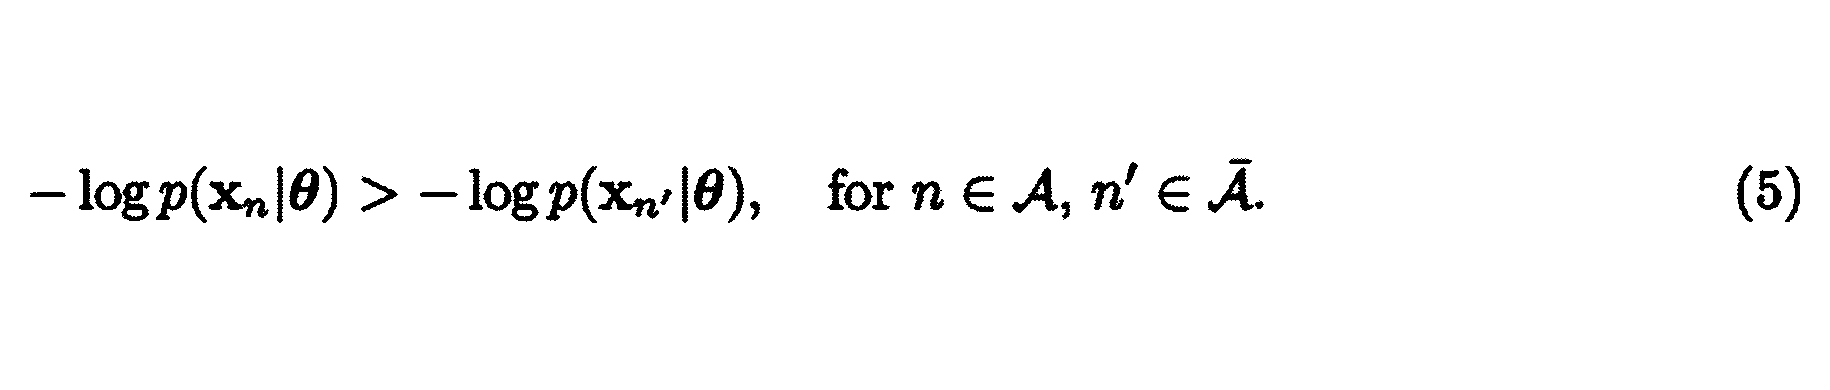
入力データとして、ラベルありデータとラベルなしデータが与えられる場合がある。ラベルありデータとラベルなしデータが与えられる場合、式(5)の制約に代えて、異常データがラベルなしデータよりも異常度が高くなるように、正常データがラベルなしデータよりも異常度が低くなるような制約を用いればよい。
上記のように制約を用いて目的関数を最大化することは一例である。効率的な制約なし最適化として、以下の式(6)で示す目的関数を最大化することで、パラメータθを推定することとしてもよい。


上記の目的関数の最大化の方法は特定の方法に限定されないが、例えば、確率的勾配法を用いて実現できる。例えば、パラメータ更新部130は、目的関数の値と、目的関数のパラメータθによる微分値を用いて、確率的勾配法によりパラメータθを推定する。
(推定装置200の異常度計算部210)
学習装置100により推定されたパラメータの値をθ^とする。推定装置200には、パラメータθ^と、異常度を求める対象の入力データとしてデータx*が入力される。異常度計算部210は、パラメータθ^を用いて、データx*に対する異常度を下記の式(8)により計算し、当該異常度を出力する。
学習装置100により推定されたパラメータの値をθ^とする。推定装置200には、パラメータθ^と、異常度を求める対象の入力データとしてデータx*が入力される。異常度計算部210は、パラメータθ^を用いて、データx*に対する異常度を下記の式(8)により計算し、当該異常度を出力する。
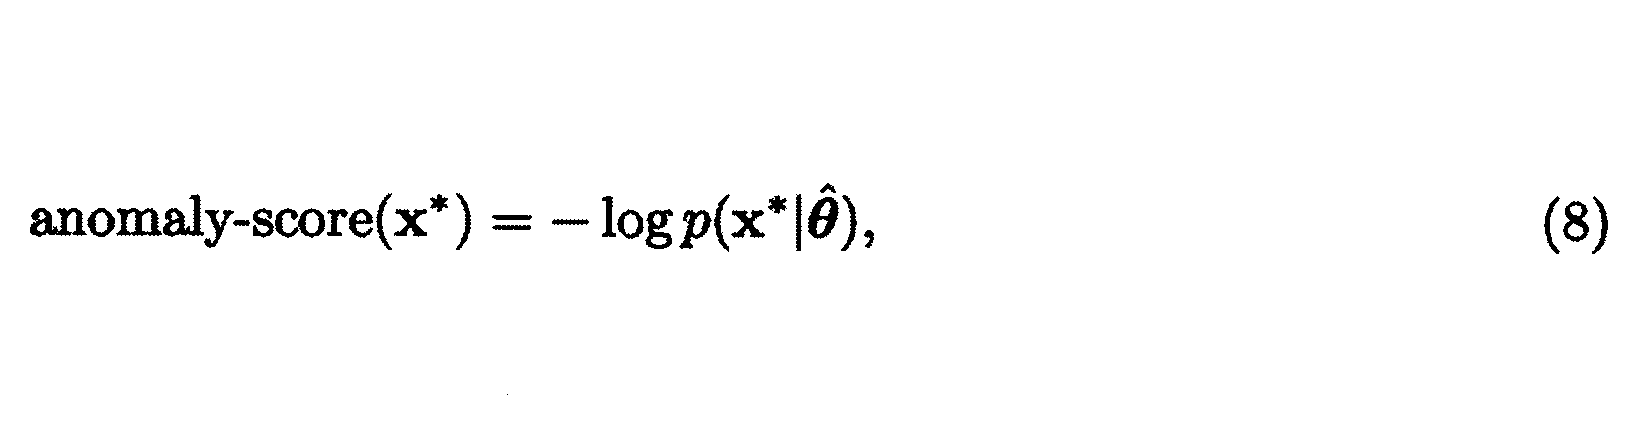
図3は、学習装置100の処理を示すフローチャートである。
S101において、入力データ読み込み部110が入力データを読み込む。読み込まれた入力データは目的関数計算部120に渡される。なお、入力データは、あるシステムからリアルタイムに受信する観測データであってもよいし、観測されたデータを学習装置100における記憶手段(HDD,メモリ等)に予め保存しておいたものであってもよい。
S102において、目的関数計算部120が、入力データと現在のパラメータθの値(最初は予め設定した初期値)を用いて目的関数を計算することにより目的関数の値を求めるとともに、目的関数のパラメータθに関する微分値を求める。目的関数の値、及び、微分地は、パラメータ更新部130に渡される。
S103において、パラメータ更新部130は、S102で計算した目的関数の値と微分値を用いて、目的関数の値が高くなるように、パラメータθを更新する。
S102、S103の処理は、終了条件を満たすまで繰り返される。すなわち、S104において、パラメータ更新部130(あるいは目的関数計算部120)は、終了条件を満たすかどうかを判定し、満たさなければS102に進み、満たせば処理を終了する。
終了条件としては、例えば、繰り返し回数がある値を越える、目的関数値の変化量がある値より小さくなる、パラメータの変化量がある値より小さくなる、などを用いることができる。
学習装置100の処理によりパラメータθの値が算出(推定)されると、推定装置200の異常度計算部210が、推定されたパラメータθの値を用いて、対象のデータについての異常度を計算する。
(評価結果)
上記実施の形態を用いて説明した本発明に係る技術を評価するために、16のデータを用いて評価を実施した。その結果を図4に示す。図4に示す評価では、評価指標としてArea Under the ROC Curve(AUC)を用いた。AUCの値が1に近いほど高性能であることを示す。
上記実施の形態を用いて説明した本発明に係る技術を評価するために、16のデータを用いて評価を実施した。その結果を図4に示す。図4に示す評価では、評価指標としてArea Under the ROC Curve(AUC)を用いた。AUCの値が1に近いほど高性能であることを示す。
図4における表の左端に16のデータ名が示されている。本発明に係る手法(Proposed)に対する比較対象として、図4の表の上端に示すとおり、the local outlier factor (LOF)、one-class support vector machine (OCSVM)、isolation forest (IF)、valiational autoencoder (VAE)、deep masked autoencoder density estimator (MADE)、k-nearest neighbor (KNN)、support vector machine (SVM)、random forest (RF)、neural network (NN)を用いた。
図4に示すとおり、本発明に係る手法(Proposed)が他の手法よりも多くのデータで高い性能を達成していることがわかる。
(実施の形態のまとめ)
以上、説明したとおり、本明細書には少なくとも下記の事項が開示されている。
(第1項)
データと、データが異常か否かを示すラベルとを入力する入力データ読み込み部と、
異常度に関するパラメータを適用してデータの異常度を算出するための所定の関数と、前記ラベルとに基づく目的関数の値を、前記データと前記パラメータの値とを用いて算出する目的関数計算部と、
前記パラメータの値を更新しながら、前記目的関数計算部による処理を繰り返し実行することにより、前記目的関数の値を最大化する前記パラメータの値を算出するパラメータ更新部と
を備えることを特徴とする学習装置。
(第2項)
前記所定の関数を用いて算出される異常度は、出現する確率が高いデータに対してはその値が低くなり、出現する確率が低いデータに対してはその値が高くなるような異常度である
ことを特徴とする第1項に記載の学習装置。
(第3項)
前記パラメータ更新部は、異常データの異常度を正常データの異常度よりも高くするための制約を用いて前記パラメータの値を更新する
ことを特徴とする第1項又は第2項に記載の学習装置。
(第4項)
前記目的関数は、異常データの異常度が正常データの異常度よりも高い場合に大きな値を取り、異常データの異常度が正常データの異常度よりも低い場合に小さな値を取る関数を含む
ことを特徴とする第1項又は第2項に記載の学習装置。
(第5項)
第1項ないし第4項のうちいずれか1項に記載の学習装置により得られた、前記目的関数の値を最大化する前記パラメータの値を適用した前記所定の関数にデータを入力することにより、当該データの異常度を算出する異常度計算部
を備えることを特徴とする推定装置。
(第6項)
学習装置が実行するパラメータ算出方法であって、
データと、データが異常か否かを示すラベルとを入力する入力ステップと、
異常度に関するパラメータを適用してデータの異常度を算出するための所定の関数と、前記ラベルとに基づく目的関数の値を、前記データと前記パラメータの値とを用いて算出する目的関数計算ステップと、
前記パラメータの値を更新しながら、前記目的関数計算ステップを繰り返し実行することにより、前記目的関数の値を最大化する前記パラメータの値を算出するパラメータ算出ステップと
を備えることを特徴とするパラメータ算出方法。
(第7項)
コンピュータを、第1項ないし第4項のうちいずれか1項に記載の学習装置における各部として機能させるためのプログラム。
(第8項)
コンピュータを、第5項に記載の推定装置における異常度計算部として機能させるためのプログラム。
以上、説明したとおり、本明細書には少なくとも下記の事項が開示されている。
(第1項)
データと、データが異常か否かを示すラベルとを入力する入力データ読み込み部と、
異常度に関するパラメータを適用してデータの異常度を算出するための所定の関数と、前記ラベルとに基づく目的関数の値を、前記データと前記パラメータの値とを用いて算出する目的関数計算部と、
前記パラメータの値を更新しながら、前記目的関数計算部による処理を繰り返し実行することにより、前記目的関数の値を最大化する前記パラメータの値を算出するパラメータ更新部と
を備えることを特徴とする学習装置。
(第2項)
前記所定の関数を用いて算出される異常度は、出現する確率が高いデータに対してはその値が低くなり、出現する確率が低いデータに対してはその値が高くなるような異常度である
ことを特徴とする第1項に記載の学習装置。
(第3項)
前記パラメータ更新部は、異常データの異常度を正常データの異常度よりも高くするための制約を用いて前記パラメータの値を更新する
ことを特徴とする第1項又は第2項に記載の学習装置。
(第4項)
前記目的関数は、異常データの異常度が正常データの異常度よりも高い場合に大きな値を取り、異常データの異常度が正常データの異常度よりも低い場合に小さな値を取る関数を含む
ことを特徴とする第1項又は第2項に記載の学習装置。
(第5項)
第1項ないし第4項のうちいずれか1項に記載の学習装置により得られた、前記目的関数の値を最大化する前記パラメータの値を適用した前記所定の関数にデータを入力することにより、当該データの異常度を算出する異常度計算部
を備えることを特徴とする推定装置。
(第6項)
学習装置が実行するパラメータ算出方法であって、
データと、データが異常か否かを示すラベルとを入力する入力ステップと、
異常度に関するパラメータを適用してデータの異常度を算出するための所定の関数と、前記ラベルとに基づく目的関数の値を、前記データと前記パラメータの値とを用いて算出する目的関数計算ステップと、
前記パラメータの値を更新しながら、前記目的関数計算ステップを繰り返し実行することにより、前記目的関数の値を最大化する前記パラメータの値を算出するパラメータ算出ステップと
を備えることを特徴とするパラメータ算出方法。
(第7項)
コンピュータを、第1項ないし第4項のうちいずれか1項に記載の学習装置における各部として機能させるためのプログラム。
(第8項)
コンピュータを、第5項に記載の推定装置における異常度計算部として機能させるためのプログラム。
以上、本実施の形態について説明したが、本発明はかかる特定の実施形態に限定されるものではなく、特許請求の範囲に記載された本発明の要旨の範囲内において、種々の変形・変更が可能である。
100 学習装置
110 入力データ読み込み部
120 目的関数計算部
130 パラメータ更新部
200 推定装置
210 異常度計算部
1000 ドライブ装置
1001 記録媒体
1002 補助記憶装置
1003 メモリ装置
1004 CPU
1005 インタフェース装置
1006 表示装置
1007 入力装置
110 入力データ読み込み部
120 目的関数計算部
130 パラメータ更新部
200 推定装置
210 異常度計算部
1000 ドライブ装置
1001 記録媒体
1002 補助記憶装置
1003 メモリ装置
1004 CPU
1005 インタフェース装置
1006 表示装置
1007 入力装置
Claims (8)
- データと、データが異常か否かを示すラベルとを入力する入力データ読み込み部と、
異常度に関するパラメータを適用してデータの異常度を算出するための所定の関数と、前記ラベルとに基づく目的関数の値を、前記データと前記パラメータの値とを用いて算出する目的関数計算部と、
前記パラメータの値を更新しながら、前記目的関数計算部による処理を繰り返し実行することにより、前記目的関数の値を最大化する前記パラメータの値を算出するパラメータ更新部と
を備えることを特徴とする学習装置。 - 前記所定の関数を用いて算出される異常度は、出現する確率が高いデータに対してはその値が低くなり、出現する確率が低いデータに対してはその値が高くなるような異常度である
ことを特徴とする請求項1に記載の学習装置。 - 前記パラメータ更新部は、異常データの異常度を正常データの異常度よりも高くするための制約を用いて前記パラメータの値を更新する
ことを特徴とする請求項1又は2に記載の学習装置。 - 前記目的関数は、異常データの異常度が正常データの異常度よりも高い場合に大きな値を取り、異常データの異常度が正常データの異常度よりも低い場合に小さな値を取る関数を含む
ことを特徴とする請求項1又は2に記載の学習装置。 - 請求項1ないし4のうちいずれか1項に記載の学習装置により得られた、前記目的関数の値を最大化する前記パラメータの値を適用した前記所定の関数にデータを入力することにより、当該データの異常度を算出する異常度計算部
を備えることを特徴とする推定装置。 - 学習装置が実行するパラメータ算出方法であって、
データと、データが異常か否かを示すラベルとを入力する入力ステップと、
異常度に関するパラメータを適用してデータの異常度を算出するための所定の関数と、前記ラベルとに基づく目的関数の値を、前記データと前記パラメータの値とを用いて算出する目的関数計算ステップと、
前記パラメータの値を更新しながら、前記目的関数計算ステップを繰り返し実行することにより、前記目的関数の値を最大化する前記パラメータの値を算出するパラメータ算出ステップと
を備えることを特徴とするパラメータ算出方法。 - コンピュータを、請求項1ないし4のうちいずれか1項に記載の学習装置における各部として機能させるためのプログラム。
- コンピュータを、請求項5に記載の推定装置における異常度計算部として機能させるためのプログラム。
Priority Applications (1)
| Application Number | Priority Date | Filing Date | Title |
|---|---|---|---|
| US17/299,679 US20220036204A1 (en) | 2018-12-05 | 2019-12-02 | Learning apparatus, estimation apparatus, parameter calculation method and program |
Applications Claiming Priority (2)
| Application Number | Priority Date | Filing Date | Title |
|---|---|---|---|
| JP2018228516A JP7198064B2 (ja) | 2018-12-05 | 2018-12-05 | 学習装置、推定装置、パラメータ算出方法、及びプログラム |
| JP2018-228516 | 2018-12-05 |
Publications (1)
| Publication Number | Publication Date |
|---|---|
| WO2020116405A1 true WO2020116405A1 (ja) | 2020-06-11 |
Family
ID=70974208
Family Applications (1)
| Application Number | Title | Priority Date | Filing Date |
|---|---|---|---|
| PCT/JP2019/047093 Ceased WO2020116405A1 (ja) | 2018-12-05 | 2019-12-02 | 学習装置、推定装置、パラメータ算出方法、及びプログラム |
Country Status (3)
| Country | Link |
|---|---|
| US (1) | US20220036204A1 (ja) |
| JP (2) | JP7198064B2 (ja) |
| WO (1) | WO2020116405A1 (ja) |
Families Citing this family (2)
| Publication number | Priority date | Publication date | Assignee | Title |
|---|---|---|---|---|
| JP7532318B2 (ja) | 2021-07-01 | 2024-08-13 | 株式会社東芝 | 学習装置、方法およびプログラム |
| EP4343475B1 (en) * | 2022-09-22 | 2025-08-06 | Hitachi, Ltd. | Monitoring device, monitored system, method for monitoring and computer program product |
Citations (1)
| Publication number | Priority date | Publication date | Assignee | Title |
|---|---|---|---|---|
| JP2017102540A (ja) * | 2015-11-30 | 2017-06-08 | 日本電信電話株式会社 | 分類装置、方法、及びプログラム |
Family Cites Families (1)
| Publication number | Priority date | Publication date | Assignee | Title |
|---|---|---|---|---|
| JP3506068B2 (ja) * | 1999-09-29 | 2004-03-15 | 日本電気株式会社 | 外れ値度計算装置 |
-
2018
- 2018-12-05 JP JP2018228516A patent/JP7198064B2/ja active Active
-
2019
- 2019-12-02 US US17/299,679 patent/US20220036204A1/en not_active Abandoned
- 2019-12-02 WO PCT/JP2019/047093 patent/WO2020116405A1/ja not_active Ceased
-
2022
- 2022-09-26 JP JP2022152962A patent/JP2022174327A/ja active Pending
Patent Citations (1)
| Publication number | Priority date | Publication date | Assignee | Title |
|---|---|---|---|---|
| JP2017102540A (ja) * | 2015-11-30 | 2017-06-08 | 日本電信電話株式会社 | 分類装置、方法、及びプログラム |
Non-Patent Citations (1)
| Title |
|---|
| (KUWABARA, AKIYUKI: "A perceptron learning rule for locally improving the ROC curve", IEICE TECHNICAL REPORT, vol. 3, no. 483, 7 March 2012 (2012-03-07), pages 399 - 404 * |
Also Published As
| Publication number | Publication date |
|---|---|
| JP7198064B2 (ja) | 2022-12-28 |
| JP2020091661A (ja) | 2020-06-11 |
| US20220036204A1 (en) | 2022-02-03 |
| JP2022174327A (ja) | 2022-11-22 |
Similar Documents
| Publication | Publication Date | Title |
|---|---|---|
| Solus et al. | Consistency guarantees for greedy permutation-based causal inference algorithms | |
| EP4120138A1 (en) | System and method for molecular property prediction using hypergraph message passing neural network (hmpnn) | |
| US12136034B2 (en) | Dynamic gradient aggregation for training neural networks | |
| US12505376B2 (en) | Federated learning with only positive labels | |
| US20180174062A1 (en) | Root cause analysis for sequences of datacenter states | |
| US8121967B2 (en) | Structural data classification | |
| CN110705718A (zh) | 基于合作博弈的模型解释方法、装置、电子设备 | |
| Cai et al. | Selection of mixed copula model via penalized likelihood | |
| JP7306432B2 (ja) | 情報処理方法、情報処理装置及びプログラム | |
| US20210232931A1 (en) | Identifying adversarial attacks with advanced subset scanning | |
| US12307376B2 (en) | Training spectral inference neural networks using bilevel optimization | |
| US10885593B2 (en) | Hybrid classification system | |
| US20180174072A1 (en) | Method and system for predicting future states of a datacenter | |
| Guo et al. | Tight mutual information estimation with contrastive fenchel-legendre optimization | |
| JP2022174327A (ja) | 学習装置、推定装置、パラメータ算出方法、及びプログラム | |
| JP2013037471A (ja) | 確率モデル更新システム、確率モデル更新装置、確率モデル更新方法およびプログラム | |
| Wu et al. | Multiscale jump testing and estimation under complex temporal dynamics | |
| US20180176108A1 (en) | State information completion using context graphs | |
| JP7451606B2 (ja) | 学習システム及び学習方法 | |
| WO2020240770A1 (ja) | 学習装置、推定装置、学習方法、推定方法及びプログラム | |
| Reddy et al. | A new approach for bias–variance analysis using regularized linear regression | |
| US11656650B2 (en) | Model generation system, model generation method, and model generation program | |
| Maugis | Event conditional correlation: Or how non-linear linear dependence can be | |
| US9218486B2 (en) | System and method for operating point and box enumeration for interval bayesian detection | |
| US9530104B1 (en) | Scalable bootstrap method for assessing the quality of machine learning algorithms over massive time series |
Legal Events
| Date | Code | Title | Description |
|---|---|---|---|
| 121 | Ep: the epo has been informed by wipo that ep was designated in this application |
Ref document number: 19891980 Country of ref document: EP Kind code of ref document: A1 |
|
| NENP | Non-entry into the national phase |
Ref country code: DE |
|
| 122 | Ep: pct application non-entry in european phase |
Ref document number: 19891980 Country of ref document: EP Kind code of ref document: A1 |