WO2020066725A1 - データ処理装置、データ処理方法、及びプログラム - Google Patents
データ処理装置、データ処理方法、及びプログラム Download PDFInfo
- Publication number
- WO2020066725A1 WO2020066725A1 PCT/JP2019/036263 JP2019036263W WO2020066725A1 WO 2020066725 A1 WO2020066725 A1 WO 2020066725A1 JP 2019036263 W JP2019036263 W JP 2019036263W WO 2020066725 A1 WO2020066725 A1 WO 2020066725A1
- Authority
- WO
- WIPO (PCT)
- Prior art keywords
- data
- input
- auxiliary
- event
- prediction model
- Prior art date
- Legal status (The legal status is an assumption and is not a legal conclusion. Google has not performed a legal analysis and makes no representation as to the accuracy of the status listed.)
- Ceased
Links
Images







Classifications
-
- G—PHYSICS
- G06—COMPUTING OR CALCULATING; COUNTING
- G06N—COMPUTING ARRANGEMENTS BASED ON SPECIFIC COMPUTATIONAL MODELS
- G06N3/00—Computing arrangements based on biological models
- G06N3/02—Neural networks
- G06N3/08—Learning methods
-
- G—PHYSICS
- G06—COMPUTING OR CALCULATING; COUNTING
- G06N—COMPUTING ARRANGEMENTS BASED ON SPECIFIC COMPUTATIONAL MODELS
- G06N3/00—Computing arrangements based on biological models
- G06N3/02—Neural networks
- G06N3/04—Architecture, e.g. interconnection topology
- G06N3/044—Recurrent networks, e.g. Hopfield networks
-
- G—PHYSICS
- G06—COMPUTING OR CALCULATING; COUNTING
- G06N—COMPUTING ARRANGEMENTS BASED ON SPECIFIC COMPUTATIONAL MODELS
- G06N3/00—Computing arrangements based on biological models
- G06N3/02—Neural networks
- G06N3/04—Architecture, e.g. interconnection topology
- G06N3/045—Combinations of networks
- G06N3/0455—Auto-encoder networks; Encoder-decoder networks
-
- G—PHYSICS
- G06—COMPUTING OR CALCULATING; COUNTING
- G06N—COMPUTING ARRANGEMENTS BASED ON SPECIFIC COMPUTATIONAL MODELS
- G06N3/00—Computing arrangements based on biological models
- G06N3/02—Neural networks
- G06N3/04—Architecture, e.g. interconnection topology
- G06N3/049—Temporal neural networks, e.g. delay elements, oscillating neurons or pulsed inputs
-
- G—PHYSICS
- G06—COMPUTING OR CALCULATING; COUNTING
- G06N—COMPUTING ARRANGEMENTS BASED ON SPECIFIC COMPUTATIONAL MODELS
- G06N3/00—Computing arrangements based on biological models
- G06N3/02—Neural networks
- G06N3/04—Architecture, e.g. interconnection topology
- G06N3/0499—Feedforward networks
-
- G—PHYSICS
- G06—COMPUTING OR CALCULATING; COUNTING
- G06N—COMPUTING ARRANGEMENTS BASED ON SPECIFIC COMPUTATIONAL MODELS
- G06N3/00—Computing arrangements based on biological models
- G06N3/02—Neural networks
- G06N3/08—Learning methods
- G06N3/09—Supervised learning
Definitions
- the present invention relates to a technique for modeling a relationship between a plurality of events.
- Non-Patent Document 1 discloses an example of a technique for learning the relationship between two events. This method is effective for dense data such as images, but it is effective for learning when data including deficits such as measurement failure or measurement error such as medical health data is used as learning data. Can not do.
- Patent Literature 1 describes a method of learning about a time-series change of one event, but does not describe a method of learning a relationship between two events.
- the present invention has been made in view of the above circumstances, and provides a data processing device, a data processing method, and a program that can model a relationship between a plurality of events by using data including a defect as learning data. With the goal.
- the data processing device includes: first data relating to a first event; second data relating to a second event related to the first event; A first generating unit configured to generate first input data by combining first auxiliary data based on a data loss situation in at least one of the second data; and Based on an error according to the first auxiliary data between output data output from the prediction model when input and the first data and the second data, a model parameter of the prediction model is A learning unit for learning.
- the first generation unit includes: auxiliary data based on a data loss situation in the first data; and auxiliary data based on a data loss situation in the second data. And generating the first auxiliary data.
- the first generation unit calculates a data loss degree of each of the first data and the second data, and calculates a degree of loss of the first data and the second data.
- the data having a higher data loss degree is selected, and the first auxiliary data is generated based on a data loss state in the selected data.
- the first generation unit is configured to determine the first data based on a data loss situation in a predetermined one of the first data and the second data. Generate auxiliary data.
- the first generation unit is configured to determine a data loss situation in a predetermined one of the first data and the second data, Generating the first auxiliary data based on the temporal relationship with the second event.
- the prediction model is a neural network having an input layer, at least one hidden layer, and an output layer, wherein one of the at least one hidden layer is the first network.
- the data processing device comprises: third data relating to the first event, fourth data relating to the second event, the third data and the fourth data
- a second generating unit that generates second input data obtained by combining second auxiliary data based on a data loss situation in at least one of the first and second input data, and the learned model parameter sets the second input data.
- a prediction unit that inputs the predicted model thus obtained and obtains a predicted value for a loss included in at least one of the third data and the fourth data.
- the data processing device comprises: third data relating to the first event, fourth data relating to the second event, the third data and the fourth data
- a second generating unit that generates second input data obtained by combining second auxiliary data based on a data loss situation in at least one of the first and second input data, and the learned model parameter sets the second input data.
- a prediction unit that inputs the predicted model thus obtained to obtain data output from an intermediate layer of the predicted model.
- the calculation of the error is performed according to the first auxiliary data, so that the error is calculated excluding the influence of the data loss.
- the relationship between the two events can be learned using the data including the defect.
- the error is calculated excluding the influence of data loss in both the first data and the second data.
- the relationship between two events can be effectively learned.
- learning is performed with emphasis on data relating to an event having a higher importance.
- a model parameter that improves the prediction accuracy for data relating to the event with the higher importance.
- the relationship between the two events can be effectively learned.
- a predicted value corresponding to a data missing portion can be obtained. This makes it possible to correctly analyze medical health data by interpolating data including a defect such as medical health data with the obtained predicted value.
- the eighth aspect of the present invention it is possible to obtain a feature quantity representing a relationship between the first event and the second event.
- a data processing device a data processing method, and a program capable of modeling a relationship between a plurality of events by using data including a defect as learning data.
- FIG. 1 is a block diagram illustrating a data processing device according to an embodiment.
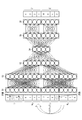
- FIG. 2 is a diagram illustrating a configuration example of a prediction model according to the embodiment.
- FIG. 3 is a diagram illustrating an example of a method for generating input data according to the embodiment.
- FIG. 4 is an exemplary view for explaining another example of the method for generating input data according to the embodiment.
- FIG. 5 is a flowchart showing a learning process according to the embodiment.
- FIG. 6 is a flowchart showing a prediction process according to the embodiment.
- FIG. 7 is a diagram illustrating a prediction process according to the embodiment.
- FIG. 8 is a diagram illustrating a prediction process according to the embodiment.
- FIG. 9 is a diagram illustrating a prediction process according to the embodiment.
- FIG. 1 is a block diagram illustrating a data processing device according to an embodiment.
- FIG. 2 is a diagram illustrating a configuration example of a prediction model according to the embodiment.
- FIG. 3 is
- FIG. 10 is a diagram illustrating a method for generating auxiliary data according to one embodiment.
- FIG. 11 is a diagram illustrating a method for generating auxiliary data according to one embodiment.
- FIG. 12 is a diagram illustrating an example of a method for generating input data when there are a plurality of types of biological indices according to an embodiment.
- FIG. 13 is a diagram illustrating another example of a method for generating input data when there are a plurality of types of biometric indices according to an embodiment.
- a data processing device uses a data related to a first event and a data related to a second event related to the first event to represent a model representing a relationship between the first event and the second event. To learn.
- This data processing device can perform effective learning even when data relating to the first event and data relating to the second event related to the first event include data loss.
- FIG. 1 schematically shows a data processing device 1 according to an embodiment of the present invention.
- the data processing device 1 is configured by a computer such as a personal computer, a smartphone, and a server, for example.
- the data processing device 1 includes an input / output interface unit 10, a control unit 20, and a storage unit 30.
- the data processing device 1 is mounted on a server and can communicate with an external device via a communication network NW such as the Internet.
- the input / output interface unit 10 has connectors such as a LAN (Local Area Network) port and a USB (Universal Serial Bus) port.
- the input / output interface unit 10 is connected to a communication network NW using, for example, a LAN cable, and transmits and receives data to and from an external device via the communication network NW. Further, the input / output interface unit 10 is connected to a display device and an input device via a USB cable, and transmits and receives data to and from the display device and the input device.
- the input / output interface unit 10 may include a wireless module such as a wireless LAN module or a Bluetooth (registered trademark) module.
- the control unit 20 includes a hardware processor such as a CPU (Central Processing Unit) and a program memory such as a ROM (Read Only Memory), and controls components including the input / output interface unit 10 and the storage unit 30.
- the control unit 20 functions as a data reception unit 21, an input data generation unit 22, a learning unit 23, a prediction unit 24, and an output control unit 25 by executing a program stored in a program memory by a hardware processor.
- the storage unit 30 uses a non-volatile memory that can be written and read at any time such as a hard disk drive (HDD) or a solid state drive (SSD) as a storage medium, and has a data storage unit 31 as a storage area.
- a model storage unit 32 is provided.
- the above-mentioned program may be stored in the storage unit 30 instead of the program memory of the control unit 20.
- the control unit 20 may download a program from an external device provided on the communication network NW via the input / output interface unit 10 and store the program in the storage unit 30.
- the control unit 20 may acquire a program from a portable storage medium such as a magnetic disk, an optical disk, or a semiconductor memory, and store the program in the storage unit 30.
- the data receiving unit 21 receives data on the user's health behavior and data on the user's biological index, and stores the received data in the data storage unit 31.
- data relating to the user's health behavior is referred to as health behavior data
- data relating to the user's biometric index is referred to as biometric index data.
- the user's health behavior is an example of a first event
- the biological index of the user is an example of a second event.
- the biological index is an index that indicates the health condition of a living body.
- the biological index includes, for example, blood pressure, pulse rate, heart rate, body weight, body fat percentage, blood sugar level, total cholesterol, triglyceride, uric acid level, and answers to hospital interviews (questionnaires).
- the biological index data may be obtained by measurement at home, or may be obtained by a test in a hospital (for example, a blood test or a urine test). Healthy behavior refers to behavior that affects biological indicators.
- the health behavior is, for example, the number of steps, sleep time, calorie intake, and the like.
- the health behavior data can be acquired using a wearable device such as a pedometer, for example.
- the health behavior data and the biometric index data are acquired every day.
- the biometric index data is obtained by an examination in a hospital
- the biometric index data is not obtained on a day when the user does not go to the hospital.
- data loss may occur in the health behavior data.
- data loss may occur in health behavior data due to reasons such as forgetting to measure.
- the data acquisition interval is not limited to one day, and may be, for example, one hour or one week.
- the input data generation unit 22 generates input data according to the design of the prediction model from the health behavior data and the biological index data stored in the data storage unit 31. Specifically, the input data generation unit 22 extracts health behavior data for a predetermined number of days from the health behavior data stored in the data storage unit 31, and extracts the health behavior data from the biometric index data stored in the data storage unit 31. Then, biometric index data for a predetermined number of days is extracted, and auxiliary data is generated based on the data missing status in the extracted health behavior data and biometric index data. The auxiliary data includes auxiliary data relating to health behavior data and auxiliary data relating to biometric index data. Subsequently, the input data generation unit 22 combines the extracted health behavior data, the extracted biometric index data, and the generated auxiliary data to generate input data.
- the input data generation unit 22 provides the generated input data to the learning unit 23.
- the input data generation unit 22 generates an input data set including a plurality of input data, and provides the generated input data set to the learning unit 23.
- the input data set may include input data including missing data and input data including no missing data.
- the input data generation unit 22 generates input data including data loss, and provides the generated input data to the prediction unit 24.
- the learning unit 23 learns the model parameters of the prediction model using the input data generated by the input data generation unit 22. More specifically, the learning unit 23 outputs the output data output from the prediction model when the input data generated by the input data generation unit 22 is input to the prediction model, and the health behavior data extracted by the input data generation unit 22. And learning the model parameters of the prediction model based on the error between the input data generation unit 22 and the biometric index data. For example, the learning unit 23 optimizes the model parameters so that the above error is minimized.
- the prediction unit 24 uses the learned prediction model (that is, the prediction model in which the model parameters learned by the learning unit 23 are set) to calculate a prediction value for a defect included in the input data generated by the input data generation unit 22. Get. Specifically, the prediction unit 24 inputs the input data to the learned prediction model, and obtains output data including a predicted value for the loss, output from the learned prediction model.
- the learned prediction model that is, the prediction model in which the model parameters learned by the learning unit 23 are set
- the output control unit 25 outputs the predicted value obtained by the prediction unit 24.
- the output control unit 25 transmits the predicted value to an external device (for example, a computer terminal used by a doctor) via the input / output interface unit 10.
- FIG. 2 schematically shows an example of the structure of the prediction model according to the present embodiment.
- the prediction model according to the present embodiment is a neural network including an input layer 51, four intermediate layers 52 to 55, and an output layer 56.
- the prediction model is composed of a network for restoring health behavior data and a network for restoring biometric index data by inputting health behavior data and biometric index data, and these networks are part of the intermediate layer (specifically, the intermediate layer). 54).
- the number of dimensions of the input layer 51 is 16, the number of dimensions of the intermediate layer 52 is 16, the number of dimensions of the intermediate layer 53 is 8, the number of dimensions of the intermediate layer 54 is 4, and the number of dimensions of the intermediate layer 55. Is 8, and the number of dimensions of the output layer 56 is 8.
- the prediction model is an auto encoder.
- the biometric index data is assigned to the first to fourth elements, and the auxiliary data relating to the biometric index data is assigned to the fifth to eighth elements.
- health behavior data is assigned to the ninth to twelfth elements, and auxiliary data relating to the health behavior data is assigned to the thirteenth to sixteenth elements.
- SEQ X represents health behavior data
- sequence Y represents biometric indicator data
- sequence W X represents the supplementary data on health behavior data
- sequence W Y represents the supplementary data related to biometric indicator data.
- Sequence W X is generated based on the data loss situation in health behavior data.
- the array WY is generated based on a data loss state in the biological index data.
- a value “1” indicates that there is data (non-loss), and a value “0” indicates that there is no data (loss).
- the symbol "-" shown in the input sequence represents a defect.
- a value such as “0” is assigned to the missing portion.
- Array W in which the second and fourth elements of array Y are missing, and correspondingly, the first and third elements are “1” and the second and fourth elements are “0” Y is generated. Furthermore, sequences and fourth elements deficient in X, the sequence W X which the third element from the first corresponding to a "1" is and fourth element is "0" is generated You.
- biometric index data is allocated to the first to fourth elements
- health behavior data is allocated to the fifth to eighth elements.
- Sequence Y ⁇ represents a biometric indicator data
- X ⁇ represents health behavior data.
- Z 1 an array of input layer 51, Z 2 the sequence of intermediate layer 52, the arrangement of the intermediate layer 53 Z 3, the arrangement of the intermediate layer 54 Z 4, the arrangement of the intermediate layer 55 Z 5, the sequence of the output layer 56 the expressed as Z 6.
- the arrays Z 1 to Z 6 are represented by the following formulas (1a) to (1f), respectively.
- Z 1 (z 1,1 z 1,2 z 1,3 z 1,4 ... Z 1,16 ) T (1a)
- Z 2 (z 2,1 z 2,2 z 2,3 z 2,4 ... Z 2,16 ) T (1b)
- Z 3 (z 3,1 z 3,2 z 3,3 z 3,4 ... Z 3,8 )
- Z 4 (z 4,1 z 4,2 z 4,3 z 4,4 ) T (1d)
- Z 5 (z 5,1 z 5,2 z 5,3 z 5,4 ... Z 5,8 ) T (1e)
- Z 6 (z 6,1 z 6,2 z 6,3 z 6,4 ... Z 6,8 ) T (1f)
- T indicates transposition.
- each layer is represented by a recurrence formula such as the following formula (2).
- Z i + 1 f i (A i Z i + B i ) (2)
- a i is a matrix of weight parameters
- B i is an array of bias parameters
- f i represents an activation function.
- the activation functions f 1 , f 3 , f 4 , f 5 are linear combinations (simple perceptrons) as in the following equation (3a), and the activation function f 2 is the following equation (3b) And ReLU (ramp function).
- f 2 (x) max (0, x) (3b)
- Sequence Z 6 of the output layer 56 is expressed by the following equation (4).
- the learning unit 23 learns the model parameters by the gradient method so that the error L calculated based on the error function shown in the following equation (5) is minimized.
- a stochastic gradient descent method such as Adam, SGD, and AdaDelta can be used.
- other methods may be used.
- the layer configuration, the size, and the activation function are not limited to the above-described example.
- the activation function may be a step function, a sigmoid function, a polynomial, an absolute value, a maxout, a soft sign, a soft plus, and the like.
- the prediction model is not limited to the feedforward neural network as shown in FIG. 2, but may be a recurrent neural network represented by Long @ short-term @ memory (LSTM).
- the middle layer 54 has four nodes affected by both the health behavior data and the biometric index data.
- the middle layer 54 may be one or more (eg, four) nodes affected by the biometric data but not affected by the health behavior data and / or affected by the health behavior data but affected by the biometric data. It may further have no more than one (eg four) nodes.
- the nodes affected by the biometric index data but not affected by the health behavior data are, for example, nodes connected to only the upper four nodes of the intermediate layer 53 on the input side.
- the nodes affected by the health behavior data but not affected by the biometric index data are, for example, nodes connected to only the lower four nodes of the intermediate layer 53 on the input side.
- the outputs of these nodes may be connected, for example, to the nodes of the middle layer 55 shown in FIG.
- the outputs of these nodes that can be added to the middle layer 54 are among the nodes shown in FIG.
- Output only to the nodes that affect the array of restored biometric indices, and outputs of nodes that are affected by the health behavior data but not affected by the biometric index data are output only to nodes that affect the restored array of health behaviors Or outputs the output of the node affected only by the biometric index data only to the node affecting the array of the restored health behavior, so that the relationship between the input and the output is crossed.
- the output of the node affected only by the data may be output only to the node affecting the array of the restored biometric indices.
- the middle layer 55 may have additional nodes (not shown in FIG. 2), and the outputs of those nodes that may be added to the middle layer 54 may be connected to further nodes of the middle layer 55. Additional nodes of the middle layer 55 may or may not be connected to the four nodes of the middle layer 54 shown in FIG. By adding these nodes to the intermediate layer 54, the accuracy of data prediction using the prediction model can be improved.
- FIG. 3 shows the biometric index data and the health behavior data stored in the data storage unit 31 and the learning input data generated based on the biometric index data and the health behavior data.
- the biological index data is time-series data of measured values of blood pressure (systolic blood pressure)
- the health behavior data is time-series data of measured values of steps.
- the biometric index data the data on June 25, June 30, and July 5 are missing.
- the health behavior data the data on June 24 and June 28 are missing.
- the input data generation unit 22 generates input data by dividing the data into data for four days. Specifically, the input data generation unit 22 generates input data from data from June 22 to June 25, generates input data from data from June 26 to June 29, A plurality of input data is generated by, for example, generating input data from the data from June 30 to July 3.
- NA indicates a defect.
- a value “0” is assigned to a missing portion (element corresponding to the missing). Instead of the value “0”, a value such as an average value or a median value may be substituted for the missing part.
- the input data generation unit 22 may generate input data by extracting data for four days while shifting one day at a time. Specifically, one input data is generated from the data for four days from June 22 to June 25, and one input data is generated from the data for four days from June 23 to June 26. A large number of input data may be generated by generating data and generating one input data from data for four days from June 24 to June 27.
- Part or all of the functions of the data processing device 1 may be realized by a hardware circuit such as an ASIC (Application Specific Integrated Circuit) or an FPGA (Field-Programmable Gate Array).
- the storage unit 30 does not include at least one of the data storage unit 31 and the model storage unit 32, and at least one of the data storage unit 31 and the model storage unit 32 is provided in, for example, a storage device on the communication network NW. Is also good.
- both the learning device that performs the learning process and the prediction device that performs the prediction process are provided in the data processing device 1.
- the learning device and the prediction device may be realized as separate devices.
- FIG. 5 illustrates a learning process performed by the data processing device 1 illustrated in FIG.
- the data receiving unit 21 acquires learning health behavior data and biometric index data from an external device via the input / output interface unit 10 (step S101). For example, the data receiving unit 21 acquires health behavior data and biometric index data recorded over a long period as shown in FIG.
- the input data generation unit 22 generates input data based on the health behavior data and the biological index data acquired by the data reception unit 21 (Step S102). Specifically, the input data generation unit 22 extracts the health behavior data and the biometric index data for the number of days corresponding to the input dimension of the prediction model from the health behavior data and the biometric index data acquired by the data reception unit 21. Then, auxiliary data is generated based on the missing data in the extracted health behavior data and biometric index data, and input data is generated by combining the extracted health behavior data and biometric index data with the generated auxiliary data. By repeating this process, a plurality of input data are generated. For example, input data (input 1, input 2,%) As shown in FIG. 3 is generated.
- the learning unit 23 initializes the model parameters of the prediction model (Step S103).
- the model parameters are weight parameters (specifically, matrices A 1 , A 2 , A 3 , A 4 , A 5 ) and bias parameters (specifically, arrays B 1 , B 2 , B 3 , B 4 , B 5) )including.
- the learning unit 23 substitutes random values for the weight parameter and the bias parameter.
- the learning unit 23 learns model parameters of the prediction model using the input data generated by the input data generation unit 22 (Steps S104 to S106).
- the learning unit 23 acquires output data output from the prediction model when each input data is input to the prediction model.
- the learning unit 23 calculates an error between the health behavior data and the biometric index data included in the input data and the output data according to the auxiliary data generated by the input data generation unit 22 (Step S104).
- the error is calculated, for example, according to the error function shown in the above equation (5).
- the learning unit 23 determines whether the error gradient has converged (step S105). If the gradient of the error has not converged, the learning unit 23 updates the model parameters according to the gradient method (Step S106). Then, the learning unit 23 calculates an error using the prediction model having the updated model parameters (Step S104).
- the learning unit 23 determines the current model parameter as a model parameter used for prediction (step S107) and stores it in the model storage unit 32.
- FIG. 6 illustrates an estimation process performed by the data processing device 1 illustrated in FIG.
- step S201 of FIG. 6 the data receiving unit 21 acquires health behavior data and biometric index data for prediction processing from an external device via the input / output interface unit 10.
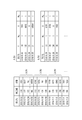
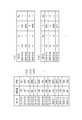
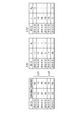
- FIG. 7A shows an example of health behavior data and biometric index data for the prediction process. In the example of FIG. 7A, a part of the health behavior data is missing.
- the input data generation unit 22 generates input data based on the health behavior data and the biometric index data acquired by the data reception unit 21. Specifically, the input data generation unit 22 generates auxiliary data relating to the health behavior data based on the data loss status in the health behavior data, and generates auxiliary data relating to the biometric index data based on the data loss status in the biometric index data. Generate For example, the auxiliary data (arrays W X and W Y ) shown in FIG. 7B is generated based on the health behavior data (array X) and the biological index data (array Y) shown in FIG. 7A. .
- the input data generation unit 22 combines the generated auxiliary data with the health behavior data and the biometric index data acquired by the data reception unit 21 to generate input data.
- the input data shown in FIG. 7C is obtained by combining the health behavior data and the biometric index data shown in FIG. 7A with the auxiliary data shown in FIG. 7B.
- step S203 of FIG. 6 the prediction unit 24 reads the model parameters from the model storage unit 32, sets the read model parameters in the prediction model, and inputs the input data generated by the input data generation unit 22 to the prediction model. . Thereby, the prediction unit 24 obtains output data in which the missing part is interpolated with the predicted value. For example, the output data shown in FIG. 7D is obtained by inputting the input data shown in FIG. 7C to the prediction model.
- step S204 of FIG. 6 the output control unit 25 outputs the output data obtained by the prediction unit 24 as a prediction result.
- the in the portion other than the defect there is a difference occurs between the sequence Y ⁇ and between sequences Y with sequence X ⁇ and sequence X.
- a first element of the array Y is a 132
- SEQ Y first element of ⁇ has become 131.
- the output control unit 25 may output, as a prediction result, a result obtained by substituting the predicted value corresponding to the defect into the biological index data acquired by the data receiving unit 21.
- the learning processing illustrated in FIG. 5 and the prediction processing illustrated in FIG. 6 are merely examples, and the processing procedure or the content of each processing can be appropriately changed.
- the prediction unit 24 may acquire the data output from the intermediate layer 54 of the predictive model (sequence Z 4).
- This data represents an abstracted feature representing the relationship between the health behavior and the biological index.
- This data can be used as an input of a learning device different from the prediction model.
- a classifier such as logistic regression, a support vector machine, or a random forest, or a regression model using a multiple regression analysis or a regression tree can be used.
- the data processing device 1 generates input data in which health behavior data, biometric index data, and auxiliary data based on a data deficiency state in the health behavior data and the biometric index data are generated, and the auxiliary data Calculated according to the model parameters of the prediction model so as to minimize the error between the output data output from the prediction model when the input data is input to the prediction model and the health behavior data and the biological index data.
- the error is calculated excluding the effect of data loss.
- the model parameters of the prediction model that models the relationship between the health behavior data and the biological index data can be effectively learned using the data including the defect.
- the data processing device 1 uses the prediction model in which the model parameters learned as described above are set, and calculates the predicted value for the deficiency included in at least one of the health behavior data and the biological index data. Will be able to gain.
- the prediction process can be used for purposes other than predicting a value for a loss caused by a measurement failure or the like.
- temporary data for example, data indicating a desired temporal change in blood pressure
- the prediction process makes it possible to set goals for health behavior.
- the auxiliary data is generated based on the data loss status in both the health behavior data and the biological index data.
- the method for generating the auxiliary data is not limited to the method described in the above embodiment.
- the auxiliary data may be generated based on a data loss situation in one of the health behavior data and the biometric index data.
- the biological index data is acquired by a test in a hospital
- the health behavior data is acquired by a wearable device.
- the biometric index data is acquired only when the user goes to the hospital.
- the ratio of the deficiency of the biometric index data becomes larger than that of the health behavior data.
- Such a bias of loss may cause errors in the analysis results of the health index data and the health behavior data.
- the input data generation unit 22 calculates the degree of loss for each of the health behavior data and the biological index data, and selects the data with the higher degree of loss from the health behavior data and the biological index data.
- the auxiliary data may be generated based on the data loss status of the data.
- the degree of loss is the number of elements whose value is zero in the array.
- the loss degree may be, for example, a ratio of the number of elements whose value is zero to the number of elements of the array.
- the degree of loss of the biometric index data is 2, and the degree of loss of the health behavior data is 1.
- the input data generation unit 22 generates auxiliary data (array W Y ) related to the biometric index data based on the data loss status in the biometric index data having a higher degree of deficiency, and duplicates the auxiliary data related to the biometric index data to be healthy. to generate the auxiliary data related to behavioral data (array W X). That is, the auxiliary data relating to the health behavior data is set to be the same as the auxiliary data relating to the biological index data.
- the evaluation function is represented by the following equation (6).
- the relationship between the health behavior and the biometric index can be effectively learned.
- the input data generation unit 22 generates auxiliary data based on a data deficiency state in one of the health behavior data and the biometric index data, which is selected based on the importance of each of the health behavior and the biometric index. May do it.
- the importance of each of the health behavior and the biological index may be set by an operator such as a doctor, for example.
- the input data generation unit 22 when the importance of the biometric index is higher than the importance of the health behavior, the input data generation unit 22 generates auxiliary data (array W Y ) related to the biometric index data based on the data loss status in the biometric index data, and
- the auxiliary data (array W X ) regarding the health behavior data is generated by duplicating the auxiliary data regarding the index data.
- the evaluation function is represented by the above equation (6).
- learning is performed with emphasis on data having higher importance.
- the relationship between health behavior and biometric indicators may be offset in the time direction. For example, there may be a time difference from when a healthy behavior is taken to when its effect is reflected in a biological index. In other words, the result of the last health action may not be immediately reflected in the biometric index, and the biometric index may have an effect after a certain period of time.
- the temporal relationship between health behavior and biometric indicators is considered.
- the input data generation unit 22 generates auxiliary data (array W X ) related to the behavior index data based on the data deficiency status in the health behavior data, and associates the auxiliary data related to the health behavior data with the above temporal relationship.
- the auxiliary data (array W Y ) related to the biological index data is generated.
- a step in which the effect of the health behavior appears on the biological index is set.
- a step corresponds to a time difference between elements in the input array.
- a case is considered where the effect of the health behavior appears on the biological index with a delay of one day (one step).
- the elements of the array are arranged in order of date. As shown in FIG.
- W Y (1 0 1 0) T .
- the evaluation function is represented by the following equation (7).
- the relationship between the health behavior and the biological index can be more accurately modeled.
- the data processing device 1 can also learn the relationship between three or more events.
- the array X is generated by extracting biometric index data for a predetermined number of days for each of the two types of biometric indices. .
- biometric index data for three days is extracted.
- three days' worth of data is also extracted from the health behavior data. Note that, as described with reference to FIG. 4, data may be extracted by shifting one day at a time.
- a plurality of types of data may be assigned to respective input channels and input. This is realized by a general method used when inputting image data to a neural network when one pixel has three pieces of information as in an RGB image.
- time-series data is handled.
- data other than time-series data For example, temperature data recorded for each observation point may be handled, or image data may be handled.
- input data is generated by extracting information for each row and combining them in the same manner as when there are multiple types of data. May be.
- the present invention is not limited to the above-described embodiment as it is, and can be embodied by modifying constituent elements in an implementation stage without departing from the scope of the invention.
- Various inventions can be formed by appropriately combining a plurality of constituent elements disclosed in the above embodiments. For example, some components may be deleted from all the components shown in the embodiment. Further, components of different embodiments may be appropriately combined.
Landscapes
- Engineering & Computer Science (AREA)
- Theoretical Computer Science (AREA)
- Physics & Mathematics (AREA)
- Data Mining & Analysis (AREA)
- General Health & Medical Sciences (AREA)
- Biomedical Technology (AREA)
- Biophysics (AREA)
- Computational Linguistics (AREA)
- Life Sciences & Earth Sciences (AREA)
- Evolutionary Computation (AREA)
- Artificial Intelligence (AREA)
- Molecular Biology (AREA)
- Computing Systems (AREA)
- General Engineering & Computer Science (AREA)
- General Physics & Mathematics (AREA)
- Mathematical Physics (AREA)
- Software Systems (AREA)
- Health & Medical Sciences (AREA)
- Measuring And Recording Apparatus For Diagnosis (AREA)
Abstract
本発明の第1の態様に係るデータ処理装置は、第1の事象に関する第1のデータと、前記第1の事象と関係する第2の事象に関する第2のデータと、前記第1のデータ及び前記第2のデータの少なくとも一方におけるデータ欠損状況に基づいた第1の補助データと、を結合した第1の入力データを生成する第1の生成部と、前記第1の入力データを予測モデルに入力したときに前記予測モデルから出力される出力データと前記第1のデータ及び前記第2のデータとの間の前記第1の補助データに応じた誤差に基づいて、前記予測モデルのモデルパラメータを学習する学習部と、を備える。
Description
本発明は、複数の事象の関係をモデル化する技術に関する。
例えば、1日の歩数などの健康行動についての目標を設定するために、健康行動の時系列変化と健康診断又は病院での検査で得られる検査値の時系列変化との間の関係をモデル化することが求められている。
非特許文献1には、2つの事象の関係性を学習する手法の一例が開示されている。この手法は画像のように密なデータに対しては有効であるが、例えば医療健康データのように計測忘れや計測ミスなどによる欠損を含むデータを学習データとして用いる場合には効果的に学習することができない。
ところで、欠損を含むデータを用いて学習を行う方法としては、特許文献1に開示された手法がある。特許文献1には、1つの事象の時系列変化について学習を行う手法が記載されているが、2つの事象の関係性を学習する手法については記載されていない。
鈴木雅大、松尾豊、「深層生成モデルを用いたマルチモーダル学習」、The 30th Annual Conference of the Japanese Society for Artificial Intelligence, 2016
欠損を含むデータを用いて2つ又は3つ以上の事象間の関係をモデル化できる技術が求められている。
本発明は、上記の事情に着目してなされたものであり、欠損を含むデータを学習データとして用いて複数の事象の関係をモデル化できるデータ処理装置、データ処理方法、及びプログラムを提供することを目的とする。
本発明の第1の態様では、データ処理装置は、第1の事象に関する第1のデータと、前記第1の事象と関係する第2の事象に関する第2のデータと、前記第1のデータ及び前記第2のデータの少なくとも一方におけるデータ欠損状況に基づいた第1の補助データと、を結合した第1の入力データを生成する第1の生成部と、前記第1の入力データを予測モデルに入力したときに前記予測モデルから出力される出力データと前記第1のデータ及び前記第2のデータとの間の前記第1の補助データに応じた誤差に基づいて、前記予測モデルのモデルパラメータを学習する学習部と、を備える。
本発明の第2の態様では、前記第1の生成部は、前記第1のデータにおけるデータ欠損状況に基づいた補助データと、前記第2のデータにおけるデータ欠損状況に基づいた補助データと、を含む前記第1の補助データを生成する。
本発明の第3の態様では、前記第1の生成部は、前記第1のデータ及び前記第2のデータのそれぞれのデータ欠損度合いを算出し、前記第1のデータ及び前記第2のデータのうち、前記データ欠損度合いが高い方のデータを選択し、前記選択されたデータにおけるデータ欠損状況に基づいて、前記第1の補助データを生成する。
本発明の第4の態様では、前記第1の生成部は、前記第1のデータ及び前記第2のデータのうちの予め決定された方のデータにおけるデータ欠損状況に基づいて、前記第1の補助データを生成する。
本発明の第5の態様では、前記第1の生成部は、前記第1のデータ及び前記第2のデータのうちの予め決定された方のデータにおけるデータ欠損状況と、前記第1の事象と前記第2の事象との間の時間的関係と、に基づいて、前記第1の補助データを生成する。
本発明の第6の態様では、前記予測モデルは、入力層、少なくとも1つの中間層、及び出力層を有するニューラルネットワークであり、前記少なくとも1つの中間層のうちの1つは、前記第1のデータ及び前記第2のデータの両方の影響を受けるノードと、前記第1のデータの影響を受けるが前記第2のデータの影響を受けないノード及び前記第2のデータの影響を受けるが前記第1のデータの影響を受けないノードの少なくとも一方と、を有する。
本発明の第7の態様では、前記データ処理装置は、前記第1の事象に関する第3のデータと、前記第2の事象に関する第4のデータと、前記第3のデータ及び前記第4のデータの少なくとも一方におけるデータ欠損状況に基づいた第2の補助データと、を結合した第2の入力データを生成する第2の生成部と、前記第2の入力データを前記学習されたモデルパラメータが設定された前記予測モデルに入力して、前記第3のデータ及び前記第4のデータの少なくとも一方に含まれる欠損に対する予測値を得る予測部と、をさらに備える。
本発明の第8の態様では、前記データ処理装置は、前記第1の事象に関する第3のデータと、前記第2の事象に関する第4のデータと、前記第3のデータ及び前記第4のデータの少なくとも一方におけるデータ欠損状況に基づいた第2の補助データと、を結合した第2の入力データを生成する第2の生成部と、前記第2の入力データを前記学習されたモデルパラメータが設定された前記予測モデルに入力して、前記予測モデルの中間層から出力されるデータを得る予測部と、をさらに備える。
本発明の第1の態様によれば、誤差の算出が第1の補助データに応じて行われるので、データ欠損の影響を除外して誤差が算出される。これにより、欠損を含むデータを用いて2つの事象の関係を学習することができる。
本発明の第2の態様によれば、第1のデータ及び第2のデータの両方におけるデータ欠損の影響を除外して誤差が算出される。これにより、欠損を含むデータを用いて2つの事象の関係を効果的に学習することができる。
本発明の第3の態様によれば、例えば第1のデータと第2のデータとの間で欠損データ数に偏りがある場合において、2つの事象の関係を効果的に学習することができる。
本発明の第4の態様によれば、例えば重要度の高い方の事象に関するデータを重視して学習が行われる。これにより、重要度の高い方の事象に関するデータに対する予測精度を向上するモデルパラメータを得ることができる。
本発明の第5の態様によれば、例えば第1の事象と第2の事象との間での時間方向のズレがある場合において、2つの事象の関係を効果的に学習することができる。
本発明の第6の態様によれば、予測精度の高い予測モデルを提供することが可能になる。
本発明の第7の態様によれば、データ欠損部分に対応する予測値が得られる。これにより、医療健康データのような欠損を含むデータを、得られた予測値で補間することで、医療健康データに対する解析を正しく行えるようになる。
本発明の第8の態様によれば、第1の事象と第2の事象との関係を表す特徴量を得ることができる。
すなわち、本発明によれば、欠損を含むデータを学習データとして用いて複数の事象の関係をモデル化できるデータ処理装置、データ処理方法、及びプログラムを提供することができる。
以下、図面を参照しながら本発明の実施形態を説明する。実施形態に係るデータ処理装置は、第1の事象に関するデータ及び第1の事象と関係する第2の事象に関するデータを用いて、第1の事象と第2の事象との間の関係を表すモデルを学習する。このデータ処理装置は、第1の事象に関するデータ及び第1の事象と関係する第2の事象に関するデータがデータ欠損を含む場合にも、効果的な学習を行うことができる。
<一実施形態>
[構成]
図1は、本発明の一実施形態にデータ処理装置1を概略的に示している。データ処理装置1は、例えば、パーソナルコンピュータ、スマートフォン、サーバなどのコンピュータで構成される。図1の例では、データ処理装置1は、入出力インタフェースユニット10、制御ユニット20、及び記憶ユニット30を備える。
[構成]
図1は、本発明の一実施形態にデータ処理装置1を概略的に示している。データ処理装置1は、例えば、パーソナルコンピュータ、スマートフォン、サーバなどのコンピュータで構成される。図1の例では、データ処理装置1は、入出力インタフェースユニット10、制御ユニット20、及び記憶ユニット30を備える。
本実施形態では、データ処理装置1は、サーバに実装されており、インターネットなどの通信ネットワークNWを介して外部の装置と通信可能であるものとする。
入出力インタフェースユニット10は、例えばLAN(Local Area Network)ポート及びUSB(Universal Serial Bus)ポートなどのコネクタを有する。入出力インタフェースユニット10は、例えばLANケーブルを用いて通信ネットワークNWに接続され、通信ネットワークNWを介して外部の装置との間でデータを送受信する。さらに、入出力インタフェースユニット10は、USBケーブルで表示デバイス及び入力デバイスに接続され、表示デバイス及び入力デバイスとの間でデータを送受信する。なお、入出力インタフェースユニット10は、例えば無線LANモジュール又はBluetooth(登録商標)モジュールなどの無線モジュールを備えてよい。
制御ユニット20は、CPU(Central Processing Unit)などのハードウェアプロセッサ、及びROM(Read Only Memory)などのプログラムメモリを備え、入出力インタフェースユニット10と記憶ユニット30とを含む構成要素を制御する。制御ユニット20は、ハードウェアプロセッサでプログラムメモリに格納されたプログラムを実行することにより、データ受付部21、入力データ生成部22、学習部23、予測部24、及び出力制御部25として機能する。
記憶ユニット30は、記憶媒体として例えばHDD(Hard Disk Drive)又はSSD(Solid State Drive)などの随時書込及び読み出しが可能な不揮発性メモリを用いたものであり、記憶領域としてデータ記憶部31及びモデル記憶部32を備える。
上記プログラムは、制御ユニット20のプログラムメモリに代えて、記憶ユニット30に格納されていてもよい。一例では、制御ユニット20は、入出力インタフェースユニット10を介して、通信ネットワークNW上に設けられた外部装置からプログラムをダウンロードし、プログラムを記憶ユニット30に格納してよい。他の例では、制御ユニット20は、磁気ディスク、光ディスク、又は半導体メモリなどの可搬記憶媒体からプログラムを取得し、プログラムを記憶ユニット30に格納してよい。
データ受付部21は、ユーザの健康行動に関するデータ及びユーザの生体指標に関するデータを受け付け、受け付けたデータをデータ記憶部31に記憶させる。以下では、ユーザの健康行動に関するデータを健康行動データと称し、ユーザの生体指標に関するデータを生体指標データと称する。ユーザの健康行動が第1の事象の一例であり、ユーザの生体指標が第2の事象の一例である。
生体指標は、生体の健康状態を表す指標を指す。生体指標は、例えば、血圧、脈拍数、心拍数、体重、体脂肪率、血糖値、総コレステロール、中性脂肪、尿酸値、病院での問診(アンケート)に対する回答などである。生体指標データは、家庭での計測により取得されたものでもよく、病院での検査(例えば血液検査又は尿検査)により取得されたものであってもよい。健康行動は、生体指標に影響を与える行動を指す。健康行動は、例えば、歩数、睡眠時間、摂取カロリーなどである。健康行動データは、例えば、歩数計などのウェアラブルデバイスを用いて取得することができる。
本実施形態では、健康行動データ及び生体指標データが1日毎に取得されるものとする。ただし、例えば、生体指標データが病院での検査で取得されるものである場合、ユーザが通院しない日には生体指標データが取得されない。このような理由により健康行動データにデータ欠損が発生することがある。また、健康行動データについても、計測忘れなどの理由によりデータ欠損が発生することがある。なお、データ取得の間隔は、1日に限らず、例えば、1時間又は1週間などであってよい。
入力データ生成部22は、データ記憶部31に記憶されている健康行動データ及び生体指標データから、予測モデルの設計に応じた入力データを生成する。具体的には、入力データ生成部22は、データ記憶部31に記憶されている健康行動データから、所定日数分の健康行動データを抽出し、データ記憶部31に記憶されている生体指標データから、所定日数分の生体指標データを抽出し、抽出した健康行動データ及び生体指標データにおけるデータ欠損状況に基づいて補助データを生成する。補助データは、健康行動データに関する補助データと、生体指標データに関する補助データと、を有する。続いて、入力データ生成部22は、抽出した健康行動データと、抽出した生体指標データと、生成した補助データと、を結合して、入力データを生成する。
予測モデルのモデルパラメータを学習する段階では、入力データ生成部22は、生成した入力データを学習部23に与える。典型的には、入力データ生成部22は、複数の入力データからなる入力データセットを生成し、生成した入力データセットを学習部23に与える。入力データセットは、欠損を含む入力データと、欠損の無い入力データと、を含み得る。予測モデルを用いた予測を行う段階では、入力データ生成部22は、データ欠損を含む入力データを生成し、生成した入力データを予測部24に与える。
学習部23は、入力データ生成部22により生成された入力データを用いて予測モデルのモデルパラメータを学習する。具体的には、学習部23は、入力データ生成部22により生成された入力データを予測モデルに入力したときに予測モデルから出力される出力データと入力データ生成部22により抽出された健康行動データ及び生体指標データとの間における、入力データ生成部22により生成された補助データに応じた誤差に基づいて、予測モデルのモデルパラメータを学習する。例えば、学習部23は、上記の誤差が最小になるように、モデルパラメータを最適化する。
予測部24は、学習済み予測モデル(すなわち学習部23によって学習されたモデルパラメータが設定された予測モデル)を使用して、入力データ生成部22により生成された入力データに含まれる欠損に対する予測値を得る。具体的には、予測部24は、入力データを学習済み予測モデルに入力し、学習済み予測モデルから出力された、欠損に対する予測値を含む出力データを取得する。
出力制御部25は、予測部24により取得された予測値を出力する。例えば、出力制御部25は、入出力インタフェースユニット10を介して外部の装置(例えば医師が使用するコンピュータ端末)に予測値を送信する。
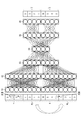
図2は、本実施形態に係る予測モデルの構造例を概略的に示している。図2に示すように、本実施形態に係る予測モデルは、入力層51、4つの中間層52~55、及び出力層56を備えるニューラルネットワークである。予測モデルは、健康行動データ及び生体指標データを入力とし、健康行動データを復元するネットワークと生体指標データを復元するネットワークで構成され、これらのネットワークは中間層の一部(具体的には中間層54)を共有する。
入力層51の次元数は16であり、中間層52の次元数は16であり、中間層53の次元数は8であり、中間層54の次元数は4であり、中間層55の次元数は8であり、出力層56の次元数は8である。図2の例では、予測モデルは、オートエンコーダである。
入力データを要素数が16の配列(16行1列の行列)で表すと、第1から第4の要素に生体指標データが割り当てられ、第5から第8の要素に生体指標データに関する補助データが割り当てられ、第9から第12の要素に健康行動データが割り当てられ、第13から第16の要素に健康行動データに関する補助データが割り当てられる。図2において、配列Xは健康行動データを表し、配列Yは生体指標データを表し、配列WXは健康行動データに関する補助データを表し、配列WYは生体指標データに関する補助データを表す。
配列WXは、健康行動データにおけるデータ欠損状況に基づいて生成される。配列WYは、生体指標データにおけるデータ欠損状況に基づいて生成される。補助データにおいて、値「1」は、データがあること(非欠損)を示し、値「0」は、データがないこと(欠損)を示す。入力用の配列に示された記号「-」は欠損を表す。実際の配列では、欠損部分には例えば「0」などの値が代入される。配列Yの第2及び第4の要素が欠損しており、これに対応して第1及び第3の要素が「1」であり且つ第2及び第4の要素が「0」である配列WYが生成される。さらに、配列Xの第4の要素が欠損しており、これに対応して第1から第3の要素が「1」であり且つ第4の要素が「0」である配列WXが生成される。
出力データを要素数が8の配列(8行1列の行列)で表すと、第1から第4の要素に生体指標データが割り当てられ、第5から第8の要素に健康行動データが割り当てられる。配列Y~が生体指標データを表し、X~が健康行動データを表す。
入力層51の配列をZ1、中間層52の配列をZ2、中間層53の配列をZ3、中間層54の配列をZ4、中間層55の配列をZ5、出力層56の配列をZ6と表す。配列Z1~Z6はそれぞれ、以下の式(1a)~(1f)のように表される。
Z1=(z1,1 z1,2 z1,3 z1,4 ・・・ z1,16)T …(1a)
Z2=(z2,1 z2,2 z2,3 z2,4 ・・・ z2,16)T …(1b)
Z3=(z3,1 z3,2 z3,3 z3,4 ・・・ z3,8)T …(1c)
Z4=(z4,1 z4,2 z4,3 z4,4)T …(1d)
Z5=(z5,1 z5,2 z5,3 z5,4 ・・・ z5,8)T …(1e)
Z6=(z6,1 z6,2 z6,3 z6,4 ・・・ z6,8)T …(1f)
ここで、上付きの「T」は転置を表す。
Z2=(z2,1 z2,2 z2,3 z2,4 ・・・ z2,16)T …(1b)
Z3=(z3,1 z3,2 z3,3 z3,4 ・・・ z3,8)T …(1c)
Z4=(z4,1 z4,2 z4,3 z4,4)T …(1d)
Z5=(z5,1 z5,2 z5,3 z5,4 ・・・ z5,8)T …(1e)
Z6=(z6,1 z6,2 z6,3 z6,4 ・・・ z6,8)T …(1f)
ここで、上付きの「T」は転置を表す。
また、各層の配列は、以下の式(2)のような漸化式で表される。
Zi+1=fi(AiZi+Bi) …(2)
ここで、Aiは重みパラメータの行列であり、Biはバイアスパラメータの配列であり、fiは活性化関数を表す。
Zi+1=fi(AiZi+Bi) …(2)
ここで、Aiは重みパラメータの行列であり、Biはバイアスパラメータの配列であり、fiは活性化関数を表す。
一例として、活性化関数f1、f3、f4、f5は、以下の式(3a)のように線形結合(単純パーセプトロン)であり、活性化関数f2は、以下の式(3b)のようにReLU(ランプ関数)である。
f1(x)=f3(x)=f4(x)=f5(x)=x …(3a)
f2(x)=max(0,x) …(3b)
出力層56の配列Z6は、以下の式(4)のように表される。
f1(x)=f3(x)=f4(x)=f5(x)=x …(3a)
f2(x)=max(0,x) …(3b)
出力層56の配列Z6は、以下の式(4)のように表される。
Z6=f5(A5(f4(A4(f3(A3(f2(A2(f1(A1X1+B1))+B2))+B3))+B4))+B5) …(4)
本実施形態では、学習部23は、下記の式(5)に示す誤差関数に基づいて算出される誤差Lが最小になるように、勾配法でモデルパラメータを学習する。
本実施形態では、学習部23は、下記の式(5)に示す誤差関数に基づいて算出される誤差Lが最小になるように、勾配法でモデルパラメータを学習する。

式(5)において、「・」は行列の内積を表す。配列X、Y、WX、WY、X~、Y~は、以下のように表される。
X=(z1,9 z1,10 z1,11 z1,12)T
Y=(z1,1 z1,2 z1,3 z1,4)T
WX=(z1,13 z1,14 z1,15 z1,16)T
WY=(z1,5 z1,6 z1,7 z1,8)T
X~=(z6,5 z6,6 z6,7 z6,8)T
Y~=(z6,1 z6,2 z6,3 z6,4)T
式(5)に示すように、誤差関数には、データ欠損状況を表す配列WX、WYが導入される。これにより、欠損部分に代入した値は誤差Lに加味されないようになる。言い換えると、欠損の無い部分で誤差Lが算出される。
X=(z1,9 z1,10 z1,11 z1,12)T
Y=(z1,1 z1,2 z1,3 z1,4)T
WX=(z1,13 z1,14 z1,15 z1,16)T
WY=(z1,5 z1,6 z1,7 z1,8)T
X~=(z6,5 z6,6 z6,7 z6,8)T
Y~=(z6,1 z6,2 z6,3 z6,4)T
式(5)に示すように、誤差関数には、データ欠損状況を表す配列WX、WYが導入される。これにより、欠損部分に代入した値は誤差Lに加味されないようになる。言い換えると、欠損の無い部分で誤差Lが算出される。
勾配法としては、例えばAdam、SGD、AdaDeltaなどの確率的勾配降下法を使用することができる。勾配法に限らず、他の手法を使用してもよい。
本実施形態に係る予測モデルに関して、層の構成やサイズ、活性化関数は上述の例に限定されない。別の具体例として、活性化関数は、ステップ関数、シグモイド関数、多項式、絶対値、maxout、ソフトサイン、ソフトプラスなどであってもよい。予測モデルは、図2に示すようなフィードフォワードニューラルネットワークに限らず、Long short-term memory(LSTM)に代表されるリカレントニューラルネットワークであってもよい。
図2の例では、中間層54は健康行動データ及び生体指標データの両方の影響を受ける4つのノードを有する。中間層54は、生体指標データの影響を受けるが健康行動データの影響を受けない1以上の(例えば4つの)ノード、及び/又は、健康行動データの影響を受けるが生体指標データの影響を受けない1以上の(例えば4つの)ノードをさらに有してもよい。生体指標データの影響を受けるが健康行動データの影響を受けないノードは、例えば、入力側では中間層53の上側4つのノードのみに接続されるノードである。健康行動データの影響を受けるが生体指標データの影響を受けないノードは、例えば、入力側では中間層53の下側4つのノードのみに接続されるノードである。中間層54に追加され得るこれらのノードの出力は、例えば、中間層55の図2に示されるノードに接続されてよい。特に中間層54に追加され得るこれらのノードの出力について、生体指標データの影響を受けるが健康行動データの影響を受けないノードの出力は、中間層55の図2に示されるノードのうち、復元された生体指標の配列に影響するノードのみに出力し、健康行動データの影響を受けるが生体指標データの影響を受けないノードの出力は、復元された健康行動の配列に影響するノードのみに出力するよう構成してもよいし、あるいは入力と出力の関係がクロスするよう、生体指標データのみの影響を受けるノードの出力を復元された健康行動の配列に影響するノードのみに出力し、健康行動データのみの影響を受けるノードの出力を復元された生体指標の配列に影響するノードのみに出力するよう構成してもよい。また、中間層55がさらなるノード(図2に示されない)を有し、中間層54に追加され得るこれらのノードの出力は、中間層55のさらなるノードに接続されてもよい。中間層55のさらなるノードは、中間層54の図2に示される4つのノードに接続されていてもよいし、接続されていなくてもよい。これらのノードを中間層54に追加することにより、予測モデルを用いたデータ予測の精度が向上し得る。
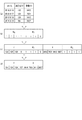
図3を参照して、学習用の入力データを生成する方法例を説明する。図3は、データ記憶部31に記憶されている生体指標データ及び健康行動データと、当該生体指標データ及び健康行動データに基づいて生成される学習用の入力データを示している。ここでは、生体指標データは血圧(収縮期血圧)の計測値の時系列データであり、健康行動データは歩数の計測値の時系列データである。図3に示される例では、生体指標データに関しては、6月25日、6月30日、7月5日のデータが欠損している。また、健康行動データに関しては、6月24日、6月28日のデータが欠損している。
図2に示した構造を有する予測モデルでは、4日分の生体指標データ及び健康行動データを含む入力データが要求される。入力データ生成部22は、データを4日分のデータに区切って入力データを生成する。具体的には、入力データ生成部22は、6月22日から6月25日までのデータから入力データを生成し、6月26日から6月29日までのデータから入力データを生成し、6月30日から7月3日までのデータから入力データを生成するなどして、複数の入力データを生成する。
図3において「NA」は欠損を示す。入力データでは、欠損部分(欠損に対応する要素)に値「0」を代入する。値「0」に代えて、平均値又は中央値などの値を欠損部分に代入してもよい。
6月22日から6月24日では、血圧計測値が得られているので、配列WYの要素を値「1」とし、6月25日では、生体指標データが欠損している(血圧計測値が得られていない)ので、配列WYの要素を値「0」とする。同様に、6月22日、6月23日、6月25日では、歩数計測値が得られているので、配列WXの要素を値「1」とし、6月24日では、健康行動データが欠損しているので、配列WXの要素を値「0」とする。
6月22日から6月25日までの4日分のデータからは、以下に示す配列X、Y、WX、WYが得られる。
X=(7851 8612 0 10594)T
Y=(110 122 121 0)T
WX=(1 1 0 1)T
WY=(1 1 1 0)T
入力データとしての配列Z1は下記のように得られる。
Z1=(110 122 121 0 1 1 1 0 7851 8612 0 10594 1 1 0 1)T
同様にして、6月26日から6月29日までの4日分のデータからは、入力データとしての配列Z1は下記のように得られる。
Z1=(115 128 134 139 1 1 1 1 6741 6955 0 7462 1 1 0 1)T
図3に示される入力データを生成する方法は一例に過ぎない。入力データ生成部22は、図4に示すように、1日ずつずらしながら4日分のデータを抽出することで、入力データを生成してもよい。具体的には、6月22日から6月25日までの4日分のデータから1つの入力データを生成し、6月23日から6月26日までの4日分のデータから1つの入力データを生成し、6月24日から6月27日までの4日分のデータから1つの入力データを生成するなどして、多数の入力データを生成してよい。
X=(7851 8612 0 10594)T
Y=(110 122 121 0)T
WX=(1 1 0 1)T
WY=(1 1 1 0)T
入力データとしての配列Z1は下記のように得られる。
Z1=(110 122 121 0 1 1 1 0 7851 8612 0 10594 1 1 0 1)T
同様にして、6月26日から6月29日までの4日分のデータからは、入力データとしての配列Z1は下記のように得られる。
Z1=(115 128 134 139 1 1 1 1 6741 6955 0 7462 1 1 0 1)T
図3に示される入力データを生成する方法は一例に過ぎない。入力データ生成部22は、図4に示すように、1日ずつずらしながら4日分のデータを抽出することで、入力データを生成してもよい。具体的には、6月22日から6月25日までの4日分のデータから1つの入力データを生成し、6月23日から6月26日までの4日分のデータから1つの入力データを生成し、6月24日から6月27日までの4日分のデータから1つの入力データを生成するなどして、多数の入力データを生成してよい。
データ処理装置1の機能の一部又は全部は、例えばASIC(Application Specific Integrated Circuit)又はFPGA(Field-Programmable Gate Array)などのハードウェア回路により実現されてもよい。また、記憶ユニット30がデータ記憶部31及びモデル記憶部32の少なくとも一方を備えず、データ記憶部31及びモデル記憶部32の少なくとも一方が、例えば、通信ネットワークNW上の記憶装置に設けられていてもよい。
本実施形態では、学習処理を行う学習装置及び予測処理を行う予測装置の両方がデータ処理装置1に設けられている。しかしながら、学習装置及び予測装置は別々の装置として実現されてもよい。
[動作]
上述した構成を有するデータ処理装置1の動作例について説明する。
上述した構成を有するデータ処理装置1の動作例について説明する。
(学習処理)
図5を参照して、本実施形態に係る学習処理について説明する。図5は、図1に示したデータ処理装置1により実行される学習処理を例示する。
図5を参照して、本実施形態に係る学習処理について説明する。図5は、図1に示したデータ処理装置1により実行される学習処理を例示する。
まず、データ受付部21は、入出力インタフェースユニット10を介して外部の装置から、学習用の健康行動データ及び生体指標データを取得する(ステップS101)。例えば、データ受付部21は、図3に示されるような長い期間にわって記録された健康行動データ及び生体指標データを取得する。
入力データ生成部22は、データ受付部21により取得された健康行動データ及び生体指標データに基づいて、入力データを生成する(ステップS102)。具体的には、入力データ生成部22は、データ受付部21により取得された健康行動データ及び生体指標データから、予測モデルの入力次元数に応じた日数分の健康行動データ及び生体指標データを抽出し、抽出した健康行動データ及び生体指標データにおけるデータ欠損状況に基づいて補助データを生成し、抽出した健康行動データ及び生体指標データと生成した補助データとを結合することで入力データを生成する。この処理を繰り返すことで、複数の入力データが生成される。例えば、図3に示されるような入力データ(入力1、入力2、・・・)が生成される。
学習部23は、予測モデルのモデルパラメータを初期化する(ステップS103)。モデルパラメータは、重みパラメータ(具体的には行列A1、A2、A3、A4、A5)及びバイアスパラメータ(具体的には配列B1、B2、B3、B4、B5)を含む。例えば、学習部23は、重みパラメータ及びバイアスパラメータにランダムな値を代入する。
次に、学習部23は、入力データ生成部22により生成された入力データを用いて、予測モデルのモデルパラメータを学習する(ステップS104~S106)。
具体的には、学習部23は、各入力データを予測モデルに入力したときに予測モデルから出力される出力データを取得する。学習部23は、入力データに含まれる健康行動データ及び生体指標データと出力データとの間の誤差を、入力データ生成部22により生成された補助データに応じて算出する(ステップS104)。誤差は、例えば、上記式(5)に示す誤差関数に従って算出される。
学習部23は、誤差の勾配が収束したか否かを判定する(ステップS105)。誤差の勾配が収束していない場合、学習部23は、勾配法に従ってモデルパラメータを更新する(ステップS106)。そして、学習部23は、更新されたモデルパラメータを有する予測モデルを用いて、誤差を算出する(ステップS104)。
ステップS104及びS106に示される処理を繰り返して誤差の勾配が収束したら、学習部23は、現在のモデルパラメータを、予測に用いるモデルパラメータとして決定し(ステップS107)、モデル記憶部32に記憶させる。
(推定処理)
図6を参照して、本実施形態に係る予測処理について説明する。図6は、図1に示したデータ処理装置1により実行される推定処理を例示する。
図6を参照して、本実施形態に係る予測処理について説明する。図6は、図1に示したデータ処理装置1により実行される推定処理を例示する。
図6のステップS201において、データ受付部21は、入出力インタフェースユニット10を介して外部の装置から、予測処理のための健康行動データ及び生体指標データを取得する。図7(a)は、予測処理のための健康行動データ及び生体指標データの一例を示す。図7(a)の例では、健康行動データの一部が欠損している。
図6のステップS202において、入力データ生成部22は、データ受付部21により取得された健康行動データ及び生体指標データに基づいて入力データを生成する。具体的には、入力データ生成部22は、健康行動データにおけるデータ欠損状況に基づいて、健康行動データに関する補助データを生成し、生体指標データにおけるデータ欠損状況に基づいて、生体指標データに関する補助データを生成する。例えば、図7(b)に示す補助データ(配列WX、WY)が、図7(a)に示される健康行動データ(配列X)及び生体指標データ(配列Y)に基づいて生成される。続いて、入力データ生成部22は、生成した補助データと、データ受付部21により取得された健康行動データ及び生体指標データと、を結合して、入力データを生成する。例えば、図7(c)に示す入力データが、図7(a)に示される健康行動データ及び生体指標データと、図7(b)に示される補助データと、を結合することで得られる。
図6のステップS203において、予測部24は、モデル記憶部32からモデルパラメータを読み込み、読み込んだモデルパラメータを予測モデルに設定し、入力データ生成部22により生成された入力データを予測モデルに入力する。それにより、予測部24は、欠損部分が予測値で補間された出力データを取得する。例えば、図7(d)に示す出力データが、図7(c)に示される入力データを予測モデルに入力することにより得られる。
図6のステップS204において、出力制御部25は、予測部24により取得された出力データを予測結果として出力する。図7(c)及び図7(d)に示すように、欠損以外の部分では、配列Xと配列X~との間及び配列Yと配列Y~との間で差が生じることがある。例えば、配列Yの第1の要素は132であるが、配列Y~の第1の要素は131になっている。このため、出力制御部25は、データ受付部21により取得された生体指標データに欠損に対応する予測値を代入したものを予測結果として出力してもよい。
図7(a)から図7(d)を参照して説明した例は、図8に示すように、生体指標データに欠損がなく、健康行動データの一部が欠損しており、その欠損に対する予測値を得るものである。これとは逆に、図9に示すように、健康行動データに欠損がなく、生体指標データの一部が欠損している場合に、その欠損に対する予測値を得ることも可能である。また、健康行動データ及び生体指標データの両方に欠損がある場合にも、それらの欠損に対する予測値を得ることも可能である。
図5に示した学習処理及び図6に示した予測処理は一例に過ぎず、処理手順又は各処理の内容は適宜変更することが可能である。例えば、図6のステップS204では、予測部24は、予測モデルの中間層54から出力されるデータ(配列Z4)を取得してもよい。このデータは健康行動と生体指標との関係を表す抽象化された特徴量を表す。このデータは、予測モデルとは異なる学習器の入力として使用することができる。学習器としては、例えば、ロジスティック回帰やサポートベクターマシン、ランダムフォレストのような分類器や、重回帰分析や回帰木などを用いた回帰モデルを使用することができる。
[効果]
本実施形態に係るデータ処理装置1は、健康行動データと、生体指標データと、健康行動データ及び生体指標データにおけるデータ欠損状況に基づいた補助データと、を結合した入力データを生成し、補助データに応じて算出される、入力データを予測モデルに入力したときに予測モデルから出力される出力データと健康行動データ及び生体指標データとの間の誤差を最小化するように、予測モデルのモデルパラメータを学習する。
本実施形態に係るデータ処理装置1は、健康行動データと、生体指標データと、健康行動データ及び生体指標データにおけるデータ欠損状況に基づいた補助データと、を結合した入力データを生成し、補助データに応じて算出される、入力データを予測モデルに入力したときに予測モデルから出力される出力データと健康行動データ及び生体指標データとの間の誤差を最小化するように、予測モデルのモデルパラメータを学習する。
上記の構成では、データ欠損の影響を除外して誤差を算出することになる。それにより、欠損を含むデータを用いて、健康行動データと生体指標データとの関係をモデル化した予測モデルのモデルパラメータを効果的に学習することができる。
さらに、データ処理装置1は、上述したようにして学習されたモデルパラメータが設定された予測モデルを用いることで、健康行動データと生体指標データとのうちの少なくとも一方に含まれる欠損に対する予測値を得ることができるようになる。
予測処理は、計測忘れなどにより生じた欠損に対する値を予測すること以外の用途に利用することもできる。例えば、予測処理は、生体指標データに仮のデータ(例えば所望する血圧の時間的変化を示すデータ)を設定し、そのデータを得るために必要な健康行動を知るために利用することができる。これにより、健康行動についての目標を設定することが可能になる。
<他の実施形態>
なお、この発明は上記実施形態に限定されるものではない。
なお、この発明は上記実施形態に限定されるものではない。
上記実施形態では、健康行動データ及び生体指標データの両方におけるデータ欠損状況に基づいて補助データを生成する。補助データを生成する方法は、上述した実施形態において説明した方法に限らない。補助データは、健康行動データ及び生体指標データの一方におけるデータ欠損状況に基づいて生成されてもよい。
例えば、生体指標データが病院での検査により取得され、健康行動データがウェアラブルデバイスで取得される場合を想定する。この場合、生体指標データはユーザが病院に行ったときにしか取得されない。このため、健康行動データに比べて、生体指標データの欠損の比率が大きくなる。このような欠損の偏りは、健康指標データ及び健康行動データの解析結果に誤差をもたらし得る。
一実施形態では、入力データ生成部22は、健康行動データ及び生体指標データのそれぞれについて欠損度合いを算出し、健康行動データ及び生体指標データのうち、欠損度合いが高い方のデータを選択し、選択したデータにおけるデータ欠損状況に基づいて補助データを生成してよい。本実施形態では、欠損度合いは、配列内で値がゼロである要素の数である。これに代えて、欠損度合いは、例えば、配列の要素数に対する値がゼロである要素数の割合であってよい。
図10に示す例では、生体指標データの欠損度合いが2であり、健康行動データの欠損度合いが1である。入力データ生成部22は、欠損度合いがより高い生体指標データにおけるデータ欠損状況に基づいて、生体指標データに関する補助データ(配列WY)を生成し、生体指標データに関する補助データを複製することで健康行動データに関する補助データ(配列WX)を生成する。すなわち、健康行動データに関する補助データは、生体指標データに関する補助データと同じに設定される。この場合、評価関数は下記の式(6)で表される。

この実施形態によれば、例えば健康行動データと生体指標データとの間で欠損に偏りがある場合において、健康行動と生体指標との関係を効果的に学習することができる。
一実施形態では、入力データ生成部22は、健康行動及び生体指標のそれぞれの重要度に基づいて選択される、健康行動データ及び生体指標データの一方におけるデータ欠損状況に基づいて、補助データを生成してよい。健康行動及び生体指標のそれぞれの重要度は、例えば、医師などのオペレータにより設定されてよい。例えば生体指標の重要度が健康行動の重要度より高い場合、入力データ生成部22は、生体指標データにおけるデータ欠損状況に基づいて、生体指標データに関する補助データ(配列WY)を生成し、生体指標データに関する補助データを複製することで健康行動データに関する補助データ(配列WX)を生成する。この場合、評価関数は上記の式(6)で表される。
この実施形態によれば、例えば重要度の高い方のデータを重視して学習が行われる。これにより、重要度の高い方のデータに対する予測精度を向上するモデルパラメータを得ることができる。
健康行動と生体指標との間の関係に時間方向のズレがあることがある。例えば、健康行動をとってからその効果が生体指標に反映されるまでに時差があることがある。言い換えると、直前の健康行動の結果が即座に生体指標に反映されず、ある程度の期間がたってから生体指標に効果が現れる場合がある。
一実施形態では、健康行動と生体指標との間の時間的関係が考慮される。この実施形態では、入力データ生成部22は、健康行動データにおけるデータ欠損状況に基づいて、行動指標データに関する補助データ(配列WX)を生成し、健康行動データに関する補助データと上記の時間的関係とに基づいて、生体指標データに関する補助データ(配列WY)を生成する。健康行動の効果が生体指標に現れるステップが設定される。ステップは、入力の配列における要素間の時間差に相当する。ここでは、健康行動の効果が1日(1ステップ)遅れて生体指標に現れる場合を考える。また、配列の要素は日にちの順に整列されているものとする。図11に示すように、配列WXの要素を1ステップずらした配列を作成し、この配列の第1の要素には値「0」を代入する。この配列を配列WYとする。この手順は、1ステップずらす処理を再帰的にプログラムで実行することで実現することができる。また、配列WYは下記に示す行列Hを用いた行列演算によって算出されてもよい。

例えばWX=(1 0 1 0)Tである場合、WYは下記のように求まる。

この実施形態では、評価関数は下記の式(7)で表される。

この実施形態によれば、健康行動と生体指標との間での時間方向のズレが考慮されるので、健康行動と生体指標との関係をより正確にモデル化することができるようになる。
上記実施形態では健康行動及び生体指標という2つの事象の関係を学習する場合について説明したが、データ処理装置1は3つ以上の事象の関係を学習することもできる。例えば、図12に示すように2種類の生体指標に関する生体指標データが取得される場合、配列Xは、2種類の生体指標のそれぞれについて所定日数分の生体指標データを抽出することで生成される。図12の例では、3日分の生体指標データが抽出される。この場合、健康行動データについても3日分のデータが抽出される。なお、図4を参照して説明したように、1日ずつずらしてデータを抽出するようにしてもよい。
また、複数種類のデータが存在する場合、図13に示すように、複数種類のデータをそれぞれ入力のチャネルに割り当てて入力してもよい。これは、RGB画像のように1ピクセルが3つの情報を持っている際に、画像データをニューラルネットに入力するようなときに使われる一般的な手法で実現される。
上述した実施形態では、時系列データを扱う例に関して説明した。しかしながら、上述した実施形態は、時系列データ以外のデータに対しても適用可能である。例えば、観測地点毎に記録された気温のデータを扱ってもよく、画像データを扱ってもよい。画像データのように2次元の配列で表現されるデータの場合は、複数種類のデータが存在する場合と同様にして、行毎に情報を抽出し、それらを結合することで入力データを生成してよい。
要するに本発明は、上記実施形態そのままに限定されるものではなく、実施段階ではその要旨を逸脱しない範囲で構成要素を変形して具体化できる。また、上記実施形態に開示されている複数の構成要素の適宜な組み合せにより種々の発明を形成できる。例えば、実施形態に示される全構成要素から幾つかの構成要素を削除してもよい。さらに、異なる実施形態に亘る構成要素を適宜組み合せてもよい。
1…データ処理装置
10…入出力インタフェースユニット
20…制御ユニット
21…データ受付部
22…入力データ生成部
23…学習部
24…予測部
25…出力制御部
30…記憶ユニット
31…データ記憶部
32…モデル記憶部
51…入力層
52~55…中間層
56…出力層
10…入出力インタフェースユニット
20…制御ユニット
21…データ受付部
22…入力データ生成部
23…学習部
24…予測部
25…出力制御部
30…記憶ユニット
31…データ記憶部
32…モデル記憶部
51…入力層
52~55…中間層
56…出力層
Claims (10)
- 第1の事象に関する第1のデータと、前記第1の事象と関係する第2の事象に関する第2のデータと、前記第1のデータ及び前記第2のデータの少なくとも一方におけるデータ欠損状況に基づいた第1の補助データと、を結合した第1の入力データを生成する第1の生成部と、
前記第1の入力データを予測モデルに入力したときに前記予測モデルから出力される出力データと前記第1のデータ及び前記第2のデータとの間の前記第1の補助データに応じた誤差に基づいて、前記予測モデルのモデルパラメータを学習する学習部と、
を備えるデータ処理装置。 - 前記第1の生成部は、前記第1のデータにおけるデータ欠損状況に基づいた補助データと、前記第2のデータにおけるデータ欠損状況に基づいた補助データと、を含む前記第1の補助データを生成する、請求項1に記載のデータ処理装置。
- 前記第1の生成部は、前記第1のデータ及び前記第2のデータのそれぞれのデータ欠損度合いを算出し、前記第1のデータ及び前記第2のデータのうち、前記データ欠損度合いが高い方のデータを選択し、前記選択されたデータにおけるデータ欠損状況に基づいて、前記第1の補助データを生成する、請求項1に記載のデータ処理装置。
- 前記第1の生成部は、前記第1のデータ及び前記第2のデータのうちの予め決定された方のデータにおけるデータ欠損状況に基づいて、前記第1の補助データを生成する、請求項1に記載のデータ処理装置。
- 前記第1の生成部は、前記第1のデータ及び前記第2のデータのうちの予め決定された方のデータにおけるデータ欠損状況と、前記第1の事象と前記第2の事象との間の時間的関係と、に基づいて、前記第1の補助データを生成する、請求項1に記載のデータ処理装置。
- 前記予測モデルは、入力層、少なくとも1つの中間層、及び出力層を有するニューラルネットワークであり、前記少なくとも1つの中間層のうちの1つは、前記第1のデータ及び前記第2のデータの両方の影響を受けるノードと、前記第1のデータの影響を受けるが前記第2のデータの影響を受けないノード及び前記第2のデータの影響を受けるが前記第1のデータの影響を受けないノードの少なくとも一方と、を有する、請求項1乃至5のいずれか1項に記載のデータ処理装置。
- 前記第1の事象に関する第3のデータと、前記第2の事象に関する第4のデータと、前記第3のデータ及び前記第4のデータの少なくとも一方におけるデータ欠損状況に基づいた第2の補助データと、を結合した第2の入力データを生成する第2の生成部と、
前記第2の入力データを前記学習されたモデルパラメータが設定された前記予測モデルに入力して、前記第3のデータ及び前記第4のデータの少なくとも一方に含まれる欠損に対する予測値を得る予測部と、
をさらに備える請求項1乃至6のいずれか1項に記載のデータ処理装置。 - 前記第1の事象に関する第3のデータと、前記第2の事象に関する第4のデータと、前記第3のデータ及び前記第4のデータの少なくとも一方におけるデータ欠損状況に基づいた第2の補助データと、を結合した第2の入力データを生成する第2の生成部と、
前記第2の入力データを前記学習されたモデルパラメータが設定された前記予測モデルに入力して、前記予測モデルの中間層から出力されるデータを得る予測部と、
をさらに備える請求項1乃至6のいずれか1項に記載のデータ処理装置。 - 第1の事象に関する第1のデータと、前記第1の事象と関係する第2の事象に関する第2のデータと、前記第1のデータ及び前記第2のデータの少なくとも一方におけるデータ欠損状況に基づいた補助データと、を結合した入力データを生成する過程と、
前記入力データを予測モデルに入力したときに前記予測モデルから出力される出力データと前記第1のデータ及び前記第2のデータとの間の前記補助データに応じた誤差に基づいて、前記予測モデルのモデルパラメータを学習する過程と、
を備えるデータ処理方法。 - 請求項1乃至8のいずれか1項に記載のデータ処理装置が備える各部としてコンピュータを機能させるためのプログラム。
Priority Applications (1)
| Application Number | Priority Date | Filing Date | Title |
|---|---|---|---|
| US17/279,834 US20210397951A1 (en) | 2018-09-28 | 2019-09-17 | Data processing apparatus, data processing method, and program |
Applications Claiming Priority (2)
| Application Number | Priority Date | Filing Date | Title |
|---|---|---|---|
| JP2018-184073 | 2018-09-28 | ||
| JP2018184073A JP7014119B2 (ja) | 2018-09-28 | 2018-09-28 | データ処理装置、データ処理方法、及びプログラム |
Publications (1)
| Publication Number | Publication Date |
|---|---|
| WO2020066725A1 true WO2020066725A1 (ja) | 2020-04-02 |
Family
ID=69949718
Family Applications (1)
| Application Number | Title | Priority Date | Filing Date |
|---|---|---|---|
| PCT/JP2019/036263 Ceased WO2020066725A1 (ja) | 2018-09-28 | 2019-09-17 | データ処理装置、データ処理方法、及びプログラム |
Country Status (3)
| Country | Link |
|---|---|
| US (1) | US20210397951A1 (ja) |
| JP (1) | JP7014119B2 (ja) |
| WO (1) | WO2020066725A1 (ja) |
Cited By (3)
| Publication number | Priority date | Publication date | Assignee | Title |
|---|---|---|---|---|
| JP2023056190A (ja) * | 2021-10-07 | 2023-04-19 | トヨタ自動車株式会社 | 欠損値推定方法、機械学習方法および欠損値推定装置 |
| WO2023127029A1 (ja) * | 2021-12-27 | 2023-07-06 | 日本電信電話株式会社 | 観察対象選択装置、観察対象選択方法、及びプログラム |
| WO2024189791A1 (ja) * | 2023-03-14 | 2024-09-19 | 日本電信電話株式会社 | 現在バイアス分析装置、方法およびプログラム |
Families Citing this family (3)
| Publication number | Priority date | Publication date | Assignee | Title |
|---|---|---|---|---|
| JP7499732B2 (ja) * | 2021-05-20 | 2024-06-14 | Kddi株式会社 | 変更した事象・関連情報で訓練された生成器を含む領域内情報推定モデル、装置及び方法 |
| WO2023105673A1 (ja) * | 2021-12-08 | 2023-06-15 | 日本電信電話株式会社 | 学習装置、推定装置、学習方法、推定方法及びプログラム |
| JP2024099355A (ja) * | 2023-01-12 | 2024-07-25 | 株式会社日立製作所 | 情報分析支援方法及び情報分析支援システム |
Citations (1)
| Publication number | Priority date | Publication date | Assignee | Title |
|---|---|---|---|---|
| US20160093048A1 (en) * | 2014-09-25 | 2016-03-31 | Siemens Healthcare Gmbh | Deep similarity learning for multimodal medical images |
Family Cites Families (9)
| Publication number | Priority date | Publication date | Assignee | Title |
|---|---|---|---|---|
| JPH08212184A (ja) * | 1995-02-01 | 1996-08-20 | Fujitsu Ltd | 認識装置および欠損値推定/学習方法 |
| DE60130742T2 (de) * | 2001-05-28 | 2008-07-17 | Honda Research Institute Europe Gmbh | Mustererkennung mit hierarchischen Netzen |
| US9786013B2 (en) * | 2015-11-30 | 2017-10-10 | Aon Global Risk Research Limited | Dashboard interface, platform, and environment for matching subscribers with subscription providers and presenting enhanced subscription provider performance metrics |
| WO2018005489A1 (en) * | 2016-06-27 | 2018-01-04 | Purepredictive, Inc. | Data quality detection and compensation for machine learning |
| US11449732B2 (en) * | 2016-09-06 | 2022-09-20 | Nippon Telegraph And Telephone Corporation | Time-series-data feature extraction device, time-series-data feature extraction method and time-series-data feature extraction program |
| US20180150609A1 (en) * | 2016-11-29 | 2018-05-31 | Electronics And Telecommunications Research Institute | Server and method for predicting future health trends through similar case cluster based prediction models |
| US11039805B2 (en) * | 2017-01-05 | 2021-06-22 | General Electric Company | Deep learning based estimation of data for use in tomographic reconstruction |
| US10834341B2 (en) * | 2017-12-15 | 2020-11-10 | Baidu Usa Llc | Systems and methods for simultaneous capture of two or more sets of light images |
| WO2019127231A1 (en) * | 2017-12-28 | 2019-07-04 | Intel Corporation | Training data generators and methods for machine learning |
-
2018
- 2018-09-28 JP JP2018184073A patent/JP7014119B2/ja active Active
-
2019
- 2019-09-17 WO PCT/JP2019/036263 patent/WO2020066725A1/ja not_active Ceased
- 2019-09-17 US US17/279,834 patent/US20210397951A1/en not_active Abandoned
Patent Citations (1)
| Publication number | Priority date | Publication date | Assignee | Title |
|---|---|---|---|---|
| US20160093048A1 (en) * | 2014-09-25 | 2016-03-31 | Siemens Healthcare Gmbh | Deep similarity learning for multimodal medical images |
Non-Patent Citations (1)
| Title |
|---|
| KURASAWA, HISASHI ET AL.: "The 37th Joint Conference on Medical Informatics (The 18th Annual Meeting of Japan Association for Medical Informatics", PROCEEDINGS OF JAPAN JOURNAL OF MEDICAL INFORMATICS, vol. 37, 1 November 2017 (2017-11-01), pages 825 - 830 * |
Cited By (5)
| Publication number | Priority date | Publication date | Assignee | Title |
|---|---|---|---|---|
| JP2023056190A (ja) * | 2021-10-07 | 2023-04-19 | トヨタ自動車株式会社 | 欠損値推定方法、機械学習方法および欠損値推定装置 |
| JP7636312B2 (ja) | 2021-10-07 | 2025-02-26 | トヨタ自動車株式会社 | 欠損値推定方法、機械学習方法および欠損値推定装置 |
| WO2023127029A1 (ja) * | 2021-12-27 | 2023-07-06 | 日本電信電話株式会社 | 観察対象選択装置、観察対象選択方法、及びプログラム |
| JPWO2023127029A1 (ja) * | 2021-12-27 | 2023-07-06 | ||
| WO2024189791A1 (ja) * | 2023-03-14 | 2024-09-19 | 日本電信電話株式会社 | 現在バイアス分析装置、方法およびプログラム |
Also Published As
| Publication number | Publication date |
|---|---|
| JP7014119B2 (ja) | 2022-02-01 |
| JP2020052915A (ja) | 2020-04-02 |
| US20210397951A1 (en) | 2021-12-23 |
Similar Documents
| Publication | Publication Date | Title |
|---|---|---|
| JP7014119B2 (ja) | データ処理装置、データ処理方法、及びプログラム | |
| JP6574527B2 (ja) | 時系列データ特徴量抽出装置、時系列データ特徴量抽出方法及び時系列データ特徴量抽出プログラム | |
| JP6922284B2 (ja) | 情報処理装置及びプログラム | |
| WO2019176991A1 (ja) | アノテーション方法、アノテーション装置、アノテーションプログラム及び識別システム | |
| US20140195472A1 (en) | Information processing apparatus, generating method, medical diagnosis support apparatus, and medical diagnosis support method | |
| CN113538334B (zh) | 一种胶囊内窥镜图像病变识别装置及训练方法 | |
| EP3545471A1 (en) | Distributed clinical workflow training of deep learning neural networks | |
| Lu et al. | Recurrent disease progression networks for modelling risk trajectory of heart failure | |
| JP2012018450A (ja) | ニューラルネットワークシステム、ニューラルネットワークシステムの構築方法およびニューラルネットワークシステムの制御プログラム | |
| Ordikhani et al. | An evolutionary machine learning algorithm for cardiovascular disease risk prediction | |
| CN106462655A (zh) | 用于计算机化临床诊断支持的分层自学习系统 | |
| EP3618080B1 (en) | Reinforcement learning for medical system | |
| US11996201B2 (en) | Technology to automatically identify the most relevant health failure risk factors | |
| CN114782394A (zh) | 一种基于多模态融合网络的白内障术后视力预测系统 | |
| US20220027686A1 (en) | Data processing apparatus, data processing method, and program | |
| CN114021744A (zh) | 设备的剩余使用寿命的确定方法、装置和电子设备 | |
| KR102921064B1 (ko) | 유사 에피소드 샘플링을 이용하는 모델 기반 강화학습을 통해 최적 치료경로를 탐색하기 위한 장치 및 방법 | |
| KR20230045628A (ko) | 인지 진단 게임을 이용한 인지 진단 평가를 위한 컴퓨터 프로그램 기록매체 | |
| CN116417137A (zh) | 睡眠方案的预测方法、装置、存储介质及计算机设备 | |
| KR20230045630A (ko) | 인지 게임을 자동 추천하는 인지 상태 진단 장치 | |
| KR20230045627A (ko) | 태스크 수행 모델 기반의 인지 상태 진단을 위한 컴퓨터 프로그램 | |
| KR20230045629A (ko) | 자동 수행 맞춤형 태스크 수행 모델을 기반으로 하는 인지 상태 진단 장치 | |
| KR20230045623A (ko) | 사용자 맞춤형 인지 모델 기반의 인지 상태 진단 시스템 | |
| JP2024007851A (ja) | 情報処理装置、情報処理方法、及びプログラム | |
| Ati | Knowledge capturing in autonomous system design for chronic disease risk assessment |
Legal Events
| Date | Code | Title | Description |
|---|---|---|---|
| 121 | Ep: the epo has been informed by wipo that ep was designated in this application |
Ref document number: 19866241 Country of ref document: EP Kind code of ref document: A1 |
|
| NENP | Non-entry into the national phase |
Ref country code: DE |
|
| 122 | Ep: pct application non-entry in european phase |
Ref document number: 19866241 Country of ref document: EP Kind code of ref document: A1 |