WO2020054073A1 - 分析装置、分析方法およびプログラム - Google Patents
分析装置、分析方法およびプログラム Download PDFInfo
- Publication number
- WO2020054073A1 WO2020054073A1 PCT/JP2018/034281 JP2018034281W WO2020054073A1 WO 2020054073 A1 WO2020054073 A1 WO 2020054073A1 JP 2018034281 W JP2018034281 W JP 2018034281W WO 2020054073 A1 WO2020054073 A1 WO 2020054073A1
- Authority
- WO
- WIPO (PCT)
- Prior art keywords
- personalization
- personalization level
- information
- prediction model
- development process
- Prior art date
- Legal status (The legal status is an assumption and is not a legal conclusion. Google has not performed a legal analysis and makes no representation as to the accuracy of the status listed.)
- Ceased
Links
Images






Classifications
-
- G—PHYSICS
- G06—COMPUTING OR CALCULATING; COUNTING
- G06F—ELECTRIC DIGITAL DATA PROCESSING
- G06F8/00—Arrangements for software engineering
- G06F8/70—Software maintenance or management
- G06F8/77—Software metrics
Definitions
- the present invention relates to an analysis device, an analysis method, and a program for analyzing a personalization level indicating a degree of personalization in a software development process.
- Patent Literature 1 discloses an analysis device that presents, to a user, priorities of source codes requiring correction by performing multivariate analysis on source code metrics and program development project information.
- Patent Document 2 proposes a standard and specific technique of standardization of source code to a developer using source code metric information, and evaluates a result of the standardization performed by the developer. It discloses a source code management system that can notify developers of the best execution results.
- Patent Document 3 discloses an object-oriented program quality evaluation device that extracts metrics that lead to a decrease in maintainability and reusability by analyzing metrics in module units.
- a person may be in a personalized state in which technology, progress management, construction period management, etc. depend on a specific person.
- the personalized state occurs, if the specific person suddenly becomes absent, for example, there is a possibility that another person does not understand the specifications, technology, construction period, etc., and development may not proceed.
- the occurrence of a personalized state can lead to lost opportunities.
- the prior art can solve the state of personalization in the coding process by presenting to the user the necessary portions, maintainability, reusability, etc. of the source code created by others.
- personalization in software development occurs not only in a coding process but also in various processes such as a specification design process, an external design process, and an internal design process.
- the present invention has been made in order to solve the above problems, and an object of the present invention is to provide an analyzer, an analysis method, and a program for analyzing a personalization level indicating a degree of personalization in a software development process. I do.
- One embodiment of the present invention provides an analyzer for analyzing a personalization level indicating a degree of personalization in a software development process.
- the control unit receives the metric information on the development process, applies a personalization level prediction model that outputs a personalization level based on the metric information to the metrics information, and determines the personalization level. And.
- Another embodiment of the present invention provides an analysis system for analyzing a personalization level indicating a degree of personalization in a software development process.
- the analysis system is connected to a learning device that generates a personalization level prediction model based on sample information regarding the metric information and a personalization level given to the sample information, and the learning device is connected via a network
- the server includes a server that stores the personalization level prediction model received from the learning device, and a control device that is connected to the server via a network and receives the personalization level prediction model from the server.
- the control device receives the metric information on the development process and applies the personalization level prediction model to the metric information on the development process to determine the personalization level.
- Another embodiment of the present invention provides an analysis method for analyzing a personalization level indicating a degree of personalization in a software development process.
- the control unit receives the metric information related to the development process, and the control unit applies a personalization level prediction model that outputs a personalization level based on the metric information to the metric information. Determining the personalization level.
- Still another embodiment of the present invention provides a program for causing a control unit to execute the above analysis method.
- the personalization level of the development process can be determined based on the metric information on the software development process.
- FIG. 1 is a block diagram illustrating a configuration of an analyzer according to Embodiment 1 of the present invention.
- FIG. 3 is a diagram showing a data flow in the analyzer according to the first embodiment of the present invention.
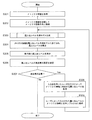
- 5 is a flowchart showing a flow of analysis of a personalization level by the analysis device according to the first embodiment of the present invention.
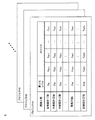
- FIG. 3 is a diagram illustrating an example of a metrics information database. It is a figure showing an example of a personalization level prediction model.
- FIG. 9 is a block diagram illustrating a configuration of an analyzer according to Embodiment 2 of the present invention.
- FIG. 9 is a diagram showing a data flow in the analyzer according to Embodiment 2 of the present invention.
- FIG. 9 is a flowchart showing a flow of analysis of a personalization level by the analyzer according to Embodiment 2 of the present invention.
- 9 is a flowchart showing a flow of analysis of a personalization level by the analyzer according to Embodiment 2 of the present invention.
- FIG. 4 is a diagram illustrating an example of a sample database.
- FIG. 14 is a diagram showing a data flow in the analyzer according to Embodiment 3 of the present invention.
- 13 is a flowchart illustrating a flow of analysis of a personalization level by the analysis device according to the third embodiment of the present invention. It is a figure which shows the example of a display for asking the user whether the redefinition of a personalization level is necessary.
- FIG. 11 is a diagram illustrating an example of a dialog box for a user to input a redefined personalization level.
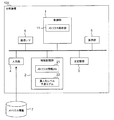
- FIG. 1 is a block diagram showing a configuration of an analyzer 100 according to Embodiment 1 of the present invention.
- the analysis device 100 includes a control unit 1, an auxiliary storage unit 2, a main storage unit 3, an input unit 4, a display unit 5, and a communication interface (I / F) 6.
- the control unit 1 is a processing device that performs various calculations and controls the overall operation of the analyzer 100.
- the control unit 1 includes a general-purpose processor such as a CPU that implements a predetermined function by executing a program.
- the control unit 1 includes a metrics analysis unit 11 that performs an operation for analyzing metrics information described below.
- the auxiliary storage unit 2 is a medium for recording various information.
- the auxiliary storage unit 2 is specifically realized by a semiconductor memory device such as a ROM, a flash memory, and an SSD, a disk device such as a hard disk, and other storage devices alone or by appropriately combining them.
- the auxiliary storage unit 2 stores a metrics information database (DB) 21, an individualization level prediction model 22, an operating system (OS), a control program executed by the control unit 1, and the like, which will be described later.
- DB metrics information database
- OS operating system
- the main storage unit 3 is a medium for temporarily recording various information.
- the main storage unit 3 loads a control program stored in the auxiliary storage unit 2, and the control unit 1 sequentially reads and executes the loaded programs. Further, the main storage unit 3 loads at least a part of the OS stored in the auxiliary storage unit 2, and the control unit 1 executes the loaded OS to realize a control function.
- the main storage unit 3 is configured by a volatile memory such as an SRAM and a DRAM.
- the input unit 4 is an input interface that converts an input instruction or operation content received from a user into an electric signal and transmits the electric signal to the control unit 1.
- the input unit 4 includes a mouse, a keyboard, a touch panel, buttons, a microphone for voice input, and the like.
- the display unit 5 is a display device that displays various information.
- the display unit 5 includes, for example, a liquid crystal display, an organic EL display, a projector, and the like.
- the analyzer 100 may include an output device such as a speaker and a printer in addition to the display unit 5.
- the communication I / F 6 is an interface circuit or a module for enabling communication connection between the analyzer 100 and an external device via a network.
- the communication I / F 6 performs communication according to standards such as IEEE802.3, IEEE802.11 or Wi-Fi, LTE, 3G, 4G, 5G.
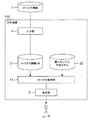
- FIG. 2 is a diagram showing a flow of data in the analyzer 100.
- FIG. 3 is a flowchart showing the flow of the analysis of the personalization level by the analyzer 100. The operation of the analyzer 100 will be described with reference to FIGS.
- the metrics information 7 is input to the analyzer 100 via the input unit 4 (S101).
- the means for making the metric information 7 available to the control unit 1 is not limited to inputting the metric information 7 via the input unit 4.
- the metric information 7 may be temporarily stored in an external storage device such as a server, and the analyzer 100 may download the metric information 7 via the communication I / F 6.
- the metrics are the quality and productivity of at least one of the development processes of requirements analysis, specification design, external design, internal design, coding, unit test, combination test, comprehensive test, and system test in software development. Criterion for evaluating reliability, etc.
- the metrics information 7 includes, for example, the number of pages of a document for explaining the development process, the document density, the proportion of charts in the document, the review man-hours, the review density, the number of reviewers, the number of defects pointed out, the complexity of the source code, the number of defects. , Information indicating the degree of difficulty of the process.
- the metrics information 7 is information indicating the number of testers, test density, defect detection rate, and the like.
- the metrics information 7 may include a review density for each person in charge, a review utterance time for each person in charge, a defect detection rate for each person in charge, or a maximum value and a minimum value of these values.
- the control unit 1 classifies the metrics information 7 received via the input unit 4 into a database, and stores it in the metrics information database 21 (S102).
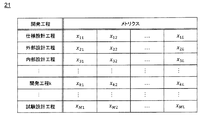
- FIG. 4 is a diagram illustrating an example of the metrics information database 21. If the development process can be decomposed into M stages, the metrics information 7 can be organized in the form of metrics groups (x 1 , x 2 , x 3 ,..., X k ,..., X M ).
- the metric analysis unit 11 reads the metric information database 21 and the personalization level prediction model 22 and converts the metric information 7 stored in the metric information database 21 into the personal information.
- the personalization level for each development process is calculated (S103).
- FIG. 5 is a diagram showing an example of the personalization level prediction model 22.
- the personalization level prediction model 22 is a statistical model for obtaining the personalization level from the metrics information 7.
- the personalization level prediction model 22 is composed of M multiple regression equations corresponding to each of the M development processes.
- the objective variable y k of the development process k included in the personalization level prediction model 22 is represented by the following multiple regression equation (1), as shown in FIG.
- y k ⁇ k + ⁇ k1 x k1 + ⁇ k2 x k2 + ⁇ k3 x k3 + ⁇ + ⁇ kL x kL (1)
- the partial regression coefficients ⁇ and ⁇ are determined, for example, by performing multiple regression analysis based on sample data of metrics information or metrics information in a past development process. Note that the types and number of metrics in each development process may not be the same.
- the number of metrics acquired in the development process k is G less than L, for example, in equation (1), among the partial regression coefficients ⁇ k1 to ⁇ kL , ( LG ) partial regression coefficients The coefficient can be considered to be zero.
- the personalization level prediction model 22 may be externally stored in the auxiliary storage unit 2 via the input unit 4 of the analyzer 100 shown in FIG. Further, for example, the personalization level prediction model 22 may be downloaded from an external storage device such as a server via the communication I / F 6 and stored in the auxiliary storage unit 2.
- the control unit 1 displays the calculated personalization level for each development process on the display unit 5 (S104). Thereby, the user can recognize the personalization level for each development process.
- the personalization level displayed on the display unit 5 indicates the degree of personalization for each development process by, for example, a numerical value from 1 to 10.
- the display unit 5 may display the personalization levels of all development processes. Further, the display unit 5 may display the personalization levels of all the development processes in order from the highest personalization level. Thus, the user can recognize the development process in which the personalization has progressed at a glance of the display unit 5.
- the calculated personalization level for each development process may be uploaded to an external storage device such as a server. Then, for example, the personalization level of the development process is downloaded to the PC used by the manager of the specific development process, whereby the manager can confirm the personalization level of the development process managed by himself / herself. Can be.
- the display unit 5 may display the explanatory variable x and the values of the partial regression coefficients ⁇ and ⁇ . Thereby, the user can recognize the degree of influence of the specific metric on the specific development process. For example, when ⁇ k3 is the largest among the partial regression coefficients ( ⁇ k1 , ⁇ k2 , ⁇ k3 ,..., ⁇ kL ) of the development process k represented by the equation (1), it is represented by x k3. It can be seen that the metrics have a great influence on personalization.
- the analyzer 100 analyzes the personalization level indicating the degree of personalization in the software development process.
- the control unit 1 of the analysis device 100 receives, via the input unit 4, metrics information 7 on a software development process.
- the control unit 1 applies the personalization level prediction model 22 that outputs the personalization level based on the metrics information 7 to the metrics information 7 to determine the personalization level of the development process.
- the analysis apparatus 100 can obtain the level of personalization in the software development process. Thereby, the degree of personalization can be quantified.
- the analysis result by the analyzer 100 can be used for data processing for grasping the status of personalization in the software development process, such as listing development processes with a high personalization level.
- the analysis device 100 may further include a display unit 5 that displays the personalization level determined by the control unit 1. This makes it possible to visualize the personalization level of the software development process. By visualizing the personalization level, the manager of the development process can appropriately start to reduce or eliminate the personalization status. Therefore, for example, when a specific person involved in software development is suddenly absent, the risk that development stops working can be minimized.
- FIG. FIG. 6 is a block diagram showing a configuration of the analyzer 200 according to Embodiment 2 of the present invention.
- the control unit 1 of the analysis device 200 further includes a learning unit 12 that generates a personalization level prediction model 22.
- FIG. 7 is a diagram showing the flow of data in the analyzer 200.
- 8 and 9 are flowcharts showing the flow of the analysis of the personalization level by the analysis device 200. The operation of the analyzer 200 will be described with reference to FIGS.
- the metrics information 7 is input to the analyzer 200 via the input unit 4 (S201).
- the control unit 1 classifies the metrics information 7 received via the input unit 4 into a database, and stores it in the metrics information database 21 (S202).
- Steps S201 and S202 are the same as steps S101 and S102 of the first embodiment.
- the learning unit 12 of the control unit 1 generates the personalization level prediction model 22 (S203).
- Step S203 does not need to be performed after step S202, and may be performed before step S201, for example.
- FIG. 9 is a flowchart showing details of step S203 for generating the personalization level prediction model 22.
- step S203 of generating the personalization level prediction model 22 will be described with reference to FIG.
- FIG. 10 is a diagram illustrating an example of the sample database 8.
- the sample database 8 stores a set of metrics in past developments such as development projects A, B, and C in association with a personalization level assigned by the user.
- the metrics stored in the sample database 8 are not limited to those acquired in the past development.
- the group of metrics stored in the sample database 8 may be created by a user based on theory, rule of thumb, or the like.
- the learning unit 12 calculates the partial regression coefficient by the least squares method using the acquired personalization level as an objective variable and the metrics group as an explanatory variable for each development process (S212).
- the calculated partial regression coefficient is stored in the auxiliary storage unit 2 as the personalization level prediction model 22 (S213).
- the personalization level prediction model 22 is not stored in the auxiliary storage unit 2 in advance as in the first embodiment, but is generated by the learning unit 12 of the control unit 1. .
- the metric analysis unit 11 of the control unit 1 reads the metric information database 21 and the personalization level prediction model 22, and stores the metric information 7 stored in the metric information database 21 By applying to the explanatory variables of the humanization level prediction model 22, the personalization level for each development process is calculated (S204). Next, the control unit 1 displays the calculated personalization level for each development process on the display unit 5 (S205). Thereby, the user can recognize the personalization level for each development process.
- the analysis device 200 includes the learning unit 12 in the control unit 1 in addition to the configuration of the analysis device 100 according to the first embodiment.
- the learning unit 12 generates the personalization level prediction model 22 based on the sample of the metric information stored in the sample database 8 and the personalization level assigned thereto.
- the analyzer 200 can generate the personalization level prediction model 22 by itself.
- FIG. FIG. 11 is a diagram showing a data flow in the analyzer 300 according to Embodiment 3 of the present invention.
- the configuration of the analyzer 300 is the same as the configuration of the analyzer 200 shown in FIG.
- FIG. 12 is a flowchart showing the flow of analysis of the personalization level by the analysis device 300.
- the operation of the analyzer 300 will be described with reference to FIGS.
- Steps S301 to S305 are the same as steps S201 to S205 of the second embodiment shown in FIG.
- step S305 of displaying the personalization level on the display unit 5 the control unit 1 displays on the display unit 5 a display for confirming to the user whether the personalization level needs to be redefined (S306).
- the display displayed on the display unit 5 in step S306 is, for example, a dialog box as shown in FIG.
- the user confirms whether or not the personalization level displayed in step S305 is correct, and determines whether or not it is necessary to redefine the personalization level (S307). For example, when the user determines that the personalization level needs to be redefined, the user clicks a “Yes” button in a dialog box as shown in FIG.
- the control unit 1 displays a dialog box as shown in FIG.
- the user inputs the redefined personalization level (hereinafter, referred to as “correction level”) 310 using the input unit 4 such as a keyboard (S308).
- control unit 1 stores the modification level 310 input by the user in the sample database 8 in association with the metrics information (S309). After that, the process proceeds to step S303 again, where the learning unit 12 of the control unit 1 reads the updated sample database 8, regenerates and updates the personalization level prediction model 22. After that, steps S304 to S307 are executed again.
- control unit 1 of the analyzer 300 acquires the modification level 310 assigned to the metrics information 7 by the user.
- the learning unit 12 updates the personalization level prediction model 22 based on the metrics information 7 and the modification level 310.
- the modification level 310 is a personalization level that is redefined by the user when the personalization level calculated by the metrics analysis unit 11 differs from the theory or the user's rule of thumb.
- the analyzer 300 can improve the accuracy of the personalization level prediction model 22 by performing such feedback.
- the personalization level is calculated by performing multiple regression analysis based on sample data of metric information or metric information in a past development process.
- the determination of the personalization level may be performed by a multivariate analysis other than the multiple regression analysis such as the logistic regression analysis.
- the learning unit 12 performs multivariate analysis using sample information related to the metrics information and the personalization level assigned to the sample information, and
- the humanization level prediction model 22 may be generated.
- the personalization level prediction model 22 compares the sample data of the metrics information, the metrics information in the past development process, and the personalization level given by the user with a neural network, decision tree learning, a support vector machine, or the like. It may be a learning model generated by learning.
- the analysis device including the control unit 1, the auxiliary storage unit 2, the main storage unit 3, the input unit 4, the display unit 5, and the communication I / F 6 has been described.
- these components need not be provided in a single analyzer, but may be separate devices connected via a network, for example. Therefore, in one aspect, the present invention includes a metric analysis device that performs metrics analysis, a learning device that generates the personalization level prediction model 22, and a server that stores the generated personalization level prediction model 22.
- the analysis system may be provided.
- 1 control unit 2 auxiliary storage unit, 3 main storage unit, 4 input unit, 5 display unit, 6 communication interface, 7 metrics information, 8 sample database, 11 metrics analysis unit, 12 learning unit, 21 metrics information database, 22 attributes Humanization level prediction model, 100 ° analyzer.
Landscapes
- Engineering & Computer Science (AREA)
- Software Systems (AREA)
- General Engineering & Computer Science (AREA)
- Theoretical Computer Science (AREA)
- Physics & Mathematics (AREA)
- General Physics & Mathematics (AREA)
- Stored Programmes (AREA)
Abstract
ソフトウェアの開発工程の属人化の度合いを示す属人化レベルを分析する分析装置100を提供する。この分析装置100は、開発工程に関するメトリクス情報7を受信し、メトリクス情報に基づいて属人化レベルを出力する属人化レベル予測モデル22を、メトリクス情報7に適用して、属人化レベルを判定する制御部1と、を備える。
Description
本発明は、ソフトウェアの開発工程の属人化の度合いを示す属人化レベルを分析する分析装置、分析方法およびプログラムに関する。
ソースコードやソースコードメトリクスを分析して、他者が作成したソースコードの修正必要箇所、保守性および再利用性等を利用者に提示する分析技術が知られている。これにより、特定の担当者以外の者でも、ソースコードの修正や管理を行うことができる。
例えば、特許文献1は、ソースコードメトリクスおよびプログラム開発プロジェクト情報を多変量解析することにより、修正が必要となるソースコードの優先順位を利用者に提示する分析装置を開示している。
特許文献2は、ソースコードメトリクス情報を用いて、ソースコードの共通化の標準的かつ具体的な技法を開発者に提示し、かつ、開発者が実施した共通化の結果を評価することで、最善の実施結果を開発者に通知できるソースコード管理システムを開示している。
特許文献3は、モジュール単位のメトリクスを分析することで、保守性や再利用性の低下につながるクラスを抽出するオブジェクト指向プログラム品質評価装置を開示している。
ソフトウェア開発では、特定の者に技術、進捗管理、工期管理等が依存する属人化状態が発生することがある。属人化状態が発生すると、その特定の者が急遽不在になった場合に、例えば他の者が仕様、技術、工期等を理解しておらず、開発が立ち行かなくなるおそれがある。したがって、属人化状態の発生は、機会損失に繋がり得る。
従来技術は、他者が作成したソースコードの修正必要箇所、保守性および再利用性等を利用者に提示することにより、コーディング工程についての属人化状態を解決し得る。しかしながら、前述のように、ソフトウェア開発における属人化は、コーディング工程だけでなく、仕様設計工程、外部設計工程、内部設計工程等、様々な工程において発生する。
本発明は、上記課題を解決するためになされたものであり、ソフトウェアの開発工程の属人化の度合いを示す属人化レベルを分析する分析装置、分析方法およびプログラムを提供することを目的とする。
本発明の一態様は、ソフトウェアの開発工程の属人化の度合いを示す属人化レベルを分析する分析装置を提供する。この分析装置は、開発工程に関するメトリクス情報を受信し、メトリクス情報に基づいて属人化レベルを出力する属人化レベル予測モデルを、メトリクス情報に適用して、属人化レベルを判定する制御部と、を備える。
本発明の他の態様は、ソフトウェアの開発工程の属人化の度合いを示す属人化レベルを分析する分析システムを提供する。この分析システムは、メトリクス情報に関するサンプル情報と、サンプル情報に付与された属人化レベルとに基づいて、属人化レベル予測モデルを生成する学習装置と、学習装置にネットワークを介して接続され、学習装置から受信した属人化レベル予測モデルを記憶するサーバと、サーバとにネットワークを介して接続され、属人化レベル予測モデルをサーバから受信する制御装置とを備える。制御装置は、開発工程に関するメトリクス情報を受信し、属人化レベル予測モデルを、開発工程に関するメトリクス情報に適用して、属人化レベルを判定する。
本発明の他の態様は、ソフトウェアの開発工程の属人化の度合いを示す属人化レベルを分析する分析方法を提供する。この分析方法は、制御部が、開発工程に関するメトリクス情報を受信するステップと、制御部が、メトリクス情報に基づいて属人化レベルを出力する属人化レベル予測モデルを、メトリクス情報に適用して、属人化レベルを判定するステップと、を含む。
本発明の更に他の態様は、上記の分析方法を制御部に実行させるためのプログラムを提供する。
本発明により、ソフトウェアの開発工程に関するメトリクス情報に基づいて、開発工程の属人化レベルを判定することができる。
以下、本発明の実施の形態に係る分析装置について、図面を参照して説明する。各実施の形態において、同一の構成には同一の符号を付して、重複説明を省略する。
実施の形態1.
[構成]
図1は、本発明の実施の形態1に係る分析装置100の構成を示すブロック図である。分析装置100は、制御部1と、補助記憶部2と、主記憶部3と、入力部4と、表示部5と、通信インタフェース(I/F)6とを備える。
[構成]
図1は、本発明の実施の形態1に係る分析装置100の構成を示すブロック図である。分析装置100は、制御部1と、補助記憶部2と、主記憶部3と、入力部4と、表示部5と、通信インタフェース(I/F)6とを備える。
制御部1は、種々の演算と、分析装置100の動作全体の制御とを行う処理装置である。制御部1は、プログラムを実行することにより所定の機能を実現するCPUのような汎用プロセッサを含む。制御部1は、後述のメトリクス情報を解析するための演算を行うメトリクス解析部11を含む。
補助記憶部2は、種々の情報を記録する媒体である。補助記憶部2は、具体的には、ROM、フラッシュメモリ、SSD等の半導体メモリ装置、ハードディスク等のディスク装置、その他の記憶デバイス単独でまたはそれらを適宜組み合わせて実現される。補助記憶部2には、後述のメトリクス情報データベース(DB)21、属人化レベル予測モデル22、オペレーティングシステム(OS)および制御部1が実行する制御プログラム等が格納される。
主記憶部3は、種々の情報を一時的に記録する媒体である。主記憶部3は、補助記憶部2に記憶されている制御プログラムをロードし、制御部1がロードされたプログラムを順次読み込んで実行する。また、主記憶部3は、補助記憶部2に記憶されているOSの少なくとも一部をロードし、制御部1がロードされたOSを実行して制御機能を実現する。主記憶部3は、例えばSRAM、DRAMなどの揮発性メモリで構成される。
入力部4は、ユーザから受け付けた入力指示や操作の内容を電気信号に変換して制御部1に伝達する入力用インタフェースである。入力部4は、マウス、キーボード、タッチパネル、ボタン、音声入力のためのマイク等を含む。
表示部5は、種々の情報を表示する表示装置である。表示部5は、例えば、液晶ディスプレイ、有機ELディスプレイ、プロジェクタ等により構成される。また、分析装置100は、表示部5の他に、スピーカ、プリンタ等の出力装置を備えてもよい。
通信I/F6は、ネットワークを介して、分析装置100と外部機器との通信接続を可能とするためのインタフェース回路またはモジュールである。通信I/F6は、IEEE802.3、IEEE802.11またはWi-Fi、LTE、3G、4G、5G等の規格に従って通信を行う。
[動作]
図2は、分析装置100におけるデータの流れを示す図である。図3は、分析装置100による属人化レベルの分析の流れを示すフローチャートである。図2および図3を参照して、分析装置100の動作について説明する。
図2は、分析装置100におけるデータの流れを示す図である。図3は、分析装置100による属人化レベルの分析の流れを示すフローチャートである。図2および図3を参照して、分析装置100の動作について説明する。
分析装置100には、入力部4を介して、メトリクス情報7が入力される(S101)。もっとも、これは例示であり、メトリクス情報7を制御部1に利用可能にする手段は、入力部4を介してメトリクス情報7を入力することに限定されない。例えば、メトリクス情報7は、一端サーバ等の外部記憶装置に格納され、分析装置100は、通信I/F6を介してメトリクス情報7をダウンロードしてもよい。
ここで、メトリクスとは、ソフトウェア開発における要求分析、仕様設計、外部設計、内部設計、コーディング、単体試験、組合せ試験、総合試験、およびシステム試験等のうちの少なくとも1つの開発工程の品質、生産性、信頼性等を評価するための基準を指す。
メトリクス情報7は、例えば、開発工程について説明するための文書のページ数、文書密度、文書中の図表の割合、レビュー工数、レビュー密度、レビュアー人数、欠陥指摘件数、ソースコードの複雑度、欠陥数、工程の難易度等を示す情報である。あるいは、例えば試験設計工程では、メトリクス情報7は、試験者数、試験密度、不具合検出率等を示す情報である。
さらに、メトリクス情報7は、担当者毎のレビュー密度、担当者毎のレビュー発言時間、担当者毎の不具合検出率、または、これらの値の最大値および最小値等を含んでもよい。
制御部1は、入力部4を介して受信したメトリクス情報7を分類してデータベース化し、メトリクス情報データベース21に格納する(S102)。図4は、メトリクス情報データベース21の一例を示す図である。開発工程がM段階に分解できる場合、メトリクス情報7は、メトリクス群(x1,x2,x3,・・・,xk,・・・,xM)の形式に整理できる。xkは、k段階目の開発工程(開発工程k)におけるメトリクス群を表すベクトルである。開発工程にL個のメトリクスが含まれる場合、xk=(xk1,xk2,xk3,・・・,xkL)と表すことができる。したがって、メトリクス情報データベース21は、図4に示すような表として表され、行列形式で表現することができる。
次に、図2および図3に示すように、メトリクス解析部11は、メトリクス情報データベース21と属人化レベル予測モデル22とを読み込み、メトリクス情報データベース21に格納されたメトリクス情報7を、属人化レベル予測モデル22の説明変数xに当てはめることによって、開発工程毎の属人化レベルを算出する(S103)。
図5は、属人化レベル予測モデル22の一例を示す図である。属人化レベル予測モデル22は、メトリクス情報7から属人化レベルを求めるための統計モデルである。図4では、属人化レベル予測モデル22は、M個の各開発工程にそれぞれ対応するM個の重回帰式で構成されている。重回帰式において、属人化レベルを表す目的変数y=(y1,y2,y3,・・・,yk,・・・,yM)は、メトリクス情報7を表す説明変数x=(x1,x2,x3,・・・,xk,・・・,xM)と、偏回帰係数α、βとで表される。例えば、属人化レベル予測モデル22に含まれる開発工程kの目的変数ykは、図5に示すように、次の重回帰式(1)で表される。
yk=αk+βk1xk1+βk2xk2+βk3xk3+・・・+βkLxkL(1)
偏回帰係数α、βは、メトリクス情報のサンプルデータや、過去の開発工程におけるメトリクス情報に基づいて、例えば重回帰分析を行うことによって決定される。なお、各開発工程におけるメトリクスの種類および数は同一でなくてもよい。開発工程kにおいて取得しているメトリクスの数がL個より少ないG個である場合、例えば、式(1)において、偏回帰係数βk1~βkLのうち、(L-G)個の偏回帰係数は0と考えることができる。
属人化レベル予測モデル22は、図1に示す分析装置100の入力部4を介して、外部から補助記憶部2に格納されてもよい。また、例えば、属人化レベル予測モデル22は、通信I/F6を介してサーバ等の外部記憶装置からダウンロードされ、補助記憶部2に格納されてもよい。
制御部1は、算出された開発工程毎の属人化レベルを、表示部5に表示する(S104)。これにより、ユーザは、開発工程毎の属人化レベルを認識することができる。表示部5に表示される属人化レベルは、開発工程毎の属人化の度合いを、例えば1~10の数値で表すものである。
表示部5には、すべての開発工程の属人化レベルが表示されてもよい。また、表示部5には、すべての開発工程の属人化レベルを、属人化レベルが高い順に並べて表示してもよい。これにより、ユーザは、表示部5を一目見るだけで、属人化の進んだ開発工程を認識することができる。
あるいは、算出された開発工程毎の属人化レベルは、サーバ等の外部記憶装置にアップロードされてもよい。そして、例えば特定の開発工程の管理者が使用するPCに、その開発工程の属人化レベルがダウンロードされ、これにより、管理者は、自己の管理する開発工程の属人化レベルを確認することができる。
表示部5は、説明変数xおよび偏回帰係数α、βの値を表示してもよい。これにより、ユーザは、特定のメトリクスが特定の開発工程に及ぼす影響の程度を認識することができる。例えば、式(1)で表される開発工程kの偏回帰係数(βk1,βk2,βk3,・・・,βkL)のうちβk3が最大である場合、xk3で表されるメトリクスが属人化に大きな影響を与えていることがわかる。
[効果等]
以上のように、分析装置100は、ソフトウェアの開発工程の属人化の度合いを示す属人化レベルを分析するものである。分析装置100の制御部1は、入力部4を介して、ソフトウェアの開発工程に関するメトリクス情報7を受信する。制御部1は、メトリクス情報7に基づいて属人化レベルを出力する属人化レベル予測モデル22を、メトリクス情報7に適用して、開発工程の属人化レベルを判定する。
以上のように、分析装置100は、ソフトウェアの開発工程の属人化の度合いを示す属人化レベルを分析するものである。分析装置100の制御部1は、入力部4を介して、ソフトウェアの開発工程に関するメトリクス情報7を受信する。制御部1は、メトリクス情報7に基づいて属人化レベルを出力する属人化レベル予測モデル22を、メトリクス情報7に適用して、開発工程の属人化レベルを判定する。
分析装置100により、ソフトウェアの開発工程の属人化レベルを得ることができる。これにより、属人化の度合いを定量化することができる。また、属人化レベルが高い開発工程をリストアップする等、ソフトウェアの開発工程の属人化状態を把握するためのデータ処理に分析装置100による分析結果を利用することができる。
分析装置100は、制御部1によって判定された属人化レベルを表示する表示部5を更に備えてもよい。これにより、ソフトウェアの開発工程の属人化レベルを可視化することができる。属人化レベルの可視化により、開発工程の管理者が属人化状態の緩和や解消に適切に着手することができる。したがって、例えばソフトウェア開発に関与した特定の者が急遽不在になった場合に開発が立ち行かなくなるというリスクを最小限に抑えることができる。
実施の形態2.
図6は、本発明の実施の形態2に係る分析装置200の構成を示すブロック図である。実施の形態1と比較すると、分析装置200の制御部1は、属人化レベル予測モデル22を生成する学習部12を更に備える。
図6は、本発明の実施の形態2に係る分析装置200の構成を示すブロック図である。実施の形態1と比較すると、分析装置200の制御部1は、属人化レベル予測モデル22を生成する学習部12を更に備える。
図7は、分析装置200におけるデータの流れを示す図である。図8および図9は、分析装置200による属人化レベルの分析の流れを示すフローチャートである。図7~9を参照して、分析装置200の動作について説明する。
分析装置200には、入力部4を介して、メトリクス情報7が入力される(S201)。制御部1は、入力部4を介して受信したメトリクス情報7を分類してデータベース化し、メトリクス情報データベース21に格納する(S202)。ステップS201およびS202は、実施の形態1のステップS101およびS102と同様である。
実施の形態2では、制御部1の学習部12が、属人化レベル予測モデル22を生成する(S203)。なお、ステップS203は、ステップS202の後に実行される必要はなく、例えばステップS201の前に実行されてもよい。
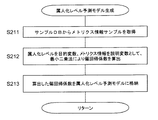
図9は、属人化レベル予測モデル22を生成するステップS203の詳細を示すフローチャートである。以下、図9を参照して属人化レベル予測モデル22を生成するステップS203について説明する。
まず、学習部12は、入力部4を介して、サンプルデータベース8からメトリクス情報のサンプルおよび属人化レベルのサンプルを取得する(S211)。図10は、サンプルデータベース8の一例を示す図である。サンプルデータベース8には、開発プロジェクトA、B、C等の過去の開発におけるメトリクス群と、ユーザが付与した属人化レベルとが関連付けられて格納されている。例えば、開発プロジェクトAの開発工程kにおけるメトリクス群xAk=(xAk1,xAk2,xAk3,・・・,xAkL)と、開発工程kに対してユーザが付与した属人化レベルyAkとが対となってサンプルデータベース8に格納されている。
サンプルデータベース8に格納されるメトリクス群は、過去の開発において取得されたものに限定されない。例えば、サンプルデータベース8に格納されるメトリクス群は、理論や経験則等に基づいてユーザによって作成されてもよい。
次に、学習部12は、開発工程毎に、取得された属人化レベルを目的変数とし、メトリクス群を説明変数として、最小二乗法によって偏回帰係数を算出する(S212)。算出された偏回帰係数は、属人化レベル予測モデル22として補助記憶部2に格納される(S213)。
このように、実施の形態2では、属人化レベル予測モデル22は、実施の形態1のように予め補助記憶部2に格納されるのではなく、制御部1の学習部12によって生成される。
図8に戻り、制御部1のメトリクス解析部11は、ステップS203の後、メトリクス情報データベース21と属人化レベル予測モデル22とを読み込み、メトリクス情報データベース21に格納されたメトリクス情報7を、属人化レベル予測モデル22の説明変数に当てはめることによって、開発工程毎の属人化レベルを算出する(S204)。次に、制御部1は、算出された開発工程毎の属人化レベルを、表示部5に表示する(S205)。これにより、ユーザは、開発工程毎の属人化レベルを認識することができる。
以上のように、分析装置200は、実施の形態1の分析装置100の構成に加えて、制御部1に学習部12を備える。学習部12は、サンプルデータベース8に格納されたメトリクス情報のサンプルと、これに付与された属人化レベルとに基づいて、属人化レベル予測モデル22を生成する。このように、分析装置200は、実施の形態1の分析装置100と異なり、属人化レベル予測モデル22を自ら生成することができる。
実施の形態3.
図11は、本発明の実施の形態3に係る分析装置300におけるデータの流れを示す図である。分析装置300の構成は、図6に示した分析装置200の構成と同様であるため、図示を省略する。
図11は、本発明の実施の形態3に係る分析装置300におけるデータの流れを示す図である。分析装置300の構成は、図6に示した分析装置200の構成と同様であるため、図示を省略する。
図12は、分析装置300による属人化レベルの分析の流れを示すフローチャートである。以下、図11~14を参照して、分析装置300の動作について説明する。
ステップS301~S305は、図8に示した実施の形態2のステップS201~S205と同様であるため、説明を省略する。
表示部5に属人化レベルを表示するステップS305の後、制御部1は、属人化レベルの再定義の要否をユーザに確認するための表示を、表示部5に表示する(S306)。ステップS306で表示部5に表示される表示は、例えば図13に示すようなダイアログボックスである。
ユーザは、ステップS305で表示された属人化レベルが正しいか否かを確認し、属人化レベルを再定義する必要の有無を判断する(S307)。例えば、ユーザは、属人化レベルを再定義する必要があると判断した場合、図13に示すようなダイアログボックス中の「Yes」ボタンをクリックする。
ユーザが属人化レベルを再定義する必要があると判断した場合、制御部1は、例えば図14に示すようなダイアログボックスを表示部5に表示する。ユーザは、キーボード等の入力部4を用いて、再定義された属人化レベル(以下、「修正レベル」という。)310を入力する(S308)。
次に、制御部1は、ユーザによって入力された修正レベル310をメトリクス情報に関連付けて、サンプルデータベース8に格納する(S309)。その後、再びステップS303に進み、制御部1の学習部12が、更新されたサンプルデータベース8を読み込み、属人化レベル予測モデル22を再生成して更新する。その後、ステップS304~S307を再び実行する。
以上のように、実施の形態3では、分析装置300の制御部1は、ユーザがメトリクス情報7に付与した修正レベル310を取得する。学習部12は、メトリクス情報7と修正レベル310とに基づいて、属人化レベル予測モデル22を更新する。
修正レベル310は、メトリクス解析部11によって算出された属人化レベルが、理論やユーザの経験則と異なる場合に、ユーザによって再定義される属人化レベルである。分析装置300は、このようなフィードバックを行うことにより、属人化レベル予測モデル22の精度を向上させることができる。
変形例.
以上、複数の実施形態を用いて本発明について説明したが、各実施形態に記載された特徴は、自由に組み合わせられてよい。また、上記の実施形態には、種々の改良、設計上の変更および削除が加えられてよく、本発明にはさまざまな変形例が存在する。
以上、複数の実施形態を用いて本発明について説明したが、各実施形態に記載された特徴は、自由に組み合わせられてよい。また、上記の実施形態には、種々の改良、設計上の変更および削除が加えられてよく、本発明にはさまざまな変形例が存在する。
例えば、上記の実施形態では、属人化レベルが、メトリクス情報のサンプルデータや、過去の開発工程におけるメトリクス情報に基づいて、重回帰分析を行うことによって算出される例を説明した。しかしながら、属人化レベルの決定は、ロジスティック回帰分析等の重回帰分析以外の多変量解析によって行われてもよい。
これを実施の形態2および実施の形態3についてみると、学習部12は、メトリクス情報に関するサンプル情報と、サンプル情報に付与された属人化レベルとを用いて多変量解析を行うことによって、属人化レベル予測モデル22を生成してもよい。
あるいは、属人化レベル予測モデル22は、メトリクス情報のサンプルデータや、過去の開発工程におけるメトリクス情報と、ユーザが付与した属人化レベルとを、ニューラルネットワーク、決定木学習、サポートベクターマシン等によって学習することによって生成される学習モデルであってもよい。
また、上記の各実施形態では、制御部1、補助記憶部2、主記憶部3、入力部4、表示部5および通信I/F6を備えた分析装置について説明した。しかしながら、これらの構成要素は、1つの分析装置内に備えられる必要はなく、例えばネットワークを介して接続された別個の装置であってもよい。したがって、本発明は、一態様では、メトリクス解析を行うメトリクス解析装置と、属人化レベル予測モデル22を生成する学習装置と、生成された属人化レベル予測モデル22を記憶するサーバと、を備えた分析システムであってもよい。
1 制御部、2 補助記憶部、3 主記憶部、4 入力部、5 表示部、6 通信インタフェース、7 メトリクス情報、8 サンプルデータベース、11 メトリクス解析部、12 学習部、21 メトリクス情報データベース、22 属人化レベル予測モデル、100 分析装置。
Claims (10)
- ソフトウェアの開発工程の属人化の度合いを示す属人化レベルを分析する分析装置であって、
前記開発工程に関するメトリクス情報を受信し、前記メトリクス情報に基づいて前記属人化レベルを出力する属人化レベル予測モデルを、前記メトリクス情報に適用して、前記属人化レベルを判定する制御部と、
を備える分析装置。 - 前記制御部は、メトリクス情報に関するサンプル情報と、前記サンプル情報に付与された属人化レベルとに基づいて、前記属人化レベル予測モデルを生成する学習部を更に備える、請求項1に記載の分析装置。
- 前記学習部は、メトリクス情報に関するサンプル情報と、前記サンプル情報に付与された属人化レベルとを用いて多変量解析を行うことによって、前記属人化レベル予測モデルを生成する、請求項2に記載の分析装置。
- 前記学習部は、メトリクス情報に関するサンプル情報と、前記サンプル情報に付与された属人化レベルとを用いた機械学習によって、前記属人化レベル予測モデルを生成する、請求項2に記載の分析装置。
- 前記制御部は、ユーザが前記メトリクス情報に付与した属人化レベルを更に取得し、
前記学習部は、前記メトリクス情報と、前記メトリクス情報に付与された属人化レベルとに基づいて、前記属人化レベル予測モデルを更新する、請求項2~4のいずれかに記載の分析装置。 - 前記制御部によって判定された前記属人化レベルを表示する表示部を更に備えた請求項1~5のいずれかに記載の分析装置。
- 前記属人化レベル予測モデルを記憶する記憶部を更に備える請求項1~6のいずれかに記載の分析装置。
- ソフトウェアの開発工程の属人化の度合いを示す属人化レベルを分析する分析システムであって、
メトリクス情報に関するサンプル情報と、前記サンプル情報に付与された属人化レベルとに基づいて、属人化レベル予測モデルを生成する学習装置と、
前記学習装置にネットワークを介して接続され、前記学習装置から受信した前記属人化レベル予測モデルを記憶するサーバと、
前記サーバにネットワークを介して接続され、前記属人化レベル予測モデルを前記サーバから受信する制御装置とを備え、
前記制御装置は、前記開発工程に関するメトリクス情報を受信し、前記属人化レベル予測モデルを、前記開発工程に関するメトリクス情報に適用して、前記属人化レベルを判定する、分析システム。 - ソフトウェアの開発工程の属人化の度合いを示す属人化レベルを分析する分析方法であって、
制御部が、前記開発工程に関するメトリクス情報を受信するステップと、
前記制御部が、前記メトリクス情報に基づいて前記属人化レベルを出力する属人化レベル予測モデルを、前記メトリクス情報に適用して、前記属人化レベルを判定するステップと、
を含む分析方法。 - 請求項9に記載の分析方法を制御部に実行させるためのプログラム。
Priority Applications (2)
| Application Number | Priority Date | Filing Date | Title |
|---|---|---|---|
| PCT/JP2018/034281 WO2020054073A1 (ja) | 2018-09-14 | 2018-09-14 | 分析装置、分析方法およびプログラム |
| JP2020546666A JP6956891B2 (ja) | 2018-09-14 | 2018-09-14 | 分析装置、分析方法およびプログラム |
Applications Claiming Priority (1)
| Application Number | Priority Date | Filing Date | Title |
|---|---|---|---|
| PCT/JP2018/034281 WO2020054073A1 (ja) | 2018-09-14 | 2018-09-14 | 分析装置、分析方法およびプログラム |
Publications (1)
| Publication Number | Publication Date |
|---|---|
| WO2020054073A1 true WO2020054073A1 (ja) | 2020-03-19 |
Family
ID=69776779
Family Applications (1)
| Application Number | Title | Priority Date | Filing Date |
|---|---|---|---|
| PCT/JP2018/034281 Ceased WO2020054073A1 (ja) | 2018-09-14 | 2018-09-14 | 分析装置、分析方法およびプログラム |
Country Status (2)
| Country | Link |
|---|---|
| JP (1) | JP6956891B2 (ja) |
| WO (1) | WO2020054073A1 (ja) |
Citations (2)
| Publication number | Priority date | Publication date | Assignee | Title |
|---|---|---|---|---|
| JP2003157345A (ja) * | 2001-11-19 | 2003-05-30 | Itid Consulting:Kk | 製品開発プロセス評価システム及び製品開発プロセス評価方法 |
| JP2015014856A (ja) * | 2013-07-04 | 2015-01-22 | 株式会社日立製作所 | ソフトウェア開発プロジェクトの評価方法及びシステム |
-
2018
- 2018-09-14 WO PCT/JP2018/034281 patent/WO2020054073A1/ja not_active Ceased
- 2018-09-14 JP JP2020546666A patent/JP6956891B2/ja not_active Expired - Fee Related
Patent Citations (2)
| Publication number | Priority date | Publication date | Assignee | Title |
|---|---|---|---|---|
| JP2003157345A (ja) * | 2001-11-19 | 2003-05-30 | Itid Consulting:Kk | 製品開発プロセス評価システム及び製品開発プロセス評価方法 |
| JP2015014856A (ja) * | 2013-07-04 | 2015-01-22 | 株式会社日立製作所 | ソフトウェア開発プロジェクトの評価方法及びシステム |
Non-Patent Citations (2)
| Title |
|---|
| MUNAKATA SATOSHI ET AL.: "Introduction of project risk identification focusing on standard risks of software development", HITACHI EAST JAPAN SOLUTIONS TECHNICAL REPORT, no. 13, 1 November 2007 (2007-11-01), pages 20 - 24 * |
| SASAGAWA FUMIYOSHI: "Approach to the technology that supports software coat estimation by risk level presumption based on machine learning", IPSJ SIG TECHNICAL REPORT, vol. 2006, no. 48, 17 May 2006 (2006-05-17), pages 25 - 32 * |
Also Published As
| Publication number | Publication date |
|---|---|
| JPWO2020054073A1 (ja) | 2021-02-15 |
| JP6956891B2 (ja) | 2021-11-02 |
Similar Documents
| Publication | Publication Date | Title |
|---|---|---|
| US11163536B2 (en) | Maintenance and commissioning | |
| CN111178512B (zh) | 器件运行神经网络的测试方法及装置 | |
| CN111488211A (zh) | 基于深度学习框架的任务处理方法、装置、设备及介质 | |
| US20240412002A1 (en) | Dialogue model training method | |
| US20200074313A1 (en) | Determining features to be included in a risk assessment instrument | |
| US12474892B2 (en) | Generative artificial intelligence industrial design code conversion | |
| CN117076335A (zh) | 一种模型测试方法、系统、介质及电子设备 | |
| JP2024064997A (ja) | 学習装置、学習方法及び学習プログラム | |
| CN115062571B (zh) | 应用于集成电路器件的数据区域动态选取方法、系统、设备和计算机可读存储介质 | |
| JP2023079183A (ja) | 情報処理システム、情報処理方法及び情報処理プログラム | |
| CN113326113B (zh) | 任务处理方法及装置、电子设备和存储介质 | |
| JP4791990B2 (ja) | プラントモデル開発システム | |
| JP6956891B2 (ja) | 分析装置、分析方法およびプログラム | |
| US20240411529A1 (en) | Data modeling method, apparatus and device, and storage medium | |
| CN113056725B (zh) | 信息处理系统以及信息处理方法 | |
| WO2011052147A1 (ja) | 評価モデル分析システム、評価モデル分析方法およびプログラム | |
| JP7536722B2 (ja) | 変更度計測装置、方法及びプログラム | |
| CN118284876A (zh) | 使用来自另一自动化领域对象的知识生成自动化领域对象的方法和系统 | |
| JP2025034904A (ja) | 情報提供装置、情報提供方法、及び情報提供プログラム | |
| US20160154724A1 (en) | Non-functional evaluation assistance device, system, method, and program | |
| JP7586980B1 (ja) | 情報提供装置、情報提供方法、及び情報提供プログラム | |
| US20250342011A1 (en) | Systems and methods for standardizing definition of software architectures | |
| EP4231154A1 (en) | Method for providing a training dataset for training and/or testing a machine learning model, method for training a machine learning model, and method for predicting timing and/or resource requirements of an unknown application running on an electronic device | |
| US20240281674A1 (en) | Information processing apparatus, information processing method and non-transitory storage medium storing information processing program thereon | |
| WO2024203382A1 (ja) | 学習モデル生成装置、検査値予測装置、学習モデル生成方法、検査値予測方法、及びコンピュータ読み取り可能な記録媒体 |
Legal Events
| Date | Code | Title | Description |
|---|---|---|---|
| 121 | Ep: the epo has been informed by wipo that ep was designated in this application |
Ref document number: 18933554 Country of ref document: EP Kind code of ref document: A1 |
|
| ENP | Entry into the national phase |
Ref document number: 2020546666 Country of ref document: JP Kind code of ref document: A |
|
| NENP | Non-entry into the national phase |
Ref country code: DE |
|
| 122 | Ep: pct application non-entry in european phase |
Ref document number: 18933554 Country of ref document: EP Kind code of ref document: A1 |