WO2020054028A1 - データ解析装置 - Google Patents
データ解析装置 Download PDFInfo
- Publication number
- WO2020054028A1 WO2020054028A1 PCT/JP2018/034006 JP2018034006W WO2020054028A1 WO 2020054028 A1 WO2020054028 A1 WO 2020054028A1 JP 2018034006 W JP2018034006 W JP 2018034006W WO 2020054028 A1 WO2020054028 A1 WO 2020054028A1
- Authority
- WO
- WIPO (PCT)
- Prior art keywords
- data
- mislabel
- analysis device
- data analysis
- sample
- Prior art date
- Legal status (The legal status is an assumption and is not a legal conclusion. Google has not performed a legal analysis and makes no representation as to the accuracy of the status listed.)
- Ceased
Links
Images







Classifications
-
- G—PHYSICS
- G16—INFORMATION AND COMMUNICATION TECHNOLOGY [ICT] SPECIALLY ADAPTED FOR SPECIFIC APPLICATION FIELDS
- G16H—HEALTHCARE INFORMATICS, i.e. INFORMATION AND COMMUNICATION TECHNOLOGY [ICT] SPECIALLY ADAPTED FOR THE HANDLING OR PROCESSING OF MEDICAL OR HEALTHCARE DATA
- G16H50/00—ICT specially adapted for medical diagnosis, medical simulation or medical data mining; ICT specially adapted for detecting, monitoring or modelling epidemics or pandemics
- G16H50/20—ICT specially adapted for medical diagnosis, medical simulation or medical data mining; ICT specially adapted for detecting, monitoring or modelling epidemics or pandemics for computer-aided diagnosis, e.g. based on medical expert systems
-
- G—PHYSICS
- G06—COMPUTING OR CALCULATING; COUNTING
- G06N—COMPUTING ARRANGEMENTS BASED ON SPECIFIC COMPUTATIONAL MODELS
- G06N20/00—Machine learning
- G06N20/10—Machine learning using kernel methods, e.g. support vector machines [SVM]
-
- G—PHYSICS
- G06—COMPUTING OR CALCULATING; COUNTING
- G06N—COMPUTING ARRANGEMENTS BASED ON SPECIFIC COMPUTATIONAL MODELS
- G06N20/00—Machine learning
- G06N20/20—Ensemble learning
-
- G—PHYSICS
- G06—COMPUTING OR CALCULATING; COUNTING
- G06N—COMPUTING ARRANGEMENTS BASED ON SPECIFIC COMPUTATIONAL MODELS
- G06N5/00—Computing arrangements using knowledge-based models
- G06N5/01—Dynamic search techniques; Heuristics; Dynamic trees; Branch-and-bound
-
- G—PHYSICS
- G06—COMPUTING OR CALCULATING; COUNTING
- G06N—COMPUTING ARRANGEMENTS BASED ON SPECIFIC COMPUTATIONAL MODELS
- G06N7/00—Computing arrangements based on specific mathematical models
- G06N7/01—Probabilistic graphical models, e.g. probabilistic networks
-
- G—PHYSICS
- G16—INFORMATION AND COMMUNICATION TECHNOLOGY [ICT] SPECIALLY ADAPTED FOR SPECIFIC APPLICATION FIELDS
- G16C—COMPUTATIONAL CHEMISTRY; CHEMOINFORMATICS; COMPUTATIONAL MATERIALS SCIENCE
- G16C20/00—Chemoinformatics, i.e. ICT specially adapted for the handling of physicochemical or structural data of chemical particles, elements, compounds or mixtures
- G16C20/70—Machine learning, data mining or chemometrics
-
- G—PHYSICS
- G16—INFORMATION AND COMMUNICATION TECHNOLOGY [ICT] SPECIALLY ADAPTED FOR SPECIFIC APPLICATION FIELDS
- G16H—HEALTHCARE INFORMATICS, i.e. INFORMATION AND COMMUNICATION TECHNOLOGY [ICT] SPECIALLY ADAPTED FOR THE HANDLING OR PROCESSING OF MEDICAL OR HEALTHCARE DATA
- G16H50/00—ICT specially adapted for medical diagnosis, medical simulation or medical data mining; ICT specially adapted for detecting, monitoring or modelling epidemics or pandemics
- G16H50/70—ICT specially adapted for medical diagnosis, medical simulation or medical data mining; ICT specially adapted for detecting, monitoring or modelling epidemics or pandemics for mining of medical data, e.g. analysing previous cases of other patients
-
- G—PHYSICS
- G01—MEASURING; TESTING
- G01N—INVESTIGATING OR ANALYSING MATERIALS BY DETERMINING THEIR CHEMICAL OR PHYSICAL PROPERTIES
- G01N33/00—Investigating or analysing materials by specific methods not covered by groups G01N1/00 - G01N31/00
- G01N33/48—Biological material, e.g. blood, urine; Haemocytometers
- G01N33/483—Physical analysis of biological material
-
- H—ELECTRICITY
- H01—ELECTRIC ELEMENTS
- H01J—ELECTRIC DISCHARGE TUBES OR DISCHARGE LAMPS
- H01J49/00—Particle spectrometers or separator tubes
- H01J49/26—Mass spectrometers or separator tubes
Definitions
- the present invention relates to a data analyzer that analyzes data collected by various methods, such as data obtained by various analyzers such as a mass spectrometer, a gas chromatograph (GC), a liquid chromatograph (LC), and a spectrometer. More specifically, the present invention relates to a data analysis device for identifying and labeling unlabeled data by using supervised learning, which is a technique of machine learning, and for predicting a label.
- supervised learning which is a technique of machine learning, and for predicting a label.
- machine learning may not include multivariate analysis, but in the present specification, machine learning includes multivariate analysis.
- Machine learning is one of the useful methods to find regularity from a large amount of diverse data and use it to predict and identify data, and its application field has been expanding in recent years. ing.
- SVM Support @ Vector @ Machine
- a neural network Neural @ Network
- a random forest Random @ Forest
- Adaboost Adaboost
- Deep @ Learning Deep Learning
- PCA Principal Component Analysis
- ICA Independent Component Analysis
- PLS Partial Least Squares
- Machine learning is roughly divided into supervised learning and unsupervised learning. For example, when identifying the presence or absence of a specific disease on the subject based on data collected by the analyzer, a large number of data are previously set for a patient suffering from the disease and a normal person not suffering from the disease. , It is possible to perform supervised learning using those data as teacher data. Recently, in particular, attempts have been made in various places to apply supervised learning to mass spectrum data acquired by a mass spectrometer to diagnose diseases such as cancer.
- FIG. 12 is an example of a peak matrix in which mass spectrum data on cancer samples and non-cancer samples is arranged as teacher data.
- This peak matrix is obtained by taking a sample in the vertical direction and a peak position (mass-to-charge ratio m / z) in the horizontal direction, and taking the signal intensity value of each peak as an element value. Therefore, each element in one row in this peak matrix indicates the signal intensity value of the peak at each mass-to-charge ratio for one sample, and each element in one column indicates the signal intensity of all the samples at a certain mass-to-charge ratio.
- the intensity values are shown.
- the samples from sample 1 to sample n-2 are cancer specimens, and each of the samples is labeled with a value of “1” indicating that the sample is cancer.
- the samples from sample n-1 to sample N are non-cancer specimens, and each of the samples is labeled with a value of “0” indicating non-cancer.
- the label is a binary label.
- One way to cope with this situation is to use a machine learning algorithm that can provide high discrimination performance even if some mislabeled samples are mixed in the teacher data.
- a reduction in discrimination performance is inevitable, and a general-purpose machine learning method that can achieve both is not realized.
- Non-Patent Document 1 Another way to cope with mislabeled samples is to find and remove mislabeled samples or relabel correctly before building a machine learning model.
- a method of detecting an error in a label given by machine learning has been proposed
- a method for determining whether or not a sample given as teacher data is a mislabel has been proposed.
- the reality is that there is only a primitive method. These methods are very labor intensive and inefficient. Even with this method, it is almost impossible to determine whether or not the sample is truly mislabeled if the diagnosis by the pathologist itself is incorrect.
- the present invention has been made to solve the above-described problem, and an object of the present invention is to accurately identify a sample having a high possibility of being in a mislabel state from a large number of data provided as teacher data. It is an object of the present invention to provide a data analysis device capable of constructing a machine learning model having high discrimination performance by removing and replacing a label.
- the present invention has been made to solve the above-described problem, and a method of constructing a machine learning model based on labeled teacher data for a plurality of samples, identifying an unknown sample using the machine learning model, and labeling the unknown sample.
- a data analysis device to be attached A mislabel detection unit that detects a sample in a mislabel state in the teacher data, the mislabel detection unit includes: a) constructing a machine learning model using model construction data that is selected from or different from the teacher data and is labeled data, and constructing the constructed machine learning model with the teacher data
- a repetition identification execution unit that repeats a series of processes of identifying and labeling samples by applying to model verification data selected from among a plurality of times, b) For a plurality of repetitions of a series of processes by the repetition identification execution unit, the number of erroneous identifications in which the label as the identification result did not match the label originally attached to the data was determined for each sample.
- a mislabel determination unit that determines whether the
- machine learning includes multivariate analysis for performing so-called supervised learning.
- the content and type of data to be analyzed are not particularly limited, but typically, analysis data and measurement data collected by various analysis devices can be used. Specifically, mass spectral data obtained by a mass spectrometer, chromatogram data obtained by GC or LC, absorption spectrum data obtained by a spectrometer, data obtained by DNA microarray analysis, etc. Can be. Of course, data collected by various other methods can be targeted.
- a machine learning model is constructed based on labeled teacher data for a given plurality (usually a very large number) of samples.
- a sample in a mislabeled state in which the label is incorrect in the given teacher data is detected. That is, the repetition identification execution unit appropriately selects, for example, model construction data and model verification data from the given teacher data, and constructs a temporary machine learning model using the former data. Then, by applying the temporary machine learning model to the latter data, the samples selected as model verification data are identified and labeled.
- the model construction data does not necessarily need to be data included in the given teacher data (that is, data to be determined as to whether or not it is in a mislabeled state), and may be completely different labeled data.
- the data for model construction and the data for model verification may partially overlap or may be completely the same. Therefore, all of the given teacher data may be used as model construction data and model verification data.
- the repetition identification execution unit repeats the above-described series of processes a plurality of times, for example, for model construction data that are not the same. Even if the machine learning method itself is the same, if the model construction data changes, the machine learning model changes, and thus identification using a plurality of different machine learning models is repeated.
- the mislabel determination unit obtains the number of erroneous identifications at the time of repeating such a series of processes a plurality of times for each sample. That is, the number of incorrect identifications for the same sample is counted.
- the mislabel determination unit is based on the number of misidentifications counted or based on the misidentification rate obtained from the number of misidentifications, It is determined whether or not each sample is in a mislabel state. It is necessary to determine whether the number of misidentifications is relatively large or small or the misidentification rate is relatively high or low for each sample. It is necessary to increase the number of repetitions of the process.
- the mislabel detection unit can detect a sample having a high possibility of having a wrong label from teacher data derived from many cancer samples. Therefore, by excluding the samples thus detected from the teacher data to improve the quality of the teacher data, it is possible to improve the identification performance of the machine learning model constructed using the teacher data. Also, if the label is a binary label such as cancer and non-cancer, it is easy to change the label, so replace the label without excluding the sample identified as likely to be mislabeled It may be left as teacher data.
- the mislabel detection unit uses the teacher data after removing the sample determined to be in the mislabel state by the mislabel determination unit from the teacher data, and the iterative identification execution unit.
- the configuration may be such that the processing by the mislabel determination unit is performed one or more times.
- the model construction data does not necessarily need to be the teacher data to be determined as to whether or not it is in the mislabel state. It is preferable to select application data.
- the mislabel detection unit includes a data division unit that divides the teacher data into model construction data and model verification data.
- the repetition identification execution unit may be configured to change data division by the data division unit every time the series of processing is executed.
- the data division unit may divide the teacher data into model construction data and model verification data at random using, for example, a random number table.
- a random number table may divide the teacher data into model construction data and model verification data at random using, for example, a random number table.
- the repetition identification executing section may be configured to use only one type of machine learning method, or may be configured to use two or more types of machine learning methods.
- the use of two or more types of machine learning techniques complicates the configuration of the device (substantially, the program for arithmetic processing).
- the accuracy of mislabel detection can be improved. Can be.
- the accuracy of mislabel detection can be increased by increasing the number of repetitions.
- the machine learning method used in the iterative identification execution unit is not particularly limited as long as it performs supervised learning.
- a random forest for example, a random forest, a support vector machine, a neural network, a linear discrimination, And a non-linear discriminant method. It is preferable to appropriately select the method to be used depending on the type and properties of the data to be analyzed. For example, according to the study of the present inventor, when identifying whether a subject is cancerous or non-cancer based on mass spectrum data obtained by mass spectrometry, the detection accuracy of mislabeling is relatively high when a random forest is used. Was confirmed to be high.
- the mislabel state determination by the mislabel determination unit can be performed based on various criteria.
- the mislabel determination unit may determine that the sample with the highest misidentification rate is in the mislabel state.
- the samples determined to be in the mislabel state are removed one by one and repeatedly identified. By repeating the processing by the execution unit and the mislabel determination unit, a plurality of samples that are likely to be in the mislabel state may be removed.
- the mislabel determination unit may determine the number of samples specified by the user to be in the mislabel state in the descending order of the misidentification rate.
- the mislabel determination unit may determine that a sample having an erroneous identification rate of 100% is in a mislabel state.
- the mislabel determination unit may determine that a sample whose misidentification rate is equal to or greater than a threshold set by a user is in a mislabel state.
- the mislabel detection unit performs the repetition until the erroneous identification rate becomes equal to or less than a predetermined threshold. It is preferable that the processing by the identification execution unit and the mislabel determination unit is repeatedly performed.
- a sample that may be in a mislabel state can be more reliably detected.
- the process may be terminated when the restriction is violated.
- the data analysis device may further include a result display processing unit that creates a table or a graph based on the identification result of the mislabel determination unit and displays the table or the graph on the display unit.
- the distribution of the number of times of misidentification and the rate of misidentification for each sample of the entire teacher data is shown in a graph. The user can easily determine the criterion.
- the data analysis device of the present invention it is possible to automatically determine whether or not the label of the given teacher data is incorrect, and to specify a sample having a high possibility of being in a mislabeled state.
- the quality of the training data is improved, a machine learning model with higher discrimination performance is constructed, and unknown samples are more accurately identified. It becomes possible.
- FIG. 1 is a functional block configuration diagram of a cancer / non-cancer discriminating apparatus which is one embodiment of a data analyzing apparatus according to the present invention.
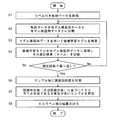
- 9 is a flowchart of a mislabel detection process in the cancer / non-cancer discriminating apparatus of the embodiment.
- 9 is a flowchart of a modified example of the mislabel detection process in the cancer / non-cancer identification device of the present embodiment.
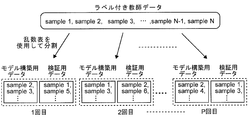
- FIG. 7 is a schematic diagram of a process of dividing teacher data in the cancer / non-cancer discriminating apparatus of the present embodiment.
- FIG. 4 is an explanatory diagram of data used for a simulation for verifying a mislabel detection ability in the cancer / non-cancer discriminating apparatus of the present embodiment.
- FIG. 1 is a functional block configuration diagram of the cancer / non-cancer discriminating apparatus of the present embodiment.
- the cancer / non-cancer discriminating apparatus when mass spectrum data obtained by mass-analyzing a biological sample from a subject with a mass spectrometer (not shown) is input as unknown sample data, whether the cancer is cancer or not is determined.
- it is a device for determining whether the subject is non-cancer, and includes a data analysis unit 1, an operation unit 2 as a user interface, and a display unit 3.
- the data analysis unit 1 includes, as functional blocks, a mislabel detection unit 10, a mislabel sample exclusion unit 17, a machine learning model creation unit 18, and an unknown data identification unit 19. Further, the mislabel detection unit 10 includes, as functional blocks, a data division unit 11, a machine learning model construction unit 12, a machine learning model application unit 13, a misclassification frequency counting unit 14, a mislabel sample identification unit 15, and a detection control unit 16. .
- each function block included in the data analysis unit 1 can be configured by hardware, in practice, a personal computer or a more sophisticated workstation is used as a hardware resource, and a dedicated computer installed in the computer is used. By executing the software on the computer, the above-described functional blocks may be realized.
- the data analysis unit 1 stores mass spectrum data (data indicating peak signal intensity for each mass-to-charge ratio at which a peak exists) from a large number of samples labeled with cancer or non-cancer as shown in FIG. It is given in advance as labeled teacher data.
- the mislabel detection unit 10 detects a sample having a high possibility of a mislabel state from the given teacher data.
- the mislabel sample exclusion unit 17 excludes the sample detected by the mislabel detection unit 10 from the teacher data, or replaces the label attached to the detected sample.
- the label is a binary value of cancer: 1 and non-cancer: 0, the label can be changed simply by changing the value from 1 to 0 and from 0 to 1.
- the machine learning model creation unit 18 constructs a machine learning model using the teacher data after some of the samples have been excluded or the labels have been replaced by the mislabel sample exclusion unit 17.
- the method of machine learning used here may be the same as the method of machine learning used in the mislabel detection unit 10 described later, but is not necessarily the same.
- the unknown data identification unit 19 uses the machine learning model constructed by the machine learning model creation unit 18 to determine mass spectrum data derived from the unknown sample, and labels the unknown sample as cancerous or non-cancer. I do. These identification results are output from the display unit 3.
- FIG. 2 is a flowchart of a mislabel detection process in the cancer / non-cancer discriminating apparatus of the present embodiment
- FIG. 4 is a schematic diagram of a process of dividing labeled teacher data.
- the data division unit 11 reads the labeled teacher data as shown in FIG. 12 (Step S1). That is, the labeled teacher data is mass spectrum data of N samples each having a sample name of sample # 1, sample # 2,..., Sample # N-1, sample # N, and each sample has cancer: "1", Non-cancer: a binary label of “0” is attached. In general, it is better to increase the number of N's, but it is desirable to confirm in advance how many numbers are required, because it depends on the nature of data.
- the data division unit 11 divides the read teacher data derived from a large number of samples into model construction data used for constructing a machine learning model and model verification data to which the constructed machine learning model is applied (Ste S2).
- data obtained from the sample whose total number is N is divided into M data sets by using a random number table, and M-1 data sets among them are used as model construction data, and the remaining data sets are used as model construction data.
- One data set is used as model verification data.
- the given teacher data is divided into model construction data and model verification data (see FIG. 4).
- M is set to 5 at the time of simulation verification described later. Since a random number table is used to divide the data, the combination of data included in the data set may be the same when the division is re-performed, but the probability is extremely low. When starting over, the combination of data included in the data set changes.
- the machine learning model construction unit 12 constructs a machine learning model by a predetermined method using the model construction data obtained in step S2, that is, as teacher data (step S3).
- the method of machine learning used here does not matter as long as it is supervised learning.
- a random forest, a support vector machine, a neural network, a linear discrimination method, a non-linear discrimination method, and the like can be used.
- the machine learning model application unit 13 applies the model verification data obtained in step S2 to the machine learning model constructed in step S3, and identifies whether each sample is cancerous or non-cancer.
- a label is provided (step S4).
- the label for each sample assigned here is stored in, for example, an internal memory in association with the sample name.
- the detection control unit 16 determines whether or not the series of processes of steps S2 to S4 has been repeated a specified number of times P (step S5). If the number of times of repetition has not reached the specified number P, the process returns to step S2.
- the data division unit 11 divides the teacher data derived from a large number of samples again into model construction data and model verification data. At this time, it is highly probable that the data for model construction and the data for model verification are different combinations from those in the first time. Even if the method of machine learning is the same, if the data for model construction is different, the machine learning model constructed based on this will naturally be different. Therefore, if a machine learning model different from the previous one is applied to the model verification data, the identification result may be different even if the same sample is included in the model verification data. Thus, the processing of steps S2 to S5 is repeated a specified number of times P while changing the division of the teacher data.
- the combination of samples included in the model verification data usually changes at each repetition of the above.
- the degrees are also included in the model verification data, and each time they are labeled by the processing in step S4. Therefore, after the number of repetitions of the above series of processing reaches the specified number P (Yes in step S5), the misclassification frequency counting unit 14 determines, for each sample, the label originally assigned and the label as the identification result. The number of mismatches, that is, the number of erroneous identifications is counted (step S6). The number of incorrect identifications is obtained for each sample included in the teacher data read in step S1.
- the mislabeled sample specifying unit 15 specifies a sample having a high possibility of being in the mislabeled state based on the number of times of misidentification obtained for each sample (step S7).
- the number of times of identification is not the same for each sample, it is not always appropriate to make a comparison with the number of erroneous identifications, which is an absolute value. Therefore, it is preferable to calculate an erroneous identification rate from the number of times of identification and the number of erroneous identifications for each sample, and specify a sample having a high possibility of being in a mislabel state based on the erroneous identification rate.
- any of the following several determination criteria may be employed. (1) One sample having the highest misidentification rate is determined to be in the mislabel state. However, when there are a plurality of samples having the highest misidentification rate, all of the plurality of samples may be determined to be in the mislabel state. (2) The user specifies in advance the number of samples determined to be in the mislabel state from the operation unit 2 as a parameter, and determines the specified number of samples in the mislabel state in descending order of the misidentification rate. (3) Only the sample whose erroneous identification rate is 100% is determined to be in the mislabel state.
- all of the plurality of samples may be determined to be in the mislabel state.
- the user specifies in advance the threshold value of the erroneous identification rate to be determined as the mislabeled state as a parameter from the operation unit 2, and determines that the sample having the erroneous identification rate equal to or more than the threshold is in the mislabeled state.
- (1) and (4) can be appropriately combined.
- (1) and (4) may be combined, and the sample having the highest misidentification rate with the misidentification rate equal to or greater than a certain threshold value may be determined to be in the mislabel state.
- a certain threshold value may be determined to be in the mislabel state.
- the mislabel detection result and the misidentification detection result are arranged in a table format or a graph format, displayed on the display unit 3, and presented to the user (step S8). Further, as described above, the mislabel sample elimination unit 17 excludes a sample determined as having a high possibility of being in a mislabel state from the teacher data or changes the label as described above, and performs actual identification. What is necessary is just to generate teacher data for constructing a learning model.
- a method called cross-validation is used to reduce a statistical error.
- a machine learning model is constructed using M-1 data sets of the M-divided data sets as model construction data, and the remaining one data set is used as model verification data. Then, the process of applying the classification to the machine learning model and performing the identification is performed M times while changing the data set selected as the model verification data, and for example, the average value of the erroneous identification rate is calculated.
- the data set divided in step S2 is only subjected to one processing, which is different from cross validation in a strict sense. However, by repeating the processes of steps S2 to S5 many times while replacing the samples included in the data set, substantially the same effect as the cross validation can be obtained.
- step S15 after it is determined as Yes in step S15, one or more samples having the highest misidentification rate obtained for each sample are removed from the teacher data as a sample in a mislabeled state (step S16). After the quality of the teacher data is increased in this way, the process returns to step S12, and the processes of steps S12 to S16 are executed again. Then, one or more samples having the highest misidentification rate obtained for each sample are removed from the teacher data again as samples in a mislabeled state. The processing of steps S12 to S16 is repeated a specified number of times Q, or if the highest misidentification rate becomes equal to or less than a predetermined value, or if the change in the misidentification rate converges to a predetermined range (step S17). Is Yes), and the process ends.
- the linear data refers to data in which there is a sufficient signal intensity difference between all marker peaks on a mass spectrum between cancer and non-cancer. If the number of marker peaks is sufficiently large and the signal intensity difference between the cancer and non-cancer is sufficient, principal component analysis or OPLS-DA (PLS-DA (Partial Least Squares Discriminant Analysis, a kind of discriminant analysis) Multivariate analysis techniques such as cancer and non-cancer. Therefore, here, data including ten marker peaks having almost no signal intensity difference between cancer and non-cancer was used for the simulation. It has been confirmed that even if this data is subjected to principal component analysis, classification into two groups is impossible.
- PLS-DA Partial Least Squares Discriminant Analysis, a kind of discriminant analysis
- a representative parameter that needs to be adjusted is the number of decision trees.
- the number of decision trees is set to 10, and an attempt is made to detect a mislabel.
- the detection results are shown in FIGS.
- FIG. 7 shows the result of detection of a mislabel in a sample labeled with non-cancer
- FIG. 8 shows the result of detection of a mislabel in a sample labeled with cancer.
- the number of times of adopting the model verification data corresponds to the number of times of performing the identification in the process of step S4.
- the misidentification rate was 100% for the mislabeled sample and 0% for the non-mislabeled sample. That is, it can be said that the mislabel detection is completely successful.
- the correct answer rate of the cancer / non-cancer determination in the mislabeled data is 99.6%, but the correct answer rate becomes 100% by removing the mislabel sample detected by the above method. . That is, it can be confirmed that by removing the sample specified as the mislabeled sample from the teacher data, it is possible to realize the construction of a machine learning model having extremely high identification performance.
- the non-linear data referred to here is data that can not distinguish cancer / non-cancer by a single peak on the mass spectrum, but can distinguish cancer / non-cancer by considering multiple peaks simultaneously. is there.
- data in which two marker peaks A and B are in an XOR (exclusive OR) state was created.
- FIG. 6 is a diagram showing the relationship between the signal intensity of the two marker peaks in the XOR state and the cancer or non-cancer state.
- the two marker peaks A and B cannot be used alone to discriminate cancer / non-cancer, if the signal intensities of the peaks A and B are both greater than or equal to the thresholds Ath and Bth, respectively, cancer (region [c]), Even if the signal intensities of the peaks A and B are both lower than the thresholds Ath and Bth, respectively, it is a cancer (region [b]).
- the signal intensity of the peak B is equal to or more than the threshold value Bth and the signal intensity of the peak A is less than the threshold value Ath, it is non-cancer (region [d]), and the signal intensity of the peak A is equal to or more than the threshold value Ath. Even if the signal intensity of B is less than the threshold value Bth, it is non-cancer (region [a]).
- the specimen ⁇ is cancer.
- the samples artificially mislabeled are 10 samples each of cancer and non-cancer (the sample numbers are exactly the same) as in the linear data. Marker peaks having exactly the same mass-to-charge ratio as the linear simulation data were selected, but two peaks out of the ten peaks were processed to be in the XOR state.
- the average correct answer rate in five-class class validation when the number of decision trees was changed for such data was examined, the average correct answer rate was 99.000 regardless of the number of decision trees in the range of 5 to 20 decision trees. 6%. Therefore, the number of decision trees is set to 10 and an attempt is made to detect a mislabel.
- the detection results are shown in FIG. 9 and FIG. FIG. FIG. 9 shows the result of detection of a mislabel in a sample labeled as non-cancer, and FIG. 10 shows the result of detection of a mislabel in a sample labeled as cancer.
- the misidentification rate was 100% for the mislabeled sample and 0% for the non-mislabeled sample. That is, it can be said that also in this case, the mislabel detection is completely successful.
- the number of times model verification data was adopted for each sample is exactly the same for linear data and non-linear data, but this is due to the fact that the random numbers in the random number table used for data division are exactly the same, and does not affect any evaluation results. Not something.
- the misidentification rate is 100% for all the mislabeled samples, and the misidentification rate is 0% for all of the samples with valid labels. This is mainly due to the characteristics of the machine learning method (random forest) used in this simulation. In the case where the misidentification rate is extremely different between the mislabel state and the case where the mislabel is not, it is easy to specify the mislabel sample based on the misidentification rate. On the other hand, when another machine learning method is used, the erroneous identification rate does not always become such.
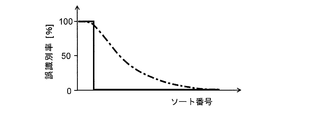
- FIG. 11 is a diagram illustrating a schematic relationship between a sort number obtained by sorting sample numbers in descending order of the erroneous identification rate and the erroneous identification rate.
- the solid line is the result of detecting a mislabel on the simulation data using the above-described random forest
- the dashed line is an example of the result of detecting a mislabel on the simulation data using the support vector machine.
- the erroneous identification rate may gradually decrease.
- the highest misidentification rate may not reach 100%. Therefore, a method of designating a threshold value for determining whether or not a sample is in a mislabeled state by the user, or excluding a sample having the highest misidentification rate one by one as shown in FIG. Useful.
- Presenting the user with a graph such as that shown in FIG. 11 or a table containing the same information can be used by the user to select a criterion for determining whether or not a mislabeled state exists, or to set parameters such as thresholds for that, Is effective for judging whether the used machine learning method is appropriate or not. Therefore, in the cancer / non-cancer discriminating apparatus of the above embodiment, after calculating the erroneous discrimination rate for each sample, a graph as shown in FIG. 11 or a table corresponding thereto is created and displayed on the screen of the display unit 3. You may make it.
- the random label is used as the machine learning method in the mislabel detection unit 10, but various supervised learning methods already exemplified, for example, support vector machines, neural networks, and linear discrimination It is obvious that a method, a non-linear discriminant method or the like can be used. The appropriate method to use depends on the properties of the data to be analyzed and the like. Therefore, a plurality of machine learning methods may be prepared in advance so that the user can arbitrarily select the method.
- model construction data and model verification data may be arbitrarily selected from a large number of teacher data (for example, using a random number table). Therefore, part of the model construction data and the model verification data may be common. Further, the data for model construction may be used as it is as the data for model verification, that is, both may be completely the same.
- the present invention is used for analyzing mass spectrum data obtained by a mass spectrometer.
- mass spectrum data obtained by a mass spectrometer.
- other various analysis data and measurement data are identified by using machine learning.
- the present invention can be applied to all devices for performing the above.
- the present invention can be used for devices that analyze chromatogram data obtained by LC devices and GC devices, absorption spectrum data obtained by spectrometers, and the like. Is clear.
- the present invention can be used for analyzing data (data obtained by digitizing images) obtained by DNA microarray analysis.
- the present invention is applied to a data analysis device that performs identification (labeling) not only by machine learning based on data obtained by such device analysis but also by machine learning based on data collected by various other methods.
- identification labeling
Landscapes
- Engineering & Computer Science (AREA)
- Theoretical Computer Science (AREA)
- Software Systems (AREA)
- Data Mining & Analysis (AREA)
- Medical Informatics (AREA)
- Physics & Mathematics (AREA)
- Evolutionary Computation (AREA)
- Computing Systems (AREA)
- General Physics & Mathematics (AREA)
- Artificial Intelligence (AREA)
- General Engineering & Computer Science (AREA)
- Mathematical Physics (AREA)
- Health & Medical Sciences (AREA)
- Computer Vision & Pattern Recognition (AREA)
- Public Health (AREA)
- General Health & Medical Sciences (AREA)
- Databases & Information Systems (AREA)
- Biomedical Technology (AREA)
- Primary Health Care (AREA)
- Pathology (AREA)
- Epidemiology (AREA)
- Probability & Statistics with Applications (AREA)
- Chemical & Material Sciences (AREA)
- Mathematical Optimization (AREA)
- Computational Mathematics (AREA)
- Pure & Applied Mathematics (AREA)
- Algebra (AREA)
- Computational Linguistics (AREA)
- Mathematical Analysis (AREA)
- Crystallography & Structural Chemistry (AREA)
- Life Sciences & Earth Sciences (AREA)
- Bioinformatics & Cheminformatics (AREA)
- Bioinformatics & Computational Biology (AREA)
- Image Analysis (AREA)
- Investigating Or Analysing Biological Materials (AREA)
- Other Investigation Or Analysis Of Materials By Electrical Means (AREA)
Abstract
与えられたラベル付き教師データをモデル構築用データとモデル検証用データとに分割し、モデル構築用データを用いて機械学習モデルを構築し、そのモデルをモデル検証用データに適用してサンプルを識別(ラベル付け)する、という一連の処理を多数回繰り返す(S2~S5)。モデル構築用データが変わると構築される機械学習モデルは変わるものの高い確率で正確な識別が可能である筈なので、ミスラベルサンプルでは、元のラベルと識別結果とが一致せず誤識別となる可能性が高い。サンプル毎にこの誤識別回数を計数し誤識別率を求めると、ミスラベルサンプルでは誤識別率が相対的に高くなるため、誤識別率に基づいてミスラベルサンプルを特定する(S6~S7)。このようにして、教師データに含まれる、ミスラベル状態である可能性が高いサンプルを高い確度で検出することにより、機械学習モデルの識別性能を向上させることができる。
Description
本発明は、質量分析装置、ガスクロマトグラフ(GC)、液体クロマトグラフ(LC)、分光測定装置といった各種分析装置で得られたデータなど、様々な手法で収集されたデータを解析するデータ解析装置に関し、さらに詳しくは、機械学習の一手法である教師あり学習を利用してラベルの付されていないデータを識別してラベル付けを行ったり、ラベルを予測したりするデータ解析装置に関する。なお、一般に「機械学習」との用語には多変量解析を含まない場合もあるが、本明細書では、機械学習は多変量解析を含むものとする。
多種多様である大量のデータの中から規則性を見いだし、それを利用してデータの予測や識別を行うために、機械学習は有用な手法の一つであり、その応用分野は近年ますます広がっている。機械学習の代表的な手法としては、サポートベクターマシン(SVM=Support Vector Machine)、ニューラルネットワーク(Neural Network)、ランダムフォレスト(Random Forest)、アダブースト(AdaBoost)、ディープラーニング(Deep Learning)、などがよく知られている。また、広義の機械学習に含まれる多変量解析の代表的な手法としては、主成分分析(PCA=Principal Component Analysis)、独立成分分析(ICA=Independent Component Analysis)、部分最小二乗法(PLS=Partial Least Squares)などがよく知られている(特許文献1等参照)。
機械学習には大別して教師あり学習と教師なし学習とがある。例えば、被検者について分析装置で収集されたデータに基づいて特定の疾病の有無を識別するような場合、その疾病に罹患している患者と罹患していない正常者とについてそれぞれ予め多数のデータを集めることが可能であれば、それらデータを教師データとする教師あり学習が可能である。最近では特に、質量分析装置により取得したマススペクトルデータに、教師あり学習を適用して、癌などの疾病の診断を行う試みが各所で進められている。
図12は、癌検体と非癌検体についてのマススペクトルデータを教師データとして整理したピークマトリクスの一例である。
このピークマトリクスは、縦方向にサンプル、横方向にピーク位置(質量電荷比m/z)をとり、各ピークの信号強度値を要素の値としたものである。したがって、このピークマトリクスにおける1行の各要素は、一つのサンプルについての各質量電荷比におけるピークの信号強度値を示しており、1列の各要素は或る質量電荷比における全てのサンプルの信号強度値を示している。ここでは、sample 1~sample n-2までのサンプルが癌検体であり、それら各サンプルには癌であることを示す「1」の値のラベルが付されている。一方、sample n-1~sample Nまでのサンプルが非癌検体であり、それら各サンプルには非癌であることを示す「0」の値のラベルが付されている。この場合、ラベルは二値のラベルである。
このピークマトリクスは、縦方向にサンプル、横方向にピーク位置(質量電荷比m/z)をとり、各ピークの信号強度値を要素の値としたものである。したがって、このピークマトリクスにおける1行の各要素は、一つのサンプルについての各質量電荷比におけるピークの信号強度値を示しており、1列の各要素は或る質量電荷比における全てのサンプルの信号強度値を示している。ここでは、sample 1~sample n-2までのサンプルが癌検体であり、それら各サンプルには癌であることを示す「1」の値のラベルが付されている。一方、sample n-1~sample Nまでのサンプルが非癌検体であり、それら各サンプルには非癌であることを示す「0」の値のラベルが付されている。この場合、ラベルは二値のラベルである。
こうしたラベル付教師データを用いることで、癌と非癌とを高い確度で識別できる機械学習モデルを構築することができる。しかしながら、場合によっては、教師データ自体のラベルが誤っていることがある。そもそも、癌と非癌(或いは他の疾病の罹患と非罹患)の判定は病理医の診断に基づくものであり、人間が判断する以上、誤りをゼロにすることは実際上不可能である。また、病理医診断結果は正しくても、それを教師データとして入力する際のオペレータの入力ミスでラベルが誤ることも考えられる。そのため、教師データとして与えられる多数のサンプルに、ラベルが誤っているミスラベル状態のサンプルが少数混じることは避けられない。
こうした状況に対応する一つの方法としては、機械学習のアルゴリズムを、教師データの中にミスラベル状態のサンプルが若干混じっていても高い識別性能が得られるようなものとすることである。しかしながら、ミスラベル状態である教師データへの耐性を高めようとすると、識別性能の低下が避けられず、それらを両立できる汎用的な機械学習の手法は実現されていない。
またミスラベル状態のサンプルが混じることの他の対応方法は、機械学習モデルを構築する前にミスラベル状態であるサンプルを見つけて除去する、又はラベルを正しく付け替えることである。非特許文献1に記載のように、機械学習によって付与されたラベルの誤りを検出する手法は提案されているものの、教師データとして与えられたサンプルがミスラベルであるのか否かを判断するための信頼性の高い統計学的な方法は従来存在しない。そのため、データにミスラベルが含まれているか否かは、例えば医療データにおいては測定日や病理医の診断結果などと教師データに付与されているラベルとが一致しているか否かを逐一チェックするという原始的な方法しかないのが実状である。こうした方法は大変に人手が掛かり効率が悪い。またこの方法でも、病理医の診断自体が誤っていた場合に、そのサンプルが真にミスラベルであるか否かを決めることは殆ど不可能である。
板橋、ほか2名、「誤ラベルデータ検出による半教師有り学習の研究」、情報処理学会全国大会講演論文集、2010年03月08日発行、第72巻、第2号、pp.463-464
本発明は上記課題を解決するために成されたものであり、その目的とするところは、教師データとして与えられた多数のデータの中から、ミスラベル状態である可能性の高いサンプルを的確に特定して除去する又はラベルの付け替えを行うことにより、識別性能の高い機械学習モデルを構築することができるデータ解析装置を提供することである。
上記課題を解決するために成された本発明は、複数のサンプルについてのラベル付けされた教師データに基づいて機械学習モデルを構築し、該機械学習モデルを用いて未知のサンプルを識別してラベル付けするデータ解析装置であって、
前記教師データの中でミスラベル状態のサンプルを検出するミスラベル検出部を備え、該ミスラベル検出部は、
a)前記教師データの中から選択した又は該教師データとは別の、ラベル付きのデータであるモデル構築用データを用いて機械学習モデルを構築し、その構築された機械学習モデルを前記教師データの中から選択したモデル検証用データに適用してサンプルを識別しラベル付けを行う、という一連の処理を複数回繰り返す繰返し識別実行部と、
b)前記繰返し識別実行部による一連の処理の複数回の繰り返しの際に、その識別結果であるラベルと元々データに付されていたラベルとが不一致であった誤識別の回数をサンプル毎に求め、その誤識別回数又はその誤識別の確率に基づいてサンプルがミスラベル状態であるか否かを判定するミスラベル判定部と、
を含むことを特徴としている。
前記教師データの中でミスラベル状態のサンプルを検出するミスラベル検出部を備え、該ミスラベル検出部は、
a)前記教師データの中から選択した又は該教師データとは別の、ラベル付きのデータであるモデル構築用データを用いて機械学習モデルを構築し、その構築された機械学習モデルを前記教師データの中から選択したモデル検証用データに適用してサンプルを識別しラベル付けを行う、という一連の処理を複数回繰り返す繰返し識別実行部と、
b)前記繰返し識別実行部による一連の処理の複数回の繰り返しの際に、その識別結果であるラベルと元々データに付されていたラベルとが不一致であった誤識別の回数をサンプル毎に求め、その誤識別回数又はその誤識別の確率に基づいてサンプルがミスラベル状態であるか否かを判定するミスラベル判定部と、
を含むことを特徴としている。
本発明に係るデータ解析装置において、機械学習はいわゆる教師あり学習を行う多変量解析を含む。また、本発明に係るデータ解析装置において、解析対象であるデータの内容や種類は特に問わないが、典型的には、様々な分析装置で収集された分析データや測定データとすることができる。具体的には、質量分析装置で得られたマススペクトルデータ、GCやLCで得られたクロマトグラムデータ、分光測定装置で得られた吸光スペクトルデータ、DNAマイクロアレイ解析で得られたデータなどとすることができる。もちろん、それ以外の様々な手法で収集されたデータを対象とすることができる。
本発明に係るデータ解析装置では、与えられた複数(通常は非常に多数)のサンプルについてのラベル付けされた教師データに基づいて機械学習モデルを構築するが、その前にミスラベル検出部は、その与えられた教師データの中でラベルが誤っているミスラベル状態のサンプルを検出する。即ち、繰返し識別実行部は、例えば与えられた教師データの中からモデル構築用データとモデル検証用データとをそれぞれ適宜選択し、前者のデータを用いて仮の機械学習モデルを構築する。そして、その仮の機械学習モデルを後者のデータに適用することで、モデル検証用データとして選択されたサンプルをそれぞれ識別しラベル付けする。なお、モデル構築用データは必ずしも与えられた教師データ(つまりはミスラベル状態か否かの判定対象であるデータ)に含まれるデータである必要はなく、全く別のラベル付きデータであってもよい。また、モデル構築用データとモデル検証用データとは一部が重なっていてもよいし、全く同一であってもよい。したがって、与えられた教師データの全てをモデル構築用データ及びモデル検証用データとしても構わない。
いま例えば、真に癌であるのに非癌のラベル付けがされたサンプル(つまりはミスラベル状態であるサンプル)を或る機械学習モデルで識別すると、多くの場合、このサンプルは癌であると識別される筈である。ただし、該サンプルに付加されているラベルは非癌のラベルであるから、識別結果であるラベルと元のラベルとが一致していないという意味で、これは誤識別であるといえる。一方、正しいラベルが付されているサンプルを同じ機械学習モデルで識別すると、多くの場合、識別結果であるラベルと元のラベルとが一致して正識別となる。機械学習モデルが一つのみである場合、或るサンプルのラベルと識別結果であるラベルとが一致せず誤識別であると判定されても、元のラベルが正しく識別が誤っているのか、逆に識別自体は正しいが元のラベルが誤っているか、を高い確度で判断することは実質上不可能である。しかしながら、確率的にいえば、ミスラベル状態である場合に誤識別となる可能性のほうが高いため、異なる複数の機械学習モデルを用いて同じサンプルについての識別を試みて誤識別の回数を計数すれば、ミスラベル状態であるサンプルでは誤識別回数が多く、一方、正しいラベルのサンプルでは誤識別回数は少なくなる筈である。
そこで繰返し識別実行部は、上述した一連の処理を、例えばそれぞれ同一でないモデル構築用データについて複数回繰り返す。機械学習の手法自体は同じであってもモデル構築用データが変わると機械学習モデルは変わるから、異なる複数の機械学習モデルを用いた識別を繰り返すことになる。ミスラベル判定部は、このような一連の処理の複数回の繰り返しの際の誤識別の回数をサンプル毎に求める。つまり同じサンプルについての誤識別回数を計数する。上述したようにミスラベル状態であるサンプルでは誤識別回数が相対的に多くなるから、ミスラベル判定部は、計数された誤識別回数に基づいて又はその誤識別回数から求めた誤識別率に基づいて、サンプル毎にミスラベル状態であるか否かを判定する。サンプル毎に誤識別回数が相対的に多いか少ないか又は誤識別率が相対的に高いか低いかを判定する必要があるから、当然のことながら、この判定に十分である程度に、上述した一連の処理の繰り返し回数を多くしておく必要がある。
以上のようにして本発明に係るデータ解析装置では、ミスラベル検出部は、多数の癌サンプル由来の教師データの中で、ラベルが誤っている可能性が高いサンプルを検出することができる。したがって、こうして検出されたサンプルを教師データから除外して教師データの質を高めることで、その教師データを用いて構築される機械学習モデルの識別性能を向上させることができる。また、ラベルが癌と非癌のような二値のラベルである場合、ラベルの付け替えは容易であるから、ミスラベル状態である可能性が高いとして特定されたサンプルを除外せずにラベルを付け替えて教師データとして残しても構わない。
本発明に係るデータ解析装置において好ましくは、前記ミスラベル検出部は、前記ミスラベル判定部によりミスラベル状態であると判定されたサンプルを教師データから除去したあとの教師データを用いて、前記繰返し識別実行部及び前記ミスラベル判定部による処理を1回以上実施する構成とするとよい。
ミスラベル状態であるサンプルを教師データから除去すると、その除去後の教師データを用いて構築された機械学習モデルの識別性能は向上する。したがって、この構成によれば、ミスラベル状態か否かを判定することが難しいデータについても高い信頼性を以て判定することが可能となり、結果的に、ミスラベル検出の精度を向上させることができる。
また本発明に係るデータ解析装置では、上述したようにモデル構築用データは必ずしもミスラベル状態か否かの判定対象である教師データである必要はないが、実用上、その教師データの中からモデル構築用データを選択することが好ましい。
そこで、本発明に係るデータ解析装置の一態様として、
前記ミスラベル検出部は、前記教師データをモデル構築用データとモデル検証用データとに分割するデータ分割部を含み、
前記繰返し識別実行部は、前記一連の処理を実行する毎に前記データ分割部によるデータ分割を変更する構成とすることができる。
前記ミスラベル検出部は、前記教師データをモデル構築用データとモデル検証用データとに分割するデータ分割部を含み、
前記繰返し識別実行部は、前記一連の処理を実行する毎に前記データ分割部によるデータ分割を変更する構成とすることができる。
この場合、具体的には、データ分割部は例えば乱数表を利用して、教師データをモデル構築用データとモデル検証用データとにランダムに分割するとよい。なお、この場合、モデル構築用データとモデル検証用データとの分割をやり直しても、ごく低い確率でそれぞれのデータが変更前と又はすでに識別を実施した処理と同じになる可能性があるが、繰り返しの回数が多ければその影響は殆ど現れない。
また本発明に係るデータ解析装置において前記繰返し識別実行部は、機械学習の手法を一種類のみ用いる構成としてもよいし、機械学習の手法を二種類以上用いる構成としてもよい。当然のことながら、機械学習の手法を二種類以上用いるとそれだけ装置の構成(実質的には演算処理のプログラム)が複雑になるが、異なる手法を適切に組み合わせることでミスラベル検出の精度を高めることができる。一方、機械学習の手法は一種類のみであっても、繰返しの回数を増やすことでミスラベル検出の精度を高めることができる。
また本発明に係るデータ解析装置において、前記繰返し識別実行部で用いる機械学習の手法は教師あり学習を行うものであれば特に限定されないが、例えば、ランダムフォレスト、サポートベクターマシン、ニューラルネットワーク、線形判別法、非線形判別法などとするとよい。どのような手法を用いるのかは、解析対象であるデータの種類、性質などにより適宜選択することが好ましい。例えば本発明者の検討によれば、質量分析により得られたマススペクトルデータに基づいて被検体が癌であるか非癌であるかを識別する場合、ランダムフォレストを用いるとミスラベルの検出精度が相対的に高いことが確認できた。
また本発明に係るデータ解析装置において、ミスラベル判定部によるミスラベル状態の判定は様々な基準で以て行うことができる。一つの態様として、前記ミスラベル判定部は、誤識別率が最も高いサンプルをミスラベル状態であると判定する構成とするとよい。
この場合、ミスラベル状態である可能性が最も高い一つのサンプルがミスラベル状態であると判定されるので、上述したように、ミスラベル状態であると判定されたサンプルを一つずつ除去しつつ、繰返し識別実行部及びミスラベル判定部による処理を繰り返すことで、ミスラベル状態である可能性が高い複数のサンプルを除去するとよい。
また別の態様として、前記ミスラベル判定部は、誤識別率が高い順に、ユーザにより指定された個数のサンプルをミスラベル状態であると判定する構成としてもよい。
この構成では、ミスラベル状態である可能性が高い複数のサンプルを一度に除去することができるため、処理時間を短縮することができる。
この構成では、ミスラベル状態である可能性が高い複数のサンプルを一度に除去することができるため、処理時間を短縮することができる。
さらにまた別の態様として、前記ミスラベル判定部は、誤識別率が100%であるサンプルをミスラベル状態であると判定する構成としてもよい。
この構成では、ミスラベル状態である可能性が高い複数のサンプルを高い信頼性を以て除去することができる。
この構成では、ミスラベル状態である可能性が高い複数のサンプルを高い信頼性を以て除去することができる。
さらにまた別の態様として、前記ミスラベル判定部は、誤識別率がユーザにより設定された閾値以上であるサンプルをミスラベル状態であると判定する構成としてもよい。
また本発明に係るデータ解析装置において、上述したように、繰返し識別実行部及びミスラベル判定部による処理を繰り返し実施する場合、前記ミスラベル検出部は、誤識別率が所定の閾値以下になるまで前記繰返し識別実行部及び前記ミスラベル判定部による処理を繰り返し実施する構成とするとよい。
この構成によれば、ミスラベル状態である可能性のあるサンプルをより確実に検出することができる。ただし、場合によっては繰り返し回数が多くなりすぎることもあるから、繰り返し回数に制限を設けたり或いは実行時間に制限を設けたりして、誤識別率が所定の閾値以下にならない場合であっても、その制限に抵触したときに処理を終了するとよい。
また本発明に係るデータ解析装置では、前記ミスラベル判定部による識別結果に基づいた表又はグラフを作成して該表又はグラフを表示部に表示する結果表示処理部、をさらに備える構成とするとよい。
具体的には、例えば教師データ全体のサンプル毎の誤識別回数や誤識別率の分布をグラフで示すことで、誤識別回数や誤識別率がどの程度であればミスラベル状態のサンプルであるとみなすかの判定基準を、ユーザが容易に決定することができる。
本発明に係るデータ解析装置によれば、与えられた教師データのラベルが誤っているか否かを自動的に判定し、ミスラベル状態である可能性が高いサンプルを特定することができる。それにより、例えばそうしたサンプルを教師データから除外したりラベルを付け替えたりすることで教師データの質を向上させ、識別性能が従来よりも高い機械学習モデルを構築し、未知サンプルをより正確に識別することが可能となる。
以下、本発明に係るデータ解析装置の一実施例である癌/非癌識別装置について、添付図面を参照して説明する。
図1は本実施例の癌/非癌識別装置の機能ブロック構成図である。
この癌/非癌識別装置は、被検者由来の生体試料を図示しない質量分析装置で質量分析することで得られたマススペクトルデータが未知サンプルデータとして入力されたとき、それが癌であるか又は非癌であるのかを判定する装置であり、データ解析部1と、ユーザインターフェイスである操作部2、表示部3と、を備える。
この癌/非癌識別装置は、被検者由来の生体試料を図示しない質量分析装置で質量分析することで得られたマススペクトルデータが未知サンプルデータとして入力されたとき、それが癌であるか又は非癌であるのかを判定する装置であり、データ解析部1と、ユーザインターフェイスである操作部2、表示部3と、を備える。
データ解析部1は、ミスラベル検出部10、ミスラベルサンプル除外部17、機械学習モデル作成部18、及び未知データ識別部19、を機能ブロックとして含む。また、ミスラベル検出部10は、データ分割部11、機械学習モデル構築部12、機械学習モデル適用部13、誤識別回数計数部14、ミスラベルサンプル特定部15、検出制御部16を機能ブロックとして含む。
データ解析部1に含まれる各機能ブロックはハードウェアで構成することも可能ではあるが、実用上は、パーソナルコンピュータやより高性能なワークステーション等をハードウェア資源とし、該コンピュータにインストールされた専用のソフトウェアを該コンピュータ上で実行することにより、上記各機能ブロックが具現化される構成とするとよい。
データ解析部1には、図12に示したような癌又は非癌のラベルが付された多数のサンプル由来のマススペクトルデータ(ピークが存在する質量電荷比毎のピーク信号強度を示すデータ)がラベル付き教師データとして予め与えられる。ミスラベル検出部10は、与えられた教師データの中でミスラベル状態の可能性が高いサンプルを検出する。ミスラベルサンプル除外部17は、ミスラベル検出部10により検出されたサンプルを教師データから除外するか、或いは、検出されたサンプルに付されているラベルを付け替える。ここでは、ラベルは癌:1、非癌:0の二値であるので、ラベルの付替えは単に1→0、0→1に値を変更すればよい。
機械学習モデル作成部18は、ミスラベルサンプル除外部17で一部のサンプルが除外された又はラベルが付け替えられたあとの教師データを用いて、機械学習モデルを構築する。ここで用いる機械学習の手法は、後述するミスラベル検出部10で用いられている機械学習の手法と同じであってもよいが、必ずしも同じである必要はない。未知データ識別部19は機械学習モデル作成部18で構築された機械学習モデルを用いて未知サンプル由来のマススペクトルデータを判定し、該未知サンプルについて癌であるか非癌であるかのラベルを付与する。こうした識別結果は表示部3から出力される。
機械学習モデル作成部18で識別性能の高い機械学習モデルを構築するには、教師データの中に混入している可能性がある誤ってラベル付けされたサンプルを、できるだけ少なくすることが重要である。そこで、本実施例の癌/非癌識別装置におけるミスラベル検出部10では、以下に述べるような特徴的な処理によって、ミスラベル状態の可能性が高いサンプルを精度良く検出している。図2は本実施例の癌/非癌識別装置におけるミスラベル検出処理のフローチャート、図4はラベル付き教師データの分割処理の模式図である。
検出制御部16の制御の下で、データ分割部11は図12に示したようなラベル付き教師データを読み込む(ステップS1)。即ち、このラベル付き教師データは、sample 1、sample 2、…、sample N-1、sample Nというサンプル名であるN個のサンプルそれぞれのマススペクトルデータであり、各サンプルに癌:「1」、非癌:「0」の二値のラベルが付されたものである。なお、一般にNの数は多いほうがよいが、どの程度の数が必要であるのかはデータの性質などによっても異なるから、予め確認しておくことが望ましい。
データ分割部11は、読み込んだ多数のサンプル由来の教師データを、機械学習モデルの構築のために使用するモデル構築用データと、構築した機械学習モデルを適用するモデル検証用データとに分割する(ステップS2)。
ここでは、総数がN個であるサンプルから得られたデータを、乱数表を用いて、M個のデータセットに分割し、そのうちのM-1個のデータセットをモデル構築用データとし、残りの1個のデータセットをモデル検証用データにする。こうして、与えられた教師データをモデル構築用データとモデル検証用データとに分割する(図4参照)。なお、後述するシミュレーション検証の際にはMを5としている。
データの分割には乱数表を用いるため、分割をやり直したときにデータセットに含まれるデータの組合せが同じであることもあり得るが、その確率は極めて低く、実際には殆どの場合、分割をやり直したときにデータセットに含まれるデータの組合せは変わる。
ここでは、総数がN個であるサンプルから得られたデータを、乱数表を用いて、M個のデータセットに分割し、そのうちのM-1個のデータセットをモデル構築用データとし、残りの1個のデータセットをモデル検証用データにする。こうして、与えられた教師データをモデル構築用データとモデル検証用データとに分割する(図4参照)。なお、後述するシミュレーション検証の際にはMを5としている。
データの分割には乱数表を用いるため、分割をやり直したときにデータセットに含まれるデータの組合せが同じであることもあり得るが、その確率は極めて低く、実際には殆どの場合、分割をやり直したときにデータセットに含まれるデータの組合せは変わる。
次に機械学習モデル構築部12は、上記ステップS2で得られたモデル構築用データを用いて、つまりは教師データとして、所定の手法による機械学習モデルを構築する(ステップS3)。ここで使用する機械学習の手法は、教師あり学習でありさえすればその手法を問わない。例えば、ランダムフォレスト、サポートベクターマシン、ニューラルネットワーク、線形判別法、非線形判別法などとすることができる。
機械学習モデル適用部13は、上記ステップS3において構築された機械学習モデルに上記ステップS2で得られたモデル検証用データを適用し、その各サンプルが癌であるか非癌であるのか識別してラベルを付与する(ステップS4)。ここで付与されたサンプル毎のラベルは、例えば内部のメモリに、サンプル名に対応付けて記憶しておく。そして、検出制御部16はステップS2~S4の一連の処理を規定回数P繰り返したか否かを判定し(ステップS5)、繰返し回数が規定回数Pに達していなければステップS2へと戻る。
ステップS2に戻ると、データ分割部11は再び多数のサンプル由来の教師データをモデル構築用データとモデル検証用データとに分割する。このとき、モデル構築用データ及びモデル検証用データはそれぞれ1回目のときとは異なる組合せである可能性がきわめて高い。機械学習の手法が同じであったとしても、モデル構築用データが異なると、これに基づいて構築される機械学習モデルも当然異なるものとなる。そこで、前回とは異なる機械学習モデルをモデル検証用データに適用すると、そのモデル検証用データの中に前回と同じサンプルがあったとしても識別結果が相違する可能性がある。こうして、教師データの分割を変えながら、ステップS2~S5の処理を規定回数Pだけ繰り返す。
上述したように、また図4に示したように、モデル検証用データに含まれるサンプルの組合せは通常、上記の繰り返しの度に変化するが、Pを或る程度大きくすれば、同じサンプルが何度もモデル検証用データに含まれ、その度にステップS4の処理によるラベル付けがなされる。そこで、上記一連の処理の繰り返し回数が規定回数Pになったあと(ステップS5でYes)、誤識別回数計数部14は、サンプル毎に、元々付与されていたラベルと識別結果であるラベルとが不一致である回数つまりは誤識別の回数を計数する(ステップS6)。この誤識別回数は、ステップS1で読み込んだ教師データに含まれるサンプル毎に求まる。
機械学習モデルに基づく識別では、本当に癌であるのに非癌であると判定する、又はその逆に本当は非癌であるのに癌であると判定するような可能性もあるものの、その確率は低い。換言すれば、元々付与されていたラベルと識別結果であるラベルとが一致しない、つまり誤識別である場合、機械学習モデルに基づく識別自体が誤っているよりも元々付与されていたラベルが誤っている(ミスラベル状態である)可能性のほうが高いといえる。もちろん、1回の識別結果のみからはそう判断するのは難しいが、機械学習モデルを変えながら識別を繰り返したときに誤識別の回数が多ければ、元々付与されていたラベルが誤っていると考えたほうが妥当である。そこで、ミスラベルサンプル特定部15は、サンプル毎に求まった誤識別回数に基づいて、ミスラベル状態である可能性が高いサンプルを特定する(ステップS7)。
ただし、識別の実行回数はサンプル毎に同じではないため、絶対値である誤識別回数で比較するのは必ずしも適切ではない。そこで、サンプル毎に、識別の実行回数と誤識別回数とから誤識別率を計算し、その誤識別率に基づいてミスラベル状態である可能性が高いサンプルを特定するとよい。
誤識別率に基づいてミスラベル状態か否かを判定する際には、次のようないくつかの判定基準のいずれかを採用すればよい。
(1)誤識別率が最も高い一つのサンプルをミスラベル状態であると判定する。ただし、誤識別率が最も高いサンプルが複数存在する場合には、その複数のサンプルの全てをミスラベル状態であると判定すればよい。
(2)ミスラベル状態であると判定するサンプルの数をパラメータとして予めユーザが操作部2から指定しておき、誤識別率が高い順にその指定された個数のサンプルをミスラベル状態であると判定する。
(3)誤識別率が100%であるサンプルのみをミスラベル状態であると判定する。誤識別率が100%であるサンプルが複数存在する場合には、その複数のサンプルの全てをミスラベル状態であると判定すればよい。
(4)ミスラベル状態であると判定する誤識別率の閾値をパラメータとして予めユーザが操作部2から指定しておき、誤識別率がその閾値以上であるサンプルをミスラベル状態であると判定する。
(1)誤識別率が最も高い一つのサンプルをミスラベル状態であると判定する。ただし、誤識別率が最も高いサンプルが複数存在する場合には、その複数のサンプルの全てをミスラベル状態であると判定すればよい。
(2)ミスラベル状態であると判定するサンプルの数をパラメータとして予めユーザが操作部2から指定しておき、誤識別率が高い順にその指定された個数のサンプルをミスラベル状態であると判定する。
(3)誤識別率が100%であるサンプルのみをミスラベル状態であると判定する。誤識別率が100%であるサンプルが複数存在する場合には、その複数のサンプルの全てをミスラベル状態であると判定すればよい。
(4)ミスラベル状態であると判定する誤識別率の閾値をパラメータとして予めユーザが操作部2から指定しておき、誤識別率がその閾値以上であるサンプルをミスラベル状態であると判定する。
もちろん、上記(1)~(4)は適宜に組み合わせることができる。例えば、(1)と(4)とを組み合わせ、誤識別率が或る閾値以上であって最も高い誤識別率のサンプルをミスラベル状態であると判定してもよい。当然、与えられた教師データの中にミスラベル状態であるサンプルが一つも存在しないということもあり得る。したがって、基本的には、誤識別率が低いサンプルはミスラベル状態ではないと推定するのが妥当であり、逆に、極端に誤識別率が高いサンプルはミスラベル状態ではあると推定するのが妥当である。
こうしてミスラベル状態であるサンプルが特定されたならば、ミスラベル検出結果や誤識別検出結果を表形式又はグラフ形式に整理して表示部3に表示し、ユーザに提示すればよい(ステップS8)。
また、上述したようにミスラベルサンプル除外部17は上述したようにミスラベル状態である可能性が高いと判定されたサンプルを教師データから除外したりラベルを付け替えたりして、実際の識別を行う機械学習モデルを構築するための教師データを生成すればよい。
また、上述したようにミスラベルサンプル除外部17は上述したようにミスラベル状態である可能性が高いと判定されたサンプルを教師データから除外したりラベルを付け替えたりして、実際の識別を行う機械学習モデルを構築するための教師データを生成すればよい。
なお、一般的に上記のような統計的な処理の際には、統計誤差を小さくするためにクロスバリデーションと呼ばれる手法が用いられる。 厳密な意味でのクロスバリデーションでは、M個に分割したデータセットのうちのM-1個のデータセットをモデル構築用データとして機械学習モデルを構築し、残りの一つのデータセットをモデル検証用データしてその機械学習モデルに適用して識別するという処理を、モデル検証用データとして選択するデータセットを変えながらM回実行して、例えば誤識別率の平均値を計算する。これに対し、上記実施例の処理では、ステップS2で分割したデータセットについては一回の処理を実施するだけであるので、厳密な意味でのクロスバリデーションとは異なる。しかしながら、データセットに含まれるサンプルを入れ替えつつステップS2~S5の処理を多数回繰り返すことにより、実質的にクロスバリデーションと同様の効果が得られることになる。
図2を用いて説明したミスラベル検出処理では、ステップS2~S4の一連の処理を規定回数Pだけ繰り返したあと、ミスラベル状態である可能性が高いサンプルを一度にまとめて検出しているが、図3に示すようにミスラベル検出処理のフローチャートを変形することもできる。図3においてステップS11~S15の処理は図2中のステップS1~S5の処理と全く同じである。
この例では、ステップS15でYesと判定されたあと、サンプル毎に求まった誤識別率が最も高い一つ又は複数のサンプルをミスラベル状態であるサンプルとして教師データから除去する(ステップS16)。こうして教師データの質を高めたあと、ステップS12に戻り、ステップS12~S16の処理を再度実行する。そうして、サンプル毎に求まった誤識別率が最も高い一つ又は複数のサンプルをミスラベル状態であるサンプルとして教師データから再び除去する。このステップS12~S16の処理を規定回数Qだけ繰り返すか、又は、最も高い誤識別率が所定の値以下になる、若しくは、その誤識別率の変化が所定の範囲に収束したならば(ステップS17でYes)、処理を終了する。
このようにミスラベル状態である可能性が高いサンプルを段階的に除去することで、ミスラベルでないサンプルを誤って除去することを避けながら、より的確に、つまりは真にミスラベル状態であるサンプルのみを除去して、教師データの質をより一層高めることができる。
[シミュレーションによるミスラベル検出処理の評価]
次に、上述したミスラベル検出処理によりミスラベル状態であるサンプルが適切に検出されるのかを、シミュレーションにより評価した結果について説明する。このシミュレーションによる評価では、上述したようにデータセットへの分割数Mは5とし、規定回数Pは500とした。また、機械学習の手法としてランダムフォレストを用いた。また、評価に用いたデータ(教師データ)としては、図5に示すように、線形データと、非線形データとの両方を用いた。
次に、上述したミスラベル検出処理によりミスラベル状態であるサンプルが適切に検出されるのかを、シミュレーションにより評価した結果について説明する。このシミュレーションによる評価では、上述したようにデータセットへの分割数Mは5とし、規定回数Pは500とした。また、機械学習の手法としてランダムフォレストを用いた。また、評価に用いたデータ(教師データ)としては、図5に示すように、線形データと、非線形データとの両方を用いた。
[線形データを用いたシミュレーションの方法と結果]
ここでいう線形データとは、癌と非癌との間で、マススペクトル上の全てのマーカーピークの信号強度差が十分に存在するデータのことをいう。マーカーピークの数が十分に多く、癌と非癌とでピークの信号強度差が十分にあれば、主成分分析やOPLS-DA(判別分析の一種であるPLS-DA(Partial Least Squares Discriminant Analysis)の改良版)などの多変量解析の手法でも癌と非癌という二つの群に分けることが可能である。そこで、ここでは、癌と非癌との間での信号強度差が殆どない10本のマーカーピークを含むデータをシミュレーションに用いた。このデータについて主成分分析を行っても二群への分類が不可能であることは確認済みである。
また、シミュレーションデータは既知のデータであるからラベルは当然100%正当である。そこで、癌及び非癌のサンプルからそれぞれランダムに10個のサンプルを選択し、それら合計20個のサンプルのラベルを付け替えることで、人為的なミスラベル検体を作成した。そして、この20個のサンプルがミスラベルサンプルであると特定できるか否かを検証した。
ここでいう線形データとは、癌と非癌との間で、マススペクトル上の全てのマーカーピークの信号強度差が十分に存在するデータのことをいう。マーカーピークの数が十分に多く、癌と非癌とでピークの信号強度差が十分にあれば、主成分分析やOPLS-DA(判別分析の一種であるPLS-DA(Partial Least Squares Discriminant Analysis)の改良版)などの多変量解析の手法でも癌と非癌という二つの群に分けることが可能である。そこで、ここでは、癌と非癌との間での信号強度差が殆どない10本のマーカーピークを含むデータをシミュレーションに用いた。このデータについて主成分分析を行っても二群への分類が不可能であることは確認済みである。
また、シミュレーションデータは既知のデータであるからラベルは当然100%正当である。そこで、癌及び非癌のサンプルからそれぞれランダムに10個のサンプルを選択し、それら合計20個のサンプルのラベルを付け替えることで、人為的なミスラベル検体を作成した。そして、この20個のサンプルがミスラベルサンプルであると特定できるか否かを検証した。
決定木を学習器としているランダムフォレストにおいては、調整を要する代表的なパラメータは決定木の数である。決定木の数を変化させたときの5分割クラスバリデーションにおける平均正答率を調べたところ、決定木が5~20の範囲で決定木数に拘わらず、平均正答率はいずれも99.6%であった。そこで、ここでは決定木数を10に定めてミスラベル検出を試みた。
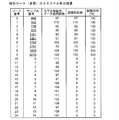
その検出結果を図7及び図8に示す。図7は非癌であるラベル付けがなされたサンプルのミスラベル検出結果、図8は癌であるラベル付けがなされたサンプルのミスラベル検出結果である。図7及び図8において(並びに後述する図9及び図10において)、モデル検証用データ採用回数はステップS4の処理による識別実行回数に相当する。
その検出結果を図7及び図8に示す。図7は非癌であるラベル付けがなされたサンプルのミスラベル検出結果、図8は癌であるラベル付けがなされたサンプルのミスラベル検出結果である。図7及び図8において(並びに後述する図9及び図10において)、モデル検証用データ採用回数はステップS4の処理による識別実行回数に相当する。
図7及び図8から分かるように、癌と非癌のいずれに対しても、ミスラベルサンプルについては誤識別率が100%になり、ミスラベルでないサンプルの誤識別率は0%であった。即ち、ミスラベル検出は完全に成功しているということができる。また、本データでは、ミスラベル混入データにおける癌/非癌判定の正答率は99.6%であるが、これは上記手法で検出されたミスラベルサンプルを除去することで正答率が100%になる。即ち、ミスラベルサンプルとして特定されたサンプルを教師データから除去することで、識別性能がきわめて高い機械学習モデルの構築が実現できることが確認できる。
[非線形データを用いたシミュレーションの方法と結果]
一般に収集されるデータの多くは少なからず非線形性を有しており、完全に線形であるデータはむしろ少ない。そこで、非線形シミュレーションデータについても上記ミスラベル検出処理の能力を評価した。
一般に収集されるデータの多くは少なからず非線形性を有しており、完全に線形であるデータはむしろ少ない。そこで、非線形シミュレーションデータについても上記ミスラベル検出処理の能力を評価した。
ここでいう非線形データとは、マススペクトル上の単一のピークでは癌/非癌の識別はできないものの、複数のピークを同時に考慮することで癌/非癌の識別が可能となるようなデータである。こうした状態である典型的なデータとして、二つのマーカーピークA、BがXOR(排他的論理和)状態であるデータを作成した。図6はXOR状態にある二つのマーカーピークの信号強度と癌又は非癌の状態との関係を示す図である。即ち、二つのマーカーピークA、Bはそれぞれ単体では癌/非癌の識別はできないものの、ピークA、Bの信号強度が共にそれぞれ閾値Ath、Bth以上であれば癌(領域[c])、またピークA、Bの信号強度が共にそれぞれ閾値Ath、Bth未満であっても癌(領域[b])である。一方、ピークBの信号強度が閾値Bth以上であってピークAの信号強度が閾値Ath未満であれば非癌(領域[d])であり、ピークAの信号強度が閾値Ath以上であってピークBの信号強度が閾値Bth未満であっても非癌(領域[a])である。したがって、例えば検体αは癌である。
人為的にミスラベルとした検体は、線形データと同じく癌、非癌それぞれ10サンプルずつ(サンプル番号も全く同じ)である。また、マーカーピークも線形シミュレーションデータと全く同じ質量電荷比のものを選択したが、10本のピークのうち、各2本がXOR状態になるように加工した。
こうしたデータについて決定木の数を変化させたときの5分割クラスバリデーションにおける平均正答率を調べたところ、決定木が5~20の範囲で決定木数に拘わらず、平均正答率はいずれも99.6%であった。そこで、ここでも決定木数を10に定めてミスラベル検出を試みた。
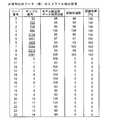
その検出結果を図9及び図10に示す。図9は非癌であるラベル付けがなされたサンプルのミスラベル検出結果、図10は癌であるラベル付けがなされたサンプルのミスラベル検出結果である。
こうしたデータについて決定木の数を変化させたときの5分割クラスバリデーションにおける平均正答率を調べたところ、決定木が5~20の範囲で決定木数に拘わらず、平均正答率はいずれも99.6%であった。そこで、ここでも決定木数を10に定めてミスラベル検出を試みた。
その検出結果を図9及び図10に示す。図9は非癌であるラベル付けがなされたサンプルのミスラベル検出結果、図10は癌であるラベル付けがなされたサンプルのミスラベル検出結果である。
図9及び図10から分かるように、癌と非癌のいずれに対しても、ミスラベルサンプルについては誤識別率が100%になり、ミスラベルでないサンプルの誤識別率は0%であった。即ち、この場合にもミスラベル検出は完全に成功しているということができる。なお、各サンプルのモデル検証用データ採用回数は線形データ、非線形データで全く同じであるが、これはデータ分割に用いた乱数表の乱数が全く同じことによるもので、何ら評価結果に影響を与えるものではない。
図7~図10を見れば明らかなように、ミスラベルサンプルについては全て誤識別率が100%であり、正当なラベルが付されたサンプルについては全て誤識別率が0%となっている。これは、主として、このシミュレーションで使用した機械学習の手法(ランダムフォレスト)の特性による。ミスラベル状態とそうでない場合とで誤識別率がこのように極端に異なる場合、誤識別率に基づいてミスラベルサンプルを特定するのは容易である。一方、別の機械学習の手法を用いた場合、誤識別率はこのようになるとは限らない。
図11は、誤識別率の高い順にサンプル番号をソートして付したソート番号と誤識別率との概略的な関係を示す図である。
図11において、実線は上述したランダムフォレストを用いた、シミュレーションデータに対するミスラベル検出結果であり、一点鎖線はサポートベクターマシンを用いた、シミュレーションデータに対するミスラベル検出結果の一例である。このように、サポートベクターマシンを用いると、誤識別率が徐々に低下することがある。また、最高の誤識別率が100%にならないこともある。そのため、ミスラベル状態であるサンプルか否かを判定する閾値をユーザが指定するようにするか、或いは、図3に示したように誤識別率が最も高いサンプルを一つずつ除外していく方法が有用である。
図11において、実線は上述したランダムフォレストを用いた、シミュレーションデータに対するミスラベル検出結果であり、一点鎖線はサポートベクターマシンを用いた、シミュレーションデータに対するミスラベル検出結果の一例である。このように、サポートベクターマシンを用いると、誤識別率が徐々に低下することがある。また、最高の誤識別率が100%にならないこともある。そのため、ミスラベル状態であるサンプルか否かを判定する閾値をユーザが指定するようにするか、或いは、図3に示したように誤識別率が最も高いサンプルを一つずつ除外していく方法が有用である。
図11に示したようなグラフ或いは同じ情報を含む表をユーザに提示することは、ミスラベル状態か否かを判定する判定基準をユーザが選択したり、そのための閾値等のパラメータを定めたり、さらには使用した機械学習の手法が適切であるか否かを判断したりするのに有効である。そこで、上記実施例の癌/非癌識別装置では、サンプル毎の誤識別率を算出したあと、図11に示すようなグラフ又はそれに相当する表などを作成して表示部3の画面上に表示するようにしてもよい。
上記実施例の癌/非癌識別装置では、ミスラベル検出部10において機械学習の手法としてランダムフォレストを用いたが、すでに例示した様々な教師あり学習の手法、例えばサポートベクターマシン、ニューラルネットワーク、線形判別法、非線形判別法などを用いることができることは明らかである。どのような手法を用いるのが適当であるかは、解析対象であるデータの性質等により異なるから、予め複数の機械学習手法を用意しておき、ユーザが任意に選択できるようしてもよい。
また、図2におけるステップS2~S5の処理の繰り返し、又は図3におけるステップS12~S15の処理の繰り返しの際に、一種類の機械学習手法を用いるのではなく複数種類の機械学習手法を用いてもよい。なお、複数の異なる種類の機械学習手法を用いる場合、当然のことながら、モデル構築用データが同じであっても構築される機械学習モデルはその機械学習手法毎に相違したものとなる。したがって、複数の異なる種類の機械学習手法を用いる場合であって、或る一つの手法による機械学習を実施したあとに別の手法による機械学習を行う際に、教師データの再分割を省略し、その前に実施した上記或る一つの手法による機械学習のときと同じモデル構築用データ及びモデル検証用データを用いて上記別の手法による機械学習を行っても構わない。
また上記実施例では、サンプル由来の教師データをモデル構築用データとモデル検証用データとに分割していたため、モデル構築用データとモデル検証用データとは必ず異なるデータになるが、これは必須ではない。例えば多数の教師データの中から任意に(例えば乱数表を用いて)モデル構築用データとモデル検証用データとをそれぞれ選択しても構わない。したがって、モデル構築用データとモデル検証用データとはその一部が共通していてもよい。また、モデル構築用データをそのままモデル検証用データに用いる、つまり両者が全く同じでも構わない。
また、上記実施例の装置は質量分析装置で得られたマススペクトルデータの解析に本発明を使用したものであるが、それ以外の様々な分析データや測定データについて機械学習を利用して何らかの識別を行う装置全般に本発明を適用できることは明らかである。例えば、質量分析装置と同様の分析装置の分野で言えば、LC装置やGC装置で得られたクロマトグラムデータ、分光測定装置で得られた吸光スペクトルデータなどを解析する装置に本発明を使用できることは明らかである。さらにまた、DNAマイクロアレイ解析で得られたデータ(画像を数値化したデータ)の解析にも本発明を使用することができる。
さらにまた、そうした機器分析によって得られたデータに基づく機械学習だけでなく、それ以外の様々な手法で収集されたデータに基づく機械学習により識別(ラベル付け)を行うデータ解析装置に本発明を利用可能であることも当然である。
即ち、上記実施例は本発明の一例にすぎず、上記記載以外の点において、本発明の趣旨の範囲で適宜変形、修正、追加等を行っても本願特許請求の範囲に包含されることは当然である。
1…データ解析部
10…ミスラベル検出部
11…データ分割部
12…機械学習モデル構築部
13…機械学習モデル適用部
14…誤識別回数計数部
15…ミスラベルサンプル特定部
16…検出制御部
17…ミスラベルサンプル除外部
18…機械学習モデル作成部
19…未知データ識別部
2…操作部
3…表示部
10…ミスラベル検出部
11…データ分割部
12…機械学習モデル構築部
13…機械学習モデル適用部
14…誤識別回数計数部
15…ミスラベルサンプル特定部
16…検出制御部
17…ミスラベルサンプル除外部
18…機械学習モデル作成部
19…未知データ識別部
2…操作部
3…表示部
Claims (16)
- 複数のサンプルについてのラベル付けされた教師データに基づいて機械学習モデルを構築し、該機械学習モデルを用いて未知のサンプルを識別してラベル付けするデータ解析装置であって、
前記教師データの中でミスラベル状態のサンプルを検出するミスラベル検出部を備え、該ミスラベル検出部は、
a)前記教師データの中から選択した又は該教師データとは別のラベル付きのデータであるモデル構築用データを用いて機械学習モデルを構築し、その構築された機械学習モデルを前記教師データの中から選択したモデル検証用データに適用してサンプルを識別しラベル付けを行う、という一連の処理を複数回繰り返す繰返し識別実行部と、
b)前記繰返し識別実行部による一連の処理の複数回の繰り返しの際に、その識別結果であるラベルと元々データに付されていたラベルとが不一致であった誤識別の回数をサンプル毎に求め、その誤識別回数又はその誤識別の確率に基づいてサンプルがミスラベル状態であるか否かを判定するミスラベル判定部と、
を備えることを特徴とするデータ解析装置。 - 請求項1に記載のデータ解析装置であって、
前記ミスラベル検出部は、前記ミスラベル判定部によりミスラベル状態であると判定されたサンプルを教師データから除去したあとの教師データを用いて、前記繰返し識別実行部及び前記ミスラベル判定部による処理を1回以上実施することを特徴とするデータ解析装置。 - 請求項1に記載のデータ解析装置であって、
前記ミスラベル検出部は、前記教師データをモデル構築用データとモデル検証用データとに分割するデータ分割部を含み、
前記繰返し識別実行部は、前記一連の処理を実行する毎に前記データ分割部によるデータ分割を変更することを特徴とするデータ解析装置。 - 請求項1に記載のデータ解析装置であって、
前記繰返し識別実行部は、機械学習の手法を一種類のみ用いることを特徴とするデータ解析装置。 - 請求項1に記載のデータ解析装置であって、
前記繰返し識別実行部は、機械学習の手法を二種類以上用いることを特徴とするデータ解析装置。 - 請求項1に記載のデータ解析装置であって、
前記繰返し識別実行部は、機械学習の手法としてランダムフォレストを用いることを特徴とするデータ解析装置。 - 請求項1に記載のデータ解析装置であって、
前記繰返し識別実行部は、機械学習の手法としてサポートベクターマシンを用いることを特徴とするデータ解析装置。 - 請求項1に記載のデータ解析装置であって、
前記繰返し識別実行部は、機械学習の手法としてニューラルネットワークを用いることを特徴とするデータ解析装置。 - 請求項1に記載のデータ解析装置であって、
前記繰返し識別実行部は、機械学習の手法として線形判別法を用いることを特徴とするデータ解析装置。 - 請求項1に記載のデータ解析装置であって、
前記繰返し識別実行部は、機械学習の手法として非線形判別法を用いることを特徴とするデータ解析装置。 - 請求項1に記載のデータ解析装置であって、
前記ミスラベル判定部は、誤識別率が最も高いサンプルをミスラベル状態であると判定することを特徴とするデータ解析装置。 - 請求項1に記載のデータ解析装置であって、
前記ミスラベル判定部は、誤識別率が高い順に、ユーザにより指定された個数のサンプルをミスラベル状態であると判定することを特徴とするデータ解析装置。 - 請求項1に記載のデータ解析装置であって、
前記ミスラベル判定部は、誤識別率が100%であるサンプルをミスラベル状態であると判定することを特徴とするデータ解析装置。 - 請求項1に記載のデータ解析装置であって、
前記ミスラベル判定部は、誤識別率がユーザにより設定された閾値以上であるサンプルをミスラベル状態であると判定することを特徴とするデータ解析装置。 - 請求項2に記載のデータ解析装置であって、
前記ミスラベル検出部は、誤識別率が所定の閾値以下になるまで前記繰返し識別実行部及び前記ミスラベル判定部による処理を繰り返し実施することを特徴とするデータ解析装置。 - 請求項1に記載のデータ解析装置であって、
前記ミスラベル判定部による識別結果に基づいた表又はグラフを作成して該表又はグラフを表示部に表示する結果表示処理部、をさらに備えることを特徴とするデータ解析装置。
Priority Applications (3)
| Application Number | Priority Date | Filing Date | Title |
|---|---|---|---|
| CN201880097252.7A CN112654864B (zh) | 2018-09-13 | 2018-09-13 | 数据解析装置 |
| PCT/JP2018/034006 WO2020054028A1 (ja) | 2018-09-13 | 2018-09-13 | データ解析装置 |
| US17/273,762 US20210350283A1 (en) | 2018-09-13 | 2018-09-13 | Data analyzer |
Applications Claiming Priority (1)
| Application Number | Priority Date | Filing Date | Title |
|---|---|---|---|
| PCT/JP2018/034006 WO2020054028A1 (ja) | 2018-09-13 | 2018-09-13 | データ解析装置 |
Publications (1)
| Publication Number | Publication Date |
|---|---|
| WO2020054028A1 true WO2020054028A1 (ja) | 2020-03-19 |
Family
ID=69778567
Family Applications (1)
| Application Number | Title | Priority Date | Filing Date |
|---|---|---|---|
| PCT/JP2018/034006 Ceased WO2020054028A1 (ja) | 2018-09-13 | 2018-09-13 | データ解析装置 |
Country Status (3)
| Country | Link |
|---|---|
| US (1) | US20210350283A1 (ja) |
| CN (1) | CN112654864B (ja) |
| WO (1) | WO2020054028A1 (ja) |
Cited By (3)
| Publication number | Priority date | Publication date | Assignee | Title |
|---|---|---|---|---|
| CN113780323A (zh) * | 2021-02-10 | 2021-12-10 | 北京沃东天骏信息技术有限公司 | 样本数据处理方法、装置、存储介质与电子设备 |
| US11429472B1 (en) | 2021-03-26 | 2022-08-30 | International Business Machines Corporation | Automated cognitive software application error detection |
| JP2023042582A (ja) * | 2021-09-14 | 2023-03-27 | 日本電気株式会社 | サンプル分析の方法、電子装置、記憶媒体、及びプログラム製品 |
Families Citing this family (8)
| Publication number | Priority date | Publication date | Assignee | Title |
|---|---|---|---|---|
| US11625641B2 (en) | 2018-12-28 | 2023-04-11 | Esurance Insurance Services, Inc. | Machine learning based function testing |
| JP7347198B2 (ja) * | 2019-12-20 | 2023-09-20 | 富士通株式会社 | 推論方法、推論プログラムおよび情報処理装置 |
| GB2593551A (en) * | 2020-03-17 | 2021-09-29 | Seechange Tech Limited | Model-based machine-learning and inferencing |
| US12518198B2 (en) | 2021-01-08 | 2026-01-06 | Bank Of America Corporation | System and method for ascertaining data labeling accuracy in supervised learning systems |
| US12216740B2 (en) * | 2021-01-08 | 2025-02-04 | Bank Of America Corporation | Data source evaluation platform for improved generation of supervised learning models |
| CN115510964B (zh) * | 2022-09-21 | 2023-05-26 | 浙江省科技项目管理服务中心 | 一种针对液相色谱仪类科学仪器的机时计算方法 |
| CN116795981A (zh) * | 2023-06-02 | 2023-09-22 | 北京明略昭辉科技有限公司 | 用于校验标注数据的方法及装置、电子设备、存储介质 |
| US20250111268A1 (en) * | 2023-09-29 | 2025-04-03 | Dell Products L.P. | Label denoising approach via embeddings and probabilities |
Citations (5)
| Publication number | Priority date | Publication date | Assignee | Title |
|---|---|---|---|---|
| JP2011210181A (ja) * | 2010-03-30 | 2011-10-20 | Secom Co Ltd | 学習装置及び対象物検知装置 |
| JP2013250809A (ja) * | 2012-05-31 | 2013-12-12 | Casio Comput Co Ltd | 多クラス識別器、方法、およびプログラム |
| JP2015087903A (ja) * | 2013-10-30 | 2015-05-07 | ソニー株式会社 | 情報処理装置及び情報処理方法 |
| JP2016502650A (ja) * | 2012-10-25 | 2016-01-28 | コーニンクレッカ フィリップス エヌ ヴェKoninklijke Philips N.V. | 臨床決定支援に対する、血栓症に対する臨床的リスク因子及び分子マーカの組み合わされた使用 |
| JP2017004509A (ja) * | 2015-06-04 | 2017-01-05 | ザ・ボーイング・カンパニーThe Boeing Company | 機械学習のための高度解析インフラストラクチャ |
Family Cites Families (8)
| Publication number | Priority date | Publication date | Assignee | Title |
|---|---|---|---|---|
| US8463718B2 (en) * | 2000-08-07 | 2013-06-11 | Health Discovery Corporation | Support vector machine-based method for analysis of spectral data |
| US6925454B2 (en) * | 2000-12-12 | 2005-08-02 | International Business Machines Corporation | Methodology for creating and maintaining a scheme for categorizing electronic communications |
| US7392199B2 (en) * | 2001-05-01 | 2008-06-24 | Quest Diagnostics Investments Incorporated | Diagnosing inapparent diseases from common clinical tests using Bayesian analysis |
| US8595153B2 (en) * | 2010-06-09 | 2013-11-26 | Microsoft Corporation | Exploring data using multiple machine-learning models |
| US8504492B2 (en) * | 2011-01-10 | 2013-08-06 | Accenture Global Services Limited | Identification of attributes and values using multiple classifiers |
| US9607272B1 (en) * | 2012-10-05 | 2017-03-28 | Veritas Technologies Llc | System and method for training data generation in predictive coding |
| US11238365B2 (en) * | 2017-12-29 | 2022-02-01 | Verizon Media Inc. | Method and system for detecting anomalies in data labels |
| US11514515B2 (en) * | 2018-07-17 | 2022-11-29 | Adobe Inc. | Generating synthetic data using reject inference processes for modifying lead scoring models |
-
2018
- 2018-09-13 WO PCT/JP2018/034006 patent/WO2020054028A1/ja not_active Ceased
- 2018-09-13 US US17/273,762 patent/US20210350283A1/en active Pending
- 2018-09-13 CN CN201880097252.7A patent/CN112654864B/zh active Active
Patent Citations (5)
| Publication number | Priority date | Publication date | Assignee | Title |
|---|---|---|---|---|
| JP2011210181A (ja) * | 2010-03-30 | 2011-10-20 | Secom Co Ltd | 学習装置及び対象物検知装置 |
| JP2013250809A (ja) * | 2012-05-31 | 2013-12-12 | Casio Comput Co Ltd | 多クラス識別器、方法、およびプログラム |
| JP2016502650A (ja) * | 2012-10-25 | 2016-01-28 | コーニンクレッカ フィリップス エヌ ヴェKoninklijke Philips N.V. | 臨床決定支援に対する、血栓症に対する臨床的リスク因子及び分子マーカの組み合わされた使用 |
| JP2015087903A (ja) * | 2013-10-30 | 2015-05-07 | ソニー株式会社 | 情報処理装置及び情報処理方法 |
| JP2017004509A (ja) * | 2015-06-04 | 2017-01-05 | ザ・ボーイング・カンパニーThe Boeing Company | 機械学習のための高度解析インフラストラクチャ |
Non-Patent Citations (1)
| Title |
|---|
| "Non-official translation: t-yotsu. Roughly Understanding Machine Learning", INCREMENTS, 13 November 2016 (2016-11-13) * |
Cited By (4)
| Publication number | Priority date | Publication date | Assignee | Title |
|---|---|---|---|---|
| CN113780323A (zh) * | 2021-02-10 | 2021-12-10 | 北京沃东天骏信息技术有限公司 | 样本数据处理方法、装置、存储介质与电子设备 |
| US11429472B1 (en) | 2021-03-26 | 2022-08-30 | International Business Machines Corporation | Automated cognitive software application error detection |
| JP2023042582A (ja) * | 2021-09-14 | 2023-03-27 | 日本電気株式会社 | サンプル分析の方法、電子装置、記憶媒体、及びプログラム製品 |
| JP7480811B2 (ja) | 2021-09-14 | 2024-05-10 | 日本電気株式会社 | サンプル分析の方法、電子装置、コンピュータ可読記憶媒体、及びコンピュータプログラム |
Also Published As
| Publication number | Publication date |
|---|---|
| US20210350283A1 (en) | 2021-11-11 |
| CN112654864B (zh) | 2025-01-10 |
| CN112654864A (zh) | 2021-04-13 |
Similar Documents
| Publication | Publication Date | Title |
|---|---|---|
| JP6729457B2 (ja) | データ解析装置 | |
| US20210350283A1 (en) | Data analyzer | |
| Jordaney et al. | Transcend: Detecting concept drift in malware classification models | |
| Matsunaga | How to Factor-Analyze Your Data Right: Do's, Don'ts, and How-To's. | |
| JP6027132B2 (ja) | 質量分析法とスコア正規化による微生物の特定方法 | |
| CN108629365A (zh) | 分析数据解析装置以及分析数据解析方法 | |
| Steichen et al. | Te, Te, Hi, Hi: Eye gaze sequence analysis for informing user-adaptive information visualizations | |
| JP6715451B2 (ja) | マススペクトル解析システム,方法およびプログラム | |
| US20200118650A1 (en) | Mass spectrometer, mass spectrometry method, and non-transitory computer readable medium | |
| CN114580982B (zh) | 一种工业设备的数据质量的评估方法、装置及设备 | |
| Skarysz et al. | Fast and automated biomarker detection in breath samples with machine learning | |
| US11435370B2 (en) | Data analying device and program for data analysis | |
| CN117038068A (zh) | 医学治疗效果的评估方法、装置、存储介质及计算机设备 | |
| JP6356015B2 (ja) | 遺伝子発現情報解析装置、遺伝子発現情報解析方法、及びプログラム | |
| Johnson et al. | Effectiveness of image-based deep learning on token-level software vulnerability detection | |
| CN119832980A (zh) | 基因变异检测方法、装置、电子设备及存储介质 | |
| EP1723249A2 (en) | Labeling of rapamycin using rapamycin-specific methylases | |
| CN113517021A (zh) | 一种癌症驱动基因预测方法 | |
| Shein et al. | A comparative study of outliers identification methods in univariate data set | |
| US20160188796A1 (en) | Methods of characterizing, determining similarity, predicting correlation between and representing sequences and systems and indicators therefor | |
| JP7757246B2 (ja) | 試料分析装置及び方法 | |
| US20200202982A1 (en) | Methods and systems for assessing the presence of allelic dropout using machine learning algorithms | |
| WO2009148527A2 (en) | Mass spectrometer output analysis tool for identification of proteins | |
| KR102072894B1 (ko) | 인트론과 엑손 구분에 기반한 이상 서열 식별 방법 | |
| CN118095850A (zh) | 一种风险监控方法及装置 |
Legal Events
| Date | Code | Title | Description |
|---|---|---|---|
| NENP | Non-entry into the national phase |
Ref country code: DE |
|
| NENP | Non-entry into the national phase |
Ref country code: JP |
|
| 122 | Ep: pct application non-entry in european phase |
Ref document number: 18933293 Country of ref document: EP Kind code of ref document: A1 |
|
| WWG | Wipo information: grant in national office |
Ref document number: 201880097252.7 Country of ref document: CN |