WO2019093263A1 - 解析装置、解析方法プログラムおよび不揮発性記憶媒体 - Google Patents
解析装置、解析方法プログラムおよび不揮発性記憶媒体 Download PDFInfo
- Publication number
- WO2019093263A1 WO2019093263A1 PCT/JP2018/040960 JP2018040960W WO2019093263A1 WO 2019093263 A1 WO2019093263 A1 WO 2019093263A1 JP 2018040960 W JP2018040960 W JP 2018040960W WO 2019093263 A1 WO2019093263 A1 WO 2019093263A1
- Authority
- WO
- WIPO (PCT)
- Prior art keywords
- probability
- reaction amount
- pathway
- amount data
- known pathway
- Prior art date
- Legal status (The legal status is an assumption and is not a legal conclusion. Google has not performed a legal analysis and makes no representation as to the accuracy of the status listed.)
- Ceased
Links
Images








Classifications
-
- G—PHYSICS
- G16—INFORMATION AND COMMUNICATION TECHNOLOGY [ICT] SPECIALLY ADAPTED FOR SPECIFIC APPLICATION FIELDS
- G16B—BIOINFORMATICS, i.e. INFORMATION AND COMMUNICATION TECHNOLOGY [ICT] SPECIALLY ADAPTED FOR GENETIC OR PROTEIN-RELATED DATA PROCESSING IN COMPUTATIONAL MOLECULAR BIOLOGY
- G16B40/00—ICT specially adapted for biostatistics; ICT specially adapted for bioinformatics-related machine learning or data mining, e.g. knowledge discovery or pattern finding
- G16B40/20—Supervised data analysis
-
- G—PHYSICS
- G01—MEASURING; TESTING
- G01N—INVESTIGATING OR ANALYSING MATERIALS BY DETERMINING THEIR CHEMICAL OR PHYSICAL PROPERTIES
- G01N33/00—Investigating or analysing materials by specific methods not covered by groups G01N1/00 - G01N31/00
- G01N33/48—Biological material, e.g. blood, urine; Haemocytometers
- G01N33/50—Chemical analysis of biological material, e.g. blood, urine; Testing involving biospecific ligand binding methods; Immunological testing
- G01N33/68—Chemical analysis of biological material, e.g. blood, urine; Testing involving biospecific ligand binding methods; Immunological testing involving proteins, peptides or amino acids
- G01N33/6803—General methods of protein analysis not limited to specific proteins or families of proteins
- G01N33/6845—Methods of identifying protein-protein interactions in protein mixtures
-
- G—PHYSICS
- G06—COMPUTING OR CALCULATING; COUNTING
- G06N—COMPUTING ARRANGEMENTS BASED ON SPECIFIC COMPUTATIONAL MODELS
- G06N7/00—Computing arrangements based on specific mathematical models
- G06N7/01—Probabilistic graphical models, e.g. probabilistic networks
-
- G—PHYSICS
- G06—COMPUTING OR CALCULATING; COUNTING
- G06N—COMPUTING ARRANGEMENTS BASED ON SPECIFIC COMPUTATIONAL MODELS
- G06N20/00—Machine learning
-
- G—PHYSICS
- G16—INFORMATION AND COMMUNICATION TECHNOLOGY [ICT] SPECIALLY ADAPTED FOR SPECIFIC APPLICATION FIELDS
- G16B—BIOINFORMATICS, i.e. INFORMATION AND COMMUNICATION TECHNOLOGY [ICT] SPECIALLY ADAPTED FOR GENETIC OR PROTEIN-RELATED DATA PROCESSING IN COMPUTATIONAL MOLECULAR BIOLOGY
- G16B5/00—ICT specially adapted for modelling or simulations in systems biology, e.g. gene-regulatory networks, protein interaction networks or metabolic networks
- G16B5/20—Probabilistic models
Definitions
- the present invention relates to a technique for analyzing the consistency between reaction amount data and a known pathway when predetermined treatments are performed on a plurality of substances contained in a sample.
- Protein phosphorylation is a kinase-catalyzed reaction that regulates various life functions such as cell growth, transcriptional regulation, cell death, and metabolism. It is known that diseases such as cancer also occur due to abnormalities in phosphoenzymes, and phosphorylation signal pathways have a great influence on human diseases. It is thought that useful information can be obtained for drug discovery, disease diagnosis and the like by analyzing phosphorylation signals (Non-patent Document 1).
- Non-Patent Document 1 discloses a method of analyzing phosphorylation signals using a peptide array.
- the present invention is used for early diagnosis of a disease by comparing the phosphorylation pattern of a normal cell with the phosphorylation pattern of a sample cell (non-patent document 1, page 99 right column to page 100 left column).
- Non-Patent Document 1 The method described in Non-Patent Document 1 was able to find peptides with different degrees of phosphorylation between normal cells and sample cells, and could not analyze the phosphorylation signal pathway.
- Non-Patent Document 2 a method of evaluating the consistency between measurement data and a network structure.
- the method disclosed in Non-Patent Document 2 is a method when the network structure is a directed acyclic graph (DAG).
- DAG directed acyclic graph
- An object of the present invention is to provide a method of analyzing the consistency between reaction amount data of a plurality of substances contained in a sample and a known pathway in view of the above background.
- the analysis method of the present invention is an analysis method for analyzing the consistency between reaction amount data and a known pathway when predetermined processing is performed on a plurality of substances contained in a sample, using an analyzer.
- the analysis device acquires the reaction amount data of a plurality of samples;
- B reading the data of the known pathway from the storage unit storing the data of the known pathway having the substance as a node, and determining the consistency between the known pathway and the reaction amount data;
- the known pathway is an undirected graph, determining consistency with the known pathway by the following steps: (B-1) decomposing the known pathway into a plurality of subgraphs of two nodes connected to each other; (B-2) applying the reaction amount data to each subgraph to obtain a partial correlation coefficient between each node, and combining the probability values of the independence test of the partial correlation coefficients to obtain the known pathway Obtaining a joint probability value representing independence to the reaction amount data; (B-3) generating a plurality of graphs having the same number of nodes as
- An analysis method is an analysis method in which an analysis device determines a target substance based on reaction amount data when predetermined treatments are performed on a plurality of substances contained in a sample, Have the following steps: (A) the analysis device acquires the reaction amount data of a plurality of samples; (B) The analysis device reads out the data of the known pathway from the storage unit storing data of the known pathway having the substance as a node, and the reaction amount data is known to have consistency with a predetermined threshold or more Selecting a pathway according to the following step if the known pathway stored in the storage unit is an undirected graph; (B-1) decomposing the known pathway into a plurality of subgraphs of two nodes connected to each other; (B-2) applying the reaction amount data to each subgraph to obtain a partial correlation coefficient between each node, and combining the probability values of the independence test of the partial correlation coefficients to obtain the known pathway Obtaining a joint probability value representing independence to the reaction amount data; (B-3) generating a plurality of
- the analysis method of the present invention further includes the step of (e) determining, as a signature substance, a substance in which the reaction amount data has a difference greater than or equal to a predetermined threshold value with respect to the reaction amount of the control.
- the target substance may be determined using the data of the signature substance determined in the step (e).
- FIG. 1 is a diagram showing the configuration of an analysis apparatus according to the first embodiment.
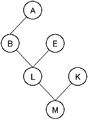
- FIG. 2A is a diagram showing an example of a known pathway.
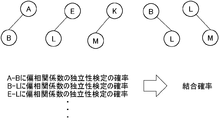
- FIG. 2B is a diagram showing an example in which a known pathway is decomposed into subgraphs.
- FIG. 3A is a diagram showing an example of reaction amount data to be analyzed.
- FIG. 3B is a diagram showing an example of the correlation between two substances A and B.
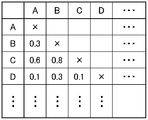
- FIG. 4 is a table describing an example of the correlation coefficient of each substance.
- FIG. 5A shows an example of a number of randomly generated networks.
- FIG. 5B is a diagram illustrating an example of a number of randomly generated networks.
- FIG. 5C shows an example of a number of randomly generated networks.
- FIG. 5A shows an example of a number of randomly generated networks.
- FIG. 5B is a diagram illustrating an example of a number of randomly generated networks.
- FIG. 5C shows an example of a number of randomly generated networks.
- FIG. 6 is a diagram showing a probability distribution of connection probabilities of random networks.
- FIG. 7 is a diagram showing the operation of the analysis device of the first embodiment.
- FIG. 8 is a diagram showing a probability distribution of connection probabilities obtained using correlation coefficients instead of partial correlation coefficients.
- FIG. 9 is a diagram showing an outline of an analysis method according to the second embodiment.
- FIG. 10 is a diagram showing the configuration of an analysis apparatus according to the second embodiment.
- FIG. 11 is a diagram illustrating an example of network estimation.
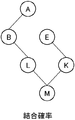
- FIG. 12A is a diagram illustrating an example of a known pathway (DAG).
- FIG. 12B is a diagram showing an example in which a known pathway (DAG) is decomposed into subgraphs.
- FIG. 13 is a diagram showing the operation of the analysis device of the second embodiment.
- FIG. 14 is a diagram showing an outline of an analysis method of the third embodiment.
- FIG. 15 is a diagram showing the configuration of an analysis apparatus according to the third embodiment.
- FIG. 1 is a diagram showing the configuration of the analysis device 1 according to the first embodiment.
- the analysis device 1 according to the first embodiment determines the consistency between the known pathway having the undirected graph network structure and the reaction amount data.
- An undirected graph which is an analysis target of the analysis device 1 according to the present embodiment, is a nondirected graph which does not have a closed loop. Since the pathway has a structure of a network in which substances are nodes and the nodes are connected by a link, the evaluation of the integrity of the pathway and reaction amount data is performed by evaluating the pathway as a network.
- the “pathway” is a connection between substances found by experiments, and the “network” is a connection between substances in computational biology.
- a graph is a term when expressing the structure of a network mathematically.
- the analyzer 1 includes an input unit 10 for inputting reaction amount data, an output unit 11 for outputting an analysis result, and an operation processing unit 12 for determining the consistency between the reaction amount data and a known pathway.
- the analysis apparatus 1 is configured by a computer including a CPU, a RAM, a ROM, a hard disk, a display, a keyboard, a mouse, a communication interface, and the like.
- a program for analysis processing is stored in the ROM, and the CPU reads out the program from the ROM and executes it, whereby the computer performs processing to determine the consistency between the reaction amount data and the known pathway.
- the program may be stored not in the ROM but in a non-volatile storage medium that is removable from the computer. In this case, the computer reads out and executes the information processing program from the storage medium to perform processing of determining the consistency between the reaction amount data and the known pathway.
- An example of the input unit 10 is a communication interface.
- reaction amount data acquired by a microarray or the like is received and taken into the analyzer 1.
- the received reaction amount data is temporarily stored in the hard disk.
- An example of the output unit 11 is a display.
- the arithmetic processing unit 12 has a network consistency determination unit 14 which finds consistency between the input reaction amount data and a known pathway.
- the known pathway is a pathway having an undirected graph network structure that does not have a closed path. The processing of the network consistency determination unit 14 will be described below.
- FIG. 2A is a diagram showing an example of a known pathway.
- the network consistency determination unit 14 decomposes the known pathway into a subgraph composed of two nodes connected by links.
- the network consistency determination unit 14 obtains a first-order partial correlation coefficient between nodes in each subgraph based on the reaction amount data.
- the correlation between substances will be described.
- FIG. 3A is a diagram showing an example of reaction amount data to be analyzed, and in FIG. 3A, reaction amount data is described in a matrix shape so as to simulate a microarray.
- the reaction amount data is quantitative data representing the degree to which each substance has reacted by a predetermined treatment.
- the correlation between the two substances A and B can be obtained by plotting the reaction amount of the substance A and the reaction amount of the substance B of each sample, and the relation can be obtained.
- the correlation coefficient can be determined.
- FIG. 4 is a table describing an example of the correlation coefficient of each substance obtained by the method shown in FIG. 3B. It can be seen from FIG. 4 that the correlation coefficient between substance A and substance B is 0.3, and the correlation coefficient between substance A and substance C is 0.6.
- first-order partial correlation coefficients between substances are used to evaluate the network.
- the partial correlation coefficient is a coefficient showing a true correlation excluding the influence of other variables other than the two variables of interest, and can be calculated by a known method.
- the network consistency determination unit 14 determines the probability of the independence test between each node of the known pathway. Then, as shown in FIG. 2B, the network consistency determination unit 14 integrates the probability of the independence test between each node according to the Fisher's joint probability, and expresses the probability representing the independence to the reaction amount data of the known pathway. Ask. In this embodiment, by using the partial correlation coefficient, it is possible to detect a false correlation that can not be detected by the correlation coefficient and estimate the overall consistency more accurately. Although, in the present embodiment, Fisher's joint probability is used to integrate the probability of independence test between each node, it may be integrated by other joint probabilities, for example, Brown's joint probability. .
- the network consistency determination unit 14 randomly generates a number of networks having the same number of nodes and the same number of links as the known pathway.
- 10000 networks are generated.
- networks in which both the known pathway and the number of nodes and links have the same number are randomly generated, but the number of links does not have to be the same.
- the network consistency determination unit 14 may randomly generate a network having the same number of nodes as the number of known pathways and different numbers of links.
- the network consistency determination unit also determines the connection probability of these networks using the method described in FIG. 2B. That is, the network is decomposed into subgraphs, the probability of the independence test is determined from the partial correlation coefficient of the subgraph, and these are combined to determine the connection probability value of the network. In this way, connection probabilities for 10000 networks are obtained.
- FIG. 6 is a diagram showing the distribution of connection probabilities of randomly generated networks.
- the horizontal axis of the graph shown in FIG. 6 is the ⁇ 2 value (chi-square value) of the connection probability of the random network, and the vertical axis is the frequency.
- the ⁇ 2 value has a distribution with peaks at 300 to 360.
- the known pathway is consistent with the reaction mass data means that the known pathway is not independent of the reaction mass data (the known pathway is independent of the reaction mass data, It means that both are irrelevant). Therefore, when the ⁇ 2 value of the connection probability of the known pathway is, for example, near the average value (within a predetermined range including the average) of the probability distribution of the randomly generated network, the known pathway is On the other hand, it means that the independence is high and the consistency is not high.
- the network consistency determination unit 14 obtains the upper probability density from the connection probability value of the known pathway in the distribution of the connection probability.
- This probability density is a graph consistency probability (GCP: Graph Consistency Probability) between the known pathway and the reaction amount data.
- GCP graph consistency probability
- a predetermined threshold for example, 0.2
- the network consistency determination unit 14 can determine that there is consistency with the reaction amount data.
- FIG. 7 is a diagram showing the operation of the analysis device 1 according to the first embodiment.
- the analyzer 1 inputs reaction amount data of the sample (S10). Further, the analysis device 1 reads out from the storage unit 13 a known pathway to be compared with the reaction amount data (S11). The analysis device 1 decomposes the known pathway into a plurality of subgraphs of two nodes connected to each other (S12). Subsequently, for each subgraph, the analysis device 1 obtains the probability of the independence test based on the partial correlation coefficient between nodes, and obtains the connection probability of the known pathway by combining the probabilities (S13). .
- the analysis device 1 randomly generates a network having the same number of nodes and the same number of links as the known pathway (S14). In the present embodiment, 10000 networks are generated. Subsequently, the analysis device 1 obtains the connection probability of the independence test even for the randomly generated network, and generates a probability distribution of the connection probability (S15). In the generated probability distribution, the analysis device 1 obtains the upper probability density from the connection probability value of the known pathway, and sets it as GCP (S16). The analysis device 1 outputs the obtained GCP value.
- the configuration and operation of the analysis device 1 according to the first embodiment have been described above.
- the analysis device 1 according to the first embodiment determines the probability of the independence test between nodes using the first-order partial correlation coefficient, and combines the probabilities among the nodes thus determined to determine the connection probability of the network. . Then, since the GCP is calculated based on this connection probability, it is possible to obtain an appropriate GCP, and to evaluate the integrity of the network.
- FIG. 8 is an example in which GCP is obtained by the same method as the present embodiment, using the correlation coefficient instead of the first-order partial correlation coefficient, for the same data as shown in FIG.
- the distribution of ⁇ 2 values of the joint probability was a distribution having a peak around 550 to 600.
- the correlation coefficient was used as described above, it was determined that the known pathway was not consistent with the reaction amount data (included in the distribution of randomly generated networks).
- the determination result when the partial correlation coefficient is not used is an error.
- the correct evaluation can be performed by evaluating the consistency between the reaction amount data and the known pathway using the partial correlation coefficient.
- the analysis apparatus, the analysis method, and the program stored in the non-volatile storage medium according to the present embodiment are useful for finding pathways activated or suppressed in patients having a predetermined disease. .
- data on the difference between the reaction amount between a patient with a predetermined disease and a healthy person is input to an analyzer and activated or activated in the patient by searching for a pathway that matches the data of the reaction amount You can find the pathway whose transformation is suppressed.
- the analysis device, the analysis method, and the program stored in the non-volatile storage medium of the present embodiment are also useful for finding pathways that are activated by the administration of a drug or whose activation is suppressed.
- reaction amount For example, data on the difference between reaction amounts before and after administration of a drug is input to an analyzer, and a pathway activated by the drug or a pathway whose activation is suppressed by searching for a pathway matching the data on the reaction amount You can find As the reaction amount, the expression amount of mRNA, the expression amount of protein obtained by mass spectrometry, etc. can be used. Such analysis can contribute to drug development.
- the analysis method of the second embodiment is a method of obtaining a target substance based on the input reaction amount data.
- the “target substance” is a substance (gene, protein or the like) which is expected to be a key to distinguish a disease or the like or to be a therapeutic drug for a disease.
- the target substance considered to be important is searched in consideration of not only the difference from the control but also the pathway.
- the analyzer 2 determines the GCP of the reaction amount data and the known pathway, and the reaction amount when the GCP is equal to or less than a predetermined threshold value. It is determined that the data and the pathway have consistency.
- the second is to estimate a network in which the relationships of each substance are graphed based on the reaction amount data of each substance. The method of estimating the network will be described later.
- the analysis method according to the second embodiment detects data of two overlapping nodes from a pathway evaluated as being consistent and the estimated network.
- node E and node G are detected as being two nodes overlapping two networks.
- two substances closely related to the pathway can be detected as target substances.
- FIG. 10 is a diagram showing the configuration of the analysis device 2 according to the second embodiment.
- the analyzer 2 includes an input unit 10 for inputting reaction amount data, an output unit 11 for outputting an analysis result, and an operation processing unit 12 for obtaining a target substance based on the reaction amount data.
- the analysis device 2 is configured by a computer including a CPU, a RAM, a ROM, a hard disk, a display, a keyboard, a mouse, a communication interface, and the like.
- a program for analysis processing is stored in the ROM, and the CPU reads and executes the program from the ROM, whereby the computer analyzes the reaction amount data and performs processing for searching for a target substance.
- An example of the input unit 10 is a communication interface.
- the reaction amount data acquired by the microarray is received and taken into the analyzer 2.
- the received reaction amount data is temporarily stored in the hard disk.
- An example of the output unit 11 is a display.
- the arithmetic processing unit 12 includes a network consistency determination unit 14, a network estimation unit 15, and a target material search unit 16.
- the network estimation unit 15 has a function of estimating a network having a substance as a node based on reaction amount data.
- the network estimation unit 15 obtains partial correlation coefficients between substances based on the reaction amounts of a large number of substances included in the reaction amount data.
- the network estimation unit 15 generates a network of substances included in the reaction amount data by generating a link between nodes having partial correlation coefficients greater than or equal to a predetermined threshold value based on partial correlation coefficients between substances.
- FIG. 11 is a diagram illustrating an example of the network estimated by the network estimation unit 15. In fact, the reaction amount data contains more substances than those shown in the figure.
- the network consistency determination unit 14 has a function of determining the consistency between the input reaction amount data and the known pathway, and obtaining a pathway having the consistency equal to or more than a predetermined threshold.
- the network consistency determination unit 14 sequentially reads out data of known pathways from the storage unit 13 storing the known pathways, and determines whether or not there is consistency with the reaction amount data. Since the case where the known pathway is an undirected graph is described above, here, the process when the known pathway is a DAG will be described.
- FIG. 12A and 12B are diagrams showing processing for obtaining the likelihood of the entire graph when the known pathway is DAG.
- FIG. 12A is a diagram illustrating an example of a known pathway.
- the network consistency determination unit 14 decomposes the pathway of the DAG into a plurality of subgraphs composed of two nodes connected by the conditional probability. Linear regression is applied for each subgraph to calculate the overall likelihood of the pathway.
- the network consistency determination unit 14 generates a plurality of DAGs having the same number of nodes and links as the number of known pathways, obtains the likelihood of each, and generates a probability distribution. And the method of calculating
- the network consistency determination unit 14 can obtain a pathway having consistency with the reaction amount data based on the GCP.
- the target substance search unit 16 searches for the structure of two nodes common to the estimated network and the network having consistency, and specifies the searched substance as a target substance.
- FIG. 13 is a diagram showing the operation of the analysis device 2 according to the second embodiment.
- the analysis device 2 acquires reaction amount data (S20)
- the analysis device 2 sequentially reads data of known pathways from the storage unit 13, determines consistency with the reaction amount data, and obtains a pathway having high consistency (S21). Further, the analysis device 2 estimates a network of substances based on the reaction amount data of each substance (S22).
- the analysis device 2 searches for two nodes which are commonly included in both the highly consistent known pathway and the estimated network, and specifies the substance of the searched node as a target substance (S23).
- the analysis device 2 outputs information of the identified target substance (S24).
- the configuration and operation of the analysis device 2 according to the second embodiment have been described above.
- the analysis device 2 according to the second embodiment searches for two nodes that exist in common in both the network generated from the reaction amount data and the known pathway consistent with the reaction amount data. It is possible to obtain a substance with high accuracy in identifying
- the analysis device 2 does not compare the phosphorylation pattern of a normal cell with the phosphorylation pattern of a sample cell as in the above-described conventional technique, but uses data of known pathways. Since the substance is searched, the target substance can be appropriately searched based on the entire pathway.
- the analysis apparatus, the analysis method, and the program stored in the non-volatile storage medium according to the present embodiment are useful for finding target substances that are activated in patients having a predetermined disease or whose activation is suppressed. is there.
- the analysis device and the like of the present embodiment is also useful for finding a target substance which is activated by the administration of a drug or whose activation is suppressed.
- searching for a target substance searching for a single substance at the molecular level has been performed, but in the present embodiment, the target substance is focused on a pathway that indicates the relationship between a plurality of substances. Ask.
- the desired target substance conforms to the reaction in the organism, so that an appropriate target substance can be searched.
- Such analysis can contribute to drug development.
- the target substance is narrowed down by another method. Specifically, from the substances contained in the reaction amount data, a signature substance having a large reaction amount as compared to the control is determined, and the target substance is determined including the viewpoint of whether or not it is a signature substance.
- data of two overlapping nodes are detected from the pathway evaluated as being consistent and the estimated network. Then, it is determined whether or not the substance related to the obtained two nodes is a signature substance, and when it is judged as a signature substance, the substances related to the node E and the node G are detected as target substances.
- FIG. 15 is a diagram showing the configuration of the analysis device 3 according to the third embodiment.
- the basic configuration of the analysis device 3 of the third embodiment is the same as that of the analysis device 2 of the second embodiment, but in addition to the configuration of the analysis device 2, a signature substance extraction unit 17 is provided There is.
- the signature substance extraction unit 17 compares the reaction amount data of the input sample with the reaction amount data of the control to obtain a signature substance having a reaction amount equal to or more than a predetermined threshold value as compared with the control. For example, when the reaction amount data of the sample has a difference of a predetermined threshold value or more as compared with the control, the signature substance extraction unit 17 determines that the signature substance is the signature substance. Further, for extraction of the signature substance, the technology disclosed in Japanese Patent Application No. 2014-173382 filed by the present inventor may be used.
- the target substance search unit 16 has a structure of two known nodes common to the network estimated by the network consistency determination unit 14 and the network estimated by the network estimation unit 15. Explore. When a common node is found, the target substance searching unit 16 determines whether the substance related to the node is a signature substance, and if it is determined that the substance is a signature substance, Identify the substance concerned as a target substance.
- FIG. 16 is a diagram showing the operation of the analysis device 3 of the third embodiment.
- the analysis device 3 sequentially reads out data of a known pathway from the storage unit 13, determines consistency with the reaction amount data, and obtains a network with high consistency (S31). Further, the analysis device 3 estimates a network of substances based on the reaction amount of each substance (S32). The analyzer 3 compares the input reaction amount data of the sample with the reaction amount data of the control to obtain a signature substance (S33).
- the analysis device 3 searches for a known pathway having high consistency and two nodes commonly included in the estimated network, and determines whether the substance of the searched node is a signature substance. When the substance related to the common node is a signature substance, the analysis device 3 specifies the substance as a target substance (S34). The analysis device 3 outputs information of the identified target substance (S35).
- the configuration and operation of the analysis device 3 according to the third embodiment have been described above.
- the analyzer 3 of the third embodiment can obtain a substance with high accuracy for specifying a pathway, as in the second embodiment.
Landscapes
- Engineering & Computer Science (AREA)
- Physics & Mathematics (AREA)
- Life Sciences & Earth Sciences (AREA)
- Health & Medical Sciences (AREA)
- Theoretical Computer Science (AREA)
- Molecular Biology (AREA)
- General Physics & Mathematics (AREA)
- Bioinformatics & Cheminformatics (AREA)
- Data Mining & Analysis (AREA)
- Bioinformatics & Computational Biology (AREA)
- Biotechnology (AREA)
- Biophysics (AREA)
- General Health & Medical Sciences (AREA)
- Probability & Statistics with Applications (AREA)
- Medical Informatics (AREA)
- Evolutionary Computation (AREA)
- Software Systems (AREA)
- Artificial Intelligence (AREA)
- Chemical & Material Sciences (AREA)
- Urology & Nephrology (AREA)
- Immunology (AREA)
- Hematology (AREA)
- Biomedical Technology (AREA)
- Evolutionary Biology (AREA)
- Spectroscopy & Molecular Physics (AREA)
- Computing Systems (AREA)
- Mathematical Analysis (AREA)
- Algebra (AREA)
- Computational Mathematics (AREA)
- Mathematical Optimization (AREA)
- Pure & Applied Mathematics (AREA)
- Mathematical Physics (AREA)
- General Engineering & Computer Science (AREA)
- Food Science & Technology (AREA)
- Proteomics, Peptides & Aminoacids (AREA)
- Pathology (AREA)
- Cell Biology (AREA)
- Physiology (AREA)
- Biochemistry (AREA)
- Microbiology (AREA)
Abstract
解析方法は、既知のパスウェイと反応量データとの整合性を求めるステップであって、既知のパスウェイを互いに接続された2つのノードからなる複数のサブグラフに分解するステップ(S12)と、各ノード間の偏相関係数に基づいて求めた独立性検定の確率値を結合して、既知のパスウェイの独立性を表す結合確率値を求めるステップ(S13)と、既知のパスウェイと同数のノードを有する複数のグラフを生成するステップ(S14)と、複数のグラフの結合確率をステップ(S12、S13)と同じ方法によって求め、複数のグラフの結合確率値の確率分布を生成するステップ(S15)と、ステップ(S15)で求めた確率分布において、ステップ(S13)で求めた結合確率値から上側における確率密度をグラフ整合性確率として求める(S16)。
Description
本発明は、検体に含まれる複数の物質に対して所定の処理を行ったときの反応量データと既知のパスウェイとの整合性を解析する技術に関する。
タンパク質のリン酸化は、キナーゼにより触媒される反応で、細胞増殖や転写制御、細胞死、代謝など様々な生命機能を調節している。がんを初めとする疾患などもリン酸化酵素の異常により起こることが知られており、リン酸化シグナルパスウェイは、ヒトの疾患にも大きな影響を持っている。リン酸化シグナルを解析することで創薬や疾患の診断などに対して有用な情報を得ることができると考えられている(非特許文献1)。
非特許文献1は、ペプチドアレイを用いたリン酸化シグナルの解析法を開示している。この文献では、正常細胞のリン酸化パターンと検体細胞のリン酸化パターンとを比較することによって疾患の早期診断に利用する(非特許文献1、99頁右欄~100頁左欄)。
船津貴洋他「細胞内リン酸化シグナル網羅的解析のためのペプチド固定化酸化チタン基板の開発」北九州工業高等専門学校研究報告第44号(2011年1月)
堀本勝久他「Network evaluation from consistency of the graph structure with the measured data」BMC Systems Biology 2008, 2:84(2008年10月1日)
非特許文献1に記載された方法は、正常細胞と検体細胞とでリン酸化の程度が異なるペプチドを発見することができるにとどまり、そのリン酸化シグナルパスウェイを解析することはできなかった。
本発明者は、非特許文献2において、測定データとネットワーク構造との整合性を評価する方法を発表した。非特許文献2で開示した方法は、ネットワーク構造が有向非巡回グラフ(DAG)である場合の方法である。無向グラフ(非DAG)のネットワーク構造と測定データとの整合性を評価する方法を開示した文献は存在しなかった。
本発明は、上記背景に鑑み、検体に含まれる複数の物質の反応量データと既知のパスウェイとの整合性を解析する方法を提供することを目的とする。
本発明の解析方法は、検体に含まれる複数の物質に対して所定の処理を行ったときの反応量データと既知のパスウェイとの整合性を解析装置によって解析するための解析方法であって、次のステップを備える:
(a)前記解析装置が、複数の検体についての前記反応量データを取得するステップ;
(b)前記解析装置が、前記物質をノードとする既知のパスウェイのデータを記憶した記憶部から前記既知のパスウェイのデータを読み出し、前記既知のパスウェイと前記反応量データとの整合性を求めるステップであって、前記既知のパスウェイが無向グラフの場合に、次のステップによって既知のパスウェイとの整合性を求めるステップ;
(b-1)前記既知のパスウェイを互いに接続された2つのノードからなる複数のサブグラフに分解するステップ;
(b-2)各サブグラフに前記反応量データを適用して各ノード間の偏相関係数を求め、求めた偏相関係数の独立性検定の確率値を結合して、前記既知のパスウェイの前記反応量データに対する独立性を表す結合確率値を求めるステップ;
(b-3)前記既知のパスウェイと同数のノードを有する複数のグラフを生成するステップ;
(b-4)前記複数のグラフの結合確率を上記ステップ(b-1)及び(b-2)と同じ方法によって求め、前記複数のグラフの結合確率値の確率分布を生成するステップ;
(b-5)上記ステップ(b-4)で求めた確率分布において、上記ステップ(b-2)で求めた結合確率値から上側における確率密度をグラフ整合性確率として求めるステップ。
(a)前記解析装置が、複数の検体についての前記反応量データを取得するステップ;
(b)前記解析装置が、前記物質をノードとする既知のパスウェイのデータを記憶した記憶部から前記既知のパスウェイのデータを読み出し、前記既知のパスウェイと前記反応量データとの整合性を求めるステップであって、前記既知のパスウェイが無向グラフの場合に、次のステップによって既知のパスウェイとの整合性を求めるステップ;
(b-1)前記既知のパスウェイを互いに接続された2つのノードからなる複数のサブグラフに分解するステップ;
(b-2)各サブグラフに前記反応量データを適用して各ノード間の偏相関係数を求め、求めた偏相関係数の独立性検定の確率値を結合して、前記既知のパスウェイの前記反応量データに対する独立性を表す結合確率値を求めるステップ;
(b-3)前記既知のパスウェイと同数のノードを有する複数のグラフを生成するステップ;
(b-4)前記複数のグラフの結合確率を上記ステップ(b-1)及び(b-2)と同じ方法によって求め、前記複数のグラフの結合確率値の確率分布を生成するステップ;
(b-5)上記ステップ(b-4)で求めた確率分布において、上記ステップ(b-2)で求めた結合確率値から上側における確率密度をグラフ整合性確率として求めるステップ。
本発明の別の態様の解析方法は、検体に含まれる複数の物質に対して所定の処理を行ったときの反応量データに基づいて、解析装置が、ターゲット物質を求める解析方法であって、次のステップを備える:
(a)前記解析装置が、複数の検体についての前記反応量データを取得するステップ;
(b)前記解析装置が、前記物質をノードとする既知のパスウェイのデータを記憶した記憶部から、前記既知のパスウェイのデータを読み出し、前記反応量データと所定の閾値以上の整合性を有する既知のパスウェイを選択するステップであって、前記記憶部に記憶された既知のパスウェイが無向グラフの場合に、次のステップによって既知のパスウェイを選択するステップ;
(b-1)前記既知のパスウェイを互いに接続された2つのノードからなる複数のサブグラフに分解するステップ;
(b-2)各サブグラフに前記反応量データを適用して各ノード間の偏相関係数を求め、求めた偏相関係数の独立性検定の確率値を結合して、前記既知のパスウェイの前記反応量データに対する独立性を表す結合確率値を求めるステップ;
(b-3)前記既知のパスウェイと同数のノードを有する複数のグラフを生成するステップ;
(b-4)前記複数のグラフの結合確率を上記ステップ(b-1)及び(b-2)と同じ方法によって求め、前記複数のグラフの結合確率値の確率分布を生成するステップ;
(b-5)上記ステップ(b-4)で求めた確率分布において、上記ステップ(b-2)で求めた結合確率値から上側における確率密度をグラフ整合性確率として求めるステップ;
(b-6)前記グラフ整合性確率が所定の閾値以下である場合に、前記既知のパスウェイを前記反応量データに整合するパスウェイとして選択するステップ;
(c)前記解析装置が、前記物質の反応量データに基づいて、前記物質間の偏相関係数を求め、前記偏相関係数に基づいて前記物質をノードとするネットワーク構造を生成するステップ;
(d)前記解析装置が、ステップ(b)で選択された前記既知のパスウェイと、ステップ(c)で生成された前記ネットワーク構造との間で、リンクで接続された2つのノードが同じ部分を探索し、探索されたノードの物質をターゲット物質として求めるステップ。
(a)前記解析装置が、複数の検体についての前記反応量データを取得するステップ;
(b)前記解析装置が、前記物質をノードとする既知のパスウェイのデータを記憶した記憶部から、前記既知のパスウェイのデータを読み出し、前記反応量データと所定の閾値以上の整合性を有する既知のパスウェイを選択するステップであって、前記記憶部に記憶された既知のパスウェイが無向グラフの場合に、次のステップによって既知のパスウェイを選択するステップ;
(b-1)前記既知のパスウェイを互いに接続された2つのノードからなる複数のサブグラフに分解するステップ;
(b-2)各サブグラフに前記反応量データを適用して各ノード間の偏相関係数を求め、求めた偏相関係数の独立性検定の確率値を結合して、前記既知のパスウェイの前記反応量データに対する独立性を表す結合確率値を求めるステップ;
(b-3)前記既知のパスウェイと同数のノードを有する複数のグラフを生成するステップ;
(b-4)前記複数のグラフの結合確率を上記ステップ(b-1)及び(b-2)と同じ方法によって求め、前記複数のグラフの結合確率値の確率分布を生成するステップ;
(b-5)上記ステップ(b-4)で求めた確率分布において、上記ステップ(b-2)で求めた結合確率値から上側における確率密度をグラフ整合性確率として求めるステップ;
(b-6)前記グラフ整合性確率が所定の閾値以下である場合に、前記既知のパスウェイを前記反応量データに整合するパスウェイとして選択するステップ;
(c)前記解析装置が、前記物質の反応量データに基づいて、前記物質間の偏相関係数を求め、前記偏相関係数に基づいて前記物質をノードとするネットワーク構造を生成するステップ;
(d)前記解析装置が、ステップ(b)で選択された前記既知のパスウェイと、ステップ(c)で生成された前記ネットワーク構造との間で、リンクで接続された2つのノードが同じ部分を探索し、探索されたノードの物質をターゲット物質として求めるステップ。
本発明の解析方法は、さらに、(e)前記解析装置が、前記反応量データがコントロールの反応量に対して所定の閾値以上の差分を有する物質をシグネチャ物質として求めるステップを備え、前記ステップ(d)では、前記ステップ(e)で求めたシグネチャ物質のデータをも用いてターゲット物質を求めてもよい。
本発明によれば、既知のパスウェイが無向グラフの場合であっても、反応量データとの整合性を適切に求めることができる。
以下、本発明の実施の形態の解析方法および装置について図面を参照しながら説明する。実施の形態においては、検体に含まれる複数の物質に対して所定の処理を行ったときの生物学的な反応量データと既知のパスウェイとの整合性を解析する方法および装置について説明する。ここで、以下に説明する実施の形態の解析対象について述べる。例えば、免疫系や疾患に関するパスウェイは、因果関係が不明な点が多いため、無向グラフで評価することが好ましい。具体的には、例えば、抗原抗体反応などのタンパク質間の相互作用の連鎖が挙げられる。この場合、物質としては、タンパク質であり、反応量データは、抗原抗体相互作用のアフィニティー等である。ここで紹介したのは一例であり、本実施の形態の解析方法は、様々な物質に適用することができる。
(第1の実施の形態)
図1は、第1の実施の形態の解析装置1の構成を示す図である。第1の実施の形態の解析装置1は、無向グラフのネットワーク構造を有する既知のパスウェイと反応量データとの整合性を求める。本実施の形態の解析装置1が解析の対象とする無向グラフは、閉路を持たない無向グラフである。パスウェイは、物質をノードとし、ノード間がリンクによって接続されたネットワークの構造を有しているので、パスウェイと反応量データの整合性の評価は、パスウェイをネットワークとして評価を行う。「パスウェイ」とは、実験によって見つけ出された物質どうしのつながりであり、「ネットワーク」は計算生物学における物質どうしのつながりである。本書では、「グラフ」という用語も使用するが、グラフは、ネットワークの構造を数学的に表現する際の用語である。
図1は、第1の実施の形態の解析装置1の構成を示す図である。第1の実施の形態の解析装置1は、無向グラフのネットワーク構造を有する既知のパスウェイと反応量データとの整合性を求める。本実施の形態の解析装置1が解析の対象とする無向グラフは、閉路を持たない無向グラフである。パスウェイは、物質をノードとし、ノード間がリンクによって接続されたネットワークの構造を有しているので、パスウェイと反応量データの整合性の評価は、パスウェイをネットワークとして評価を行う。「パスウェイ」とは、実験によって見つけ出された物質どうしのつながりであり、「ネットワーク」は計算生物学における物質どうしのつながりである。本書では、「グラフ」という用語も使用するが、グラフは、ネットワークの構造を数学的に表現する際の用語である。
解析装置1は、反応量データを入力する入力部10と、解析結果を出力する出力部11と、反応量データと既知のパスウェイとの整合性を判定する演算処理部12とを備えている。
解析装置1は、CPU、RAM、ROM、ハードディスク、ディスプレイ、キーボード、マウス、通信インターフェース等を備えるコンピュータによって構成される。解析処理のためのプログラムをROMに記憶しておき、CPUがROMからプログラムを読み出して実行することにより、コンピュータが、反応量データと既知のパスウェイとの整合性を判定する処理を行う。また、プログラムは、ROMではなく、コンピュータに対して着脱自在な不揮発性の記憶媒体に記憶されていてもよい。この場合、コンピュータが、記憶媒体から情報処理プログラムを読み出して実行することにより、反応量データと既知のパスウェイとの整合性を判定する処理を行う。
入力部10の一例は、通信インターフェースである。例えば、マイクロアレイ等によって取得した反応量データを受信して解析装置1に取り込む。なお、受信した反応量データは、いったんハードディスクに保存する。出力部11の一例は、ディスプレイである。
次に、演算処理部12について説明する。演算処理部12は、入力された反応量データと、既知のパスウェイとの整合性を求めるネットワーク整合性判定部14を有している。本実施の形態では、既知のパスウェイは、閉路を持たない無向グラフのネットワーク構造を有するパスウェイである。以下、ネットワーク整合性判定部14の処理について説明する。
図2Aは、既知のパスウェイの例を示す図である。ネットワーク整合性判定部14は、図2Bに示すように、既知のパスウェイをリンクによって接続された2つのノードからなるサブグラフに分解する。ネットワーク整合性判定部14は、反応量データに基づいて、各サブグラフにおけるノード間の一次の偏相関係数を求める。ここで、物質どうしの相関について説明する。
図3Aは、解析対象の反応量データの例を示す図であり、図3Aではマイクロアレイを模して、反応量データをマトリックス状に記載している。反応量データは、各物質が所定の処理によって反応した程度を表す定量的なデータである。
ここで、例えば、2つの物質Aと物質Bの相関は、図3Bに示すように、各検体の物質Aの反応量と物質Bの反応量をプロットすることでその関係が求まり、両物質の相関係数を求めることができる。
図4は、図3Bに示す方法によって求めた、それぞれの物質の相関係数の例を記載した表である。図4から、物質Aと物質Bの相関係数は0.3、物質Aと物質Cの相関係数は0.6であることが分かる。なお、本実施の形態では、ネットワークを評価するために物質どうしの一次の偏相関係数を用いる。偏相関係数は、対象としている2変数以外の他の変数の影響を除いた真の相関を示す係数であり、公知の方法によって計算することができる。
以上のようにして求めたノード間の偏相関係数を用いて、ネットワーク整合性判定部14は、既知のパスウェイの各ノード間の独立性検定の確率を求める。そして、ネットワーク整合性判定部14は、図2Bに示すように、各ノード間の独立性検定の確率をフィッシャーの結合確率によって統合して、既知のパスウェイの反応量データに対する独立性を表す確率を求める。本実施の形態では、偏相関係数を用いたことにより、相関係数では検出不可能な偽相関を検出し、全体の整合性をより正確に見積もることができる。なお、本実施の形態では、各ノード間の独立性検定の確率を統合するのに、フィッシャーの結合確率を用いたが、他の結合確率、例えば、ブラウンの結合確率によって統合することとしてもよい。
次に、ネットワーク整合性判定部14は、既知のパスウェイと同数のノード、同数のリンクを有する多数のネットワークをランダムに生成する。本実施の形態では、10000個のネットワークを生成する。なお、本実施の形態では、既知のパスウェイとノード及びリンクの両方が同数であるネットワークをランダムに生成したが、リンクの数は必ずしも同数でなくてもよい。ネットワーク整合性判定部14は、既知のパスウェイと同数のノードを有し、リンク数が異なるネットワークをランダムに生成してもよい。
図5A~図5Cは、ランダムに生成した多数のネットワークの例を示す図である。ネットワーク整合性判定部は、これらのネットワークについても、図2Bで説明した方法を用いて、ネットワークの結合確率を求める。すなわち、ネットワークをサブグラフに分解し、サブグラフの偏相関係数から独立性検定の確率を求め、これらを結合してネットワークの結合確率値を求める。このようにして、10000個のネットワークについての結合確率を求める。
図6は、ランダムに生成したネットワークの結合確率の分布を示す図である。図6に示すグラフの横軸は、ランダムなネットワークの結合確率のχ2値(カイ二乗値)であり、縦軸は度数である。図6に示すように、ランダムなネットワークの場合には、χ2値は300~360にピークを有する分布となったことが分かる。
既知のパスウェイが反応量データに整合しているということは、既知のパスウェイが反応量データに対して独立ではないということを意味する(既知のパスウェイが反応量データに独立であるということは、両者が無関係であることを意味する)。したがって、既知のパスウェイの結合確率のχ2値が、例えば、ランダムに生成したネットワークの確率分布の平均値付近(平均を含む所定の範囲内)にあるときは、既知のパスウェイが反応量データに対して独立性が高いことを意味し、整合性が高くないということになる。
ネットワーク整合性判定部14は、結合確率の分布において、既知のパスウェイの結合確率値から上方の確率密度を求める。この確率密度が既知のパスウェイと反応量データとのグラフ整合性確率(GCP:Graph Consistency Probability)である。このGCPが小さくなるほど、既知のパスウェイが反応量データに対して整合するということを意味する。ネットワーク整合性判定部14は、GCPが所定の閾値(例えば、0.2)以下のときに、反応量データに対する整合性があると判定することができる。
図6に示す例では、既知のパスウェイの結合確率のχ2値は597.4であり、この値から上方(+∞)の確率密度は0.0001である。すなわち、GCP=0.0001である。以上の処理により、既知のパスウェイと反応量データとの整合性を表すGCPを求めることができる。
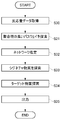
図7は、第1の実施の形態の解析装置1の動作を示す図である。解析装置1は、検体についての反応量データを入力する(S10)。また、解析装置1は、反応量データとの比較対象の既知のパスウェイを記憶部13から読み出す(S11)。解析装置1は、既知のパスウェイを互いに接続された2つのノードからなる複数のサブグラフに分解する(S12)。続いて、解析装置1は、それぞれのサブグラフについて、ノード間の偏相関係数に基づいて独立性検定の確率を求め、この確率を結合することにより、既知のパスウェイの結合確率を求める(S13)。
次に、解析装置1は、既知のパスウェイと同数のノード、同数のリンクを有するネットワークをランダムに生成する(S14)。本実施の形態では、10000個のネットワークを生成する。続いて、解析装置1は、ランダムに生成したネットワークについても、独立性検定の結合確率を求め、結合確率の確率分布を生成する(S15)。解析装置1は、生成した確率分布において、既知のパスウェイの結合確率値から上方の確率密度を求め、これをGCPとする(S16)。解析装置1は、求めたGCPの値を出力する。
以上、第1の実施の形態の解析装置1の構成および動作について説明した。第1の実施の形態の解析装置1は、ノード間の独立性検定の確率を一次の偏相関係数を用いて求め、こうして求めたノード間の確率を結合してネットワークの結合確率を求めた。そして、この結合確率に基づいてGCPを計算しているので、適切なGCPを求めることができ、ネットワークの整合性を評価することができた。
図8は、一次の偏相関係数ではなく相関係数を用いて、図6で示したのと同じデータに対して、本実施の形態と同様の方法でGCPを求めた例である。結合確率のχ2値の分布は、550~600あたりにピークを有する分布となった。そして、既知のパスウェイの独立性検定の結合確率値は、C=492.0であり、この値から上方(+∞)の確率密度、すなわち、GCPは0.90となった。このように相関係数を用いた場合には、既知のパスウェイは、反応量データと整合性がない(ランダムに生成したネットワークの分布の中に含まれる)と判定された。
図6及び図8の実験で用いた反応量データと既知のパスウェイとは整合性を有するものであったから、偏相関係数を用いなかったときの判定結果は誤りである。本実施の形態のように、偏相関係数を用いて、反応量データと既知のパスウェイの整合性を評価することにより、正しい評価が行えることが示された。
本実施の形態の解析装置、解析方法、及び不揮発性記憶媒体に記憶されたプログラムは、所定の疾患を有する患者において活性化している、または活性化が抑制されているパスウェイの発見に有用である。例えば、所定の疾患を有する患者と健常者との反応量の差分のデータを解析装置に入力し、その反応量のデータに整合するパスウェイを探索することにより、患者において活性化している、または活性化が抑制されているパスウェイを見つけることができる。また、本実施の形態の解析装置、解析方法、及び不揮発性記憶媒体に記憶されたプログラムは、薬剤の投与によって活性化する、または活性化が抑制されるパスウェイの発見にも有用である。例えば、薬剤の投与前後の反応量の差分のデータを解析装置に入力し、その反応量のデータに整合するパスウェイを探索することにより、薬剤によって活性化するパスウェイ、または活性化が抑制されるパスウェイを見つけることができる。反応量としては、mRNAの発現量、質量分析により求めたタンパク質の発現量等を用いることができる。このような解析を行うことにより、薬剤の開発に貢献することができる。
(第2の実施の形態)
第2の実施の形態の解析方法は、入力された反応量データに基づいて、ターゲット物質を求める方法である。「ターゲット物質」とは、疾患等を鑑別するのにキーとなる、あるいは疾患の治療薬を創るのにキーとなると期待される物質(遺伝子、タンパク質等)である。本実施の形態では、単に、コントロールとの違いを見るのではなく、パスウェイをも考慮して重要と考えられるターゲット物質を探索する。
第2の実施の形態の解析方法は、入力された反応量データに基づいて、ターゲット物質を求める方法である。「ターゲット物質」とは、疾患等を鑑別するのにキーとなる、あるいは疾患の治療薬を創るのにキーとなると期待される物質(遺伝子、タンパク質等)である。本実施の形態では、単に、コントロールとの違いを見るのではなく、パスウェイをも考慮して重要と考えられるターゲット物質を探索する。
まず、図9を参照して、第2の実施の形態の解析方法の処理概要について説明する。第2の実施の形態の解析方法は、例えば、マイクロアレイによって取得された反応量データが入力されると、反応量データに基づいて物質のネットワークを2通りの方法で求める。
一つ目は、既知のパスウェイと反応量データとの整合性を評価し、既知のパスウェイの中から整合性の高いパスウェイを抽出する。具体的には、解析装置2は、第1の実施の形態において説明した方法を用いて、反応量データと既知のパスウェイとのGCPを求め、GCPが所定の閾値以下である場合に、反応量データとパスウェイとが整合性を有すると判定する。二つ目は、それぞれの物質の反応量データに基づいて各物質の関係をグラフ化したネットワークを推定する。ネットワークを推定する方法は、後述する。
第2の実施の形態の解析方法は、整合性があると評価されたパスウェイと、推定されたネットワークの中から、オーバーラップする2つのノードのデータを検出する。図9に示す例では、ノードEとノードGが2つのネットワークにオーバーラップする2つのノードであるとして検出される。これにより、第2の実施の形態では、パスウェイに関係の深い2つの物質をターゲット物質として検出することができる。
図10は、第2の実施の形態の解析装置2の構成を示す図である。解析装置2は、反応量データを入力する入力部10と、解析結果を出力する出力部11と、反応量データに基づいてターゲット物質を求める演算処理部12とを備えている。
解析装置2は、CPU、RAM、ROM、ハードディスク、ディスプレイ、キーボード、マウス、通信インターフェース等を備えるコンピュータによって構成される。解析処理のためのプログラムをROMに記憶しておき、CPUがROMからプログラムを読み出して実行することにより、コンピュータが、反応量データを解析してターゲット物質を探索する処理を行う。
入力部10の一例は、通信インターフェースである。例えば、マイクロアレイによって取得した反応量データを受信して解析装置2に取り込む。なお、受信した反応量データは、いったんハードディスクに保存する。出力部11の一例は、ディスプレイである。
次に、演算処理部12について説明する。演算処理部12は、ネットワーク整合性判定部14と、ネットワーク推定部15と、ターゲット物質探索部16とを有している。ネットワーク推定部15は、反応量データに基づいて、物質をノードとするネットワークを推定する機能を有する。ネットワーク推定部15は、反応量データに含まれる多数の物質の反応量に基づいて、物質どうしの偏相関係数を求める。
ネットワーク推定部15は、物質どうしの偏相関係数に基づいて、偏相関係数が所定の閾値以上のノード間にリンクを生成することによって、反応量データに含まれる物質のネットワークを生成する。図11は、ネットワーク推定部15によって推定されたネットワークの一例を示す図である。なお、実際には、反応量データには図に示すより多くの物質が含まれている。
ネットワーク整合性判定部14は、入力された反応量データと、既知のパスウェイとの整合性を判定し、所定の閾値以上の整合性を有するパスウェイを求める機能を有する。ネットワーク整合性判定部14は、既知のパスウェイを記憶した記憶部13から、既知のパスウェイのデータを順次読み出して、反応量データと整合性を有するかどうかを判定する。既知のパスウェイが無向グラフの場合については、上述したので、ここでは、既知のパスウェイがDAGの場合の処理について説明する。
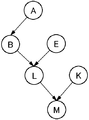
次に、既知のパスウェイがDAGの場合の処理について説明する。図12A及び図12Bは、既知のパスウェイがDAGの場合にグラフ全体の尤度を求める処理を示す図である。図12Aは、既知のパスウェイの例を示す図である。ネットワーク整合性判定部14は、図12Bに示すように、DAGのパスウェイを条件付き確率で接続された2つのノードからなる複数のサブグラフに分解する。各サブグラフについて線形回帰を適用して、パスウェイの全体の尤度を計算する。
また、ネットワーク整合性判定部14は、既知のパスウェイと同数のノードおよびリンクを有する複数のDAGを生成し、それぞれの尤度を求めて確率分布を生成する。そして、確率分布を用いてGCPを求める方法は、非DAGの場合と同じである。以上の処理により、既知のパスウェイがDAGの場合にも、反応量データと既知のパスウェイとのGCPを求めることができる。ネットワーク整合性判定部14は、GCPに基づいて、反応量データとの整合性を有するパスウェイを求めることができる。
ターゲット物質探索部16は、推定されたネットワークと、整合性を有するネットワークにおいて共通する2つのノードの構造を探索し、探索された物質をターゲット物質として特定する。
図13は、第2の実施の形態の解析装置2の動作を示す図である。解析装置2は、反応量データを取得すると(S20)、記憶部13から既知のパスウェイのデータを順次読み出し、反応量データとの整合性を判定し、整合性の高いパスウェイを求める(S21)。また、解析装置2は、各物質の反応量データに基づいて、物質のネットワークを推定する(S22)。解析装置2は、整合性の高い既知のパスウェイと推定されたネットワークとの両方に共通に含まれている2つのノードを探索し、探索されたノードの物質をターゲット物質として特定する(S23)。解析装置2は、特定されたターゲット物質の情報を出力する(S24)。
以上、第2の実施の形態の解析装置2の構成及び動作について説明した。第2の実施の形態の解析装置2は、反応量データから生成されたネットワークと、反応量データと整合性を有する既知のパスウェイの両方に共通して存在する2つのノードを探索するので、パスウェイを特定する精度の高い物質を求めることができる。
また、本実施の形態の解析装置2は、上述した従来技術のように、正常細胞のリン酸化パターンと検体細胞のリン酸化パターンとを比較するのではなく、既知のパスウェイのデータを利用して物質を探索しているので、パスウェイの全体に基づいて、適切にターゲット物質の探索を行うことができる。
本実施の形態の解析装置、解析方法、及び不揮発性記憶媒体に記憶されたプログラムは、所定の疾患を有する患者において活性化している、または活性化が抑制されているターゲット物質の発見に有用である。また、本実施の形態の解析装置等は、薬剤の投与によって活性化する、または活性化が抑制されるターゲット物質の発見にも有用である。従来は、ターゲット物質を探索する際には、分子レベルでの単体の物質の探索が行われていたが、本実施の形態では、複数の物質の関係性を示すパスウェイに着目してターゲット物質を求める。これにより、求められるターゲット物質は、生物内での反応に整合するので、適切なターゲット物質を探索できる。このような解析を行うことにより、薬剤の開発に貢献することができる。
(第3の実施の形態)
第3の実施の形態の解析方法では、第2の実施の形態の解析方法に加えて、さらに別の方法でターゲットの物質を絞り込む。具体的には、反応量データに含まれる物質から、コントロールに比べて反応量が大きいシグネチャ物質を求め、シグネチャ物質であるかどうかという観点も含めてターゲット物質を求める。
第3の実施の形態の解析方法では、第2の実施の形態の解析方法に加えて、さらに別の方法でターゲットの物質を絞り込む。具体的には、反応量データに含まれる物質から、コントロールに比べて反応量が大きいシグネチャ物質を求め、シグネチャ物質であるかどうかという観点も含めてターゲット物質を求める。
第3の実施の形態の解析方法は、図14に示すように、整合性があると評価されたパスウェイと、推定されたネットワークの中から、オーバーラップする2つのノードのデータを検出する。そして、求めた2つのノードに係る物質がシグネチャ物質であるか否かを判定し、シグネチャ物質と判定された場合に、ノードEとノードGに係る物質が、ターゲット物質として検出される。
図15は、第3の実施の形態の解析装置3の構成を示す図である。第3の実施の形態の解析装置3の基本的な構成は、第2の実施の形態の解析装置2と同じであるが、解析装置2の構成に加えて、シグネチャ物質抽出部17を備えている。
シグネチャ物質抽出部17は、入力された検体の反応量データをコントロールの反応量データを比較して、コントロールに比べて所定の閾値以上の反応量を有するシグネチャ物質を求める。シグネチャ物質抽出部17は、例えば、検体の反応量データがコントロールに比べて所定の閾値以上の差を有するときに、シグネチャ物質であると判定する。また、シグネチャ物質の抽出には、本発明者が出願した特願2014-173382で開示した技術を使ってもよい。
ターゲット物質探索部16は、ネットワーク整合性判定部14にて整合性があると評価された既知のネットワークと、ネットワーク推定部15にて推定されたネットワークに共通して存在する2つのノードの構造を探索する。共通するノードが発見されたときは、ターゲット物質探索部16は、そのノードに係る物質がシグネチャ物質であるか否かを判定し、シグネチャ物質であると判定された場合に、探索されたノードに係る物質をターゲット物質として特定する。
図16は、第3の実施の形態の解析装置3の動作を示す図である。解析装置3は、反応量データを取得すると(S30)、記憶部13から既知のパスウェイのデータを順次読み出し、反応量データとの整合性を判定し、整合性の高いネットワークを求める(S31)。また、解析装置3は、各物質の反応量に基づいて、物質のネットワークを推定する(S32)。解析装置3は、入力された検体の反応量データをコントロールの反応量データを比較して、シグネチャ物質を求める(S33)。
解析装置3は、整合性の高い既知のパスウェイと、推定されたネットワークに共通に含まれている2つのノードを探索し、探索されたノードの物質がシグネチャ物質であるか否かを判定する。共通するノードに係る物質がシグネチャ物質であるときに、解析装置3は、その物質をターゲット物質として特定する(S34)。解析装置3は、特定されたターゲット物質の情報を出力する(S35)。
以上、第3の実施の形態の解析装置3の構成および動作について説明した。第3の実施の形態の解析装置3は、第2の実施の形態と同様に、パスウェイを特定する精度の高い物質を求めることができる。
Claims (10)
- 検体に含まれる複数の物質に対して所定の処理を行ったときの反応量データと既知のパスウェイとの整合性を解析装置によって解析するための解析方法であって、次のステップを備える:
(a)前記解析装置が、複数の検体についての前記反応量データを取得するステップ;
(b)前記解析装置が、前記物質をノードとする既知のパスウェイのデータを記憶した記憶部から前記既知のパスウェイのデータを読み出し、前記既知のパスウェイと前記反応量データとの整合性を求めるステップであって、前記既知のパスウェイが無向グラフの場合に、次のステップによって既知のパスウェイとの整合性を求めるステップ;
(b-1)前記既知のパスウェイを互いに接続された2つのノードからなる複数のサブグラフに分解するステップ;
(b-2)各サブグラフに前記反応量データを適用して各ノード間の偏相関係数を求め、求めた偏相関係数の独立性検定の確率値を結合して、前記既知のパスウェイの前記反応量データに対する独立性を表す結合確率値を求めるステップ;
(b-3)前記既知のパスウェイと同数のノードを有する複数のグラフを生成するステップ;
(b-4)前記複数のグラフの結合確率を上記ステップ(b-1)及び(b-2)と同じ方法によって求め、前記複数のグラフの結合確率値の確率分布を生成するステップ;
(b-5)上記ステップ(b-4)で求めた確率分布において、上記ステップ(b-2)で求めた結合確率値から上側における確率密度をグラフ整合性確率として求めるステップ。 - 請求項1に記載の解析方法であって、ステップ(b-3)において、前記既知のパスウェイと同数のノード及び同数のリンクを有する複数のグラフを生成する解析方法。
- 請求項1または2に記載の解析方法であって、(b-6)前記解析装置が、前記グラフ整合性確率が所定の閾値以下である場合に、前記既知のパスウェイを前記反応量データに整合するパスウェイであると判定するステップをさらに備える解析方法。
- 検体に含まれる複数の物質に対して所定の処理を行ったときの反応量データに基づいて、解析装置が、ターゲット物質を求める解析方法であって、次のステップを備える:
(a)前記解析装置が、複数の検体についての前記反応量データを取得するステップ;
(b)前記解析装置が、前記物質をノードとする既知のパスウェイのデータを記憶した記憶部から、前記既知のパスウェイのデータを読み出し、前記反応量データと所定の閾値以上の整合性を有する既知のパスウェイを選択するステップであって、前記記憶部に記憶された既知のパスウェイが無向グラフの場合に、次のステップによって既知のパスウェイを選択するステップ;
(b-1)前記既知のパスウェイを互いに接続された2つのノードからなる複数のサブグラフに分解するステップ;
(b-2)各サブグラフに前記反応量データを適用して各ノード間の偏相関係数を求め、求めた偏相関係数の独立性検定の確率値を結合して、前記既知のパスウェイの前記反応量データに対する独立性を表す結合確率値を求めるステップ;
(b-3)前記既知のパスウェイと同数のノードを有する複数のグラフを生成するステップ;
(b-4)前記複数のグラフの結合確率を上記ステップ(b-1)及び(b-2)と同じ方法によって求め、前記複数のグラフの結合確率値の確率分布を生成するステップ;
(b-5)上記ステップ(b-4)で求めた確率分布において、上記ステップ(b-2)で求めた結合確率値から上側における確率密度をグラフ整合性確率として求めるステップ;
(b-6)前記グラフ整合性確率が所定の閾値以下である場合に、前記既知のパスウェイを前記反応量データに整合するパスウェイとして選択するステップ;
(c)前記解析装置が、前記物質の反応量データに基づいて、前記物質間の偏相関係数を求め、前記偏相関係数に基づいて前記物質をノードとするネットワーク構造を生成するステップ;
(d)前記解析装置が、ステップ(b)で選択された前記既知のパスウェイと、ステップ(c)で生成された前記ネットワーク構造との間で、リンクで接続された2つのノードが同じ部分を探索し、探索されたノードの物質をターゲット物質として求めるステップ。 - 請求項4に記載の解析方法であって、ステップ(b)で読み出した既知のパスウェイが有向非巡回グラフである場合に、次のステップによってパスウェイを選択する解析方法:
(b-7)前記既知のパスウェイを条件付き確率で接続された2つのノードからなる複数のサブグラフに分解するステップ;
(b-8)各サブグラフに前記反応量データを用いて線形回帰を行い、前記既知のパスウェイの全体の尤度を求めるステップ;
(b-9)前記既知のパスウェイと同数のノードを有する複数の有向非巡回グラフを生成するステップ;
(b-10)前記複数の有向非巡回グラフの尤度を上記ステップ(b-7)及び(b-8)と同じ方法によって求め、前記複数の有向非巡回グラフの尤度の確率分布を生成するステップ;
(b-11)上記ステップ(b-10)で求めた確率分布において、上記ステップ(b-8)で求めた尤度から上側における確率密度をグラフ整合性確率として計算するステップ:
(b-12)前記グラフ整合性確率が所定の閾値以下である場合に、前記既知のパスウェイを前記反応量データに整合するパスウェイであると判定するステップ。 - 請求項4または5に記載の解析方法であって、さらに、
(e)前記解析装置が、前記反応量データがコントロールの反応量に対して所定の閾値以上の差分を有する物質をシグネチャ物質として求めるステップを備え、
前記ステップ(d)では、前記ステップ(e)で求めたシグネチャ物質のデータをも用いてターゲット物質を求める解析方法。 - 検体に含まれる複数の物質に対して所定の処理を行ったときの反応量データと既知のパスウェイとの整合性を解析する解析装置であって、
複数の検体についての反応量データを入力する入力部と、
前記物質をノードとする既知のパスウェイのデータを記憶した記憶部と、
前記記憶部から前記既知のパスウェイのデータを読み出し、前記既知のパスウェイと前記反応量データとの整合性を求めるネットワーク整合性判定部と、
を備え、
前記ネットワーク整合性判定部は、前記既知のパスウェイが無向グラフの場合に、次の処理によって、前記既知のパスウェイと前記反応量データとの整合性を表すグラフ整合性確率を求める:
(b-1)前記既知のパスウェイを互いに接続された2つのノードからなる複数のサブグラフに分解するステップ;
(b-2)各サブグラフに前記反応量データを適用して各ノード間の偏相関係数を求め、求めた偏相関係数の独立性検定の確率値を結合して、前記既知のパスウェイの前記反応量データに対する独立性を表す結合確率値を求めるステップ;
(b-3)前記既知のパスウェイと同数のノードを有する複数のグラフを生成するステップ;
(b-4)前記複数のグラフの結合確率を上記ステップ(b-1)及び(b-2)と同じ方法によって求め、前記複数のグラフの結合確率値の確率分布を生成するステップ;
(b-5)上記ステップ(b-4)で求めた確率分布において、上記ステップ(b-2)で求めた結合確率値から上側における確率密度をグラフ整合性確率として求めるステップ;
(b-6)前記グラフ整合性確率が所定の閾値以下である場合に、前記既知のパスウェイを前記反応量データに整合するパスウェイとして選択するステップ。 - 検体に含まれる複数に物質に対して所定の処理を行ったときの反応量データに基づいて、ターゲット物質を求める解析装置であって、
複数の検体についての反応量データを入力する入力部と、
前記物質をノードとする既知のパスウェイのデータを記憶した記憶部と、
前記記憶部から前記既知のパスウェイのデータを読み出し、前記既知のパスウェイの中から前記反応量データに整合するパスウェイを選択するネットワーク整合性判定部と、
前記反応量データに基づいて、前記物質間の偏相関係数を求め、前記偏相関係数に基づいて前記物質をノードとするネットワーク構造を生成するネットワーク推定部と、
前記ネットワーク整合性判定部にて選択した前記既知のパスウェイと、前記ネットワーク推定部にて生成した前記ネットワーク構造との間で、リンクで接続された2つのノードが同じ部分を探索し、探索されたノードの物質をターゲット物質として求めるターゲット物質探索部と、
を備え、
前記ネットワーク整合性判定部は、前記記憶部に記憶された既知のパスウェイが無向グラフの場合に、次の処理によって前記反応量データに整合する既知のパスウェイを選択する:
(b-1)前記既知のパスウェイを互いに接続された2つのノードからなる複数のサブグラフに分解するステップ;
(b-2)各サブグラフに前記反応量データを適用して各ノード間の偏相関係数を求め、求めた偏相関係数の独立性検定の確率値を結合して、前記既知のパスウェイの前記反応量データに対する独立性を表す結合確率値を求めるステップ;
(b-3)前記既知のパスウェイと同数のノードを有する複数のグラフを生成するステップ;
(b-4)前記複数のグラフの結合確率を上記ステップ(b-1)及び(b-2)と同じ方法によって求め、前記複数のグラフの結合確率値の確率分布を生成するステップ;
(b-5)上記ステップ(b-4)で求めた確率分布において、上記ステップ(b-2)で求めた結合確率値から上側における確率密度をグラフ整合性確率として求めるステップ;
(b-6)前記グラフ整合性確率が所定の閾値以下である場合に、前記既知のパスウェイを前記反応量データに整合するパスウェイとして選択するステップ。 - 検体に含まれる複数の物質に対して所定の処理を行ったときの反応量データと既知のパスウェイとの整合性を解析するためのプログラムであって、コンピュータに、次のステップを実行させる:
(a)複数の検体についての前記反応量データを取得するステップ;
(b)前記物質をノードとする既知のパスウェイのデータを記憶した記憶部から前記既知のパスウェイのデータを読み出し、前記既知のパスウェイと前記反応量データとの整合性を求めるステップであって、前記既知のパスウェイが無向グラフの場合に、次のステップによって既知のパスウェイとの整合性を求めるステップ;
(b-1)前記既知のパスウェイを互いに接続された2つのノードからなる複数のサブグラフに分解するステップ;
(b-2)各サブグラフに前記反応量データを適用して各ノード間の偏相関係数を求め、求めた偏相関係数の独立性検定の確率値を結合して、前記既知のパスウェイの前記反応量データに対する独立性を表す結合確率値を求めるステップ;
(b-3)前記既知のパスウェイと同数のノードを有する複数のグラフを生成するステップ;
(b-4)前記複数のグラフの結合確率を上記ステップ(b-1)及び(b-2)と同じ方法によって求め、前記複数のグラフの結合確率値の確率分布を生成するステップ;
(b-5)上記ステップ(b-4)で求めた確率分布において、上記ステップ(b-2)で求めた結合確率値から上側における確率密度をグラフ整合性確率として求めるステップ;
(b-6)前記グラフ整合性確率が所定の閾値以下である場合に、前記既知のパスウェイを前記反応量データに整合するパスウェイとして選択するステップ。 - 検体に含まれる複数に物質に対して所定の処理を行ったときの反応量データに基づいて、ターゲット物質を求めるためのプログラムを記憶した不揮発性記憶媒体であって、前記プログラムを実行することにより、コンピュータに、次のステップを実行させる:
(a)複数の検体についての前記反応量データを取得するステップ;
(b)前記物質をノードとする既知のパスウェイのデータを記憶した記憶部から、前記既知のパスウェイのデータを読み出し、前記反応量データと所定の閾値以上の整合性を有するパスウェイを選択するステップであって、前記記憶部に記憶された既知のパスウェイが無向グラフの場合に、次のステップによって既知のパスウェイを選択するステップ;
(b-1)前記既知のパスウェイを互いに接続された2つのノードからなる複数のサブグラフに分解するステップ;
(b-2)各サブグラフに前記反応量データを適用して各ノード間の偏相関係数を求め、求めた偏相関係数の独立性検定の確率値を結合して、前記既知のパスウェイの前記反応量データに対する独立性を表す結合確率値を求めるステップ;
(b-3)前記既知のパスウェイと同数のノードを有する複数のグラフを生成するステップ;
(b-4)前記複数のグラフの結合確率を上記ステップ(b-1)及び(b-2)と同じ方法によって求め、前記複数のグラフの結合確率値の確率分布を生成するステップ;
(b-5)上記ステップ(b-4)で求めた確率分布において、上記ステップ(b-2)で求めた結合確率値から上側における確率密度をグラフ整合性確率として求めるステップ;
(b-6)前記グラフ整合性確率が所定の閾値以下である場合に、前記既知のパスウェイを前記反応量データに整合するパスウェイであるとして選択するステップ;
(c)前記物質の反応量データに基づいて、前記物質間の偏相関係数を求め、前記偏相関係数に基づいて前記物質をノードとするネットワーク構造を生成するステップ;
(d)ステップ(b)で選択された前記既知のパスウェイと、ステップ(c)で生成された前記ネットワーク構造との間で、リンクで接続された2つのノードが同じ部分を探索し、探索されたノードの物質をターゲット物質として求めるステップ。
Priority Applications (2)
| Application Number | Priority Date | Filing Date | Title |
|---|---|---|---|
| US16/761,165 US20200265919A1 (en) | 2017-11-07 | 2018-11-05 | Analyzing device, analysis method program, and non-volatile storage medium |
| CN201880071246.4A CN111295711A (zh) | 2017-11-07 | 2018-11-05 | 解析装置、解析方法程序以及非易失性存储介质 |
Applications Claiming Priority (2)
| Application Number | Priority Date | Filing Date | Title |
|---|---|---|---|
| JP2017215038A JP6884389B2 (ja) | 2017-11-07 | 2017-11-07 | 解析装置、解析方法およびプログラム |
| JP2017-215038 | 2017-11-07 |
Publications (1)
| Publication Number | Publication Date |
|---|---|
| WO2019093263A1 true WO2019093263A1 (ja) | 2019-05-16 |
Family
ID=66438407
Family Applications (1)
| Application Number | Title | Priority Date | Filing Date |
|---|---|---|---|
| PCT/JP2018/040960 Ceased WO2019093263A1 (ja) | 2017-11-07 | 2018-11-05 | 解析装置、解析方法プログラムおよび不揮発性記憶媒体 |
Country Status (4)
| Country | Link |
|---|---|
| US (1) | US20200265919A1 (ja) |
| JP (1) | JP6884389B2 (ja) |
| CN (1) | CN111295711A (ja) |
| WO (1) | WO2019093263A1 (ja) |
Cited By (3)
| Publication number | Priority date | Publication date | Assignee | Title |
|---|---|---|---|---|
| WO2022003997A1 (ja) * | 2020-07-02 | 2022-01-06 | 株式会社Fronteo | パスウェイ生成装置、パスウェイ生成方法およびパスウェイ生成用プログラム |
| WO2024085096A1 (ja) * | 2022-10-18 | 2024-04-25 | ソシウム株式会社 | 変動パスウェイデータベース生成装置、探索装置、変動パスウェイデータベース生成方法、探索方法、およびプログラム |
| WO2025004167A1 (ja) * | 2023-06-27 | 2025-01-02 | 株式会社Fronteo | パスウェイ解析装置、パスウェイ解析方法およびパスウェイ解析プログラム |
Families Citing this family (1)
| Publication number | Priority date | Publication date | Assignee | Title |
|---|---|---|---|---|
| WO2022149372A1 (ja) * | 2021-01-08 | 2022-07-14 | ソニーグループ株式会社 | 情報処理装置、情報処理方法及びプログラム |
Citations (3)
| Publication number | Priority date | Publication date | Assignee | Title |
|---|---|---|---|---|
| JP2002175305A (ja) * | 2000-12-06 | 2002-06-21 | Biomolecular Engineering Research Institute | 遺伝子ネットワークを推測するためのグラフィカルモデリング法及びそのための装置 |
| JP2014228991A (ja) * | 2013-05-21 | 2014-12-08 | ソニー株式会社 | 情報処理装置および方法、並びにプログラム |
| JP2016048485A (ja) * | 2014-08-28 | 2016-04-07 | 国立研究開発法人産業技術総合研究所 | 遺伝子発現情報解析装置、遺伝子発現情報解析方法、及びプログラム |
Family Cites Families (2)
| Publication number | Priority date | Publication date | Assignee | Title |
|---|---|---|---|---|
| JP6550571B2 (ja) * | 2014-11-18 | 2019-07-31 | 国立研究開発法人産業技術総合研究所 | 薬剤探索装置、薬剤探索方法およびプログラム |
| WO2016121054A1 (ja) * | 2015-01-29 | 2016-08-04 | 株式会社日立製作所 | 計算機システム及びグラフィカルモデルの補正方法 |
-
2017
- 2017-11-07 JP JP2017215038A patent/JP6884389B2/ja active Active
-
2018
- 2018-11-05 CN CN201880071246.4A patent/CN111295711A/zh active Pending
- 2018-11-05 US US16/761,165 patent/US20200265919A1/en not_active Abandoned
- 2018-11-05 WO PCT/JP2018/040960 patent/WO2019093263A1/ja not_active Ceased
Patent Citations (3)
| Publication number | Priority date | Publication date | Assignee | Title |
|---|---|---|---|---|
| JP2002175305A (ja) * | 2000-12-06 | 2002-06-21 | Biomolecular Engineering Research Institute | 遺伝子ネットワークを推測するためのグラフィカルモデリング法及びそのための装置 |
| JP2014228991A (ja) * | 2013-05-21 | 2014-12-08 | ソニー株式会社 | 情報処理装置および方法、並びにプログラム |
| JP2016048485A (ja) * | 2014-08-28 | 2016-04-07 | 国立研究開発法人産業技術総合研究所 | 遺伝子発現情報解析装置、遺伝子発現情報解析方法、及びプログラム |
Non-Patent Citations (2)
| Title |
|---|
| AFUSO, HITOSHI ET AL.: "Genetic Causal Network Estimation from the Gene Expression Data", IPSJ SIG TECHNICAL REPORTS, vol. 2006, no. 99, pages 9 - 15 * |
| SAITO, SHIGERU ET AL.: "Network evaluation from the consistency of the graph structure with the measured data", BMC SYSTEM BIOLOGY, vol. 2, no. 84, 1 October 2008 (2008-10-01), pages 1 - 14, XP021045485 * |
Cited By (5)
| Publication number | Priority date | Publication date | Assignee | Title |
|---|---|---|---|---|
| WO2022003997A1 (ja) * | 2020-07-02 | 2022-01-06 | 株式会社Fronteo | パスウェイ生成装置、パスウェイ生成方法およびパスウェイ生成用プログラム |
| JP2022012659A (ja) * | 2020-07-02 | 2022-01-17 | 株式会社Fronteo | パスウェイ生成装置、パスウェイ生成方法およびパスウェイ生成用プログラム |
| WO2024085096A1 (ja) * | 2022-10-18 | 2024-04-25 | ソシウム株式会社 | 変動パスウェイデータベース生成装置、探索装置、変動パスウェイデータベース生成方法、探索方法、およびプログラム |
| WO2025004167A1 (ja) * | 2023-06-27 | 2025-01-02 | 株式会社Fronteo | パスウェイ解析装置、パスウェイ解析方法およびパスウェイ解析プログラム |
| JP7656284B1 (ja) * | 2023-06-27 | 2025-04-03 | 株式会社Fronteo | パスウェイ解析装置、パスウェイ解析方法およびパスウェイ解析プログラム |
Also Published As
| Publication number | Publication date |
|---|---|
| CN111295711A (zh) | 2020-06-16 |
| US20200265919A1 (en) | 2020-08-20 |
| JP6884389B2 (ja) | 2021-06-09 |
| JP2019087053A (ja) | 2019-06-06 |
Similar Documents
| Publication | Publication Date | Title |
|---|---|---|
| US20230207068A1 (en) | Methods of Profiling Mass Spectral Data Using Neural Networks | |
| Wu et al. | Tools for the analysis of high-dimensional single-cell RNA sequencing data | |
| US12272060B2 (en) | Method and system for determining concentration of an analyte in a sample of a bodily fluid, and method and system for generating a software-implemented module | |
| CN110890137A (zh) | 一种化合物毒性预测模型建模方法、装置及其应用 | |
| JP7817147B2 (ja) | 誤検知を減少させた分光学的定量化のための識別 | |
| US20200279148A1 (en) | Material structure analysis method and material structure analyzer | |
| Shababo et al. | Bayesian inference and online experimental design for mapping neural microcircuits | |
| JP2018152000A (ja) | 分析データ解析装置及び分析データ解析方法 | |
| JP6884389B2 (ja) | 解析装置、解析方法およびプログラム | |
| Heylman et al. | Supervised machine learning for classification of the electrophysiological effects of chronotropic drugs on human induced pluripotent stem cell-derived cardiomyocytes | |
| KR102113502B1 (ko) | 말디토프 질량 분석에 의한 항생제 내성 판별 장치 및 방법 | |
| Hediyeh-zadeh et al. | MSImpute: Imputation of label-free mass spectrometry peptides by low-rank approximation | |
| Andreu et al. | Prediction of bioactive peptides using artificial neural networks | |
| KR20110054926A (ko) | 생물학적 네트워크 분석을 이용한 마이크로어레이 실험 자료의 작용기작, 실험/처리 조건 특이적 네트워크 생성 및 실험/처리 조건 관계성 해석을 위한 알고리즘을 포함한 시스템 및 방법과 상기 방법을 수행하기 위한 프로그램을 갖는 기록매체 | |
| Baumgartner et al. | A novel network-based approach for discovering dynamic metabolic biomarkers in cardiovascular disease | |
| Shin et al. | Guilt-by-association feature selection: identifying biomarkers from proteomic profiles | |
| Procopio et al. | A combined simulation and machine learning approach to classify severity of infarction patients | |
| Lopez-Fernandez et al. | A comprehensive analysis about the influence of low-level preprocessing techniques on mass spectrometry data for sample classification | |
| CN118606611A (zh) | 一种基于半监督非负矩阵分解和最小角回归的空间转录组解卷积方法及应用 | |
| Aiche et al. | Inferring proteolytic processes from mass spectrometry time series data using degradation graphs | |
| Rodríguez-Belenguer et al. | Application of machine learning to improve the efficiency of electrophysiological simulations used for the prediction of drug-induced ventricular arrhythmia | |
| US20260018291A1 (en) | Domain Adaptation Engine(s) For Cell-Free DNA Fragmentomics | |
| Burzykowski et al. | Experimental Design in Quantitative Proteomics | |
| Dobbe et al. | Heterogeneity in cancer dynamics: A convex formulation to dissect dynamic trajectories and infer LTV models of networked systems | |
| Barmpas et al. | Hyperdimensional computing approaches in single cell RNA sequencing classification |
Legal Events
| Date | Code | Title | Description |
|---|---|---|---|
| 121 | Ep: the epo has been informed by wipo that ep was designated in this application |
Ref document number: 18875493 Country of ref document: EP Kind code of ref document: A1 |
|
| NENP | Non-entry into the national phase |
Ref country code: DE |
|
| 122 | Ep: pct application non-entry in european phase |
Ref document number: 18875493 Country of ref document: EP Kind code of ref document: A1 |