WO2019024345A1 - 基于带序兴趣区域的轨迹查询的匀速搜索扩展算法 - Google Patents
基于带序兴趣区域的轨迹查询的匀速搜索扩展算法 Download PDFInfo
- Publication number
- WO2019024345A1 WO2019024345A1 PCT/CN2017/113472 CN2017113472W WO2019024345A1 WO 2019024345 A1 WO2019024345 A1 WO 2019024345A1 CN 2017113472 W CN2017113472 W CN 2017113472W WO 2019024345 A1 WO2019024345 A1 WO 2019024345A1
- Authority
- WO
- WIPO (PCT)
- Prior art keywords
- trajectory
- query
- correlation
- head
- spatial density
- Prior art date
- Legal status (The legal status is an assumption and is not a legal conclusion. Google has not performed a legal analysis and makes no representation as to the accuracy of the status listed.)
- Ceased
Links
Images


Classifications
-
- G—PHYSICS
- G06—COMPUTING OR CALCULATING; COUNTING
- G06F—ELECTRIC DIGITAL DATA PROCESSING
- G06F16/00—Information retrieval; Database structures therefor; File system structures therefor
- G06F16/20—Information retrieval; Database structures therefor; File system structures therefor of structured data, e.g. relational data
- G06F16/29—Geographical information databases
Definitions
- the invention belongs to a location-based service in the field of computer spatial data, and in particular relates to a uniform search expansion algorithm based on track query of a sequenced region of interest.
- trajectory search queries are generally classified into three categories.
- the query parameter is a single spatial point, and the query looks for a trajectory that is spatially close to the query point.
- Zheng et al. [K. Zheng, B. Zheng, J. Xu, G. Liu, A. Liu, and Z. Li. Popularityaware spatial keyword search on activity trajectories. World Wide Web, 19(6): 1–25, Online first, 2016.] Extend this query to the overlay space and text field, and propose a TkSK query to retrieve the trajectory spatially close to the query point to meet the semantic requirements of the query definition.
- the query requires a set of locations (such as a sightseeing place) as parameters to return a link or a trajectory that approximates the query location according to some criteria.
- locations such as a sightseeing place
- TTL location-based trajectory search
- the query parameters are a set or series of locations.
- a place may not be the location of a point, but it may be a region of interest that contains several spatial objects.
- the user may not be able to accurately specify the intended location, instead using the intended area instead.
- TSR trajectory search interest
- the present invention investigates a trajectory search interest (TSR) query by region, which aims to find a trajectory that has the highest correlation with the spatial density of the query region.
- TSR queries are not valid for TSR queries for two reasons. First, TSL only considers space, while TSR takes into account spatial distance and spatial object density. Second, TSL is only performed in Euclidean space, and spatial index (for example, R-tree [A. Guttman. R-trees: a dynamic index structure for spatial searching. In SIGMOD, pages 47-57, 1984.]) is used. Improve query efficiency. But in our work, movement is limited to the space network.
- the lower bound distance of the network may not be the corresponding Euclidean distance; therefore, spatial indicators such as R-tree are invalid of. This is the main reason we use network extensions (ie, Dijkstra's extension).
- TSR query and its solution are different from PNC query.
- the solution has the following six aspects: (i) query type: PNC query is spatial density query on space and density domain, and TSR query is spatial query (density also It is considered, but the query processing only occurs in the spatial domain).
- Query parameters and results The PNC query takes the route as a parameter and returns a top-k cluster with the highest distance-density for the query route, while the TSR query takes a set of regions of interest as parameters and returns the highest spatial density. Off track.
- Similarity function The similarity function is used for PNC queries to calculate the correlation of distance and density in the spatial and density domain, and their linear combination. In the spatial domain, it measures the network distance between the cluster center and the route; and in the density domain, calculates the density of the cluster.
- the similarity function of the TSR query evaluates the spatial density correlation between the trajectory and a set of query regions. The distance between the trajectory and all spatial objects in the query area is taken into account.
- the technical problem to be solved by the present invention is to provide a uniform search expansion algorithm based on a tracked query of a sequenced region of interest, given a set of track parameters, and a TSR query requires a set of regions of interest as a parameter and returns The track has the highest correlation with the spatial density of the query area.
- This type of query can be used for many popular applications, such as trip planning and recommendations, and location-based services, extending the scope of applications.
- the invention solves the problem that the existing TSL solution is invalid for TSR query (track-based query based on region of interest), and the existing PNC solution is not applicable to the TSR problem.
- the user can specify a preferred sequence of access to the query area, in which case the order of the areas needs to be considered.
- the uniform search expansion algorithm based on the trajectory query of the ordered region of interest considers the order of each region, and solves the above technical problem.
- the present invention develops a straightforward method for computing TSR queries (track-based queries based on regions of interest), which is referred to as a uniform search (USS), which follows a filter-perfect mode.
- a uniform search USS
- Each query, the query area center pi is used as a so-called query source, and the network is extended (ie, extended Dijkstra [EWDijkstra.A note on two problems in connection with graphs.Numevik Math, 1:269–271, 1959) .]) is to explore the space network from these query sources at the same speed.
- a uniform search requires that the trajectory be spatially close to the dense sub-region of the query area.
- the upper and lower limits of the spatial density dependence of the track and a set of query regions are used for the pruning search space.
- the present invention provides a uniform search expansion algorithm based on a tracked query of a sequenced region of interest, including the following steps:
- C' sd (c, v) is the spatial density correlation between the query regions c and v
- C' sd (C, v) represents the space of the query region set C and the trajectory ⁇ Density correlation
- p i . g is the number of spatial objects attached to p i
- sd(p, v) represents the distance between point p and point v
- *.head represents the first element in the list
- *.tail represents the list except for head a list of all the elements
- Step 2 Use the same rate Dijkstra extension algorithm from each center of the query area, each time expanding the point with the smallest distance;
- Step 3 Calculate the upper and lower limits of the spatial density, update LB and UB;
- Step 4 Determine whether LB>UB or the search radius exceeds ⁇ , ⁇ is a threshold set in advance, if the search is completed, the search ends, and proceeds to the next step 5; if not, returns to step 3;
- Step 5 Sort the trajectory according to the value of the upper limit of the spatial density
- Step 6 Further refinement according to the trajectory ordering, returning the trajectory with the largest spatial density correlation.
- the point at which each extended distance is the smallest in step 2 is expanded by selecting a vertex having a minimum distance label.
- the upper and lower limits of the calculated spatial density in step 3 are specifically: for each newly scanned trajectory, if it is not scanned by the extended scan starting from pi, it is marked as being scanned by pi, Calculate the upper limit of the spatial density C' sd (C, ⁇ ).ub and the lower limit C' sd (C, ⁇ ). lb;
- the upper limit of the spatial density is estimated as:
- C is the set of query regions
- ⁇ is a trajectory
- C' sd (C, ⁇ ) is the spatial density dependence of the trajectory ⁇ and the set of query regions C, C' sd (C, ⁇ ).
- lb represents this correlation
- C.head represents the first query region in set C
- ⁇ .head represents the first element in ⁇
- lb represents the lower bound of the correlation between C.head and ⁇ .head in the query area
- C' sd (C.head, ⁇ .head).ub represents the upper limit of the correlation between C.head and ⁇ .head in the query area.
- C.tail represents a list of all query areas except C.head in the list.
- C' sd (C.tail, ⁇ ) represents the correlation between the query region set C.tail and the track ⁇
- C' sd (C , ⁇ .tail) represents the correlation of the query region set C with the trajectory ⁇ .tail.
- the update LB and UB in step 3 are specifically: if C' sd (C, ⁇ ). lb > LB, the LB is updated to C' sd (C, ⁇ ). lb; if C ' sd (C, ⁇ ).ub ⁇ UB, UB updated to C' sd (C, ⁇ ).ub.
- the search ends in step 4, the trajectory whose upper limit of the spatial density is smaller than LB is deleted from Tf , and Tf is a set of all trajectories that are completely covered.
- the trajectories in Tf in step 5 are sorted according to the value of the upper limit of the spatial density.
- the trajectory ordering is further refined in step 6.
- ⁇ p1, p2, ..., pi ⁇ is the closest to the center of the region ⁇ c1.m , c2.m,..., ci.m ⁇ vertices
- perform Dijkstra extension algorithm from ⁇ p1, p2, ..., pi ⁇ to calculate the network distance between pi and vertices in region ci, once
- the refinement terminates, returning the trajectory with the largest spatial density correlation;
- Tr is the trajectory set that has been refined
- Tu is the trajectory set that is not refined
- Tr ⁇ Tu Tf
- ⁇ ' is a piece in Tu Track.
- the present invention has the following beneficial effects:
- the present invention is based on regions of interest; in addition, we have also studied The TSR query in the case of specifying a sequence of accessing the expected area; the present invention solves the problem that the existing TSL solution is invalid for the TSR query, and the existing PNC solution does not apply to the TSR problem.
- the user can specify a sequence of preferred access queries, in which case the order of the regions needs to be considered.
- the uniform search expansion algorithm based on the trajectory query of the ordered region of interest considers the order of each region, and solves the above technical problem.
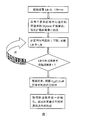
- FIG. 1 is a flow chart of a uniform search expansion algorithm based on a tracked query of a sequenced region of interest according to the present invention.
- FIG. 2 is a schematic diagram of an example of a TSR query of the present invention.
- Figure 3 is a schematic illustration of an embodiment of spatial density correlation of the present invention.
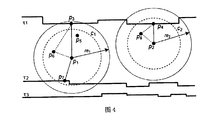
- FIG. 4 is a schematic diagram of an example of a uniform search expansion algorithm (USS algorithm) based on a tracked query of a sequenced region of interest according to the present invention.
- USS algorithm uniform search expansion algorithm
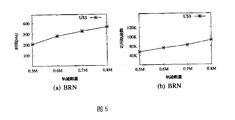
- FIG. 5 is a schematic diagram showing the influence of different trajectory numbers on experimental results according to the present invention. wherein FIG. 5(a) represents the influence of different trajectories on the running time in Beijing Road Network (BRN); FIG. 5(b) represents Beijing Road Network ( Number of access trajectories in different trajectories in BRN).
- BRN Beijing Road Network
- the system of the invention is defined as follows:
- V is the set of vertices
- I a set of edges.
- the vertex vi ⁇ V represents the road intersection or end point.
- the function F: V ⁇ E ⁇ Geometries records the geometric information of the spatial network. In particular, it maps the vertices and edges to the points of the respective road intersections and the polylines representing the corresponding road segments.
- W:E ⁇ R assigns weights to each edge.
- the weight of the edge e, W(e) represents the length of the corresponding link or some other relevant property such as fuel consumption or travel time, which can be obtained by mining historical traffic data.
- vi (pi, ti)
- the area of interest is a subgraph Contains vertex cV and edge cE, defined by center vm and radius r, where c.vm is the vertex in G: r is the network distance from c to the area boundary.
- the spatial influence factor I(p1, p2) is defined as follows:
- ⁇ is a threshold.
- the value of I(p1, p2) is inversely proportional to sd(p1, p2). If the distance between p1 and p2 reaches the threshold, the influence factor between them is set to zero.
- the threshold is used to further trim the trajectory from the query area.
- the value of I(p1, p2) is in the range [0, e - ⁇ ], e - ⁇ ⁇ (0, 1).
- pi is a vertex belonging to c
- p ⁇ is the vertex closest to the center c.m of the region.
- Pi.g is the number of spatial objects connected to pi. Both spatial distance and spatial object density are taken into account. These functions extend the well-known longest common subsequence (LCSS) by considering the density of spatial objects.
- LCSS longest common subsequence
- each region plays an equally important role, so we use the Sigmoid function to normalize the spatial density correlation C sd (c, ⁇ ) to the range [0, 1].
- the Sigmoid function is as follows:
- C'sd(c, v) is the spatial density correlation between the query areas c and v.
- C'sd(C,v) represents the spatial density correlation of the set of query regions C with the trajectory ⁇ .
- Pi.g is the number of spatial objects attached to pi.
- Sd(p,v) represents the distance between point p and point v.
- *.head represents the first element in the list, and *.tail represents a list of all elements except the head in the list.
- USS algorithm a uniform search expansion algorithm based on the track query of the ordered region of interest according to the present invention:
- the USS algorithm of the present invention is a simple method for calculating TRS queries based on filtering and refinement. Given the trajectory data set T and the query area set C, the USS seeks a trajectory spatially close to the dense area of the spatial object within the query area. Each regional center ci.m (ci ⁇ C) is selected as the so-called query source, and the network extension (ie Dijkstra's extension) performs network search from the query source at the same speed, and defines the upper and lower limits of the spatial density correlation. Trim the search space. By integrating the results, we found the trajectory with the greatest correlation with the spatial density of C. As shown in Figure 1, the specific steps of the algorithm of the present invention are as follows:
- the global spatial density correlation lower bound LB is set to 0, and the global spatial density correlation upper bound UB is set to + ⁇ .
- C is the set of query regions
- ⁇ is a trajectory
- C' sd (C, ⁇ ) is the spatial density dependence of the trajectory ⁇ and the set of query regions C
- C' sd (C, ⁇ ) is the spatial density dependence of the trajectory ⁇ and the set of query regions C
- C' sd (C, ⁇ ) represents the lower bound of this correlation.
- C.head represents the first query area in set C
- ⁇ .head represents the first element in ⁇
- C' sd (C.head, ⁇ .head).lb represents the correlation between C.head and ⁇ .head in the query area.
- C.tail represents a list of all query areas except C.head in the list
- C' sd (C.tail, ⁇ ) represents the correlation between the query region set C.tail and the track ⁇
- C' sd (C, ⁇ .tail) represents the correlation of the query region set C with the trajectory ⁇ .tail.
- the upper limit of the spatial density correlation is estimated as:
- C is the set of query regions
- ⁇ is a trajectory
- C' sd (C, ⁇ ) is the spatial density correlation of the trajectory ⁇ and the set of query regions C
- C' sd (C, ⁇ ).ub represents the upper limit of this correlation.
- C.head represents the first query area in set C
- ⁇ .head represents the first element in ⁇
- C' sd (C.head, ⁇ .head).ub represents the correlation between C.head and ⁇ .head in the query area.
- C.tail represents a list of all query areas except C.head in the list
- C' sd (C.tail, ⁇ ) represents the correlation between the query region set C.tail and the track ⁇
- C' sd (C, ⁇ .tail) represents the correlation of the query region set C with the trajectory ⁇ .tail.
- T r is the set of tracks that have been refined
- T u is the set of tracks that have not been refined.
- FIG. 2 shows an example of a TSR query.
- c1, c2, and c3 are TSR query areas
- p1, p2, and p3 are the corresponding area centers
- r1, r2, and r3 are radii.
- Points p3, p4, ..., p8 are the sampling points within the track.
- ⁇ 1, p6, p7, and p8 are sampling points closest to the centers p1, p2, and p3, respectively.
- p4 and p5 are the sampling points closest to the centers p1 and p2, respectively.
- Each region contains several spatial objects.
- the trajectory ⁇ 2 is returned because the trajectory ⁇ 2 is spatially closest to the center of the region. If we consider the distribution of spatial objects, the trajectory ⁇ 2 is less attractive than the trajectory ⁇ 1 because it is farther away from the region where the spatial object density is high.
- the trajectory ⁇ 1 is the best choice when considering both of the above aspects (although the trajectory ⁇ 2 is slightly better in spatial distance than ⁇ 1).
- Figure 3 shows an embodiment of spatial density correlation.
- ⁇ is a trajectory
- c1 and c2 are two regions
- p1 and p2 are their centers, respectively.
- the vertices ⁇ p3, p4 ⁇ ⁇ are the points closest to p1 and p2 on ⁇ , ⁇ p5, p6, p7, p8 ⁇ ⁇ c1, ⁇ p9, p10 ⁇ ⁇ c2.
- c1 and c2 are two regions, p1 and p2 are their centers respectively, ⁇ 1, ⁇ 2, ⁇ 3 are three trajectories, and p3 and p4 are the closest to p1 and p2 on the trajectory ⁇ 1. point.
- the track set size in the BRN is set to 600,000, and when the NRN is set to 1000,000, the track length is set to 20 in the BRN, set to 100 in the NRN, and the number of query areas in the BRN and BRN is set to 6.
- the average radius of the query area varies from 2 km to 10 km, at BRN (default 6 km); at NRN (default 150 km) varies from 50 km to 250 km.
- Figure 5 shows the performance of the algorithm for the number of different trajectories
- causes more trajectories to be processed and produces a larger trajectory search space. Therefore, both the CPU time and the number of access trajectories under the algorithm of the present invention will be higher.
Landscapes
- Engineering & Computer Science (AREA)
- Databases & Information Systems (AREA)
- Theoretical Computer Science (AREA)
- Remote Sensing (AREA)
- Data Mining & Analysis (AREA)
- Physics & Mathematics (AREA)
- General Engineering & Computer Science (AREA)
- General Physics & Mathematics (AREA)
- Information Retrieval, Db Structures And Fs Structures Therefor (AREA)
Abstract
本发明公开了一种基于带序兴趣区域的轨迹查询的匀速搜索扩展算法,包括:1:初始设置全局空间密度相关性下限LB=0,全局空间密度相关性上限UB=+∞;2:从查询区域的每个中心使用相同速率的Dijkstra扩展算法,每次扩展距离最小的点;步骤3:计算空间密度的上限和下限,更新LB和UB;步骤4:判断LB>UB或搜索半径超过ε是否成立,ε是事先设置的阈值,如成立则搜索结束,进入下一步;如不成立,则回到步骤3;步骤5:根据空间密度上限的值对轨迹进行排序;步骤6:按照轨迹排序细化,返回具有最大空间密度相关性的轨迹。与传统轨迹搜索(TSL)查询不同,本发明基于兴趣区域,解决了现有的TSL方案对TSR查询无效的问题,且考虑到各区域的顺序,解决了顺序问题。
Description
本发明属于计算机空间数据领域基于位置的服务,尤其涉及一种基于带序兴趣区域的轨迹查询的匀速搜索扩展算法。
一般将现有的轨迹搜索查询分为三类。在点对点轨迹查询类别中,查询参数是单个空间点,并且查询寻找空间上靠近查询点的轨迹。郑等人[K.Zheng,B.Zheng,J.Xu,G.Liu,A.Liu,and Z.Li.Popularityaware spatial keyword search on activity trajectories.World Wide Web,19(6):1–25,online first,2016.]将此查询扩展到覆盖空间和文本域,并提出TkSK查询来检索在空间上靠近查询点的轨迹,以满足查询定义的语义要求。在点到轨迹查询类别中,查询需要一组地点(如观光场所)作为参数,返回一条连接或根据某种标准接近查询位置的轨迹。基于位置的轨迹搜索的概念(TSL)首先由Chen等提出[Z.Chen,H.T.Shen,X.Zhou,Y.Zheng,and X.Xie.Searching trajectories by locations:an efficiency study.In SIGMOD,pages 255–266,2010.]。这个研究仅考虑空间域(欧几里德空间)。尚等[S.Shang,R.Ding,B.Yuan,K.Xie,K.Zheng,and P.Kalnis.User oriented trajectory search for trip recommendation.In EDBT,pages156–167,2012.]观察到由于用户的特定偏好,空间相似性没有充分捕捉查询位置与轨迹之间的关系。然后他们提出以用户为导向的轨迹搜索并扩展查询覆盖空间和文本域。直观地,如果轨迹接近指定的查询位置(空间域),其文本属性值与用户的文字偏好(文字域)类似,将会被推荐给用户。在轨迹到轨迹类别中,查询检索与查询轨迹最相似的轨迹。例如,PTM查询[S.Shang,R.Ding,K.Zheng,C.S.Jensen,P.Kalnis,and X.Zhou.Personalized trajectory matching in spatial networks.VLDB J.,23(3):449–468,2014.]考虑时空相似性,ATSQ查询[K.Zheng,S.Shang,N.J.Yuan,and Y.Yang.Towards efficient search for activity trajectories.In ICDE,pages 230–241,2013.]考虑空间-文本相似性。
在大多数现有的研究轨迹搜索中,查询参数是一组或一系列的位置。然而,在某些情况下,一个地方可能不是一个点的位置,但可能是包含几个空间对象的感兴趣区域。此外,特别是当规划一个在陌生城市的旅行时,用户可能无法准确指定预期地点,而使用预期区域代替。这两个常见的案例正是现有轨迹搜索方法存在的问题或缺陷。
与现有研究不同,本发明研究按地区进行轨迹搜索的兴趣(TSR)查询,它旨在找到一个与查询区域的空间密度相关性最高的轨迹。现有的TSL解决方案对TSR查询无效,有两个原因。首先,TSL只考虑空间,而TSR考虑到空间距离和空间物体密度。二是TSL只在欧氏空间中进行,空间索引(例如,R-tree[A.Guttman.R-trees:a dynamic index structure for spatial searching.In SIGMOD,pages 47–57,1984.])用于提高查询效率。但在我们的工作中,运动被限制到空间网络。当网络中的边的权重是对旅行的许多方面(例如,燃料消耗和旅行时间)建模,网络的下限距离可能不是相应的欧几里德距离;因此,诸如R-tree等空间指标是无效的。这是我们使用网络扩展的主要原因(即,Dijkstra的扩展)。
最相关的工作可以说是集群附近的路径(PNC)查询[S.Shang,K.Zheng,C.S.Jensen,B.Yang,P.Kalnis,G.Li,and J.Wen.Discovery of path nearby clusters in spatial networks.IEEE Trans.Knowl.Data Eng.,27(6):1505–1518,2015.],因此我们在此详细介绍。TSR查询及其解决方案与PNC查询不同,其解决方案有以下六个方面:(i)查询类型:PNC查询是在空间和密度域上进行的空间密度查询,而TSR查询是空间查询(密度也被考虑,但查询处理仅发生在空间域)。(ii)查询参数和结果:PNC查询以路由为参数,并返回关于查询路由具有最高距离-密度的top-k簇,而TSR查询将一组感兴趣的地区作为参数并返回具有最高空间密度相
关的轨迹。(iii)相似度函数:相似度函数用于PNC查询,会计算距离和密度在空间和密度领域的相关性,以及它们的线性组合。在空间域中,它测量集群中心与路由之间的网络距离;并且在密度域中,计算簇的密度。TSR查询的相似度函数评估轨迹与一组查询区域之间的空间密度相关性。轨迹和查询区域内所有空间对象之间的距离均被考虑在内。(iv)数据模型和算法结构:对于PNC查询,集群的密度映射到一维空间(密度域),PNC查询处理搜索此域以查找高空间物体密度的集群。TSR查询没有单独的密度域。空间物体的密度是轨迹与查询区域中空间物体之间的距离的总和。由于这些差异,PNC和TSR要求不同的算法。(v)优化技术:由于以上与PNC的差异,TSR需要具体优化技术。因TSR查询具有多个查询区域参数,需要一个策略来安排多个查询区域。TSR重用并扩展查询源选择PNC方法(方程式12-14)来从查询区域中选择查询源。(vi)实验空间数据集:使用不同的空间数据集。对于PNC查询,空间对象是地理标记的微博帖子,轨迹数据没有使用,而对于TSR查询,空间对象是使用兴趣点和真实或合成的轨迹数据。由于这六个差异,TSR查询及其解决方案是新的。PNC解决方案不适用于TSR问题。
发明内容
本发明要解决的技术问题在于提供一种基于带序兴趣区域的轨迹查询的匀速搜索扩展算法,其给定一个轨迹参数集合,一个TSR查询需要一组感兴趣的区域作为一个参数,并返回在轨迹集中与查询区域的空间密度相关性最高的轨迹。这种类型的查询可用于许多流行的应用,如行程规划和建议,和基于位置的服务,扩展了应用范围。本发明解决了现有的TSL解决方案对TSR查询(基于兴趣区域的轨迹查询)无效,现有的PNC解决方案不适用于TSR问题。此外,在某些情况下,用户可以指定首选访问查询区域的序列,在这种情况下,需要考虑到各区域的顺序。本发明基于带序兴趣区域的轨迹查询的匀速搜索扩展算法就考虑到各区域的顺序,解决了上述技术问题。
本发明开发一个直接的方法来计算TSR查询(基于兴趣区域的轨迹查询),它称为匀速搜索(USS),这遵循过滤-完善模式。每次查询时,查询区域中心pi被用作一个所谓的查询源,而网络的扩展(即扩展Dijkstra[E.W.Dijkstra.A note on two problems in connection with graphs.Numerische Math,1:269–271,1959.])是从这些查询源以相同的速度探索空间网络。匀速搜索要求轨迹在空间上接近查询区域的密集次区域。轨道与一组查询区域的空间密度相关性的上下限被用于剪枝搜索空间。
为解决上述技术问题,本发明提供一种基于带序兴趣区域的轨迹查询的匀速搜索扩展算法,包括如下步骤:
步骤1:初始设置全局空间密度相关性下限LB=0,全局空间密度相关性上限UB=+∞;定义空间密度相关性计算公式:


其中,v是轨迹τ上的点,C’sd(c,v)是查询区域c与v之间的空间密度相关性;C’sd(C,v)表示查询区域集合C与轨迹τ的空间密度相关性;pi。g是附属于pi的空间对象的数量;sd(p,v)代表点p与点v之间的距离;*.head表示列表中第一个元素,*.tail表示列表中除head之外的所有元素构成的列表;
步骤2:从查询区域的每个中心使用相同速率的Dijkstra扩展算法,每次扩展距离最小的点;
步骤3:计算空间密度的上限和下限,更新LB和UB;
步骤4:判断LB>UB或搜索半径超过ε是否成立,ε是事先设置的阈值,如成立则搜索结束,进入下一步骤5;如不成立,则回到步骤3;
步骤5:根据空间密度上限的值对轨迹进行排序;
步骤6:按照轨迹排序进一步细化,返回具有最大空间密度相关性的轨迹。
作为本发明优选的技术方案,步骤2中所述每次扩展距离最小的点通过选择具有最小距离标签的顶点进行扩展。
作为本发明优选的技术方案,步骤3中所述计算空间密度的上限和下限具体为:对于每一个新扫描的轨迹,如果没有被从pi开始的扩展扫描,它被标记为已被pi扫描,计算其空间密度上限C’sd(C,τ).ub和下限C’sd(C,τ).lb;
空间密度下限估算公式为:

对应的,空间密度上限估算公式为:

其中,C是查询区域集合,τ是一条轨迹,C’sd(C,τ)是轨迹τ与查询区域集合C的空间密度相关性,C’sd(C,τ).lb代表这个相关性的下限,C’sd(C,τ).ub代表这个相关性的上限;C.head表示集合C中第一个查询区域,τ.head表示τ中第一个元素,C’sd(C.head,τ.head).lb表示查询区域C.head与τ.head相关性的下限,C’sd(C.head,τ.head).ub表示查询区域C.head与τ.head相关性的上限,C.tail表示列表中除C.head之外的所有查询区域构成的列表,C’sd(C.tail,τ)代表查询区域集合C.tail与轨迹τ的相关性,C’sd(C,τ.tail)代表查询区域集合C与轨迹τ.tail的相关性。
作为本发明优选的技术方案,步骤3中所述更新LB和UB具体为:如果C’sd(C,τ).lb>LB,LB更新为C’sd(C,τ).lb;如果C’sd(C,τ).ub<UB,UB更新为C’sd(C,τ).ub。
作为本发明优选的技术方案,步骤4中所述搜索结束,空间密度上限小于LB的轨迹从Tf中删除,Tf是所有被完全覆盖的轨迹的集合。
作为本发明优选的技术方案,步骤5中Tf中的轨迹根据空间密度上限的值排序。
作为本发明优选的技术方案,步骤6中所述按照轨迹排序进一步细化,具体为:对于轨迹τ∈Tf,假设{p1,p2,...,pi}是最靠近区域中心{c1.m,c2.m,...,ci.m}的顶点,从{p1,p2,...,pi}执行Dijkstra扩展算法来计算pi和区域ci内顶点之间的网络距离,一旦 所述细化终止,返回具有最大空间密度相关性的轨迹;其中Tr是已经被细化的轨迹集合,Tu是未被细化的轨迹集合,Tr∪Tu=Tf,τ’是Tu中的一条轨迹。
与现有技术相比,本发明具有以下有益效果:
1、与传统轨迹搜索(TSL)查询不同,本发明是基于兴趣区域的;另外,我们还研究了
在指定访问预期区域的序列情况下的TSR查询;本发明解决了现有的TSL解决方案对TSR查询无效,现有的PNC解决方案不适用于TSR问题。
2、在某些情况下,用户可以指定首选访问查询区域的序列,在这种情况下,需要考虑到各区域的顺序。本发明基于带序兴趣区域的轨迹查询的匀速搜索扩展算法就考虑到各区域的顺序,解决了上述技术问题。
3、经实验验证,一个更大的轨迹数导致更多的轨迹被处理并产生更大的轨迹搜索空间,采用本发明算法,CPU时间和访问轨迹数都将更高。
下面结合附图和实施例对本发明进一步说明。
图1是本发明基于带序兴趣区域的轨迹查询的匀速搜索扩展算法的流程图。
图2是本发明TSR查询实例示意图。
图3是本发明空间密度相关性的实施例示意图。
图4为本发明基于带序兴趣区域的轨迹查询的匀速搜索扩展算法(USS算法)的一个实例示意图。
图5为本发明的不同轨迹数对实验结果的影响示意图;其中,图5(a)代表北京路网(BRN)中不同轨迹数量对于运行时间的影响;图5(b)代表北京路网(BRN)中不同轨迹数量下的访问轨迹数。
现在结合附图对本发明作进一步详细的说明。这些附图均为简化的示意图,仅以示意方式说明本发明的基本结构,因此其仅显示与本发明有关的构成。
本发明系统定义如下:
空间网络
我们将空间网络建模为一个无向连通图G(V,E,F,W),其中V是顶点集, 是一个边集。顶点vi∈V表示道路交叉点或终点。定义边ek=(vi,vj)∈E通过两个顶点,并表示路段顶点vi和vj之间的行进功能。函数F:V∪E→Geometries记录空间网络的几何信息.特别地,它将顶点和边分别映射到相应道路交叉口的点和代表相应路段的折线。函数W:E→R给每个边分配权重。边e的权重W(e)代表相应的路段长度或一些其他相关性质如燃油消耗或旅行时间,可以通过挖掘历史交通数据获得。
轨迹
轨迹是一个有限的有序序列<v1,v2,...,vn>,其中vi=(pi,ti),其中pi是样点(在顶点处),ti是时间戳。在这项研究中,我们只考虑轨迹的空间属性。
兴趣区域
兴趣区域是一个子图 包含顶点c.V和边c.E,通过中心vm和半径r定义,其中c.vm是G中的顶点:r是从c到区域边界的网络距离。
空间密度相关性
给定空间网络中的任何两个顶点pa和pb,它们之间的网络最短路径由SP(pa,pb)表示,其长度由sd(pa,pb)表示。给出一个轨迹τ和空间网络中的顶点o,最小距离顶点o和轨迹τ之间的dM(o,τ)定义为:

其中pi是τ中的点。
给定两个空间点p1和p2,空间影响因子I(p1,p2)定义如下:

ε是一个阈值。I(p1,p2)的值与sd(p1,p2)成反比。如果p1和p2之间的距离达到阈值,则设置它们之间的影响因子是0。阈值用于从查询区域进一步修剪轨迹。I(p1,p2)的值在范围内[0,e-ε],e-ε∈(0,1)。
一个区域c与轨迹τ之间的空间密度相关性Csd(c,τ)定义如下:

这里,pi是属于c的顶点,p∈τ是最接近区域中心c.m的顶点。pi.g是连接到pi的空间对象个数。空间距离和空间对象密度都被考虑在内。这些功能通过考虑空间物体的密度来扩展众所周知的最长公共子序列(LCSS)。
在TSR查询处理中,每个地区都扮演着同样重要的角色,所以我们使用Sigmoid函数归一化空间密度相关性Csd(c,τ)到范围[0,1]。
Sigmoid函数如下:
S(x)=1/(1+e-x)
代入x=Csd(c,τ),S(x)即为空间密度相关性归一化之后的值。
扩展算法中,通过组合每个区域ci∈C的空间密度相关性,一组区域的集合C和轨迹τ之间的空间密度相关性由下面给出:


其中,v是轨迹τ上的点,C’sd(c,v)是查询区域c与v之间的空间密度相关性。C’sd(C,v)表示查询区域集合C与轨迹τ的空间密度相关性。pi.g是附属于pi的空间对象的数量。sd(p,v)代表点p与点v之间的距离。*.head表示列表中第一个元素,*.tail表示列表中除head之外的所有元素构成的列表。
以下是本发明基于带序兴趣区域的轨迹查询的匀速搜索扩展算法(简称USS算法):
本发明USS算法是一种简单的方法,基于过滤和细化来计算TRS查询。给定轨迹数据集T和查询区域集合C,USS求查询区域内在空间上靠近空间对象密集区域的轨迹。每个地区中心ci.m(ci∈C)被选为所谓的查询源,网络扩展(即Dijkstra的扩展)从查询源以相同的速度进行网络搜索,并对空间密度相关性的上下限定义来修剪搜索空间。通过整合结果,发现与C的空间密度相关性最大的轨迹。如图1所示,本发明算法的具体步骤如下:
1.最初,全局空间密度相关性下限LB设置为0,全局空间密度相关性上限UB设置为+∞。
2.从查询区域的每个中心依次使用相同速率的Dijkstra扩展算法(即在各个中心以相同的速率进行Dijkstra算法,即同一迭代中访问相同个数的点),通过选择具有最小距离标签
的顶点进行扩展。
3.计算空间密度的上下限,更新LB和UB:对于每一个新扫描的轨迹,如果没有被从pi开始的扩展扫描,它被标记为已被pi扫描,我们计算其空间密度上限C’sd(C,τ).ub和下限C’sd(C,τ).lb。如果C’sd(C,τ).lb>LB,LB更新为C’sd(C,τ).lb。此外,如果C’sd(C,τ).ub<UB,UB更新为C’sd(C,τ).ub。
空间密度下限估算公式为:

C是查询区域集合,τ是一条轨迹,C’sd(C,τ)是轨迹τ与查询区域集合C的空间密度相关性,C’sd(C,τ).lb代表这个相关性的下限。C.head表示集合C中第一个查询区域,τ.head表示τ中第一个元素,C’sd(C.head,τ.head).lb表示查询区域C.head与τ.head相关性的下限,C.tail表示列表中除C.head之外的所有查询区域构成的列表,C’sd(C.tail,τ)代表查询区域集合C.tail与轨迹τ的相关性,C’sd(C,τ.tail)代表查询区域集合C与轨迹τ.tail的相关性。
对应的,空间密度相关性上限估算公式为:

C是查询区域集合,τ是一条轨迹,C’sd(C,τ)是轨迹τ与查询区域集合C的空间密度相关性,C’sd(C,τ).ub代表这个相关性的上限。C.head表示集合C中第一个查询区域,τ.head表示τ中第一个元素,C’sd(C.head,τ.head).ub表示查询区域C.head与τ.head相关性的上限,C.tail表示列表中除C.head之外的所有查询区域构成的列表,C’sd(C.tail,τ)代表查询区域集合C.tail与轨迹τ的相关性,C’sd(C,τ.tail)代表查询区域集合C与轨迹τ.tail的相关性。
4.如果LB>UB或搜索半径超过ε,其中ε是事先设置的阈值,网络扩展终止,即搜索结束,C’sd(C,τ).ub小于LB的轨迹从Tf中删除,Tf是所有被完全覆盖的轨迹的集合。Tf中的轨迹根据C’sd(C,τ).ub的值排序。如果LB≤UB或搜索半径≤ε,则返回上一步骤;
5.按照轨迹排序进一步细化,一旦 细化终止,返回具有最大空间密度相关性的轨迹。其中Tr是已经被细化的轨迹集合,Tu是未被细化的轨迹集合。
细化:对于轨迹τ∈Tf,假设{p1,p2,...,pi}是最靠近区域中心{c1.m,c2.m,...,ci.m}的顶点。我们从{p1,p2,...,pi}执行Dijkstra扩展算法来计算pi和区域ci内顶点之间的网络距离。一旦我们有了 细化终止,返回C’sd(C,τ)最大的轨迹。这里Tr是细化过的轨迹的集合,Tu是一组未细化的轨迹,Tr∪Tu=Tf,τ’是Tu中的一条轨迹。
图2显示了一个TSR查询实例。如图2所示,c1,c2,c3是TSR查询区域,p1,p2,p3是相应的区域中心,r1、r2和r3是半径。点p3,p4,…,p8是轨迹内的采样点。在轨迹τ1中,p6,p7,p8分别是离中心p1,p2和p3最近的采样点。在轨迹τ2中,p4,p5分别是离中心p1,p2最近的采样点。每个区域包含几个空间对象。只有在对该区域中心的空间
接近性被考虑到时,轨迹τ2才被返回,因为轨迹τ2在空间上最接近该地区中心。如果我们考虑空间对象的分布,轨迹τ2则比轨迹τ1缺少吸引力,因为它更远离空间对象密度高的地区。当同时考虑以上两个方面时,轨迹τ1是最好的选择(尽管轨迹τ2是在空间距离上比τ1略好)。
图3显示了空间密度相关性的实施例。以图3为例,τ是一条轨迹,c1和c2是两个区域,p1和p2分别是它们的中心。顶点{p3,p4}∈τ分别是τ上离p1和p2最近的点,{p5,p6,p7,p8}∈c1,{p9,p10}∈c2。空间密度相关性Csd(c1,τ)and Csd(c2,τ)被计算为:Csd(c1,τ)=p1·g·I(p1,p3)+p5·g·I(p5,p3)+p6·g·I(p6,p3)+p7·g·I(p7,p3)+p8·g·I(p8,p3),Csd(c2,τ)=p2·g·I(p2,p4)+p9·g·I(p9,p4)+p10·g·I(p10,p3)。
图4为本发明USS算法的一个实例,c1和c2是两个区域,p1和p2分别为它们的中心,τ1,τ2,τ3为三条轨迹,p3和p4是轨迹τ1上最靠近p1和p2的点。在USS算法中,我们使用区域中心p1和p2作为查询源,利用Dijkstra扩展算法以相同速率进行计算。被搜索的区域的半径是从中心p1和p2到相应搜索边界的最短距离re1和re2,由于是匀速搜索,故re1=re2。P3是τ1上最靠近p1的点,故dM(p1,τ)=sd(p1,p3)。当一条轨迹被所有查询源的搜索区域覆盖到时(如τ1),则被称为完全覆盖;当一条轨迹只被一部分查询源的搜索区域覆盖到时(如τ2),被称为部分覆盖;当一条轨迹没有被任何查询源的搜索区域覆盖到时(如τ3),被称为未覆盖。
以下通过具体实验来验证本发明的效果:
我们使用从两个空间网络提取的图形,即北京路网(BRN)和北美道路网(NRN)。分别包含28,342个顶点和27,690条边,和17,813个顶点,179,179条边。图形由邻接列表索引。对于BRN,我们使用一个真实的北京出租车的轨迹数据集和实数数据集感兴趣的(空间物体),其中包含80万个轨迹和30万个POI(兴趣点)。原始POI具有经度和纬度坐标,它们被映射到空间网络,分配给它们最近的顶点。对于BRN中的每个顶点p,我们记录具有其最近顶点的对象的数量。因此,我们不需要在TSR查询处理期间访问个人空间对象。我们与以前的研究分享POI设定[S.Shang,K.Zheng,C.S.Jensen,B.Yang,P.Kalnis,G.Li,and J.Wen.Discovery of path nearby clusters in spatial networks.IEEE Trans.Knowl.Data Eng.,27(6):1505–1518,2015.]。对于NRN,较大的合成数据用于研究可扩展性。NRN包含4,000,000条轨迹。对于NRN中的每个顶点p’,我们得出该数的附加空间物体,我们将这个数字存储为一个属性。我们有180万个派生空间物体。在BRN,默认距离阈值设置在10公里,而在NRN中,默认设置为200公里。所有算法都是在Java中实现并在Windows 8平台上运行,使用英特尔酷睿i7-3520M处理器(2.90GHz)和8GB内存。
默认情况下,BRN中的轨迹集大小设置为600,000,而在NRN设置为1000,000,轨迹长度在BRN中设置为20,在NRN中设置为100,在BRN和BRN中查询区域的数量设置为6。查询区域的平均半径从2公里变化到10公里,在BRN(默认6公里);在NRN(默认150公里)从50公里到250公里变化。
1.剪枝效果
首先,我们设置实验来查看算法在图上的剪枝效果,实验结果如下:
| USS | |
| 剪枝率(BRN) | 0.32 |
| 保留率(BRN) | 0.68 |
| 剪枝率(NRN) | 0.37 |
| 保留率(NRN) | 0.63 |
表1 USS算法的剪枝效果
2.轨迹数的影响
图5给出了不同轨迹的数量|T|下算法的性能。直观地说,一个更大的|T|导致更多的轨迹被处理并产生更大的轨迹搜索空间。因此,本发明算法下的CPU时间和访问轨迹数都将更高。
以上述依据本发明的理想实施例为启示,通过上述的说明内容,相关工作人员完全可以在不偏离本项发明技术思想的范围内,进行多样的变更以及修改。本项发明的技术性范围并不局限于说明书上的内容,必须要根据权利要求范围来确定其技术性范围。
Claims (7)
- 一种基于带序兴趣区域的轨迹查询的匀速搜索扩展算法,其特征在于,包括如下步骤:步骤1:初始设置全局空间密度相关性下限LB=0,全局空间密度相关性上限UB=+∞;定义空间密度相关性计算公式:

 其中,v是轨迹τ上的点,C’sd(c,v)是查询区域c与v之间的空间密度相关性;C’sd(C,v)表示查询区域集合C与轨迹τ的空间密度相关性;pi。g是附属于pi的空间对象的数量;sd(p,v)代表点p与点v之间的距离;*.head表示列表中第一个元素,*.tail表示列表中除head之外的所有元素构成的列表;步骤2:从查询区域的每个中心使用相同速率的Dijkstra扩展算法,每次扩展距离最小的点;步骤3:计算空间密度的上限和下限,更新LB和UB;步骤4:判断LB>UB或搜索半径超过ε是否成立,ε是事先设置的阈值,如成立则搜索结束,进入下一步骤5;如不成立,则回到步骤3;步骤5:根据空间密度上限的值对轨迹进行排序;步骤6:按照轨迹排序进一步细化,返回具有最大空间密度相关性的轨迹。
 - 如权利要求1所述的算法,其特征在于,步骤2中所述每次扩展距离最小的点通过选择具有最小距离标签的顶点进行扩展。
- 如权利要求1所述的算法,其特征在于,步骤3中所述计算空间密度的上限和下限具体为:对于每一个新扫描的轨迹,如果没有被从pi开始的扩展扫描,它被标记为已被pi扫描,计算其空间密度上限C’sd(C,τ).ub和下限C’sd(C,τ).lb;空间密度下限估算公式为:
 对应的,空间密度上限估算公式为:
 其中,C是查询区域集合,τ是一条轨迹,C’sd(C,τ)是轨迹τ与查询区域集合C的空间密度相关性,C’sd(C,τ).lb代表这个相关性的下限,C’sd(C,τ).ub代表这个相关性的上限;C.head表示集合C中第一个查询区域,τ.head表示τ中第一个元素,C’sd(C.head,τ.head).lb表示查询区域C.head与τ.head相关性的下限,C’sd(C.head,τ.head).ub表示查询区域C.head与τ.head相关性的上限,C.tail表示列表中除C.head之外的所有查询区域构成的列表,C’sd(C.tail,τ)代表查询区域集合C.tail与轨迹τ的相关性,C’sd(C,τ.tail)代表查询区域集合C与轨迹τ.tail的相关性。
 - 如权利要求3所述的算法,其特征在于,步骤3中所述更新LB和UB具体为:如果C’sd(C,τ).lb>LB,LB更新为C’sd(C,τ).lb;如果C’sd(C,τ).ub<UB,UB更新为C’sd(C,τ).ub。
- 如权利要求1所述的算法,其特征在于,步骤4中所述搜索结束,空间密度上限小于LB的轨迹从Tf中删除,Tf是所有被完全覆盖的轨迹的集合。
- 如权利要求5所述的算法,其特征在于,步骤5中Tf中的轨迹根据空间密度上限的值排序。
- 如权利要求1所述的算法,其特征在于,步骤6中所述按照轨迹排序进一步细化,具体为:对于轨迹τ∈Tf,假设{p1,p2,...,pi}是最靠近区域中心{c1.m,c2.m,...,ci.m}的顶点,从{p1,p2,...,pi}执行Dijkstra扩展算法来计算pi和区域ci内顶点之间的网络距离,一旦所述细化终止,返回具有最大空间密度相关性的轨迹;其中Tr是已经被细化的轨迹集合,Tu是未被细化的轨迹集合,Tr∪Tu=Tf,τ’是Tu中的一条轨迹。

Applications Claiming Priority (2)
| Application Number | Priority Date | Filing Date | Title |
|---|---|---|---|
| CN201710659371.4A CN107463674A (zh) | 2017-08-04 | 2017-08-04 | 基于带序兴趣区域的轨迹查询的匀速搜索扩展算法 |
| CN201710659371.4 | 2017-08-04 |
Publications (1)
| Publication Number | Publication Date |
|---|---|
| WO2019024345A1 true WO2019024345A1 (zh) | 2019-02-07 |
Family
ID=60548389
Family Applications (1)
| Application Number | Title | Priority Date | Filing Date |
|---|---|---|---|
| PCT/CN2017/113472 Ceased WO2019024345A1 (zh) | 2017-08-04 | 2017-11-29 | 基于带序兴趣区域的轨迹查询的匀速搜索扩展算法 |
Country Status (2)
| Country | Link |
|---|---|
| CN (1) | CN107463674A (zh) |
| WO (1) | WO2019024345A1 (zh) |
Families Citing this family (1)
| Publication number | Priority date | Publication date | Assignee | Title |
|---|---|---|---|---|
| CN109558519B (zh) * | 2018-11-16 | 2023-03-14 | 中山大学 | 一种基于顶点相连列表的无向图索引方法 |
Citations (3)
| Publication number | Priority date | Publication date | Assignee | Title |
|---|---|---|---|---|
| CN106447097A (zh) * | 2016-09-20 | 2017-02-22 | 北京工业大学 | 一种受限最长频繁路径的查询方法 |
| CN106446960A (zh) * | 2016-10-10 | 2017-02-22 | 太原理工大学 | 一种密度聚类划分时间段的动态热度路网构建方法 |
| US20170132547A1 (en) * | 2015-11-05 | 2017-05-11 | Charles F. Myers | Methods for dynamically identifying loads for a trucker |
Family Cites Families (1)
| Publication number | Priority date | Publication date | Assignee | Title |
|---|---|---|---|---|
| CN106780262B (zh) * | 2017-01-13 | 2020-12-25 | 中国科学院空天信息创新研究院 | 一种考虑城市道路网络约束的同位模式发现方法及装置 |
-
2017
- 2017-08-04 CN CN201710659371.4A patent/CN107463674A/zh active Pending
- 2017-11-29 WO PCT/CN2017/113472 patent/WO2019024345A1/zh not_active Ceased
Patent Citations (3)
| Publication number | Priority date | Publication date | Assignee | Title |
|---|---|---|---|---|
| US20170132547A1 (en) * | 2015-11-05 | 2017-05-11 | Charles F. Myers | Methods for dynamically identifying loads for a trucker |
| CN106447097A (zh) * | 2016-09-20 | 2017-02-22 | 北京工业大学 | 一种受限最长频繁路径的查询方法 |
| CN106446960A (zh) * | 2016-10-10 | 2017-02-22 | 太原理工大学 | 一种密度聚类划分时间段的动态热度路网构建方法 |
Also Published As
| Publication number | Publication date |
|---|---|
| CN107463674A (zh) | 2017-12-12 |
Similar Documents
| Publication | Publication Date | Title |
|---|---|---|
| Shang et al. | Searching trajectories by regions of interest | |
| Shang et al. | Parallel trajectory similarity joins in spatial networks | |
| Shang et al. | Trajectory similarity join in spatial networks | |
| Chu et al. | Visualizing hidden themes of taxi movement with semantic transformation | |
| Gidófalvi et al. | Mining long, sharable patterns in trajectories of moving objects | |
| CN107392245A (zh) | 一种出租车载客轨迹聚类算法Tr‑OPTICS | |
| CN107766406A (zh) | 一种采用时间优先搜索的轨迹相似性连接查询方法 | |
| CN114201480A (zh) | 一种基于nlp技术的多源poi融合方法、装置及可读存储介质 | |
| CN104346444A (zh) | 一种基于路网反空间关键字查询的最佳选址方法 | |
| Dan et al. | Double hierarchical labeling shortest distance querying in time-dependent road networks | |
| CN118820810A (zh) | 路网环境下基于标签的轨迹聚类方法 | |
| Nutanong et al. | Memory-efficient algorithms for spatial network queries | |
| He et al. | Spatio-temporal trajectory anomaly detection based on common sub-sequence | |
| Cao et al. | SCG-tree: shortcut enhanced graph hierarchy tree for efficient spatial queries on massive road networks | |
| CN110502567B (zh) | 一种面向主题的城市轨道交通站点层次poi提取方法 | |
| WO2019024348A1 (zh) | 基于兴趣区域的轨迹查询的匀速搜索算法 | |
| Tianyang et al. | Direction-aware KNN queries for moving objects in a road network | |
| Xu et al. | Continuous k nearest neighbor queries over large multi-attribute trajectories: a systematic approach | |
| WO2019024343A1 (zh) | 基于带序兴趣区域的轨迹查询的扩张搜索扩展算法 | |
| Xiong et al. | Geo-gap tree: A progressive query and visualization method for massive spatial data | |
| WO2019024346A1 (zh) | 基于兴趣区域的轨迹查询的扩张搜索算法 | |
| WO2019024344A1 (zh) | 基于带序兴趣区域的轨迹查询的启发式扩张搜索扩展算法 | |
| CN107463674A (zh) | 基于带序兴趣区域的轨迹查询的匀速搜索扩展算法 | |
| CN116147623B (zh) | 时空轨迹多节点并行融合方法 | |
| CN107766407A (zh) | 一种采用两阶段搜索的轨迹相似性连接查询方法 |
Legal Events
| Date | Code | Title | Description |
|---|---|---|---|
| NENP | Non-entry into the national phase |
Ref country code: DE |
|
| 32PN | Ep: public notification in the ep bulletin as address of the adressee cannot be established |
Free format text: NOTING OF LOSS OF RIGHTS PURSUANT TO RULE 112(1) EPC (EPO FORM 1205A DATED 10.08.2020) |
|
| 121 | Ep: the epo has been informed by wipo that ep was designated in this application |
Ref document number: 17920393 Country of ref document: EP Kind code of ref document: A1 |
|
| 122 | Ep: pct application non-entry in european phase |
Ref document number: 17920393 Country of ref document: EP Kind code of ref document: A1 |