WO2018032061A1 - An improved alarm operator assist method and assembly - Google Patents
An improved alarm operator assist method and assembly Download PDFInfo
- Publication number
- WO2018032061A1 WO2018032061A1 PCT/AU2017/050884 AU2017050884W WO2018032061A1 WO 2018032061 A1 WO2018032061 A1 WO 2018032061A1 AU 2017050884 W AU2017050884 W AU 2017050884W WO 2018032061 A1 WO2018032061 A1 WO 2018032061A1
- Authority
- WO
- WIPO (PCT)
- Prior art keywords
- alarms
- alarm
- operator
- anm
- plant
- Prior art date
- Legal status (The legal status is an assumption and is not a legal conclusion. Google has not performed a legal analysis and makes no representation as to the accuracy of the status listed.)
- Ceased
Links
Classifications
-
- G—PHYSICS
- G05—CONTROLLING; REGULATING
- G05B—CONTROL OR REGULATING SYSTEMS IN GENERAL; FUNCTIONAL ELEMENTS OF SUCH SYSTEMS; MONITORING OR TESTING ARRANGEMENTS FOR SUCH SYSTEMS OR ELEMENTS
- G05B23/00—Testing or monitoring of control systems or parts thereof
- G05B23/02—Electric testing or monitoring
- G05B23/0205—Electric testing or monitoring by means of a monitoring system capable of detecting and responding to faults
- G05B23/0259—Electric testing or monitoring by means of a monitoring system capable of detecting and responding to faults characterized by the response to fault detection
- G05B23/0267—Fault communication, e.g. human machine interface [HMI]
- G05B23/0272—Presentation of monitored results, e.g. selection of status reports to be displayed; Filtering information to the user
Definitions
- the present invention concerns alarm systems for installations or "plants” that involve multiple processes which require monitoring and supervision.
- plants include refineries, reactors, chemical production plants, ships, airplanes, submarines and facilities such as large hospitals and prisons.
- An Alarm System (AS) for a modern industrial process plant is often large and complex: even medium scale refineries typically have thousands of alarms (Ref. 12). Designing and operating such alarm systems is a complicated task. Poor alarm management costs the process industries in excess of $20 billion in product loss annually, as well as multiple fatalities and environmental harm (Ref. 34).
- AS design is also becoming increasingly important in industries such as healthcare and transportation, as systems become larger and more complex (Ref. 19). New methods are needed to improve the analysis and design of AS (Ref. 21 ).
- the AS management standard ISA18 defines an alarm as "an audible and/or visible means of indicating to the operator an equipment malfunction, process deviation, or abnormal condition requiring a response" (2).
- the main purpose of an AS is to assist the plant operators to manage and control operational anomalies, for safety and efficiency. Alarms originate from many of the plant's different systems, including the Basic Plant Control System (BPCS), Safety Instrumented System (SIS), and equipment and component subsystem controllers (Ref. 6).
- BPCS Basic Plant Control System
- SIS Safety Instrumented System
- a human plant operator is expected to take an action in response to the alarm, such as diverting flows or disabling equipment.
- the AS helps the operator identify and handle abnormal situation and failure events before they result in a trip or accident. As the number of alarms increases, management of alarms becomes increasingly complicated.
- the AS is responsible for measuring process or safety variables, comparing them with the normal or safe conditions, and notifying the operator about the alarm state, so that s/he can take corrective action to return to normal state (Ref. 2).
- the AS is a semi-automatic control system which demands operator's response within a specific timeframe in case of alarm activation (Ref. 14).
- the safety and efficiency of the plant depends on the operator's ability to make timely and informed decisions, which is affected by the way alarm information is presented to them (Ref. 38).
- Other important factors for the safe and efficient running of the plant include operator workload, training and familiarity with the process (Ref. 32).
- a poorly designed AS can confuse or mislead operators into making poor decisions, which in turn can lead to product loss or accidents (Ref. 1 1 ).
- Good AS design is particularly important during abnormal situations, such as when equipment fails.
- AS design issues include alarm floods, nuisance alarms, and chattering alarms.
- Alarm flood occurs when the rate of alarm activation is greater than the ability of the operator to respond and manage them effectively (Ref. 7).
- Nuisance alarms are alarms that occur excessively or unnecessarily and do not return to their normal state. Chattering alarms occur when an alarm transits very quickly and repeatedly between the alarm state and the normal state (Ref.24).
- Resolving an alarm flood is more complex since it requires evaluation of the alarms' functionality in relation to each other, as well as determining which alarms should be responded to with higher priority (Ref.27). Analyzing all possible scenarios can be difficult in even a moderate-size plant, and there is danger of inadvertently deleting or suppressing important alarms (Ref.6). Tools and techniques are required to rationalize and evaluate alarms, to maximize safety and maintain plant efficiency. New ways are needed of displaying alarms to operators (Ref.20).
- ISA 18.2 defines the processes that should be carried out, in terms of an alarm management lifecycle. Stauffer and others provided useful guidance for integrating the ISA18.2 processes with the IEC 6151 1 safety lifecycle (Ref.35), which in turn provides traceability of AS design requirements to system documentation such as HAZOP and LOPA studies.
- Alarm Rationalization and Justification stages of alarm lifecycle management are concerned with checking exactly which of the potential alarms identified in the Identification stage really are needed, and with documenting their motivation and detailed requirements. Having too many alarms can be almost as bad as not having enough, because nuisance alarms and - in the worst case - alarm floods, can severely impact an operator's ability to control the plant (Ref.9).
- Alarm prioritization is an important part of alarm rationalization, concerned with conveying the significance of alarms to the operator (Ref.13). If the operator does not respond to the alarms according to their required-response timing and priority level, an alarm flood may result, leading to loss of control of the plant (Ref.7). According to EEMUA-191 , ten alarms per ten minutes is about the limit of the operator's ability to handle alarms safety (Ref.12), so alarm prioritization is desirable. Alarm prioritization is typically based on the severity of the consequences of not responding to the alarm in a timely manner (Ref.28). This process is very time consuming as each alarm must be evaluated individually, and it can be difficult to compare alarms with different consequences, or even a single alarm with different consequences.
- a method for assisting a human operator to respond to alarm activations of a plurality of alarms of a plant including:
- an alarm network model for said plant in which the alarms are identified as causally related nodes
- the step of presenting operator assistance information to the human operator may include displaying a directed graph diagram corresponding to the ANM.
- the method includes presenting recommended action information for matched action scenarios to assist the operator to avert plant failures associated with each APTF.
- the method preferably includes dynamically prioritizing activated alarms and presenting a list of the prioritized activated alarms to the human operator.
- alarms corresponding to nodes of the ANM that are located closest to incidents are categorized as being of highest priority for the operator to address.
- the step of dynamically prioritizing activated alarms may further include identifying second-to-highest priority alarms as being alarms corresponding to nodes with at least a predetermined number of outgoing links.
- the step of presenting a list of the prioritized activated alarms includes presenting the list ordered by a time-to-respond parameter whereby the operator can readily determine which alarms require most urgent action.
- the method may further include classifying alarms as corresponding to different alarm systems of the plant.
- the plant may include Safety Instrumented System (SIS) alarms and Basic Plant Control System (BPCS) alarms. Where the alarms are classified as corresponding to different alarm systems the method preferably presents the diagram of the ANM to the operator so that the different classification is visually apparent to the operator.
- SIS Safety Instrumented System
- BPCS Basic Plant Control System
- the method preferably includes presenting a piping and instrumentation diagram (P&ID) of the plant to the operator in conjunction with a diagram of the ANM.
- P&ID piping and instrumentation diagram
- the ANM may be overlaid on the P&ID or alternatively the P&ID and the diagram of the ANM may be presented side by side.
- the method includes updating the ANM in response to commands from the operator.
- the method may include updating the ANM to remove redundant nodes or to add nodes.
- the method may further include storing more than one ANM of the plant wherein different ANMs correspond to different operating states of the plant.
- the method includes monitoring for alarms that are non-responsive to operator action and indicating such alarms to the operator as being non- responding nuisance alarms.
- the method may include indicating potentially underway action scenarios to the operator with an identification of a root cause alarm, possible consequences, alarms to watch for that may indicate progress of undesired scenarios, root- cause alarm pathways, and potential root-cause pathways.
- the method includes identifying possibly-failed alarms to the operator.
- the method may include presenting recommendations for alarms to be shelved to the operator.
- an assembly for assisting a human operator to respond to alarm activations of a plurality of alarms of a plant comprising:
- a computer server in communication with the alarms via an electronic data network the computer server being arranged to:
- an alarm network model for said plant identifying the alarms as causally related nodes
- HMI human-machine-interface
- the computer server is arranged to render the ANM for display by the HMI as a directed graph diagram including nodes corresponding to the alarms and incidents, and directed links between the nodes corresponding to the causal alarm relationships.
- the computer server is further arranged to add or remove alarms to the alarm network model in response to commands from the HMI.
- FIG. 1 is a block diagram of an operator alarm assist assembly according to a preferred embodiment of the invention, shown in use.
- ACM Alarm Network Model
- MADB of Figure 2 which corresponds to the plant of the P&ID of Figure 1 .
- FIG. 1 is a flowchart of the steps of a method according to an aspect of the present invention for developing an ANM.
- FIG. 10 is a simple P&ID used for explaining the development of an ANM.
- FIG. 10 is a diagram of an ANM corresponding to the P&ID of Figure 7 and wherein possible Activation Paths to Failure (APTF) are shown.
- Figure 9 is a P&ID of a debutanizer used for explaining the development of a more complex ANM.
- Figure 10 is a first ANM based on the P&ID of Figure 9.
- Figure 1 1 is a second ANM based on the P&ID of Figure 9.
- Figure 12 is a flowchart of a process for alarm system implementation according to an embodiment of the present invention.
- Figure 13 is a flowchart of a process for alarm system change management according to an embodiment of the present invention.
- Figure 14 is a P&ID diagram of a prior art Isomerization Unit.
- Figure 15 is an ANM for the Isomerization Unit (IU) of Figure 14.
- Figure 16 is an alternative and less preferred ANM diagram of the
- Figure 17 is a modified P&ID for the IU of Figure 14 with new alarms shown.
- Figure 18 is an ANM for the modified IU of Figure 17.
- Figure 18A shows the ANM of Figure 18 with unique numbers associated with each alarm node and an equivalent list of related node numbers.
- Figure 18B illustrates an alarm activation sequence of the ANM of Figure 18A.
- Figure 18C provides a legend for the alarm symbols and paths (links) that are used in Figure 18D.
- Figure 18D illustrates the state of the ANM of Figure 18B subsequent to activations of particular alarms.
- Figure 18E illustrates a state of the ANM of Figure 18B subsequent to activation of a further alarm relative to Figure 18D.
- Figure 18F illustrates a state of the ANM of Figure 18B subsequent to activation of a further alarm relative to Figure 18E.
- Figure 18G illustrates a state of the ANM of Figure 18B subsequent to activation of a further alarm relative to Figure 18F.
- Figure 19A illustrates a state of the ANM of Figure 18B subsequent to activation of a further alarm relative to Figure 18G.
- Figure 19B illustrates a state of the ANM of Figure 18B subsequent to activation of a further alarm relative to Figure 19A.
- Figure 19C presents the prototype results for the original AS design illustrated in Figure 14.
- Figure 20 is a dashboard display generated on an HMI according an embodiment of the present invention.
- Figure 21 is a close up of a portion of the dashboard of Figure 20.
- Figure 22 is an ANM corresponding to the ANM of Figure 19 but with alarm activation order labelled.
- FIGS 22 to 27 are close ups of portions of the dashboard display of Figure 20.
- FIG. 1 there is shown a simplified piping and instrumentation diagram (“P&ID") 1 of an isomerization unit (IU), being a portion of a prior art oil refinery.
- the raffinate splitter tower (RST) section of the IU is designed to separate the aromatic components of the hydrocarbon liquid by heating and distilling the liquid in a process loop. This process loop begins with boiling the liquid and distilling it through trays located inside the RST. The separation process is based on discrepancies between the boiling points of the different components and the process iterates several times to enhance the quality of the product.
- the blowdown drum is designed to relieve over-pressure from the RST and then separate water from hydrocarbon (Ref. 1 ).
- FIG. 1 there are shown alarms that relate to the lU's safety instrumented system, i.e. SIS alarms 2 and also alarms that relate to its Basic Plant Control System, i.e. BCPS alarms 4.
- Other monitoring and supervisory systems may also be present such as a fire and gas system (FGS) and programmable logic controller (PLC) system.
- FGS fire and gas system
- PLC programmable logic controller
- the various alarms 2, 4 generate electrical signals which may be remotely monitored at an operator Human Machine Interface (HMI) 6, which typically comprises a suitably programmed computer, across a computer data network 8.
- HMI Human Machine Interface
- the network 8 is divided into two portions 8a, 8b which are interconnected by an Object Linking and Embedding (OLE) for Process Control (OPC) server 10.
- OLE for Process Control (OPC) is a series of standards specifications.
- the current OPC specifications form a set of standard OLE/COM interface protocols based upon the functional requirements of Microsoft Corp's OLE/COM technology.
- Such technology defines standard objects, methods and properties for servers, e.g.
- the OPC Foundation is the body that maintains the standard.
- the Operator HMI devices communicate with a data server across the computer data network.
- the data server is programmed to implement and maintain a Master Alarm Database (MADB) 14 as illustrated in Figure 3.
- the MADB stores information about the alarm system of the plant including the location and attributes 16 of each alarm and also information drawn from documents such as operation manuals, safety manuals, alarm system philosophy statement, piping and instrumentation diagrams and HAZOP/HAZID, LOPA/ SIL and CHAZOP documents.
- MADB 14 also defines and updates an alarm network model (ANM) 18 for the plant, which in the present case comprises an ANM for the plant 1 of Figure 1 that is being monitored.
- ANM alarm network model
- Figure 4 presents a graphical representation of an ANM generated by server 12 and displayed on the HMI device 6 from the ANM model 18 that is stored in MADB 14.
- the ANM consists of nodes (e.g. nodes 20a to 20e) and directed links (e.g. links 22a to 22d) between the nodes.
- nodes e.g. nodes 20a to 20e
- directed links e.g. links 22a to 22d
- the term ANM is overloaded below, to refer to three different things: the network model; a more detailed data model that will be described below, which also includes labelled paths through the network; and analysis methods based on the model.
- Figure 5 presents a flowchart 500 that sets forth steps, according to a preferred embodiment of the present invention for the development of an ANM drawn up by a human analyst working through the process control logic of the plant.
- the analyst may refer to the P&ID for guidance, identifying for each alarm the circumstances that would cause that alarm to activate (e.g. out-of- normal-range process conditions or equipment failures) and the likely downstream consequences.
- Each time a new alarm is identified it gets added to the ANM as a node.
- a link is drawn from one node to another if it is possible that the conditions that led to activation of the first alarm will be followed by conditions that lead to activation of the second alarm, if the operator does not take the appropriate and timely corrective action. For example, if the operator fails to respond to a high temperature alarm in a reactor column in a timely manner, it is likely that the pressure in the column will rise and eventually activate the high pressure alarm, so a link would be drawn between these two alarms.
- the ANM is then extended with nodes and links corresponding to the safety logic of the plant, as represented by the Safety Instrumented System (SIS), for example using the PHA/HAZOP and LOPA as guidance (Ref. 33). Links are drawn from the process variable alarms to the SIS alarms that would be activated, if the operator did not respond in a timely manner.
- SIS Safety Instrumented System
- a node corresponding to the incident is added, with a link from the alarm.
- the accident type is noted as part of the node, for reasons that will be explained below.
- Different ANM models may need to be updated for different operating states of the plant (running, start-up, scheduled shutdown, etc.) since typically the alarm activation sequences will be different. For example, some alarms may be suppressed to avoid alarm floods during scheduled shutdown when the operator is aware of the state of the plant, or when a particular piece of equipment is disabled (Ref 21 ). Where the underlying alarm causation logic is unchanged, such suppressed alarms will be included in the ANM model with an indication they are suppressed, to save having to redevelop the ANM just for these cases.
- APTF Activation Paths to Failure
- the analyst is also required to identify and label particular subsequences of APTFs as action scenarios, and nominate an associated operator action with each.
- Action scenarios will be used to help the operator decide which is the most appropriate action or actions to take when multiple alarms are activated simultaneously.
- this approach enables the context to be taken into account when determining how to respond to an alarm: whereas the traditional approach simply associates a single action with an alarm.
- APTFs assist the operator to track the sequence of failures which lead to major Trips/Incidents
- action scenarios assist the operator in determining the most appropriate action to take. If the operator is able to make a proper decision and take action at any alarm point the failure progress can be stopped.
- the alarm activation sequences are defined for minor trips to provide an accurate guide for the operators.
- ANMs are drawn simply as nodes and links without showing APTFs or action scenarios explicitly. Nevertheless the APTFs and action scenarios of an ANM are stored as part of the underlying data structure in the MADB 14. Each APTF is stored with a short description of the hazardous cases that gave rise to it and the severity of its outcomes(s). Each action scenario is stored with a note of the appropriate corrective action(s) and a timeframe within which the corrective actions should be taken.
- a mathematical formulation for an ANM, or more strictly for an Alarm Network Diagram, being an ANM without inclusion of action scenarios such as APTFs, is set out in Appendix A toward the end of this specification.
- the ANM is then stored as an electronic data structure in the MADB 14.
- the data structure may comprise tables and relationships therebetween of a structured query language (SQL) database.
- SQL structured query language
- links could be stored against elements in the MADB as a list of alarms and incidents that link from the given node: for example, nodes 20b and 20d would be listed against node 20c from Figure 4.
- ANM is a failure behavior- based profile constructed on the causal relationship between failures and the assigned alarms. By uncovering the patterns and their underlying association (Ref 8) such as APTF the failure progress can be observed (Ref 29) and required corrective decision must be implemented.
- a medium-sized process unit would typically have of the order of 1000 process alarms and 100 safety alarms, and say 1500 links and less than 50 APTFs in the ANM model. Because ANM links are "local", in the sense that they represent direct causes, ANM models can be developed unit by unit; indeed, the ANM network could easily be overlaid over the P&l Diagram sheets, with "transfer links” between sheets. The method is scalable to large plants.
- the server is programmed so that nodes are displayed on the HMI as coloured according to the Layer of Protection (LOP) they come from (Ref. 33), as follows:
- Green indicated as "grn" for the process control layer, such as alarms from the Basic Plant Control system (BPCS), the Distributed Control System (DCS), PLCs and SCADA systems
- BPCS Basic Plant Control system
- DCS Distributed Control System
- SCADA SCADA
- Blue (indicated as “blu” or “Iblu") for alarms from subsystem controllers, such as pumps and communication subsystems
- Red (indicated as "red) for incidents, including trips and accidents
- the drum 24 shown in Figure 7 used as a reservoir for storing a fluid between different process cycles in a plant.
- the fluid is a mixture of liquid and vapor, and is supplied from a boiler via a pump.
- the drum includes the following three transmitters as part of the BPCS:
- a flow transmitter on its upstream pipe which comprises a Flow Alarm High (FAH) alarm 26 that activates if fluid inflow exceeds a given operational threshold;
- FAH Flow Alarm High
- a pressure transmitter located on top of the drum comprising a Pressure Alarm High (PAH) alarm 28, which activates if too much vapour builds up within the drum; and
- PAH Pressure Alarm High
- a level transmitter on the side of the drum comprising a Level Alarm High (LAH) alarm 30, which activates if too much liquid accumulates within the drum.
- LAH Level Alarm High
- the drum also has two SIS-related transmitters installed:
- a pressure transmitter comprising a Pressure Alarm High-High (PAHH) alarm 32 which activates in the event that the pressure within the drum exceeds a given safety threshold, and 2.
- a level transmitter which comprises a Level Alarm High-High (LAHH) alarm 34 that activates if the level within the drum exceeds a given safety threshold.
- PAHH Pressure Alarm High-High
- LAHH Level Alarm High-High
- Hot fluid start-up hazard (HC2): FAH ⁇ LAH ⁇ PAH ⁇ PAHH ⁇ Leak.
- APTF-3 Pump start-up hazard (HC3): Pump rate too high at start-up: FAH ⁇ LAH ⁇ PAH ⁇ LAHH ⁇ Spill.
- FIG. 9 is a P&ID diagram of a debutanizer plant 36 (Ref 3).
- FIG 10 depicts the ANM model for the normal operating state of the debutanizer plant of Figure 9.
- the low-alarm and high-alarm networks have been drawn separately for readability.
- the FA-101 alarms FAL-101 , FALL-101
- FAL-101 , FALL-101 are included to protect pump P-100, hence the "reflux pump damaged" node 1001 in the ANM model.
- DT Debutanizer Tower
- APTF-2 Reboiler fails to heat fluid sufficiently: FAL-100 ⁇ FALL-100 ⁇ PAL-104 ⁇ PALL-104 ⁇ trip DT.
- APTF-3 Protect reflux pump: FAL-101 ⁇ FALL-101 ⁇ reflux pump damaged.
- ATPFs should also be developed for scenarios such as low flow in the reflux loop and for various overfill/overflow scenarios.
- Figure 1 1 illustrates the ANM model for the state where pump P-100 has been disabled and the FA-101 alarms have been suppressed. Only the low-alarm segment is shown, since the high-alarm segment is unchanged. The implicit link from LAL-103 to LAL-102 has also been "suppressed" because the reflux loop is effectively disabled.
- FIG. 6 is a flowchart of a process according to an embodiment of the present invention for a human analyst to add and remove alarms to and from the Master Alarm Database (MADB) and to ensure that there is a sufficient diversity of alarm types.
- MADB Master Alarm Database
- ISA18.2 lists a number of useful techniques for identifying alarms, such as working though the HAZOP (Hazard and Operability) and LOPA (Layer of Protection Analysis) studies identifying potential alarms. Developing the ANM in parallel provides a systematic way of capturing the alarms.
- APTFs provide an alarm-focused complement to event trees: starting from initiating events such as equipment failures/shut-downs and abnormal situations, the analyst can work through the Layers of Protection identified in the event tree, checking that alarms are present where operator actions are required. For example, for the Drum example of Figure 7 and 8, a leak detection subsystem and alarm should be added, as a protection measure between the spill/leak hazards and an accident. Likewise, for the debutanizer example of Figures 9-1 1 , the three flow monitors (FA-100/101 /1 02) should also have high alarms defined, to protect against excess flows.
- All APTFs should be checked to ensure they contain sufficient diversity of alarm types. For example, according to Stauffer's independence principle (Ref 33), alarms should not all come from the same protection layer, subsystem or instrument. Similarly, to avoid common-cause process failures such as having a gas in a pipe when a liquid was expected, the alarms in an APTF should relate to different flow attributes, such as pressure, temperature, or level. For example, for the debutanizer case study currently it might be wise to define an alarm for pressure the reflux loop, in case the condenser fails and the line fills with vapour. 4.2. Alarm rationalization
- the Alarm Rationalization and Justification stages of the alarm lifecycle management are concerned with checking exactly which of the potential alarms identified in the Identification stage really are needed, and with documenting their motivation and detailed requirements. Having too many alarms can be almost as bad as not having enough, because nuisance alarms and - in the worst case - alarm floods, can severely impact the operator's ability to control the plant.
- alarm redundancy can be reviewed by checking if there are any pairs of alarms in the same protection layer that share the same out-links. This check is illustrated as decision box 603 in the flowchart 600 of Figure 6 for example. If so there may be unnecessary redundancy, increasing the likelihood of alarm floods and one of them could be removed.
- the ANM can thus provide support for systematic alarm rationalization, which can otherwise be a costly and error-prone exercise.
- Alarm prioritization is an important part of alarm rationalization, concerned with conveying the significance of alarms to the operator (Ref 13). If the operator does not respond to the alarms according to their required-response timing and priority level, an alarm flood may result, leading to loss of control of the plant (Ref 7). According to EEMUA-191 , ten alarms per ten minutes is about the limit of the operator's ability to handle alarms safety (Ref 12), so alarm prioritization is critical.
- Alarm prioritization is typically based on the severity of the consequences of not responding to the alarm in a timely manner (Ref 28). This process is very time consuming as each alarm must be evaluated individually, and it can be difficult to compare alarms with different consequences, or even a single alarm with different consequences. Moreover, this practice does not take account of the likely relative effectiveness of protection layers in reducing incident risk (Refs 25, 26). For example alarms commonly are prioritized based on their severity by using risk matrix in up to 3-4 categories as ISA 18.2 recommends (Ref 35), but the problem here is that in each category there are still lots of alarms which require a better resolution for the operation.
- ANM assists the prioritization process by presenting an overview of the alarms and their relationships. From this overview it is quickly apparent which nodes might be overloaded. Nodes with higher out-degree (i.e., a high number of links leaving the node) can be expected to trigger more downstream alarms, and thus possibly alarm floods, if they are not treated promptly. Such nodes should be reviewed by the design team to decide whether additional alarms should be defined, to avoid over-reliance on this alarm. For example, in the Debutanizer example of Figures 9-1 1 , LAHH-102 (the debutanizer tower high-high level alarm) has many out-links and is clearly critical. By the time it is activated it might be too late to control the process. A design team may thus decide it would be better to add high-flow alarms on the feed lines.
- LAHH-102 the debutanizer tower high-high level alarm
- Nodes with high in-degrees i.e. nodes which receive many directed link ins, or which are involved in many APTFs, should also be reviewed carefully, for similar reasons.
- LAL-102 is involved in all three APTFs in the debutanizer case study, indicating that non-response has a high number of possible outcomes.
- the ANM network model clearly indicates the central place of LAL- 102 in controlling the unit.
- APTFs can also assist qualitative analysis of prioritization by indicating what other alarms stand between the node of interest and hazardous incidents: alarms with no or few intervening alarms should typically be given high priority. The alarms with more links are candidate to have higher priority since they link different APTFs which means the pattern of failure proceeding can be changed at that points.
- ANM provides a systematic approach to dynamically prioritize the alarms, by following the below rules on the ANM: the First category belongs to the alarms in the ANM which are the closest to the incident which usually contains safety alarms. The second category is for the alarms with the high number of the outgoing links. In the case of failure to respond this type of alarms the failure can propagate and more alarm can be activated and consequently end in alarm flood.
- the third category is for the alarms with more links since this type of alarms connect more APTFs which can change the pattern of failure proceeding.
- the fourth category is for the remained alarms on the APTFS to stop the route ended to the miss/near miss conditions.
- the last category is for the remained alarms. At each category alarms must be organized based on the sequence of activation on the ANM to stop failures when they are initiated.
- the alarms on each APTF in the ANM should be designed to avoid common- cause equipment failures such as all the sensors or transmitters being deployed on the same SCADA network, or using the same type of technology.
- alarm node LAL-102 shown in Figures 10, 1 1
- BPCS and SIS alarms must be completely segregated (Ref 9).
- high and high-high alarms use different methods for measuring process variables. For example, in the debutanizer tower, if a contact sensor such as a displacer is used for the high level alarm, then a non-contact sensor such as radar or differential pressure could be used for the high-high level alarm.
- Figure 12 presents a flowchart 1200 for the processes that the server 12 ( Figure 2) implements to provide a software tool that monitors the alarms, stores and references the ANM and displays alarm information via a screen of HMI 6 ( Figure 2) to provide useful complementary support to the plant operator, to aid situation awareness.
- the ANM network model is overlaid upon, or displayed side by side with a P&ID of the plant, with activated and recently deactivated alarm nodes highlighted. Results from the HAMMLAB study and others indicate that operators prefer displays that integrate alarms into process monitoring formats (Ref 5).
- the server 12 ( Figure 2) is programmed to match activated alarms against APTFs and action scenarios and show a match if two or more of nodes are activated. Server 12 then serves pages over computer data network 8 that are displayed on screens of the HMI 6 to make the operator 7 aware of possible downstream consequences, i.e. what potential plant failures are anticipated by the APTFs, and to assist the operator with Cause-Consequence Analysis (CCA) by identifying which scenario(s) could be underway, even if some of the alarms have failed along the way.
- CCA Cause-Consequence Analysis
- the object of the matching of the activated alarms against APTFs and action scenarios is simply to identify APTFs that contain two or more of the activated alarms.
- An ANM based alarm alert system may offer a memory of failure management about the activated, deactivated and responded alarms which provides better understanding about the progress of an operational failure.
- the chain of APTFs provide profiles of failures at different states of operation and so that the operator is able to check the escalation of an accident (Ref 29).
- tracking the failures in the ANM expands the ability of the operator to detect spurious alarms (Ref 22) if there is not any activation of the related alarms in the ANM.
- Figure 13 presents a flowchart 1300 for alarm system management according to an embodiment of the present invention.
- ANM can assist in this process by enabling the impact of the changes to be checked in a systematic manner.
- the impact of the changes can be checked by assessing how connectivity of the ANM would be affected when certain alarms are removed, and by rerunning the previously described checks.
- ANM contains the failure behavior based profile of the operation (Ref 8).
- the failure patterns can be varied in different states of the operation such as Full operation, half operation or start-up; since process variable maybe varied from the normal range of operation (e.g. different percentage of vapor and liquid mixture or variable viscosity) can lead to unusual alarm sequence activation.
- process variable maybe varied from the normal range of operation (e.g. different percentage of vapor and liquid mixture or variable viscosity) can lead to unusual alarm sequence activation.
- some APTFs are for normal operation and the others can be used for the other states of operation to cover infrequent alarm sequences. 5.
- FIG 14 shows a simplified P&ID for the part of the process involved in the accident, showing plant components, alarms and their location.
- the Isomerization Unit (IU) 1400 was responsible for increasing the octane level of the gasoline being processed.
- RST Raffinate Splitter Tower
- Pressure relief devices opened as a safety measure, but this in turn led to overfilling of the Blowdown Drum (BDD). Flammable liquid was released into the air and sewer, which triggered the explosion and subsequent fire (Refs 1 , 17).
- the raffinate splitter section of the IU 1400 was designed to separate the aromatic components of the hydrocarbon liquid by heating and distilling the liquid in a process loop. This process loop begins with boiling the liquid and distilling it through the trays located inside the RST. The separation process is based on the discrepancies between the boiling points of the different components and the process iterates several times to enhance the quality of the product.
- the blowdown drum is designed to relieve over-pressure from the RST and then separate water from hydrocarbon (Ref 1 ). 5.2. ANM analysis of the original design
- the high-high level alarm LAHH-02 also failed, because it was improperly installed.
- the contact level switch was not a good selection since poor installation and calibration can cause the detection failure.
- GDA-01 The rules from NFPA 72 (Ref 4) suggest adding a leak detector to monitor level of release from BDD, to activate an emergency alarm when the leak is higher than Lower Explosive Limit (LEL).
- LEL Lower Explosive Limit
- FAH-05 The BDD high-level alarm LAH-05 is critical and close to a hazardous incident.
- the alarm identification rules in section 4.1 suggest adding an alarm on the flow diversion from the RST to the BDD to detect unusual amounts of liquid being diverted to the BDD.
- TAH-06 and TAL-06 Temperature transmitter at the lowest tray of the RST can be used to generate High/Low temperature alarms. High- temperature alarm shows failure in temperature control and low temperature alarm indicates that the liquid reached to the tray level which demands discharge to the heavy raffinate tank and stop feeding.
- TAH-01 The temperature transmitter at the highest tray of the RST can be used for high temperature alarm which can be activated before high pressure alarm and provide the opportunity for the operator to prevent high pressure and its consequence release.
- FAH-02 To provide a better monitoring of the net flow in the RST, a high flow alarm is recommended to stop the reboiler pump when the RST high level alarm is activated.
- LAH-08 A high level alarm on the Reflux Drum is required to prevent release from the Reflux Drum to the BDD. In case of LAH-08 activation then operator must transfer excess amount of the process fluid to the RST (if the high level is not activated) or transfer to the light raffinate tank.
- the transmitter for the LAH-01 on the RST should be replaced with a displacer or radar type, which does not depend on the change of raffinate viscosity and for the LAHH-03 a level transmitter such as pressure is indicated rather than a switch.
- Figure 18A depicts an enhanced version of the ANM of Figure 18 wherein for generality, numerals (shown encircled) have been used to identify nodes instead of alarm labels.
- MADB Master Alarm Database
- the ANM links are added as a field in the AMDb so that the alarm maps to an alarm (/ incident) list. Consequently results can be returned as simple lists and readily integrated with a graphical user interface (GUI) running on the Human Machine Interface (HMI) 6 (Fig 2).
- GUI graphical user interface
- nodes in the prototype ANM can be numbered (in circles as shown) and the links represented, and stored in MADB 14, by lists of related nodes as follows:
- Figure 18B illustrates the alarm activation sequence (6), (7), 2, 21 , 18, 23, 9, 5, (8), 25
- Figure 18C sets out the legend for the alarm symbols and paths that are used in Figure 18D which illustrates the prototypes results after activation of FAH-02 and TAH-01 .
- the cause consequence analysis is as follows:
- Figure 18E shows a subsequent stage after activation of alarm PAH-01 .
- the cause consequence analysis is as follows:
- Figure 18F shows a subsequent stage after activation of alarm TAL-06.
- the cause consequence analysis at this stage is as follows:
- Figure 18G shows a subsequent stage after activation of alarm LAH-08.
- the cause consequence analysis at this stage is as follows:
- Figure 1 9A shows a subsequent stage after activation of alarm FAH-05.
- the cause consequence analysis at this stage is as follows:
- Figure 1 9B shows a subsequent stage after activation of alarm GDA-01 .
- the cause consequence analysis at this stage is as follows:
- the server 12 of Figure 2 is programmed to display a graphical representation of the ANM on HMI device 6 beside a typical P&ID to assist the operator to track the activated and currently deactivated alarms, to discover that a chain of failures are followin which attern of activation.
- each alarm activation sequence shows different pattern of failures which maybe require different operator action
- Table 2 shows the recommended action for different alarm activation sequences.
- ANM provides the opportunity to dynamically prioritize the alarms, by following the rules mentioned on the ANM, the new prioritization is defined for the operator as shown in Table 3.
- Category 1 contains alarms which are close to the trip/incident condition and typically include Safety alarms which are the most severe and urgent alarms.
- Second category include alarms which propagate failures. Failing to respond LAH-01 in this model concludes more alarm activation.
- alarms with more links are considered since they connect to more APTFs. Such as FAH- 05 which merges 3-4 APTFs to one, or PAH-01 connects 3 APTFs to 2 APTFs.
- Fourth category is for the alarms are on the APTFs and are not mentioned in the previous categories. The last category is for the alarms which are not mentioned in the previous categories. As can be seen the new APTF for the main path to failure has more variety type of alarms which reduce the dependency to process variable changes.
- the ANM of Figure 18 corresponds to the case where new alarms have been added to the plant as previously described.
- the ANM of Figure 19A is supplemented with an indication of alarm activation, such as might occur at a particular time in plant operation. Seven alarms have activated (indicated by a small red or yellow solid triangle). The alarm indicated by a small red hollow triangle is shown as having possibly failed. The three alarms with yellow triangles are alarms which can be shelved by the operator. The three alarms with a small red hollow diamond are put on a watch list, to alert the operator that - should the alarm subsequently activate - that an APTF may be progressing towards an incident.
- Figure 20 is a screen shot of a "dashboard" page 2000 that is served by server 12 and displayed on a display of HMI 6 to operator 7.
- the dashboard screen provides the operator with information about many aspects of the AS simultaneously.
- FIG 21 is a close up of a portion 2100, labelled "Dynamic Alarm Prioritisation" of the dashboard page 2000.
- the Dynamic Alarm Prioritisation screen portion 2100 shows the activated alarms in order of dynamic priority and is useful for the operator to quickly understand what actions must be taken urgently and how much time is likely to be available to act in order to avert incident escalation.
- FIG 23 is a close up of a portion 2300 of the dashboard 2000 of Figure 20, which is labelled "APTFs and Action Scenarios".
- the activated alarms are listed, organised by the action scenario(s) in which they appear.
- the recommended action is shown on the right most column.
- Isolated alarms i.e. those not joined to any other activated alarms
- a "Watch List” is provided on the dashboard, by which the server brings to the operator's attention currently non-activated alarms that should be monitored, in case they turn into more serious situations. These alarms are indicated by hollow red diamonds in Figure 19.
- the Watch List indicates the possible consequences and number of alarms between the currently activated alarm and the consequence.
- the server may also be programmed to list the possibly underway action scenarios, in a similar manner to the potentially underway action scenarios, but with the missing alarm indicated.
- the server may also be programmed so that the alarms between root cause and frontier nodes listed in the "APTFs and Action Scenarios" view can be selected by the operator as candidates for shelving. Shelved alarms get suppressed from the other views (e.g. the "Dynamic Alarm Prioritisation” view). Shelving such alarms allows the operator to focus on the more important alarms.
- Figure 26 shows the shelvable alarms and the activated alarms they link to.
- Ald for alarm IDs There are two basic types: Ald for alarm IDs and //d for incident IDs.
- Nodes can be alarms or incidents:
- the AND state of a system consists of a finite set of nodes (nodes), directed links between node s (sued) and a set of activated alarms (active):
- the invariants say: 1. the network is closed: i.e., all links start and end at nodes already in the network
- the SuppressibleAlarms function returns activated alarms that lie between (different) activated alarms:
- the PossiblyFailedAlarms function returns non-activated alarms that lie between (different) activated alarms.
- the LastAlarms function returns activated alarms that link to incidents, and the incidents:
- the FrontierAlarms function returns activated alarms that have non-activated successors:
- the ConsequenceAnalysis function looks through all paths from activated nodes through to incidents, and returns the frontier node, the next (i.e., not activated) node, and the incident, in that order.
- Root Cause Analysis function RCA returns all paths of activated nodes from a root node to a given activated node:
- the PotentialRCA function is similar to RCA, except that it allows one non- activated alarm in the root-cause path (which will be one of the possibly failed alarms):
- the "Cause-Consequence Analysis of frontier alarms" function in the HMI goes through each of the frontier alarms in turn, using the ConsequenceAnalysis function above to note the frontier node, the next node (the “then” node) and a list of the possible incidents that could result. It then uses the RCA and PotentialRCA functions to list the shortest root-cause paths and potential root-cause paths (if any) to the frontier node.
- the "Activated alarms immediately before incidents" function in the HMI is similar, but analyses alarms that are linked directly to incidents.
- EEMUA Alarm systems: a guide to design, management and procurement, EEMUA 191 . In: Engineering Equipment and Materials Users Association.
- Stauffer T implement an Effective Alarm Management Program. Chemical Engineering Progress 108: 19-27, 2012. 33. Stauffer T, and Clarke P. Using alarms as a layer of protection. Process Safety Progress 2015.
Landscapes
- Engineering & Computer Science (AREA)
- Human Computer Interaction (AREA)
- Physics & Mathematics (AREA)
- General Physics & Mathematics (AREA)
- Automation & Control Theory (AREA)
- Testing And Monitoring For Control Systems (AREA)
Abstract
A method is provided for assisting a human operator to respond to alarm activations of a large number of alarms of a plant, for example an oil refinery. The method involves determining an alarm network model (ANM) for the plant in which the alarms are identified as causally related nodes. The alarms are monitored across an electronic data network with a computational device such as a server to detect alarm activations. The server is operated to match alarm activations to predetermined activation paths to failure (APTF) and action scenarios made up of sequences of the causally related nodes. A human machine interface (HMI) under control of the server presents operator assistance information to the operator based on matches between the monitored alarm activations and matched APTFs and action scenarios.
Description
AN IMPROVED ALARM OPERATOR ASSIST METHOD AND
ASSEMBLY
TECHNICAL FIELD
The present invention concerns alarm systems for installations or "plants" that involve multiple processes which require monitoring and supervision. Such plants include refineries, reactors, chemical production plants, ships, airplanes, submarines and facilities such as large hospitals and prisons. RELATED APPLICATIONS
The present application claims priority from Australian provisional patent application No. 2016903307 filed 19 August 2017, the content of which is hereby incorporated in its entirety. 1.0 BACKGROUND ART
Any references to methods, apparatus or documents of the prior art are not to be taken as constituting any evidence or admission that they formed, or form part of the common general knowledge.
An Alarm System (AS) for a modern industrial process plant is often large and complex: even medium scale refineries typically have thousands of alarms (Ref. 12). Designing and operating such alarm systems is a complicated task. Poor alarm management costs the process industries in excess of $20 billion in product loss annually, as well as multiple fatalities and environmental harm (Ref. 34).
AS design is also becoming increasingly important in industries such as healthcare and transportation, as systems become larger and more complex (Ref. 19). New methods are needed to improve the analysis and design of AS (Ref. 21 ).
The AS management standard ISA18 defines an alarm as "an audible and/or visible means of indicating to the operator an equipment malfunction, process deviation, or abnormal condition requiring a response" (2). The main purpose of an AS is to assist the plant operators to manage and control operational anomalies, for safety and efficiency. Alarms originate from many of the plant's different systems, including the Basic Plant Control System (BPCS), Safety Instrumented System (SIS), and equipment and component subsystem controllers (Ref. 6). A human plant operator is expected to take an action in response to the alarm, such as diverting flows or disabling equipment. The AS helps the operator identify and handle abnormal situation and failure events before they result in a trip or accident. As the number of alarms increases, management of alarms becomes increasingly complicated.
The AS is responsible for measuring process or safety variables, comparing them with the normal or safe conditions, and notifying the operator about the alarm state, so that s/he can take corrective action to return to normal state (Ref. 2). The AS is a semi-automatic control system which demands operator's response within a specific timeframe in case of alarm activation (Ref. 14). The safety and efficiency of the plant depends on the operator's ability to make timely and informed decisions, which is affected by the way alarm information is presented to them (Ref. 38). Other important factors for the safe and efficient running of the plant include operator workload, training and familiarity with the process (Ref. 32). A poorly designed AS can confuse or mislead operators into making poor decisions, which in turn can lead to product loss or accidents (Ref. 1 1 ). Good AS design is particularly important during abnormal situations, such as when equipment fails.
AS design issues include alarm floods, nuisance alarms, and chattering alarms. Alarm flood occurs when the rate of alarm activation is greater than the ability of the operator to respond and manage them effectively (Ref. 7). Nuisance alarms are alarms that occur excessively or unnecessarily and do not return to their normal state. Chattering alarms occur when an alarm transits very quickly and repeatedly between the alarm state and the normal state (Ref.24).
Some of these issues can be resolved by improving the design process. For example, precise definition of the alarm set-point and alarm offset, based on the process condition can significantly decrease alarm chattering and nuisance alarms (Ref.37). Resolving an alarm flood is more complex since it requires evaluation of the alarms' functionality in relation to each other, as well as determining which alarms should be responded to with higher priority (Ref.27). Analyzing all possible scenarios can be difficult in even a moderate-size plant, and there is danger of inadvertently deleting or suppressing important alarms (Ref.6). Tools and techniques are required to rationalize and evaluate alarms, to maximize safety and maintain plant efficiency. New ways are needed of displaying alarms to operators (Ref.20).
ISA 18.2 (Ref.2) defines the processes that should be carried out, in terms of an alarm management lifecycle. Stauffer and others provided useful guidance for integrating the ISA18.2 processes with the IEC 6151 1 safety lifecycle (Ref.35), which in turn provides traceability of AS design requirements to system documentation such as HAZOP and LOPA studies.
Alarm Rationalization and Justification stages of alarm lifecycle management are concerned with checking exactly which of the potential alarms identified in the Identification stage really are needed, and with documenting their motivation and detailed requirements. Having too many alarms can be almost as bad as not having enough, because nuisance alarms and - in the worst case - alarm floods, can severely impact an operator's ability to control the plant (Ref.9).
Alarm prioritization is an important part of alarm rationalization, concerned with conveying the significance of alarms to the operator (Ref.13). If the operator does not respond to the alarms according to their required-response timing and priority level, an alarm flood may result, leading to loss of control of the plant (Ref.7). According to EEMUA-191 , ten alarms per ten minutes is about the limit of the operator's ability to handle alarms safety (Ref.12), so alarm prioritization is desirable.
Alarm prioritization is typically based on the severity of the consequences of not responding to the alarm in a timely manner (Ref.28). This process is very time consuming as each alarm must be evaluated individually, and it can be difficult to compare alarms with different consequences, or even a single alarm with different consequences. Moreover, this practice does not take account of the likely relative effectiveness of protection layers in reducing incident risk (Ref.25, 26). For example alarms commonly are prioritized based on their severity by using risk matrix in up to 3-4 categories as ISA 18.2 recommends (Ref.35), but the problem here is that in each category there are still lots of alarms which require a better resolution for the operation.
It is an object of the present invention to address one or more of the above described problems. 2.0 SUMMARY OF THE INVENTION
According to a first aspect of the present invention, there is provided a method for assisting a human operator to respond to alarm activations of a plurality of alarms of a plant, the method including:
determining an alarm network model (ANM) for said plant in which the alarms are identified as causally related nodes;
monitoring the alarms across an electronic data network with a computational device to detect alarm activations;
operating the computational device to match alarm activations to predetermined activation paths to failure (APTF) and action scenarios comprising sequences of said nodes; and
presenting operator assistance information to said operator based on matches between said monitored alarm activations and matched APTFs and action scenarios.
The step of presenting operator assistance information to the human operator may include displaying a directed graph diagram corresponding to the ANM.
Preferably the method includes presenting recommended action information for matched action scenarios to assist the operator to avert plant failures associated with each APTF. The method preferably includes dynamically prioritizing activated alarms and presenting a list of the prioritized activated alarms to the human operator.
In one embodiment alarms corresponding to nodes of the ANM that are located closest to incidents are categorized as being of highest priority for the operator to address.
The step of dynamically prioritizing activated alarms may further include identifying second-to-highest priority alarms as being alarms corresponding to nodes with at least a predetermined number of outgoing links.
It is preferred that the step of presenting a list of the prioritized activated alarms includes presenting the list ordered by a time-to-respond parameter whereby the operator can readily determine which alarms require most urgent action. The method may further include classifying alarms as corresponding to different alarm systems of the plant. For example, the plant may include Safety Instrumented System (SIS) alarms and Basic Plant Control System (BPCS) alarms. Where the alarms are classified as corresponding to different alarm systems the method preferably presents the diagram of the ANM to the operator so that the different classification is visually apparent to the operator.
The method preferably includes presenting a piping and instrumentation diagram (P&ID) of the plant to the operator in conjunction with a diagram of the ANM. For example, the ANM may be overlaid on the P&ID or alternatively the P&ID and the diagram of the ANM may be presented side by side.
It is preferred that the method includes updating the ANM in response to commands from the operator. For example, the method may include updating the ANM to remove redundant nodes or to add nodes.
The method may further include storing more than one ANM of the plant wherein different ANMs correspond to different operating states of the plant. Preferably the method includes monitoring for alarms that are non-responsive to operator action and indicating such alarms to the operator as being non- responding nuisance alarms.
The method may include indicating potentially underway action scenarios to the operator with an identification of a root cause alarm, possible consequences, alarms to watch for that may indicate progress of undesired scenarios, root- cause alarm pathways, and potential root-cause pathways.
It is preferable that the method includes identifying possibly-failed alarms to the operator.
In some embodiments of the invention the method may include presenting recommendations for alarms to be shelved to the operator.
According to a second aspect of the present invention there is provided an assembly for assisting a human operator to respond to alarm activations of a plurality of alarms of a plant, the assembly comprising:
a computer server in communication with the alarms via an electronic data network the computer server being arranged to:
maintain a database including an alarm network model (ANM) for said plant identifying the alarms as causally related nodes;
matching alarm activations to predetermined activation paths to failure (APTF) and action scenarios comprising sequences of the nodes; and
present operator assistance information based on one or more series of the APTFs and action scenarios matching the changes in states of the alarms; and
a human-machine-interface (HMI) in data communication with the computer server and arranged to display the operator assistance information to the operator.
In a preferred embodiment of the invention the computer server is arranged to render the ANM for display by the HMI as a directed graph diagram including nodes corresponding to the alarms and incidents, and directed links between the nodes corresponding to the causal alarm relationships.
Preferably the computer server is further arranged to add or remove alarms to the alarm network model in response to commands from the HMI.
BRIEF DESCRIPTION OF THE DRAWINGS
Preferred features, embodiments and variations of the invention may be discerned from the following Detailed Description which provides sufficient information for those skilled in the art to perform the invention. The Detailed Description is not to be regarded as limiting the scope of the preceding Summary of the Invention in any way. The Detailed Description will make reference to a number of drawings as follows: is an example of a prior art piping and instrumentation diagram (P&ID) for a plant assembly including alarms associated with SIS and BPCS.
is a block diagram of an operator alarm assist assembly according to a preferred embodiment of the invention, shown in use.
is a diagram representing the Master Alarm Database that is implemented by a server of the assembly of Figure 2. is a diagram of an Alarm Network Model (ANM) that is stored in the
MADB of Figure 2 and which corresponds to the plant of the P&ID of Figure 1 .
is a flowchart of the steps of a method according to an aspect of the present invention for developing an ANM.
is a flowchart of further steps of the method for developing the ANM.
is a simple P&ID used for explaining the development of an ANM. is a diagram of an ANM corresponding to the P&ID of Figure 7 and wherein possible Activation Paths to Failure (APTF) are shown.
Figure 9 is a P&ID of a debutanizer used for explaining the development of a more complex ANM.
Figure 10 is a first ANM based on the P&ID of Figure 9.
Figure 1 1 is a second ANM based on the P&ID of Figure 9.
Figure 12 is a flowchart of a process for alarm system implementation according to an embodiment of the present invention.
Figure 13 is a flowchart of a process for alarm system change management according to an embodiment of the present invention.
Figure 14 is a P&ID diagram of a prior art Isomerization Unit.
Figure 15 is an ANM for the Isomerization Unit (IU) of Figure 14.
Figure 16 is an alternative and less preferred ANM diagram of the
Isomerization Unit of Figure 14.
Figure 17 is a modified P&ID for the IU of Figure 14 with new alarms shown. Figure 18 is an ANM for the modified IU of Figure 17.
Figure 18A shows the ANM of Figure 18 with unique numbers associated with each alarm node and an equivalent list of related node numbers. Figure 18B illustrates an alarm activation sequence of the ANM of Figure 18A. Figure 18C provides a legend for the alarm symbols and paths (links) that are used in Figure 18D.
Figure 18D illustrates the state of the ANM of Figure 18B subsequent to activations of particular alarms.
Figure 18E illustrates a state of the ANM of Figure 18B subsequent to activation of a further alarm relative to Figure 18D.
Figure 18F illustrates a state of the ANM of Figure 18B subsequent to activation of a further alarm relative to Figure 18E.
Figure 18G illustrates a state of the ANM of Figure 18B subsequent to activation of a further alarm relative to Figure 18F.
Figure 19A illustrates a state of the ANM of Figure 18B subsequent to activation of a further alarm relative to Figure 18G.
Figure 19B illustrates a state of the ANM of Figure 18B subsequent to activation of a further alarm relative to Figure 19A.
Figure 19C presents the prototype results for the original AS design illustrated in Figure 14.
Figure 20 is a dashboard display generated on an HMI according an embodiment of the present invention.
Figure 21 is a close up of a portion of the dashboard of Figure 20.
Figure 22 is an ANM corresponding to the ANM of Figure 19 but with alarm activation order labelled.
Figures 22 to 27 are close ups of portions of the dashboard display of Figure 20.
DETAILED DESCRIPTION OF PREFERRED EMBODIMENTS
Referring initially to Figure 1 there is shown a simplified piping and instrumentation diagram ("P&ID") 1 of an isomerization unit (IU), being a portion of a prior art oil refinery. The raffinate splitter tower (RST) section of the IU is designed to separate the aromatic components of the hydrocarbon liquid by heating and distilling the liquid in a process loop. This process loop begins with boiling the liquid and distilling it through trays located inside the RST. The separation process is based on discrepancies between the boiling points of the different components and the process iterates several times to enhance the quality of the product. The blowdown drum is designed to relieve over-pressure from the RST and then separate water from hydrocarbon (Ref. 1 ). At various stages throughout the IU alarms are fitted relating to various process and monitoring systems are installed. For example, in Figure 1 there are shown alarms that relate to the lU's safety instrumented system, i.e. SIS alarms 2 and also alarms that relate to its Basic Plant Control System, i.e. BCPS alarms 4. Other monitoring and supervisory systems may also be present such as a fire and gas system (FGS) and programmable logic controller (PLC) system.
Referring now to Figure 2, the various alarms 2, 4 generate electrical signals which may be remotely monitored at an operator Human Machine Interface (HMI) 6, which typically comprises a suitably programmed computer, across a computer data network 8. In the example that is shown the network 8 is divided into two portions 8a, 8b which are interconnected by an Object Linking and Embedding (OLE) for Process Control (OPC) server 10. OLE for Process Control
(OPC) is a series of standards specifications. The current OPC specifications form a set of standard OLE/COM interface protocols based upon the functional requirements of Microsoft Corp's OLE/COM technology. Such technology defines standard objects, methods and properties for servers, e.g. server 10, of real-time information like distributed process systems, programmable logic controllers, smart field devices and analyzers in order to communicate the information that such servers contain to standard OLE/COM compliant technologies enabled devices. The OPC Foundation is the body that maintains the standard. The Operator HMI devices communicate with a data server across the computer data network. The data server is programmed to implement and maintain a Master Alarm Database (MADB) 14 as illustrated in Figure 3. The MADB stores information about the alarm system of the plant including the location and attributes 16 of each alarm and also information drawn from documents such as operation manuals, safety manuals, alarm system philosophy statement, piping and instrumentation diagrams and HAZOP/HAZID, LOPA/ SIL and CHAZOP documents.
3. Alarm Network Modelling
MADB 14 also defines and updates an alarm network model (ANM) 18 for the plant, which in the present case comprises an ANM for the plant 1 of Figure 1 that is being monitored. 3.1 The Alarm Network Model
Figure 4 presents a graphical representation of an ANM generated by server 12 and displayed on the HMI device 6 from the ANM model 18 that is stored in MADB 14. The ANM consists of nodes (e.g. nodes 20a to 20e) and directed links (e.g. links 22a to 22d) between the nodes. For simplicity in what follows the term ANM is overloaded below, to refer to three different things: the network model; a more detailed data model that will be described below, which also includes labelled paths through the network; and analysis methods based on the model.
Figure 5 presents a flowchart 500 that sets forth steps, according to a preferred embodiment of the present invention for the development of an ANM drawn up by a human analyst working through the process control logic of the plant. For example the analyst may refer to the P&ID for guidance, identifying for each alarm the circumstances that would cause that alarm to activate (e.g. out-of- normal-range process conditions or equipment failures) and the likely downstream consequences. Each time a new alarm is identified it gets added to the ANM as a node. A link is drawn from one node to another if it is possible that the conditions that led to activation of the first alarm will be followed by conditions that lead to activation of the second alarm, if the operator does not take the appropriate and timely corrective action. For example, if the operator fails to respond to a high temperature alarm in a reactor column in a timely manner, it is likely that the pressure in the column will rise and eventually activate the high pressure alarm, so a link would be drawn between these two alarms. Similarly, a link would be drawn from an alarm indicating pump failure to a low-flow-rate alarm immediately downstream from the pump. To avoid generating a spaghetti bowl of links, only links corresponding to immediate sufficient causes should be included in the ANM (Refs 16, 29).
The ANM is then extended with nodes and links corresponding to the safety logic of the plant, as represented by the Safety Instrumented System (SIS), for example using the PHA/HAZOP and LOPA as guidance (Ref. 33). Links are drawn from the process variable alarms to the SIS alarms that would be activated, if the operator did not respond in a timely manner. When the last alarm before an incident (trip or accident) is reached, a node corresponding to the incident is added, with a link from the alarm. In the case where failure of the trip could lead to an accident, the accident type is noted as part of the node, for reasons that will be explained below.
Different ANM models may need to be updated for different operating states of the plant (running, start-up, scheduled shutdown, etc.) since typically the alarm activation sequences will be different. For example, some alarms may be
suppressed to avoid alarm floods during scheduled shutdown when the operator is aware of the state of the plant, or when a particular piece of equipment is disabled (Ref 21 ). Where the underlying alarm causation logic is unchanged, such suppressed alarms will be included in the ANM model with an indication they are suppressed, to save having to redevelop the ANM just for these cases.
With reference to the flowchart 600 of Figure 6, as part of ANM development the analyst is required to identify and label particular sequences of nodes, called Activation Paths to Failure (APTF), that correspond to patterns of alarm activations that are likely to occur in a system failure scenario situation - typically scenarios arising from particular initiating events, including equipment or process failures, leading to a trip or accident. Hazard analysis artefacts such as Event Trees and Fault Trees may be used as information sources. APTFs will normally follow links through the ANM model.
The analyst is also required to identify and label particular subsequences of APTFs as action scenarios, and nominate an associated operator action with each. Action scenarios will be used to help the operator decide which is the most appropriate action or actions to take when multiple alarms are activated simultaneously. As will be explained below, this approach enables the context to be taken into account when determining how to respond to an alarm: whereas the traditional approach simply associates a single action with an alarm.
As will be explained, in use APTFs assist the operator to track the sequence of failures which lead to major Trips/Incidents, and action scenarios assist the operator in determining the most appropriate action to take. If the operator is able to make a proper decision and take action at any alarm point the failure progress can be stopped. In addition the alarm activation sequences are defined for minor trips to provide an accurate guide for the operators.
In what follows, apart from the example of Figure 8, ANMs are drawn simply as nodes and links without showing APTFs or action scenarios explicitly. Nevertheless the APTFs and action scenarios of an ANM are stored as part of the underlying data structure in the MADB 14. Each APTF is stored with a short
description of the hazardous cases that gave rise to it and the severity of its outcomes(s). Each action scenario is stored with a note of the appropriate corrective action(s) and a timeframe within which the corrective actions should be taken.
From a mathematical and computer science perspective the ANM may be thought of as a directed graph. A mathematical formulation for an ANM, or more strictly for an Alarm Network Diagram, being an ANM without inclusion of action scenarios such as APTFs, is set out in Appendix A toward the end of this specification. Once the analyst has constructed the ANM from the P&ID and other sources describing the design of the plant, the ANM is then stored as an electronic data structure in the MADB 14. The data structure may comprise tables and relationships therebetween of a structured query language (SQL) database. Alternatively, links could be stored against elements in the MADB as a list of alarms and incidents that link from the given node: for example, nodes 20b and 20d would be listed against node 20c from Figure 4.
Knowing which APTFs and action scenarios to explore and capture depends on understanding the design of the plant and the different scenarios that might eventuate during both normal and abnormal operation. ANM is a failure behavior- based profile constructed on the causal relationship between failures and the assigned alarms. By uncovering the patterns and their underlying association (Ref 8) such as APTF the failure progress can be observed (Ref 29) and required corrective decision must be implemented.
A medium-sized process unit would typically have of the order of 1000 process alarms and 100 safety alarms, and say 1500 links and less than 50 APTFs in the ANM model. Because ANM links are "local", in the sense that they represent direct causes, ANM models can be developed unit by unit; indeed, the ANM network could easily be overlaid over the P&l Diagram sheets, with "transfer links" between sheets. The method is scalable to large plants.
In one embodiment of the invention, to increase the clarity and to enhance the visualisation of the ANM, the server is programmed so that nodes are displayed
on the HMI as coloured according to the Layer of Protection (LOP) they come from (Ref. 33), as follows:
• Green (indicated as "grn") for the process control layer, such as alarms from the Basic Plant Control system (BPCS), the Distributed Control System (DCS), PLCs and SCADA systems
• Blue (indicated as "blu" or "Iblu") for alarms from subsystem controllers, such as pumps and communication subsystems
• Orange (indicated as "org") for alarms from the Safety Instrumented System (SIS)
· Red (indicated as "red") for incidents, including trips and accidents
• Black (indicated as "blk") for alarms that are suppressed or disabled, for example because the equipment they protect is disabled (Ref.21 )
3.2. Simple worked example
To illustrate the ANM development process, consider the simple drum 24 shown in Figure 7, used as a reservoir for storing a fluid between different process cycles in a plant. The fluid is a mixture of liquid and vapor, and is supplied from a boiler via a pump. The drum includes the following three transmitters as part of the BPCS:
1 . a flow transmitter on its upstream pipe which comprises a Flow Alarm High (FAH) alarm 26 that activates if fluid inflow exceeds a given operational threshold;
2. a pressure transmitter located on top of the drum comprising a Pressure Alarm High (PAH) alarm 28, which activates if too much vapour builds up within the drum; and
3. a level transmitter on the side of the drum comprising a Level Alarm High (LAH) alarm 30, which activates if too much liquid accumulates within the drum. The drum also has two SIS-related transmitters installed:
1 . a pressure transmitter comprising a Pressure Alarm High-High (PAHH) alarm 32 which activates in the event that the pressure within the drum exceeds a given safety threshold, and
2. a level transmitter which comprises a Level Alarm High-High (LAHH) alarm 34 that activates if the level within the drum exceeds a given safety threshold. Suppose hazard analysis yields the following three hazard cases:
HC 1 . Drum overfill during normal operation due to a mismatch between the inflow and outflow rates;
HC 2. Vapor leak due to the boiler at process start-up supplying a fluid mix with significantly more vapor than usual, and at higher temperature;
HC 3. Drum overfill and/or vapor leak due to the pump at process start-up supplying a fluid mix with significantly more liquid than usual, and at higher temperature.
By working through the process cycle for the drum 24, system analysts identify the following APTFs that would result in the different hazard cases, if the operator does not take timely and appropriate action:
APTF-1 . Drum overfill hazard (HC1 ): FAH→ LAH→ LAHH→ Spill.
APTF-2. Hot fluid start-up hazard (HC2): FAH→ LAH→ PAH→ PAHH→ Leak.
APTF-3. Pump start-up hazard (HC3): Pump rate too high at start-up: FAH→ LAH→ PAH→ LAHH→ Spill.
The following action scenarios would be identified:
AS-1 . FAH→ LAH→ LAHH
Recommended action: Open drain valve and then if required, close the inlet valve.
AS-2. LAH→ PAH→ PAHH
Recommended action: Open vent and then if required, close the inlet valve.
Note that action scenario AS-2 covers both APTF-1 and APTF-3. Figure 8 depicts the ANM that results from the above analysis.
3.3 ANM Generation: A More Complex Example
A more complex example of an ANM will now be explained with reference to Figure 9, which is a P&ID diagram of a debutanizer plant 36 (Ref 3).
Figure 10 depicts the ANM model for the normal operating state of the debutanizer plant of Figure 9. In Figure 10 the low-alarm and high-alarm networks have been drawn separately for readability. In this example the FA-101 alarms (FAL-101 , FALL-101 ) are included to protect pump P-100, hence the "reflux pump damaged" node 1001 in the ANM model. It has been assumed that in some phases of operation, having sufficient reflux is essential for operation of the Debutanizer Tower (DT), and that if the reflux flow drops too low then the DT will trip, hence the link from LALL-103 to DT trip 1007 (i.e. "Trip of Debutanizer Tower"). There are links in both directions between PAHH-104 and LAHH-102 because the alarms could activate in either order, depending on the mixture of vapor and liquid in the DT. It has also been assumed that the SIS high-high alarms will trip the DT or Reflux Drum if an operator does not respond in a timely manner. In keeping with the previously adopted convention the accident type is included as part of the incident node for the trips.
The following are examples of APTFs for the debutanizer example ANM of Figure 10:
APTF-1 . Low feed flow scenario: FAL-102→ FALL-102→ LAL-102→ LALL-102 → trip DT.
APTF-2. Reboiler fails to heat fluid sufficiently: FAL-100→ FALL-100→PAL-104 → PALL-104→ trip DT. APTF-3. Protect reflux pump: FAL-101 → FALL-101 → reflux pump damaged.
ATPFs should also be developed for scenarios such as low flow in the reflux loop and for various overfill/overflow scenarios.
The following are examples of corresponding action scenarios:
AS-1 : FAL-102→ FALL-102→ LAL-102→ LALL-102
Analyst recommended action: Increase feed flow.
AS-2: FAL-100→ FALL-100→PAL-104→ PALL-104
Analyst recommended action: Increase steam flow to reboiler.
AS-3: FAL-101→ FALL-101
Analyst recommended action: Shut down pump P-100.
Note that it may not be possible at design-time (or even perhaps in operation) to determine the exact sequence in which alarms are likely to activate when different process flow attributes are involved, such as whether LALL-103 or FAL- 101 will follow LAL-103, due to the range of different scenarios that could arise. In such cases the convention that LL (/HH) alarms are listed immediately after the corresponding L (/H) alarms has been adopted, for reasons that will be explained below. There is no implication that all alarms in the sequence necessarily activate: for example, activating in APTF-1 above if FAL-102 is not acted on sufficiently promptly, the DT level may drop sufficiently low to trip the DT, even without FALL-102. Nor will all alarms necessarily stay activated: for example, activation of FALL-101 results in suppression of FAL-101 in (Ref.3).
Figure 1 1 illustrates the ANM model for the state where pump P-100 has been disabled and the FA-101 alarms have been suppressed. Only the low-alarm segment is shown, since the high-alarm segment is unchanged. The implicit link from LAL-103 to LAL-102 has also been "suppressed" because the reflux loop is effectively disabled.
4. Alarm System analysis using ANM
This section describes the support that ANM provides for the different stages of the alarm management lifecycle (Ref 2).
4.1 . Alarm identification
The alarm identification stage determines whether an alarm might be needed for a particular process state or equipment failure, to mitigate risk. Figure 6 is a flowchart of a process according to an embodiment of the present invention for a human analyst to add and remove alarms to and from the Master Alarm Database (MADB) and to ensure that there is a sufficient diversity of alarm types.
ISA18.2 lists a number of useful techniques for identifying alarms, such as working though the HAZOP (Hazard and Operability) and LOPA (Layer of Protection Analysis) studies identifying potential alarms. Developing the ANM in parallel provides a systematic way of capturing the alarms. APTFs provide an alarm-focused complement to event trees: starting from initiating events such as equipment failures/shut-downs and abnormal situations, the analyst can work through the Layers of Protection identified in the event tree, checking that alarms are present where operator actions are required. For example, for the Drum example of Figure 7 and 8, a leak detection subsystem and alarm should be added, as a protection measure between the spill/leak hazards and an accident. Likewise, for the debutanizer example of Figures 9-1 1 , the three flow monitors (FA-100/101 /1 02) should also have high alarms defined, to protect against excess flows.
All APTFs should be checked to ensure they contain sufficient diversity of alarm types. For example, according to Stauffer's independence principle (Ref 33), alarms should not all come from the same protection layer, subsystem or instrument. Similarly, to avoid common-cause process failures such as having a gas in a pipe when a liquid was expected, the alarms in an APTF should relate to different flow attributes, such as pressure, temperature, or level. For example, for the debutanizer case study currently it might be wise to define an alarm for pressure the reflux loop, in case the condenser fails and the line fills with vapour. 4.2. Alarm rationalization
The Alarm Rationalization and Justification stages of the alarm lifecycle management are concerned with checking exactly which of the potential alarms identified in the Identification stage really are needed, and with documenting their motivation and detailed requirements. Having too many alarms can be almost as bad as not having enough, because nuisance alarms and - in the worst case - alarm floods, can severely impact the operator's ability to control the plant.
During or after ANM development, alarm redundancy can be reviewed by checking if there are any pairs of alarms in the same protection layer that share the same out-links. This check is illustrated as decision box 603 in the flowchart 600 of Figure 6 for example. If so there may be unnecessary redundancy, increasing the likelihood of alarm floods and one of them could be removed. The ANM can thus provide support for systematic alarm rationalization, which can otherwise be a costly and error-prone exercise.
Conversely, inadvertent alarm suppression has contributed to many accidents. In the Deepwater Horizon oil spill disaster, which commenced on 20 April 2010 in the Gulf of Mexico, a warning alarm outside the crew sleeping quarters was apparently suppressed because nuisance alarms had often interfered with the crews' sleep (Ref 33). The alarm process diversity decision box of Figure 6 defines a step at which an analyst can review and then document or modify redundancies.
4.2.1 . Alarm prioritization
Alarm prioritization is an important part of alarm rationalization, concerned with conveying the significance of alarms to the operator (Ref 13). If the operator does not respond to the alarms according to their required-response timing and priority level, an alarm flood may result, leading to loss of control of the plant (Ref 7). According to EEMUA-191 , ten alarms per ten minutes is about the limit of the operator's ability to handle alarms safety (Ref 12), so alarm prioritization is critical.
Alarm prioritization is typically based on the severity of the consequences of not responding to the alarm in a timely manner (Ref 28). This process is very time consuming as each alarm must be evaluated individually, and it can be difficult to compare alarms with different consequences, or even a single alarm with different consequences. Moreover, this practice does not take account of the likely relative effectiveness of protection layers in reducing incident risk (Refs 25, 26). For example alarms commonly are prioritized based on their severity by using risk matrix in up to 3-4 categories as ISA 18.2 recommends (Ref 35), but
the problem here is that in each category there are still lots of alarms which require a better resolution for the operation.
Use of an ANM assists the prioritization process by presenting an overview of the alarms and their relationships. From this overview it is quickly apparent which nodes might be overloaded. Nodes with higher out-degree (i.e., a high number of links leaving the node) can be expected to trigger more downstream alarms, and thus possibly alarm floods, if they are not treated promptly. Such nodes should be reviewed by the design team to decide whether additional alarms should be defined, to avoid over-reliance on this alarm. For example, in the Debutanizer example of Figures 9-1 1 , LAHH-102 (the debutanizer tower high-high level alarm) has many out-links and is clearly critical. By the time it is activated it might be too late to control the process. A design team may thus decide it would be better to add high-flow alarms on the feed lines.
Nodes with high in-degrees, i.e. nodes which receive many directed link ins, or which are involved in many APTFs, should also be reviewed carefully, for similar reasons. For example, LAL-102 is involved in all three APTFs in the debutanizer case study, indicating that non-response has a high number of possible outcomes. The ANM network model clearly indicates the central place of LAL- 102 in controlling the unit.
APTFs can also assist qualitative analysis of prioritization by indicating what other alarms stand between the node of interest and hazardous incidents: alarms with no or few intervening alarms should typically be given high priority. The alarms with more links are candidate to have higher priority since they link different APTFs which means the pattern of failure proceeding can be changed at that points. Lastly, ANM provides a systematic approach to dynamically prioritize the alarms, by following the below rules on the ANM: the First category belongs to the alarms in the ANM which are the closest to the incident which usually contains safety alarms. The second category is for the alarms with the high number of the outgoing links. In the case of failure to respond this type of alarms the failure can
propagate and more alarm can be activated and consequently end in alarm flood. The third category is for the alarms with more links since this type of alarms connect more APTFs which can change the pattern of failure proceeding. The fourth category is for the remained alarms on the APTFS to stop the route ended to the miss/near miss conditions. The last category is for the remained alarms. At each category alarms must be organized based on the sequence of activation on the ANM to stop failures when they are initiated.
4.3. Detailed design and implementation
The alarms on each APTF in the ANM should be designed to avoid common- cause equipment failures such as all the sensors or transmitters being deployed on the same SCADA network, or using the same type of technology. For example, since alarm node LAL-102 (shown in Figures 10, 1 1 ) plays such a critical role in the debutanizer case study, it would be wise to put it on a different network from the rest of the control layer. More generally, BPCS and SIS alarms must be completely segregated (Ref 9). For alarms in the BPCS, it is recommended that high and high-high alarms use different methods for measuring process variables. For example, in the debutanizer tower, if a contact sensor such as a displacer is used for the high level alarm, then a non-contact sensor such as radar or differential pressure could be used for the high-high level alarm.
4.4. Operator support
Figure 12 presents a flowchart 1200 for the processes that the server 12 (Figure 2) implements to provide a software tool that monitors the alarms, stores and references the ANM and displays alarm information via a screen of HMI 6 (Figure 2) to provide useful complementary support to the plant operator, to aid situation awareness. As will be described in more detail, in a preferred embodiment of the invention the ANM network model is overlaid upon, or displayed side by side with a P&ID of the plant, with activated and recently deactivated alarm nodes highlighted. Results from the HAMMLAB study and others indicate that operators prefer displays that integrate alarms into process monitoring formats (Ref 5).
The server 12 (Figure 2) is programmed to match activated alarms against APTFs and action scenarios and show a match if two or more of nodes are activated. Server 12 then serves pages over computer data network 8 that are displayed on screens of the HMI 6 to make the operator 7 aware of possible downstream consequences, i.e. what potential plant failures are anticipated by the APTFs, and to assist the operator with Cause-Consequence Analysis (CCA) by identifying which scenario(s) could be underway, even if some of the alarms have failed along the way. The object of the matching of the activated alarms against APTFs and action scenarios is simply to identify APTFs that contain two or more of the activated alarms.
An ANM based alarm alert system may offer a memory of failure management about the activated, deactivated and responded alarms which provides better understanding about the progress of an operational failure. The chain of APTFs provide profiles of failures at different states of operation and so that the operator is able to check the escalation of an accident (Ref 29). In addition, tracking the failures in the ANM expands the ability of the operator to detect spurious alarms (Ref 22) if there is not any activation of the related alarms in the ANM.
As an example, consider the debutanizer plant that was previously discussed with reference to Figures 9 and 1 1 . The appropriate corrective action for LAL-102 depends on the activation path to that point. The server 12 is programmed to implement a pattern-matcher that determines which action scenario might be underway and recommends the appropriate action to the operator, depending on which alarms preceded LAL-102: increase the feed flow (AS-1 ); check the reboiler and increase the flow of LP saturated steam (AS-2); or increase the flow into the debutanizer from the reflux drum. This example clearly shows that in general it is not enough to note a single corrective action against each alarm: the context needs to be taken into account. Suitable formulation of action scenarios can provide this context.
4.5. Change management support
Figure 13 presents a flowchart 1300 for alarm system management according to an embodiment of the present invention.
Failure to manage changes of the AS and poor documentation are two of the major causes of incidents in AS lifecycle. ANSI/ISA 18.2 introduces 10 phases for AS lifecycle and management of changes is one of the important phases which has a great impact on AS performance (Ref 31 ). During operation, changes in the AS are typically expensive. They also increase the risk of incidents, as many incidents occur in the commissioning and start-up (Ref 18).
Therefore, the consequences of changes must be studied before they are implemented. ANM can assist in this process by enabling the impact of the changes to be checked in a systematic manner. The impact of the changes can be checked by assessing how connectivity of the ANM would be affected when certain alarms are removed, and by rerunning the previously described checks.
As previously discussed, separate ANM models may need to be developed for different operating states of a plant. Where the change simply results in certain alarms being disabled, such as when redundant equipment is taken offline, the corresponding nodes in the ANM network can simply be struck out, as illustrated in Figure 1 1 . The ANM can quickly be rechecked to see that integrity checks continue to apply.
ANM contains the failure behavior based profile of the operation (Ref 8). The failure patterns can be varied in different states of the operation such as Full operation, half operation or start-up; since process variable maybe varied from the normal range of operation (e.g. different percentage of vapor and liquid mixture or variable viscosity) can lead to unusual alarm sequence activation. In the ANM, some APTFs are for normal operation and the others can be used for the other states of operation to cover infrequent alarm sequences.
5. Case Study: BP Texas City Refinery Explosion
This section illustrates hypothetical use of ANM on a well-known case study: the 2005 explosion in the isomerization unit of BP'S Texas City refinery which resulted in 15 deaths, 180 injuries and more than $1 .5 billion financial damage. Investigations revealed that AS failure was one of the major factors contributing to the accident (Ref 23).
5.1 . Background: The BP Texas City isomerization unit design
Figure 14 shows a simplified P&ID for the part of the process involved in the accident, showing plant components, alarms and their location. The Isomerization Unit (IU) 1400 was responsible for increasing the octane level of the gasoline being processed. During process start-up, as a result of an inaccurate level measurement by a level transmitter, the Raffinate Splitter Tower (RST) was overfilled. Pressure relief devices opened as a safety measure, but this in turn led to overfilling of the Blowdown Drum (BDD). Flammable liquid was released into the air and sewer, which triggered the explosion and subsequent fire (Refs 1 , 17).
The raffinate splitter section of the IU 1400 was designed to separate the aromatic components of the hydrocarbon liquid by heating and distilling the liquid in a process loop. This process loop begins with boiling the liquid and distilling it through the trays located inside the RST. The separation process is based on the discrepancies between the boiling points of the different components and the process iterates several times to enhance the quality of the product. The blowdown drum is designed to relieve over-pressure from the RST and then separate water from hydrocarbon (Ref 1 ). 5.2. ANM analysis of the original design
The ANM derived from Figure 14 is set out in Figure 15.
The main APTF which contains the incident is illustrated in the dashed links of Figure 16, namely:
FAH-01 > LAH-01 > LAHH-03> PAH-01 > LAH-07 > Blowdown Leak/Spill
According to the accident report (Ref.1 ), the incident played out as follows, in terms of alarm activation:
1 . The incident happened because of unintentional over feeding the RST and failure of the level alarms (LAH and LAHH), so the operator failed to control the level inside the RST, while the feeding and boiling were not stopped.
2. The RST high-level sensor failed, resulting in LAH-01 being deactivated early. The high level alarm had been deactivated because the viscosity of the Raffinate varied with temperature and consequently level measurement contained error.
3. The high-high level alarm LAHH-02 also failed, because it was improperly installed. The contact level switch was not a good selection since poor installation and calibration can cause the detection failure.
4. The RST failed to trip, as a result. Also the process control and safety system were not separated.
5. The high-pressure alarm PAH-01 activated due to liquid overflowing from the RST, but the operator misdiagnosed the situation and opened a valve that resulted in the liquid being diverted into the BDD.
6. The BDD high-level alarm LAH-05 failed. The level switch during installation and calibration had been turned and failed to detect high level point.
7. The BDD overfilled, which ultimately resulted in the explosion (Ref.10).
This incident shows the importance of the alarm system to interrupt the failures, and how the failure can progress or hide in the system and without the proper human intervention lead to an incident. Though, many factors contribute to this incident, such as safety culture failure, outdated safety systems and cutting costs which postponed the flare system integration (Refs 1 0, 1 5) but alarm system with some modification with low cost was able to prevent the failure.
5.3. Proposed design modification
Applying the ANM rules from sections 4.1 -4.3 suggests adding 7 alarms to the IU, underlined in the revised ANM model shown in Figure 18 which is an ANM for the modified isomerization unit shown in the P&ID of Figure 17. The new links are shown in light blue on the ANM of Figure 18.
The rationale for the new alarms is as follows:
1 . GDA-01 : The rules from NFPA 72 (Ref 4) suggest adding a leak detector to monitor level of release from BDD, to activate an emergency alarm when the leak is higher than Lower Explosive Limit (LEL).
2. FAH-05: The BDD high-level alarm LAH-05 is critical and close to a hazardous incident. The alarm identification rules in section 4.1 suggest adding an alarm on the flow diversion from the RST to the BDD to detect unusual amounts of liquid being diverted to the BDD.
3. TAH-06 and TAL-06: Temperature transmitter at the lowest tray of the RST can be used to generate High/Low temperature alarms. High- temperature alarm shows failure in temperature control and low temperature alarm indicates that the liquid reached to the tray level which demands discharge to the heavy raffinate tank and stop feeding.
4. TAH-01 : The temperature transmitter at the highest tray of the RST can be used for high temperature alarm which can be activated before high pressure alarm and provide the opportunity for the operator to prevent high pressure and its consequence release.
5. FAH-02: To provide a better monitoring of the net flow in the RST, a high flow alarm is recommended to stop the reboiler pump when the RST high level alarm is activated.
6. LAH-08: A high level alarm on the Reflux Drum is required to prevent release from the Reflux Drum to the BDD. In case of LAH-08 activation
then operator must transfer excess amount of the process fluid to the RST (if the high level is not activated) or transfer to the light raffinate tank.
Also, the transmitter for the LAH-01 on the RST should be replaced with a displacer or radar type, which does not depend on the change of raffinate viscosity and for the LAHH-03 a level transmitter such as pressure is indicated rather than a switch.
Figure 18A depicts an enhanced version of the ANM of Figure 18 wherein for generality, numerals (shown encircled) have been used to identify nodes instead of alarm labels. The advantage of doing so is that it is easy to add an interface to read the labelling from the Master Alarm Database (MADB) 14 and return results as alarm labels. Preferably the ANM links are added as a field in the AMDb so that the alarm maps to an alarm (/ incident) list. Consequently results can be returned as simple lists and readily integrated with a graphical user interface (GUI) running on the Human Machine Interface (HMI) 6 (Fig 2).
Referring now to Figure 18A nodes in the prototype ANM can be numbered (in circles as shown) and the links represented, and stored in MADB 14, by lists of related nodes as follows:

It is possible to make a Cause-consequence analysis in ANM as follows:
alarm X leads directly to incident [Y] · X links directly to an incident Y & is activated
root-cause path: [A B C]
• There is a path of activated alarms A to B to C
potential root-cause path: [A B C D E] if
C failed · There is a path of activated alarms with one non-activated (possibly failed) alarm
alarm X then Y may lead to incident [Y Z]
• X has activated; Y has not
• Y is the first node on the path from X to incidents Y, Z
• Y is put on a watch-list
An example of the above is as follows:


Figure 18E shows a subsequent stage after activation of alarm PAH-01 . The cause consequence analysis is as follows:


Figure 18G shows a subsequent stage after activation of alarm LAH-08. The cause consequence analysis at this stage is as follows:


Cause-Consequence Analysis of frontier alarms :
1 : alarm 18 then 8 may lead to incident [28]
root -cause paths :
1 : [18]
A side by side comparison of the original AS design with the Modified AS design is set out in Table 1 .

5.4. Operator support using ANM
The server 12 of Figure 2 is programmed to display a graphical representation of the ANM on HMI device 6 beside a typical P&ID to assist the operator to track the activated and currently deactivated alarms, to discover that a chain of failures are followin which attern of activation.

ANM provides the opportunity to dynamically prioritize the alarms, by following the rules mentioned on the ANM, the new prioritization is defined for the operator as shown in Table 3.

Category 1 , contains alarms which are close to the trip/incident condition and typically include Safety alarms which are the most severe and urgent alarms. Second category, include alarms which propagate failures. Failing to respond LAH-01 in this model concludes more alarm activation. In third category, alarms with more links are considered since they connect to more APTFs. Such as FAH- 05 which merges 3-4 APTFs to one, or PAH-01 connects 3 APTFs to 2 APTFs. Fourth category is for the alarms are on the APTFs and are not mentioned in the previous categories. The last category is for the alarms which are not mentioned in the previous categories. As can be seen the new APTF for the main path to failure has more variety type of alarms which reduce the dependency to process variable changes.
□ Original AS: FAH-01 > LAH-01 > LAHH-03> PAH-01 > LAH-07 > Blowdown Leak/Spill
□ Modified AS: FAH-01 > LAH-01 > LAHH-03 > PAH-01 > FAH-05> LAH-07> GDA-01 > Blowdown Leak/Spill
Indeed safety of the alarm system in the modified AS of Figure 19C is increased since it has 7 interrupt points compares to the five in the original system. There is a trade-off between the number of alarms on the APTFs (which demand more
attention of the operators) and the safety level of the AS. ANM provides the opportunity to make a compromise.
The ANM of Figure 18 corresponds to the case where new alarms have been added to the plant as previously described. The ANM of Figure 19A is supplemented with an indication of alarm activation, such as might occur at a particular time in plant operation. Seven alarms have activated (indicated by a small red or yellow solid triangle). The alarm indicated by a small red hollow triangle is shown as having possibly failed. The three alarms with yellow triangles are alarms which can be shelved by the operator. The three alarms with a small red hollow diamond are put on a watch list, to alert the operator that - should the alarm subsequently activate - that an APTF may be progressing towards an incident.
The following action scenarios are potentially underway (consecutive nodes in the action scenario are activated); the activated alarms are shown in bold. The action scenario numbering in Table 4 is taken from Table 2.
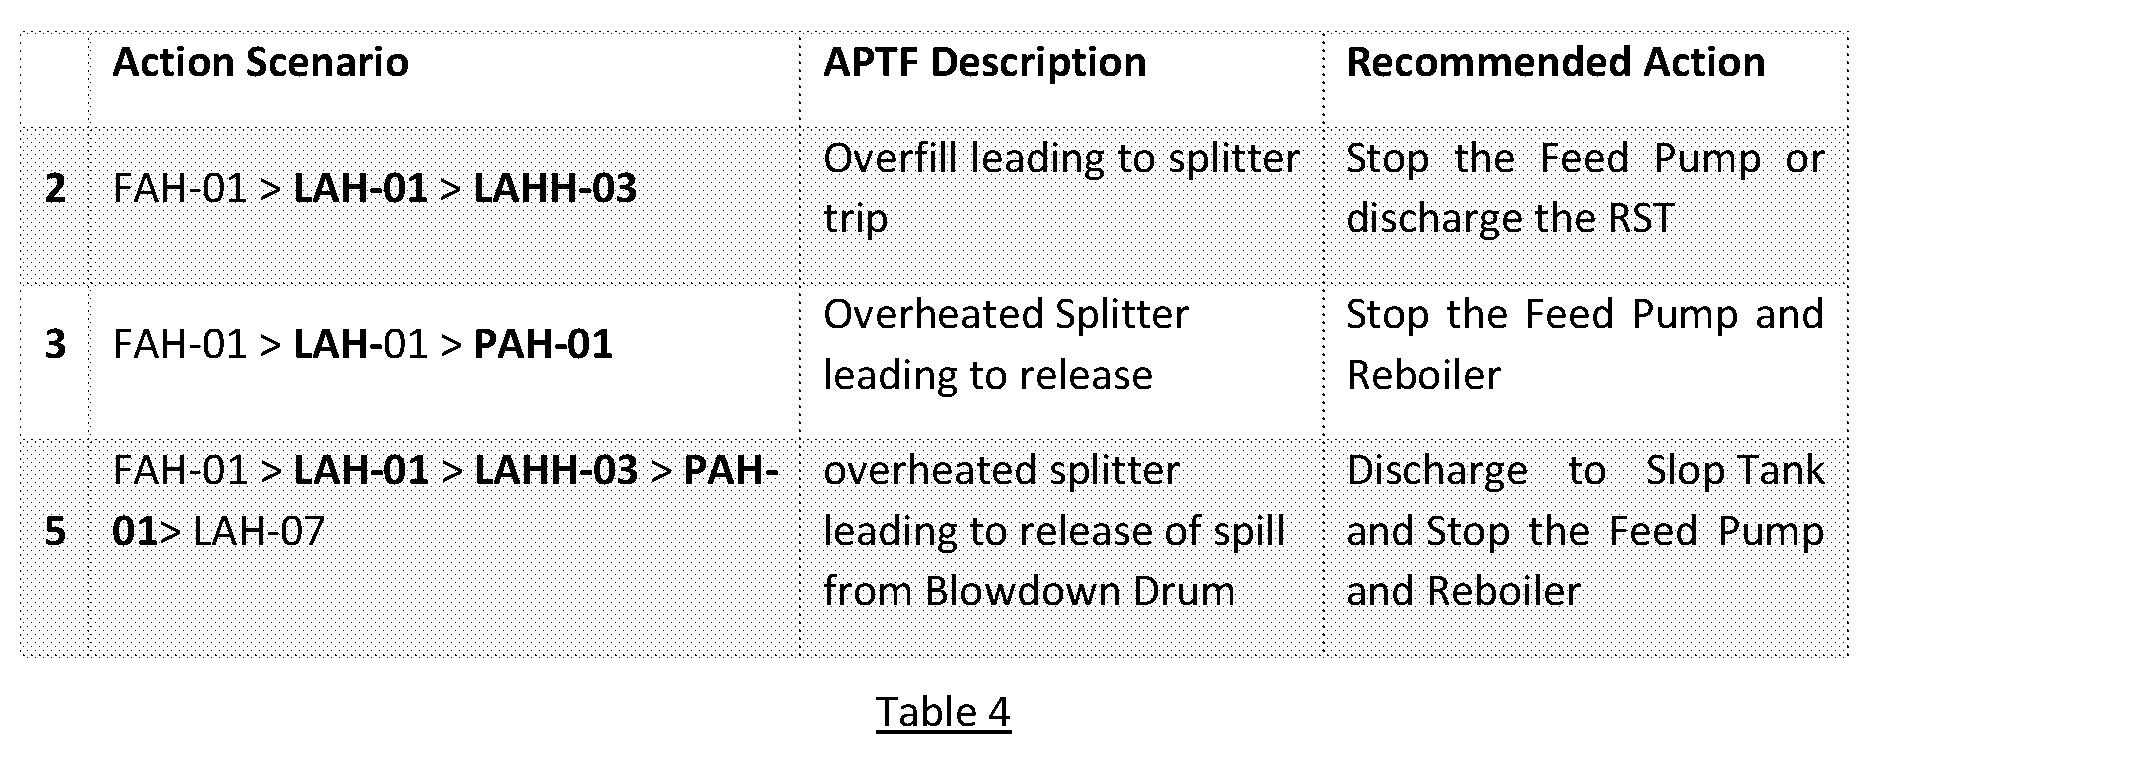
The following action scenario 6 of Table 5 is possibly underway (non-consecutive nodes in the action scenario are activated, with the intervening node presumed to have failed):

Figure 21 is a close up of a portion 2100, labelled "Dynamic Alarm Prioritisation" of the dashboard page 2000. The Dynamic Alarm Prioritisation screen portion 2100 shows the activated alarms in order of dynamic priority and is useful for the operator to quickly understand what actions must be taken urgently and how much time is likely to be available to act in order to avert incident escalation.
In Figure 22 there is shown a version of the ANM 2201 , which is displayed in a top right hand portion 2200 of the dashboard screen 2000 of Figure 20, wherein the activated alarms are shown with a number in black, for ease of reference in what follows. (These labels would not appear on the actual screen.) The number indicates temporal ordering of activation (1 = earliest).
Figure 23 is a close up of a portion 2300 of the dashboard 2000 of Figure 20, which is labelled "APTFs and Action Scenarios". In the APTFs and Action Scenarios portion of the dashboard the activated alarms are listed, organised by the action scenario(s) in which they appear. The recommended action is shown on the right most column. Isolated alarms (i.e. those not joined to any other activated alarms) are indicated by a closed folder symbol and simply have their recommended action, e.g. "Reduce boiler temperature" listed. If they do not deactivate in response to the operator action, the operator can note them as a non-responding alarm, indicated by a "prohibited" symbol, and shelve them.
Referring again to Figure 23, potentially underway action scenarios are indicated by an open folder symbol with the root cause (i.e. the earliest activated alarm in an APTF - earliest in the sense that no alarm that links to it is activated, e.g. "LAH-01 ") identified in the leftmost column adjacent the open folder symbol.
With reference to Figure 25, a "Watch List" is provided on the dashboard, by which the server brings to the operator's attention currently non-activated alarms
that should be monitored, in case they turn into more serious situations. These alarms are indicated by hollow red diamonds in Figure 19. The Watch List indicates the possible consequences and number of alarms between the currently activated alarm and the consequence.
The server may also be programmed to list the possibly underway action scenarios, in a similar manner to the potentially underway action scenarios, but with the missing alarm indicated. The server may also be programmed so that the alarms between root cause and frontier nodes listed in the "APTFs and Action Scenarios" view can be selected by the operator as candidates for shelving. Shelved alarms get suppressed from the other views (e.g. the "Dynamic Alarm Prioritisation" view). Shelving such alarms allows the operator to focus on the more important alarms. Figure 26 shows the shelvable alarms and the activated alarms they link to.
Appendix A
Z specification for ANM
The following specifies the Alarm Network Diagram (AND) and its associated functions only (i.e., it does not cover the action scenarios aspect of ANM).
1 The basic network model
1.1 Types
There are two basic types: Ald for alarm IDs and //d for incident IDs.
Nodes can be alarms or incidents:
Node ::= alarm(Ald) \ incident(lld)
1.2 AND state model
The AND state of a system consists of a finite set of nodes (nodes), directed links between node s (sued) and a set of activated alarms (active):

The invariants say: 1. the network is closed: i.e., all links start and end at nodes already in the network
2. all activated alarms (or at least, all of the activated alarms that we're interested in) arenodes in the network
3. there are no self-links Note that incidents can have out-links.
1.3 Definitions

n a arm pat s a non-empty sequence o n e a arms:

1.4 Functions
The SuppressibleAlarms function returns activated alarms that lie between (different) activated alarms:

The PossiblyFailedAlarms function returns non-activated alarms that lie between (different) activated alarms.
 The LastAlarms function returns activated alarms that link to incidents, and the incidents:

The FrontierAlarms function returns activated alarms that have non-activated successors:

Note that frontier alarms may appear on the SuppressibleAlarms list.
The ConsequenceAnalysis function looks through all paths from activated nodes through to incidents, and returns the frontier node, the next (i.e., not activated) node, and the incident, in that order.

Note that we don't currently look beyond the first incident when following links downstream, even though incidents can themselves have further consequences.
The Root Cause Analysis function RCA returns all paths of activated nodes from a root node to a given activated node:

Note that the current specification does not admit incidents as root causes. The PotentialRCA function is similar to RCA, except that it allows one non- activated alarm in the root-cause path (which will be one of the possibly failed alarms):

2 Relationship to ANM prototype
The "suppressible" and "possibly failed" functions in the HMI return the results of the SuppressibleAlarms and PossiblyFailedAlarms functions explained above.
The "Cause-Consequence Analysis of frontier alarms" function in the HMI goes through each of the frontier alarms in turn, using the ConsequenceAnalysis function above to note the frontier node, the next node (the "then" node) and a list of the possible incidents that could result. It then uses the RCA and PotentialRCA functions to list the shortest root-cause paths and potential root-cause paths (if any) to the frontier node. The "Activated alarms immediately before incidents" function in the HMI is similar, but analyses alarms that are linked directly to incidents.
References
The following reference documents numbered 1 to 38 are hereby incorporated herein in their entireties.
1 . Investigation Report, Refinery Explosion and Fire, BP-Texas City, Texas, March 23, 2005 U.S. Chemical Safety and Hazard Investigation Board, 2007.
2. ISA 18.2 Management of Alarm Systems for the Process Industries ANSI/ISA, 2009.
3. Arjomandi RK, and Salahshoor K. Development of an efficient alarm management package for an industrial process plant. In: Control and Decision Conference (CCDC), 2011 Chinese\EEE, 201 1 , p. 1875-1880.
4. Association NFP. NFPA 72: National fire alarm and signaling code. The Association, 2009.
5. Berg 0, Kaarstad M, Farbrot JE, Nihlwing C, Karlsson T, and Torralba B.
Alarm systems. In: Simulator-based Human Factors Studies Across 25
VearsSpringer, 201 1 , p. 155-167.
6. Cai Z, Zhang L, Hu J, Yi Y, and Wang Y. Comprehensive alarm information processing technology with application in petrochemical plant. Journal of Loss Prevention in the Process Industries 38: 101 -1 13, 2015.
7. Cheng Y, Izadi I, and Chen T. Pattern matching of alarm flood sequences by a modified Smith-Waterman algorithm. Chemical Engineering Research and
Design 91 : 1085-1094, 2013.
8. Chikhaoui B, Wang S, Xiong T, and Pigot H. Pattern-based causal relationships discovery from event sequences for modeling behavioral user profile in ubiquitous environments. Information Sciences 285: 204-222, 2014. 9. Commission IE. IEC 6151 1 , Functional safety— Safety instrumented systems for the process industry sector. International Electrotechnical Commission Std 2003.
10. CSB15 U. Investigation Report, Refinery Explosion and Fire, BP-Texas City, Texas, March 23, 2005. Report, 2007. 1 1 . Dal Vernon CR, Downs JL, and Bayn D. Human performance models for response to alarm notifications in the process industries: An industrial case study. In: Proceedings of the Human Factors and Ergonomics Society Annual MeetingSAGE Publications, 2004, p. 1 189-1 193.
12. EEMUA. Alarm systems: a guide to design, management and procurement, EEMUA 191 . In: Engineering Equipment and Materials Users Association.
London: 2007.
13. Foong O, Sulaiman S, Rambli D, and Abdullah N. ALAP: Alarm
prioritization system for oil refinery. In: Proc of the World Congress on
Engineering and Computer Science2009.
14. Hatch D. Alarms: prevention is better than cure. The Chemical Engineer 40- 42, 2005.
15. Holmstrom D, Altamirano F, Banks J, Joseph G, Kaszniak M, Mackenzie C, Shroff R, Cohen H, and Wallace S. CSB investigation of the explosions and fire at the BP Texas City refinery on March 23, 2005. Process safety progress 25: 345-349, 2006. 16. Hu J, and Yi Y. A two-level intelligent alarm management framework for process safety. Safety science 82: 432-444, 2016.
17. Kalantarnia M, Khan F, and Hawboldt K. Modelling of BP Texas City refinery accident using dynamic risk assessment approach. Process Safety and Environmental Protection 88: 191 -199, 2010. 18. Kondaveeti SR, Izadi I, Shah SL, Black T, and Chen T. Graphical tools for routine assessment of industrial alarm systems. Computers & Chemical
Engineering 46: 39-47, 2012.
19. Konkani A, Oakley B, and Bauld TJ. Reducing hospital noise: a review of medical device alarm management. Biomedical Instrumentation & Technology 46: 478-487, 2012.
20. Laberge JC, Bullemer P, Tolsma M, and Dal Vernon CR. Addressing alarm flood situations in the process industries through alarm summary display design and alarm response strategy. International Journal of Industrial Ergonomics 44: 395-406, 2014. 21 . Larsson JE, Ohman B, Calzada A, and DeBor J. New solutions for alarm problems.
22. Lundteigen MA, and Rausand M. Spurious activation of safety instrumented systems in the oil and gas industry: Basic concepts and formulas. Reliability engineering & system safety 93: 1208-1217, 2008. 23. Mogford J. Fatal accident investigation report: isomerization unit explosion final report. Texas City, Texas, USA 2005.
24. Naghoosi E, Izadi I, and Chen T. Estimation of alarm chattering. Journal of Process Control 21 : 1243-1249, 201 1 .
25. Pariyani A, Seider WD, Oktem UG, and Soroush M. Dynamic risk analysis using alarm databases to improve process safety and product quality: Part I— Data compaction. AIChE Journal 58: 812-825, 2012.
26. Pariyani A, Seider WD, Oktem UG, and Soroush M. Dynamic risk analysis using alarm databases to improve process safety and product quality: Part II— Bayesian analysis. AIChE Journal 58: 826-841 , 2012.
27. Parsa K, and Lindsay PA. A Process for Integrating Alarm Systems for Operation, Safety and Security in Process Plants. 2014.
28. Rothenberg DH. Alarm management for process control: a best-practice guide for design, implementation, and use of industrial alarm systems.
Momentum Press, 2009.
29. Saleh JH, Haga RA, Favaro FM, and Bakolas E. Texas City refinery accident: Case study in breakdown of defense-in-depth and violation of the safety-diagnosability principle in design. Engineering Failure Analysis 36: 121 - 133, 2014.
30. Shahriari M, Shee A, and Ortengren R. The development of critical criteria to improve the alarm system in the process industry. Human Factors and Ergonomics in Manufacturing & Service Industries 16: 321 -337, 2006.
31 . Stauffer T. Exida Whitepaper Use Alarm Management To Make your Plant Safer. 2009.
32. Stauffer T. Implement an Effective Alarm Management Program. Chemical Engineering Progress 108: 19-27, 2012. 33. Stauffer T, and Clarke P. Using alarms as a layer of protection. Process Safety Progress 2015.
34. Stauffer T, Sands N, and Dunn D. Alarm Management and ISA-18-a Journey, not a Destination. In: Texas A&M Instrumentation Symposium2Q~\ Q.
35. Stauffer Τ, Sands Ν, and Dunn D. Get a Life (cycle)! Connecting Alarm Management and Safety Instrumented Systems. In: ISA Safety & Security
Symposium2010.
36. Venkatasubramanian V, Rengaswamy R, and Kavuri SN. A review of process fault detection and diagnosis: Part II: Qualitative models and search strategies. Computers & Chemical Engineering 27: 313-326, 2003.
37. Zhu J, Shu Y, Zhao J, and Yang F. A dynamic alarm management strategy for chemical process transitions. Journal of Loss Prevention in the Process industries 30: 207-218, 2014. 38. Zwaga H, and Hoonhout H. Supervisory control behaviour and the implementation of alarms in process control. In: Human factors in alarm desigriTay\or & Francis, Inc., 1995, p. 1 19-134.
In compliance with the statute, the invention has been described in language more or less specific to structural or methodical features. The term "comprises" and its variations, such as "comprising" and "comprised of" is used throughout in an inclusive sense and not to the exclusion of any additional features. It is to be understood that the invention is not limited to specific features shown or described since the means herein described herein comprises preferred forms of putting the invention into effect. The invention is, therefore, claimed in any of its forms or modifications within the proper scope of the appended claims appropriately interpreted by those skilled in the art.
Features, integers, characteristics, compounds, chemical moieties or groups described in conjunction with a particular aspect, embodiment or example of the invention are to be understood to be applicable to any other aspect, embodiment or example described herein unless incompatible therewith.
Any embodiment of the invention is meant to be illustrative only and is not meant to be limiting to the invention. Therefore, it should be appreciated that various other changes and modifications can be made to any embodiment described without departing from the spirit and scope of the invention.
Claims
1 . A method for assisting a human operator to respond to alarm activations of a plurality of alarms of a plant, the method including: determining an alarm network model (ANM) for said plant in which the alarms are identified as causally related nodes and storing the ANM in an electronic database;
monitoring the alarms across an electronic data network with a computational device to detect alarm activations;
operating the computational device to match alarm activations to predetermined activation paths to failure (APTF) and action scenarios comprising sequences of said nodes of the ANM; and
presenting operator assistance information to said operator with a human machine interface (HMI) under control of the computational device, based on matches between said monitored alarm activations and matched
APTFs and action scenarios.
2. A method according to claim 1 , wherein the step of presenting operator assistance information to the human operator includes displaying a directed graph diagram corresponding to the ANM.
3. A method according to claim 1 , wherein recommended action information for matched action scenarios is presented to assist the operator to avert plant failures associated with each APTF.
4. A method according to any one of claims 1 to 3 including dynamically prioritizing activated alarms and presenting a list of the prioritized activated alarms to the human operator.
5. A method according to any one of claims 3 to 4, wherein alarms corresponding to nodes of the ANM that are located closest to an incident are categorized as being of highest priority for the operator to address.
6. A method according to claim 5, including identifying second-to-highest priority alarms as being alarms corresponding to nodes with at least a predetermined number of outgoing links.
7. A method according to any one of claims 5 to 6, wherein the step of presenting a list of the prioritized activated alarms includes presenting the list ordered by a time-to-respond parameter whereby the operator can readily determine which alarms require most urgent action.
8. A method according to any one of claims 1 to 7 including classifying alarms as corresponding to different alarm systems of the plant.
9. A method according to claim 8, including presenting a diagram of the ANM to the operator wherein different classifications of alarms are visually apparent to the operator.
10. A method according to any one of claims 1 to 9 including presenting a piping and instrumentation diagram (P&ID) of the plant to the operator in conjunction with a diagram of the ANM.
1 1 . A method according to any one of claims 1 to 10 including updating the ANM in response to commands from the operator.
12. A method according to any one of claims 1 to 1 1 including storing more than one ANM of the plant wherein different ANMs correspond to different operating states of the plant.
13. A method according to any one of claims 1 to 12 including determining alarms that are non-responsive to operator action and indicating such alarms to the operator as being non-responding nuisance alarms.
14. A method according to any one of claims 1 to 13 including indicating potentially underway action scenarios to the operator with an identification of a root cause alarm.
15. A method according to any one of claims 1 to 14 including identifying failed alarms to the operator.
16. A method according to any one of claims 1 to 15 including presenting recommendations for alarms to be shelved to the operator.
17. A method according to any one of the preceding claims including numbering the nodes and storing the numbers in association with labels of the alarms.
18. A method according to claim 17 including representing links of the ANM on the HMI as lists of related nodes.
19. An assembly for assisting a human operator to respond to alarm activations of a plurality of alarms of a plant, the assembly comprising:
a computer server in communication with the alarms via an electronic data network the computer server being arranged to:
maintain a database including an alarm network model (ANM) for said plant identifying the alarms as causally related nodes;
match alarm activations to predetermined activation paths to failure (APTF) and action scenarios comprising sequences of the nodes; and
present operator assistance information based on one or more series of the APTFs and action scenarios matching the changes in states of the alarms; and
a human-machine-interface (HMI) in data communication with the computer server and arranged to display the operator assistance information to the operator.
20. An assembly according to claim 19, wherein the computer server is arranged to render the ANM for display by the HMI as a directed graph diagram including nodes corresponding to the alarms and directed links between the nodes corresponding to the causal alarm relationships.
21 . An assembly according to claim 19, wherein the computer server is arranged to associate a unique number with each node and to present all or portions of the ANM as one or more lists of related nodes.
22. An assembly according to claim 20 or claim 21 , wherein the computer server is further arranged to add or remove alarms to and from the alarm network model (ANM) in response to commands from the HMI.
Applications Claiming Priority (2)
| Application Number | Priority Date | Filing Date | Title |
|---|---|---|---|
| AU2016903307 | 2016-08-19 | ||
| AU2016903307A AU2016903307A0 (en) | 2016-08-19 | An improved alarm operator assist method and assembly |
Publications (1)
| Publication Number | Publication Date |
|---|---|
| WO2018032061A1 true WO2018032061A1 (en) | 2018-02-22 |
Family
ID=61195947
Family Applications (1)
| Application Number | Title | Priority Date | Filing Date |
|---|---|---|---|
| PCT/AU2017/050884 Ceased WO2018032061A1 (en) | 2016-08-19 | 2017-08-18 | An improved alarm operator assist method and assembly |
Country Status (1)
| Country | Link |
|---|---|
| WO (1) | WO2018032061A1 (en) |
Cited By (2)
| Publication number | Priority date | Publication date | Assignee | Title |
|---|---|---|---|---|
| JP2022117231A (en) * | 2021-01-29 | 2022-08-10 | 三菱重工業株式会社 | Coping method presentation system, coping method presentation method and program |
| CN115146746A (en) * | 2022-09-06 | 2022-10-04 | 武汉商学院 | A regional landslide disaster identification method based on multi-source data fusion |
Citations (2)
| Publication number | Priority date | Publication date | Assignee | Title |
|---|---|---|---|---|
| US5237518A (en) * | 1990-10-27 | 1993-08-17 | Vanderbilt University | Optimization method for adaptive sensor reading scheduling and delayed alarm evaluation in real-time diagnostic systems |
| US5420977A (en) * | 1990-10-24 | 1995-05-30 | Vanderbilt University | Multiple aspect operator interface for displaying fault diagnostics results in intelligent process control systems |
-
2017
- 2017-08-18 WO PCT/AU2017/050884 patent/WO2018032061A1/en not_active Ceased
Patent Citations (2)
| Publication number | Priority date | Publication date | Assignee | Title |
|---|---|---|---|---|
| US5420977A (en) * | 1990-10-24 | 1995-05-30 | Vanderbilt University | Multiple aspect operator interface for displaying fault diagnostics results in intelligent process control systems |
| US5237518A (en) * | 1990-10-27 | 1993-08-17 | Vanderbilt University | Optimization method for adaptive sensor reading scheduling and delayed alarm evaluation in real-time diagnostic systems |
Non-Patent Citations (1)
| Title |
|---|
| "Principles for alarm system design", YA-711, NORWEGIAN PETROLEUM DIRECTORATE, February 2001 (2001-02-01), XP055467255, Retrieved from the Internet <URL:http://www.ptil.no/getfile.php/135975/Regelverket/Alarm_system_designe.pdf> [retrieved on 20171115] * |
Cited By (3)
| Publication number | Priority date | Publication date | Assignee | Title |
|---|---|---|---|---|
| JP2022117231A (en) * | 2021-01-29 | 2022-08-10 | 三菱重工業株式会社 | Coping method presentation system, coping method presentation method and program |
| JP7633031B2 (en) | 2021-01-29 | 2025-02-19 | 三菱重工業株式会社 | Solution presentation system, solution presentation method, and program |
| CN115146746A (en) * | 2022-09-06 | 2022-10-04 | 武汉商学院 | A regional landslide disaster identification method based on multi-source data fusion |
Similar Documents
| Publication | Publication Date | Title |
|---|---|---|
| Shu et al. | Abnormal situation management: Challenges and opportunities in the big data era | |
| CN106164411B (en) | For showing the component health of seabed control subsystem component and the system and method for preventive maintenance needs | |
| Yazdi | The application of bow-tie method in hydrogen sulfide risk management using layer of protection analysis (LOPA) | |
| US10572493B2 (en) | Computerized process safety management system | |
| CN107316444B (en) | Chemicals production device actual time safety method for early warning | |
| Natarajan et al. | An ontology for distributed process supervision of large-scale chemical plants | |
| Parsa et al. | Process alarm modeling using graph theory: Alarm design review and rationalization | |
| Rodríguez et al. | A systematic and integral hazards analysis technique applied to the process industry | |
| JP2017015592A (en) | Nuclear power plant warning monitoring support system | |
| Hollifield et al. | Alarm management: Seven effective methods for optimum performance | |
| Parsa et al. | Enhancing alarm prioritization in the alarm management lifecycle | |
| CN110337640B (en) | Methods, systems, and media for problem alert aggregation and identification of suboptimal behavior | |
| Bao et al. | Risk‐based fault diagnosis and safety management for process systems | |
| Hurdle et al. | Fault diagnostics of dynamic system operation using a fault tree based method | |
| Wang et al. | Intelligent industrial alarm systems | |
| EP4639302A1 (en) | Computer-implemented method and computer device for identifying risks in an industrial plant, and method for operating an industrial plant | |
| WO2018032061A1 (en) | An improved alarm operator assist method and assembly | |
| Park et al. | A systematic framework to investigate the coverage of abnormal operating procedures in nuclear power plants | |
| Dalapatu et al. | Alarm allocation for event-based process alarm systems | |
| GB2536567A (en) | System for supporting operation during plant accidents and method for supporting operation during plant accidents | |
| Vásquez-Capacho et al. | An additional layer of protection through superalarms with diagnosis capability | |
| Demichela et al. | How to avoid the generation of logic loops in the construction of fault trees | |
| Hollender et al. | Intelligent alarming | |
| Adnan | Performance assessment and systematic design of industrial alarm systems | |
| Oeing et al. | preHAZOP: Graph‐Based Safety Analysis for Early Integration into Automated Engineering Workflows |
Legal Events
| Date | Code | Title | Description |
|---|---|---|---|
| 121 | Ep: the epo has been informed by wipo that ep was designated in this application |
Ref document number: 17840637 Country of ref document: EP Kind code of ref document: A1 |
|
| NENP | Non-entry into the national phase |
Ref country code: DE |
|
| 122 | Ep: pct application non-entry in european phase |
Ref document number: 17840637 Country of ref document: EP Kind code of ref document: A1 |