WO2018016037A1 - 最適メニュー決定システム、最適メニュー決定方法、及びプログラム - Google Patents
最適メニュー決定システム、最適メニュー決定方法、及びプログラム Download PDFInfo
- Publication number
- WO2018016037A1 WO2018016037A1 PCT/JP2016/071312 JP2016071312W WO2018016037A1 WO 2018016037 A1 WO2018016037 A1 WO 2018016037A1 JP 2016071312 W JP2016071312 W JP 2016071312W WO 2018016037 A1 WO2018016037 A1 WO 2018016037A1
- Authority
- WO
- WIPO (PCT)
- Prior art keywords
- customer
- month
- rate
- prediction model
- evaluation
- Prior art date
- Legal status (The legal status is an assumption and is not a legal conclusion. Google has not performed a legal analysis and makes no representation as to the accuracy of the status listed.)
- Ceased
Links
Images






Classifications
-
- G—PHYSICS
- G06—COMPUTING OR CALCULATING; COUNTING
- G06Q—INFORMATION AND COMMUNICATION TECHNOLOGY [ICT] SPECIALLY ADAPTED FOR ADMINISTRATIVE, COMMERCIAL, FINANCIAL, MANAGERIAL OR SUPERVISORY PURPOSES; SYSTEMS OR METHODS SPECIALLY ADAPTED FOR ADMINISTRATIVE, COMMERCIAL, FINANCIAL, MANAGERIAL OR SUPERVISORY PURPOSES, NOT OTHERWISE PROVIDED FOR
- G06Q50/00—Information and communication technology [ICT] specially adapted for implementation of business processes of specific business sectors, e.g. utilities or tourism
- G06Q50/06—Energy or water supply
Definitions
- the present invention relates to an optimal menu determination system, an optimal menu determination method, and a program.
- Patent Document 1 acquires virtual power consumption data for a predetermined time for one day according to an input from a user terminal, and uses the virtual power consumption data for a predetermined time for one day for the predetermined time.
- Teaching an electricity bill estimation system that obtains at least one month's worth of data for each day and each time zone by associating each time zone information categorized by 1 with each of all date information for at least one month ing.
- the electricity bills for various charge plans are calculated based on the power consumption data for each day and each time period for January and the actual monthly power consumption data.
- the present invention is connected to at least one customer terminal via a communication network, and for each of the at least one customer, a predicted value of monthly power usage of the customer.
- a database storing weather data for each day of each month of at least one year, customer-specific calendar data for each of the at least one customer, and customer-specific monthly power usage data;
- At least weather data for estimation for each day of each month and calendar data for estimation specific to the customer are acquired from the database, and at least weather data for estimation for each day of the month and the A prediction model generation unit that generates a first prediction model for predicting the monthly power usage of the customer based on the calendar data for estimation unique to the customer;
- Weather data for evaluation for each day of each month of at least a plurality of years and calendar data for customer-specific evaluation for the next year are acquired from the database, and the weather data for evaluation and the calendar for evaluation are acquired.
- the customer's monthly power usage prediction, wherein the generated first prediction model constitute
- the present invention is connected to a terminal of at least one customer via a communication network, and the weather data for each day of each month of at least one year and the at least one customer.
- a power rate plan evaluation system including a customer-specific calendar data, a database storing customer-specific monthly power consumption data, a prediction model generation unit, and a rate plan evaluation unit.
- a method for evaluating each of a plurality of power rate plans using a predicted value of monthly power usage of the customer for each of the customers A prediction model generation unit acquiring weather data for each day of each month and calendar data unique to the customer from the database; The prediction model generation unit obtains at least weather data for estimation for each day of each month and calendar data for estimation specific to the customer from the database, and at least estimates for each day of each month Generating a first prediction model for predicting monthly power usage of the customer based on weather data for the customer and calendar data for estimation specific to the customer; The price plan evaluation unit obtains weather data for evaluation for each day of each month of at least a plurality of years and calendar data for customer-specific evaluation for the next year from the database, and the weather data for evaluation And the calendar data for evaluation, and the generated first forecast model constitutes a number of sets equal to the number of years of the plurality of years of the weather data for evaluation And calculating a predicted value of the power usage amount as a predicted distribution.
- the present invention is connected to at least one customer terminal via a communication network, and each day of weather data for each month of at least one year, and the at least one customer's
- a power rate plan evaluation system including a database storing each customer-specific calendar data, customer-specific monthly power usage data, a prediction model generation unit, and a rate plan evaluation unit;
- a program that, for each customer, executes a method for evaluating each of a plurality of power rate plans using a predicted value of monthly power usage of the customer, the method comprising: A prediction model generation unit acquiring weather data for each day of each month and calendar data unique to the customer from the database;
- the prediction model generation unit obtains at least weather data for estimation for each day of each month and calendar data for estimation specific to the customer from the database, and at least estimates for each day of each month Generating a first prediction model for predicting monthly power usage of the customer based on weather data for the customer and calendar data for estimation specific to the customer;
- the price plan evaluation unit obtains weather data for evaluation for each day of
- FIG. 2 is a diagram illustrating a hardware configuration of a customer terminal 116-i, a person-in-charge terminal 118-j, and an operator terminal 112.
- FIG. 2 is a diagram illustrating a hardware configuration of a firewall 104 and a Web server 106.
- FIG. It is a figure which shows the hardware constitutions of the application server.
- 2 is a diagram illustrating a hardware configuration of a database server 110.
- FIG. It is a figure which shows the production
- the optimum menu determination system of the present invention is not limited to the determination of the optimal menu of the electricity rate plan, but the optimal menu of the gas rate plan, the optimal menu of the water rate plan, the optimal menu of the crude oil rate plan, the iron ore rate plan.
- the optimal menu of the product, and the optimal menu of the bauxite rate plan i.e., a product used as an energy source or as a raw material for an industrial product, traded in the market under the relationship of supply and demand, e.g. package
- the present invention can also be applied to the determination of the optimal menu for a price plan for a product having a price plan such as a price.
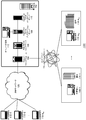
- FIG. 1 is a diagram showing a configuration of a communication system for implementing an optimum menu determining method according to the present invention.
- the electric power company 102 includes a firewall 104, a Web server 106, an application server 108, a database server 110, and an operator terminal 112.
- the customer terminal 116-i is connected to the firewall 104 of the power company 102 via the intranet 122.
- the person-in-charge terminal 118-j is connected to the firewall 104 of the power company 102 via the communication network 120.
- the customer terminal 116-i transmits the power consumption data, the peak rate, the weekend rate, and the like, which are the sources of the power consumption of the customer i, to the application server 108 and the database server 110 of the power company 102 via the intranet 122.
- the customer terminal 116-i receives data indicating the power usage amount, the power charge, and the optimum charge plan of the customer i from the application server 108 and the database server 110 of the power company 102 via the intranet 122.
- the person-in-charge terminal 118-j is owned by a sales person, and is used for receiving data indicating an optimum rate plan from the application server 108 and the database server 110.
- the communication network 120 is a circuit-switched network such as a public switched telephone network (PSTN) or a packet-based network such as the Internet.
- Communication network 120 includes any network that provides data communication via wireless signals, at least in part.
- Optional networks include, for example, wireless local area networks (WLANs) that use WiFi / WiMax communications.
- WLANs wireless local area networks
- the internal networking of the communication network 120 may use technologies such as the IMS architecture described in 3GPP. Any network may be implemented as a corporate or campus corporate network or as a “hot spot” in a general public place such as an airport, coffee shop, etc.
- the communication network 112 is normally used for data communication, but may be a network that can transfer voice communication such as a VoIP call.
- the communication network 112 further includes one or more access points that provide a wireless connection to a plurality of personnel terminals 118-j. Access points include base stations, base station routers, and access networks.
- the intranet 122 is an in-company network that improves convenience by using Internet technology and increases safety by restricting accessible customer terminals 116-i.
- the intranet 122 may be a VPN (Virtual Private Network) implemented using an MPLS (Multi Protocol Label Switching) architecture.
- VPN Virtual Private Network
- MPLS Multi Protocol Label Switching
- Customer terminal 116-i is typically a general desktop computer, but is a smartphone, tablet terminal, cellular phone, personal digital assistant, text messaging device, pager, network interface card, notebook computer, and personal computer -It may be a digital assistant (PDA).
- Customer terminals 116-i can communicate by exchanging information over an air interface (or wireless communication link) that includes several channels, such as a traffic channel, a signaling channel, a paging channel, and the like.
- the person-in-charge terminal 118-j is a smartphone, tablet terminal, cellular phone, personal digital assistant, text messaging device, pager, network interface card, notebook computer, desktop computer, and personal digital assistant (PDA). There may be.
- Personnel terminal 118-j can communicate by exchanging information over an air interface (or wireless communication link) that includes several channels, such as a traffic channel, a signaling channel, a paging channel, etc. .
- Air interface channels are defined according to one or more wireless communication protocols used by the communication system 100.
- an air interface channel operating according to code division multiple access (CDMA) is defined by an orthogonal code that modulates a radio signal used to transmit information over the air interface.
- the channel of the air interface may also be determined by the frequency of the carrier used to transmit information over the air interface.
- CDMA code division multiple access
- OFDMA orthogonal frequency division multiple access
- one or more responsible terminals 118-j may share multiple orthogonal frequencies or tones.
- the power company 102 may be a server room of the power company.
- the firewall 104 operates in the transport layer, which is an upper protocol of IP, and is used for communications that require reliability to perform window control, retransmission control, congestion control for Web browsing, mail transmission / reception, file transfer, etc.
- TCP Transmission Control Protocol
- TCP Transmission Control Protocol
- Real-time such as voice calls, video streaming, multicast communication, broadcast communication, and small amounts of data transfer
- UDP User Datagram Protocol
- UDP User Datagram Protocol
- the Web server 106 receives the HTTP request from the Web browsers of the customer terminal 116-i and the person-in-charge terminal 118-j and returns the response.
- the application server 108 executes business logic in response to a processing request from the Web server 106 and makes a data reference or update request to the database server 110 if necessary.
- the database server 110 mainly manages data, executes a data reference or update processing request from the application server 108, and returns a result.
- the application server 108 When the request is first received from the browser of the customer terminal 116-i and the person-in-charge terminal 118-j, the application server 108 generates an identifier for uniquely identifying the browser, and sends it to the Web application on the Web server 106. Pass that identifier. After that, the application server holds information on the Web browser in an external resource that is sharable with the database server 110 and is permanent, using the identifier as a key. The Web server 106 passes the identifier received from the application server 108 to the browser of the customer terminal 116-i and the person-in-charge terminal 118-j.
- an identifier can be set for the cookie by the application server 108 by passing the cookie as an argument when the Web server 106 and the application server 108 are called.
- information can be acquired by referring to the external resource based on the identifier set in the application server 108.
- FIG. 2 is a diagram showing the hardware configuration of the customer terminal 116-i, person-in-charge terminal 118-j, and operator terminal 112.
- the customer terminal 116-i includes a CPU 202, a memory 204, a storage device 206, an input unit 208, a display unit 210, and a transmission / reception interface 212.
- the CPU 202 implements various functions by reading the program stored in the storage device 206 into the memory 204 and executing it.
- the memory 204 includes, for example, a random access memory (RAM) and / or a read-only memory (ROM).
- Storage device 206 includes a tape drive, floppy drive, hard disk drive, or compact disk drive.
- the input unit 208 receives data input, and includes, for example, a keyboard, a mouse, a trackball, a touch panel, a microphone, and the like.
- the display unit 210 includes, for example, a display and a speaker that output data.
- the customer terminal 116-i receives data indicating the power usage amount, the power rate, and the optimum rate plan of the customer i from the application server 108 and the database server 110. Can be printed out.
- the transmission / reception interface 212 accesses the Web server 106 via the communication network 120 and the intranet 122 and transmits an HTTP request to the Web server 106. Further, the transmission / reception interface 212 receives information such as a customer id, a person-in-charge id, and a password input on the web browser displayed on the display unit 210 in response to the response to the HTTP request from the web server 106. Send to. Thereby, the login to the optimum menu determination system by the customer i and the person in charge j is completed.
- FIG. 3 is a diagram illustrating a hardware configuration of the firewall 104 and the Web server 106.
- the firewall 104 and the Web server 106 include a CPU 302, a memory 304, a storage device 306, an input unit 308, an output unit 310, and a transmission / reception interface 312.
- the storage device 306 may be a hard disk drive, a solid state drive, a flash memory, or the like that stores various data and programs.
- the CPU 302 implements various functions by reading the program stored in the storage device 306 into the memory 304 and executing it.
- the transmission / reception interface 312 is an interface for connecting to the communication network 120 and the intranet 122, and is an adapter for connecting to Ethernet (registered trademark), a modem for connecting to a public telephone line network, or the like.
- the input unit 308 may be a keyboard, a mouse, a trackball, a touch panel, a microphone, or the like that receives data input.
- the output unit 310 may be a display, a printer, a speaker, or the like that outputs data.
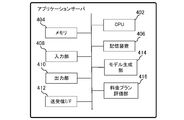
- FIG. 4 is a diagram illustrating a hardware configuration of the application server 108.
- the application server 108 includes a CPU 402, a memory 404, a storage device 406, an input unit 408, an output unit 410, a transmission / reception interface 412, a model generation unit 414, and a charge plan evaluation part 416.
- the CPU 402, the memory 404, the storage device 406, the input unit 408, the output unit 410, and the transmission / reception interface 412 are the same as those of the firewall 104 and the web server 106 described above.
- the first predictive model includes at least a cooling index (Cooling Degree Days (CDD)) “E (CDD) (k)” of a month k and a heating index (Heating Degree Days (HDD)) “E (HDD ) of the month k.
- the model generation unit 414 can estimate the parameters of the first linear prediction model by regression analysis.
- the first prediction model receives at least weather data including a cooling index and a heating index and calendar data including business days D 1 (i, k) and holiday days D 2 (i, k) as input. It may be a structured neural network (NN) that outputs a predicted value P * (i, k) of power consumption for each.
- the power reference usage P 1 (i) of the business day of the customer i is changed according to special circumstances such as a large change in the scale of facilities such as the cooling and heating of the customer i.
- the holiday reference power consumption P 2 (i) and the power reference usage P (use) (CSpe) (i, k) specific to the customer i for the month k may be added to the input of the structured NN.
- the model generation unit 414 may learn the structured NN using a well-known forgetting structure learning algorithm or a generative structure learning algorithm using the power usage data P (i, k) as teacher data. it can.
- the CDD “ ⁇ T (CDD) (k, l) of the day l that can be obtained from the average temperature ⁇ l (k) of the day l (l 1,..., N (k)) and the temperature threshold ⁇ 0 for each k.
- the sum of the components of the predicted usage matrix for each time zone t (column sum of the predicted usage matrix P * (i, k, t)) is the monthly power usage predicted by the first prediction model. Is equal to the predicted value P * (i, k).
- the rate plan evaluation unit 416 acquires the night rate R (Night) (i, k) and the weekend rate R (we) (i, k) for each month k from the rate plan database 514 of the database server 110, Using the predicted value P * (i, k) of power usage per month k and the night rate R (Night) (i, k), the predicted value P * (Night) (i ) of night usage per month k , K) and the predicted value P * (i, k) of the electric power consumption per month k and the weekend end rate R (we) (i, k), the predicted value of the weekend usage per month k P * (we) (i, k) can be obtained.
- the charge plan evaluation unit 416 can determine the power usage amount of the peak time for each month k of the customer i by using the same method using the peak rate of the month i of the customer i.
- the peak rate is the ratio of the amount of power used during the peak hour, for example, from 1 pm to 4 pm in summer, out of the daily power usage of the power usage.
- the night rate is the ratio of the amount of power used during the night, for example, from 22:00 to 8:00 the next morning, out of the daily power usage.
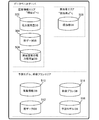
- FIG. 5 is a diagram illustrating a hardware configuration of the database server 110.
- the database server 110 includes a customer information area, a person in charge area, a prediction model, and a charge plan area.
- the prediction model and rate plan area includes a weather information database 510, a calendar data database 512, a rate plan database 514, and a prediction model database 516.
- the calendar data database 504 stores the number of business days D 1 (i, k), the number of holidays D 2 (i, k), the business days, and the dates of holidays for the month i in the n-th year. These data may have different business days and holidays during the Golden Week, year-end and New Year business days and holidays, company establishment anniversary dates, etc., depending on the specific circumstances of the customer i.
- the customer-specific electric power consumption database 506 stores electric power reference usage P (use) (CSpe) (i, k) specific to the customer i such as business cycles and trends such as production.
- the customer information area may include a customer phone number, a customer mobile phone number, an address, an e-mail address, a homepage URL, the number of employees, and the like.
- the person-in-charge database stores a “person in charge id” for identifying the person in charge j, a code for identifying the region in charge of the person in charge j, the device identifier of the person-in-charge terminal carried by the person in charge j, and the like. .
- the weather data database 510 may store the weather, humidity, atmospheric pressure, wind power, daylight hours, etc. of the day 1 for every month k of the (n ⁇ m) th year.
- the calendar data database 512 stores a normal calendar that does not depend on the customer i.
- a normal calendar not depending on the customer i includes the number of business days D 1 (k) and the number of holiday days D 2 (k) in the month k of the nnth and nth years.
- Each rate plan o can include, for example, “Economy Night” plan, “Family Time (Plan 1)”, “Family Night (Plan 2)”, “Light Peak Shift” plan, etc.
- the prediction model is a linear prediction model
- the prediction model database can store constants and regression coefficients, and when the prediction model is a structured neural network, it stores coupling coefficients between units. be able to.
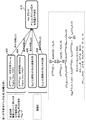
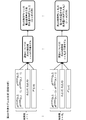
- FIG. 6 is a diagram illustrating a procedure for generating a prediction model as a linear regression model.
- the present invention creates a first prediction model based on meteorological data and almanac data for the last N TR annually, using a first prediction model created using the weather data of the past N EV year, calculating a predicted value of the power usage per month k of 1 year following years, the predicted value of the power usage of N EV street corresponding to the meteorological data of N EV year as N EV number of scenarios (predict distribution) To do.
- N (k) is the number of days in month k
- N (k) 28, 30 or 31.
- the temperature threshold value ⁇ 0 is, for example, 18 ° C.
- the model generation unit 414 calculates the cooling index (CDD) “E (CDD) (k)” of the month k by the formula (Block 602).
- CDD is an index representing the amount of energy required to satisfy the cooling demand.
- max ( ⁇ l (k) ⁇ 0 , 0) indicates that the larger of ⁇ l (k) ⁇ 0 and 0 is selected.
- the model generation unit 414 calculates the heating index (HDD) “E (HDD) (k)” of the month k by the formula (Block 604).
- the HDD is an index that represents the amount of energy required to satisfy the heating demand.
- the model generation unit 414 retrieves the number of business days D 1 (i, k) and the number of holidays D 2 (i, k) of the customer i in the month k of the (n ⁇ m) th year from the calendar data database 504 in the customer area of the database server 110. ) (Blocks 606 and 608). here, It is.
- Model generating unit 414 a set of variables from the n-m year of the n-1_Nen'nokako N TR year from customer i [E (CDD) (k ), E (HDD) (k), D 1 ( i, k), D 2 (i, k)] using a large number of samples, a set of parameters unique to customer i [a (i), b 1 (i), b 2 (i), c 1 (i ), C 2 (i)] to generate a first prediction model represented by this set of parameters (block 610).
- the estimation process is performed by a general regression analysis method.
- the model generation unit 414 generates a parameter set [a (i), b 1 (i), b 2 (i), c 1 (i), c 2 (i)] representing the first prediction model from the database server 110, the database server 110 stores the parameter set [a (i), b 1 (i), b 2 (i), c 1 (i), c 2 (i)] in the prediction model database 516. .
- the estimation of the first prediction model parameter set [a (i), b 1 (i), b 2 (i), c 1 (i), c 2 (i)] is not for multiple customers, For each customer i. This is to prevent the occurrence of a model that does not match the usage status of individual customers when parameter estimation is performed using pool data of a plurality of customers.
- the parameter estimation is performed using a set of variables for 12 ⁇ N TR months to ensure the data for estimation.
- the estimation of the above parameters was performed using the cooling index of month k, the heating index of month k, and the calendar data of month k. If there is a special circumstance such as a change, the standard power usage P 1 (i) for business day of customer i, the standard power usage P 2 (i) for holiday, and the customer for the month k.
- the i-specific power reference usage amount P (use) (CSpe) (i, k) may be added as an explanatory variable of the first linear prediction model.
- the model generation unit 414 uses the power reference usage amount P (use) (CSpe) (customer i-specific business cycle such as production or the like from the customer-specific power usage database 506 of the database server 110. Read i, k). At this time, the regression equation of the predicted value P * (i, k) of the customer i's monthly power consumption is b 1 (i), b 2 (i), c 1 (i), c 2 (i). , And d 0 (i) are regression coefficients specific to customer i, And taking the natural logarithm of both sides, The relationship holds.
- P * (i, k) of the customer i's monthly power consumption is b 1 (i), b 2 (i), c 1 (i), c 2 (i).
- And d 0 (i) are regression coefficients specific to customer i, And taking the natural logarithm of both sides, The relationship holds.
- the model generation unit 414 retrieves the power reference usage amount P 1 (i) per day for the business day of the customer i and the reference power usage amount P 2 (per day for holidays) from the power usage database 502 of the database server 110. i) is read, and the power standard usage of the month k in the (n ⁇ m) th year, You may calculate according to. Power of month k for each of customer i, where b 1 (i), b 2 (i), b 3 (i), b 4 (i), and d 0 (i) are the regression coefficients specific to customer i The predicted value P * (i, k) of usage is If we take the natural logarithm of both sides, The relationship holds.
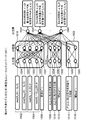
- FIG. 7 is a diagram showing a procedure for generating a first prediction model using a structural neural network.
- the amount of power and thermal energy used has various characteristics depending on the load affected by the operation schedule of factories, the load affected by weather conditions, and the load that shows a certain tendency almost every day.
- a usage amount may be accurately predicted by a linear model, or may be predicted by a non-linear model, and a usage amount prediction tool corresponding to various load characteristics is required.
- neural networks have the ability to model nonlinear functions and the ability to learn, and are applied in many fields including prediction.
- the neural network has an advantage that it can easily reflect the intention of the designer and can perform prediction with higher accuracy than other prediction methods.
- there are disadvantages such as that information about the optimal network structure cannot be obtained in advance, so that it must be learned through trial and error, and that the reason for the output is difficult because the inside is a black box.
- the calculation from the input layer to the intermediate layer is divided for each input factor group.
- learning is started with a large number of intermediate units, and a forgetting structure learning algorithm, which is a type of destructive structure learning that searches for an optimal network structure by deleting redundant units, and learning from a small number of intermediate units in advance.
- the above problem can be solved by adopting a generative structure learning algorithm that searches for an optimal network structure with a minimum unit addition by adding a unit if necessary.
- an input factor group 714 is an input factor group of meteorological factors (temperature effect), and the temperature effect is the largest uncertain factor for the customer i.
- the input factor group 716 is an input factor group of calendar data unique to the customer i.
- the model generation unit 414 of the application server 108 retrieves the average temperature ⁇ l of the day l and the temperature threshold ⁇ from the meteorological data database 510 of the database server 110 for each month k of the (n ⁇ m) th year. 0 is read, and the cooling index (CDD) “E (CDD) (k)” of month k is calculated according to equation (1) (block 702), and “E (CDD) (k)” is input to the input unit 718. To do.
- the model generation unit 414 calculates the heating index (HDD) “E (HDD) (k)” of the month k according to the equation (2) (block 704), and calculates “E (HDD) (k)” as the input unit 720. To enter.
- the model generation unit 414 inputs “customer id” i to one input unit 722 in the input factor group 714.
- the input unit 722 that inputs “customer id” i is used to implement a customer i specific mapping.
- the model generation unit 414 retrieves the number of business days D 1 (i, k) and the number of holidays D 2 (i, k) of the customer i in the month k of the (n ⁇ m) th year from the calendar data database 504 in the customer area of the database server 110. ) And D 1 (i, k) and D 2 (i, k) are input to the input units 724 and 726, respectively.
- the model generation unit 414 inputs “customer id” i to one input unit 728 in the input factor group 716.
- An input unit 728 for entering “customer id” i is used to implement a customer i specific mapping.
- the output of the input units 718, 720, and 722 of the input factor group 714 is weighted by the coupling factor and connected only to the intermediate unit of the input factor group 714.
- the outputs of the input units 724, 726, and 728 of the input factor group 716 are weighted by the coupling factor and are coupled only to the intermediate units in the input factor group 716.
- the output of each intermediate unit is weighted by the coupling coefficient and connected to the output unit 730.
- the output unit 730 outputs the predicted value P * (i, k) of the power consumption of the customer i for the month k.
- each customer i (i 1, ..., N cu) N TR year predicted value of the power usage of the content of the month k P * (i, k) with respect to the corresponding Learning by executing the structural learning algorithm with forgetting and the generative structural learning algorithm using the actual data P (i, k) of the power consumption per month k for NTR years of the customer i as the teacher data Can be made.
- the model generation unit 414 sends the coupling coefficient between units obtained as a result of learning to the database server 110, and the database server 110 stores the coupling coefficient in the prediction model database 516.
- the price plan evaluation unit 416 of the application server 108 performs the first based on the temperature data, calendar data, and in some cases, the power usage data for the past NTR years.
- N that of creating a predictive model, using the first prediction model that has been created, using the almanac data of meteorological data and the next year of the past N EV year, corresponding to the meteorological data of the past N EV year
- the predicted value of the electric power consumption according to EV is calculated.
- Rate plan evaluation unit 416 the predicted value of the power usage of the N EV as of the above, to present the predicted value of the power consumption of each month k of one year of the next year as a scenario of N EV Street.
- the rate plan evaluation unit 416 calculates the predicted value of the power usage for each time zone t of each month k from the predicted value of the annual power usage of NEV using the second prediction model. , by applying the predicted value of the power usage of each time period t of N EV street power rate plan, to create a scenario for the predicted value of the power rates for N EV street, each rate plan as a result of each scenario evaluate.
- FIG. 8 is a diagram showing a process for evaluating each rate plan using a predicted value of monthly power consumption.
- the rate plan evaluation unit 416 includes E (CDD) (k) and E (HDD) (k) in the n-N EV year and D 1 (i, k) and D that are calendar data in the n-th year.
- the rate plan evaluation unit 416 performs E (CDD) (k) and E (HDD) (k) in the n- (N EV -1) year and D 1 (i) which is calendar data in the n year.
- K) and D 2 (i, k) are used to calculate P * (i, k), which is a predicted value of the power consumption for each month k, using the first prediction model shown in FIG. To do.
- the rate plan evaluation unit 416 calculates E (CDD) (k) and E (HDD) (k) for each year from the n-N EV year to the n-1 year, and the n-th year.
- E (CDD) (k) and E (HDD) (k) are the calendar data of N EV .
- D 1 (i, k) and D 2 (i, k) which are the calendar data of N EV
- P * (i, k) of N EV sets is calculated, and the monthly power Find the predicted distribution of usage.
- the rate plan evaluation unit 416 uses the second prediction model to calculate each time zone t of month k from the predicted value P * (i, k) of power usage for each month k.
- a predicted usage matrix P * (i, k, t) of the power usage for each is calculated.
- FIG. 9 is a diagram showing a procedure for generating a second prediction model by regression analysis.
- the CDD “ ⁇ T (CDD) (k, l ⁇ 1)” and the HDD “ ⁇ T (HDD) (k, l ⁇ 1)” of l ⁇ 1 are calculated.
- the model generation unit 414 reads the number of business days D 1 (i, k) and the number of holidays D 2 (i, k) of the customer i in the month k of the (n ⁇ m) th year from the calendar data database 504 of the database server 110.
- f (i, t) be a constant term specific to customer i
- g 1 (i, t), g 2 (i, t), g 3 (i, t), g 4 (i, t), h 1 (i , T), h 2 (i, t), and r (i, t) are regression coefficients specific to the customer i
- the predicted usage P * (i, k, t) for each time zone t of the customer i is , If we take the natural logarithm of both sides, The relationship holds.
- Model generating unit 414 the n-m year from the n-1_Nen'nokako N TR years worth of the set of variables of the customer i [ ⁇ T (CDD) (k , l), ⁇ T (HDD) (k, l) , ⁇ T (CDD) (k, l ⁇ 1), ⁇ T (HDD) (k, l ⁇ 1), D 1 (i, k), D 2 (i, k), P * (i, k)]
- a set of parameters specific to customer i [f (i, t), g 1 (i, t), g 2 (i, t), g 3 (i, t), g 4 (i , T), h 1 (i, t), h 2 (i, t), r (i, t)]
- a prediction model represented by this set of parameters is generated.
- the estimation process is performed by a general regression analysis method.
- the model generation unit 414 includes a set of parameters [f (i, t), g 1 (i, t), g 2 (i, t), g 3 (i, t), g 4 (i, t) representing the prediction model.
- t), h 1 (i, t), h 2 (i, t), r (i, t)] are sent to the database server 110, and the database server 110 sends a set of parameters [f (i, t), g 1 (i, t), g 2 (i, t), g 3 (i, t), g 4 (i, t), h 1 (i, t), h 2 (i, t), r ( i, t)] is stored in the prediction model database 516.
- FIG. 10 is a diagram showing a procedure for generating the second prediction model using the structural neural network.
- the structural neural network that implements the second prediction model includes an input factor group 1018 that is an input factor group of meteorological factors (temperature effects), an input factor group 1020 that is an input factor group of calendar factors, and every month k. And an input factor group 1022 that is an input factor group of the power usage amount of the power consumption.
- the model generation unit 414 inputs “customer id” i to one input unit 1032 in the input factor group 1018.
- the input unit 1032 for inputting “customer id” i is used to realize mapping specific to customer i.
- the model generation unit 414 retrieves the number of business days D 1 (i, k) and the number of holidays D 2 (i, k) of the customer i in the month k of the (n ⁇ m) th year from the calendar data database 504 in the customer area of the database server 110. ) (Blocks 1008 and 1010) and D 1 (i, k) and D 2 (i, k) are input to input units 1034 and 1036, respectively.
- the model generation unit 414 inputs “customer id” i to one input unit 1038 in the input factor group 1020.
- the input unit 1038 for entering “customer id” i is used to implement a customer i specific mapping.
- the model generation unit 414 inputs, to the input unit 1040, the predicted value P * (i, k) of the month k power usage of the customer i calculated by the first prediction model of FIGS.
- the model generation unit 414 inputs “customer id” i to one input unit 1042 in the input factor group 1022.
- the input unit 1042 for entering “customer id” i is used to implement a mapping specific to customer i.
- the outputs of the input units 1024, 1026, 1028, 1030, and 1032 of the input factor group 1018 are weighted by the coupling coefficient and connected only to the intermediate unit of the input factor group 1018.
- the outputs of the input units 1034, 1036, and 1038 of the input factor group 1020 are weighted by the coupling factor and are coupled only to the intermediate units in the input factor group 1020.
- the outputs of the input units 1040 and 1042 of the input factor group 1022 are weighted by the coupling factor and are coupled only to intermediate units in the input factor group 1022.
- the output of each intermediate unit is weighted by the coupling factor and connected to output units 1044, 1046, 1048.
- the above-described neural network as the second prediction model has a predicted usage matrix P * (i, k) of the power usage for each time period t of month k from the (n ⁇ N) TR year to the (n ⁇ 1) year. , T), the measured value P (i, k, t) of the corresponding power usage for each time zone t of month k from the (n ⁇ N) TR year to the (n ⁇ 1) -th year is used as teacher data. And learning by executing a forgetting structure learning algorithm or a generative structure learning algorithm.
- the model generation unit 414 sends the coupling coefficient between units obtained as a result of learning to the database server 110, and the database server 110 stores the coupling coefficient in the prediction model database 516.
- the weather factor (temperature effect) input factor group 1018 includes N (k) units of cooling index input units and N (k) units of heating index input units.
- the charge plan evaluation unit 416 inputs max ( ⁇ 1 (k) ⁇ 0 , 0),..., Max ( ⁇ N (k) (k) ⁇ 0 , 0) from the first to the N (k) th. Input to the unit, and max ( ⁇ 0 ⁇ 1 (k), 0),..., Max ( ⁇ 0 ⁇ N (k) (k), 0) is 2N from the (N (k) +1) th unit. (K) Input to the unit.
- the rate plan evaluation unit 416 inputs “customer id” i into one input unit 1042 in the input factor group 1022.
- the output of the input unit of the input factor group 1018 is weighted by the coupling coefficient and connected only to the intermediate unit of the input factor group 1018.
- the charge plan evaluation unit 416 inputs calendar data for the nth year (next year) to the structured neural network as the second prediction model generated by the model generation unit 414 (blocks 1008 and 1010). That is, the rate plan evaluation unit 416 reads from the calendar data database 504 the number of business days D 1 (i, k) and the number of holidays D 2 (i, k) of the customer i in the month k of the nth year, and the input factor Input to the two input units 1034 and 1036 of the group 1020. The rate plan evaluation unit 416 inputs “customer id” i into one input unit 1038 in the input factor group 1020. The outputs of the three input units of the input factor group 1020 are weighted by the coupling factor and are only coupled to the intermediate units in the input factor group 1020.
- the rate plan evaluation unit 416 inputs a predicted value P * (i, k) of power consumption per month k obtained by the first prediction model shown in FIGS. 6 and 7 to the structured neural network. (Block 1014).
- the rate plan evaluation unit 416 inputs “customer id” i into one input unit 1042 in the input factor group 1022.
- the output of the input unit of the input factor group 1022 is weighted by the coupling coefficient and connected only to the intermediate unit of the input factor group 1022.
- each intermediate unit is weighted by the coupling coefficient and connected to output units 1044, 1046, 1048 in the output layer.
- the output layer there are equal N h number of output units to the number of time zones, the power of each time slot t of the n-1_Nenmadenitaiosuru N EV sets of month k from the n-N EV Year A predicted usage matrix P * (i, k, t) of the usage is output.
- the price plan evaluation unit 416 of the application server 108 uses the second prediction model generated by the model generation unit 414 to calculate each month of each nn year from the n-N EV year to the n-1 year of the customer i. based on the temperature factor data for k, using the calendar data of the month k of the next n-th year, corresponding from the n-N EV year to the n-1_Nenmadenokakutoshino N EV sets of temperature factor data
- the scenario of N EV of the predicted usage matrix P * (i, k, t) of the power usage for each time zone t is calculated.
- the predicted usage matrix P * (i, k, t) is calculated.
- the rate plan evaluation unit 416 obtains “ ⁇ T (CDD) (k, l)” and “ ⁇ T (HDD) (k, l)” in the n-th (N EV ⁇ 1) year, Using the calendar data D 1 (i, k) and D 2 (i, k), the second prediction model shown in FIG. A predicted usage matrix P * (i, k, t) is calculated. As described above, the rate plan evaluation unit 416 performs ⁇ T (CDD) (k, l) ”and“ ⁇ T (HDD) (in each month of each year from the n-N EV year to the n-1 year.
- the second predictive model uses N EV sets of P * (i, k, t) is calculated, and a predicted distribution of power consumption in hour units of each month is obtained.
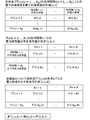
- FIG. 11 is a diagram showing a charge unit price matrix M (o, t), a predicted usage matrix P * (i, k, t), and a charge matrix R * (i, o, k).
- the unit price matrix M (o, t) is shown in the upper part of FIG.
- the row indicates each menu o
- the column indicates each time zone.
- the unit price matrix M (o, t) is a matrix of N M ⁇ N h .
- the predicted usage matrix P * (i, k, t) is shown in the middle of FIG.
- the row indicates each time zone
- the column indicates each month.
- the charge matrix R * (i, o, k) is shown in the lower part of FIG.
- rows indicate each charge plan
- columns indicate each month.
- the rate plan evaluation unit 416 generates a rate matrix R * (i, o, k) representing the predicted value of the electricity rate for each month k for the rate plan o of the customer i. Where you can ask It is.
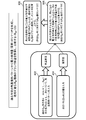
- Figure 12 is a flow chart of the method of the present invention in evaluating N M number of the rate plans o on the basis of the temperature factor data and almanac data.
- the method of the present embodiment can be implemented by executing software installed in the operator terminal 112 on the CPU 202 of the operator terminal 112.
- the operator terminal 112 can control the application server 108 and the database server 110 by executing the software.
- the average temperature ⁇ l (k) of the day l for each month k from the calendar data database 504, the past N TR years from the n-N TR years to the n-1 years
- the actual data P (i, k) and the like of the power consumption for every month k of m years are read (step S1206).
- the model generation unit 414 calculates the cooling index of the month k in the (n ⁇ m) th year from the read temperature threshold value ⁇ 0 and the average temperature ⁇ l (k) of the day l for each month k according to the equations (1) and (2).
- E (CDD) (k) and heating index E (HDD) (k) are calculated (step S1206).
- NTR is 5, for example.
- the model generation unit 414 estimates the prediction model represented by Expression (5) using a general regression analysis technique (step S1208), and the prediction model is In the case of a structured neural network, the actual power usage data P (i, k) for each month k of the (n ⁇ m) -th year of the customer i for the past NTR years is used as the teacher data, A first prediction model is generated by executing a forgetting structure learning algorithm or a generative structure learning algorithm using NTR year data as a learning sample (step S1208). The model generation unit 414 sends a set of parameters representing the first prediction model to the database server 110, and the database server 110 stores the set of parameters in the prediction model database 516.
- the model generation unit 414 calculates the CDD “of the day 1 of the month k in the (n ⁇ m) th year from the read temperature threshold ⁇ 0 and the average temperature ⁇ l (k) of the day 1 for each month k according to the equation (6).
- Model generating unit 414 a CDD and HDD above, the n-N second n-1_Nenmadenokako from TR Year N TR years worth of operating days D 1 (i customer i monthly k of each year, k) and the number of holidays D 2 (i, k), and the predicted value P * (i, k) of the power consumption for each month k of the (n ⁇ m) th year of the customer i estimated by the first prediction model.
- a second prediction model is generated (step S1212).
- the model generation unit 414 estimates the prediction model represented by Expression (8) using a general regression analysis method (step S1212), and the prediction model is In the case of a structured neural network, the actual measured value P (i, k, t) of the corresponding power usage for each time zone t of month k from the (n ⁇ N) TR year to the (n ⁇ 1) year is calculated.
- the second prediction model is generated by executing the forgetting structure learning algorithm and the generative structure learning algorithm using the above NTR year data as a learning sample by using the data for teacher data (step S1212).
- the model generation unit 414 sends a set of parameters representing the second prediction model to the database server 110, and the database server 110 stores the set of parameters in the prediction model database 516.
- the model generation unit 414 determines whether “customer id” i is smaller than N cu (step S1214). When the customer id “i” is smaller than N cu , the model generation unit 414 performs i ⁇ i + 1 processing (meaning processing for substituting the value of i + 1 for the variable i. The same applies hereinafter) (step S1216). The processing returns to step S1206. When the customer id "i is N cu or more, the processing is taken over by the rate plan evaluation unit 416.
- the rate plan evaluation unit 416 calculates the cooling index E of the month k in the (n ⁇ m) th year from the temperature threshold ⁇ 0 and the average temperature ⁇ l (k) of the day l for each month k according to the equations (1) and (2).
- (CDD) (k) and heating index E (HDD) (k) are calculated (step S1222).
- the rate plan evaluation unit 416 calculates the cooling index E (CDD) (k) and the heating index E (HDD) (k) of the month k in the ( n ⁇ m ) th year, and calendar data D 1 of the nth year (next year). Using (i, k) and D 2 (i, k) (evaluation sample), a predicted value P * (i, k) of power consumption for each month k is calculated by the first prediction model ( Step S1224).
- the rate plan evaluation unit 416 calculates the CDD “ ⁇ T ( CDD) (k, l) "and HDD” ⁇ T (HDD) (k, l) ", CDD” ⁇ T (CDD) (k, l-1) "on day l-1 of month k of the ( nm) -th year. Then, the HDD “ ⁇ T (HDD) (k, l ⁇ 1)” is calculated (step S1226).
- the rate plan evaluation unit 416 estimates the above-mentioned CDD and HDD, calendar data D 1 (i, k) and D 2 (i, k) of the nth year (next year), and the first prediction model. Using the predicted value P * (i, k) (evaluation sample) of customer i's power consumption per month k in the (n ⁇ m) th year, customer i's power usage per time slot t of month k The predicted usage matrix P * (i, k, t) is calculated (step S1228). The rate plan evaluation unit 416 uses the rate unit price matrix M (o, t) indicating the power rate for each time zone t of the rate plan o and the calculated predicted usage matrix P * (i, k, t).
- a charge matrix R * (i, o, k) indicating the monthly k power usage for each charge plan o of the customer i is generated (step S1230).
- the charge plan evaluation unit 416 stores the generated charge matrix R * (i, o, k) (step S1230).
- the rate plan evaluation unit 416 determines whether the “year index” m is smaller than N EV (step S1232). When the “year index” m is smaller than N EV , the rate plan evaluation unit 416 performs m ⁇ m + 1 processing (processing that substitutes the value of m + 1 for the variable m) (step S1234). The process returns to step S1222. If the “year index” m is equal to or greater than N EV , the rate plan evaluation unit 416 generates a rank for each rate plan o (step S1236) and displays the rank on the output unit 410. The price plan evaluation unit 416 determines whether or not “customer id” i is smaller than N cu (step S1238).
- the rate plan evaluation unit 416 performs the process of i ⁇ i + 1 (a process of substituting the value of i + 1 for the variable i) (step S1240). The process returns to S1220. If “customer id” i is greater than or equal to N cu , the process ends (step S1242).
- the rate plan evaluation unit 416 further reads out the night rate R (Night) (i, k) and weekend rate R (we) (i, k) of the customer i from the power consumption database 502 of the database server 110, and uses them at night.
- the predicted value PN * (i, k) of the amount and the predicted value PW * (i, k) of the weekend usage amount are expressed as Calculate according to
- the rate plan evaluation unit 416 assumes that the constant term specific to the customer i is a ′ (i) and the regression coefficients specific to the customer i are b ′ 1 (i) and b ′ 2 (i).
- the predicted value P * (max) (k) of the maximum power for each month k of customer i predicted as follows is calculated.
- the predicted value P * (max) (k) of the maximum power for each month k is considered when determining the basic charge.
- the application server 108 sends the evaluation result to the operator terminal 112, and the evaluation result is displayed on the display unit 210 of the operator terminal 112. Is done.
- the evaluation result of the customer i is sent to the customer terminal 116-i via the intranet 122 and displayed on the display unit 210 of the customer terminal 116-i.
- the evaluation result is sent to the person-in-charge terminal 118-j via the communication network 120 and displayed on the display unit of the person-in-charge terminal 118-j.
- the on-demand model is entered by entering the customer id without using the loop starting at step S1204 and the loop starting at step S1218 to batch process and save the results for all customer model generations.
- a system that performs the rate plan evaluation process from generation can also be used.
- the prediction model for each customer i is estimated and stored for all customers at once, but in response to the input of “customer id” i each time.
- a prediction model may be estimated and a price plan may be evaluated.
- FIG. 13 is a display screen of the ranking of each rate plan based on the rate merit rate, the merit price of each rate plan, and the merit rate.
- 13 is a screen displayed on the display unit 210 of the operator terminal 112, the customer terminal 116-i, and the person-in-charge terminal 118-j.
- This customer i is currently subscribed to the “business power” plan.
- the ranking is higher in the order of the “business high load factor” plan, the “business weekend” plan, and the “business high load factor TOU” plan.
- the average price of all scenarios is ⁇ 178,292 compared to the “business power plan” currently subscribed -It's cheaper. Therefore, the merit rate is -1.7%. In other words, it is 1.7% less expensive than the “business power” plan currently under contract.
- the second “business weekend” plan has an average price of ⁇ 140,777-cheaper for all scenarios compared to the current “business power” plan.
- the merit rate is -1.3%.
- the 3rd “Commercial High Load Factor TOU” plan has an average price of ⁇ 22,500-cheaper than the current “Business Power” plan. Yes. Therefore, the merit rate is -0.2%.
- FIG. 14 is a diagram in which the power standard usage due to a business cycle such as production unique to a customer or a trend is factorized and displayed.
- the broken line 1402 has shown the measured value P (i, k) of the electric power consumption for every month.
- a portion 1404 indicates the temperature effect component P (Tem) (i, k) in the measured value P (i, k) of the power consumption.
- a portion obtained by removing the temperature effect component “P (Tem) (i, k)” 1404 from the actual measurement value “P (i, k)” 1402 of the electric power consumption is a portion indicated by 1406.
- a portion obtained by taking a moving average of the portion 1406 is a portion indicated by 1408, and is a portion representing a trend P (Tre) (i, k) unique to the customer i.
- the trend “P (Tre) (i, k)” 1406 unique to the customer i and the temperature effect component “P (Tem) (i, k)” 1404 are combined with the actual measured value 1402 of the power consumption.
- the difference is the portion indicated by 1410.
- a portion indicated by 1410 is an irregular fluctuation component caused by a business cycle such as production unique to the customer i, a trend, or the like.
- ⁇ (i, k) be the residual between the measured value P (i, k) of the power usage and the predicted value P * (i, k) of the power usage estimated according to the equation (5).
- the rate plan evaluation unit 416 sets a parameter set specific to the customer i [a (i), b 1 (i), b 2 (i), c 1 (i), c 2 (i) estimated according to the equation (5).
- the temperature effect component P (Tem) (i, k) Calculate according to The rate plan evaluation unit 416 calculates the base power usage amount P (net) (i, k) of the month i of the customer i, which is a portion excluding the temperature effect component 1404, from the equation Calculate according to The rate plan evaluation unit 416 takes the moving average of P (net) (i, k) for M months, Accordingly, the trend power usage P (Tre) (i, k) representing the trend unique to the customer i is calculated.
- the tendency power usage amount P (Tre) (i, k) is represented by a portion indicated by 1408 in FIG.
- the trend power consumption P (Tre) (i, k) shows the tendency of the electricity usage fee excluding the temperature effect component P (Tem) (i, k), the circulation of the M month cycle, and the irregular fluctuation component Yes. Therefore, if the sum of the circulation of the M-month cycle and the irregular fluctuation component in the base power consumption P (net) (i, k) of month k is P (MR) (i, k), It becomes.
- the component of month k of customer i's M month cycle is given by taking the average of P (MR) (i, k) for each year, and expressed as P (cyc) (i, k),
- the rate plan evaluation unit 416 Accordingly, the irregular fluctuation component P (ir) (i, k) of the month i of the customer i is calculated.
- the factorization described above is based on a different approach from the regression equation that calculates the temperature sensitivity, and the residual of the regression equation and the irregular fluctuation component P (ir) (i, k) of the factorization are also different. is there. This is because it is difficult to interpret the residual in the product type regression analysis, and it is considered that it is not useful information for the customer.
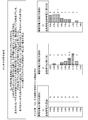
- FIG. 15 is a diagram showing the price merit.
- Three of the graph is displaying the benefits amount due to temperature variations of N EV year in the histogram.
- the value displayed in the histogram cell (on the right side of the histogram) is the number of scenarios belonging to that class.
- the histogram on the left is for the price plan “business power” that customer i currently contracts. Since the displayed price merit is a comparison with the currently subscribed price plan, the price merit in this case is all zero.
- the histogram in the middle shows a comparison between the price plan “business power” that customer i currently contracts and the price plan “business TOU”, and the histogram on the right shows that customer i currently has a contract. This shows a comparison between the current charge plan “business power” and the charge plan “high added power for business use”. “*” On the right side of the histogram indicates the class to which the average value belongs.
- the price merit is indicated by a negative value, that is, the rate plan “business power” and the rate plan “business high added-rate power” rather than the rate plan “business power” that the customer i currently contracts with If at least one of the price plans is cheaper, it is better to switch from the current rate plan “business power” to the rate plan “business power” or the rate plan “high added power for business”. In the example shown in the figure, all the price merits are positive values, which indicates that the current rate plan “business power” is optimal.
- FIG. 16 shows the merit rate distribution.
- the histogram on the left is for the price plan “business power” that customer i currently contracts. Since the displayed merit rate is a comparison with the currently subscribed rate plan, the price merit in this case is all zero.
- the histogram in the middle shows a comparison between the price plan “business power” that customer i currently contracts and the price plan “business TOU”, and the histogram on the right shows that customer i currently has a contract. This shows a comparison between the current charge plan “business power” and the charge plan “high added power for business use”. “*” On the right side of the histogram indicates the class to which the average value belongs.
- the merit rate is shown as a negative value, that is, the rate plan “business power” and the rate plan “business high added rate power than the rate plan“ business power ”that the customer i currently contracts If at least one of the price plans is cheaper, it is better to switch from the current rate plan “business power” to the rate plan “business power” or the rate plan “high added power for business”. In the example shown in the figure, all the price merits are positive values, which indicates that the current rate plan “business power” is optimal.
- the value displayed in the histogram cell is the number of scenarios belonging to that class. Since the rate merit rate and the rate merit amount are calculated for each year, the shape of the histogram may not match between the rate merit rate and the rate merit amount.
- FIG. 17 is a diagram showing a display example of the merit rate and merit amount of each rate plan.
- FIG. 17 shows the rate plan “business power” that customer i currently contracts, three rate plans “business high load factor power”, “business weekend”, and “business high load factor TOU”.
- the merit ratio and merit price are discounted average values.
- the merit rate of the charge plan “business high load factor power” with respect to the charge plan “business power” is “ ⁇ 1.7%”, and the average discount price is “ ⁇ 178,292”.
- the merit scenario in this case is 25, indicating that all scenarios have merit.
- the merit rate of the rate plan “business weekend” with respect to the rate plan “business power” is “ ⁇ 1.3%”, and the average discount price is “ ⁇ 140,777”.
- the merit scenario in this case is 25, indicating that all scenarios have merit.
- the merit rate of the rate plan “business high load factor TOU” with respect to the rate plan “business power” is “ ⁇ 0.2%”, and the average discount price is “ ⁇ 22,500”. There are 20 scenarios that have merit in this case. In this table, it can be seen that the rate plan “business high load factor power” is optimal for customer i.
- FIG. 17 shows the price merit and merit rate of the charge plan “business high load factor power” with respect to the charge plan “business power” for each scenario.
- “*” On the right side of the histogram indicates the class to which the average value belongs.
- Each step of the above method according to the present invention may be performed by an operator terminal (not shown) having a CPU and a memory.
- the software program used to execute the above method may be stored in a program storage device such as a digital data storage medium, and these program storage devices Are machine-readable or computer-readable, and these computers or machines encode program instructions as machine-executable programs or computer-executable programs, and the encoded program instructions are the method of the present invention. Some or all of these steps are executed.
- the program storage device can be, for example, a digital storage, a magnetic storage medium such as a magnetic disk and magnetic tape, a hard drive, or an optically readable digital data storage medium.
- the present invention is a combination of software and / or software and hardware, for example, an application specific integrated circuit (ASIC), a field programmable gate array (FPGA), It may be implemented using a general purpose computer, or any other hardware equivalent.
- ASIC application specific integrated circuit
- FPGA field programmable gate array
- the system for determining the electricity rate optimal menu has been described by taking as an example the evaluation of a plurality of electricity rate plans based on the predicted value of the power usage.
- the optimum menu determination system of the present invention is not limited to the determination of the optimal menu of the electricity rate plan, but the optimal menu of the gas rate plan, the optimal menu of the water rate plan, the optimal menu of the crude oil rate plan, and the optimal of the iron ore rate plan Menus and determination of optimal menus for bauxite rate plans, ie products used as energy sources or as raw materials for certain industrial products that are traded in the market under the relationship between supply and demand, eg package prices It is also possible to apply to the determination of the optimal menu of the price plan for products with different price plans A.
Landscapes
- Business, Economics & Management (AREA)
- Health & Medical Sciences (AREA)
- Engineering & Computer Science (AREA)
- Economics (AREA)
- Public Health (AREA)
- Water Supply & Treatment (AREA)
- General Health & Medical Sciences (AREA)
- Human Resources & Organizations (AREA)
- Marketing (AREA)
- Primary Health Care (AREA)
- Strategic Management (AREA)
- Tourism & Hospitality (AREA)
- Physics & Mathematics (AREA)
- General Business, Economics & Management (AREA)
- General Physics & Mathematics (AREA)
- Theoretical Computer Science (AREA)
- Management, Administration, Business Operations System, And Electronic Commerce (AREA)
- Supply And Distribution Of Alternating Current (AREA)
Abstract
少なくとも1年の各月の各日ごとの気象データと、該少なくとも一の顧客の各々の顧客固有の暦データと、顧客固有の月単位の電力使用量データとを格納するデータベースと、少なくとも、該各月の各日ごとの推計用の気象データと該顧客固有の推計用の暦データとを該データベースから取得し、少なくとも、該各月の各日ごとの推計用の気象データと該顧客固有の推計用の暦データとに基づいて、該顧客の月単位の電力使用量を予測する第1の予測モデルを生成する予測モデル生成部と、少なくとも複数の年の各月の各日ごとの評価用の気象データと次の年の顧客固有の評価用の暦データとを該データベースから取得し、該評価用の気象データと該評価用の暦データとを使用して、該生成した第1の予測モデルにより、該評価用の気象データの該複数の年の数と等しい数の組を構成する、該顧客の月単位の電力使用量の予測値を予測分布として算出する料金プラン評価部とを含む。
Description
本発明は、最適メニュー決定システム、最適メニュー決定方法、及びプログラムに関する。
現在、電気事業者は、顧客の事業形態等に応じた多種多様な電力料金プランを提供する。近い将来、電気料金単価を数時間ごとに切り変える多段階電気料金プランや、電力の需給状況に応じて電気料金単価をリアルタイムに切り替えるような電気料金プランなども将来的には実現すると考えられる。
一方、需要家(顧客)側の観点から、経済発展に伴う職種の多様化がもたらしたものとして、勤務時間等の多様化がある。現在、夜間勤務や交代制勤務など様々な勤務形態が生まれ、企業での業務に充てられる時間帯もまちまちとなってきている。
ここで、顧客にとっては、何れの料金プランが最も自身に適しているのか、また現在契約している料金プランは自身にとって最適であるのかが最大の関心事である。しかしながら、各料金プランの比較検討には、上記のように料金プランが複雑多様化しているために各料金プランの熟知及び計算等の膨大な労力を必要とし、大変な困難を伴う。顧客の事業規模が大きくなればなるほど、その困難性は高くなる。
さらに、従来、顧客の電気料金プランを試算する際に、前年度の電力使用量を用いて将来の電気料金の予測としていたが、このような方法では、電気料金の算定根拠となる電力使用量の予測において、多大な影響を与える気温等の要素を反映できておらず、気温等の不確実性を考慮した試算を行うことができなかった。
例えば、特許文献1は、ユーザの端末からの入力に従って1日分の所定時間毎の仮想使用電力量データを取得し、この1日分の所定時間毎の仮想使用電力量データを、該所定時間で区分された各時間帯情報と少なくとも1月分の全日付情報のそれぞれに対応づけることで、少なくとも1月分各日及び各時間帯の使用電力量データを取得する電気料金試算システムを教示している。上記の電気料金試算システムにおいては、1月分各日及び各時間帯の使用電力量データと実際の月間使用電力量データとに基づいて各種料金プランの電気料金を計算する。
しかしながら、特許文献1の試算方法では、電気料金の算定根拠となる電力使用量の予測にお
いて、多大な影響を与える気温等の要素を予測の際に反映できておらず、気温等の不確実性を考慮した試算を行うことができない。
いて、多大な影響を与える気温等の要素を予測の際に反映できておらず、気温等の不確実性を考慮した試算を行うことができない。
本発明の第1の態様によれば、本発明は、通信ネットワークを介して少なくとも一の顧客端末に接続され、該少なくとも一の顧客の各々について、当該顧客の月単位の電力使用量の予測値を使用して、複数の電力料金プランの各々を評価するシステムであって、
少なくとも1年の各月の各日ごとの気象データと、該少なくとも一の顧客の各々の顧客固有の暦データと、顧客固有の月単位の電力使用量データとを格納するデータベースと、
少なくとも、該各月の各日ごとの推計用の気象データと該顧客固有の推計用の暦データとを該データベースから取得し、少なくとも、該各月の各日ごとの推計用の気象データと該顧客固有の推計用の暦データとに基づいて、該顧客の月単位の電力使用量を予測する第1の予測モデルを生成する予測モデル生成部と、
少なくとも複数の年の各月の各日ごとの評価用の気象データと次の年の顧客固有の評価用の暦データとを該データベースから取得し、該評価用の気象データと該評価用の暦データとを使用して、該生成した第1の予測モデルにより、該評価用の気象データの該複数の年の数と等しい数の組を構成する、該顧客の月単位の電力使用量の予測値を予測分布として算出する料金プラン評価部とを含む、電気料金プラン評価システムである。
少なくとも1年の各月の各日ごとの気象データと、該少なくとも一の顧客の各々の顧客固有の暦データと、顧客固有の月単位の電力使用量データとを格納するデータベースと、
少なくとも、該各月の各日ごとの推計用の気象データと該顧客固有の推計用の暦データとを該データベースから取得し、少なくとも、該各月の各日ごとの推計用の気象データと該顧客固有の推計用の暦データとに基づいて、該顧客の月単位の電力使用量を予測する第1の予測モデルを生成する予測モデル生成部と、
少なくとも複数の年の各月の各日ごとの評価用の気象データと次の年の顧客固有の評価用の暦データとを該データベースから取得し、該評価用の気象データと該評価用の暦データとを使用して、該生成した第1の予測モデルにより、該評価用の気象データの該複数の年の数と等しい数の組を構成する、該顧客の月単位の電力使用量の予測値を予測分布として算出する料金プラン評価部とを含む、電気料金プラン評価システムである。
本発明の第2の態様によれば、本発明は、通信ネットワークを介して少なくとも一の顧客の端末に接続され、少なくとも1年の各月の各日ごとの気象データと、該少なくとも一の顧客の各々の顧客固有の暦データと、顧客固有の月単位の電力使用量データとを格納するデータベースと、予測モデル生成部と、料金プラン評価部とを含む電力料金プラン評価システムにおいて、該少なくとも一の顧客の各々について、該顧客の月単位の電力使用量の予測値を使用して、複数の電力料金プランの各々を評価する方法であって、
予測モデル生成部が、該各月の各日ごとの気象データと該顧客固有の暦データとを該データベースから取得するステップと、
予測モデル生成部が、少なくとも、該各月の各日ごとの推計用の気象データと該顧客固有の推計用の暦データとを該データベースから取得し、少なくとも、該各月の各日ごとの推計用の気象データと該顧客固有の推計用の暦データとに基づいて、該顧客の月単位の電力使用量を予測する第1の予測モデルを生成するステップと、
料金プラン評価部が、少なくとも複数の年の各月の各日ごとの評価用の気象データと次の年の顧客固有の評価用の暦データとを該データベースから取得し、該評価用の気象データと該評価用の暦データとを使用して、該生成した第1の予測モデルにより、該評価用の気象データの該複数の年の数と等しい数の組を構成する、該顧客の月単位の電力使用量の予測値を予測分布として算出するステップとを含む、電気料金プラン評価方法である。
予測モデル生成部が、該各月の各日ごとの気象データと該顧客固有の暦データとを該データベースから取得するステップと、
予測モデル生成部が、少なくとも、該各月の各日ごとの推計用の気象データと該顧客固有の推計用の暦データとを該データベースから取得し、少なくとも、該各月の各日ごとの推計用の気象データと該顧客固有の推計用の暦データとに基づいて、該顧客の月単位の電力使用量を予測する第1の予測モデルを生成するステップと、
料金プラン評価部が、少なくとも複数の年の各月の各日ごとの評価用の気象データと次の年の顧客固有の評価用の暦データとを該データベースから取得し、該評価用の気象データと該評価用の暦データとを使用して、該生成した第1の予測モデルにより、該評価用の気象データの該複数の年の数と等しい数の組を構成する、該顧客の月単位の電力使用量の予測値を予測分布として算出するステップとを含む、電気料金プラン評価方法である。
本発明の第3の態様によれば、本発明は、通信ネットワークを介して少なくとも一の顧客端末に接続され、少なくとも1年の各月の各日ごとの気象データと、該少なくとも一の顧客の各々の顧客固有の暦データと、顧客固有の月単位の電力使用量データとを格納するデータベースと、予測モデル生成部と、料金プラン評価部とを含む電力料金プラン評価システムに、該少なくとも一の顧客の各々について、該顧客の月単位の電力使用量の予測値を使用して、複数の電力料金プランの各々を評価する方法を実行させるプログラムであって、該方法は、
予測モデル生成部が、該各月の各日ごとの気象データと該顧客固有の暦データとを該データベースから取得するステップと、
予測モデル生成部が、少なくとも、該各月の各日ごとの推計用の気象データと該顧客固有の推計用の暦データとを該データベースから取得し、少なくとも、該各月の各日ごとの推計用の気象データと該顧客固有の推計用の暦データとに基づいて、該顧客の月単位の電力使用量を予測する第1の予測モデルを生成するステップと、
料金プラン評価部が、少なくとも複数の年の各月の各日ごとの評価用の気象データと次の年の顧客固有の評価用の暦データとを該データベースから取得し、該評価用の気象データと該評価用の暦データとを使用して、該生成した第1の予測モデルにより、該評価用の気象データの該複数の年の数と等しい数の組を構成する、該顧客の月単位の電力使用量の予測値を予測分布として算出するステップとを含む、電気料金プラン評価プログラムである。
予測モデル生成部が、該各月の各日ごとの気象データと該顧客固有の暦データとを該データベースから取得するステップと、
予測モデル生成部が、少なくとも、該各月の各日ごとの推計用の気象データと該顧客固有の推計用の暦データとを該データベースから取得し、少なくとも、該各月の各日ごとの推計用の気象データと該顧客固有の推計用の暦データとに基づいて、該顧客の月単位の電力使用量を予測する第1の予測モデルを生成するステップと、
料金プラン評価部が、少なくとも複数の年の各月の各日ごとの評価用の気象データと次の年の顧客固有の評価用の暦データとを該データベースから取得し、該評価用の気象データと該評価用の暦データとを使用して、該生成した第1の予測モデルにより、該評価用の気象データの該複数の年の数と等しい数の組を構成する、該顧客の月単位の電力使用量の予測値を予測分布として算出するステップとを含む、電気料金プラン評価プログラムである。
その他、本願が開示する課題、及びその解決方法は、発明を実施するための形態の欄の記載、及び図面の記載等により明らかにされる。
本発明に従ったシステム及び方法によれば、担当者が気温変動の不確実性を考慮したうえで、顧客に料金プランを提案することが可能である。
また、使用量の要因分析を時系列で可視化したことで、顧客の設備変更や営業状態に関する情報を得ることができる。
さらに、顧客との対話やトレンドを参考に、翌一年間の使用量の増加見込みなどのオプション変更できるので、予測に顧客や営業担当者の計画や主観的な予測等を考慮する柔軟性を備えている。
本発明は様々な変更形態及び代替形態が可能であるが、本発明の一例としての実施形態が実施例として図面に示されており、本明細書で詳細に説明される。しかし、一例としての実施形態の本明細書における説明は、開示された特定の形態に本発明を限定することを意図するものではなく、本発明は、特許請求の範囲によって規定された本発明の趣旨及び範囲に入る全ての変更形態、同等形態、及び代替形態を含む。
以下では、一例として、電力使用量の予測値に基づく複数の電力料金プランの評価を例に挙げて、本発明の実施形態に係る電気料金最適メニューを決定するシステムを説明する。但し、本発明の最適メニュー決定システムは、電力料金プランの最適メニューの決定のみに限定されず、ガス料金プランの最適メニュー、水道料金プランの最適メニュー、原油料金プランの最適メニュー、鉄鉱石料金プランの最適メニュー、及びボーキサイト料金プランの最適メニューの決定、すなわち、エネルギー源としてあるいはある工業製品の原材料として使用される商品であって、需要と供給の関係の下で市場において取引され、例えば、パッケージプライス等の料金プランがある商品の料金プランの最適メニューの決定にも適用することが可能である。
(1) ネットワークの全体構成
図1は、本発明に従った最適メニューの決定方法を実装するための通信システムの構成を示す図である。
図1は、本発明に従った最適メニューの決定方法を実装するための通信システムの構成を示す図である。
通信システム100は、電力会社102と、顧客114-i(i=1,…,Ncu)と、担当者端末118‐j(j=1,…,Nag)と、通信ネットワーク120と、イントラネット122とを含んでいる。電力会社102は、ファイアウォール104と、Webサーバ106と、アプリケーションサーバ108と、データベースサーバ110と、オペレータ端末112とを含む。顧客114-iは、それぞれ、顧客端末116-i(i=1,…,Ncu)を備えている。顧客端末116-iは、イントラネット122を介して電力会社102のファイアウォール104に接続されている。担当者端末118‐jは、通信ネットワーク120を介して電力会社102のファイアウォール104に接続されている。顧客端末116-iは、イントラネット122を介して、電力会社102のアプリケーションサーバ108及びデータベースサーバ110に、顧客iの電力使用量の元となる電力消費データ、ピーク率、ウィークエンド率等を送信する。また、顧客端末116-iは、イントラネット122を介して、電力会社102のアプリケーションサーバ108及びデータベースサーバ110からの、顧客iの電力使用量、電力料金、及び最適な料金プランを示すデータを受信する。ここで、顧客端末のインデックスi(i=1,…,Ncu)は、顧客idに対応している。担当者端末118-jは、営業担当者が所有し、アプリケーションサーバ108及びデータベースサーバ110からの、最適な料金プランを示すデータの受信のために使用されるものである。ここで、担当者端末のインデックスj(j=1,…,Nag)は、営業担当者の担当者idに対応している。
通信ネットワーク120は、公衆交換電話ネットワーク(PSTN)等の回線交換ネットワーク又はインターネット等のパケット・ベース・ネットワークである。通信ネットワーク120は、少なくともその一部分に、無線信号を介してデータ通信を提供する任意のネットワークを含む。任意のネットワークは、例えば、WiFi/WiMax通信を使用する無線ローカル・エリア・ネットワーク(WLAN)を含む。通信ネットワーク120の内部ネットワーキングは、3GPPで説明されているIMSアーキテクチャ等の技術を使用しても良い。任意のネットワークは、会社又はキャンパスの企業ネットワークとして、又は空港、喫茶店、その他等の一般的な公共の場の「ホット・スポット」として実装されるものであっても良い。通信ネットワーク112は、通常、データ通信に対して使用されるが、VoIP呼等の音声通信を転送することができるネットワークであっても良い。通信ネットワーク112は、さらに、複数の担当者端末118-jへの無線接続を提供する1つ又は複数のアクセスポイントを含む。アクセスポイントには、基地局、基地局ルータ、アクセス・ネットワークが含まれる。
イントラネット122は、インターネットの技術を用いることで利便性を高め、且つアクセスできる顧客端末116-iを制限する事で安全性を高めた企業内ネットワークである。イントラネット122は、MPLS(Multi Protocol Label Switching)アーキテクチャを用いて実装されたVPN(Virtual Private Network)とすることができる。
顧客端末116-iは、通常は、一般的なデスクトップコンピュータであるが、スマートフォン、タブレット端末、セルラ電話、携帯情報端末、テキスト・メッセージング装置、ページャ、ネットワーク・インターフェイス・カード、ノートブックコンピュータ、及びパーソナル・ディジタル・アシスタント(PDA)であっても良い。顧客端末116-iは、トラフィック・チャネル、シグナリング・チャネル、ページング・チャネル等、いくつかのチャネルを含むエア・インターフェイス(又は無線通信リンク)を介して情報を交換することによって通信することができる。
担当者端末118-jは、スマートフォン、タブレット端末、セルラ電話、携帯情報端末、テキスト・メッセージング装置、ページャ、ネットワーク・インターフェイス・カード、ノートブックコンピュータ、デスクトップコンピュータ、及びパーソナル・ディジタル・アシスタント(PDA)であっても良い。担当者端末118-jは、トラフィック・チャネル、シグナリング・チャネル、ページング・チャネル等、いくつかのチャネルを含むエア・インターフェイス(又は無線通信リンク)を介して情報を交換することによって通信することができる。
エア・インターフェイスのチャネルは、通信システム100によって使用される1つ又は複数の無線通信プロトコルに従って定義される。例えば、符号分割多元接続(CDMA)に従って動作するエア・インターフェイスのチャネルは、情報を、エア・インターフェイスを介して送信するために使用される無線信号を変調する直交符号によって定義される。エア・インターフェイスのチャネルは、また、エア・インターフェイスを介して情報を送信するために使用される搬送波の周波数によって決定されてもよい。例えば、直交周波数分割多重接続(OFDMA)では、1つ又は複数の担当者端末118-jが複数の直交周波数、又はトーンを共用しても良い。
電力会社102は、電力会社のサーバ室であっても良い。ファイアウォール104は、IPの上位プロトコルであるトランスポート層で動作し、Webの閲覧、メールの送受信、ファイル転送等のためのウィンドウ制御、再送制御、輻輳制御を行う信頼性を要求される通信に使用されるコネクション型プロトコルであるTCP(Transmission Control Protocol)と、同じく、IPの上位プロトコルであるトランスポート層で動作し、音声通話や、Videoストリーミング、マルチキャスト通信、ブロードキャスト通信、少量のデータ転送等のリアルタイムの通信に使用されるコネクションレス型プロトコルであるUDP(User Datagram Protocol)の条件に基づいて、通信の許可又は不許可を判断するように構成される。Webサーバ106は、顧客端末116-i及び担当者端末118-jのWebブラウザからHTTPリクエストを受信しその応答を返却する。アプリケーションサーバ108は、Webサーバ106からの処理要求に対して、ビジネスロジックを実行し、必要であればデータベースサーバ110に対してデータの参照や更新要求を行う。データベースサーバ110は、主にデータの管理を行い、アプリケーションサーバ108からのデータの参照や更新処理の要求を実行し結果を返却する。
顧客端末116-i及び担当者端末118-jのブラウザから最初に要求を受けたとき、アプリケーションサーバ108は、そのブラウザを一意に識別するための識別子を生成し、Webサーバ106上のWebアプリケーションにその識別子を渡す。その後、アプリケーションサーバは、その識別子をキーとして、そのWebブラウザに関する情報を、データベースサーバ110との間で共有可能で永続性のある外部リソースに保持する。Webサーバ106は、アプリケーションサーバ108から受け取った識別子を、顧客端末116-i及び担当者端末118-jのブラウザに渡す。例えば、cookieを利用する場合、Webサーバ106とアプリケーションサーバ108の呼び出しにおいて、cookieを引数として渡すことによりアプリケーションサーバ108でcookieに識別子を設定できる。再度、顧客端末116-i及び担当者端末118-jのブラウザから要求を行った場合には、アプリケーションサーバ108で設定された識別子を元に外部リソースを参照し情報を取得することができる。
(2) 顧客端末、担当者端末、オペレータ端末
図2は、顧客端末116-i、担当者端末118-j、及びオペレータ端末112のハードウェア構成を示す図である。
図2は、顧客端末116-i、担当者端末118-j、及びオペレータ端末112のハードウェア構成を示す図である。
例えば、顧客端末116-iは、CPU202、メモリ204、記憶装置206、入力部208、表示部210、及び送受信インターフェイス212を含む。CPU202は、記憶装置206に記憶されているプログラムをメモリ204に読み出して実行することにより各種の機能を実現する。メモリ204は、例えば、ランダム・アクセス・メモリ(RAM:random access memory)及び/又は読取り専用メモリ(ROM:read only memory)を含む。記憶装置206は、テープ・ドライブ、フロッピー(登録商標)・ドライブ、ハードディスク・ドライブ又はコンパクト・ディスク・ドライブを含む。入力部208は、データの入力を受け付ける、例えば、キーボードやマウス、トラックボール、タッチパネル、マイクロフォン等を含む。表示部210は、データを出力する、例えば、ディスプレイやスピーカ等を含む。顧客端末116-iは、送受信インターフェイス212を外部のプリンタ等に接続することにより、アプリケーションサーバ108及びデータベースサーバ110からの、顧客iの電力使用量、電力料金、及び最適な料金プランを示すデータをプリントアウトすることができる。
送受信インターフェイス212は、通信ネットワーク120及びイントラネット122を介してWebサーバ106にアクセスし、Webサーバ106にHTTPリクエストを送信する。また、送受信インターフェイス212は、Webサーバ106からのHTTPリクエストに対する応答に対して、表示部210上に表示されたWebブラウザ上で入力された顧客id、担当者id、パスワード等の情報をWebサーバ106に送信する。これにより、顧客i及び担当者jによる最適メニューの決定システムへのログインが完了する。
(3) ファイアウォール、Webサーバ
図3は、ファイアウォール104及びWebサーバ106のハードウェア構成を示す図である。
図3は、ファイアウォール104及びWebサーバ106のハードウェア構成を示す図である。
ファイアウォール104及びWebサーバ106は、CPU302、メモリ304、記憶装置306、入力部308、出力部310、及び送受信インターフェイス312を含む。記憶装置306は、各種のデータやプログラムを記憶する、ハードディスク・ドライブやソリッドステート・ドライブ、フラッシュメモリ等であってもよい。CPU302は、記憶装置306に記憶されているプログラムをメモリ304に読み出して実行することにより各種の機能を実現する。送受信インターフェイス312は、通信ネットワーク120及びイントラネット122に接続するためのインターフェイスであり、イーサネット(登録商標)に接続するためのアダプタ、公衆電話回線網に接続するためのモデム等である。入力部308は、データの入力を受け付ける、キーボードやマウス、トラックボール、タッチパネル、マイクロフォン等であってもよい。出力部310は、データを出力する、ディスプレイやプリンタ、スピーカなどであってもよい。
(4) アプリケーションサーバ
図4は、アプリケーションサーバ108のハードウェア構成を示す図である。
図4は、アプリケーションサーバ108のハードウェア構成を示す図である。
アプリケーションサーバ108は、CPU402、メモリ404、記憶装置406、入力部408、出力部410、送受信インターフェイス412、モデル生成部414、及び料金プラン評価分416とからなる。CPU402、メモリ404、記憶装置406、入力部408、出力部410、及び送受信インターフェイス412は、上記のファイアウォール104及びWebサーバ106のものと同様である。
モデル生成部414は、後述のデータベースサーバ110の予測モデル及び料金プランエリアの気象情報データベース510に格納されている気象データ、及びデータベースサーバ110の顧客エリアに、“顧客id”i(i=1,…,Ncu)ごとに格納され、顧客アカウントの一部を形成する電力使用量データベース502の月k(k=1,…,M)ごとの電力使用量の実績データP(i,k)、顧客iの営業日の電力基準使用量P1(i)、顧客iの休日の基準電力使用量P2(i)、その顧客i固有の電力基準使用量P(CSpe)(i,k)、顧客iの月kの営業日数D1(i,k)及び休日数D2(i,k)等に基づいて、顧客iの各々についての月ごとの電力使用量の予測値P*(i,k)を算出することができる顧客iごとの第1の予測モデルを生成する。第1の予測モデルは、少なくとも、月kの冷房指数(Cooling Degree Days(CDD))“E(CDD)(k)”と、月kの暖房指数(Heating Degree Days(HDD))“E(HDD)(k)”と、顧客iのその月kの営業日数D1(i,k)及び休日数D2(i,k)を含む暦データを説明変数とする第1の線形予測モデルであってもよい。また、例えば、顧客iの冷暖房等の設備の規模等が大きく変更される等の特別の事情がある場合等には、必要に応じて、その顧客iの営業日の電力基準使用量P1(i)、休日の基準電力使用量P2(i)、その月kのその顧客i固有の電力基準使用量P(use)
(CSpe)(i,k)を第1の線形予測モデルの説明変数として加えてもよい。この場合、モデル生成部414は、第1の線形予測モデルのパラメータを回帰分析によって推計することができる。また、第1の予測モデルは、少なくとも、冷房指数及び暖房指数を含む気象データと、営業日数D1(i,k)及び休日日数D2(i,k)を含む暦データとを入力として月ごとの電力使用量の予測値P*(i,k)を出力とする構造化ニューラルネットワーク(NN)であってもよい。上記と同様に、この場合にも、顧客iの冷暖房等の設備の規模等が大きく変更される等の特別の事情に応じて、その顧客iの営業日の電力基準使用量P1(i)、休日の基準電力使用量P2(i)、その月kのその顧客i固有の電力基準使用量P(use)
(CSpe)(i,k)を構造化NNの入力に加えてもよい。この場合には、モデル生成部414は、電力使用量の実績データP(i,k)を教師データとして、周知の忘却付き構造学習アルゴリズムや生成的構造学習アルゴリズムによって構造化NNを学習させることができる。
また、モデル生成部414は、営業日数D1(i,k)及び休日数D2(i,k)を含む暦データと、第n-m(m=1,…,NEV)年の月kごとの日l(l=1,…,N(k))の平均気温θl(k)、及び温度閾値θ0から求めることができる日lのCDD“ΔT(CDD)(k,l)”及び日lのHDD“ΔT(HDD)(k,l)”、日l-1のCDD“ΔT(CDD)(k,l-1)”及び日l-1のHDD“ΔT(HDD)(k,l-1)”等を入力変数として使用して、第1の予測モデルによって予測された顧客iの各々についての月ごとの電力使用量の予測値P*(i,k)に基づいて、顧客iの各々についての月kの各時間帯t(t=1,…,Nh)ごとの電力使用量の予測使用量行列P*(i,k,t)を求める第2の予測モデルを生成することができる。予測使用量行列の各成分の各時間帯tについての和(予測使用量行列P*(i,k,t)の列和)が、第1の予測モデルによって予測された月ごとの電力使用量の予測値P*(i,k)に等しくなる。第2の予測モデルは、それぞれ、少なくとも、営業日数D1(i,k)及び休日数D2(i,k)を含む暦データと、日lのCDD“ΔT(CDD)(k,l)”及び日lのHDD“ΔT(HDD)(k,l)”、日l-1のCDD“ΔT(CDD)(k,l-1)”及び日l-1のHDD“ΔT(HDD)(k,l-1)”を説明変数として、予測使用量行列P*(i,k,t)を予測するNh個の第2の線形予測モデルとして実装されてもよい。また、第1の予測モデルと同様に、第2の予測モデルも、構造化NNとして実装されてもよい。例えば、第2の予測モデルは、30分ごとにNh=48個の線形予測モデルによって実装されてもよい。
料金プラン評価部416は、予測モデル生成部414が生成した第1の予測モデルを用いて、顧客iの各々についての月kごとの電力使用量の予測値P*(i,k)を算出し、予測モデル生成部414が生成した第2の予測モデルを用いて、月kごとの電力使用量の予測値P*(i,k)に基づいて、月kの各時間帯tごとの電力使用量の予測使用量行列P*(i,k,t)を算出する。料金プラン評価部416は、各料金プランo(o=1,…,NM)の各時間帯tごとの電力料金単価を表す料金単価行列M(o,t)を、データベースサーバ110から取得し、料金単価行列M(o,t)と予測使用量行列P*(i,k,t)とに基づいて、各顧客iについて各料金プランoの各月kごとの電力料金を示す料金行列R*(i,o,k)を求める。料金行列の各成分R*(i,o,k)の月kについての和(料金行列R*(i,o,k)の行和)をとると、顧客iの各料金プランoについての第n年の電力料金の予測値が得られる。
また、料金プラン評価部416は、データベースサーバ110の料金プランデータベース514から、月kごとの夜間率R(Night)(i,k)及びウィークエンド率R(we)(i,k)を取得し、月kごとの電力使用量の予測値P*(i,k)及び夜間率R(Night)(i,k)を用いて、月kごとの夜間使用量の予測値P*
(Night)(i,k)を、また、月kごとの電力使用量の予測値P*(i,k)及びウィークエンド率R(we)(i,k)を用いて、月kごとのウィークエンド使用量の予測値P*
(we)(i,k)を求めることができる。料金プラン評価部416は、顧客iの月kのピーク率を用いて、同様の方法で、顧客iの月kごとのピーク時間の電力使用量を求めることができる。ピーク率は、電力使用量の1日の電力使用量のうち、ピーク時間、例えば、夏期の午後1時から午後4時までの間に使用する電力使用量の占める割合である。夜間率は、電力使用量の1日の電力使用量のうち、夜間、例えば、22時から翌朝8時までの間に使用する電力使用量の占める割合である。
(5) データベースサーバ
図5は、データベースサーバ110のハードウェア構成を示す図である。
図5は、データベースサーバ110のハードウェア構成を示す図である。
データベースサーバ110は、顧客情報エリアと担当者エリアと予測モデル及び料金プランエリアとを含む。顧客情報エリアは、“電力使用量データベース502、暦データデータベース504、及び顧客固有の電力使用量データベース506を含み、顧客id”i(i=1,…,Ncu)と関連付けて各顧客のアカウントを格納する。担当者エリアは、担当者データベース508を含み、“担当者id”j(j=1,…,Nag)と関連付けて各担当者のアカウントを格納している。予測モデル及び料金プランエリアは、気象情報データベース510、暦データデータベース512、料金プランデータベース514、及び予測モデルデータベース516とを含む。
電力使用量データベース502は、例えば、顧客iを識別する“顧客id”、顧客iの営業日の電力基準使用量P1(i)、顧客iの休日の基準電力使用量P2(i)、顧客iの第n年(n=1,…,NEV)の月k(k=1,…,M)ごとの電力使用量の実績データP(i,k)、顧客iのピーク率、夜間率R(Night)(i,k)、及びウィークエンド率R(we)(i,k)を格納している。暦データデータベース504は、第n年の月kごとに、顧客iの営業日数D1(i,k)及び休日数D2(i,k)、営業日及び休日の日付を格納している。これらのデータは、顧客iの固有の事情により、例えば、ゴールデンウィーク中の営業日及び休日、年末年始の営業日及び休日、会社の創立記念日等が異なっている場合がある。顧客固有の電力使用量データベース506は、生産等の事業サイクルやトレンド等のその顧客i固有の電力基準使用量P(use)
(CSpe)(i,k)を格納している。また、顧客情報エリアは、他にも、顧客電話番号、顧客携帯電話番号、住所、メールアドレス、ホームページのURL、従業員数等を含むことができる。
担当者データベースは、担当者jを識別する“担当者id”、その担当者jが担当する地域を識別するコード、担当者jが携帯している担当者端末の機器識別子等を格納している。
気象データデータベース510は、温度閾値θ0、第n-m(m=1,…,NEV)年の月kごとに、日lの平均気温θlを格納している。気象データデータベース510は、他にも、第n-m年の月kごとに、日lの天候、湿度、気圧、風力、日照時間等を格納してもよい。暦データデータベース512は、顧客iによらない通常の暦を格納している。顧客iによらない通常の暦は、第n-m年及び第n年の月kの営業日数D1(k)及び休日日数D2(k)を含んでいる。料金プランデータベース514は、各料金プランo(o=1,…,NM)の各時間帯tごとの電力料金単価を表す料金単価行列M(o,t)を格納している。各料金プランoは、家庭用として、例えば、「エコノミーナイト」プラン、「ファミリータイム(プラン1)」、「ファミリーナイト(プラン2)」、「電灯ピークシフト」プラン等を含むことができ、法人用として、例えば、「特別高圧電力A」、「特別高圧電力B」、「特別高圧Time of Use(TOU)A」、「特別高圧Time of Use(TOU)B」、「業務用高負荷率電力」「業務用高負荷率TOU」、「業務用ウィークエンド」等を含むことができる。予測モデルデータベースは、例えば、予測モデルが線形予測モデルの場合には、定数及び回帰係数を格納することができ、予測モデルが構造化ニューラルネットワークの場合には、各ユニット間の結合係数を格納することができる。
(6) 予測モデルの生成
図6は、線形回帰モデルとしての予測モデルの生成手順を示す図である。
図6は、線形回帰モデルとしての予測モデルの生成手順を示す図である。
本発明は、過去NTR年間の気象データ及び暦データに基づいて第1の予測モデルを作成し、作成された第1の予測モデルを用いて、過去のNEV年間の気象データを用いて、次の年の1年間の月kごとの電力使用量の予測値を、NEV年間の気象データに対応するNEV通りの電力使用量の予測値をNEV個のシナリオ(予測分布)として算出する。その後、第2の予測モデルを用いてNEV通りの1年間の電力使用量の予測値から各月kの時間帯tごとの電力使用量の予測値を算出し、NEV通りの電力使用量の予測値を電力料金プラン(メニュー)に適用することで、NEV通りの電力料金の予測値のシナリオを作成し、各シナリオの結果により電力料金プランを評価するものである。例えば、NTR=5、NEV=25とすることができる。
図6を参照すると、アプリケーションサーバ108のモデル生成部414は、データベースサーバ110の気象データデータベース510から、第n-m(m=1,…,NTR)年の月kごとの日l(l=1,…,N(k))の平均気温θl(k)、及び温度閾値θ0を読みだす。ここで、N(k)は、月kの日数であり、N(k)=28又は30又は31である。温度閾値θ0は、例えば、18℃である。モデル生成部414は、月kの冷房指数(CDD)“E(CDD)(k)”を、式
 に従って算出する(ブロック602)。CDDは、冷房需要を満たすために必要なエネルギーの大きさを表す指標である。ここで、max(θl(k)-θ0,0)は、θl(k)-θ0と0のうちのいずれか大きいほうを選択することを示している。また、モデル生成部414は、月kの暖房指数(HDD)“E(HDD)(k)”を、式
 に従って算出する(ブロック604)。HDDは、暖房需要を満たすために必要なエネルギーの大きさを表す指標である。
モデル生成部414は、データベースサーバ110の顧客エリアにある暦データデータベース504から、第n-m年の月kの顧客iの営業日数D1(i,k)及び休日数D2(i,k)を読み出す(ブロック606及び608)。ここで、
 である。
である。
a(i)を顧客i固有の定数項、b1(i)、b2(i)c1(i)、及びc2(i)を顧客i固有の回帰係数とすると、顧客iの各々についての月kの電力使用量の予測値P*(i,k)は、
 で表すことができ、両辺の自然対数をとると、
 の関係が成り立つ。
モデル生成部414は、顧客iの第n-m年から第n-1年の過去NTR年分の変量のセット[E(CDD)(k),E(HDD)(k),D1(i,k),D2(i,k)]の多数のサンプルを用いて、顧客i固有のパラメータの組[a(i),b1(i),b2(i),c1(i),c2(i)]の推計を行い、このパラメータの組によって表される第1の予測モデルを生成する(ブロック610)。推計処理は、一般的な回帰分析の手法により行われる。モデル生成部414は、第1の予測モデルを表すパラメータの組[a(i),b1(i),b2(i),c1(i),c2(i)]を、データベースサーバ110に送り、データベースサーバ110は、パラメータの組[a(i),b1(i),b2(i),c1(i),c2(i)]を予測モデルデータベース516に格納する。
第1の予測モデルのパラメータの組[a(i),b1(i),b2(i),c1(i),c2(i)]の推計は、複数の顧客についてではなく、個々の顧客iについて行われる。これは、複数の顧客のプールデータでパラメータ推計を行った場合に、個別の顧客の使用状況に合致しないモデルを生ずるといったことを防ぐためである。パラメータの推計は、推計用のデータを確保するために、12×NTRヵ月分の変量のセットを使用して行われる。
上記のパラメータの推計は、月kの冷房指数と、月kの暖房指数と、月kの暦データとを使用して行われたが、例えば、顧客iの冷暖房等の設備の規模等が大きく変更される等の特別の事情がある場合等には、その顧客iの営業日の電力基準使用量P1(i)、休日の基準電力使用量P2(i)、その月kのその顧客i固有の電力基準使用量P(use)
(CSpe)(i,k)を第1の線形予測モデルの説明変数として加えてもよい。
この場合には、モデル生成部414は、データベースサーバ110の顧客固有の電力使用量データベース506から、生産等の事業サイクルやトレンド等の顧客i固有の電力基準使用量P(use)
(CSpe)(i,k)を読みだす。このとき、顧客iの月kの電力使用量の予測値P*(i,k)の回帰式は、b1(i)、b2(i)、c1(i)、c2(i)、及びd0(i)を顧客i固有の回帰係数とすると、
 で表され、両辺の自然対数をとると、
 の関係が成り立つ。
また、モデル生成部414は、データベースサーバ110の電力使用量データベース502から、顧客iの営業日の1日当たりの電力基準使用量P1(i)及び休日の1日当たりの基準電力使用量P2(i)を読みだし、第n-m年の月kの電力基準使用量を、
 に従って算出してもよい。b1(i)、b2(i)、b3(i)、b4(i)、及びd0(i)を顧客i固有の回帰係数とすると、顧客iの各々についての月kの電力使用量の予測値P*(i,k)は、
 で表すことができ、両辺の自然対数をとると、
 の関係が成り立つ。
図7は、構造型ニューラルネットワークを用いた第1の予測モデルの生成手順を示す図である。
電力や熱エネルギーの使用量は、工場等の操業予定に影響される負荷や、気象条件に影響される負荷、ほぼ毎日一定の傾向を示す負荷等によって様々な特性を有している。このような使用量は、線形モデルで精度よく予測できる場合もあれば、非線形モデルによる予測が必要な場合もあり、様々な負荷特性に対応した使用量予測ツールが必要となる。
この点で、ニューラルネットワークは、非線形関数のモデル化の能力、及び学習能力を有しており、予測をはじめとする多くの分野で応用されている。また、ニューラルネットワークは、設計者の意図を反映しやすく、他の予測手法に比べ高精度な予測ができるメリットがある。しかしながら、最適なネットワーク構造に関する情報が事前に得られないため試行錯誤的に学習しなければならないこと、及び内部がブラックボックスのため、出力理由の説明が困難であること等の欠点を有する。
図示の例では、入力層から中間層までの計算を入力因子グループごとに分割している。また、あらかじめ多くの中間ユニット数で学習を開始し、冗長なユニットを削除することで最適ネットワーク構造を探索する削除的構造学習の一種である忘却付き構造学習アルゴリズムや、あらかじめ少ない中間ユニット数から学習を開始し、必要ならユニットを追加する手法で、最低限のユニット追加で最適ネットワーク構造を探索する生成的構造学習アルゴリズムを採用することで、上記の問題を解決することができる。
図7において、入力因子グループ714は、気象的要因(気温効果)の入力因子グループであり、気温効果は、顧客iにとって最も大きな不確実要因である。入力因子グループ716は、顧客i固有の暦データの入力因子グループである。
図6の場合と同様に、アプリケーションサーバ108のモデル生成部414は、データベースサーバ110の気象データデータベース510から、第n-m年の月kごとの日lの平均気温θl、及び温度閾値θ0を読みだし、式(1)に従って月kの冷房指数(CDD)“E(CDD)(k)”を算出し(ブロック702)、“E(CDD)(k)”を入力ユニット718に入力する。モデル生成部414は、月kの暖房指数(HDD)“E(HDD)(k)”を、式(2)に従って算出し(ブロック704)、“E(HDD)(k)”を入力ユニット720に入力する。モデル生成部414は、入力因子グループ714の中の1つの入力ユニット722に“顧客id”iを入力する。“顧客id”iを入力する入力ユニット722は、顧客i固有のマッピングを実現するのに使用される。
モデル生成部414は、データベースサーバ110の顧客エリアにある暦データデータベース504から、第n-m年の月kの顧客iの営業日数D1(i,k)及び休日数D2(i,k)を読みだし、D1(i,k)及びD2(i,k)を、それぞれ、入力ユニット724及び726に入力する。モデル生成部414は、入力因子グループ716の中の1つの入力ユニット728に“顧客id”iを入力する。“顧客id”iを入力する入力ユニット728は、顧客i固有のマッピングを実現するのに使用される。
入力因子グループ714の入力ユニット718、720、及び722の出力は、結合係数によって重みづけされ、入力因子グループ714の中間ユニットのみに接続される。入力因子グループ716の入力ユニット724、726、及び728の出力は、結合係数によって重みづけされ、入力因子グループ716内の中間ユニットにのみ結合される。各中間ユニットの出力は、結合係数によって重みづけされ、出力ユニット730に接続される。出力ユニット730は、顧客iの月kの電力使用量の予測値P*(i,k)を出力する。
上記の予測モデルとしてのニューラルネットワークは、各顧客i(i=1,…,Ncu)のNTR年分の月kの電力使用量の予測値P*(i,k)に対して、対応する顧客iのNTR年分の月kごとの電力使用量の実績データP(i,k)を教師データとして用いて、忘却付き構造学習アルゴリズムや生成的構造学習アルゴリズムを実行することにより、学習させることができる。モデル生成部414は、学習の結果得られたユニット間の結合係数を、データベースサーバ110に送り、データベースサーバ110は、結合係数を予測モデルデータベース516に格納する。
(7) 各料金プランの評価
本実施形態においては、アプリケーションサーバ108の料金プラン評価部416は、過去NTR年間の気温データ、暦データ、及び、場合によっては、電力使用データに基づいて第1の予測モデルを作成し、作成された第1の予測モデルを用いて、過去のNEV年間の気象データ及び次の年の暦データを用いて、過去のNEV年間の気象データに対応するNEV通りの電力使用量の予測値を算出する。料金プラン評価部416は、上記のNEV通りの電力使用量の予測値を、次の年の1年間の月kごとの電力使用量の予測値をNEV通りのシナリオとして提示する。その後、料金プラン評価部416は、第2の予測モデルを用いてNEV通りの1年間の電力使用量の予測値から、各月kの時間帯tごとの電力使用量の予測値を算出し、NEV通りの時間帯tごとの電力使用量の予測値を電力料金プランに適用することで、NEV通りの電力料金の予測値のシナリオを作成し、各シナリオの結果により各料金プランを評価する。
本実施形態においては、アプリケーションサーバ108の料金プラン評価部416は、過去NTR年間の気温データ、暦データ、及び、場合によっては、電力使用データに基づいて第1の予測モデルを作成し、作成された第1の予測モデルを用いて、過去のNEV年間の気象データ及び次の年の暦データを用いて、過去のNEV年間の気象データに対応するNEV通りの電力使用量の予測値を算出する。料金プラン評価部416は、上記のNEV通りの電力使用量の予測値を、次の年の1年間の月kごとの電力使用量の予測値をNEV通りのシナリオとして提示する。その後、料金プラン評価部416は、第2の予測モデルを用いてNEV通りの1年間の電力使用量の予測値から、各月kの時間帯tごとの電力使用量の予測値を算出し、NEV通りの時間帯tごとの電力使用量の予測値を電力料金プランに適用することで、NEV通りの電力料金の予測値のシナリオを作成し、各シナリオの結果により各料金プランを評価する。
図8は、月ごとの電力使用量の予測値を用いて各料金プランを評価する処理を示す図である。
各料金プランo(o=1,…,NM)の評価は、過去NEV年分の各月kの各日の気温データを用いて、次の年の暦に基づいて行う。従って、各料金プランoについて、過去NEV年分の各n-m(m=1,…,NEV)年の気温効果に対応するNEV個のシナリオが生成される。例えば、NEVの値は、NEV=25である。
アプリケーションサーバ108の料金プラン評価部416は、モデル生成部414が生成した第1の予測モデルを用いて、顧客iの第n-NEV年から第n-1年までの各n-m年(m=1,…,NEV)の各月kについての気温要因データに基づいて、翌第n年の各月kの電力使用量の予測値P*(i,k)のNEV通りのシナリオを算出する。例えば、料金プラン評価部416は、第n-NEV年のE(CDD)(k)及びE(HDD)(k)と、第n年の暦データであるD1(i,k)及びD2(i,k)を用いて、図6に示されている第1の予測モデルによって、各月kの電力使用量の予測値であるP*(i,k)を算出する。同様に、料金プラン評価部416は、第n-(NEV-1)年のE(CDD)(k)及びE(HDD)(k)と、第n年の暦データであるD1(i,k)及びD2(i,k)を用いて、図6に示されている第1の予測モデルによって、各月kの電力使用量の予測値であるP*(i,k)を算出する。上記のようにして、料金プラン評価部416は、第n-NEV年から第n-1年までの各年のE(CDD)(k)及びE(HDD)(k)と、第n年の暦データであるD1(i,k)及びD2(i,k)を用いて、第1の予測モデルによって、NEV組のP*(i,k)を算出し、月単位の電力使用量の予測分布を求める。
再び、図8を参照すると、料金プラン評価部416は、第2の予測モデルを用いて、月kごとの電力使用量の予測値P*(i,k)から、月kの各時間帯tごとの電力使用量の予測使用量行列P*(i,k,t)を算出する。
図9は、回帰分析による第2の予測モデルの生成手順を示す図である。
モデル生成部414は、データベースサーバ110の気象データデータベース510から読み出した第n-m(m=1,…,NTR)年の月kごとの日l(l=1,…,N(k))の平均気温θl(k)及び温度閾値θ0、第n-m年の月kの日l-1の平均気温θl-1(k)及び温度閾値θ0を用いて、式
 に従って、第n-m年の月kの日lのCDD“ΔT(CDD)(k,l)”及びHDD“ΔT(HDD)(k,l)”、第n-m年の月kの日l-1のCDD“ΔT(CDD)(k,l-1)”及びHDD“ΔT(HDD)(k,l-1)”を算出する。モデル生成部414は、データベースサーバ110の暦データデータベース504から、第n-m年の月kの顧客iの営業日数D1(i,k)及び休日数D2(i,k)を読み出す。
f(i,t)を顧客i固有の定数項、g1(i,t)、g2(i,t)、g3(i,t)、g4(i,t)、h1(i,t)、h2(i,t)、r(i,t)を顧客i固有の回帰係数とすると、顧客iの各時間帯tごとの予測使用量P*(i,k,t)は、
 で表すことができ、両辺の自然対数をとると、
 の関係が成り立つ。
モデル生成部414は、顧客iの第n-m年から第n-1年の過去NTR年分の変量のセット[ΔT(CDD)(k,l),ΔT(HDD)(k,l),ΔT(CDD)(k,l-1),ΔT(HDD)(k,l-1),D1(i,k),D2(i,k),P*(i,k)]の多数のサンプルを用いて、顧客i固有のパラメータの組[f(i,t),g1(i,t),g2(i,t),g3(i,t),g4(i,t),h1(i,t),h2(i,t),r(i,t)]の推計を行い、このパラメータの組によって表される予測モデルを生成する。推計処理は、一般的な回帰分析の手法により行われる。モデル生成部414は、予測モデルを表すパラメータの組[f(i,t),g1(i,t),g2(i,t),g3(i,t),g4(i,t),h1(i,t),h2(i,t),r(i,t)]を、データベースサーバ110に送り、データベースサーバ110は、パラメータの組[f(i,t),g1(i,t),g2(i,t),g3(i,t),g4(i,t),h1(i,t),h2(i,t),r(i,t)]を予測モデルデータベース516に格納する。
図10は、構造型ニューラルネットワークを用いた第2の予測モデルの生成手順を示す図である。
図7の場合と同様に、図10の構造化ニューラルネットワークは、入力層から中間層までの計算が入力因子グループごとに分割されている。第2の予測モデルを実装する構造型ニューラルネットワークは、気象的要因(気温効果)の入力因子グループである入力因子グループ1018と、暦要因の入力因子グループである入力因子グループ1020と、月kごとの電力使用量の入力因子グループである入力因子グループ1022とを含む。
アプリケーションサーバ108のモデル生成部414は、データベースサーバ110の気象データデータベース510から、第n-m年の月kごとの日l(l=1,…,N(k))の平均気温θl(k)及び温度閾値θ0を読みだし、式(6)に従って、日l=1からl=N(k)までのCCD“ΔT(CDD)(k,l)”及びHDD“ΔT(HDD)(k,l)”を算出し(ブロック1002及び1004)、“ΔT(CDD)(k,l)”を入力ユニット1024、1026に、“ΔT(HDD)(k,l)”を入力ユニット1028、1030に入力する。モデル生成部414は、入力因子グループ1018の中の1つの入力ユニット1032に“顧客id”iを入力する。“顧客id”iを入力する入力ユニット1032は、顧客i固有のマッピングを実現するのに使用される。
モデル生成部414は、データベースサーバ110の顧客エリアにある暦データデータベース504から、第n-m年の月kの顧客iの営業日数D1(i,k)及び休日数D2(i,k)を読みだし(ブロック1008及び1010)、D1(i,k)及びD2(i,k)を、それぞれ、入力ユニット1034及び1036に入力する。モデル生成部414は、入力因子グループ1020の中の1つの入力ユニット1038に“顧客id”iを入力する。“顧客id”iを入力する入力ユニット1038は、顧客i固有のマッピングを実現するのに使用される。
モデル生成部414は、図6及び7の第1の予測モデルによって算出した顧客iの月kの電力使用量の予測値P*(i,k)を、入力ユニット1040に入力する。モデル生成部414は、入力因子グループ1022の中の1つの入力ユニット1042に“顧客id”iを入力する。“顧客id”iを入力する入力ユニット1042は、顧客i固有のマッピングを実現するのに使用される。
入力因子グループ1018の入力ユニット1024、1026、1028、1030、及び1032の出力は、結合係数によって重みづけされ、入力因子グループ1018の中間ユニットのみに接続される。入力因子グループ1020の入力ユニット1034、1036、及び1038の出力は、結合係数によって重みづけされ、入力因子グループ1020内の中間ユニットにのみ結合される。入力因子グループ1022の入力ユニット1040及び1042の出力は、結合係数によって重みづけされ、入力因子グループ1022内の中間ユニットにのみ結合される。各中間ユニットの出力は、結合係数によって重みづけされ、出力ユニット1044、1046、1048に接続される。
上記の第2の予測モデルとしてのニューラルネットワークは、第n-NTR年から第n-1年までの月kの各時間帯tごとの電力使用量の予測使用量行列P*(i,k,t)に対して、第n-NTR年から第n-1年までの月kの各時間帯tごとの対応する電力使用量の実測値P(i,k,t)を教師データとして用いて、忘却付き構造学習アルゴリズムや生成的構造学習アルゴリズムを実行することにより、学習させることができる。モデル生成部414は、学習の結果得られたユニット間の結合係数を、データベースサーバ110に送り、データベースサーバ110は、結合係数を予測モデルデータベース516に格納する。
料金プラン評価部416は、モデル生成部414が生成した第2の予測モデルとしての構造化ニューラルネットワークに過去NEV年のうちの特定の第n-m(m=1,…,NEV)年の第k月の気温推移パターンを入力する。すなわち、料金プラン評価部416は、データベースサーバ110の気象データデータベース510から、第n-m年の月kごとの日l(l=1,…,N(k))の平均気温θl(k)及び温度閾値θ0を、1月分ずつ読みだす。料金プラン評価部416は、式(6)に従って、第n-m年の月kの各日lについて冷房指数(CDD)、すなわち、ΔT(CDD)(k,1)=max(θ1(k)―θ0,0),…,ΔT(CDD)(k,N(k))=max(θN(k)(k)―θ0,0)をN(k)日分計算する。また、料金プラン評価部416は、式(6)に従って、第n-m年の月kの各日lについての暖房指数(HDD)、すなわち、ΔT(HDD)(k,1)=max(θ0―θ1(k),0),…,ΔT(HDD)(k,N(k))=max(θ0―θN(k)(k),0)をN(k)日分計算する。
気象的要因(気温効果)の入力因子グループ1018は、冷房指数用の入力ユニットをN(k)ユニットと暖房指数用の入力ユニットをN(k)ユニット含んでいる。料金プラン評価部416は、max(θ1(k)―θ0,0),…,max(θN(k)(k)―θ0,0)を1番目からN(k)番目の入力ユニットに入力し、max(θ0―θ1(k),0),…,max(θ0―θN(k)(k),0)を(N(k)+1)番目のユニットから2N(k)番目のユニットに入力する。料金プラン評価部416は、入力因子グループ1022の中の1つの入力ユニット1042に“顧客id”iを入力する。入力因子グループ1018の入力ユニットの出力は、結合係数によって重みづけされ、入力因子グループ1018の中間ユニットのみに接続される。
料金プラン評価部416は、モデル生成部414が生成した第2の予測モデルとしての構造化ニューラルネットワークに第n年(次の1年)の暦データを入力する(ブロック1008及び1010)。すなわち、料金プラン評価部416は、暦データデータベース504から、第n年の月kの顧客iの営業日数D1(i,k)及び休日数D2(i,k)を読みだし、入力因子グループ1020の2つの入力ユニット1034及び1036に入力する。料金プラン評価部416は、入力因子グループ1020の中の1つの入力ユニット1038に“顧客id”iを入力する。入力因子グループ1020の3つの入力ユニットの出力は、結合係数によって重みづけされ、入力因子グループ1020内の中間ユニットにのみ結合される。
料金プラン評価部416は、構造化ニューラルネットワークに、図6及び7に示されている第1の予測モデルにより求めた月kごとの電力使用量の予測値P*(i,k)を入力する(ブロック1014)。料金プラン評価部416は、入力因子グループ1022の中の1つの入力ユニット1042に“顧客id”iを入力する。入力因子グループ1022の入力ユニットの出力は、結合係数によって重みづけされ、入力因子グループ1022の中間ユニットのみに接続される。
各中間ユニットの出力は、結合係数によって重みづけされ、出力層の出力ユニット1044、1046、1048に接続される。出力層には、時間帯の数に等しいNh個の出力ユニットがあり、第n-NEV年から第n-1年までに対応するNEV組の月kの各時間帯tごとの電力使用量の予測使用量行列P*(i,k,t)を出力する。
料金プラン評価部416は、モデル生成部414が生成した図9に示されている第2の予測モデルを、月kについてNh(t=1,…,Nh)個の線形予測モデルとして実装し、顧客iの月kの各時間帯tごとの電力使用量の予測使用量行列P*(i,k,t)を求めてもよい。モデル生成部414及び料金プラン評価部416は、時間帯tを30分間隔で設定し、Nh=48としてもよい。
アプリケーションサーバ108の料金プラン評価部416は、モデル生成部414が生成した第2の予測モデルにより、顧客iの第n-NEV年から第n-1年までの各n-m年の各月kについての気温要因データに基づいて、翌第n年の月kの暦データを用いて、第n-NEV年から第n-1年までの各年のNEV組の気温要因データに対応する、各月kの気温要因データ各時間帯tごとの電力使用量の予測使用量行列P*(i,k,t)のNEV通りのシナリオを算出する。例えば、料金プラン評価部416は、第n-NEV年の月kの日l=1からl=N(k)までのCCD“ΔT(CDD)(k,l)”及びHDD“ΔT(HDD)(k,l)”と、第n年の月kの暦データであるD1(i,k)及びD2(i,k)を用いて、図9に示されている第2の予測モデルによって、各月kの時間帯tごとの電力使用量の予測値を算出し、この処理を月k=1から月k=Mまで繰り返すことで、予測使用量行列P*(i,k,t)を算出する。同様に、料金プラン評価部416は、第n-(NEV-1)年の“ΔT(CDD)(k,l)”及び“ΔT(HDD)(k,l)”と、第n年の暦データであるD1(i,k)及びD2(i,k)を用いて、図9に示されている第2の予測モデルによって、月kの各時間帯tごとの電力使用量の予測使用量行列P*(i,k,t)を算出する。上記のようにして、料金プラン評価部416は、第n-NEV年から第n-1年までの各年の各月のΔT(CDD)(k,l)”及び“ΔT(HDD)(k,l)”と、第n年の暦データであるD1(i,k)及びD2(i,k)を用いて、第2の予測モデルによって、NEV組のP*(i,k,t)を算出し、各月の時間単位の電力使用量の予測分布を求める。
図11は、料金単価行列M(o,t)と予測使用量行列P*(i,k,t)と料金行列R*(i,o,k)を示す図である。
料金単価行列M(o,t)は、図11の上段に示されている。料金単価行列M(o,t)は、行が各メニューoを示しており、列が各時間帯を示している。料金単価行列M(o,t)は、NM×Nhの行列となる。例えば、成分M(1,1)は、料金プランo=1の時間帯t=1における電力単価を示しており、成分M(NM,Nh)は、料金プランo=NMの時間帯t=Nhにおける電力単価を示している。
予測使用量行列P*(i,k,t)は、図11の中段に示されている。予測使用量行列P*(i,k,t)は、行が各時間帯を示しており、列が各月を示している。例えば、成分P*(i,1,1)は、第n-m年の顧客iの月k=1の時間帯t=1における予測電力使用量を示しており、成分P*(i,M,Nh)は、第n-m年の顧客iの月k=Mの時間帯t=Nhにおける予測電力使用量を示している。料金行列の各成分R*(i,o,k)の月kについての和(料金行列R*(i,o,k)の行和)をとると、顧客iの各料金プランoについての第n年の電力料金の予測値が得られる。
料金行列R*(i,o,k)は、図11の下段に示されている。料金行列R*(i,o,k)は、行が各料金プランを示しており、列が各月を示している。例えば、成分R*(i,1,1)は、第n-m年の顧客iの料金プランo=1の時間帯t=1における電力料金を示しており、成分R*(i,NM,Nh)は、第n-m年の顧客iの月k=Mの時間帯t=Nhにおける電力料金を示している。
料金プラン評価部416は、顧客iの料金プランoについての各月kの電力料金の予測値を表す料金行列R*(i,o,k)を、
 に従って求めることができ、ここで、
 である。
である。
図12は、気温要因データ及び暦データに基づいてNM個の各料金プランoを評価する際の本発明の方法のフローチャートである。
本実施形態の方法は、オペレータ端末112にインストールされたソフトウェアをオペレータ端末112のCPU202上で実行することにより、実装され得る。オペレータ端末112は、そのソフトウェアを実行することにより、アプリケーションサーバ108及びデータベースサーバ110を制御することができる。
方法は、ステップS1202において開始される。
アプリケーションサーバ108のモデル生成部414は、“顧客id”をi=1に設定する(ステップS1204)。モデル生成部414は、データベースサーバ110の気象データデータベース510から、温度閾値θ0、第n-NTR年から第n-1年までの過去NTR年分の各年(n-m年(m=1,…,NTR))の月kごとの日lの平均気温θl(k)、暦データデータベース504から、第n-NTR年から第n-1年までの過去NTR年分の各年の月kごとの顧客iの営業日数D1(i,k)及び休日日数D2(i,k)、営業日及び休日の日付、過去NTR年分の顧客iの第n-m年の月kごとの電力使用量の実績データP(i,k)等を読み出してくる(ステップS1206)。モデル生成部414は、読み出した温度閾値θ0及び月kごとの日lの平均気温θl(k)から、式(1)及び(2)に従って、第n-m年の月kの冷房指数E(CDD)(k)及び暖房指数E(HDD)(k)を算出する(ステップS1206)。NTRは、例えば、5である。
モデル生成部414は、予測モデルが線形予測モデルである場合には、一般的な回帰分析の手法を用いて、式(5)で表される予測モデルを推計し(ステップS1208)、予測モデルが構造化ニューラルネットワークである場合には、過去NTR年分の顧客iの第n-m年の月kごとの電力使用量の実績データP(i,k)を教師データとして用いて、上記のNTR年分のデータを学習サンプルとして、忘却付き構造学習アルゴリズムや生成的構造学習アルゴリズムを実行することにより、第1の予測モデルを生成する(ステップS1208)。モデル生成部414は、第1の予測モデルを表すパラメータの組をデータベースサーバ110に送り、データベースサーバ110は、パラメータの組を予測モデルデータベース516に格納する。
モデル生成部414は、よみだした温度閾値θ0及び月kごとの日lの平均気温θl(k)から、式(6)に従って、第n-m年の月kの日lのCDD“ΔT(CDD)(k,l)”及びHDD“ΔT(HDD)(k,l)”、第n-m年の月kの日l-1のCDD“ΔT(CDD)(k,l-1)”及びHDD“ΔT(HDD)(k,l-1)”を算出する(ステップS1210)。モデル生成部414は、上記のCDD及びHDDと、第n-NTR年から第n-1年までの過去NTR年分の各年の月kごとの顧客iの営業日数D1(i,k)及び休日日数D2(i,k)と、第1の予測モデルで推定した顧客iの第n-m年の月kごとの電力使用量の予測値P*(i,k)とを用いて、第2の予測モデルを生成する(ステップS1212)。モデル生成部414は、予測モデルが線形予測モデルである場合には、一般的な回帰分析の手法を用いて、式(8)で表される予測モデルを推計し(ステップS1212)、予測モデルが構造化ニューラルネットワークである場合には、第n-NTR年から第n-1年までの月kの各時間帯tごとの対応する電力使用量の実測値P(i,k,t)を教師データとして用いて、上記のNTR年分のデータを学習サンプルとして、忘却付き構造学習アルゴリズムや生成的構造学習アルゴリズムを実行することにより、第2の予測モデルを生成する(ステップS1212)。モデル生成部414は、第2の予測モデルを表すパラメータの組をデータベースサーバ110に送り、データベースサーバ110は、パラメータの組を予測モデルデータベース516に格納する。
モデル生成部414は、“顧客id”iがNcuよりも小さいか否かを判定する(ステップS1214)。顧客id”iがNcuよりも小さい場合には、モデル生成部414は、i←i+1の処理(変数iにi+1の値を代入する処理を意味する。以下、同じ)を行い(ステップS1216)、処理は、ステップS1206に戻る。顧客id”iがNcu以上である場合には、処理は、料金プラン評価部416に引き継がれる。
料金プラン評価部416は、 “顧客id”をi=1に設定する(ステップS1218)。料金プラン評価部416は、“年の指標”mをm=1に設定する(ステップS1220)。料金プラン評価部416は、温度閾値θ0及び月kごとの日lの平均気温θl(k)から、式(1)及び(2)に従って、第n-m年の月kの冷房指数E(CDD)(k)及び暖房指数E(HDD)(k)を算出する(ステップS1222)。料金プラン評価部416は、第n-m年の月kの冷房指数E(CDD)(k)及び暖房指数E(HDD)(k)と、第n年(次の年)の暦データD1(i,k)及びD2(i,k)(評価用サンプル)を用いて、第1の予測モデルにより、月kごとの電力使用量の予測値P*(i,k)を算出する(ステップS1224)。
料金プラン評価部416は、温度閾値θ0及び月kごとの日lの平均気温θl(k)から、式(6)に従って、第n-m年の月kの日lのCDD“ΔT(CDD)(k,l)”及びHDD“ΔT(HDD)(k,l)”、第n-m年の月kの日l-1のCDD“ΔT(CDD)(k,l-1)”及びHDD“ΔT(HDD)(k,l-1)”を算出する(ステップS1226)。料金プラン評価部416は、上記のCDD及びHDDと、第n年(次の年)の暦データD1(i,k)及びD2(i,k)と、第1の予測モデルで推定した顧客iの第n-m年の月kごとの電力使用量の予測値P*(i,k)(評価用サンプル)とを用いて、顧客iの月kの時間帯tごとの電力使用量の予測使用量行列P*(i,k,t)を算出する(ステップS1228)。料金プラン評価部416は、料金プランoの時間帯tごとの電力料金を示す料金単価行列M(o,t)と、算出した予測使用量行列P*(i,k,t)とを用いて、顧客iの料金プランoごとの月kの電力使用量を示す料金行列R*(i,o,k)を生成する(ステップS1230)。料金プラン評価部416は、生成した料金行列R*(i,o,k)を格納する(ステップS1230)。
料金プラン評価部416は、“年の指標”mがNEVよりも小さいか否かを判定する(ステップS1232)。“年の指標”mがNEVよりも小さい場合には、料金プラン評価部416は、m←m+1の処理(変数mにm+1の値を代入する処理)を行い(ステップS1234)、処理は、ステップS1222に戻る。“年の指標”mがNEV以上である場合には、料金プラン評価部416は、各料金プランoごとの順位を生成し(ステップS1236)、その順位を出力部410に表示する。料金プラン評価部416は、“顧客id”iがNcuよりも小さいか否かを判定する(ステップS1238)。“顧客id”iがNcuよりも小さい場合には、料金プラン評価部416は、i←i+1の処理(変数iにi+1の値を代入する処理)を行い(ステップS1240)、処理は、ステップS1220に戻る。“顧客id”iがNcu以上である場合には、処理は終了する(ステップS1242)。
料金プラン評価部416は、さらに、データベースサーバ110の電力使用量データベース502から顧客iの夜間率R(Night)(i,k)及びウィークエンド率R(we)(i,k)を読み出し、夜間使用量の予測値PN*(i,k)及びウィークエンド使用量の予測値PW*(i,k)を、式
 に従って算出する。
また、料金プラン評価部416は、式
 に従って、第n-NEV年から第n-1年までの各年(n-m年(m=1,…,NEV))の気温要因に対応するNEV個のシナリオの各々について、月kごとの日l=1からl=N(k)のCDDの最大値ΔT(CDD)
(max)(k)及びHDDの最大値ΔT(HDD)
(max)(k)を算出する。料金プラン評価部416は、顧客i固有の定数項をa´(i)、顧客i固有の回帰係数をb´1(i)、b´2(i)とすると、
に従って、第n-NEV年から第n-1年までの各年(n-m年(m=1,…,NEV))の気温要因に対応するNEV個のシナリオの各々について、月kごとの日l=1からl=N(k)のCDDの最大値ΔT(CDD)
(max)(k)及びHDDの最大値ΔT(HDD)
(max)(k)を算出する。料金プラン評価部416は、顧客i固有の定数項をa´(i)、顧客i固有の回帰係数をb´1(i)、b´2(i)とすると、
 として予測される顧客iの月kごとの最大電力の予測値P*
(max)(k)を算出する。月kごとの最大電力の予測値P*
(max)(k)は、基本料金を決定する際に考慮される。
として予測される顧客iの月kごとの最大電力の予測値P*
(max)(k)を算出する。月kごとの最大電力の予測値P*
(max)(k)は、基本料金を決定する際に考慮される。
以上の処理が終了し、すべての顧客についてすべての電力料金プランの評価が終了すると、アプリケーションサーバ108は、オペレータ端末112に評価の結果を送り、オペレータ端末112の表示部210に評価の結果が表示される。また、顧客iについての評価の結果は、イントラネット122を介して顧客端末116-iに送られ、顧客端末116-iの表示部210に表示される。さらに、評価の結果は、通信ネットワーク120を介して担当者端末118‐jに送られ、担当者端末118‐jの表示部に表示される。
代替的な実施形態において、すべての顧客のモデル生成についてバッチ処理をして結果を保存するステップS1204から始まるループ及びステップS1218から始まるループを用いることなく、顧客idを入力することによりオンデマンドによるモデル生成から料金プラン評価プロセスを実行するシステムを使用することもできる。すなわち、図12によって示される実施形態では、顧客iごとの予測モデルをすべての顧客について一括して推計し、保存することとなっているが、“顧客id”iの入力に応答してその都度、予測モデルを推計し、料金プランの評価を行ってもよい。
(8) 評価結果の表示
図13は、料金メリット率に基づく各料金プランの順位、各料金プランのメリット価格、及びメリット率の表示画面である。
図13は、料金メリット率に基づく各料金プランの順位、各料金プランのメリット価格、及びメリット率の表示画面である。
図13の画面は、オペレータ端末112、顧客端末116-i、及び担当者端末118‐jの表示部210に表示される画面である。
この顧客iは、現在「業務用電力」プランに加入している。この顧客iの場合には、「業務用高負荷率」プラン、「業務用ウィークエンド」プラン、「業務用高負荷率TOU」プランの順に、順位が高くなっている。1番目、つまり、最適とされる業務用高負荷率」プランの場合には、現在加入している「業務用電力」プランと比較して、すべてのシナリオの価格の平均価格が¥178,292‐安くなっている。従って、メリット率は、‐1.7%になっている。つまり、現在契約中の「業務用電力」プランと比較して1.7%安価になっている。2番目の「業務用ウィークエンド」プランは、現在加入している「業務用電力」プランと比較して、すべてのシナリオの価格の平均価格が¥140,777‐安くなっている。従って、メリット率は、‐1.3%となっている。3番目の「業務用高負荷率TOU」プランは、現在加入している「業務用電力」プランと比較して、25通りのすべてのシナリオの価格の平均価格が¥22,500‐安くなっている。従って、メリット率は、‐0.2%となっている。
図14は、顧客固有の生産等の事業サイクルやトレンド等に起因する電力基準使用量を要因分解して表示した図である。
図14の図において、折れ線1402は、月ごとの電力使用量の実測値P(i,k)を示している。1404の部分は、電力使用量の実測値P(i,k)のうち、気温効果成分P(Tem)(i,k)を示している。電力使用量の実測値“P(i,k)”1402から気温効果成分“P(Tem)(i,k)”1404を除いた部分が、1406で示されている部分である。1406の部分に移動平均をとった部分が、1408で示される部分であり、顧客i固有のトレンドP(Tre)(i,k)を表す部分である。顧客i固有のトレンド“P(Tre)(i,k)”1406と気温効果成分“P(Tem)(i,k)”1404とを加え合わせたものと、電力使用量の実測値1402との差が、1410で示される部分である。1410で示される部分が、顧客i固有の生産等の事業サイクルやトレンド等に起因する不規則変動成分である。
電力使用量の実測値P(i,k)と式(5)に従って推定された電力使用量の予測値P*(i,k)との間の残差を、ε(i,k)とすると、
 である。料金プラン評価部416は、式(5)に従って推計した顧客i固有のパラメータの組[a(i),b1(i),b2(i),c1(i),c2(i)]を用いて、気温効果成分P(Tem)(i,k)を、式
 に従って算出する。料金プラン評価部416は、上記の気温効果成分1404を除いた部分である顧客iの月kのベース電力使用量P(net)(i,k)を、式
 に従って算出する。料金プラン評価部416は、P(net)(i,k)のM月の移動平均をとることにより、
 に従って、顧客i固有のトレンドを表す傾向電力使用量P(Tre)(i,k)を算出する。料金プラン評価部416は、M=12としてもよい。傾向電力使用量P(Tre)(i,k)は、図14の1408で示される部分で表される。
傾向電力使用量P(Tre)(i,k)は、気温効果成分P(Tem)(i,k)、M月サイクルの循環、及び不規則変動成分を除いた電力使用料の傾向を示している。従って、月kのベース電力使用量P(net)(i,k)のうちM月サイクルの循環と不規則変動成分との和をP(MR)(i,k)とすると、
 となる。顧客iのM月サイクルの月kの成分は、各年のP(MR)(i,k)の平均をとったもので与えられ、これをP(cyc)(i,k)で表すと、料金プラン評価部416は、
 に従って、顧客iの月kの不規則変動成分P(ir)(i,k)を算出する。
上記の要因分解は、気温感応度を計算した回帰式とは異なる考え方で分解したもので、回帰式の残差と要因分解の不規則変動成分P(ir)(i,k)も異なるものである。これは、積型の回帰分析の残差の解釈は困難であり、顧客にとって有益な情報とは言えないと考えられるためである。
図15は、価格メリットを表示した図である。
3つのグラフは、NEV年間の気温変動によるメリット額をヒストグラムで表示している。ヒストグラムのセル(ヒストグラムの右側)に表示される値は、その階級に属するシナリオの数である。シナリオ数は、合計で25になるようになっている。つまり、図示の例では、NEV=25である。
左側のヒストグラムは、顧客iが現在契約している料金プラン「業務用電力」についてのものである。表示される価格メリットは、現在契約している料金プランとの比較であるので、この場合の価格メリットは、すべて0となる。
中央のヒストグラムは、顧客iが現在契約している料金プラン「業務用電力」と、料金プラン「業務用TOU」との比較を示したものであり、右側のヒストグラムは、顧客iが現在契約している料金プラン「業務用電力」と、料金プラン「業務用高付加率電力」との比較を示したものである。ヒストグラムの右側の“*”は、平均値が属している階級を示している。
価格メリットが負の値で示されている場合、すなわち、顧客iが現在契約している料金プラン「業務用電力」よりも、料金プラン「業務用電力」及び料金プラン「業務用高付加率電力」の少なくとも一方が安価になる場合には、現在の料金プラン「業務用電力」から料金プラン「業務用電力」又は料金プラン「業務用高付加率電力」に乗り換えたほうがよい場合である。図示の例では、価格メリットは、すべて正の値であるので、現在の料金プラン「業務用電力」が最適であることを示している。
図16は、メリット率分布を表示した図である。
左側のヒストグラムは、顧客iが現在契約している料金プラン「業務用電力」についてのものである。表示されるメリット率は、現在契約している料金プランとの比較であるので、この場合の価格メリットは、すべて0となる。
中央のヒストグラムは、顧客iが現在契約している料金プラン「業務用電力」と、料金プラン「業務用TOU」との比較を示したものであり、右側のヒストグラムは、顧客iが現在契約している料金プラン「業務用電力」と、料金プラン「業務用高付加率電力」との比較を示したものである。ヒストグラムの右側の“*”は、平均値が属している階級を示している。
メリット率が負の値で示されている場合、すなわち、顧客iが現在契約している料金プラン「業務用電力」よりも、料金プラン「業務用電力」及び料金プラン「業務用高付加率電力」の少なくとも一方が安価になる場合には、現在の料金プラン「業務用電力」から料金プラン「業務用電力」又は料金プラン「業務用高付加率電力」に乗り換えたほうがよい場合である。図示の例では、価格メリットは、すべて正の値であるので、現在の料金プラン「業務用電力」が最適であることを示している。
ヒストグラムのセル(ヒストグラムの右側)に表示される値は、その階級に属するシナリオの数である。料金のメリット率と料金のメリット額とは、それぞれの年について計算されるので、料金のメリット率と料金のメリット額とでヒストグラムの形状が一致しない場合がある。
図17は、各料金プランのメリット率とメリット金額の表示例を示す図である。
図17の上段は、顧客iが現在契約している料金プラン「業務用電力」と、3つの料金プラン「業務用高負荷率電力」、「業務用ウィークエンド」、及び「業務用高負荷率TOU」との比較を示す表であり、メリット率及びメリット価格は、割引平均値を表示してある。
料金プラン「業務用電力」に対する料金プラン「業務用高負荷率電力」のメリット率は、“‐1.7%”で、平均の割引価格は、“‐178,292”である。この場合のメリットのあるシナリオは、25で、すべてのシナリオでメリットがあることを示している。料金プラン「業務用電力」に対する料金プラン「業務用ウィークエンド」のメリット率は、“‐1.3%”で、平均の割引価格は、“‐140,777”である。この場合のメリットのあるシナリオは、25で、すべてのシナリオでメリットがあることを示している。料金プラン「業務用電力」に対する料金プラン「業務用高負荷率TOU」のメリット率は、“‐0.2%”で、平均の割引価格は、“‐22,500”である。この場合のメリットのあるシナリオは、20である。この表では、料金プラン「業務用高負荷率電力」が、顧客iに最適であることがわかる。
図17の下段は、料金プラン「業務用電力」に対する料金プラン「業務用高負荷率電力」の価格メリット及びメリット率を、各シナリオごとに表示したものである。ヒストグラムの右側の“*”は、平均値が属している階級を示している。
本発明に従った上記の方法の各ステップは、CPUとメモリとを備えた、図示しないオペレータの端末によって行われてもよい。本発明の実施形態においては、上記の方法を実行するのに用いられるソフトウェアプログラムが、デジタル・データ・ストレージ媒体等のプログラム・ストレージ・デバイスに格納されていてもよく、これらのプログラム・ストレージ・デバイスは、機械読取り可能、又はコンピュータ読取り可能であり、また、これらのコンピュータ又は機械は、プログラム命令を機械実行可能プログラム、又はコンピュータ実行可能プログラムとしてエンコードし、エンコードされたプログラム命令は、本発明の方法のステップのうちの一部又は全部を実行する。プログラム・ストレージ・デバイスは、例えば、デジタル・メモリ、磁気ディスク及び磁気テープなどの磁気ストレージ媒体、ハード・ドライブ、又は光学的読取り可能デジタル・データ・ストレージ媒体とすることができる。
本発明は、ソフトウェア、及び/又はソフトウェアとハードウェアの組合せで、例えば、特定用途向け集積回路(ASIC:application specific integrated circuit)、フィールド・プログラマブル・ゲート・アレイ(FPGA:field programmable gate array)と、汎用コンピュータ、又は他の任意のハードウェア等価物を使用して実装されてもよい。
上記の実施形態では、一例として、電力使用量の予測値に基づく複数の電力料金プランの評価を例に挙げて、本発明の実施形態に係る電気料金最適メニューを決定するシステムを説明したが、本発明の最適メニュー決定システムは、電力料金プランの最適メニューの決定のみに限定されず、ガス料金プランの最適メニュー、水道料金プランの最適メニュー、原油料金プランの最適メニュー、鉄鉱石料金プランの最適メニュー、及びボーキサイト料金プランの最適メニューの決定、すなわち、エネルギー源としてあるいはある工業製品の原材料として使用される商品であって、需要と供給の関係の下で市場において取引され、例えば、パッケージプライス等の料金プランがある商品の料金プランの最適メニューの決定にも適用することが可能である。
上記の説明は、単に、本発明の特定の実施形態の開示を提供しているにすぎず、本発明を上記の実施形態のみに限定するように意図されてはいない。従って、本発明は、上記で説明された実施形態だけに限定されるものではなく、むしろ、当業者が本発明の範囲内に含まれる代替の実施形態を考案し得ることが認識される。
100 通信システム
102 電力会社
104 ファイアウォール
106 Webサーバ
108 アプリケーションサーバ
110 データベースサーバ
112 オペレータ端末
114 顧客
116 顧客端末
118 担当者端末
120 通信ネットワーク
122 イントラネット
102 電力会社
104 ファイアウォール
106 Webサーバ
108 アプリケーションサーバ
110 データベースサーバ
112 オペレータ端末
114 顧客
116 顧客端末
118 担当者端末
120 通信ネットワーク
122 イントラネット
Claims (21)
- 通信ネットワークを介して少なくとも一の顧客端末に接続され、該少なくとも一の顧客の各々について、当該顧客の月単位の電力使用量の予測値を使用して、複数の電力料金プランの各々を評価するシステムであって、
少なくとも1年の各月の各日ごとの気象データと、該少なくとも一の顧客の各々の顧客固有の暦データと、顧客固有の月単位の電力使用量データとを格納するデータベースと、
少なくとも、該各月の各日ごとの推計用の気象データと該顧客固有の推計用の暦データとを該データベースから取得し、少なくとも、該各月の各日ごとの推計用の気象データと該顧客固有の推計用の暦データとに基づいて、該顧客の月単位の電力使用量を予測する第1の予測モデルを生成する予測モデル生成部と、
少なくとも複数の年の各月の各日ごとの評価用の気象データと次の年の顧客固有の評価用の暦データとを該データベースから取得し、該評価用の気象データと該評価用の暦データとを使用して、該生成した第1の予測モデルにより、該評価用の気象データの該複数の年の数と等しい数の組を構成する、該顧客の月単位の電力使用量の予測値を予測分布として算出する料金プラン評価部とを含む、電気料金プラン評価システム。 - 請求項1に記載の電気料金プラン評価システムにおいて、
該予測モデル生成部は、さらに、少なくとも、該各月の各日ごとの推計用の気象データと該顧客固有の推計用の暦データとを該データベースから取得し、少なくとも、該各月の各日ごとの推計用の気象データと該顧客固有の推計用の暦データとに基づいて、該第1の予測モデルが算出した該顧客の月単位の電力使用量から、該顧客の各月の各時間帯ごとの予測電力使用量行列を算出する第2の予測モデルを生成し、
該料金プラン評価部は、さらに、少なくとも該複数の年の各月の各日ごとの該評価用の気象データと該次の年の顧客固有の該評価用の暦データとを該データベースから取得し、該評価用の気象データと該評価用の暦データとを使用して、該生成した第2の予測モデルにより、該第1の予測モデルによって予測分布として算出した該顧客の月単位の電力使用量の予測値から、該評価用の気象データの該複数の年の数と等しい数の組を構成する、該顧客の各月の各時間帯ごと電力使用量の予測値を表す予測電力使用量行列を予測分布として算出する、電気料金プラン評価システム。 - 請求項2に記載の電気料金プラン評価システムにおいて、
該料金プラン評価部は、さらに、該第2の予測モデルによって予測分布として算出した該顧客の各月の各時間帯ごと電力使用量の予測値を表す該予測電力使用量行列に、該複数の電力料金プランの各料金プランの各時間帯ごとの電力料金単価を表す料金単価行列を適用することにより、各料金プランごとの電力料金を算出する、電気料金プラン評価システム。 - 請求項1に記載の電気料金プラン評価システムにおいて、
該予測モデル生成部は、
該取得した各月の各日ごとの該推計用の気象データから各月ごとの冷房指数及び暖房指数を生成し、
該顧客固有の該推計用の暦データから該顧客の月ごとの営業日数と休日日数とを算出し、
該各月ごとの冷房指数及び暖房指数を含む推計用の気象データと各月の営業日数及び休日日数を含む該顧客固有の推計用の暦データとに基づいて、該顧客の月単位の電力使用量を予測する第1の予測モデルを生成する、電気料金プラン評価システム。 - 請求項2に記載の電気料金プラン評価システムにおいて、
該予測モデル生成部は、
該取得した各月の各日ごとの該推計用の気象データから各日ごとの冷房指数及び暖房指数を生成し、
該顧客固有の該推計用の暦データから該顧客の月ごとの営業日数と休日日数とを算出し、
連続する少なくとも2日の該各日ごとの冷房指数及び暖房指数を含む推計用の気象データと各月の営業日数及び休日数を含む該顧客固有の推計用の暦データとに基づいて、該顧客の各月の各時間帯ごとの電力使用量の予測値を表す予測電力使用量行列を算出する第2の予測モデルを生成する、電気料金プラン評価システム。 - 請求項1に記載の電気料金プラン評価システムにおいて、
該データベースに格納されている該顧客固有の月単位の電力使用量データは、生産等の事業サイクルやトレンド等の該顧客に固有の電力基準使用量を含み、
該予測モデル生成部が、該各月の各日ごとの推計用の気象データと該顧客固有の推計用の暦データと該顧客に固有の電力基準使用量とに基づいて、該顧客の月単位の電力使用量を予測する第1の予測モデルを生成し、
該料金プラン評価部が、該評価用の気象データと該評価用の暦データと該顧客に固有の電力基準使用量とを使用して、該生成した第1の予測モデルにより、該評価用の気象データの該複数の年の数と等しい数の組を構成する、該顧客の月単位の電力使用量の予測値を予測分布として算出する、電気料金プラン評価システム。 - 請求項1に記載の電気料金プラン評価システムにおいて、
該第1の予測モデルは、回帰分析により推計された線形予測モデルである、電気料金プラン評価システム。 - 請求項1に記載の電気料金プラン評価システムにおいて、
該第1の予測モデルは、ニューラルネットワークである、電気料金プラン評価システム。 - 請求項1に記載の電気料金プラン評価システムにおいて、
該データベースは、該顧客のピーク率、夜間率、及びウィークエンド率を格納しており、
該料金プラン評価部は、
該データベースから該顧客のピーク率、夜間率、及びウィークエンド率を取得し、
該第1の予測モデルによって予測分布として算出した該顧客の月単位の電力使用量の予測値と、該ピーク率、該夜間率、及び該ウィークエンド率とから、該顧客のピーク使用電力、夜間使用電力、及びウィークエンド使用電力を算出する、電気料金プラン評価システム。 - 請求項3に記載の電気料金プラン評価システムにおいて、
送受信部をさらに含み、
該少なくとも一の顧客の端末及び料金プラン評価部は、表示部を含み、
該料金プラン評価部は、各料金プランごとの電力料金に基づいて該複数の電力料金プランの各々の評価結果を生成し、
該送受信部は、該複数の電力料金プランの各々の評価結果を該顧客の端末に送信し、該顧客の端末は、該複数の電力料金プランの各々の評価結果を該表示部に表示する、電気料金プラン評価システム。 - 通信ネットワークを介して少なくとも一の顧客の端末に接続され、少なくとも1年の各月の各日ごとの気象データと、該少なくとも一の顧客の各々の顧客固有の暦データと、顧客固有の月単位の電力使用量データとを格納するデータベースと、予測モデル生成部と、料金プラン評価部とを含む電力料金プラン評価システムにおいて、該少なくとも一の顧客の各々について、該顧客の月単位の電力使用量の予測値を使用して、複数の電力料金プランの各々を評価する方法であって、
予測モデル生成部が、該各月の各日ごとの気象データと該顧客固有の暦データとを該データベースから取得するステップと、
予測モデル生成部が、少なくとも、該各月の各日ごとの推計用の気象データと該顧客固有の推計用の暦データとを該データベースから取得し、少なくとも、該各月の各日ごとの推計用の気象データと該顧客固有の推計用の暦データとに基づいて、該顧客の月単位の電力使用量を予測する第1の予測モデルを生成するステップと、
料金プラン評価部が、少なくとも複数の年の各月の各日ごとの評価用の気象データと次の年の顧客固有の評価用の暦データとを該データベースから取得し、該評価用の気象データと該評価用の暦データとを使用して、該生成した第1の予測モデルにより、該評価用の気象データの該複数の年の数と等しい数の組を構成する、該顧客の月単位の電力使用量の予測値を予測分布として算出するステップとを含む、電気料金プラン評価方法。 - 請求項11に記載の電気料金プラン評価方法において、
該予測モデル生成部が、少なくとも、該各月の各日ごとの推計用の気象データと該顧客固有の推計用の暦データとを該データベースから取得し、少なくとも、該各月の各日ごとの推計用の気象データと該顧客固有の推計用の暦データとに基づいて、該第1の予測モデルが算出した該顧客の月単位の電力使用量から、該顧客の各月の各時間帯ごとの予測電力使用量行列を算出する第2の予測モデルを生成するステップと、
該料金プラン評価部が、少なくとも該複数の年の各月の各日ごとの該評価用の気象データと該次の年の顧客固有の該評価用の暦データとを該データベースから取得し、該評価用の気象データと該評価用の暦データとを使用して、該生成した第2の予測モデルにより、該第1の予測モデルによって予測分布として算出した該顧客の月単位の電力使用量の予測値から、該評価用の気象データの該複数の年の数と等しい数の組を構成する、該顧客の各月の各時間帯ごと電力使用量の予測値を表す予測電力使用量行列を予測分布として算出するステップをさらに含む、電気料金プラン評価方法。 - 請求項12に記載の電気料金プラン評価方法において、
該料金プラン評価部が、該第2の予測モデルによって予測分布として算出した該顧客の各月の各時間帯ごと電力使用量の予測値を表す該予測電力使用量行列に、該複数の電力料金プランの各料金プランの各時間帯ごとの電力料金単価を表す料金単価行列を適用することにより、各料金プランごとの電力料金を算出するステップをさらに含む、電気料金プラン評価方法。 - 請求項11に記載の電気料金プラン評価方法において、
該予測モデル生成部が第1の予測モデルを生成するステップは、
該取得した各月の各日ごとの該推計用の気象データから各月ごとの冷房指数及び暖房指数を生成するステップと、
該顧客固有の該推計用の暦データから該顧客の月ごとの営業日数と休日日数とを算出するステップと、
該各月ごとの冷房指数及び暖房指数を含む推計用の気象データと各月の営業日数及び休日日数を含む該顧客固有の推計用の暦データとに基づいて、該顧客の月単位の電力使用量を予測する第1の予測モデルを生成するステップとを含む、電気料金プラン評価方法。 - 請求項12に記載の電気料金プラン評価方法において、
該予測モデル生成部が第2の予測モデルを生成するステップは、
該取得した各月の各日ごとの該推計用の気象データから各日ごとの冷房指数及び暖房指数を生成するステップと、
該顧客固有の該推計用の暦データから該顧客の月ごとの営業日数と休日日数とを算出するステップと、
連続する少なくとも2日の該各日ごとの冷房指数及び暖房指数を含む推計用の気象データと各月の営業日数及び休日日数を含む該顧客固有の推計用の暦データとに基づいて、該顧客の各月の各時間帯ごとの電力使用量の予測値を表す予測電力使用量行列を算出する第2の予測モデルを生成するステップとを含む、電気料金プラン評価方法。 - 請求項11に記載の電気料金プラン評価方法において、
該データベースに格納されている該顧客固有の月単位の電力使用量データは、生産等の事業サイクルやトレンド等の該顧客に固有の電力基準使用量を含み、
該予測モデル生成部は、該各月の各日ごとの推計用の気象データと該顧客固有の推計用の暦データと該顧客に固有の電力基準使用量とに基づいて、該顧客の月単位の電力使用量を予測する第1の予測モデルを生成し、
該料金プラン評価部が、該評価用の気象データと該評価用の暦データと該顧客に固有の電力基準使用量とを使用して、該生成した第1の予測モデルにより、該評価用の気象データの該複数の年の数と等しい数の組を構成する、該顧客の月単位の電力使用量の予測値を予測分布として算出する、電気料金プラン評価方法。 - 請求項11に記載の電気料金プラン評価方法において、
該第1の予測モデルは、回帰分析により推計された線形予測モデルである、電気料金プラン評価方法。 - 請求項11に記載の電気料金プラン評価方法において、
該第1の予測モデルは、ニューラルネットワークである、電気料金プラン評価方法。 - 請求項11に記載の電気料金プラン評価方法において、
該データベースは、該顧客のピーク率、夜間率、及びウィークエンド率を格納しており、
該料金プラン評価部は、
該データベースから該顧客のピーク率、夜間率、及びウィークエンド率を取得し、
該第1の予測モデルによって予測分布として算出した該顧客の月単位の電力使用量の予測値と、該ピーク率、該夜間率、及び該ウィークエンド率とから、該顧客のピーク使用電力、夜間使用電力、及びウィークエンド使用電力を算出する、電気料金プラン評価方法。 - 請求項13に記載の電気料金プラン評価方法において、
該電力料金プラン評価システムは、送受信部をさらに含み、
該少なくとも一の顧客の端末及び料金プラン評価部は、表示部を含み、
該料金プラン評価部は、各料金プランごとの電力料金に基づいて該複数の電力料金プランの各々の評価結果を生成し、
該送受信部は、該複数の電力料金プランの各々の評価結果を該顧客の端末に送信し、該顧客の端末は、該複数の電力料金プランの各々の評価結果を該表示部に表示する、電気料金プラン評価方法。 - 通信ネットワークを介して少なくとも一の顧客端末に接続され、少なくとも1年の各月の各日ごとの気象データと、該少なくとも一の顧客の各々の顧客固有の暦データと、顧客固有の月単位の電力使用量データとを格納するデータベースと、予測モデル生成部と、料金プラン評価部とを含む電力料金プラン評価システムに、該少なくとも一の顧客の各々について、該顧客の月単位の電力使用量の予測値を使用して、複数の電力料金プランの各々を評価する方法を実行させるプログラムであって、該方法は、
予測モデル生成部が、該各月の各日ごとの気象データと該顧客固有の暦データとを該データベースから取得するステップと、
予測モデル生成部が、少なくとも、該各月の各日ごとの推計用の気象データと該顧客固有の推計用の暦データとを該データベースから取得し、少なくとも、該各月の各日ごとの推計用の気象データと該顧客固有の推計用の暦データとに基づいて、該顧客の月単位の電力使用量を予測する第1の予測モデルを生成するステップと、
料金プラン評価部が、少なくとも複数の年の各月の各日ごとの評価用の気象データと次の年の顧客固有の評価用の暦データとを該データベースから取得し、該評価用の気象データと該評価用の暦データとを使用して、該生成した第1の予測モデルにより、該評価用の気象データの該複数の年の数と等しい数の組を構成する、該顧客の月単位の電力使用量の予測値を予測分布として算出するステップとを含む、電気料金プラン評価プログラム。
Priority Applications (2)
| Application Number | Priority Date | Filing Date | Title |
|---|---|---|---|
| JP2017504444A JP6128296B1 (ja) | 2016-07-20 | 2016-07-20 | 最適メニュー決定システム、最適メニュー決定方法、及びプログラム |
| PCT/JP2016/071312 WO2018016037A1 (ja) | 2016-07-20 | 2016-07-20 | 最適メニュー決定システム、最適メニュー決定方法、及びプログラム |
Applications Claiming Priority (1)
| Application Number | Priority Date | Filing Date | Title |
|---|---|---|---|
| PCT/JP2016/071312 WO2018016037A1 (ja) | 2016-07-20 | 2016-07-20 | 最適メニュー決定システム、最適メニュー決定方法、及びプログラム |
Publications (1)
| Publication Number | Publication Date |
|---|---|
| WO2018016037A1 true WO2018016037A1 (ja) | 2018-01-25 |
Family
ID=58714823
Family Applications (1)
| Application Number | Title | Priority Date | Filing Date |
|---|---|---|---|
| PCT/JP2016/071312 Ceased WO2018016037A1 (ja) | 2016-07-20 | 2016-07-20 | 最適メニュー決定システム、最適メニュー決定方法、及びプログラム |
Country Status (2)
| Country | Link |
|---|---|
| JP (1) | JP6128296B1 (ja) |
| WO (1) | WO2018016037A1 (ja) |
Cited By (4)
| Publication number | Priority date | Publication date | Assignee | Title |
|---|---|---|---|---|
| KR101989493B1 (ko) * | 2018-03-05 | 2019-06-14 | 숭실대학교산학협력단 | 전력 사용량 예측 시스템 및 방법 |
| JP2020052840A (ja) * | 2018-09-27 | 2020-04-02 | 株式会社リコー | 情報処理システム、情報処理装置、情報処理方法及びプログラム |
| JP2025127659A (ja) * | 2024-02-21 | 2025-09-02 | 株式会社Looop | 電気代予測システム、電気代予測方法及びプログラム |
| JP7845563B1 (ja) * | 2025-08-28 | 2026-04-14 | 富士電機株式会社 | 情報処理装置、情報処理方法およびプログラム |
Citations (4)
| Publication number | Priority date | Publication date | Assignee | Title |
|---|---|---|---|---|
| JP2009294969A (ja) * | 2008-06-06 | 2009-12-17 | Mitsubishi Electric Corp | 需要予測方法および需要予測装置 |
| JP2013196037A (ja) * | 2012-03-15 | 2013-09-30 | Hitachi Ltd | 需要予測システム及び需要予測方法 |
| JP2016045560A (ja) * | 2014-08-20 | 2016-04-04 | 国際航業株式会社 | 電気料金プラン選定システム |
| WO2016088370A1 (ja) * | 2014-12-05 | 2016-06-09 | 日本電気株式会社 | 情報処理装置、モデル構築方法及びプログラム記録媒体 |
-
2016
- 2016-07-20 JP JP2017504444A patent/JP6128296B1/ja active Active
- 2016-07-20 WO PCT/JP2016/071312 patent/WO2018016037A1/ja not_active Ceased
Patent Citations (4)
| Publication number | Priority date | Publication date | Assignee | Title |
|---|---|---|---|---|
| JP2009294969A (ja) * | 2008-06-06 | 2009-12-17 | Mitsubishi Electric Corp | 需要予測方法および需要予測装置 |
| JP2013196037A (ja) * | 2012-03-15 | 2013-09-30 | Hitachi Ltd | 需要予測システム及び需要予測方法 |
| JP2016045560A (ja) * | 2014-08-20 | 2016-04-04 | 国際航業株式会社 | 電気料金プラン選定システム |
| WO2016088370A1 (ja) * | 2014-12-05 | 2016-06-09 | 日本電気株式会社 | 情報処理装置、モデル構築方法及びプログラム記録媒体 |
Cited By (5)
| Publication number | Priority date | Publication date | Assignee | Title |
|---|---|---|---|---|
| KR101989493B1 (ko) * | 2018-03-05 | 2019-06-14 | 숭실대학교산학협력단 | 전력 사용량 예측 시스템 및 방법 |
| JP2020052840A (ja) * | 2018-09-27 | 2020-04-02 | 株式会社リコー | 情報処理システム、情報処理装置、情報処理方法及びプログラム |
| JP7210970B2 (ja) | 2018-09-27 | 2023-01-24 | 株式会社リコー | 情報処理システム、情報処理装置、情報処理方法及びプログラム |
| JP2025127659A (ja) * | 2024-02-21 | 2025-09-02 | 株式会社Looop | 電気代予測システム、電気代予測方法及びプログラム |
| JP7845563B1 (ja) * | 2025-08-28 | 2026-04-14 | 富士電機株式会社 | 情報処理装置、情報処理方法およびプログラム |
Also Published As
| Publication number | Publication date |
|---|---|
| JP6128296B1 (ja) | 2017-05-17 |
| JPWO2018016037A1 (ja) | 2018-08-02 |
Similar Documents
| Publication | Publication Date | Title |
|---|---|---|
| Khuntia et al. | Forecasting the load of electrical power systems in mid‐and long‐term horizons: a review | |
| JP6128296B1 (ja) | 最適メニュー決定システム、最適メニュー決定方法、及びプログラム | |
| Do et al. | Residential building energy consumption: a review of energy data availability, characteristics, and energy performance prediction methods | |
| Chen et al. | A self-adaptive Armijo stepsize strategy with application to traffic assignment models and algorithms | |
| CA3200375A1 (en) | Machine learning forecasting based on residual predictions | |
| Souhe et al. | A hybrid model for forecasting the consumption of electrical energy in a smart grid | |
| Wang et al. | Forecasting Chinese carbon emission intensity based on the interactive effect GM (1, N) power model | |
| Mbasso et al. | Hybrid modeling approach for precise estimation of energy production and consumption based on temperature variations | |
| Shi et al. | Demand‐side price‐responsive flexibility and baseline estimation through end‐to‐end learning | |
| CN106295877A (zh) | 一种智能电网电能使用量预测方法 | |
| Mashal | Evaluation and assessment of smart grid reliability using fuzzy multi-criteria decision-making | |
| Hassan et al. | Improving prediction accuracy of multi-criteria recommender systems using adaptive genetic algorithms | |
| Tokuyama et al. | The effect of using attribute information in network traffic prediction with deep learning | |
| CN110826949A (zh) | 产能控制实现方法和装置 | |
| Li et al. | A new grey prediction model for forecasting the automobiles ownership in China | |
| Chica et al. | Application of autoregressive model with exogenous inputs to identify and analyse patterns of solar global radiation and ambient temperature | |
| Yusuf et al. | PV Hosting Capacity Estimation in Low-Voltage Secondary Networks Using Statistical Properties of AMI Data | |
| JP2008102816A (ja) | 省エネルギー報告書作成装置およびその装置を使用してエネルギー使用量を予測する方法 | |
| Lv et al. | Simulation-based production analysis of mixed-model assembly lines with uncertain processing times | |
| CN105427118A (zh) | 一种应用于电子商务的商品销量预测算法 | |
| Soufiani et al. | Modelling the stochastic charging behaviour of electric vehicles: a validated framework with user charging data | |
| Syntetos et al. | Forecasting of compound Erlang demand | |
| JP2016213987A (ja) | 電力小売料金メニュー策定装置 | |
| CN108428022A (zh) | 一种基于相关度的短期实时电价趋势预测方法 | |
| Li et al. | Modeling and analysis of uncertain Bass diffusion model driven by uncertain Liu process |
Legal Events
| Date | Code | Title | Description |
|---|---|---|---|
| ENP | Entry into the national phase |
Ref document number: 2017504444 Country of ref document: JP Kind code of ref document: A |
|
| 121 | Ep: the epo has been informed by wipo that ep was designated in this application |
Ref document number: 16909512 Country of ref document: EP Kind code of ref document: A1 |
|
| NENP | Non-entry into the national phase |
Ref country code: DE |
|
| 122 | Ep: pct application non-entry in european phase |
Ref document number: 16909512 Country of ref document: EP Kind code of ref document: A1 |