WO2018002268A1 - Improved methods for determining respiratory properties and system therefor - Google Patents
Improved methods for determining respiratory properties and system therefor Download PDFInfo
- Publication number
- WO2018002268A1 WO2018002268A1 PCT/EP2017/066210 EP2017066210W WO2018002268A1 WO 2018002268 A1 WO2018002268 A1 WO 2018002268A1 EP 2017066210 W EP2017066210 W EP 2017066210W WO 2018002268 A1 WO2018002268 A1 WO 2018002268A1
- Authority
- WO
- WIPO (PCT)
- Prior art keywords
- subject
- excitation signal
- frequency
- breathing
- excitation
- Prior art date
- Legal status (The legal status is an assumption and is not a legal conclusion. Google has not performed a legal analysis and makes no representation as to the accuracy of the status listed.)
- Ceased
Links
Classifications
-
- A—HUMAN NECESSITIES
- A61—MEDICAL OR VETERINARY SCIENCE; HYGIENE
- A61B—DIAGNOSIS; SURGERY; IDENTIFICATION
- A61B5/00—Measuring for diagnostic purposes; Identification of persons
- A61B5/08—Measuring devices for evaluating the respiratory organs
- A61B5/085—Measuring impedance of respiratory organs or lung elasticity
-
- A—HUMAN NECESSITIES
- A61—MEDICAL OR VETERINARY SCIENCE; HYGIENE
- A61B—DIAGNOSIS; SURGERY; IDENTIFICATION
- A61B5/00—Measuring for diagnostic purposes; Identification of persons
- A61B5/48—Other medical applications
- A61B5/486—Biofeedback
Definitions
- the invention pertains to the technical field of measuring respiratory impedances. Specifically the invention aims to provide an improved method and system for measuring the impedance of a respiratory system of a subject for an expanded frequency range (especially in the range of 0.1 to 2 Hz) with reduced spectral leakage and a reduced influence of the subject's natural breathing on the measurements.
- the object of the invention thus lies in it providing a technique and tools to better evaluate respiratory functions in subjects, and to better provide an indication of pathology of respiratory tissues.
- the frequency response function of the impedance of respiratory systems of subject has been studied extensively, as this can provide information about the status of the respiratory system (elastic, inertial and resistive properties thereof) and can thus provide a pathological image of the respiratory system to a physician, for the detection of respiratory diseases and other purposes.
- the forced oscillation technique is a non-invasive technique for determining the impedance of the respiratory system by applying sinusoidal pressure variations to the respiratory system.
- the respiratory impedance can then be determined by the ratio of the measured air pressure and the measured air flow at the mouth of the subject.
- a fourth solution in the state of the art is by using ventilator techniques (artificial ventilation). Again, the subjects must train themselves, this time to relax and submit to the OVW (optimal ventilation waveforms) that breathes for the subjects, which is of course difficult, time-consuming and undesirable. This is described in "Optimal ventilation waveforms for estimating low-frequency respiratory impedance” by Lutchen et al, or in “Partitioning airway and lung tissue resistances in humans: effects of bronchoconstriction" by Kaczka et al.
- the respiratory system and the related measurement instrumentation are assumed to be linear and time invariant, because of the simplicity of the linear time invariant framework.
- the respiratory system and the measurement devices are not linear and change over time.
- One is often not aware of the presence of non-linear distortions, thereby further affirming the necessity of a more reliable technique that minimizes unwanted distortions.
- EP 2384697 discusses the application of FOT techniques and especially methods to reduce noise and unwanted influences from measurements to the excitation signal of the FOT technique, but does not specify the method of applying the forced oscillation as it focusses on cleaning up the signals produced by the forced oscillation interacting with the patient's respiratory system.
- the present invention aims to resolve at least some of the problems mentioned above. It therefore provides a separate technique which can be easily applied to most subjects without requiring training or an invasive procedure, and furthermore greatly reduces perturbations on the measurements by the subject's breathing.
- the present invention in a first aspect provides an improved method for determining respiratory properties of a patient or subject having a respiratory system, specifically for determining the impedance of the respiratory system.
- the method comprises steps applying a first excitation signal to the respiratory system of the subject, usually through an actuator such as an FOT (forced oscillation technique) device which applies pressure oscillations to the respiratory system of the subject.
- an actuator such as an FOT (forced oscillation technique) device which applies pressure oscillations to the respiratory system of the subject.
- the subject's actual breathing frequency is injection-locked.
- the method is able to effect an injection-locking of the subject's respiratory system which does not inconvenience the subject and allows the method to measure a respiratory response with reduced disturbances due to the subject's breathing.
- This injection-locking merely requires the cooperation of the subject during the procedure and guides the subject in order to ensure the desired breathing frequency during the procedure.
- Constructing the first excitation signal is preferably based on the measured natural breathing frequency of the subject.
- the first excitation signal which is applied to the subject's respiratory system, can be constructed in order to avoid the natural breathing frequency of the subject, and thereby avoid overlap of signals from the natural breathing of the subject and signals as a consequence of the first excitation signal, as this overlap would complicate analysis of the results greatly.
- This is for instance achieved by constructing the first excitation signal so that the excitation frequencies thereof are different from the natural breathing frequency (as measured) and harmonics thereof. A practical case for this will be discussed later on in this document.
- the first excitation signal is constructed as a multisine, or at least comprising a multisine, as this allows the excitation frequencies of the first excitation signal to be selected very precisely.
- the invention provides a system for determining respiratory properties of a subject having a respiratory system, with a forced oscillation technique (FOT).
- the system comprises an FOT apparatus for applying a first excitation signal to the respiratory system of the subject and measuring the respiratory properties of the respiratory system (although separate apparatuses could be provided to perform these two actions, these separate apparatuses can be considered as a single apparatus and should not be seen as a restriction).
- the system comprises a device arranged for exposing one or more senses of the subject to a second excitation signal, whereby said second excitation signal is adapted to indicate a natural breathing frequency to the subject.
- the natural breathing frequency is assigned a value in the device, preferably by averaging the actual breathing frequency of the subject over a number of breathing cycles or a predetermined period of time.
- the FOT apparatus is arranged to be able to construct said first excitation signal based on the measured natural breathing frequency of the subject, preferably according to the further instructions provided in this document.
- the FOT apparatus can use one or more techniques in order to provide the oscillations, such as loudspeakers, fans, pumps, ventilators, pistons, valves or others, or combinations thereof.
- the system as proposed is able to be used in performing the methods disclosed in this document.
- the advantages of incorporating the devices in a single system is, amongst others, that this allows the devices (FOT apparatus and device for exposing one or more senses of the subject to the second excitation signal) to be coupled and work jointly, as generally, the first excitation signal and the second excitation signal will be linked to each other as both are based on the natural breathing frequency of the subject under examination .
- the first excitation signal will be based on the natural breathing frequency in order to represent said natural breathing frequency to the subject and injection-lock the subject's breathing rhythm .
- the second excitation signal will generally be constructed in order to avoid overlapping with the natural breathing frequency and harmonics thereof in order to avoid interference between 'noise' signals by the subject's natural breathing and actual signals of the respiratory system of the subject in response to the second excitation signal.
- the invention comprises a computer mountable medium comprising the instructions for executing one or more of the methods described in this document, preferably via a system as described in this document. Description of figures
- FIG. 1 shows a general embodiment of an FOT apparatus according to the invention, with both fans and speakers.
- FIG. 2 shows a schematic representation of measurement of the respiratory admittance (Y, the inverse of the impedance Z), wherein p ao ⁇ p e (by virtue of the feedback compensation in the pressure generator) showing the distortion of the air flow at the airway opening, q ao , which is strongly disturbed by the breathing qb.
- FIG. 3 shows a measurement procedure and parts of the proposed method of the invention, wherein for the excitation frequencies of the first excitation signal, ⁇ ⁇ ' is equal to 2.
- FIG. 4A-B shows an amplitude spectrum of P e and its uncertainty, df e , at the excited freq uency lines without (FIG. 4A) and with (FIG. 4B) use of the adaptive method for constructing the first excitation sig nal .
- the '+' shows P e while the V shows df e (or darker line versus lighter line).
- FIG. 5A-B shows an amplitude spectrum of Q ao over the full measurement without (FIG. 5A) and with (FIG.
- FIG. 6A-B shows an amplitude spectrum of 3 ⁇ 4 and at the excited frequency lines without (FIG. 6A) and with (FIG. 6B) use of the adaptive method, which can be seen to strongly influence the uncertainty around the breathing frequency of 0.27 Hz. Again, shows P e while the shows df e (or darker line versus lighter line).
- FIG. 7A-B shows the real and imaginary part of the respiratory impedance Z (or Z ⁇ s in the figures) and the 95% confidence regions without (FIG. 7A) and with (FIG. 7B) use of the adaptive method, clearly demonstrating the value of the adaptive method .
- FIG. 8 shows the decomposition of the admittance of the respiratory system of a subject.
- the present invention concerns an improved method for obtaining information concerning the state of a subject's respiratory system, particularly properties such as the impedance of said respiratory system, through a non-invasive procedure. Due to the many problems or difficulties with the known techniques in this field, there is a need for an improved method which will allow a doctor (or nurse or other member of medical staff, and others) to easily perform a measurement of the respiratory system's impedance, without having to either inconvenience the subject and without the need to train the subject or other excessive requirements, as is the case with the previously mentioned methods, techniques and procedures. This will make the procedure useful for more subjects and will enable the practitioner (used in a general sense) to perform the procedure in less time. Unless otherwise defined, all terms used in disclosing the invention, including technical and scientific terms, have the meaning as commonly understood by one of ordinary skill in the art to which this invention belongs. By means of further guidance, term definitions are included to better appreciate the teaching of the present invention.
- a compartment refers to one or more than one compartment.
- the value to which the modifier "about” refers is itself also specifically disclosed.
- FOT force oscillation technique
- FOT employs small- amplitude pressure oscillations superimposed on the normal breathing and therefore has the advantage over conventional respiratory system techniques that it does not require the performance of uncomfortable respiratory maneuvers on the subject but only a soft touch interaction with the subject.
- natural breathing frequency is referred to a measured breathing frequency (preferably assigned a value by averaging several breathing cycles) of the subject in normal circumstances (no abnormal stress, under substantially normal atmospheric conditions, without medication or other possible influences). It is not to be confused with the actual breathing frequency, though these may be the same, or at least similar, as the natural breathing frequency is defined at the start of the procedure and does not change during the procedure (with the exception of certain circumstances such as when the procedure needs to be restarted).
- actual breathing frequency is referred to the real-time breathing frequency of a subject, and is variable in time. However, it lies in the objectives of the invention to reduce this variation as much as possible and actually approximate the measured natural breathing frequency.
- respiratory response it is meant to signify a measured air flow Q e in response to the first excitation signal P e , and without the contribution by the subject's breathing, Qb.
- the air flow that is measured practically will be a total air flow at the airway opening of the subject, Q ao , which is the sum of Q e and Qb.
- the invention provides a method for determining respiratory properties, which comprises the following steps:
- first excitation signal comprises one or more excitation frequencies determined by the natural breathing properties of the subject
- second excitation signal comprises one or more excitation frequencies which are adapted to represent one or more of the measured natural breathing properties of the subject, preferably at least the measured natural breathing frequency
- the step of applying the first excitation signal to the respiratory system and the step of exposing one or more senses to the second excitation signal are executed substantially simultaneously (or at least partially overlapping), preferably whereby the step of exposing one or more senses to the second excitation signal starts before the step of applying the first excitation signal to the respiratory system. More preferably the step of exposing one or more senses to the second excitation signal starts at the beginning of an inhalation to ease the synchronization of the patients breathing with the second excitation signal. Even more preferably the step of applying the first excitation signal to the respiratory system stops before the step of exposing one or more senses to the second excitation signal stops.
- the second excitation signal is exposed to one or more senses of the subject in at least one non-intrusive manner, whereby the second excitation signal is adapted to represent and/or demonstrate the measured natural breathing frequency, for interlocking the respiratory system of the subject to match the second excitation signal.
- this second excitation signal does not physically coerce the subject to breathe according to a forcefully imposed rhythm, but is used to (even subconsciously) achieve a similar effect.
- This effect entails the stabilization of the breathing frequency of the subject to match the second excitation signal, whereby the second excitation signal was specifically constructed to represent a measured natural breathing frequency. That would mean the constructed second excitation signal will already lie very close to the actual breathing frequency of the subject and so the subject will have little trouble in shifting his actual breathing frequency (only slightly) to match the desired frequency.
- the preferred senses of the subject to which the second excitation signal is exposed is either sight and/or hearing, as stimuli to these senses are typically most easily processed and acted upon.
- the invention overcomes these problems in a noninvasive manner by obtaining the subject's natural breathing frequency (or an estimate thereof) in an offline measurement of his breathing.
- This natural breathing frequency is used to construct the first excitation signal that is applied by an FOT apparatus to the subject's respiratory system in a way so the excited frequencies of said first excitation signal do not overlap with the signal caused by the subject's breathing.
- This is a first step in reducing undesirable distortion of the response signal.
- the response signal still retained a lot of disturbances, which impedes the determination of the correct impedance of the respiratory system. These disturbances are caused by modulation of the subject's breathing, in frequency and/or in amplitude which in turn causes an erratic signal caused by the subject's breathing.
- the unpredictable nature of the breathing does not allow these disturbances to be properly filtered, thereby muddying up the response signal.
- the applicant cleverly provides a step wherein the subject is injection-locked in a non-intrusive, easy (without requiring training) fashion, which has proven to solve the problems concerning the breathing modulation to such an extent that the disturbances by the breathing modulation are reduced by a significant order.
- the applicant succeeded in this by providing a second excitation signal and exposing the subject to this second excitation signal, which is based on the subject's natural breathing frequency (which is preferably measured shortly before the procedure). This guides the subject into a natural cadence of breathing, greatly reducing aberrations of the subject's actual breathing rhythm from a theoretical constant breathing rhythm.
- the proposed improvement does not force the subject into a breathing rhythm but rather assists the subject in a stricter adherence to a theoretical constant breathing rhythm.
- the prior art techniques impose this regime on the subject which is invasive, often requires a substantial amount of training and has a certain risk along with it, as machine malfunction or problems with the subject (panic attack, dyspnea or other respiratory problems) could pose a real danger to the subject who has surrendered respiratory functions to a machine.
- a method according to embodiments of the present invention may further comprise, at least once, and preferably a plurality of times such as 2, 3, 4, 5, 6, 7, 8, 9, 10, 12, 15, 20, 25, 30, 40, 50 to 100 and all intermediate numbers, repeating at least some of the steps of the method (most preferably all steps but step a. are repeated as generally speaking the subject's measured natural breathing frequency should be representative for the entirety of the procedure) but under varying conditions such as different excitation frequencies of the first excitation signal (or differences in phase and/or amplitude of subsignals).
- the excitation frequencies of the first excitation signal will be in the frequency range of 0.01 Hz to 50 Hz, for instance 0.1 Hz to 30 Hz, or 0.1 Hz to 22 Hz, or in more specific subranges having bounds from the following list: 0.02, 0.05, 0.1, 0.2, 0.3, 0.4, 0.5, 0.6, 0.7, 0.8, 0.9, 1.0, 1.1, 1.2, 1.3, 1.4, 1.5, 1.6, 1.7, 1.8, 1.9, 2.0, 2.2, 2.4, 2.6, 2.8, 3.0, 3.2, 3.4, 3.6, 3.8, 4.0, 4.2, 4.4, 4.6, 4.8, 5.0, 5.5, 6.0, 6.5, 7.0, 7.5, 8.0, 8.5, 9.0, 9.5, 10.0, 11, 12, 13, 14, 15, 16, 17, 18, 19, 20, 22, 24, 26, 28,
- the excitation frequencies of the first excitation signal are different from the excitation frequencies of the second signal in a way such that both spectra are not overlapping.
- the excitation frequencies of the first excitation signal are different from the excitation frequencies of the second signal in a way such that both spectra are not overlapping.
- leakage introduced by aperiodicity of the second signal gives negligible contribution at the excitation frequencies of the first excitation signal, when the measurement time corresponds to an integer number of periods of the first excitation signal. This is ensured by considering how long the measurements will last, based on this the minimal difference between the first and second excitation signal can be defined (or at least a preferred minimal difference estimated) to ensure that the spectra can be separated.
- the excitation frequencies of the first excitation signal are different from the excitation frequencies of the second signal by at least 5% of the measured natural breathing frequency.
- smaller differences 2% or less of the measured natural breathing frequency
- it is furthermore encouraged to have at least a separation of at least 5%, or even 10%, of the measured natural breathing frequency, preferably more such as 15%, 20%, 25% etc.
- a base frequency, fb is defined.
- the excitation frequencies of the second excitation signal are either said base frequency or a multiple of said base frequency.
- 'k' and ⁇ ⁇ ' are positive integers wherein 'k' is not equal to ⁇ ⁇ ' or a multiple of ⁇ ⁇ '.
- ⁇ ⁇ ' is equal to 2, however other options are also possible such as 3, 4, 5, 6, 8, 10, 12, 15, 20 and others.
- the base frequency is equal to the measured natural breathing frequency.
- the proposed restrictions to the frequencies of the first and the second excitation signal ensures for a maximal distance between the separate excitation signals, and more specifically to the response signal to the first excitation signal and the signal that is caused by the subject's breathing (which generally follows the second excitation signal).
- ⁇ ⁇ ' equals 2
- the frequencies of the first and the second excitation signal fall right in the middle of each other which would provide an response signal optimally free of distortions and interference, and thereby an improved signal-to-noise ratio (as will be shown and discussed later in this document).
- N is the number of excited frequency components (and thus a positive integer), while preferably Ak is a user defined amplitude spectrum of the k-th frequency.
- the phases cpi ⁇ are preferably drawn from an independent uniformly distributed random process on [0, 2 ⁇ ).
- an odd random phase multisine can be used for the first excitation signal as this has the further advantage that even and odd nonlinear contributions and/or time variations can be detected by measuring the power generated at the non-excited frequency lines. While it would also be possible to construct the first excitation signal with a single excitation frequency, this would require a series of measurements under different excitation frequencies and a longer procedure, as such a multisine first excitation signal is usually preferable.
- this may comprise optimizing the excitation signal to reduce the non-linear effects of measurement instrumentation. This may be obtained for example by a proper choice of the phases cpi ⁇ and the amplitudes Ak.
- Such non-linear behavior of the measurement instrumentation and excitation frequencies responsible for this non-linear behavior can be determined before starting an actual measurement on a subject.
- the first excitation signal is constructed so that it comprises frequencies which differ from the excitation frequencies of the second excitation signal by at least 5%, preferably 10%, preferably even more such as 15%, 20%, 25%, 30%, 35%, 40%, 45% or 50%, of the measured natural breathing frequency (however other differences may also prove to be sufficient, such as 1%, 2%, 3%, 4%, 6%, 7%, 8%, 9%).
- the difference between the measured natural breathing frequency (and its harmonics) and the first excitation signal is necessary to separate signal from noise.
- the second excitation signal will be constructed from subsignals with frequencies equal to or a multiple of the measured natural breathing frequency.
- the response signal generated by the actual first excitation signal (which is in principle the signal that is to be obtained by the procedure) and the signal generated by the subject's breathing can be easily separated as these have sufficiently different frequencies to be distinguished from each other.
- a base frequency, fb is defined.
- the excitation frequencies of the second excitation signal are either said base frequency, or a multiple of said base frequency.
- 'k' and ⁇ ⁇ ' are positive integers, wherein 'k' is not equal to ⁇ ⁇ ' or a multiple of ⁇ ⁇ '.
- ⁇ ⁇ ' is equal to 2, thereby constructing a first excitation signal with excitation frequencies of fb/2, 3fb/2, 5fb/2, 7fb/2, 9fb/2 and so on (not necessarily having a component for all of these frequencies however).
- ⁇ ⁇ ' does not necessarily need to be an integer, only the requirement of 'k' not being equal to or a multiple of ⁇ ⁇ ' is necessary, as this makes sure that the response to the first excitation signal does not have overlapping frequencies (or does not strongly overlap at the very least) with the signal caused by the subject's breathing.
- said base frequency fb is the measured natural breathing frequency.
- These one or more unrepresented frequencies are used to quantify one or more signal properties of the respiratory system of the subject, preferably at least one or more of the following signal properties: transient behavior, nonlinear behavior, time-varying behavior of the respiratory system, measurement noise and/or perturbations introduced by the subject's actual breathing.
- the second excitation signal is adapted to provide one or more sensory stimuli to the subject to increase synchronization of the subject's actual breathing frequency with the measured natural breathing frequency.
- the subject's measured natural breathing frequency will typically be very similar to the subject's actual breathing frequency, but it is the aim of the invention to even furthermore modify the subject's actual breathing rhythm and frequency to match a theoretical perfectly periodic breathing rhythm with a frequency equal to the measured natural breathing frequency of the subject.
- the proposed sensory stimuli have been discussed already in this document, but are not limited to what was proposed here. In a preferred embodiment, however, a visual and/or auditory stimulus is applied to the subject as this is both efficient and clear for the subject to react to.
- the second excitation signal is adapted to provide an indication regarding the air flow (in and/or out) of the subject at a given moment and/or an indication of the air flow volume (in and/or out)of the subject, whereby this adapted second excitation signal is designed to keep said air flow and/or said air flow volume stable as well (following a certain profile, preferably also obtained shortly before the procedure) in order to reduce drastic amplitude changes of the signal caused by the subject's breathing.
- the start of the second excitation signal is adapted to the subject's breathing such that faster and/or better synchronization of the subject's breathing can be obtained. This can be done, for example, by starting the second excitation signal at the beginning (or substantially near to said beginning) of an inhalation.
- the first excitation signal is applied to the respiratory system of the subject via one or more actuators using one or multiple feedforward and/or feedback techniques.
- said actuators comprise one or more of the following : pistons, loudspeakers, pumps, ventilators, fans and/or valves.
- Said feedforward techniques are used to compensate the linear dynamic behavior of the measurement system and can for instance entail the adding of a feedforward signal to the signal.
- the feedback techniques are used to compensate for breathing disturbances and can be accomplished through the implementation of a (discrete time) feedback controller in the measurement system.
- the measured flow rate comprises at least a measured respiratory response and a measured breathing response for the respiratory system, wherein a frequency response function, and optionally uncertainty bounds of said frequency response function, is determined by said measured flow rate and the applied first excitation signal.
- said frequency response function indicates an input impedance or its inverse for the respiratory system of the subject at the excitation frequencies of the first excitation signal.
- the impedance of the respiratory system, Z(f) is generally speaking equal to the complex ratio of the excitation pressure, P e (f), and the measured respiratory response, Q e (f), with f the excitation frequency:
- a total air flow response which is the sum of the respiratory response and the breathing contribution.
- the respiratory response is not necessarily equal to the measured air flow, as the contribution by the subject's breathing is detracted from the measured air flow to obtain the respiratory response (and typically also requiring other to remove other disturbances such as time-varying and nonlinear contributions).
- contribution to the frequency response function by the actual breathing of the subject is modelled and eliminated from said frequency response function, and optionally from its uncertainty bounds, thereby providing an unperturbed frequency response function.
- the contribution by the actual breathing of the subject is modelled by at least one (or possibly a combination) of the following techniques: parametric modelling, regularization techniques and/or Kernel based regression techniques. Additionally, other nonparametric modelling techniques could be applied as well, though the applicants remarked significant improvements using the formerly mentioned techniques. Preferably, this contribution is then eliminated from the measured air flow. Due to the unpredictability of the breathing contribution, more advanced modelling techniques are required than usual. These techniques will be discussed in depth at a later stage in this document.
- the quality of the obtained results depends mainly on the certainty with which the actual respiratory response can be separated from the breathing contribution (disturbances caused by the subject's breathing), it is of the utmost importance that the breathing contribution is modelled as accurately as possible.
- the breathing contribution is modelled using complex modelling techniques since the actual breathing of the subject varies strongly from subject to subject with variations on amplitude and frequency, therefore the aforementioned modelling techniques are suggested.
- the respiratory response can be modelled with more ease than the breathing contribution, as this can be modeled by a sum of harmonically related sines and cosines at the excited frequency lines.
- synchronization of the subject's actual breathing frequency with the measured natural breathing frequency is controlled by monitoring the actual breathing frequency, whereby said second excitation signal is adapted when a threshold desynchronization level is detected.
- This adaptation can have several forms, for instance a sensory signal to the subject to resynchronize the actual breathing frequency with the measured natural breathing frequency (such as a light indicating that the subject has deviated and/or alterations to the second excitation signal).
- this adaptation could take the form of actually modifying the frequency of the second excitation signal (to better approximate the actual natural breathing frequency of the subject), and modifying the frequency of the first excitation signal on the basis of the modified first excitation signal.
- the applicants have provided with a number of criteria to which the periods of the measured signal must comply. The first of these criteria is that based on the measured volume at the airway opening as follows:
- vao being the volume at the airway opening and q ao being the measured flow at the airway opening.
- a forgetting factor is introduced by replacing the integral operation with a first order digital filter which converts to the z-domain as:
- K and ai are scaled to the sample frequency.
- the volume is recalculated for each of the 3 measurement sets. Starting from these volume curves, the measurement can be cut up into segments whose length correspond to the period of a multisine. For each of these segments, the phase can be determined. Since a constant phase shift does not indicate a desynchronization, the mean phase is subtracted for each of the 3 measurement sets. When the resulting phase deviates above a threshold cpo, the corresponding period is to be eliminated.
- the statistical properties of the respiratory response at each of the excited lines is considered, and a hypothesis test is constructed which allows the detection of asynchronous breathing. Note that both criteria independently lead to the detection and the elimination of the same data record containing an asynchronous breathing.
- the respiratory responses Q [p] (k) of each p th period is considered together with their sample mean Q(fe) and sample variance ⁇ (3 ⁇ 4) as:
- the alternative hypothesis H i states the other cases; H i : Q [p] (k) ⁇ Qo(k).
- the applicant has additionally implemented a fault detection method in the method and the system of the invention, by adapting the microcontroller unit (MCU) to provide feedback to the user (operator generally).
- MCU microcontroller unit
- This enables the run-time detection of measurement problems.
- the impedances are estimated offline using Matlab and the user is not informed in time if a measurement contains errors. The danger of this procedure is that erroneous measurements go unnoticed until the patient is no longer available while a simple restart of the measurement could have led to an accurate impedance estimate.
- fault detection requires for all the currently applied estimators to be implemented for online calculation on the MCU.
- the protocol consists of a fixed number of measurements, each with a duration of 20 breathing cycles. The low frequent excitations are shifted to prevent frequency overlap with the patient's breathing.
- the amplitude spectrum and excitation grid is independent of the patient.
- One solution could be to optimize the duration of the measurement and the amplitude spectrum of the excitation signal to the patient. For example, if a first measurement showed that additional frequency lines are required below 0.3Hz, a second measurement can be adapted to target specifically that frequency range.
- an FOT apparatus for constructing and applying a first excitation signal to the respiratory system of the subject and measuring the respiratory properties of the respiratory system
- a device arranged for constructing and exposing one or more senses of the subject to a second excitation signal, whereby said second excitation signal is adapted to indicate a natural breathing frequency to the subject, whereby a value can be assigned to said natural breathing frequency in the device and whereby said value is preferably defined by averaging the actual breathing frequency of the subject over a number of breathing cycles or a predetermined period of time.
- the device is arranged to expose the one or more senses of the subject to the second excitation signal in at least one non-intrusive manner for injection-locking the respiratory system of the subject to match the second excitation signal.
- the second excitation signal is adapted to represent and/or demonstrate or indicate the natural breathing frequency to the subject.
- the subject's actual breathing frequency can be influenced in this manner in a non-intrusive manner, and be 'guided' towards a desired (measured) natural breathing frequency.
- the two devices By combining the two devices (or apparatuses) into a single system, they can more easily construct the first and the second excitation signal as these are connected to each other in frequency.
- the advantages of the device for exposing one or more senses of the subject to a second excitation signal are also abundantly clear in view of the methods described in this document.
- This device can construct said second excitation signal and apply it to the subject in order to ensure injection-locking of the breathing of the subject, with the many advantages already discussed.
- the device for exposing one or more senses of the subject to the second excitation signal is configured to provide one or more of the following stimuli to the senses of the subject: auditory stimuli, visual stimuli, tactile stimuli, imposed air flow rate and/or imposed air flow volume.
- This device can be one or more screens, one or more speakers, one or more light-emitting elements, one or more actuators adapted to provided tactile stimuli, one or more pneumonic devices adapted to impose an air flow rate and/or an air flow volume to the respiratory system of a subject or others.
- the stimuli are designed in order to show the subject a desired rhythm for his or hers actual breathing.
- Said rhythm is based on measurements of the subject's natural breathing frequency (preferably taken shortly before the procedure), and by exposing the subject to the stimuli, succeed in injection- locking the respiratory system of the subject and thereby optimally stabilizing the breathing rhythm of the subject and equalizing the actual breathing frequency (approximating the measured natural breathing frequency).
- the device is adapted to either receive an input from an operator or another apparatus, whereby said input comprises (or allows the device to calculate) the measured natural breathing frequency of the subject. Based on said input, and thus the measured natural breathing frequency, the device constructs a second excitation signal and applies this to the subject.
- Said second excitation signal most preferably has a single frequency, being the measured natural breathing frequency of the subject.
- the second excitation signal can thus take a myriad of forms, from a changing color display, a countdown, a sound which changes pitch or with varying intermittency, an actual auditory message, a display of the subject's actual breathing pattern, possibly in comparison to the desired breathing pattern and others.
- the first excitation signal is in most cases applied by the FOT apparatus as a pressure signal to the respiratory system of the subject.
- Said first excitation signal is constructed by the FOT apparatus based on the natural breathing frequency of the subject (or on the base frequency with which the second excitation signal is built if this is different from the natural breathing frequency) whereby excitation frequencies of the first excitation signal do not (substantially) overlap with the natural breathing frequency of the subject (or the mentioned base frequency of the second excitation signal) or integer multiples thereof, in order to avoid interference between the response to the first excitation signal and the contribution of the (normal) breathing of the subject.
- the non-invasive device to expose one or more senses of the subject to the second excitation signal provides injection-locking without actually imposing this injection-locked regime on the subject per se and without creating discomfort for the subject.
- the proposed second excitation signals above are clear and easy to understand for the subject and succeed in greatly reducing the variation on the subject's actual breathing, as has been found by the applicant.
- a device can also be incorporated into the system to execute the measurement of the subject's natural breathing frequency before the rest of the procedure. If said device to measure the natural breathing frequency is connected to the system, these measurements can be easily obtained by the other devices and apparatuses and used to construct the first and the second excitation signal.
- the system comprises a processing unit configured to receive data (measurement data) from the FOT apparatus concerning the measured respiratory properties and capable of processing said data.
- a processing unit configured to receive data (measurement data) from the FOT apparatus concerning the measured respiratory properties and capable of processing said data.
- This may be a computer or similar processor.
- the proposed system is adapted to execute one or more of the methods disclosed in this document.
- the invention provides a computer mountable medium which comprises instructions for executing one or more of the methods disclosed in this document.
- the method is executed on a system as disclosed in this document as well.
- Example 1 FOT apparatus
- FIG. 1 A possible embodiment of the FOT apparatus can be seen in FIG. 1.
- two sets of fans (Bi and B 2 ) are placed causing an air flow (Ai and A 2 ) along the same direction through an object (D).
- the pushing fan (Bi) pushes air into the object while the pulling fan (B 2 ) pulls the air out of the object.
- This object is designed to create an optimized flow transfer from the fans to the middle of the object (Ci) and from the middle of the object to the fans (C 2 ).
- optimized flow transfer implies lowering the turbulences of the air flow.
- Both sets of fans are controlled (by CONi and CON 2 ) by a micro controller unit (MCU).
- PWM pulse width modulated
- Pressure is built up in the middle of the object (D) and a pneumotachograph (E) is placed between the object and the subject (G).
- a membrane (F) is present in the middle of the pneumotachograph and pressure is measured on both the object side (pressure 1 or Pi) and the subject's side (pressure 2 or P 2 ) of the membrane. These pressures are acquired in the MCU.
- the pressure measured at the subject's side of the membrane (P 2 ) is the airway opening pressure or p ao .
- the air flow at the airway opening, q ao is obtained as the ratio of the measured pressure difference between the sensors on both sides and the resistance of the inner membrane of the pneumotachograph R q :
- An alternative way to measure the flow rate is by means of a flow meter based on e.g. ultrasound.
- Pi is generated by using the air flow generated by the fans.
- the advantage of fans over speakers or pistons is that they can generate very low frequent oscillations ( ⁇ 1 Hz).
- Speakers or pistons on the other hand have the advantage that high frequencies (up to 50 Hz) can be excited.
- the setup can be extended with a set of speakers (H) to add high frequency (> 5 Hz) excitation components. That way, a frequency range starting from below breathing frequencies ( ⁇ 1 Hz) to high frequencies (up to 50 Hz) can be excited. This is especially important since these lower frequencies can give an insight to different parts of the respiratory system.
- Example 2 Construction of the first excitation signal
- the frequency band of interest in this setup starts around 0.1 Hz and can go up to 5 Hz (without speakers or pistons).
- a broadband signal is preferred over multiple experiments of a single tone excitation.
- the influence of measurement noise can be strongly attenuated by averaging a periodic input signal over consecutive periods.
- random phase multisines are a powerful tool in identifying a linear dynamic system (Z) in the presence of measurement noise and nonlinear distortions.
- Particularly odd random phase multisines (were only odd multiples of a construction frequency, fo, are excited) have the advantage that even and odd nonlinear contributions can be separated by measuring the power generated at the non-excited frequency lines.
- N is the number of excited frequency components (and thus a positive integer), while Ak is a user defined amplitude spectrum of the k-th frequency.
- the phases cpi ⁇ are drawn from an independent uniformly distributed random process on [0, 2 ⁇ ).
- Example 3 Adaptive method to decrease frequency overlap
- the spectral overlap between Qb (air flow caused by breathing) and Q e (air flow as a reaction to first excitation signal) at the excited frequency lines, ⁇ f 6 strongly jeopardizes the measurement of Q e and thus the measurement of Z.
- the modeling techniques discussed previously can reduce the effect of the breathing on the measurement of Q e .
- the breathing behaves highly nonstationary (strong amplitude and freq uency variation)
- modeling errors are present in the breathing estimation and no accurate measurement of Q e is obtained . Therefore the idea of the presented adaptive method is to decrease the spectral overlap between Qb and Q e by adapting the first excitation signal to the subject's breathing . In that way, the raw measurement is less disturbed at the excited frequency lines and any residual disturbances are more likely to be eliminated by modeling the breathing disturbance.
- the subject is asked to breathe spontaneously such that the measured breathing frequency fb corresponds to his/her natural breathing frequency.
- the next step consists of abstracting the information from the offline breathing measurement.
- fb is estimated (Estimate fb in FIG. 3) by using the Interpolated Fast Fourier Transform (IFFT) as described by Grandke in 'Interpolation Algorithms for Discrete Fourier Transforms of Weighted Signals'.
- IFFT Interpolated Fast Fourier Transform
- the first excitation signal can be adapted to minimize frequency overlap.
- the excited frequency lines ⁇ f 6 are shifted such that they do not coincide with the breathing frequency and its harmonics (Adapt first excitation signal in FIG. 3).
- an ORPM is used as first excitation signal.
- two excitations are simultaneously applied to the subject (Apply pressure excitation and Apply external (visual) stimulus in FIG. 3).
- the adapted pressure excitation is applied at the airway opening using the device discussed before.
- an external stimulus is added to minimize the amplitude and frequency variation of the subject's breathing.
- a visual stimulus through a monitor is used but this can also be done by, for example, an auditory signal.
- the addition of the external stimulus, and the hereby created injection locking tackles the first cause of spectral overlap. Since the external stimulus is based on the subject's natural breathing frequency, a minimal effort is demanded from the subject to maintain this frequency during the measurement. An example is shown in FIG.
- measurement results with and without use of the adaptive method are compared for measurements on a healthy subject.
- the adaptive method is omitted and a measurement is performed without synchronization of the subject's breathing or adaptation of the first excitation signal.
- First excitation signal constructed without the adaptive method The subject breathes spontaneously without following an external stimulus while 9 consecutive periods of an ORPM excitation with a construction frequency of 0. 1 Hz are applied (in the case without the adaptive method, the construction frequency is defined and used to construct the first excitation signal, however without a relation to the natural breathing frequency).
- a feedback controller is used to ensure that the first excitation signal is not disturbed by the breathing disturbances.
- FIG. 5A-B depicts Q ao over the full measurement (without averaging over the periods). Power leaks into the neighboring frequency bins of the fundamental breathing frequency or measured natural breathing frequency fb and its harmonics and the natural breathing frequency fb is found at 0.27 Hz while the second excited bin at 3 times the construction frequency is found at 0.3 Hz. This has as a consequence that spectral leakage of Qb influences Q e as can be seen when comparing FIG.
- the adaptive method is applied for the same subject.
- An offline measurement of 10 seconds is performed and a natural breathing frequency fb of 0.27 Hz is estimated/measured .
- the first excitation signal is adapted ensuring a construction frequency, ⁇ f br of 0.135 Hz (wherein ⁇ ⁇ ' is equal to 2).
- the patient follows a visual signal on a monitor to synchronize with the natural breathing freq uency fb while 9 consecutive periods (for instance) of the ORPM excitation with a construction frequency of 0. 135 Hz are applied .
- the first excitation signal P e and its uncertainty, df e are not influenced by the adaptive method apart from the shift of the excitation frequencies.
- FIG. 5A-B shows the influence of injection locking the patient and adapting the first excitation signal. The spectral leakage that was found in the measurement without external stimulus is strongly decreased due to the injection locking while the fundamental breathing frequency fb and its harmonics are further removed from the excitation lines due to the adapted multisine.
- q e is the response of the LTI system Y rs (as seen in FIG. 2) to the pressure excitation p e as defined by the previous formula for pexci (actually a response to p ao ), it can be modeled by a sum of harmonically related sines and cosines at the excited frequency lines.
- Model of qb-' The first technique models the breathing signal qb using a periodic model which includes both amplitude and phase modulation.
- This model consists of a sum of H harmonically related sine waves with a nonlinearly varying phase O(t) to handle phase modulation and amplitude polynomials Ah(t) to handle amplitude modulation.
- the phase
- phase harmonics can be used to handle frequency variations of the spontaneous breathing.
- the factor V ('nu') can be used in the estimation process to change the periodicity of the instantaneous frequency.
- the amplitudes of the sine waves in the above formula for qb are modeled as polynomials of order M to cope with changing breathing amplitudes during the measurement:
- the total measured flow q ao can be modeled as
- the Levenbergh-Marquardt algorithm is chosen to minimize the cost function w.r.t. e qao . Convergence of this optimization algorithm towards a physically interpretable solution will strongly depend on the condition number of the acobian matrix J with
- the time axis is rescaled using Legendre polynomials.
- a too high model order can increase the condition number of J and thus the ill-posedness of the estimator (i.e. the columns of J are no longer linear independent). Therefore, once the condition number reaches a given threshold value, the model order is no longer increased even if this can lead to a solution with a lower cost function.
- Estimation results can be validated using a subset of the measurements as validation set. Applying the estimated q e and qb on the validation set can tell the user if it's necessary to redo the estimation with a different model order or with a different set of starting values.
- Model In this technique, linear models are used to handle amplitude and frequency variation of the spontaneous breathing. In order to handle amplitude and frequency variation of the spontaneous breathing without the need for parametric models, the data is cut into smaller overlapping segments. This strongly decreases the modulation within this segment and therefore allows to model the signal with polynomial amplitude modulation only.
- the windows are fixed to a length that corresponds to an integer number of periods of the multisine excitation.
- a fundamental breathing frequency 6 [ ⁇ ] is estimated using the Interpolated Fast Fourier Transform of Grandke. With this 6 [ ⁇ ] fixed, a linear breathing model is proposed : with A ⁇ ] (t) and B ⁇ ] (t) polynomials of order P and 9 q l b ] represents the model parameters for the i th window:
- the well-posedness and thus the quality of the estimate q ao depends on the condition number of the regression matrix S. Due to the colliding harmonics in the model for qb and q e , S can become ill conditioned. The ill- conditioning can be handled by estimating 9 qao as:
- the cost function consists of a least squares fit added by a penalty term to add more information about 9 qao
- the regularization parameter ⁇ can be tuned to change the weight of the penalty term on the cost function. Additional information can be inserted into the penalty by use of the regularization matrix Q.
- a simple example is to use Tikhonov regularization on only the breathing parameters 9 qb as proposed in "Numerical methods for the solution of ill-posed problems" by Tikhonov and Goncharsky. In that case the regularization term minimizes the sum of squares of the breathing parameters 9 qb and can be considered as a penalty term that constraints the variance of 9 qb .
- Kernel based regression A third technique here referred to as the 'Kernel Based Regression' (KBR) technique is based on the idea of considering the breathing contribution as a realization of a gaussian process:
- ⁇ ( ⁇ , ⁇ ') the covariance function that describes the covariance between pairs of random variables x and x' (as discussed in Rasmussen's "Gaussian processes for machine learning").
- x can be time instances or frequency lines.
- the covariance function K or kernel contains information about the prior distribution of the particular process, in this case the breathing qb.
- the estimate of the breathing contribution q b is given by:
- qt(t) K(t, t')(K(tJ) + I-y ⁇ l )qb(t)
- Measurements of M consecutive periods of an ORPM excitation given by the formula of Pexci are executed on a healthy patient.
- the pressure p ao and flow q ao at the airway opening are measured.
- the air flow at the airway opening q ao consists of both the breathing disturbance qb and the respiratory response q e .
- the frequency response function (FRF) estimate of the respiratory admittance Y rs is given by:
- Respiratory impedance estimate Z rs The respiratory impedance is considered as a linear time invariant system and can thus be obtained as the inverse of Y rs :
- the confidence region of the FRF estimate is obtained by approximating Z rs by a circular complex normally distributed variable.
- a 95% uncertainty bound on the real and imaginary part of Z rs ⁇ E Re ⁇ 2rs) and E Im(2rs ) is then given by:
- Measurement results with and without use of the adaptive method are compared for measurements on a healthy subject. First the adaptive method is omitted and a measurement is performed without synchronization of the subject's breathing or
- FIG. 5A-B depicts Q ao over the full measurement (without averaging over the periods). Power leaks into the neighboring frequency bins of the fundamental breathing frequency fb and its harmonics and the fundamental (breathing) frequency fb is found at 0.27 Hz while the second excited bin 3fo is found at 0.3 Hz. This ensures that spectral leakage of Qb influences Q e
- the subject follows a visual signal on a monitor to synchronize with fb while 9 consecutive periods of the ORPM excitation (the first excitation sig nal) with an excitation freq uency of 0.135 Hz are applied .
- the excitation signal P e and its uncertainty dp e are not influenced by the adaptive method apart from the shift of the excitation frequencies.
- FIG. 5A-B shows the influence of injection locking the subject and adapting the excitation signal. The spectral leakage that was found in the measurement without external stimulus is strongly decreased due to the injection locking while the fundamental breathing freq uency fb and its harmonics are further removed from the excitation lines due to the adapted multisine.
- Example 7 LPV estimation during breathing
- the pressure excitation signal in this case has only odd excitation frequencies and is represented as follows: l N
- the k th DFT bin corresponds to the frequency kf 0 .
- the breathing frequency corresponds to DFT bin kb equal to that natural number.
- Yo corresponds to the LTI contribution of Y rs .
- the goal is to optimize the measurement procedure such that the separate HTFs Y r , r € ⁇ Nb, -Nb + 1, Nb - 1, Nb ⁇ can be identified. Since the LTI contribution is the main interest of the FOT measurement, extracting Y 0 with high uncertainty will be prioritized.
- a first optimization of the excitation grid aims at reducing the dominant effect of the LPV contributions at the excited frequency lines. Since breathing is always dominant in its first harmonic, it can be stated that
- the second harmonic appears when the breathing pattern of the subject does not behave perfectly symmetric. This is generally the case since both the amplitude as the duration of inhalation and exhalation can differ.
- a possible solution would be to force symmetry on the subjects breathing pattern by an adaptation of the synchronization method (e.g. 50% inhale percentage in both duration and amplitude). In practice this would imply adding more constraints on the standard synchronization procedure while the demanded effort of cooperation is already high for some of the subjects. Therefore it is chosen to keep the measurement procedure as it is and to look for another solution.
- the measurement protocol in the hospital measurements consisted of multiple measurements (generally 3) using the one random phase realization of the pressure excitation signal as presented above.
- the LPV contributions Y-2 can be separated from the LTI contribution Y 0 by using M separate measurements using M different phase realizations.
Landscapes
- Health & Medical Sciences (AREA)
- Life Sciences & Earth Sciences (AREA)
- Heart & Thoracic Surgery (AREA)
- Surgery (AREA)
- Biophysics (AREA)
- Pathology (AREA)
- Engineering & Computer Science (AREA)
- Biomedical Technology (AREA)
- Pulmonology (AREA)
- Medical Informatics (AREA)
- Molecular Biology (AREA)
- Physics & Mathematics (AREA)
- Animal Behavior & Ethology (AREA)
- General Health & Medical Sciences (AREA)
- Public Health (AREA)
- Veterinary Medicine (AREA)
- Biodiversity & Conservation Biology (AREA)
- Physiology (AREA)
- Measurement Of The Respiration, Hearing Ability, Form, And Blood Characteristics Of Living Organisms (AREA)
Abstract
The current invention concerns an improved method for determining respiratory properties for a subject's respiratory system, particularly the respiratory impedance of said respiratory system by an improved, easily executed,non-invasive injection-locking of the subject's breathing rhythm. Furthermore, it concerns a system apt to be used in the determination of respiratory properties for a subject's respiratory system, specifically to be used in the proposed method.
Description
IMPROVED METHODS FOR DETERMINING RESPIRATORY
PROPERTIES AND SYSTEM THEREFOR
Technical field
The invention pertains to the technical field of measuring respiratory impedances. Specifically the invention aims to provide an improved method and system for measuring the impedance of a respiratory system of a subject for an expanded frequency range (especially in the range of 0.1 to 2 Hz) with reduced spectral leakage and a reduced influence of the subject's natural breathing on the measurements. The object of the invention thus lies in it providing a technique and tools to better evaluate respiratory functions in subjects, and to better provide an indication of pathology of respiratory tissues.
Background
In the past, the frequency response function of the impedance of respiratory systems of subject has been studied extensively, as this can provide information about the status of the respiratory system (elastic, inertial and resistive properties thereof) and can thus provide a pathological image of the respiratory system to a physician, for the detection of respiratory diseases and other purposes.
The forced oscillation technique (FOT) is a non-invasive technique for determining the impedance of the respiratory system by applying sinusoidal pressure variations to the respiratory system. The respiratory impedance can then be determined by the ratio of the measured air pressure and the measured air flow at the mouth of the subject.
There remains a need in the art for an improved FOT method for measuring respiratory impedances. The main drawbacks of the methods and systems currently known and used in practice, are that they provide very inaccurate results for frequencies around the natural breathing frequency of the subjects. Several systems even ignore this difficult subrange and only focus on obtaining and analyzing data where the applied oscillations have either higher (or lower) frequencies. However, the contested subrange has proven to be of great significance when trying to evaluate the respiratory system of a subject, and can no longer be ignored. Such methods and systems are described, amongst others, in "Generation of optimum pseudorandom signals for respiratory impedance measurements" by Daroczy et al, "Total respiratory impedance measured by means of the forced oscillation technique in subjects with and without respiratory complaints" by Pasker et al.
Other systems try to resolve the perturbations caused by a subject breathing by training the subjects to stop breathing and keep their glottis open during the measurement procedure. However, this is rather difficult and cannot be requested from most subject, especially when dealing with subjects with a respiratory disease or respiratory problems, children, the elderly or other difficult situations. Furthermore, this would require the subject to undergo said training, which is undesirable. This is described in for instance "Forced oscillatory impedance of the respiratory system" by Hantos et al.
Another option is that the internal movement of the chest is measured by having the subject swallow a balloon in order to measure the pressure inside the stomach of the subject. The swallowing of said balloon is however unpleasant for the subject (induces vomiting) and requires an additional measurement channel besides the already present measurement channels for measuring the air pressure and air flow at the mouth of the subject. This is described in "Human lung impedance from spontaneous breathing frequencies to 32 Hz" by Farre et al, and "Partitioning airway and lung tissue resistances in humans: effects of bronchoconstriction" by Kaczka et al.
A fourth solution in the state of the art is by using ventilator techniques (artificial ventilation). Again, the subjects must train themselves, this time to relax and submit to the OVW (optimal ventilation waveforms) that breathes for the subjects, which is of course difficult, time-consuming and undesirable. This is described in "Optimal ventilation waveforms for estimating low-frequency respiratory impedance" by Lutchen et al, or in "Partitioning airway and lung tissue resistances in humans: effects of bronchoconstriction" by Kaczka et al.
Furthermore, in prior art techniques, the respiratory system and the related measurement instrumentation are assumed to be linear and time invariant, because of the simplicity of the linear time invariant framework. However, in practice the respiratory system and the measurement devices are not linear and change over time. One is often not aware of the presence of non-linear distortions, thereby further affirming the necessity of a more reliable technique that minimizes unwanted distortions. The documents "Oscillatory resistance measured during noninvasive proportional assist ventilation" and "Forced oscillation assessment of respiratory mechanics in ventilated patients" by Ramon Farre, Daniel Navajas et al, discuss non-invasive PAV (Proportional Assist Ventilation) techniques. However, the papers only provide a description of the experiment in which patients are hooked up to a PAV system which controls the patient's breathing, thereby relieving the patient from this natural breathing. This forced
breathing is very inconvenient for the patient. As such, no FOT measurements are done in the presence of the natural breathing of the patient.
Another relevant document as background information is "Estimation of respiratory impedance at low frequencies during spontaneous breathing using the forced oscillation technique" by Hannes Maes et al. This paper discloses FOT measurements on a patient breathing under a natural breathing frequency, but does not discuss any methods to stabilize the breathing, which is in part the objective of this application.
Lastly, EP 2384697 discusses the application of FOT techniques and especially methods to reduce noise and unwanted influences from measurements to the excitation signal of the FOT technique, but does not specify the method of applying the forced oscillation as it focusses on cleaning up the signals produced by the forced oscillation interacting with the patient's respiratory system.
The present invention aims to resolve at least some of the problems mentioned above. It therefore provides a separate technique which can be easily applied to most subjects without requiring training or an invasive procedure, and furthermore greatly reduces perturbations on the measurements by the subject's breathing.
Summary of the invention
The present invention in a first aspect provides an improved method for determining respiratory properties of a patient or subject having a respiratory system, specifically for determining the impedance of the respiratory system. The method comprises steps applying a first excitation signal to the respiratory system of the subject, usually through an actuator such as an FOT (forced oscillation technique) device which applies pressure oscillations to the respiratory system of the subject. During this step, the subject's actual breathing frequency is injection-locked. This is accomplished by exposing the subject's sense(s) to a second excitation signal which is adapted to represent the measured natural breathing frequency of the subject, thereby consciously and/or subconsciously influencing the breathing of the subject and synchronizing this with a desired breathing rhythm, which allows for better results considering the disturbance of the subject's breathing is more constant, whereby said disturbance can better be accounted for. Furthermore, it provides a clearer distinction between signal and noise.
In prior art techniques, either very invasive or demanding steps were resorted to in order to control the subject's natural breathing and to reduce influences and disturbances due to this breathing (and inevitable irregularities in the breathing, both in frequency and in amplitude). These steps were briefly discussed in the technical
background of the invention and were clearly a nuisance to the subject and/or the person performing the procedure. The invention in this document does not require extensive training of the subject or an undesirably invasive step, but exposes the subject to a second signal which is tailored to fit the natural breathing frequency of the subject (which was preferably measured shortly before the ensuing steps of the proposed method). This way, the method is able to effect an injection-locking of the subject's respiratory system which does not inconvenience the subject and allows the method to measure a respiratory response with reduced disturbances due to the subject's breathing. This injection-locking merely requires the cooperation of the subject during the procedure and guides the subject in order to ensure the desired breathing frequency during the procedure.
Constructing the first excitation signal is preferably based on the measured natural breathing frequency of the subject. This way, the first excitation signal, which is applied to the subject's respiratory system, can be constructed in order to avoid the natural breathing frequency of the subject, and thereby avoid overlap of signals from the natural breathing of the subject and signals as a consequence of the first excitation signal, as this overlap would complicate analysis of the results greatly. This is for instance achieved by constructing the first excitation signal so that the excitation frequencies thereof are different from the natural breathing frequency (as measured) and harmonics thereof. A practical case for this will be discussed later on in this document. Preferably, the first excitation signal is constructed as a multisine, or at least comprising a multisine, as this allows the excitation frequencies of the first excitation signal to be selected very precisely.
In a second aspect, the invention provides a system for determining respiratory properties of a subject having a respiratory system, with a forced oscillation technique (FOT). The system comprises an FOT apparatus for applying a first excitation signal to the respiratory system of the subject and measuring the respiratory properties of the respiratory system (although separate apparatuses could be provided to perform these two actions, these separate apparatuses can be considered as a single apparatus and should not be seen as a restriction). Furthermore, the system comprises a device arranged for exposing one or more senses of the subject to a second excitation signal, whereby said second excitation signal is adapted to indicate a natural breathing frequency to the subject. The natural breathing frequency is assigned a value in the device, preferably by averaging the actual breathing frequency of the subject over a number of breathing cycles or a predetermined period of time. Preferably the FOT apparatus is arranged to be able to construct said first excitation signal based on the measured natural breathing frequency of the subject, preferably according to the further
instructions provided in this document. The FOT apparatus can use one or more techniques in order to provide the oscillations, such as loudspeakers, fans, pumps, ventilators, pistons, valves or others, or combinations thereof. The system as proposed is able to be used in performing the methods disclosed in this document. The advantages of incorporating the devices in a single system is, amongst others, that this allows the devices (FOT apparatus and device for exposing one or more senses of the subject to the second excitation signal) to be coupled and work jointly, as generally, the first excitation signal and the second excitation signal will be linked to each other as both are based on the natural breathing frequency of the subject under examination . Preferably the first excitation signal will be based on the natural breathing frequency in order to represent said natural breathing frequency to the subject and injection-lock the subject's breathing rhythm . The second excitation signal will generally be constructed in order to avoid overlapping with the natural breathing frequency and harmonics thereof in order to avoid interference between 'noise' signals by the subject's natural breathing and actual signals of the respiratory system of the subject in response to the second excitation signal.
In a third aspect, the invention comprises a computer mountable medium comprising the instructions for executing one or more of the methods described in this document, preferably via a system as described in this document. Description of figures
FIG. 1 shows a general embodiment of an FOT apparatus according to the invention, with both fans and speakers.
FIG. 2 shows a schematic representation of measurement of the respiratory admittance (Y, the inverse of the impedance Z), wherein pao ~ pe (by virtue of the feedback compensation in the pressure generator) showing the distortion of the air flow at the airway opening, qao, which is strongly disturbed by the breathing qb.
FIG. 3 shows a measurement procedure and parts of the proposed method of the invention, wherein for the excitation frequencies of the first excitation signal, λη' is equal to 2. FIG. 4A-B shows an amplitude spectrum of Pe and its uncertainty, dfe, at the excited freq uency lines without (FIG. 4A) and with (FIG. 4B) use of the adaptive method for constructing the first excitation sig nal . The '+' shows Pe while the V shows dfe (or darker line versus lighter line).
FIG. 5A-B shows an amplitude spectrum of Qao over the full measurement without (FIG. 5A) and with (FIG. 5B) use of the adaptive method, with the natural breathing frequency at 0.27 Hz, and λη' equal to 2 in the adaptive method . The injection locking clearly prevents the breathing disturbances from leaking into neighboring frequency bins of the natural breathing frequency (and its harmonics). The shows the air flow response at the airway opening to the first excitation signal, the V shows the contribution by the subject's breathing (at the natural breathing freq uency and harmonics thereof) or darker lines versus lighter lines. Note that the air flow response at excitation frequencies is displayed with a line from the towards the frequency-axis, the other points can be considered as disturbances (which are considerably less relevant or harmful for the results when using the adaptive method).
FIG. 6A-B shows an amplitude spectrum of ¾ and at the excited frequency lines without (FIG. 6A) and with (FIG. 6B) use of the adaptive method, which can be seen to strongly influence the uncertainty around the breathing frequency of 0.27 Hz. Again, shows Pe while the shows dfe (or darker line versus lighter line).
FIG. 7A-B shows the real and imaginary part of the respiratory impedance Z (or Z^s in the figures) and the 95% confidence regions without (FIG. 7A) and with (FIG. 7B) use of the adaptive method, clearly demonstrating the value of the adaptive method .
FIG. 8 shows the decomposition of the admittance of the respiratory system of a subject.
FIG. 9 shows the pressure excitation P and output contributions Q0, Q± l and Q±2, and the total output Q given breathing variation B, whereby the contributions at the output on bin k are generated by input contributions at bins k - r- kb, with r€ {Nb, -Nb + 1, Nb - 1, Nb} and kb = 2 and Nb = 2. FIG. 10 shows the same as FIG. 9, with kb = 3. Detailed description of the invention
The present invention concerns an improved method for obtaining information concerning the state of a subject's respiratory system, particularly properties such as the impedance of said respiratory system, through a non-invasive procedure. Due to the many problems or difficulties with the known techniques in this field, there is a need for an improved method which will allow a doctor (or nurse or other member of medical staff, and others) to easily perform a measurement of the respiratory system's impedance, without having to either inconvenience the subject and without the need to
train the subject or other excessive requirements, as is the case with the previously mentioned methods, techniques and procedures. This will make the procedure useful for more subjects and will enable the practitioner (used in a general sense) to perform the procedure in less time. Unless otherwise defined, all terms used in disclosing the invention, including technical and scientific terms, have the meaning as commonly understood by one of ordinary skill in the art to which this invention belongs. By means of further guidance, term definitions are included to better appreciate the teaching of the present invention.
As used herein, the following terms have the following meanings: "A", "an", and "the" as used herein refers to both singular and plural referents unless the context clearly dictates otherwise. By way of example, "a compartment" refers to one or more than one compartment.
"About" as used herein referring to a measurable value such as a parameter, an amount, a temporal duration, and the like, is meant to encompass variations of +/-20% or less, preferably +/-10% or less, more preferably +/-5% or less, even more preferably +/- 1% or less, and still more preferably +/-0.1% or less of and from the specified value, in so far such variations are appropriate to perform in the disclosed invention. However, it is to be understood that the value to which the modifier "about" refers is itself also specifically disclosed. "Comprise", "comprising", and "comprises" and "comprised of" as used herein are synonymous with "include", "including", "includes" or "contain", "containing", "contains" and are inclusive or open-ended terms that specifies the presence of what follows e.g. component and do not exclude or preclude the presence of additional, non-recited components, features, element, members, steps, known in the art or disclosed therein. By the phrase "exposing the senses of the subject" as used herein, is referred to sensory stimulation in a broad view. This ranges from providing visual stimuli to a subject (lights, colors, intensity, movement, gestures, clock, symbols or combinations thereof), auditory stimuli (sounds, changing of volume, frequency, and others or combinations), tactile stimuli, or even through taste, temperature, pain, balance, vibration, and/or smell. Of course combinations of multiple of the abovementioned stimuli are possible.
By the terms "forced oscillation technique" or "FOT" as used herein, is referred to a noninvasive method with which to measure respiratory mechanics. FOT employs small- amplitude pressure oscillations superimposed on the normal breathing and therefore has the advantage over conventional respiratory system techniques that it does not
require the performance of uncomfortable respiratory maneuvers on the subject but only a soft touch interaction with the subject.
By the term "natural breathing frequency" as used herein, is referred to a measured breathing frequency (preferably assigned a value by averaging several breathing cycles) of the subject in normal circumstances (no abnormal stress, under substantially normal atmospheric conditions, without medication or other possible influences). It is not to be confused with the actual breathing frequency, though these may be the same, or at least similar, as the natural breathing frequency is defined at the start of the procedure and does not change during the procedure (with the exception of certain circumstances such as when the procedure needs to be restarted).
By the term "actual breathing frequency" as used herein, is referred to the real-time breathing frequency of a subject, and is variable in time. However, it lies in the objectives of the invention to reduce this variation as much as possible and actually approximate the measured natural breathing frequency. By the term "respiratory response" it is meant to signify a measured air flow Qe in response to the first excitation signal Pe, and without the contribution by the subject's breathing, Qb. The air flow that is measured practically will be a total air flow at the airway opening of the subject, Qao, which is the sum of Qe and Qb. The applicant would however like to note that other physical parameters could possibly be measured instead of the air flow in this method in order to eventually obtain the respiratory impedance, however this substitution would fall under the scope of the invention as the method in se remains the same.
The recitation of numerical ranges by endpoints includes all numbers and fractions subsumed within that range, as well as the recited endpoints. In a first aspect, the invention provides a method for determining respiratory properties, which comprises the following steps:
a. measuring natural breathing properties of the subject, whereby said properties comprise at least a natural breathing frequency of the subject, preferably whereby the natural breathing frequency is measured by averaging the actual breathing frequency of the subject over a number of breathing cycles or a predetermined period of time;
b. constructing a first and a second excitation signal, whereby the first excitation signal comprises one or more excitation frequencies determined by the natural breathing properties of the subject, and whereby the second excitation signal comprises one or more excitation frequencies which are adapted to represent
one or more of the measured natural breathing properties of the subject, preferably at least the measured natural breathing frequency;
c. applying the first excitation signal to the respiratory system of the subject, preferably via pressure oscillations;
d. exposing one or more senses of the subject to said second excitation signal, thereby injection locking the respiratory system of the subject;
e. measuring a respiratory response of the respiratory system of the subject to the first excitation signal.
Herein the step of applying the first excitation signal to the respiratory system and the step of exposing one or more senses to the second excitation signal are executed substantially simultaneously (or at least partially overlapping), preferably whereby the step of exposing one or more senses to the second excitation signal starts before the step of applying the first excitation signal to the respiratory system. More preferably the step of exposing one or more senses to the second excitation signal starts at the beginning of an inhalation to ease the synchronization of the patients breathing with the second excitation signal. Even more preferably the step of applying the first excitation signal to the respiratory system stops before the step of exposing one or more senses to the second excitation signal stops.
As mentioned throughout the rest of the text, the second excitation signal is exposed to one or more senses of the subject in at least one non-intrusive manner, whereby the second excitation signal is adapted to represent and/or demonstrate the measured natural breathing frequency, for interlocking the respiratory system of the subject to match the second excitation signal. It is crucial that this is well understood, since many prior art systems impose such a secondary signal on one or more senses of the subject, but in doing so, breathing according to this secondary signal is thus forced on the subject, who is physically coerced to follow the secondary signal. The drawbacks of these prior art systems have been discussed in the background already, and will be further elaborated upon in what follows. The invention of this application lies exactly in the fact that this second excitation signal does not physically coerce the subject to breathe according to a forcefully imposed rhythm, but is used to (even subconsciously) achieve a similar effect. This effect entails the stabilization of the breathing frequency of the subject to match the second excitation signal, whereby the second excitation signal was specifically constructed to represent a measured natural breathing frequency. That would mean the constructed second excitation signal will already lie very close to the actual breathing frequency of the subject and so the subject will have little trouble in shifting his actual breathing frequency (only slightly) to match the desired frequency.
Note that the preferred senses of the subject to which the second excitation signal is exposed, is either sight and/or hearing, as stimuli to these senses are typically most easily processed and acted upon. However, other (supporting) stimuli are of course possible. Some of the advantages of the proposed method have been generally discussed before in this document. As mentioned before, one of the recurring difficulties in prior art techniques is that, for lower frequencies, especially in the range of a subject's normal breathing frequency (actual breathing frequency), a response signal to the first excitation signal applied to the respiratory system of the subject contains a great deal of disturbances of the breathing by the subject which is variable both in frequency and amplitude and thereby provides an unpredictable distortion on the response signal. Furthermore the subject's breathing interferes with the response signal as these are generally in a similar frequency range, and when the first excitation signal has a similar frequency as the subject's breathing, the breathing and the response signal will interfere. These interferences are notoriously difficult to filter out, even when only attempting to do so to a medium extent, and thus will always cause a response signal that needs improving.
The invention overcomes these problems in a noninvasive manner by obtaining the subject's natural breathing frequency (or an estimate thereof) in an offline measurement of his breathing. This natural breathing frequency is used to construct the first excitation signal that is applied by an FOT apparatus to the subject's respiratory system in a way so the excited frequencies of said first excitation signal do not overlap with the signal caused by the subject's breathing. This is a first step in reducing undesirable distortion of the response signal. However, despite this solution, the response signal still retained a lot of disturbances, which impedes the determination of the correct impedance of the respiratory system. These disturbances are caused by modulation of the subject's breathing, in frequency and/or in amplitude which in turn causes an erratic signal caused by the subject's breathing. The unpredictable nature of the breathing does not allow these disturbances to be properly filtered, thereby muddying up the response signal. The applicant cleverly provides a step wherein the subject is injection-locked in a non-intrusive, easy (without requiring training) fashion, which has proven to solve the problems concerning the breathing modulation to such an extent that the disturbances by the breathing modulation are reduced by a significant order. The applicant succeeded in this by providing a second excitation signal and exposing the subject to this second excitation signal, which is based on the subject's natural breathing frequency (which is preferably measured shortly before the procedure). This guides the subject into a natural cadence of breathing, greatly reducing
aberrations of the subject's actual breathing rhythm from a theoretical constant breathing rhythm. Furthermore, as opposed to some prior art techniques, where the injection-locking is invasively forced upon a subject by actually taking over the respiratory function of the subject (even resorting to inserting a balloon-tipped catheter into the subject's esophagus), the proposed improvement does not force the subject into a breathing rhythm but rather assists the subject in a stricter adherence to a theoretical constant breathing rhythm. The prior art techniques impose this regime on the subject which is invasive, often requires a substantial amount of training and has a certain risk along with it, as machine malfunction or problems with the subject (panic attack, dyspnea or other respiratory problems) could pose a real danger to the subject who has surrendered respiratory functions to a machine. In the proposed technique, the subject can always simply not follow the guiding instructions of the second excitation signal and switch to a personally preferred rhythm, and this would merely invalidate the measurement at that specific time. Preferably a method according to embodiments of the present invention may further comprise, at least once, and preferably a plurality of times such as 2, 3, 4, 5, 6, 7, 8, 9, 10, 12, 15, 20, 25, 30, 40, 50 to 100 and all intermediate numbers, repeating at least some of the steps of the method (most preferably all steps but step a. are repeated as generally speaking the subject's measured natural breathing frequency should be representative for the entirety of the procedure) but under varying conditions such as different excitation frequencies of the first excitation signal (or differences in phase and/or amplitude of subsignals). By repetition of the same process with excitation signals with different parameters, non-linearities and time variations can be better determined, hence better and more reliable results are finally obtained. Generally, the excitation frequencies of the first excitation signal will be in the frequency range of 0.01 Hz to 50 Hz, for instance 0.1 Hz to 30 Hz, or 0.1 Hz to 22 Hz, or in more specific subranges having bounds from the following list: 0.02, 0.05, 0.1, 0.2, 0.3, 0.4, 0.5, 0.6, 0.7, 0.8, 0.9, 1.0, 1.1, 1.2, 1.3, 1.4, 1.5, 1.6, 1.7, 1.8, 1.9, 2.0, 2.2, 2.4, 2.6, 2.8, 3.0, 3.2, 3.4, 3.6, 3.8, 4.0, 4.2, 4.4, 4.6, 4.8, 5.0, 5.5, 6.0, 6.5, 7.0, 7.5, 8.0, 8.5, 9.0, 9.5, 10.0, 11, 12, 13, 14, 15, 16, 17, 18, 19, 20, 22, 24, 26, 28, 30, 32, 34, 36, 38, 40, 42, 44, 46, 48 or 50 (all in Hz). Obviously all intermediate values are to be considered as part of this listing, especially since the actual values will typically be very dependent from subject to subject and from procedure to procedure, and will be substantially random. In a preferred embodiment of the method, the excitation frequencies of the first excitation signal are different from the excitation frequencies of the second signal in a
way such that both spectra are not overlapping. Preferably in a way such that leakage introduced by aperiodicity of the second signal gives negligible contribution at the excitation frequencies of the first excitation signal, when the measurement time corresponds to an integer number of periods of the first excitation signal. This is ensured by considering how long the measurements will last, based on this the minimal difference between the first and second excitation signal can be defined (or at least a preferred minimal difference estimated) to ensure that the spectra can be separated.
In a preferred embodiment of the method, the excitation frequencies of the first excitation signal are different from the excitation frequencies of the second signal by at least 5% of the measured natural breathing frequency. Although smaller differences (2% or less of the measured natural breathing frequency) between the excitation frequencies of the first and second excitation signals could be sufficient, it is furthermore encouraged to have at least a separation of at least 5%, or even 10%, of the measured natural breathing frequency, preferably more such as 15%, 20%, 25% etc. This would allow for minimal overlap of the response signals to the first excitation signal and signals caused by the actual breathing of the subject, which would have similar frequencies as the excitation frequencies of the second excitation signal (as said second excitation signal is adapted to signify the measured natural breathing frequency of the subject and effect injection-locking of the subject's actual breathing). By reducing the overlap, the actual response signals will be more easily distinguishable from disturbances from the subject's breathing and reduce possible interferences of the separate signals.
In a preferred embodiment, a base frequency, fb, is defined. The excitation frequencies of the second excitation signal are either said base frequency or a multiple of said base frequency. Furthermore, the following relationship applies to the excitation frequencies of the first excitation signal, fexci : fexcl = ^ f&- Herein, 'k' and λη' are positive integers wherein 'k' is not equal to λη' or a multiple of λη'. Preferably, λη' is equal to 2, however other options are also possible such as 3, 4, 5, 6, 8, 10, 12, 15, 20 and others. Most preferably, the base frequency is equal to the measured natural breathing frequency.
The proposed restrictions to the frequencies of the first and the second excitation signal ensures for a maximal distance between the separate excitation signals, and more specifically to the response signal to the first excitation signal and the signal that is caused by the subject's breathing (which generally follows the second excitation signal). In the case where λη' equals 2, the frequencies of the first and the second excitation signal fall right in the middle of each other which would provide an response signal optimally free of distortions and interference, and thereby an improved signal-to-noise ratio (as will be shown and discussed later in this document).
Generally speaking, the first excitation signal can be constructed as a random phase multisine (RPM), as follows: i i(t) = sin(27T -fbt + cpk)

Wherein N is the number of excited frequency components (and thus a positive integer), while preferably Ak is a user defined amplitude spectrum of the k-th frequency. The phases cpi< are preferably drawn from an independent uniformly distributed random process on [0, 2π). Optionally, an odd random phase multisine can be used for the first excitation signal as this has the further advantage that even and odd nonlinear contributions and/or time variations can be detected by measuring the power generated at the non-excited frequency lines. While it would also be possible to construct the first excitation signal with a single excitation frequency, this would require a series of measurements under different excitation frequencies and a longer procedure, as such a multisine first excitation signal is usually preferable.
Furthermore, when constructing said first excitation signal, this may comprise optimizing the excitation signal to reduce the non-linear effects of measurement instrumentation. This may be obtained for example by a proper choice of the phases cpi< and the amplitudes Ak. Such non-linear behavior of the measurement instrumentation and excitation frequencies responsible for this non-linear behavior can be determined before starting an actual measurement on a subject. As mentioned, it is furthermore a goal of the invention to clearly separate the first excitation signal and the response thereto, and the subject's actual breathing and the signal generated thereby. This is accomplished by constructing the first excitation signal so that this differs from the subject's natural breathing based on frequency, which allows for an easy separation or filtering, as the response signal to the first excitation signal will generally be constituted of signals with frequencies (substantially) the same as the frequencies of the first excitation signal, or centered around said frequencies. In practice, the first excitation signal is constructed so that it comprises frequencies which differ from the excitation frequencies of the second excitation signal by at least 5%, preferably 10%, preferably even more such as 15%, 20%, 25%, 30%, 35%, 40%, 45% or 50%, of the measured natural breathing frequency (however other differences may also prove to be sufficient, such as 1%, 2%, 3%, 4%, 6%, 7%, 8%, 9%). It is furthermore to be considered that the difference between the measured natural breathing frequency (and its harmonics) and the first excitation signal, is necessary to separate signal from noise. As such, it should be understood that by measuring over
longer time, a smaller difference between the frequencies could be allowed while still ensuring that signal can be distinguished from noise. Generally, the second excitation signal will be constructed from subsignals with frequencies equal to or a multiple of the measured natural breathing frequency. As such, the response signal generated by the actual first excitation signal (which is in principle the signal that is to be obtained by the procedure) and the signal generated by the subject's breathing can be easily separated as these have sufficiently different frequencies to be distinguished from each other.
In a preferred embodiment, a base frequency, fb, is defined. The excitation frequencies of the second excitation signal are either said base frequency, or a multiple of said base frequency. The excitation frequencies of the first excitation signal, fexci, all follow the following relation : fexcl = ^fb. Herein, 'k' and λη' are positive integers, wherein 'k' is not equal to λη' or a multiple of λη'. Preferably, λη' is equal to 2, thereby constructing a first excitation signal with excitation frequencies of fb/2, 3fb/2, 5fb/2, 7fb/2, 9fb/2 and so on (not necessarily having a component for all of these frequencies however). More generally however, λη' does not necessarily need to be an integer, only the requirement of 'k' not being equal to or a multiple of λη' is necessary, as this makes sure that the response to the first excitation signal does not have overlapping frequencies (or does not strongly overlap at the very least) with the signal caused by the subject's breathing. Most preferably, said base frequency fb is the measured natural breathing frequency. In a further preferred embodiment, one or more of the frequencies according to the relation fexcl = ^ f&, are not represented in the first excitation signal for one or more possible values of k. These one or more unrepresented frequencies are used to quantify one or more signal properties of the respiratory system of the subject, preferably at least one or more of the following signal properties: transient behavior, nonlinear behavior, time-varying behavior of the respiratory system, measurement noise and/or perturbations introduced by the subject's actual breathing.
In a preferred embodiment, the second excitation signal is adapted to provide one or more sensory stimuli to the subject to increase synchronization of the subject's actual breathing frequency with the measured natural breathing frequency. As mentioned, the subject's measured natural breathing frequency will typically be very similar to the subject's actual breathing frequency, but it is the aim of the invention to even furthermore modify the subject's actual breathing rhythm and frequency to match a theoretical perfectly periodic breathing rhythm with a frequency equal to the measured natural breathing frequency of the subject. The proposed sensory stimuli have been discussed already in this document, but are not limited to what was proposed here. In
a preferred embodiment, however, a visual and/or auditory stimulus is applied to the subject as this is both efficient and clear for the subject to react to.
Even more preferably, the second excitation signal is adapted to provide an indication regarding the air flow (in and/or out) of the subject at a given moment and/or an indication of the air flow volume (in and/or out)of the subject, whereby this adapted second excitation signal is designed to keep said air flow and/or said air flow volume stable as well (following a certain profile, preferably also obtained shortly before the procedure) in order to reduce drastic amplitude changes of the signal caused by the subject's breathing. This could be achieved for instance by using an air flow meter (or similar device) in the method that can give an indication (possibly real-time or approximately) of the air flow and/or display a profile which shows the subject a desired air flow regime during the procedure. This and more can be combined to show the subject whether he or she is inhaling too much or too little and can allow the subject to compensate in order to follow a stable breathing regime. In a preferred embodiment, the start of the second excitation signal is adapted to the subject's breathing such that faster and/or better synchronization of the subject's breathing can be obtained. This can be done, for example, by starting the second excitation signal at the beginning (or substantially near to said beginning) of an inhalation. By having the second excitation signal 'follow' the subject's lead, this will allow for an easier synchronization of the subject's breathing with the second excitation signal, as opposed to having the second excitation signal start at a random moment, which means that the subject can be expected to have to adapt his or her breathing pattern more strongly, requiring more time and effort from the subject (which could influence the measurements somewhat) to start the procedure. In a preferred embodiment, the first excitation signal is applied to the respiratory system of the subject via one or more actuators using one or multiple feedforward and/or feedback techniques. Preferably said actuators comprise one or more of the following : pistons, loudspeakers, pumps, ventilators, fans and/or valves. Said feedforward techniques are used to compensate the linear dynamic behavior of the measurement system and can for instance entail the adding of a feedforward signal to the signal. The feedback techniques are used to compensate for breathing disturbances and can be accomplished through the implementation of a (discrete time) feedback controller in the measurement system.
In a preferred embodiment, the measured flow rate comprises at least a measured respiratory response and a measured breathing response for the respiratory system,
wherein a frequency response function, and optionally uncertainty bounds of said frequency response function, is determined by said measured flow rate and the applied first excitation signal. Preferably, said frequency response function indicates an input impedance or its inverse for the respiratory system of the subject at the excitation frequencies of the first excitation signal. The impedance of the respiratory system, Z(f), is generally speaking equal to the complex ratio of the excitation pressure, Pe(f), and the measured respiratory response, Qe(f), with f the excitation frequency:

Typically what is measured in the procedure is a total air flow response, which is the sum of the respiratory response and the breathing contribution. Note that the respiratory response is not necessarily equal to the measured air flow, as the contribution by the subject's breathing is detracted from the measured air flow to obtain the respiratory response (and typically also requiring other to remove other disturbances such as time-varying and nonlinear contributions). By determining non-excited harmonics in the frequency response function, information can be obtained about stochastic nonlinear distortions, and can thus be accounted for in the resulting response signal.
In a further preferred embodiment, contribution to the frequency response function by the actual breathing of the subject is modelled and eliminated from said frequency response function, and optionally from its uncertainty bounds, thereby providing an unperturbed frequency response function.
In a further preferred embodiment, the contribution by the actual breathing of the subject is modelled by at least one (or possibly a combination) of the following techniques: parametric modelling, regularization techniques and/or Kernel based regression techniques. Additionally, other nonparametric modelling techniques could be applied as well, though the applicants remarked significant improvements using the formerly mentioned techniques. Preferably, this contribution is then eliminated from the measured air flow. Due to the unpredictability of the breathing contribution, more advanced modelling techniques are required than usual. These techniques will be discussed in depth at a later stage in this document. However, due to the fact that the quality of the obtained results depends mainly on the certainty with which the actual respiratory response can be separated from the breathing contribution (disturbances caused by the subject's breathing), it is of the utmost importance that the breathing contribution is modelled as accurately as possible. The breathing contribution is
modelled using complex modelling techniques since the actual breathing of the subject varies strongly from subject to subject with variations on amplitude and frequency, therefore the aforementioned modelling techniques are suggested. The respiratory response can be modelled with more ease than the breathing contribution, as this can be modeled by a sum of harmonically related sines and cosines at the excited frequency lines.
In a preferred embodiment, synchronization of the subject's actual breathing frequency with the measured natural breathing frequency is controlled by monitoring the actual breathing frequency, whereby said second excitation signal is adapted when a threshold desynchronization level is detected. This adaptation can have several forms, for instance a sensory signal to the subject to resynchronize the actual breathing frequency with the measured natural breathing frequency (such as a light indicating that the subject has deviated and/or alterations to the second excitation signal). Alternatively, this adaptation could take the form of actually modifying the frequency of the second excitation signal (to better approximate the actual natural breathing frequency of the subject), and modifying the frequency of the first excitation signal on the basis of the modified first excitation signal. This could allow the process to be able to continue without stopping (however still going through the entire procedure with a correct first and second excitation signal, for instance by deleting the previously collected data under the unmodified first and second excitation signal). In a further aspect, significant desynchronization can cause the procedure to prematurely stop as the data would likely be flawed.
Furthermore, the applicant noticed that during measurements, the subject's breathing can temporarily desynchronize, often due to unforeseen events such as distractions, coughing, etc. Although this does not occur often, the applicant wishes to avoid that the measurements are disturbed by these anomalies and therefore has provided a manner to separate these unwanted signals from the measurements. This is made possible due to the use of periodic signals in the method, which allows one to treat the complex- valued spectra of each frequency and each period individually. These spectra will only contain complex-valued and normally distributed noise when synchronized and in steady state, which enables the construction of a hypothesis test to determine if the set of measured periods is measured under synchronized conditions (when shown to be perturbed with a complex, normally distributed noise with an unknown mean value and an unknown variance). By disregarding periods with desynchronized breathing, the resulting measurements are not distorted.
The applicants have provided with a number of criteria to which the periods of the measured signal must comply. The first of these criteria is that based on the measured volume at the airway opening as follows:


Alternatively (or additionally), the statistical properties of the respiratory response at each of the excited lines is considered, and a hypothesis test is constructed which allows the detection of asynchronous breathing. Note that both criteria independently lead to the detection and the elimination of the same data record containing an asynchronous breathing.
For each of the excited harmonics, the respiratory responses Q[p](k) of each pth period is considered together with their sample mean Q(fe) and sample variance σζ(¾) as:
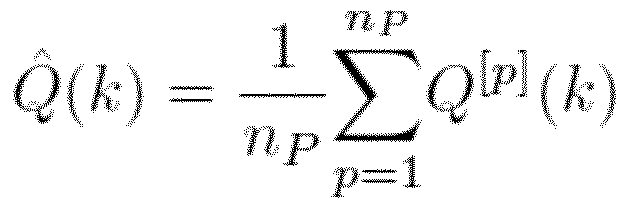

A hypothesis test is constructed for each observation Q[p](k) and the null hypothesis H0 states that the observation is equal to the true respiratory response Qo at the excited frequency; H0: Q[p](k) = Q0(k). The alternative hypothesis H i states the other cases; H i : Q[p](k)≠ Qo(k).
We assume that the realizations Q[p](k) of Q(k) are independent and circular complex normally distributed. Hereby we also assume that the real and imaginary part are normally distributed.
Qfteik' )

Qli<) ^ J - - - I / ' / m (k) ,€TIm (fc) ) with QRe(k) and Qim(k) the real and imaginary part of Q(k) respectively and: , | ., ( /,· ) = ,T ,n(A:) = *Q<*)/ 3
The real and imaginary part of the mean value, MRe(k) and Mim(k) respectively, are calculated as the real and imaginary part of the estimated mean :


i=l. has a x 2 distribution with n degrees of freedom which is noted as:

If we now assume that the observations Q[p](k), are circular complex distributed, we can normalize both Q[p] Re(k) and Q[p]im(k) :
st statistic is built using :

The applicant has additionally implemented a fault detection method in the method and the system of the invention, by adapting the microcontroller unit (MCU) to provide feedback to the user (operator generally). This enables the run-time detection of measurement problems. In many prior art systems, the impedances are estimated offline using Matlab and the user is not informed in time if a measurement contains errors. The danger of this procedure is that erroneous measurements go unnoticed until the patient is no longer available while a simple restart of the measurement could have led to an accurate impedance estimate. However, fault detection requires for all the currently applied estimators to be implemented for online calculation on the MCU.
Furthermore, an online adaptation of the measurement protocol is envisioned with the method and the system, to adapt the excitations specifically to the patient and/or the type of disease and/or to the patient history. Currently, the protocol consists of a fixed number of measurements, each with a duration of 20 breathing cycles. The low frequent excitations are shifted to prevent frequency overlap with the patient's breathing. Apart from that, the amplitude spectrum and excitation grid is independent of the patient. One solution could be to optimize the duration of the measurement and the amplitude
spectrum of the excitation signal to the patient. For example, if a first measurement showed that additional frequency lines are required below 0.3Hz, a second measurement can be adapted to target specifically that frequency range. This can be done by replacing a measurement of 6 consecutive periods with a resolution of 0.1Hz by 3 consecutive periods with a resolution of 0.05Hz. Another option is the addition of a single tone with increased power if the impedance estimate at that frequency has a too high uncertainty. A last example is to fine-tune the power spectrum in order to enable the more efficient separation of different types of diseases. These improvements can provide an optimal balance between measurement duration and estimation accuracy, depending on the measured patient.
Note that in what follows, the system and devices used to execute the method will be discussed. This is to be considered as part of the discussion of the method itself. Furthermore, it is to be considered both separate of the discussed method, as well as in view and support of the proposed method without every feature being discussed from both points of view.
In a second aspect, the invention provides a system for determining respiratory properties of a subject having a respiratory system, with a forced oscillation technique (FOT), comprising :
a. an FOT apparatus for constructing and applying a first excitation signal to the respiratory system of the subject and measuring the respiratory properties of the respiratory system;
b. a device arranged for constructing and exposing one or more senses of the subject to a second excitation signal, whereby said second excitation signal is adapted to indicate a natural breathing frequency to the subject, whereby a value can be assigned to said natural breathing frequency in the device and whereby said value is preferably defined by averaging the actual breathing frequency of the subject over a number of breathing cycles or a predetermined period of time.
Note that the device is arranged to expose the one or more senses of the subject to the second excitation signal in at least one non-intrusive manner for injection-locking the respiratory system of the subject to match the second excitation signal. The second excitation signal is adapted to represent and/or demonstrate or indicate the natural breathing frequency to the subject. As mentioned before, the subject's actual breathing frequency can be influenced in this manner in a non-intrusive manner, and be 'guided' towards a desired (measured) natural breathing frequency.
The advantages of the proposed system speak for themselves, especially in view of the methods described in this document and the use of the proposed system therefor. By combining the two devices (or apparatuses) into a single system, they can more easily construct the first and the second excitation signal as these are connected to each other in frequency. The advantages of the device for exposing one or more senses of the subject to a second excitation signal are also abundantly clear in view of the methods described in this document. This device can construct said second excitation signal and apply it to the subject in order to ensure injection-locking of the breathing of the subject, with the many advantages already discussed. In a preferred embodiment, the device for exposing one or more senses of the subject to the second excitation signal is configured to provide one or more of the following stimuli to the senses of the subject: auditory stimuli, visual stimuli, tactile stimuli, imposed air flow rate and/or imposed air flow volume. However, other of the possible sensory stimuli mentioned in this document (or even others) can be used as well. This device can be one or more screens, one or more speakers, one or more light-emitting elements, one or more actuators adapted to provided tactile stimuli, one or more pneumonic devices adapted to impose an air flow rate and/or an air flow volume to the respiratory system of a subject or others. The stimuli are designed in order to show the subject a desired rhythm for his or hers actual breathing. Said rhythm is based on measurements of the subject's natural breathing frequency (preferably taken shortly before the procedure), and by exposing the subject to the stimuli, succeed in injection- locking the respiratory system of the subject and thereby optimally stabilizing the breathing rhythm of the subject and equalizing the actual breathing frequency (approximating the measured natural breathing frequency). Most preferably, the device is adapted to either receive an input from an operator or another apparatus, whereby said input comprises (or allows the device to calculate) the measured natural breathing frequency of the subject. Based on said input, and thus the measured natural breathing frequency, the device constructs a second excitation signal and applies this to the subject. Said second excitation signal most preferably has a single frequency, being the measured natural breathing frequency of the subject. The second excitation signal can thus take a myriad of forms, from a changing color display, a countdown, a sound which changes pitch or with varying intermittency, an actual auditory message, a display of the subject's actual breathing pattern, possibly in comparison to the desired breathing pattern and others. The first excitation signal is in most cases applied by the FOT apparatus as a pressure signal to the respiratory system of the subject. Said first excitation signal is constructed by the FOT apparatus based on the natural breathing frequency of the subject (or on the base frequency with which the second excitation
signal is built if this is different from the natural breathing frequency) whereby excitation frequencies of the first excitation signal do not (substantially) overlap with the natural breathing frequency of the subject (or the mentioned base frequency of the second excitation signal) or integer multiples thereof, in order to avoid interference between the response to the first excitation signal and the contribution of the (normal) breathing of the subject.
As mentioned before, the non-invasive device to expose one or more senses of the subject to the second excitation signal, provides injection-locking without actually imposing this injection-locked regime on the subject per se and without creating discomfort for the subject. The proposed second excitation signals above are clear and easy to understand for the subject and succeed in greatly reducing the variation on the subject's actual breathing, as has been found by the applicant. Optionally, a device can also be incorporated into the system to execute the measurement of the subject's natural breathing frequency before the rest of the procedure. If said device to measure the natural breathing frequency is connected to the system, these measurements can be easily obtained by the other devices and apparatuses and used to construct the first and the second excitation signal.
A possible rendition of the device (or parts thereof) is discussed in depth in one of the examples. In a preferred embodiment, the system comprises a processing unit configured to receive data (measurement data) from the FOT apparatus concerning the measured respiratory properties and capable of processing said data. This may be a computer or similar processor.
However, most preferred, the proposed system is adapted to execute one or more of the methods disclosed in this document.
Thirdly, the invention provides a computer mountable medium which comprises instructions for executing one or more of the methods disclosed in this document. Preferably, the method is executed on a system as disclosed in this document as well.
The invention is further described by the following non-limiting examples which further illustrate the invention, and are not intended to, nor should they be interpreted to, limit the scope of the invention.
The present invention will be now described in more details, referring to examples that are not limitative.
Example 1 : FOT apparatus
A possible embodiment of the FOT apparatus can be seen in FIG. 1. Herein two sets of fans (Bi and B2) are placed causing an air flow (Ai and A2) along the same direction through an object (D). The pushing fan (Bi) pushes air into the object while the pulling fan (B2) pulls the air out of the object. This object is designed to create an optimized flow transfer from the fans to the middle of the object (Ci) and from the middle of the object to the fans (C2). Herein optimized flow transfer implies lowering the turbulences of the air flow. Both sets of fans are controlled (by CONi and CON2) by a micro controller unit (MCU). In a possible application, pulse width modulated (PWM) signals are used to control the fans. Pressure is built up in the middle of the object (D) and a pneumotachograph (E) is placed between the object and the subject (G). A membrane (F) is present in the middle of the pneumotachograph and pressure is measured on both the object side (pressure 1 or Pi) and the subject's side (pressure 2 or P2) of the membrane. These pressures are acquired in the MCU.
The pressure measured at the subject's side of the membrane (P2) is the airway opening pressure or pao. The air flow at the airway opening, qao, is obtained as the ratio of the measured pressure difference between the sensors on both sides and the resistance of the inner membrane of the pneumotachograph Rq :

An alternative way to measure the flow rate is by means of a flow meter based on e.g. ultrasound. In this application, Pi is generated by using the air flow generated by the fans. The advantage of fans over speakers or pistons is that they can generate very low frequent oscillations (< 1 Hz). Speakers or pistons on the other hand have the advantage that high frequencies (up to 50 Hz) can be excited. To combine the best of both speakers and fans, the setup can be extended with a set of speakers (H) to add high frequency (> 5 Hz) excitation components. That way, a frequency range starting from below breathing frequencies (< 1 Hz) to high frequencies (up to 50 Hz) can be excited. This is especially important since these lower frequencies can give an insight to different parts of the respiratory system.
Example 2 : Construction of the first excitation signal
The frequency band of interest in this setup starts around 0.1 Hz and can go up to 5 Hz (without speakers or pistons). To reduce the measurement time, a broadband signal is preferred over multiple experiments of a single tone excitation. The influence of measurement noise can be strongly attenuated by averaging a periodic input signal over consecutive periods. It has been shown that random phase multisines are a powerful tool in identifying a linear dynamic system (Z) in the presence of measurement noise and nonlinear distortions. Particularly odd random phase multisines (were only odd multiples of a construction frequency, fo, are excited) have the advantage that even and odd nonlinear contributions can be separated by measuring the power generated at the non-excited frequency lines. In what follows the following relation will hold true : f0 = i f6. Therefore it is preferred to excite the subject's respiratory system by an odd random phase multisine (ORPM) as described by : i i(t) = sin(27T -fbt + <pk)

Wherein for 'k'-values that are even, Ak is 0. The other terms have already been mentioned in this document. N is the number of excited frequency components (and thus a positive integer), while Ak is a user defined amplitude spectrum of the k-th frequency. The phases cpi< are drawn from an independent uniformly distributed random process on [0, 2π).
Example 3 : Adaptive method to decrease frequency overlap
The spectral overlap between Qb (air flow caused by breathing) and Qe (air flow as a reaction to first excitation signal) at the excited frequency lines, ^ f6, strongly jeopardizes the measurement of Qe and thus the measurement of Z. The modeling techniques discussed previously can reduce the effect of the breathing on the measurement of Qe. However, when the breathing behaves highly nonstationary (strong amplitude and freq uency variation), modeling errors are present in the breathing estimation and no accurate measurement of Qe is obtained . Therefore the idea of the presented adaptive method is to decrease the spectral overlap between Qb and Qe by adapting the first excitation signal to the subject's breathing . In that way, the raw measurement is less disturbed at the excited frequency lines and any residual disturbances are more likely to be eliminated by modeling the breathing disturbance.
In order to reduce the spectral overlap, three causes need to be handled :
1. Spectral leakage of Qb due to amplitude and frequency variation of the breathing.
2. Spectral leakage of Qb due to the measurement of a non-integer number of breathing cycles. This is generally the case since the measured breathing frequency fb is not an integer multiple of the construction frequency of the first excitation signal, ^f6.
3. Coincidence of the fundamental frequency of Qb and/or its integer multiples with an excitation frequency of Qe.
This work solves these issues by injection locking (also known as synchronizing) the subject to a given frequency and, additionally, adapting the first excitation signal to minimize the frequency overlap between the breathing and the excitation. Important to note is that the frequency to which the subject is synchronized is determined by the subject's breathing during an offline measurement of spontaneous breathing. The effort demanded from the subject to synchronize to an external synchronization frequency is minimal when this frequency corresponds to the subject's natural breathing frequency. The measurement procedure is depicted in FIG. 3. First an offline measurement of the breathing is performed to obtain information on the subject's spontaneous breathing such as number of harmonics and measured natural breathing frequency fb (Offline breathing measurement in FIG. 3). The subject is asked to breathe spontaneously such that the measured breathing frequency fb corresponds to his/her natural breathing frequency. The offline measurement is performed by measuring the flow at the airway opening without applying a pressure oscillation. This corresponds to the case where pao = 0 in FIG. 2. The measured flow qao then only consists of qb since qe = 0. The next step consists of abstracting the information from the offline breathing measurement. In this application fb is estimated (Estimate fb in FIG. 3) by using the Interpolated Fast Fourier Transform (IFFT) as described by Grandke in 'Interpolation Algorithms for Discrete Fourier Transforms of Weighted Signals'. Other ways such as sine wave fitting, Fast Fourier Transform with/without windowing or phase locked loops can be used. Starting from the information obtained during the offline breathing measurement, the first excitation signal can be adapted to minimize frequency overlap. In this application, the excited frequency lines ^f6 are shifted such that they do not coincide with the breathing frequency and its harmonics (Adapt first excitation signal in FIG. 3). As discussed, an ORPM is used as first excitation signal. By shifting the construction frequency, ^ f6 or f0, of this ORPM such that fb is an integer multiple of the construction frequency, the coincidence of Qe and Qb is avoided and at the same time the measured natural breathing frequency fb is an integer multiple of the construction frequency, fo, of the first excitation signal. This simultaneously handles cause 2 and 3 of frequency overlap
and motivates the introduction of the following condition on the selection of the construction frequency, namely that the breathing frequency fb is an integer multiple of said construction frequency, fo.
During the measurement, two excitations are simultaneously applied to the subject (Apply pressure excitation and Apply external (visual) stimulus in FIG. 3). The adapted pressure excitation is applied at the airway opening using the device discussed before. Meanwhile an external stimulus is added to minimize the amplitude and frequency variation of the subject's breathing. In this application a visual stimulus through a monitor is used but this can also be done by, for example, an auditory signal. The addition of the external stimulus, and the hereby created injection locking, tackles the first cause of spectral overlap. Since the external stimulus is based on the subject's natural breathing frequency, a minimal effort is demanded from the subject to maintain this frequency during the measurement. An example is shown in FIG. 3 with n = 2 for the use of an ORPM so that only odd multiples of the construction frequency (half of fb) are excited. As illustrated, no power is inserted by the first excitation signal at fb and its harmonics. In the measurement of the total air flow Qao (Measurement in FIG. 3), the contributions of the breathing Qb and the respiratory response Qe no longer overlap since the three causes for spectral overlap are tackled. However, in clinical measurements the effect of this method strongly depends on the ability of the patient to adapt to the external stimulus. If the subject is not accustomed to the measurement procedure, the injection locking has issues and spectral leakage of the breathing occurs. This motivates the use of the modeling techniques previously discussed to model the breathing and eliminate the residual breathing disturbances at the excited frequency lines ^ f6 (Model and eliminate residual breathing disturbances in FIG. 3). In the final step, the respiratory response Qe is obtained at the excited frequency lines ^f6 and the respiratory impedance Z can be estimated.
Example 4: Comparison between measurements with and without adaptive method
In this example, measurement results with and without use of the adaptive method are compared for measurements on a healthy subject. The adaptive method is omitted and a measurement is performed without synchronization of the subject's breathing or adaptation of the first excitation signal. a. First excitation signal constructed without the adaptive method :
The subject breathes spontaneously without following an external stimulus while 9 consecutive periods of an ORPM excitation with a construction frequency of 0. 1 Hz are applied (in the case without the adaptive method, the construction frequency is defined and used to construct the first excitation signal, however without a relation to the natural breathing frequency). As discussed before, a feedback controller is used to ensure that the first excitation signal is not disturbed by the breathing disturbances. Note that in what follows, sample means (mean values for a sample) will also be mentioned when discussing parameters, which sample means are obtained under the usual practices. Pe is obtained with a signal to noise ratio (SNR) of more than 30 dB at the lowest freq uencies as shown in FIG. 4A-B. FIG. 5A-B depicts Qao over the full measurement (without averaging over the periods). Power leaks into the neighboring frequency bins of the fundamental breathing frequency or measured natural breathing frequency fb and its harmonics and the natural breathing frequency fb is found at 0.27 Hz while the second excited bin at 3 times the construction frequency is found at 0.3 Hz. This has as a consequence that spectral leakage of Qb influences Qe as can be seen when comparing FIG. 6A-B. A high uncertainty (low SNR) on ¾ is observed at the excited frequencies due to the breathing disturbance. In this case the resulting estimate of the respiratory impedance Z is not reliable at very low frequencies since the uncertainty represented by the confidence region on its real and imaginary part is too high (FIG. 7A-B). b. First excitation signal constructed with the adaptive method :
To overcome the problem of spectral overlap, the adaptive method is applied for the same subject. An offline measurement of 10 seconds is performed and a natural breathing frequency fb of 0.27 Hz is estimated/measured . The first excitation signal is adapted ensuring a construction frequency, ^ fbr of 0.135 Hz (wherein λη' is equal to 2).
The patient follows a visual signal on a monitor to synchronize with the natural breathing freq uency fb while 9 consecutive periods (for instance) of the ORPM excitation with a construction frequency of 0. 135 Hz are applied . As shown in FIG. 4A-B, the first excitation signal Pe and its uncertainty, dfe , are not influenced by the adaptive method apart from the shift of the excitation frequencies. FIG. 5A-B shows the influence of injection locking the patient and adapting the first excitation signal. The spectral leakage that was found in the measurement without external stimulus is strongly decreased due to the injection locking while the fundamental breathing frequency fb and its harmonics are further removed from the excitation lines due to the adapted multisine. This ensures the decrease of uncertainty on ¾ (FIG. 6A-B) compared to the measurement without
the adaptive method. The uncertainty can be decreased further by applying the modeling techniques discussed before. The resulting estimate of the respiratory impedance Z with its 95% confidence bounds is shown in FIG. 7A-B. As illustrated the adaptive method strongly decreases the confidence regions making the measurement of Z usable for further diagnostics in the clinical area.
Example 5 : Discussion of the modelling techniques for qh and qe
The quality of the measurement of Yrs (the inverse of Z, where Vs' stands for respiratory system) is mainly dependent on the uncertainty with which qe can be extracted from qao by eliminating qb. Therefore it is of interest to obtain a model that can estimate both qb and qe starting from measurements of qao. Since qe is the response of the LTI system Yrs (as seen in FIG. 2) to the pressure excitation pe as defined by the previous formula for pexci (actually a response to pao), it can be modeled by a sum of harmonically related sines and cosines at the excited frequency lines.

fc=l.
This model is linear in the parameter set 9qe with : β

A more complex model is required when it comes to modeling the breathing disturbance qb- Spontaneous breathing varies strongly from patient to patient and strong variation on both amplitude and frequency can occur during one measurement. Here three different techniques developed by the authors are discussed that are aimed at creating a robust model for breathing disturbances. Each of these modeling techniques can be applied on overlapping data segments of a measurement of qao with a variable segment length and overlap percentage. a. Parametric modelling and estimation of qb
Model of qb-' The first technique models the breathing signal qb using a periodic model which includes both amplitude and phase modulation.

This model consists of a sum of H harmonically related sine waves with a nonlinearly varying phase O(t) to handle phase modulation and amplitude polynomials Ah(t) to handle amplitude modulation. The phase,

is written as the sum of a fixed frequency contribution 2nfbt and a sum of L harmonically related sine waves with fundamental frequency v/T ('nu' divided by the period T). It has been shown that an analytical solution for a nonparametric estimation of the phase modulation can be obtained when harmonically related sine waves are used. The instantaneous frequency of the fundamental breathing harmonic is then noted as:

This shows that the phase harmonics can be used to handle frequency variations of the spontaneous breathing. The factor V ('nu') can be used in the estimation process to change the periodicity of the instantaneous frequency. The amplitudes of the sine waves in the above formula for qb are modeled as polynomials of order M to cope with changing breathing amplitudes during the measurement:
Ah(t) = Aho f Akii + A^t2 . . , + AhUiM A = 1 . , .2I#
All model parameters are collected in the vector
Λ¾. = [Am . . . . AQP , . , . A2M o , - ^ A 2H P , Bi t■■■ ' '■
The total measured flow qao can be modeled as
where 9qao represents the parameters of both qb and qe: 9qao = [9qb 6q [
Least squares estimation: The model parameters of the above formulate for qao are determined by minimizing the least squares cost function :
i N
11= 1
over 9qao with N the number of samples of the measured air flow qao(tn).
The order of the model given by H, L and M depends on the measurement. A higher variability on the behavior of the spontaneous breathing (strong variations in amplitude and frequency) demands for higher model orders and vice versa. Since the model for qb is nonlinear in the parameters, an iterative search algorithm is used to minimize the cost function. For higher order models (e.g. H = 5; L = 2; M = 2), the cost function has a high number of local minima of which many give very poor estimates for 9qao.
Hence, good starting values are mandatory to obtain an accurate estimate. In this work, the algorithm described in "Continuous-time operational modal analysis in the presence of harmonic disturbances" (by Pintelon, Peeters and Guillaume) is used to obtain initial estimates for all nonlinear parameters in 9qb except for fb. The fundamental breathing frequency fb is initially estimated by a peak detection algorithm known as the Interpolated Fast Fourier Transform (IFFT) and described by Grandke in the earlier mentioned document.
The Levenbergh-Marquardt algorithm is chosen to minimize the cost function w.r.t. eqao . Convergence of this optimization algorithm towards a physically interpretable solution will strongly depend on the condition number of the acobian matrix J with

for the nth time sample and the ith parameter of 6qag . To reduce the condition number, the time axis is rescaled using Legendre polynomials. A too high model order can increase the condition number of J and thus the ill-posedness of the estimator (i.e. the columns of J are no longer linear independent). Therefore, once the condition number reaches a given threshold value, the model order is no longer increased even if this can lead to a solution with a lower cost function. Estimation results can be validated using a subset of the measurements as validation set. Applying the estimated qe and qb on the validation set can tell the user if it's necessary to redo the estimation with a different model order or with a different set of starting values. b. Regularization on breathing parameters
Model: In this technique, linear models are used to handle amplitude and frequency variation of the spontaneous breathing. In order to handle amplitude and frequency variation of the spontaneous breathing without the need for parametric models, the data is cut into smaller overlapping segments. This strongly decreases the modulation within this segment and therefore allows to model the signal with polynomial amplitude modulation only. The windows are fixed to a length that corresponds to an integer number of periods of the multisine excitation. For each ith window a fundamental breathing frequency 6 [ί] is estimated using the Interpolated Fast Fourier Transform of Grandke. With this 6 [ί] fixed, a linear breathing model is proposed :
 with A^](t) and B^](t) polynomials of order P and 9q l b ] represents the model parameters for the ith window:

It has been shown in "Single and piecewise polynomials for modeling of pitched sounds" by Zivanovic and Schoukens, that the polynomials A^](t) and B ](t can handle both amplitude modulation and slow frequency modulation. Therefore it is suitable to apply this model on overlapping windows in order to handle the variation of the breathing.
Estimation: Like in the previous section, the goal is to estimate the parameters in 9qb and 9qe starting from the measurement of the total flow qao(t). Since both the model for qe and qb are linear in the parameters, the model for the total flow for each ith window can be represented as


and with S the regression matrix containing the basis functions of the models for qb (above function of qb[i]) and qe (original formula at start of example 5). Note that also the parameters 9q l e ] of qe are estimated separately for each ith window. To obtain the total estimate of the respiratory response q(t), the results of each ith window are combined using the overlap-add method. In the following the window indexing [i] will be omitted for the sake of clarity. Since both the model for qb and the qe are linear in the parameters, a linear least squares estimator can be used. This estimator minimizes the L2-norm between the measured flow qao and the estimated flow qao= S9qao. The well-posedness and thus the quality of the estimate qao depends on the condition number of the regression matrix S. Due to the colliding harmonics in the model for qb and qe, S can become ill conditioned. The ill- conditioning can be handled by estimating 9qao as:
with S+ the Moore-Penrose pseudoinverse of S. However, this does not allow to insert additional information about the separate contributions qe and qb into the estimate. A regularized least squares method is an alternative. Adding regularization to the estimate can impose, for example, smoothness on the breathing.
Regularized least squares: The idea is to minimize the following cost function
seqao\\2 + xeTao q , with respect to 9qag which gives the following solution :
egao = (sTs + xQ)-1sTqt ao
The cost function consists of a least squares fit added by a penalty term to add more information about 9qao The regularization parameter λ can be tuned to change the weight of the penalty term on the cost function. Additional information can be inserted into the penalty by use of the regularization matrix Q. A simple example is to use Tikhonov regularization on only the breathing parameters 9qb as proposed in "Numerical methods for the solution of ill-posed problems" by Tikhonov and Goncharsky. In that case the regularization term minimizes the sum of squares of the breathing parameters 9qb and can be considered as a penalty term that constraints the variance of 9qb . Another example is the insertion of smoothness of the breathing into Q by using the penalty term to limit the variation of the breathing parameters 9qb over different windows. c. Kernel based regression A third technique here referred to as the 'Kernel Based Regression' (KBR) technique is based on the idea of considering the breathing contribution as a realization of a gaussian process:

with Κ(χ,χ') the covariance function that describes the covariance between pairs of random variables x and x' (as discussed in Rasmussen's "Gaussian processes for machine learning"). In this work, x can be time instances or frequency lines. The covariance function K or kernel contains information about the prior distribution of the particular process, in this case the breathing qb. The estimate of the breathing contribution qb is given by:
with J the identity matrix and γ an extra parameter to model parts of the signal that cannot be modelled by the Gaussian process with covariance K.
Separation using kernels: The idea is to separate the signal qao = qb + qe in order to find a correct representation of qe. Here the most general model for qe is applied :
with 0 = 'A \ B{ , . , ANcxJlx. , ;
and Ψ represents the sine and cosine basis functions. The breathing contribution qb can then be estimated using kernel based regression : qt(t) = K(t, t')(K(tJ) + I-y~ l )qb(t)
= A T
which gives the following for the estimate of qao:
 Θ
Θ
This is a one-step solution to find both qe and qb which means that the choice of the kernel and its hyper parameters has a great influence on the estimate. Therefore, an algorithm needs to be developed to obtain the covariance function represented by this kernel and its hyper parameters. This can be done in two ways, the leave-one-out cross validation (LOO-CV) method or by optimizing the marginal likelihood given in the document of Rasmussen. The marginal likelihood is reformulated here in the case of noisy measurements of the total airflow: qao,m = qao + ε.
The standard marginal likelihood for this case is given by
1 1 n logp(q ao,m ao,m - -log|ii¾J - -log2; with x the hyperpara meters of the kernel Kqag . The problem with the previous formula is that it will optimize towards a kernel that fits maximally with the total measured air flow qao. However, the goal of the KBR is to model the breathing contribution qb since the respiratory response qe is already modeled (as given in a previous formula, qe(t) = ΨΘ). Therefore, the marginal likelihood needs to optimize χ and Θ together. This is done by maximizing the marginal likelihood :
-1 ,
logp((g«o,m - Φ0)|ί, χ, 0) ^ (§€i»,ro— Φ#) AgM l (qao,m. — Φ0)

with Kqao optimized so that it can model the total measured air flow minus the respiratory response contribution. The convergence of the optimization will depend on the choice of starting values which can be done either by use of a grid search or by applying an optimization on the standard marginal likelihood as first defined.
Example 6 : Results
Measurements of M consecutive periods of an ORPM excitation given by the formula of Pexci are executed on a healthy patient. The pressure pao and flow qao at the airway opening are measured. As discussed previously, the air flow at the airway opening qao consists of both the breathing disturbance qb and the respiratory response qe. Consider the sample means:


with Pe LlJ (/c) and Qe k) the DFT of the ltn period pg and ¾ respectively. Respiratory admittance estimate Yrs
The frequency response function (FRF) estimate of the respiratory admittance Yrs is given by:
with varian

Respiratory impedance estimate Zrs
The respiratory impedance is considered as a linear time invariant system and can thus be obtained as the inverse of Yrs:

with variance

The confidence region of the FRF estimate is obtained by approximating Zrs by a circular complex normally distributed variable. A 95% uncertainty bound on the real and imaginary part of Zrs {ERe{2rs) and EIm(2rs ) is then given by:
10 ERe(Zrs) - EIm(Zrs) ~ ^2(7
Measurements:
Measurement results with and without use of the adaptive method are compared for measurements on a healthy subject. First the adaptive method is omitted and a measurement is performed without synchronization of the subject's breathing or
15 adaptation of the first excitation signal. The subject breathes spontaneously without following an external stimulus while 9 consecutive periods of an ORPM excitation with a construction frequency of fo = 0. 1 Hz are applied. As discussed previously, a feedback controller is used to ensure that the first excitation signal is not disturbed by the breathing disturbances. Pe is obtained with a signal to noise ratio (SNR) of more than
20 30 dB at the lowest frequencies as shown in FIG. 4A-B. FIG. 5A-B depicts Qao over the full measurement (without averaging over the periods). Power leaks into the neighboring frequency bins of the fundamental breathing frequency fb and its harmonics and the fundamental (breathing) frequency fb is found at 0.27 Hz while the second excited bin 3fo is found at 0.3 Hz. This ensures that spectral leakage of Qb influences Qe
25 as can be seen in FIG. 6A-B. A high uncertainty (low SNR) on Qe is observed at the excited frequencies due to the breathing disturbance. In this case the resulting estimate of the respiratory impedance Zrs is not reliable at very low frequencies since the uncertainty represented by the confidence region on its real and imaginary part is too high (FIG. 7A-B). To overcome the problem of spectral overlap, the adaptive method is
30 applied. An offline measurement of 10 seconds is performed and a fundamental breathing frequency fb of 0.27 Hz is estimated. The first excitation signal is adapted to comprise one or more frequencies according to the formula fexcl = - fb (with k being odd
natural numbers) ensuring a construction frequency (fo) for the first excitation signal of 0.135 Hz, exactly half of the measured breathing frequency 0.27 Hz.
The subject follows a visual signal on a monitor to synchronize with fb while 9 consecutive periods of the ORPM excitation (the first excitation sig nal) with an excitation freq uency of 0.135 Hz are applied . As shown in FIG. 4A-B, the excitation signal Pe and its uncertainty dpe are not influenced by the adaptive method apart from the shift of the excitation frequencies. FIG. 5A-B shows the influence of injection locking the subject and adapting the excitation signal. The spectral leakage that was found in the measurement without external stimulus is strongly decreased due to the injection locking while the fundamental breathing freq uency fb and its harmonics are further removed from the excitation lines due to the adapted multisine. This ensures the decrease of uncertainty on Qe (FIG. 6A-B) compared to the measurement without the adaptive method . The uncertainty can be decreased further by applying the modeling techniques discussed in example 5. The resulting estimate of the respiratory impedance Zrs with its 95% confidence bounds is shown in FIG. 7A-B. As illustrated the adaptive method strongly decreases the confidence regions making the measurement of Zrs usable for further diagnostics in the clinical area.
It is furthermore to be noted that the techniques discussed in the examples 5 and/or 6 can be applied to other measurements or data sets outside of the field of respiratory impedances, and should therefore not be considered as improvements limited to only this field . The applicants in fact remarked during the development of the invention that the discussed techniques would likely have beneficial effects in other situations as well .
Example 7 : LPV estimation during breathing
In another improvement, the applicant noticed from tests in the field (hospital) that measurements from patients show that the respiratory system of a human isn't always time-invariant, but depends slightly on the state of the lungs during breathing (from full respiration to complete aspiration).
To be able to (better) measure the dependency of the lung's properties with respect to state of the lung, an alternative set of multisine excitations can be used . This results in various transfer functions which describe not only the dynamic response of the linear time-invariant part (H0), but also the dynamic response that can be explained by the interaction with the time-varying nature of the lung (H i(f), H-i(f), H2(f) ...) . This theory is also known as the theory for Linear Parameter Varying (LPV) systems.
In order to separate the interaction between the fundamental frequency of the breathing and the applied excitation, it is advisable to use an odd frequency bin for the breathing together with an odd multisine. The breathing frequency and its harmonics are not used in the latter excitation. This choice makes that all intermodulations between the fundamental breathing frequency and the multisine results in an even (unexcited) frequency component. Hence, this is an easy way to separate the transfer function HO,
Even-order harmonics in the breathing will generate addition signal contributions that distort the above solution. To still be able to separate H0, H-i, Hi from H2 and H-2, it is necessary to measure the response to a multitude (3 or more) multisine excitations. This requires a well-chosen frequency grid and phases of the different multisine excitations. These phases are chosen such that the set of equations they generate form a well-conditioned linear least squares problem. This classical least square solution results allows the separation of the different transfer functions and the uncertainty on these estimates. In what follows, a more specific example is shown:
The pressure excitation signal in this case has only odd excitation frequencies and is represented as follows: l N
i i(t) = -7= / Ak sin(27T(2fe - l)f0t + <¾) The subject's actual breathing with synchronization is represented as:
N

Since pressure is used as the excitation signal, the admittance Yrs is measured directly and Zrs is obtained after inversion. Under the assumption that Yrs((o;t) is a linear parameter varying (LPV) system of which the system properties change due to the breathing b(t), Yrs(co;t) can be decomposed in different LTI subsystems Yr(co), r€ {Nb, -Nb + 1, Nb - 1, Nb}, also known as harmonic transfer functions (HTF) with corresponding complex exponentials ejroV. Nb is assumed to be smaller or equal to 2.
Given a measurement of a signal x(t) of Ns samples with a sample frequency fs and corresponding sample period Ts, the DFT of the samples x(nTs) n = 0, 1, ... Ns - 1 is given by:
X (k) = π(ι
When the excitation signal is chosen such that f0 = fs/Ns, the kth DFT bin corresponds to the frequency kf0. Following that f0 equals fb divided by a natural number, the breathing frequency corresponds to DFT bin kb equal to that natural number. Using the decomposition of Yrs((o;t) as given in Figure 8 the DFT of q(t) can be obtained as:

Here, Yo corresponds to the LTI contribution of Yrs. The goal is to optimize the measurement procedure such that the separate HTFs Yr, r€ {Nb, -Nb + 1, Nb - 1, Nb} can be identified. Since the LTI contribution is the main interest of the FOT measurement, extracting Y0 with high uncertainty will be prioritized.
To demonstrate the effect of the LPV behavior of Yrs on the measurement of Q, we will start with an example using an excitation signal with an excitation grid that does not take into account the LPV behavior of Yrs. As shown in Figure 9, the LPV contributions Q±i and Q±2 can generate unwanted LPV disturbances at the excited frequency lines. As a result, the estimation of Qo and hence Yo will be biased due to the contributions Q±i
A first optimization of the excitation grid aims at reducing the dominant effect of the LPV contributions at the excited frequency lines. Since breathing is always dominant in its first harmonic, it can be stated that |Y±i | > |Y±2 | and thus |Q±i | > | Q±2 1 - Hence, an excitation signal is required which ensures that
 (with kexc being the vector of excited bins, and kexc being one of the excited bins themselves).
Since any contribution Q±i( keXc) is generated by an input at bin kexc ± kb, this contribution can be prevented by using P(kexc ± kb)=0, for all kexc€ kexc. The preceding equations can be guaranteed by choosing kexc and kb to be odd, kexc = 2 m + 1, kb = 2j+ l with m and j being natural numbers for all kexc€ kexc. This is demonstrated in Figure 10 where Q±i does not have any contribution at the excited frequencies, which will strongly reduce the bias on the estimate of Qo. If one is interested in the individual contributions of Q±i( kexc), namely Y±i, then it is possible to extract this information from the even frequency bins (2m+2j+2) by solving a simple linear least squares problem,
similar to the solution described below for separating Y0 and Y±2. This requires the application of at least 2 distinct multisine excitations to obtain a well-conditioned least squares formulation.
As illustrated in Figure 10, the contributions Q±2(kexc) will still disturb Qo( kexc) and hence a bias on the estimate of Qo is still present. Since it is assumed that breathing has no more than three harmonics, this effect is solely due to the second harmonic of the breathing disturbance. The easiest solution would therefore be to eliminate this second harmonic but unfortunately this is not that simple in practice.
The second harmonic appears when the breathing pattern of the subject does not behave perfectly symmetric. This is generally the case since both the amplitude as the duration of inhalation and exhalation can differ. A possible solution would be to force symmetry on the subjects breathing pattern by an adaptation of the synchronization method (e.g. 50% inhale percentage in both duration and amplitude). In practice this would imply adding more constraints on the standard synchronization procedure while the demanded effort of cooperation is already high for some of the subjects. Therefore it is chosen to keep the measurement procedure as it is and to look for another solution.
One solution would be to adapt the excitation signal such that | Q±2(keXc) | = 0. However, since kb is chosen to be odd in order to fulfill
 note that the second breathing harmonic 2kb always appears on an even bin, irrespective of the chosen kexc. Since any contribution Q±2(keXc) is generated by an input at bin kexc ± 2kb and since kexc = 2 m + 1 and kb = 2j+ l are applied to fulfill Q±i( kexc)=0, the required condition P(kexc ± 2kb)=0 would enforce P(k)=0 for all k. Excitation signals fulfilling this last equating could be generated by violating Q±i( kexc)=0, however this would reintroduce the main source of disturbance Q±i . Given the previously discussed excitation signal fulfilling Q±i( kexc)=0, the following equation can be simplified at the bins kexc€ kexc as follows:

2/.·/, » / '· /.·.
+ Y-2 ( kexc + 2A¾)P(fce c + 2I¾ )
This shows that any contribution at Q(kexc) is caused by the contributions Yo, Y-2 and Y2. The identification of Yo, Y-2 and Y2 is only possible if more than 3 equations are available. Therefore, the solution we propose is to use multiple realizations of the pressure excitation signal in order to have sufficient equations to identify Y0, Y-2 and Y2. In this way, neither the synchronization procedure nor the grid of the excitation signal need to be adapted.
Until now, the measurement protocol in the hospital measurements consisted of multiple measurements (generally 3) using the one random phase realization of the pressure excitation signal as presented above. The LPV contributions Y-2 can be separated from the LTI contribution Y0 by using M separate measurements using M different phase realizations.


The notation can be simplified in vectorial form (kexc omitted) : Q = PY, for which an estimate Ϋ for Y can be obtained using Ϋ = P+Q, with P+ the pseudo-inverse of the matrix P, and its covariance defined by (assuming the noise over different realizations is uncorrelated) : cov(Y) = Ε{(Ϋ - Ε{Ϋ})( Ϋ - E{Y})H}, with E{} denoting the expected value and xH the Hermitian transposed of x.
Under the assumption that Q can be denoted as Q = Q+ Nq, with Q the true value of Q and Nq the noise contribution, we can note:
Ϋ = P+Q + P+NQ Given that E{Y} = P+Q, the covariance is obtained as:
-H
cov(Y) P-NqNgp-
P+CQP+H
Again, assuming the noise over different realizations is uncorrelated and with the following (with <7~m] denoting the sample variance over the nP periods of the mth realization) :

It is supposed that the present invention is not restricted to any form of realization described previously and that some modifications can be added to the presented example of fabrication without reappraisal of the appended claims. For example, the present invention has been described referring to determining the impedance of the respiratory system of the subject, but it is clear that the invention can be applied to other pulmonary measurements or procedures.
Claims
Method for determining respiratory properties of a subject having a respiratory system, comprising the following steps: a. measuring natural breathing properties of the subject, whereby said properties comprise at least a natural breathing frequency of the subject, preferably whereby the natural breathing frequency is measured by averaging the actual breathing frequency of the subject over a number of breathing cycles or a predetermined period of time; b. constructing a first and a second excitation signal, whereby the first excitation signal comprises one or more excitation frequencies determined by the measured natural breathing properties of the subject, and whereby the second excitation signal comprises one or more excitation frequencies which represent one or more of the measured natural breathing properties of the subject; c. applying the first excitation signal to the respiratory system of the subject, preferably via pressure oscillations; d. exposing one or more senses of the subject to said second excitation signal in at least one non-intrusive manner, whereby said second excitation signal is adapted to demonstrate and represent said measured natural breathing frequency, for injection locking the respiratory system of the subject to match the second excitation signal; e. measuring a respiratory response of the respiratory system of the subject to the first excitation signal; whereby the step of applying the first excitation signal to the respiratory system and the step of exposing one or more senses to the second excitation signal are executed substantially simultaneously, preferably whereby the step of exposing one or more senses to the second excitation signal starts before the step of applying the first excitation signal to the respiratory system, and whereby more preferably the step of applying the first excitation signal to the respiratory system stops before the step of exposing one or more senses to the second excitation signal.
2. Method according to the preceding claim 1, wherein the excitation frequencies of the first excitation signal are different from the excitation frequencies of the
second excitation signal by at least 5%, preferably by at least 10%, more preferably by at least 20%, of the measured natural breathing frequency.
3. Method according to any one of the preceding claims 1 or 2, wherein a base frequency, fb, is defined, wherein the excitation frequencies of the second excitation signal are either said base frequency or an integer multiple of said base frequency, and whereby the following formula applies to the excitation frequencies of the first excitation signal, feXci : fexcl = ~ r wherein k and n are positive integers and wherein k is not n or an integer multiple of n, and preferably whereby n is equal to 2, most preferably wherein the base frequency is equal to the measured natural breathing frequency.
4. Method according to any one of the preceding claims 1 to 3, wherein the second excitation signal provides one or more sensory stimuli to the subject to increase synchronization of the subject's actual breathing frequency with the measured natural breathing frequency.
5. Method according to any one of the preceding claims 3 to 4, wherein one or more frequencies according to the formula fexcl = ^ f6 are not represented in the first excitation signal for one or more possible values of k, and wherein said one or more unrepresented frequencies are used to quantify one or more signal properties of the respiratory system of the subject, preferably comprising at least one or more of the following signal properties: transient behavior, nonlinear behavior, time-varying behavior of the respiratory system, measurement noise and/or perturbations introduced by the subject's actual breathing.
6. Method according to any one of the preceding claims 1 to 5, wherein the first excitation signal is applied to the respiratory system of the subject via one or more actuators using one or multiple feedforward techniques and/or feedback techniques, preferably wherein said actuators comprise one or more of the following : pistons, loudspeakers, pumps, ventilators, fans and/or valves.
7. Method according to any one of the preceding claims 1 to 6, wherein the measured respiratory response comprises at least a measured flow rate and a measured breathing response, wherein a frequency response function, and optionally uncertainty bounds of said frequency response function, is determined by said measured flow rate and the applied first excitation signal, preferably whereby said frequency response function indicates an input impedance or its
inverse of the respiratory system of the subject at the excitation frequencies of the first excitation signal.
8. Method according to the preceding claim 7, wherein contribution to the frequency response function by the actual breathing of the subject is modelled and eliminated from said frequency response function, and optionally from its uncertainty bounds, thereby providing a substantially unperturbed frequency response function.
9. Method according to the preceding claim 8, wherein the contribution by the actual breathing of the subject is modelled by at least one of the following techniques: parametric modelling, regularization techniques and/or Kernel based regression techniques.
10. Method according to any one of the preceding claims 1 to 9, whereby synchronization of the subject's actual breathing frequency with the measured natural breathing frequency is controlled by monitoring the actual breathing frequency, whereby said second excitation signal is adapted when a threshold desynchronization level is detected.
11. System for determining respiratory properties of a subject having a respiratory system with a forced oscillation technique (FOT), comprising : a. an FOT apparatus arranged for constructing and applying a first excitation signal to the respiratory system of the subject and measuring the respiratory properties of the respiratory system; b. a device arranged for constructing and exposing one or more senses of the subject to a second excitation signal in at least one non-intrusive manner, for injection-locking the respiratory system of the subject to match the second excitation signal, whereby said second excitation signal is adapted to demonstrate and represent a natural breathing frequency to the subject, whereby a value can be assigned to said natural breathing frequency in the device and whereby said value is preferably defined by averaging the actual breathing frequency of the subject over a number of breathing cycles or a predetermined period of time.
12. System according to the preceding claim 11, whereby the device for exposing one or more senses of the subject to the second excitation signal is configured to provide one or more of the following stimuli to the senses: auditory stimuli,
visual stimuli, tactile stimuli, imposed air flow rate and/or imposed air flow volume.
13. System according to any one of the preceding claims 11 to 12, furthermore comprising a processing unit configured to receive data from the FOT apparatus concerning the measured respiratory properties and capable of processing said data.
14. System according to any one of the preceding claims 11 to 13, whereby the FOT apparatus is arranged to construct said first excitation signal on the basis of the natural breathing frequency of the subject, preferably whereby the first excitation signal comprises no excitation frequencies which substantially overlap with the natural breathing frequency of the subject or with integer multiples thereof.
15. System according to any one of the preceding claims 11 to 14, whereby the system is configured for executing the method according to any one of the preceding claims 1 to 10.
Applications Claiming Priority (2)
| Application Number | Priority Date | Filing Date | Title |
|---|---|---|---|
| EP16176967.4A EP3263028A1 (en) | 2016-06-29 | 2016-06-29 | Improved methods for determining respiratory properties and system therefor |
| EP16176967.4 | 2016-06-29 |
Publications (1)
| Publication Number | Publication Date |
|---|---|
| WO2018002268A1 true WO2018002268A1 (en) | 2018-01-04 |
Family
ID=56296614
Family Applications (1)
| Application Number | Title | Priority Date | Filing Date |
|---|---|---|---|
| PCT/EP2017/066210 Ceased WO2018002268A1 (en) | 2016-06-29 | 2017-06-29 | Improved methods for determining respiratory properties and system therefor |
Country Status (2)
| Country | Link |
|---|---|
| EP (1) | EP3263028A1 (en) |
| WO (1) | WO2018002268A1 (en) |
Cited By (2)
| Publication number | Priority date | Publication date | Assignee | Title |
|---|---|---|---|---|
| CN115444367A (en) * | 2022-09-01 | 2022-12-09 | 广西力拓医疗科技有限公司 | Monitoring method and system of respiratory function rehabilitation training instrument based on artificial intelligence |
| KR102951579B1 (en) | 2021-09-17 | 2026-04-10 | 아르셀러미탈 | Leveler calibration device |
Families Citing this family (2)
| Publication number | Priority date | Publication date | Assignee | Title |
|---|---|---|---|---|
| EP3320840B1 (en) * | 2016-11-11 | 2022-08-17 | Tata Consultancy Services Limited | System and method for pulmonary health monitoring |
| CN120093273B (en) * | 2025-05-07 | 2025-09-02 | 南方科技大学 | Sputum obstruction detection method, system, terminal and medium based on lung binary tree model |
Citations (2)
| Publication number | Priority date | Publication date | Assignee | Title |
|---|---|---|---|---|
| US2934060A (en) * | 1955-05-26 | 1960-04-26 | Neil S Satter | Apparatus and method for conditioning respiration |
| EP2384697A1 (en) | 2010-05-05 | 2011-11-09 | Universiteit Gent | Method and device for determining non-linear effects in the respiratory impedance |
-
2016
- 2016-06-29 EP EP16176967.4A patent/EP3263028A1/en not_active Withdrawn
-
2017
- 2017-06-29 WO PCT/EP2017/066210 patent/WO2018002268A1/en not_active Ceased
Patent Citations (2)
| Publication number | Priority date | Publication date | Assignee | Title |
|---|---|---|---|---|
| US2934060A (en) * | 1955-05-26 | 1960-04-26 | Neil S Satter | Apparatus and method for conditioning respiration |
| EP2384697A1 (en) | 2010-05-05 | 2011-11-09 | Universiteit Gent | Method and device for determining non-linear effects in the respiratory impedance |
Non-Patent Citations (11)
| Title |
|---|
| DANIEL NAVAJAS ET AL: "Forced oscillation assessment of respiratory mechanics in ventilated patients", 20 December 2000 (2000-12-20), XP055329993, Retrieved from the Internet <URL:https://www.ncbi.nlm.nih.gov/pmc/articles/PMC137264/pdf/cc972.pdf> [retrieved on 20161216] * |
| DAROCZY, GENERATION OF OPTIMUM PSEUDORANDOM SIGNALS FOR RESPIRATORY IMPEDANCE MEASUREMENTS |
| FARRE, HUMAN LUNG IMPEDANCE FROM SPONTANEOUS BREATHING FREQUENCIES TO 32 HZ |
| HANNES MAES, ESTIMATION OF RESPIRATORY IMPEDANCE AT LOW FREQUENCIES DURING SPONTANEOUS BREATHING USING THE FORCED OSCILLATION TECHNIQUE |
| HANTOS, FORCED OSCILLATORY IMPEDANCE OF THE RESPIRATORY SYSTEM |
| KACZKA, PARTITIONING AIRWAY AND LUNG TISSUE RESISTANCES IN HUMANS: EFFECTS OF BRONCHOCONSTRICTION |
| LUTCHEN, OPTIMAL VENTILATION WAVEFORMS FOR ESTIMATING LOW-FREQUENCY RESPIRATORY IMPEDANCE |
| MAES HANNES ET AL: "Estimation of respiratory impedance at low frequencies during spontaneous breathing using the forced oscillation technique", 2014 36TH ANNUAL INTERNATIONAL CONFERENCE OF THE IEEE ENGINEERING IN MEDICINE AND BIOLOGY SOCIETY, IEEE, 26 August 2014 (2014-08-26), pages 3410 - 3413, XP032675649, DOI: 10.1109/EMBC.2014.6944355 * |
| PASKER, TOTAL RESPIRATORY IMPEDANCE MEASURED BY MEANS OF THE FORCED OSCILLATION TECHNIQUE IN SUBJECTS WITH AND WITHOUT RESPIRATORY COMPLAINTS |
| RAMON FARRÉ ET AL: "Oscillatory Resistance Measured during Noninvasive Proportional Assist Ventilation RAMON FARRÉ,", AMERICAN JOURNAL OF RESPIRATORY AND CRITICAL CARE MEDICINE, vol. 164, no. 5, 1 September 2001 (2001-09-01), pages 790 - 794, XP055330137 * |
| RAMON FARRE; DANIEL NAVAJAS: "Oscillatory resistance measured during noninvasive proportional assist ventilation", FORCED OSCILLATION ASSESSMENT OF RESPIRATORY MECHANICS IN VENTILATED PATIENTS |
Cited By (3)
| Publication number | Priority date | Publication date | Assignee | Title |
|---|---|---|---|---|
| KR102951579B1 (en) | 2021-09-17 | 2026-04-10 | 아르셀러미탈 | Leveler calibration device |
| CN115444367A (en) * | 2022-09-01 | 2022-12-09 | 广西力拓医疗科技有限公司 | Monitoring method and system of respiratory function rehabilitation training instrument based on artificial intelligence |
| CN115444367B (en) * | 2022-09-01 | 2023-09-05 | 广西力拓医疗科技有限公司 | Monitoring method and system of respiratory function rehabilitation training instrument based on artificial intelligence |
Also Published As
| Publication number | Publication date |
|---|---|
| EP3263028A1 (en) | 2018-01-03 |
Similar Documents
| Publication | Publication Date | Title |
|---|---|---|
| CN113710151B (en) | Method and apparatus for detecting respiratory disorders | |
| US20230210401A1 (en) | System and method for non-invasively determining an internal component of respiratory effort | |
| Tang et al. | Segmentation of heart sounds based on dynamic clustering | |
| WO2018002268A1 (en) | Improved methods for determining respiratory properties and system therefor | |
| JP5868866B2 (en) | Method of operating a device for estimating respiratory impedance and the device | |
| Lee et al. | Noncontact detection and analysis of respiratory function using microwave Doppler radar | |
| US20150164413A1 (en) | Method of creating anesthetic consciousness index with artificial neural network | |
| CN105662417B (en) | A kind of control method and device based on the pressure signal feature recognition sound of snoring | |
| KR20200032248A (en) | System and method for determining sleep stage | |
| CN108348718A (en) | The gradually breathing of Patients with Lung parameter for improving estimation performance reappraises | |
| Komorowski et al. | The extraction of the new components from electrogastrogram (EGG), using both adaptive filtering and electrocardiographic (ECG) derived respiration signal | |
| Peng et al. | Wavelet phase synchronization analysis of cerebral blood flow autoregulation | |
| US20230200677A1 (en) | Methods and systems of calibrating respiratory measurements to determine flow, ventilation and/or endotypes | |
| US12268811B2 (en) | Estimation of cardiogenic artefacts on ventilator airway pressure and flow for the automated detection and resolution of patient ventilator asynchronies | |
| JP6538599B2 (en) | DIAGNOSTIC SUPPORT DEVICE, ITS OPERATION METHOD, AND OPERATION PROGRAM | |
| Wang | Multi-sensor adaptive heart and lung sound extraction | |
| CN116528755B (en) | A filtering method and filtering device for esophageal pressure signal | |
| Wang et al. | Lung sound/noise separation for anesthesia respiratorymonitoring. | |
| WO2022165567A1 (en) | Method for estimating the muscle pressure of a patient being ventilated by a pulmonary ventilator and auxiliary device for a pulmonary ventilator | |
| US12514460B2 (en) | Determining a heart rate of a subject | |
| Alamdari et al. | High frequency-low amplitude oscillometry: Continuous unobtrusive monitoring of respiratory function on PAP machines | |
| Premkumar et al. | Continuous wavelet analysis of the breathing sounds of obstructive sleep apnea patients and normal subjects during wakefulness | |
| Skalicky et al. | Respiratory sounds as a source of information in asthma diagnosis | |
| CN119997876A (en) | Respiration rate measurement | |
| Jin | Advanced signal processing methods for analysis of respiratory sounds |
Legal Events
| Date | Code | Title | Description |
|---|---|---|---|
| 121 | Ep: the epo has been informed by wipo that ep was designated in this application |
Ref document number: 17733849 Country of ref document: EP Kind code of ref document: A1 |
|
| NENP | Non-entry into the national phase |
Ref country code: DE |
|
| 122 | Ep: pct application non-entry in european phase |
Ref document number: 17733849 Country of ref document: EP Kind code of ref document: A1 |