WO2017117685A1 - Disease models and prognostic tools for pre-leukemia and leukemia - Google Patents
Disease models and prognostic tools for pre-leukemia and leukemia Download PDFInfo
- Publication number
- WO2017117685A1 WO2017117685A1 PCT/CA2017/050020 CA2017050020W WO2017117685A1 WO 2017117685 A1 WO2017117685 A1 WO 2017117685A1 CA 2017050020 W CA2017050020 W CA 2017050020W WO 2017117685 A1 WO2017117685 A1 WO 2017117685A1
- Authority
- WO
- WIPO (PCT)
- Prior art keywords
- aml
- gsk
- progression
- mds
- control profile
- Prior art date
- Legal status (The legal status is an assumption and is not a legal conclusion. Google has not performed a legal analysis and makes no representation as to the accuracy of the status listed.)
- Ceased
Links
Classifications
-
- C—CHEMISTRY; METALLURGY
- C12—BIOCHEMISTRY; BEER; SPIRITS; WINE; VINEGAR; MICROBIOLOGY; ENZYMOLOGY; MUTATION OR GENETIC ENGINEERING
- C12Q—MEASURING OR TESTING PROCESSES INVOLVING ENZYMES, NUCLEIC ACIDS OR MICROORGANISMS; COMPOSITIONS OR TEST PAPERS THEREFOR; PROCESSES OF PREPARING SUCH COMPOSITIONS; CONDITION-RESPONSIVE CONTROL IN MICROBIOLOGICAL OR ENZYMOLOGICAL PROCESSES
- C12Q1/00—Measuring or testing processes involving enzymes, nucleic acids or microorganisms; Compositions therefor; Processes of preparing such compositions
- C12Q1/68—Measuring or testing processes involving enzymes, nucleic acids or microorganisms; Compositions therefor; Processes of preparing such compositions involving nucleic acids
- C12Q1/6876—Nucleic acid products used in the analysis of nucleic acids, e.g. primers or probes
- C12Q1/6883—Nucleic acid products used in the analysis of nucleic acids, e.g. primers or probes for diseases caused by alterations of genetic material
- C12Q1/6886—Nucleic acid products used in the analysis of nucleic acids, e.g. primers or probes for diseases caused by alterations of genetic material for cancer
-
- G—PHYSICS
- G16—INFORMATION AND COMMUNICATION TECHNOLOGY [ICT] SPECIALLY ADAPTED FOR SPECIFIC APPLICATION FIELDS
- G16B—BIOINFORMATICS, i.e. INFORMATION AND COMMUNICATION TECHNOLOGY [ICT] SPECIALLY ADAPTED FOR GENETIC OR PROTEIN-RELATED DATA PROCESSING IN COMPUTATIONAL MOLECULAR BIOLOGY
- G16B25/00—ICT specially adapted for hybridisation; ICT specially adapted for gene or protein expression
- G16B25/10—Gene or protein expression profiling; Expression-ratio estimation or normalisation
-
- G—PHYSICS
- G01—MEASURING; TESTING
- G01N—INVESTIGATING OR ANALYSING MATERIALS BY DETERMINING THEIR CHEMICAL OR PHYSICAL PROPERTIES
- G01N33/00—Investigating or analysing materials by specific methods not covered by groups G01N1/00 - G01N31/00
- G01N33/48—Biological material, e.g. blood, urine; Haemocytometers
-
- G—PHYSICS
- G16—INFORMATION AND COMMUNICATION TECHNOLOGY [ICT] SPECIALLY ADAPTED FOR SPECIFIC APPLICATION FIELDS
- G16B—BIOINFORMATICS, i.e. INFORMATION AND COMMUNICATION TECHNOLOGY [ICT] SPECIALLY ADAPTED FOR GENETIC OR PROTEIN-RELATED DATA PROCESSING IN COMPUTATIONAL MOLECULAR BIOLOGY
- G16B25/00—ICT specially adapted for hybridisation; ICT specially adapted for gene or protein expression
-
- G—PHYSICS
- G16—INFORMATION AND COMMUNICATION TECHNOLOGY [ICT] SPECIALLY ADAPTED FOR SPECIFIC APPLICATION FIELDS
- G16B—BIOINFORMATICS, i.e. INFORMATION AND COMMUNICATION TECHNOLOGY [ICT] SPECIALLY ADAPTED FOR GENETIC OR PROTEIN-RELATED DATA PROCESSING IN COMPUTATIONAL MOLECULAR BIOLOGY
- G16B25/00—ICT specially adapted for hybridisation; ICT specially adapted for gene or protein expression
- G16B25/20—Polymerase chain reaction [PCR]; Primer or probe design; Probe optimisation
-
- C—CHEMISTRY; METALLURGY
- C12—BIOCHEMISTRY; BEER; SPIRITS; WINE; VINEGAR; MICROBIOLOGY; ENZYMOLOGY; MUTATION OR GENETIC ENGINEERING
- C12Q—MEASURING OR TESTING PROCESSES INVOLVING ENZYMES, NUCLEIC ACIDS OR MICROORGANISMS; COMPOSITIONS OR TEST PAPERS THEREFOR; PROCESSES OF PREPARING SUCH COMPOSITIONS; CONDITION-RESPONSIVE CONTROL IN MICROBIOLOGICAL OR ENZYMOLOGICAL PROCESSES
- C12Q2600/00—Oligonucleotides characterized by their use
- C12Q2600/118—Prognosis of disease development
-
- C—CHEMISTRY; METALLURGY
- C12—BIOCHEMISTRY; BEER; SPIRITS; WINE; VINEGAR; MICROBIOLOGY; ENZYMOLOGY; MUTATION OR GENETIC ENGINEERING
- C12Q—MEASURING OR TESTING PROCESSES INVOLVING ENZYMES, NUCLEIC ACIDS OR MICROORGANISMS; COMPOSITIONS OR TEST PAPERS THEREFOR; PROCESSES OF PREPARING SUCH COMPOSITIONS; CONDITION-RESPONSIVE CONTROL IN MICROBIOLOGICAL OR ENZYMOLOGICAL PROCESSES
- C12Q2600/00—Oligonucleotides characterized by their use
- C12Q2600/158—Expression markers
Definitions
- the disclosure relates to disease models of myelodysplastic syndromes (MDS) and acute myeloid leukemia (AML) and uses thereof.
- MDS myelodysplastic syndromes
- AML acute myeloid leukemia
- the disclosure also relates to methods and kits for detecting and/or screening for progression to AML, or an increased likelihood of progression to AML, in a subject with MDS.
- MDS Myelodysplastic syndromes
- HSPCs hematopoietic stem/progenitors cells
- BM dysplastic bone marrow
- MDS/AML is often used to describe a biological continuum in leukemia pathogenesis (Cazzola et al., 2013; Kreso and Dick, 2014).
- MDS to AML transition remains poorly understood (Bejar and Steensma, 2014; Larsson et al., 2013; Zhang et al., 2015), underscoring the need to better understand the specific pathways responsible for disease initiation and progression.
- Glycogen synthase kinase-3 (GSK-3) is an essential regulator of hematopoiesis (Huang et al., 2009; Trowbridge et al., 2006) and represents a signaling hub for Hedgehog (Briscoe and Therond, 2013), Wnt (Wu and Pan, 2010), and Notch (Andersson et al., 201 1 ) that has recently been reported to play a pivotal role in various leukemias (Abrahamsson et al., 2009; Banerji et al., 2012; Wang et al., 2008).
- GSK-3 mediated networks may represent a more universal initiator of numerous pathways in cancers (Takahashi-Yanaga, 2013).
- Previous studies have shown functional redundancy between the two homologues of GSK-3 (a and ⁇ ) (Doble et al., 2007; Gillespie et al., 201 1 ; Itoh et al., 2012), which are encoded by separate genes on different chromosomes (Wada, 2009), but exhibit tissue-specific physiologically-important functions that may have varying impacts on human cancer etiology (Banerji et al., 2012; Takahashi-Yanaga, 2013). This suggests that the overriding tissue specific functions of GSK-3 and the interplay of a and ⁇ homologues are likely cell context specific.
- GSK-3 homologues have not been studied with respect to their individual impact on disease progression in MDS or AML.
- specific allelic targeting of GSK-3a and GSK-3p in hematopoietic tissue induces stepwise progression to AML state via a preneoplastic myeloid disorder that resembles human MDS.
- the present disclosure shows that the deletion of GSK-3p in a transgenic mouse model leads to a MDS-like disease in vivo and the combined deletion of GSK- 3a and GSK-3 in a transgenic mouse model leads to an AML-like disease in vivo.
- These models are useful for screening for test agents to treat or prevent MDS, AML and/or progression from MDS to AML.
- the present disclosure also defines a specific "GSK-3 molecular signature" using a systematic approach based on the transcriptome comparison between WT versus GSK-3 KO LSK cells of those genes with greater than 1 .5-fold change in whole gene expression (with p ⁇ 0.05). This subset of genes was further filtered to yield a 63-gene GSK-3 signature based on a fold change > 5 (with p ⁇ 0.05). This signature was able to predict clinical outcomes of MDS patients.
- a method of detecting and/or screening for progression to AML or an increased likelihood of progression to AML, in a human subject having MDS comprising:
- sample gene expression profile from a sample comprising DNA from said subject, said sample profile comprising:
- a high level of similarity of the sample profile to a high risk AML progression control profile indicates progression to AML or an increased likelihood of progression to AML.
- a higher level of similarity to a high risk AML progression control profile than to a low risk AML progression control profile is indicated by hierarchical clustering.
- a higher level of similarity to a high risk AML progression control profile than to a low risk AML progression control profile is indicated by a higher correlation value computed between the sample profile and the high risk AML progression control profile than an equivalent correlation value computed between the sample profile and the low risk AML progression control profile, optionally wherein the correlation value is a correlation coefficient.
- a low level of similarity of the sample profile to a high risk AML progression control profile indicates no progression to AML or an decreased likelihood of progression to AML.
- a lower level of similarity to a high risk AML progression control profile than to a low risk AML progression control profile is indicated by hierarchical clustering.
- a lower level of similarity to a high risk AML progression control profile than to a low risk AML progression control profile is indicated by a lower correlation value computed between the sample profile and the high risk AML progression control profile than an equivalent correlation value computed between the sample profile and the low risk AML progression control profile, optionally wherein the correlation value is a correlation coefficient.
- the method further comprises identifying the WHO MDS subtype of the subject, wherein (a) (i) a high level of similarity of the sample profile to a high risk AML progression control profile; (ii) a low level of similarity to low risk AML progression control profile and/or (iii) a higher level of similarity to a high risk AML progression control profile than to a low risk AML progression control profile; and
- the method further comprises identifying the WHO MDS subtype of the subject, wherein
- the method further comprises identifying the WHO MDS subtype of the subject, wherein
- the subject identified as having progression to AML an increased likelihood of progression to AML or a high risk of progression to AML is treated with chemotherapy, radiation, stem cell transplantation and/or bone marrow transplantation.
- the disclosure also provides a method of selecting a treatment for a subject with progression to AML or an increased likelihood of progression to AML, comprising:
- the disclosure also provides a method of detecting and/or screening for myelodysplastic syndrome (MDS) or an increased likelihood of MDS, in a human subject, comprising: determining a sample gene expression profile from a sample comprising DNA from said subject, said sample profile comprising, consisting of, or consisting essentially of:
- a higher level of similarity to an MDS specific control profile than to a non-MDS specific control profile is indicated by hierarchical clustering.
- a higher level of similarity to an MDS specific control profile than to a non-MDS specific control profile is indicated by a higher correlation value computed between the sample profile and the MDS specific control profile than an equivalent correlation value computed between the sample profile and non-MDS specific control profile, optionally wherein the correlation value is a correlation coefficient.
- the subject is a pediatric subject.
- determining the sample gene expression profile comprises the steps:
- the sample is derived from a clinical specimen.
- the sample is derived from blood or bone marrow.
- the disclosure also provides a kit for detecting and/or screening for progression to AML or an increased likelihood of progression to AML, in a human subject having MDS, in a sample, comprising:
- the disclosure also provides a
- kit for detecting and/or screening for MDS or an increased likelihood of MDS in a sample from a human subject comprising:
- the detection agents are probes and/or primers.
- the kit further comprises PCR reagents.
- the kit further comprises a computer- readable medium that causes a computer to compare gene expression from a sample at the selected genes to one or more control profiles and compute a correlation value between the sample and control profile.
- the disclosure also provides a method of screening a test agent for treatment or prevention of myelodysplastic syndrome (MDS), comprising a) administering a test agent to i) a transgenic mouse model of MDS whose genome comprises a disruption of GSK-3p, ii) a tissue from said transgenic mouse model, or iii) a cell derived from said transgenic mouse model; and b) determining the effect of said test agent on the mouse model, tissue or cell, wherein a reduction of signs and/or symptoms of MDS in the mouse, tissue or cell identifies a test agent for the treatment or prevention of MDS.
- MDS myelodysplastic syndrome
- the disruption is a homozygous GSK-3 knockout.
- the GSK-3 knock out is a conditional knockout of GSK-3 .
- the disclosure also provides a method of screening a test agent for treatment or prevention of acute myeloid leukemia (AML), comprising a) administering a test agent to i) a transgenic mouse model of AML whose genome comprises a disruption of GSK-3a and a disruption of a tissue from said transgenic mouse model, or iii) a cell derived from said transgenic mouse model; and b) determining the effect of said agent on the mouse model, tissue or cell, wherein a reduction of signs and/or symptoms of AML in the mouse, tissue or cell identifies a test agent for the treatment or prevention of AML.
- AML acute myeloid leukemia
- the disruption of GSK-3a is a homozygous GSK-3a knockout and/or the disruption of GSK-3 is a homozygous GSK-3 knockout.
- the GSK-3a knockout is a conditional knockout of GSK-3a and/or the GSK-3 knock out is a conditional knockout of GSK-3 .
- the disclosure also provides a method screening a test agent for treatment or prevention of myelodysplastic syndrome (MDS), comprising a) administering a test agent to a cell comprising a disruption of GSK-3 and b) determining the effect of said agent on the cell.
- MDS myelodysplastic syndrome
- the disruption is a homozygous GSK-3 knockout.
- the GSK-3 knock out is a conditional knockout of GSK-3 .
- the disclosure also provides a method of screening a test agent for treatment or prevention of acute myeloid leukemia (AML) comprising a) administering a test agent to a cell comprising a disruption of GSK-3a and a disruption of GSK-3 and b) determining the effect of said agent on the cell.
- AML acute myeloid leukemia
- the disruption of GSK-3a is a homozygous GSK-3a knockout and/or the disruption of GSK-3 is a homozygous GSK-3 knockout.
- the GSK-3a knockout is a conditional knockout of GSK-3a and/or the GSK-3 knock out is a conditional knockout of GSK-3 .
- the cell is a human cell.
- the present disclosure also provides a method for creating a transgenic model for myelodysplastic syndrome by creating gene knockouts of GSK-3a.
- a method for classifying human myeloid pre- neoplasm subtypes comprising: determining in a subject the gene expression level for each of a set of genes selected from a GSK-3 gene signature listed in Table 5 to obtain a subject expression profile.
- GSK-3 signature alone or in combination with other methods for risk stratification of a subject with myelodysplastic syndrome.
- GSK-3 signature alone or in combination with other methods for determining a prognosis of a subject based on their expression profile.
- GSK-3 signature alone or in combination with other methods for guiding treatment based on gene expression profile.
- GSK-3 signature alone or in combination with other methods for monitoring treatment response.
- Figure 1 shows that the combined deletion of GSK-3a and ⁇ alleles leads to an AML-like disease in vivo
- FIG. 2 shows the GSK-3 deficiency alone leads to myelodysplasia and impaired hematopoiesis.
- FIG. 3 shows GSK-3 -MDS BM arises from HSCs and displays MDS-IC activity
- LSK sorted HSCs
- non-LSK progenitors
- n dual features of hypercellular BM and splenomegaly (10/15 mice)
- (d) with diffuse infiltration by myeloid and granulocytic cells and presence of dysplastic neutrophils (arrowheads) (n 10).
- Figure 4 shows HSCs GSK-3 -null and ⁇ / ⁇ -null acquires dysregulated stem cell and myeloid differentiation gene programs driven by progressive activation of the Wnt/Akt/mTOR signaling axis, (a) Principle component analysis (PCA) on all entities from global gene expression profiling
- Figure 5 shows the GSK-3 -null BM expresses a unique gene expression profile and predicts pediatric MDS disease outcome
- (b) Unique GSK-3p-deletion signature (63 genes, triangles) is determined between GSK-3 WT and ⁇ (p ⁇ 0.05, fold-change >5).
- GSK- 3 ⁇ gene signature discriminates human myeloid neoplasm subtypes
- GSK-3 -deletion differential transcriptome p ⁇ 0.05, fold-change >1 .5
- Figure 6 depicts the model of MDS onset and AML progression by allelic dosage of GSK-3a/ .
- Figure 7 shows the effect on hematopoiesis is dependent on the allelic dosage of GSK-3a/ .
- (a) Experimental design outlining the strategy to generate conditional GSK-3 knockout mice, (b-c) GSK3fi deletion was demonstrated by genomic PCR (b) mRNA gene expression and (c) Western Blot analysis of total Lin " bone marrow cells from wild-type (+/+), heterozygous (+/flx) and homozygous (flx/flx) GSK-3 mice 2 weeks after Tamoxifen injections (n 5).
- Figure 9 shows the GSK-3p deletion leads to impaired hematopoiesis and MDS properties that are sustained in secondary recipients
- (a-b) Representative bone marrow and spleen sections denoting progressive granulocytosis (MPO + ) without monocytosis (Mac-2 + ) in GSK-3 - null (B KO) and ⁇ / ⁇ -null (DKO) (n 4 for each genotype)
- Figure 10 shows the hematological disorder related to GSK-3 deficiency is initiated solely by HSCs.
- (a) Effect of GSK-3 deletion on HSCs subset demonstrating a specific increase of the LSK and CD150 + 48 + subsets (mean ⁇ S.D., n 10).
- mice transplanted with HSPC stem/progenitor
- Figure 1 1 shows the GSK-3 ⁇ / ⁇ deletion displays specific dysregulated gene program that is not allelic dose dependent
- Figure 12 shows the GSK-3 gene signatures predict MDS outcomes in humans, (a-b) GSEA analysis showing dysregulated epigenetic signatures previously associated with MDS/AML malignancies, (c) Mapping view of relevant functional association network of GSK-3 63-gene signature generated using STRING protein interaction database; stronger associations are represented by multiple lines and gene products involved in immune response are highlighted, (d) Kaplan-Meier curves demonstrate that WHO criteria as well as (e) both GSK-3 differential transcriptome and 63- gene signatures predict faithfully patient's prognosis and (f) AML transformation risk of pediatric MDS patients, as denoted by p-value.
- Figure 13 shows in vitro deletion of the Gsk3 KO and Gsk3a + ⁇ DKO in highly enriched LSK BM cell lines allow the study of the molecular features for disease onset, a) An experimental design for in vitro analysis, b) a representative flow cytometry histograms showing the percentage of c-Kit+ and Sca-1 + from the Lin- BM analyzed at Day 0 and Day 7 after incubation, c) quantitative PCR validation of Gsk3 allele deletion after in vitro Tamoxifen treatment and d) representative western blots showing the decreased protein levels of GSK3a and/or ⁇ in the respective cell line after in vitro Tamoxifen treatment.
- MDS Myelodysplasia syndrome
- AML lethal acute myeloid leukemia
- Table 5 the disclosure identifies 63 distinct genes, each of which show a statistically significant (p-value ⁇ 0.05) difference in gene expression levels between wild type cells and GSK-3p KO LSK cells.
- the gene expression levels of the disclosed genes and human orthologues thereof, or a subset thereof may be used in diagnostic and prognostic testing for MDS and AML and in particular, in detecting and/or screening for the progression of MDS to AML.
- the disclosure provides a method of detecting and/or screening for progression to AML or an increased likelihood of progression to AML, in a human subject having MDS, comprising:
- sample gene expression profile from a sample comprising DNA from said subject, said sample profile comprising, consisting of, or consisting essentially of:
- a high level of similarity of the sample profile to a high risk AML progression control profile indicates progression to AML or an increased likelihood of progression to AML.
- Another aspect of the disclosure provides a method of detecting and/or screening for myelodysplastic syndrome (MDS) or an increased likelihood of MDS, in a human subject, comprising: determining a sample gene expression profile from a sample comprising DNA from said subject, said sample profile comprising, consisting of, or consisting essentially of: (a) the gene expression level of at least 3, optionally at least 5, at least 10, at least 20, at least 30, at least 40, at least 50, at least 60, or all of the human orthologues of the genes listed in Table 5; and
- Another aspect of the disclosure provides a method of detecting and/or screening for acute myeloid leukemia (AML) or an increased likelihood of AML, in a human subject, comprising: determining a sample gene expression profile from a sample comprising DNA from said subject, said sample profile comprising, consisting of, or consisting essentially of:
- the term "gene” refers to a genomic DNA sequence that comprises a coding sequence associated with the production of a polypeptide or polynucleotide product (e.g., rRNA, tRNA).
- expression level refers to the measurable quantity of a gene product produced by the gene in a sample of a patient, such as a blood sample or a bone marrow sample, wherein the gene product can be a transcriptional product or a translated transcriptional product. Accordingly, the expression level can pertain to a nucleic acid gene product such as RNA or cDNA or a polypeptide gene product.
- the expression level is derived from a patient sample or cell and/or a control sample, and can for example be detected de novo or correspond to a previous determination.
- orthologue refers to genes in different species that evolved from a common ancestral gene by speciation. Normally, orthologues retain the same function in the course of evolution. Accordingly, the term “human orthologues of the genes in Table 5" refers to human orthologues of the mouse genes set out in Table 5. Determining human orthologues of mouse genes can be determined, for example, through the use of online databases such as GenBank. Table 5 provides accession numbers of human orthologues of the mouse genes listed therein.
- Methods of determining gene expression levels can be determined by assaying nucleic acid expression products, for example mRNA or cDNA and/or by assaying polypeptide products.
- the level of gene expression can also be determined by assaying the presence and/or amount of a specific sequence in the gene, also known as a target sequence, optionally an mRNA target sequence.
- the level of gene expression can be determined or measured using a detection agent, wherein the agent detects a gene expression product of a gene or target sequence described herein.
- the detection agent is an antibody, receptor protein or a nucleic acid such as a probe or primer set, capable of amplifying the gene or gene expression product.
- the methods comprise determining nucleic acid levels.
- the gene expression level being determined is a nucleic acid
- the gene expression levels can be determined using a number of methods for example a microarray chip or PCR, optionally multiplex PCR, northern blotting, or other methods and techniques designed to produce quantitative or relative data for the levels of mRNA species corresponding to specified nucleotide sequences present in a sample. Accordingly, in an embodiment, the gene expression level is determined using a microarray chip and/or PCR, optionally multiplex PCR.
- Expression levels of the genes described herein can also be determined using primers (also known as target specific primers).
- primers are attached to universal primer sequences that produce an amplification product (see for Example, US Patent No. 6,618,679).
- the multiplex amplification reaction used in the methods includes, but is not limited to PCR and the use of reverse transcription to generate cDNA from mRNA targets followed by nucleic acid sequence based amplification. These methods include single reaction RT-PCR, 2 step reverse transcription and PCR amplification, ligase chain reaction, cyclic probe amplification, an invader assay, bridge amplification or rolling circle amplification or a combination.
- the primers are designed to be intron spanning to minimize or eliminate genomic DNA signal interference. This can be accomplished using several primer design software products such as Primero (The Whitehead Institute, MA), OLIGO (Molecular Biology Insights, Inc, CO).
- amplified PCR products are separated by fragment sizes corresponding to the different target genes and the peak areas represent the mRNA level of expression.
- Amplified PCR products are separated by capillary electrophoresis or other separation techniques such as agarose and/or acrylamide gel, chromatography such as HPLC, or FPLC as well as microfluidic techniques. Detection is performed by, but not limited, to measuring the emission of laser induced fluorescence labels. Other methods of detection include light absorptions and electrochemical signals. Amplified PCR products can also be detected by microarray, bead based analysis, and multiplex qPCR.
- a "gene expression profile” refers to the gene expression levels of one or more target genes.
- An expression profile can for example be detected by measuring RNA expression using methods described above such as microarray analysis, RT-PCR, multiplex PCR, directly quantitating RNA levels using for example RNA sequencing and/or by measuring polypeptide expression using methods such as flow cytometry and Western blotting.
- sample gene expression profile refers to the gene expression levels of one or more target genes in a subject's genomic DNA.
- the gene expression profile of a sample tested according to the methods disclosed herein is referred to as a sample profile.
- the sample gene expression profile is compared to one or more control profiles.
- the control profile may be a reference value and/or may be derived from one or more samples, optionally from historical gene expression data for a patient or pool of patients who are known to have, or not have, MDS and/or AML and/or progression from MDS to AML.
- the historical gene expression data can be a value that is continually updated as further samples are collected and individuals are identified as having MDS, AML and/or progression from MDS to AML as described herein.
- the control profile represents an average of the gene expression levels for selected genes as described herein. Average gene expression levels may, for example, be the mean levels or median levels.
- a "MDS specific control profile” or “MDS control profile” may be generated by measuring the gene expression levels of specified genes in genomic DNA from an individual subject, or population of subjects, who are known to have MDS.
- a “non-MDS control profile” may be generated by measuring the gene expression levels of specified genes in genomic DNA from an individual subject or population of subjects who are known to not have MDS.
- an "AML specific control profile” or “AML control profile” may be generated by measuring the gene expression levels of specified genes in genomic DNA from an individual subject, or population of subjects, who are known to have AML.
- a “non-AML control profile” may be generated by measuring the gene expression levels of specified genes in genomic DNA from an individual subject or population of subjects who are known to not have AML.
- a "high risk AML progression control profile" may be generated by measuring the gene expression levels of specified genes in genomic DNA from an individual subject, or population of subjects, who are known to have a high risk of progressing from MDS to AML.
- a "low risk AML progression control profile" may be generated by measuring the gene expression levels of specified genes in genomic DNA from an individual subject, or population of subjects, who are known to have a low risk of progressing from MDS to AML.
- the tissue source from which the sample profile and control profile are derived is matched, so that they are both derived from the same or similar tissue.
- sample includes but is not limited to a body fluid sample, tissue sample or tumor sample, which can be assayed for gene expression levels.
- the sample includes for example a blood sample, a biopsy, a frozen tissue sample, a fresh tissue specimen, a cell sample, and/or a paraffin embedded section, material from which, for example, RNA or DNA can be extracted in sufficient quantities and with adequate quality to permit measurement of relative RNA levels or material from which polypeptides can be extracted in sufficient quantities and with adequate quality to permit measurement of relative polypeptide levels.
- the phrase "detecting and/or screening" for a condition refers to a method or process of determining if a subject has or does not have said condition. Where the condition is a likelihood or risk for a disease or disorder, the phrase “detecting and/or screening” will be understood to refer to a method or process of determining if a subject is at an increased or decreased likelihood for the disease or disorder.
- progression to AML refers to the process by which pre-leukemic syndromes such as MDS develop and/or transform into acute myeloid leukemia. It includes any and all steps along the continuum by which MDS proceeds to AML.
- level of progression to AML refers to the likelihood that a subject diagnosed with, or suspected of having, MDS will develop AML.
- a subject with an "increased likelihood of progression” or “an increased likelihood of MDS and/or AML” is also referred to having a high risk of progression or a high risk of MDS and/or AML.
- a subject with a "decreased likelihood of progression” or “decreased likelihood of MDS and/or AML” is also referred to having a low risk of progression or a low risk of MDS and/or AML.
- An “intermediate” risk falls between high risk and low risk and a subject having a "moderate likelihood of progression” or a "moderate likelihood of MDS and/or AML” is also referred to having an intermediate risk of progression or an intermediate risk of MDS and/or AML.
- subject refers to a human subject and includes, for example, a pediatric subject. In some embodiments, the subject is a patient diagnosed with, or suspected to have, MDS.
- This disclosure also provides a process for normalizing target gene expression data or signal against at least one or against a geometric means of multiple housekeeping gene target signals for improved gene expression analysis accuracy.
- Housekeeping genes are genes that are known to express at consistent mRNA level.
- the expression level is determined by one or more probes and/or one or more probe sets.
- the one or more probes and/or the one or more probe sets for example, include probes for the genes described herein comprised on a microarray.
- probe refers to a nucleic acid molecule that comprises a sequence of nucleotides that will hybridize specifically to a target nucleic acid sequence such as the genes described herein.
- the probe comprises at least 10 or more bases or nucleotides that are complementary and hybridize to contiguous bases and/or nucleotides in the target nucleic acid sequence.
- the length of probe depends on the hybridization conditions and the sequences of the probe and nucleic acid target sequence and can for example be 10-20, 21 -70, 71 -100, 101 -500 or more bases or nucleotides in length.
- the probes can optionally be fixed to a solid support such as an array chip, a microarray chip or bead based solid support.
- the expression is determined using one or more primer sets.
- the nucleic acid targets are mRNA and are assayed using one or more target specific probes or one or more target specific primer pairs complimentary to each target sequence.
- primer refers to a nucleic acid molecule, whether occurring naturally as in a purified restriction digest or produced synthetically (for example, a synthetic peptide nucleic acid (PNA) or a locked nucleic acid (LNA)), which is capable of acting as a point of synthesis when placed under conditions in which synthesis of a primer extension product, which is complementary to a nucleic acid strand is induced (e.g. in the presence of nucleotides and an inducing agent such as DNA polymerase and at a suitable temperature and pH).
- PNA synthetic peptide nucleic acid
- LNA locked nucleic acid
- the primer must be sufficiently long to prime the synthesis of the desired extension product in the presence of the inducing agent.
- primer length will depend upon factors, including temperature, sequences of the primer and the methods used.
- a primer typically contains 15-25 or more nucleotides, although it can contain less. The factors involved in determining the appropriate length of primer are readily known to one of ordinary skill in the art.
- gene expression levels are measured using an agent that provides for determination of gene expression levels of at least one, optionally all, of the selected genes, wherein the agent comprises an oligonucleotide-immobilized substrate comprising a plurality of oligonucleotide probes or primers corresponding to the selected genes.
- the agent comprises an oligonucleotide-immobilized substrate comprising a plurality of oligonucleotide probes or primers corresponding to the selected genes.
- a non-limiting example of such an agent includes a "microarray", comprising an ordered set of probes fixed to a solid surface that permits analysis such as gene expression analysis of a plurality of genes or gene sequences.
- a method described herein also comprises first obtaining a sample from the subject.
- the sample in an embodiment, comprises a clinical specimen.
- clinical specimen includes any sample from a subject which comprises nucleic acids, for example, DNA.
- Examples of clinical specimens useful in the present methods include, but are not limited to, blood and bone marrow samples.
- Other examples of samples useful in the present methods include a bodily fluid sample, optionally plasma, serum, blood, bone marrow, saliva, urine or CSF or a tissue or tumor sample.
- the sample is submerged in a RNA preservation solution, for example to allow for storage.
- the RNA preservation solution comprises Trizol®.
- the sample is in an embodiment, treated with a RNAse inhibitor to prevent RNA degradation.
- similarity of the gene expression profile from a sample to one or more control profiles may be used to identify individuals having myelodysplastic syndrome (MDS) and/or acute myeloid leukemia (AML) or an increased likelihood of MDS and/or AML.
- MDS myelodysplastic syndrome
- AML acute myeloid leukemia
- the method comprises determining the level of similarity of a sample profile to one or more control profiles, wherein (i) a high level of similarity of the sample profile to an MDS and/or AML specific control profile; (ii) a low level of similarity to a non-MDS and/or non-AML control profile; and/or (iii) a higher level of similarity to an MDS and/or AML specific control profile than to a non-MDS and/or non-AML control profile indicates the presence of, or an increased likelihood of, MDS and/or AML.
- Similarity of the gene expression profile from a sample to one or more control profiles may also be used to identify individuals with MDS who have progressed to AML or have an increased likelihood of progression to AML.
- the method comprises determining the level of similarity of a sample profile to one or more control profiles, (i) a high level of similarity of the sample profile to a high risk AML progression control profile; (ii) a low level of similarity to low risk AML progression control profile; and/or (iii) a higher level of similarity to a high risk AML progression control profile than to a low risk AML progression control profile indicates progression to AML or an increased likelihood of progression to AML.
- the "MDS specific control profile” is generated by measuring the gene expression levels of specified genes in genomic DNA from an individual subject, or population of subjects, who are known to have MDS.
- the "non-MDS control profile” is generated by measuring the gene expression levels of specified genes in genomic DNA from an individual subject, or population of subjects, who are known to not have MDS.
- the sample source from which the sample profile and control profile are derived is matched, so that they are both derived from the same or similar tissue.
- the sample profile and control profile are derived from different tissues.
- the MDS specific control profile and the non-MDS control profile are derived from historical data and can indicate similarity of a sample to either the MDS or non-MDS profiles.
- the "AML specific control profile” is generated by measuring the gene expression levels of specified genes in genomic DNA from an individual subject, or population of subjects, who are known to have AML.
- the "non-AML control profile” is generated by measuring the gene expression levels of specified genes in genomic DNA from an individual subject, or population of subjects, who are known to not have AML.
- the sample source from which the sample profile and control profile are derived is matched, so that they are both derived from the same or similar tissue.
- the sample profile and control profile are derived from different tissues.
- the AML specific control profile and the non-AML control profile are derived from historical data and can indicate similarity of a sample to either the AML or non-AML profiles.
- the "high risk AML progression control profile” is generated by measuring the gene expression levels of specified genes in genomic DNA from an individual subject, or population of subjects, who are known to have a high risk of progression from MDS to AML.
- the "low risk AML progression control profile” is generated by measuring the gene expression levels of specified genes in genomic DNA from an individual subject, or population of subjects, who are known to have a low risk of progression from MDS to AML.
- the sample source from which the sample profile and control profile are derived is matched, so that they are both derived from the same or similar tissue.
- the sample profile and control profile are derived from different tissues.
- the high risk AML progression control profile and the low risk AML progression control profile are derived from historical data and can indicate similarity of a sample to either the high risk AML progression control profile or the low risk AML progression control profiles.
- Methods of determining the similarity between gene expression profiles are well known in the art. Methods of determining similarity may in some embodiments provide a non-quantitative measure of similarity, for example, using visual clustering and hierarchical clustering. In another embodiment, similarity may be determined using methods which provide a quantitative measure of similarity.
- similarity may be measured using hierarchical clustering, optionally using Manhattan distance.
- the Manhattan distance function computes the distance that would be traveled to get from one data point to the other if a grid-like path is followed.
- the Manhattan distance between two items is the sum of the differences of their corresponding components.
- n is the number of variables
- Xi and Yi are the values of the variable, at points X and Y respectively.
- similarity may be measured by computing a "correlation coefficient", which is a measure of the interdependence of random variables that ranges in value from -1 to +1 , indicating perfect negative correlation at -1 , absence of correlation at zero, and perfect positive correlation at +1 .
- the correlation coefficient may be a linear correlation coefficient, for example, a Pearson product-moment correlation coefficient.
- x and y are the beta values for various genes in a sample profile and a control profile, respectively.
- a correlation coefficient calculated between the sample profile and the control profile indicates a high level of similarity to the control profile when the correlation coefficient has an absolute value between 0.5 to 1 , optionally between 0.75 to 1 , and a low level of similarity to the control profile when the correlation coefficient has an absolute value between 0 to 0.5, optionally between 0 to 0.25.
- the methods described herein may be used in combination with additional methods for classifying and/or prognosing MDS, AML and/or the progression from MDS to AML.
- the methods further comprise identifying the WHO subtype of MDS.
- WHO subtype of MDS refers to the WHO classification of myeloid neoplasms and acute leukemia (Arber DA, Orazi A, Hasserjian R, et al. The 2016 revision to the World Health Organization classification of myeloid neoplasms and acute leukemia. Blood. 2016; 127: 2391 -2405).
- patients may be classified according to the WHO classification as having either a "low-risk MDS" or a "high-risk MDS".
- the methods further comprise identifying the WHO subtype of the subject, where a high risk WHO subtype indicates progression to AML or an increased likelihood of progression to AML and a low risk WHO subtype indicates no progression to AML or a decreased likelihood of progression to AML.
- the methods further comprise identifying the WHO MDS subtype of the subject, wherein
- the methods further comprise identifying the WHO MDS subtype of the subject, wherein
- the methods further comprise identifying the WHO MDS subtype of the subject, wherein
- an aspect of the disclosure provides a method of determining a course of management for a subject with MDS, AML, an increased likelihood of MDS and/or AML and/or an increased likelihood of progression from MDS to AML, comprising:
- Methods of treating MDS, AML and progression from MDS to AML include, but are not limited to chemotherapy, radiation, stem cell transplantation and/or bone marrow transplantation.
- a subject identified as having progression to AML or an increased likelihood of progression to AML is treated with chemotherapy, radiation, stem cell transplantation and/or bone marrow transplantation.
- a subject identified as having progression to AML or an increased likelihood of progression to AML is treated with increased vigilance including regular physical exams, blood tests and/or imaging in order to identify early signs and symptoms of AML.
- a subject identified as having an intermediate risk of progression to AML or a moderate likelihood of progression to AML is treated with increased vigilance including regular physical exams, blood tests and/or imaging in order to identify early signs and symptoms of AML. Physical exams, blood tests and/or imaging to identify early signs and symptoms of AML may also be referred to as "watchful waiting".
- the subject identified as not having progression to AML or a decreased likelihood of progression to AML is not treated with chemotherapy, radiation, stem cell transplantation and/or bone marrow transplantation.
- the present disclosure also provides a method of selecting a treatment for a subject with progression to AML or an increased likelihood of progression to AML, comprising:
- the disclosure also provides a kit for detecting and/or screening for MDS and/or acute myeloid leukemia (AML) or an increased likelihood of MDS and/or AML, in a sample, comprising, consisting of, or consisting essentially of:
- kits for detecting and/or screening for detecting and/or screening for progression to AML or an increased likelihood of progression to AML, in a human subject having MDS, in a sample comprising, consisting of, or consisting essentially of:
- the detection agents comprise and/or are nucleic acid molecules.
- the detection agents are a set of probes or primers for determining the expression of at least 3, optionally at least 5, at least 10, at least 20, at least 30, at least 40, at least 50, at least 60, all of the human orthologues of the genes listed in Table 5.
- the detection agents comprise and/or are antibodies for determining the expression (e.g. polypeptide levels) of at least 3, optionally at least 5, at least 10, at least 20, at least 30, at least 40, at least 50, at least 60, or all of the human orthologues of the genes listed in Table 5.
- the kit comprises detection agents described herein, and optionally one or more specimen collectors, RNA preservation solutions and/or control samples.
- the specimen collector comprises a sterile vial or tube suitable for receiving a sample.
- the specimen collector comprises RNA preservation solution.
- the RNA preservation solution comprises one or more inhibitors of RNAse.
- the RNA preservation solution comprises Trizoi® or other reagents designed to improve stability of RNA.
- the kit further comprises control samples.
- the control sample is a positive control. In another embodiment, the control sample is a negative control.
- the antibody or probe is labeled.
- the label is optionally capable of producing, either directly or indirectly, a detectable signal.
- the label may be radio-opaque or a radioisotope, such as 3H, 14C, 32P, 35S, 1231, 1251, 131 1; a fluorescent (fluorophore) or chemiluminescent (chromophore) compound, such as fluorescein isothiocyanate, rhodamine or luciferin; an enzyme, such as alkaline phosphatase, beta-galactosidase or horseradish peroxidase; an imaging agent; or a metal ion.
- a radioisotope such as 3H, 14C, 32P, 35S, 1231, 1251, 131 1
- a fluorescent (fluorophore) or chemiluminescent (chromophore) compound such as fluorescein isothiocyanate, rhodamine or lucifer
- the kit comprises a computer-readable medium that causes a computer to compare gene expression from a sample at the selected genes to one or more control profiles and compute a correlation value between the sample and control profile.
- the kit is for use in a method described herein. Disease models
- the present disclosure shows that the deletion of GSK-3 in a transgenic mouse model leads to a MDS-like disease in vivo and the combined deletion of GSK-3a and GSK-3 in a transgenic mouse model leads to an AML-like disease in vivo. Accordingly, the present disclosure provides methods for creating a disease model of myelodysplastic syndrome by disrupting or deleting GSK-3/3 in a non-human transgenic model. The present disclosure provides methods for creating a disease model of acute myeloid leukemia by disrupting or deleting GSK-3cr and GSK-3 3 in a non- human transgenic model. These models are useful for screening for test agents to treat and/or prevent MDS, AML and/or the progression from MDS to AML.
- a transgenic non-human model of MDS and/or AML is provided.
- the transgenic non- human model is a transgenic mouse.
- transgenic non-human animal includes any member of the animal kingdom, except humans, in which one or more cells contain a genomic alteration introduced by way of human intervention such as by transgenic techniques known in the art.
- a genomic alteration a transgene or nucleic acid is introduced into the cell, directly or indirectly, by introduction into a precursor of the cell, by way of deliberate genetic manipulation, such as by microinjection or by infection with a recombinant virus.
- the term genetic manipulation does not include classical cross-breeding but rather is directed to the introduction of a recombinant DNA molecule. This molecule may be integrated within a chromosome, or it may be extrachromosomally replicating DNA.
- Non-limiting examples of animals that may be used in the present disclosure include mice, rats, squirrels, hamsters, guinea pigs, rabbits, pigs, sheep, baboons, monkeys, chimpanzees, birds and amphibians.
- the animal is a mouse.
- the genomic alteration comprises a disruption of the gene GSK-3/3 and/or the gene GSK- 3a.
- the disruption is a gene deletion or gene knock-out.
- GSK-3cr refers to the gene encoding glycogen synthase kinase 3 alpha and includes, without limitation, GSK-3cr from any source such as those with sequences as shown in Genbank Accessions NM_019884 (human) and NM_001031667.1 (mouse), incorporated herein by reference in their entirety.
- GSK-3cr is mouse GSK-3cr.
- GSK-3cr is human GSK-3cr.
- GSK-3/3 refers to the gene encoding glycogen synthase kinase 3 beta and includes, without limitation, GSK-3/3 from any source such as those with sequences as shown in Genbank Accessions NM_002093 (human), NM_001347232.1 (mouse) and NM_019827.6 (mouse), incorporated herein by reference in their entirety.
- GSK-3/3 is mouse GSK-3/3.
- GSK-3/3 is human GSK-3/3.
- gene disruption is used synonymously with “gene mutation” to refer to an alteration to the gene such the expression of the gene is decreased or suppressed compared to an animal where the gene is not disrupted or that the protein encoded by the gene is non-functional or of reduced function compared to the protein encoded by the wild-type gene.
- gene disruption is a gene deletion or gene knockout.
- gene deletion is used synonymously with “gene knockout” to specify that the entire nucleic acid sequence corresponding to the gene of interest is deleted from the genome in at least one allele.
- one allele of GSK-3cr is disrupted. This is also referred to as a heterozygous disruption. In another embodiment, both alleles of GSK-3cr are disrupted. This is referred to as a homozygous disruption. Similarly, in another embodiment, one allele of GSK-3/3 is disrupted. This is also referred to as a heterozygous disruption. In another embodiment, both alleles of GSK-3/3 are disrupted. This is referred to as a homozygous disruption.
- GSK-3cr and/or GSK-3/3 is conditionally disrupted.
- a conditional disruption such as a conditional deletion or knockout enables the disruption or deletion of a gene of interest in a specific tissue and/or at a specific time point (inducible), while in all other tissues or at all other time points the gene retains its wildtype function.
- the Cre-lox system may be utilized for conditional deletions or disruptions of a gene.
- the transgenic mouse comprises a conditional disruption of one or both alleles of GSK-3/3 and/or GSK-3cr, for example a conditional knockout of one or both alleles of GSK-3/3 and/or GSK-3cr.
- embryonic stem cells containing a nucleic acid construct or vector of interest can be used to prepare a transgenic mouse.
- the embryonic stem cells are inserted into an early embryo for example using microinjection.
- approximately 10-20 embryonic stem cells are collected into a micropipette and injected into 3-5 day old blastocysts, preferably 31 ⁇ 2 day old blastocysts, recovered from female mice. The injected blastocysts are re- implanted into a foster mother.
- the pups When the pups are born, typically 20-21 days later, they are screened for the presence of the nucleic acid construct of the disclosure.
- the tail tissue of the pups may be screened using Southern blots and/or PCR. The heterozygotes are identified and can then be crossed with each other to generate homozygous animals with the gene deletion or disruption of interest.
- the CRISPR/Cas9 system is used to generate a transgenic animal as described herein.
- the transgenic animals described herein are useful models in studying MDS, AML and progression from MDS to AML.
- the animals can assist in studying the roles of GSK-3cr and/or GSK-3/3 in these diseases.
- Figure 1 the combined deletion of GSK-3cr and GSK- 3/3 in a transgenic mouse leads to an AML-like disease in vivo.
- Figure 2 GSK-3/3 deficiency alone leads to myelodysplasia and impaired hematopoiesis.
- the transgenic animals of the disclosure are useful as animal models for testing potential agents that can modulate the effect of disruption of GSK-3/3 and/or GSK-3cr and treat conditions involving deletion and/or disruption of GSK-3/3 and/or GSK-3cr.
- the transgenic animals of the disclosure are also useful as animal models for testing potential agents that can treat or prevent MDS, AML and/or the progression of MDS to AML.
- a method of screening a test agent for treatment or prevention of myelodysplastic syndrome comprising a) administering a test agent to i) a transgenic mouse model of MDS whose genome comprises a disruption of GSK-3p, ii) a tissue from said transgenic mouse model, or iii) or a cell derived from said transgenic mouse model; and b) determining the effect of said test agent on the mouse model, tissue or cell, wherein a reduction of signs and/or symptoms of MDS in the mouse, tissue or cell identifies a test agent for the treatment or prevention of MDS.
- MDS myelodysplastic syndrome
- Signs and/or symptoms of MDS in a mouse, cell or tissue model include, but are not limited to, impaired hematopoiesis, lobated or hypersegmented neutrophils, an increased frequency of blasts, extramedullary hematopoiesis, accumulation of monocytes and/or granulocytes in the spleen, accretion of hypersegmented neturophils in the peripheral blood, micromegakaryocytes with hyperchomatic nucleic in the spleen.
- Other signs and/or symptoms of MDS include increased mortality.
- a test agent for the treatment of MDS is identified when at least one of the signs/and or symptoms of MDS in a mouse cell or tissue model of MDS is reduced or decreased by at least 5, 10, 25, 50, 100% compared to a mouse model of MDS to which the test agent has not been administered.
- a method of screening a test agent for treatment or prevention of acute myeloid leukemia comprising a) administering a test agent to i) a transgenic mouse model of AML whose genome comprises a disruption of GSK-3a and a disruption of GSK-3p, ii) a tissue from said transgenic mouse model or iii) a cell derived from said transgenic mouse model; and b) determining the effect of said agent on mouse model, tissue or cell, wherein a reduction of signs and/or symptoms of AML in the mouse, tissue or cell identifies a test agent for the treatment or prevention of AML.
- AML acute myeloid leukemia
- Signs and/or symptoms of AML in a mouse, cell or tissue model include, but are not limited to, increased mortality, skin lesions, bone marrow hypercellularity, splenomegaly, elevated leukocyte counts in peripheral blood and/or lymph nodes, increased presence of immature myeloid cells and leukemic blasts in the bone marrow, spleen, peripheral blood and/or lymph nodes.
- Other signs and/or symptoms of AML include increased mortality and/or cell death and an accumulation of blasts.
- a test agent for the treatment of AML is identified when at least one of the signs/and or symptoms of AML in a mouse, cell or tissue model of AML is reduced or decreased by at least 5, 10, 25, 50, 100% compared to a mouse model of AML to which the test agent has not been administered.
- the disruption is optionally induced prior to administering the test agent.
- the effects of the test agent on the signs and/or symptoms of MDS and/or AML can be compared to a control animal such as a transgenic animal not receiving the test agent following induction of the disruption.
- the above screening methods of the disclosure can advantageously also use tissue, organs and/or cells isolated from the transgenic animal models described above.
- test agents contemplated herein include, but are not limited to chemical or biological molecules such as simple or complex organic molecules, biomolecules, metal-containing compounds, carbohydrates, peptides, proteins, peptidomimetics, glycoproteins, lipoproteins, sugars, polysaccharides, nucleic acids, antibodies, cells or combinations thereof.
- a test agent may be a naturally-occurring product or a synthetic product.
- test agents in the screening assays can be generated by methods well known to those skilled in the art, for example, well known methods for producing pluralities of compounds including without limitation: biological libraries; spatially addressable parallel solid phase or solution phase libraries; synthetic library methods requiring deconvolution; the "one-bead one-compound” library method; and synthetic library methods using affinity chromatography selection (see, e.g. Lam, 1997).
- Libraries containing large numbers of natural and synthetic compounds, including antibodies, also can be obtained from commercial sources.
- Combinatorial libraries of molecules can be prepared using well known combinatorial chemistry methods (Gordon et al., J. Med. Chem. 37: 1233-1251 (1994); Gordon et al., J. Med. Chem. 37: 1385-1401 (1994); Gordon et al., Acc. Chem. Res. 29: 144-154 (1996); Wilson and Czarnik, eds.
- mouse cells comprising a GSK-3 knockout provides a MDS-like disease model and mouse cells comprising a GSK-3a and GSK-3 double knockout provides an AML-like disease model.
- Mouse cells are commonly used as model mammalian cells. Accordingly, it is expected that human cells comprising a GSK-3 knockout would provide a MDS-like disease model. Similarly, it is expected that human cells comprising a GSK-3a and GSK-3 double knockout would provide an AML-like disease model.
- a method of screening a test agent for treatment or prevention of myelodysplastic syndrome comprising a) administering a test agent to a cell comprising a disruption of GSK-3 and b) detecting the effect of said agent on the cell.
- the cell is a human cell.
- a method of screening a test agent for treatment or prevention of acute myeloid leukemia comprising a) administering a test agent to a cell comprising a disruption of GSK-3a and a disruption of GSK-3 and b) detecting the effect of said agent on the cell.
- the cell is a human cell.
- cell refers to a single cell as well as a plurality of cells and also includes a cell line.
- the methods described herein comprise screening a test agent for treatment or prevention of MDS or AML by detecting an effect of the test agent on the cell.
- the effect is indicative of the activity of the test agent to treat or prevent of MDS or AML.
- "detecting an effect” comprises monitoring or determining cell size or morphology, expression of cell markers, the emergence of cell types or the biochemical make-up of the cell.
- "detecting an effect” includes, but is not limited to, using methods such as immunohistochemistry (I F1 C), ELISA, reporter genes, PCR or RT-PCR, fluorescent labels, cytometric bead arrays, DNA arrays, flow cytometry or optical analysis to detect the effect of a test agent on cells comprising a disruption of GSK-3 and/or GSK-3a or normal (wild-type) cells.
- the effect of said agent on the cell is compared to the effect of said agent on a cell which does not comprise a disruption of GSK-3 and/or GSK-3a.
- a test agent which has a differential effect on a cell which comprises a disruption of GSK-3 and/or GSK-3a compared to a cell that does not comprise a disruption of GSK-3 and/or GSK-3a is identified as an agent for treating or preventing MDS and/or AML.
- the methods described herein further comprise testing the agents identified using the screening methods described herein for toxicity.
- the method of screening a test agent is a high throughput screening assay.
- high throughput screening refers to automated in vitro testing of the effect of test agents on cells and such screening is typically performed with the aid of computer or robot-controlled processes.
- a composition comprising microtitre plates with a plurality of receptacles wherein one or more of the receptacles contain cells comprising a disruption of GSK-3p and/or GSK-3a as described herein.
- the microtiter plates are high- throughput format microtitre plates.
- the plates are high- density plates suitable for cell-based assays or culture.
- the plates have 2 or more, 96, 384, or 1536 individual receptacles or wells and are suitable for use in high-throughput screening such as in automated systems and/or robotic systems.
- the term "receptacle” refers to a container suitable for the maintenance and culture of cells.
- the receptacle may be a well on a plate such as a microtitre plate, which optionally contains a plurality of wells or receptacles.
- the receptacle is designed so as to prevent contamination from adjacent receptacles.
- the receptacle will also contain media to provide nutrients to the one or more cells and allow for cell growth.
- conditional knockout mice for Gsk3a and Gsk3 has been described previously (MacAulay et al., 2007; Patel et al., 2008), and mice were kindly provided by Dr. Brad Doble (Stem Cell and Cancer Research Institute, Hamilton, Ontario, Canada). Tamoxifen-inducible Rosa26-CreERTM mice carrying the Cre recombinase and B6.SJL-Ptprca Pep3b/BoyJ (BI6/SJL) mice were purchased from the Jackson Laboratory. To obtain conditional GSK-3 -knockout mice were crossed with
- Rosa26-CreERTM mice were crossed with Gsk3a mice (obtained from germiine deletion of GSK-3a in conditional knockout animals, as previously described (MacAulay et al. , 2007) to obtain GSK-3- double mutant mice). Both, conditional GSK-3 -KO and GSK-3a/GSK-3 - knockout mice were used for experiments. Genotyping was performed on genomic DNA isolated from ear notches with the Extract-NAmp Tissue PCR Kit (Sigma Aldhch). PCR analysis was performed with primers for GSK-3a, GSK-3 and Cre (Table 1 ).
- CD45.1 + mice were admixed with 1x10 6 BM cells from CD45.1 + mice and injected into lethally irradiated BI6/SJL mice (CD45.1 + ) mice. GSK-3p-deletion was induced by tamoxifen. Similar transplantation settings were also applied in NOD/SCID mice with tamoxifen induction 2 weeks post-transplant.
- CD45.1 + cells were removed from total BM of primary recipients using the Mouse Hematopoietic Progenitor Cell Enrichment Kit containing antibodies directed against CD45.1 , CD1 1 b, B220, GR-1 and Ter1 19 (Stem Cell Technologies). Mice were bred, transplanted and maintained in the SCC- Rl animal barrier facility and all procedures received the approval of the animal ethics board of McMaster University.
- PB spleen or BM single cell suspensions were washed in PBS, incubated for 15 min. at 4°C with a blocking solution and then stained for 20 min. at 4°C with antibodies.
- a blocking solution e.g., a blocking solution
- cells were stained with conjugated anti-mouse antibodies against CD45, CD45.1 , and CD45.2 (BD Biosciences) and analyzed using a LSR II or FACS Calibur flow cytometer (BD Biosciences).
- Engrafted cells were further analyzed on a LSR II after staining with conjugated anti-mouse antibodies against CD45, CD45.1 , CD45.2, Granulocytes (CD1 1 b, Gr-1 ), Monocytes/Macrophages (CD14, F4/80), Erythrocytes (CD71 , Ter1 19), Megakaryocytes (CD61 ,CD41 ), B lymphocytes (B220, CD19, IgM), T lymphocytes (CD3, CD4, CD8) and HSCs/progenitors (Lineage, c-Kit, Sca-1 , CD150, CD48, CD34, FCgll/l ll, IL-7Ra) (BD Biosciences).
- ⁇ -catenin activity bone marrow cells were first stained with Iineage-antibodies and then stained with either hematopoietic stem cell or progenitor cocktails of antibodies followed by fixation with 0.8% paraformaldehyde for 10 min. Cells were then washed, permeabilized and stained with DAPI and an antibody recognizing the active (de-phosphorylated) form of ⁇ -catenin (ABC, clone 8E7, Millipore) or isotype controls directly labeled (Xenon kit, Invitrogen) with Alexa Fluor-488, as described previously (Abrahamsson et al. , 2009). Subsequent analyses were done with the FlowJo software (TreeStar).
- Lin- bone marrow cells were stained with APC-conjugated c-Kit, PE-conjugated Sca-1 , PB-conjugated CD45.2 and 7AAD (all BD Biosciences). Cells were sorted on a FACS Aria I I (BD Biosciences).
- Cytospins from bone marrow, spleen or liver samples were prepared by diluting 1x10 5 cells in 100 ⁇ PBS and spinning them on glass microscope slides using the Shandon Cytospin 3 (Block Scientific, Inc.). Blood smears from peripheral blood were prepared by pipetting 50 ⁇ of fresh blood mixed with EDTA on a glass microscope slide and spreading it by pulling the edge of another microscope slide over the surface of the first slide starting from the blood drop. Differential staining using Wright's Giemsa stain was performed with the Shandon Kwik-Diff Stain Kit (Thermo Scientific).
- Tissues were fixed in 10% buffered Formalin (Fisher Scientific) and bones were decalcified using Immunocal (Decal Chemical). Sections were stained with hematoxylin and eosin (H&E) stain for morphologic and cytologic assessment. For immunohistochemistry, MPO (A0398; Dako) and Mac2 (CL8942AP; Cedarlane) antibodies were used to identify myeloid cells. Images were acquired using either a Scanscope Slide Scanner with the Image Scope software (Aperio) or an Olympus IX 81 Inverted Microscope.
- PI3K/Akt/mTOR signaling either vehicle, dissolved 100nM Rapamycin (Calbiochem, Millipore), dissolved 10 ⁇ Wortmannin (Selleck Chemicals LLC) or dissolved 175nM LY2584702 (Selleck Chemicals LLC) was added to the methylcellulose mixture prior to plating as described previously (Janes et al., 2010).
- Quantitative real time PCR was performed with the MX3000P QPCR System (Stratagene, CA). Each reaction was performed in triplicate and the mean Ct value was used to calculate the relative fold changes using the ⁇ Ct method.
- the primers used are listed in Table 1 .
- Total protein fraction from mouse Lin- bone marrow cells was extracted in 1 % SDS Laemmli Sample buffer (Bio-Rad), separated by SDS- PAGE, and transferred onto nitrocellulose membranes as previously described (Benoit et al., 2010). Nuclear proteins were extracted using the NEPER® Nuclear and Cytoplasmic Extraction kit (Pierce Thermo Scientific) according to the manufacturer's recommendations. Purity of the isolated nuclear fractions was validated by monitoring levels of pan histone H3 (nuclear) vs. GAPDH (cytoplasmic) by western blot. Membranes were blocked in PBS containing 5% skim milk and 0.1 % TWEEN 20 (Bio-Rad).
- OCR oxygen consumption rates
- ECAR extra-cellular acidification rates
- a list of over 1000 genes significantly dysregulated between GSK-3 WT and BKO (p ⁇ 0.05, fold-change 2 or ⁇ 1 .5) was used as a transcriptome differential gene list as well as a differential list of 63 genes with p ⁇ 0.05, fold-change 2 or ⁇ 5 was used as a GSK-3 gene signature list.
- Gene Ontology analysis was performed using DAVID bioinformatics resource 6.7 Functional Annotation Tool Suite. The top three GOTERM_BP_FAT annotations for a given set of gene inputs were listed as annotation terms (Huang da et al. , 2009).
- GSK-3 transcriptome and 63- gene GSK-3 molecular signature were applied to GEO data set of adult (Sridhar et al., 2009) (GSE18366) and pediatric MDS (Bresolin et al., 2012) (GSE29326) using clustering analysis to discriminate disease subtypes.
- Detection of molecular signatures was performed using Gene Set Enrichment Analysis software (http://www.broadinstitute.org/gsea) using the MSigDB database of the Broad institute. Clinical prognostic analysis was performed as described previously (Eppert et al., 201 1 ). Briefly, array expression data from pediatric MDS samples (GSE29326) was filtered based on either a 63 gene signature or full differential GSK-3 gene list, multiple probe sets were averaged per gene. The log2 expression values were centered to zero median. The transformed values for genes that had been identified as being down-regulated in GSK-3 KO had their sign switched.
- the sum of the median-centered log2 expression values was used as the risk score for each patient, and 32 patients were split into high- or low-risk groups depending if the score was higher or lower than the mean risk score. These groups were assessed for MDS prognosis and AML transformation risk using progression-free survival test or progression-time to AML test respectively (univariate Kaplan-Meier analysis with log-rank test statistics).
- knockout mice die perinatally, whereas knockout mice are viable with no noticeable phenotype in hematopoiesis (Doble et al., 2007).
- deletion of both GSK-3a and ⁇ was required in order to manifest a block in stem cell differentiation and pluripotency retention in mouse embryonic stem cells (Kelly et al., 201 1 ), suggestive of a redundant role of GSK-3 a and ⁇ in mouse embryonic stem cells.
- HSPC compartment (Fig.1 d), lineage-depleted bone marrow (Lin ' BM, CD45.2) was transplanted into lethally irradiated congenic recipient mice (CD45.1 ) to evaluate the effects of combinatorial GSK-3 allele deletion on in vivo hematopoietic regenerative capacity (Fig.2a).
- peripheral blood from mice was analyzed to determine robust donor (CD45.2) chimerism (Fig. 1 e), and were subsequently administered tamoxifen to induce allele deletion (Gan et al., 2008; Lobry et al., 2013), then followed for 6 weeks, at which time a significant number of mice were analyzed The remaining mice were followed for longer-term survival
- GSK-3S deficiency impairs hematopoiesis by inducing myelodysplasia.
- mice have no phenotype, the effect of GSK-3 deletion in exclusion on hematopoiesis was tested. HSC enriched Lin ' BM from both donor mutant mice (Fig. 1 a) were assessed for their
- Fig. 3a The majority of Gsk3fi flx/flx recipients developed symptoms of cachexia, abnormal gait and labored breathing, and had to be sacrificed by 8-10 weeks post-tamoxifen treatment compared to recipients or untreated mice (Fig. 3b). Loss of mice mainly occurred due to cachexia or BM failure, leading to severe anemia (Fig.4a). BM analysis showed significant difference in cellularity in recipients (Fig. 3c) with notable increases in granulocytes along with reduced erythrocyte, monocyte and lymphocyte frequencies but no change in platelet levels (Fig. 4b). In contrast, no abnormalities were observed in any controls (e.g. untreated mice or treated mice transplanted with or wild-type Lin ' BM cells) (Fig. 3b-c). Among granulocytic
- Fig. 4g Histologically, marked expansion of the red pulp with diffuse infiltration by myeloid and granulocytic cells was observed, resulting in the destruction of splenic architecture (Fig. 3f).
- Dysplastic megakaryocytes in the spleen such as the presence of micro-megakaryocytes with hypolobulated and hyperchromatic nuclei consistent with myelodysplasia was also observed (Fig. 3f). This expansion of the granulocytic compartment was accompanied by suppressed monocytic generation in recipient
- mice featuring myeloid proliferation without monocytosis in contrast to AML phenotype (Fig. 5a-b). Based on the Bethesda criteria (Kogan et)
- BM cells from primary recipients were serially transplanted into secondary mice (Fig. 3g). Secondary recipients developed an identical hematopoietic disorder as primary recipients, and the level of stable disease was dependent on the number of injected cells (Fig. 3h and Fig. 5c). Similar dysplastic features and lethality were also consistent with primary transplanted mice (Fig. 3i and Fig. 5d-e).
- deletion of GSK-3 allows for the generation of self-renewing cells that can be functionally defined as MDS-lnitiating Cells (MDS-ICs) capable of sustaining MDS in vivo. Accordingly, the present disclosure also provides self-renewing cells comprises a deletion of GSK-3 . These cells are also useful in the methods described herein for screening for test agents for treating or preventing MDS.
- MDS-ICs MDS-lnitiating Cells
- HSCs are vulnerable to GSK-33 disruption for disease onset
- Gsk3fi deficiency Observed differentiation bias linked to Gsk3fi deficiency was coupled with a significant increase in the absolute numbers of granulocytic/monocytic progenitors (GMP) together with a decrease of the megakaryocyte-erythrocyte progenitor population (MEP) with no effects on common myeloid and lymphoid progenitors (CMP and CLP) (Fig. 6b).
- MMP and CLP common myeloid and lymphoid progenitors
- HSCs HSCs
- progenitors non- LSK
- GSK-33 deletion drives Wnt/Akt/mTOR signaling and induces AML when combined with metabolic changes acerbated by the absence of GSK-3a.
- the LSK fractions were analyzed using whole genome expression profiling (Bowman et al., 2007) where each demonstrated a distinct transcriptome phenotype (Fig. 8a).
- Extended gene set enrichment analysis (GSEA) performed on LSKs revealed unique gene signatures for each GSK-3a/ allelic deletion combination (Fig. 8b).
- GSEA Extended gene set enrichment analysis
- Enrichment in cell proliferation, DNA replication and mitochondria programs were observed in GSK-3a KO LSK cells (Fig. 9a) but had no measurable effect on the biology of HSC in transplanted hosts (Fig. 2).
- enrichment in sternness and uncommitted progenitors gene expression signatures in GSK-3 KO LSK cells was observed (Fig.
- the canonical Wnt pathway was the most prevalent activated in GSK-3 KO and accordingly continued to be active in combined GSK-3 + a DKO cells (Fig. 8c) (Lane et al., 2010; Zhao et al., 2007).
- GSK-3 KO and GSK-3 + a DKO cells show differential responses to mitochondrial stress with respect to WT, with the greatest effect when GSK-3a is deleted in GSK-3 deficient HSCs (Fig. 8p).
- Spare respiratory capacity a measure of the mitochondria's ability to provide additional ATP-derived energy in response to stress, is significantly lost in both MDS and AML phenotypes represented by Gsk3$ KO and Gs/ 3 + a DKO cells (Fig.8q).
- MDS/MPN myeloproliferative neoplasm
- GSK-3 signature based on an FC > 5 (with p-value ⁇ 0.05) that would allow a reasonable number of genes, totaling 63 (Fig.10b and Table 5) to be credibly applied to transcriptome comparisons and survival outcomes in patients.
- GSK-3p signature allowed for molecular discrimination among MDS, CMML and AML patient transcriptomes (Fig. 10c). Based on these findings, the clinical relevance of the GSK-3 signature was tested using two clinically annotated profiles from adult (Sridhar et al., 2009) and pediatric MDS (p-MDS) (Bresolin et al. , 2012) cohort studies with retrieved patient information and clinical annotations, together with published matching gene expression profiles.
- PFS progression free survival
- IMS International Prognostic Scoring System
- High-risk patients are the ones who had high cutoff GSK-3 signature and were defined as high-risk based on WHO classification. If a patient had either a significant GSK-3 signature or met the high-risk definition of WHO classification, he or she was labeled an intermediate-risk.
- This combined model was able to further risk-stratify our p- MDS cohort and provided valuable prognostic information by suggesting a third risk group, which is the intermediate-risk.
- These definitions for each risk group and especially the low-risk allowed an estimation of a lower probability for the low-risk group to evolve to AML using the GSK-3 -WHO combined model (1/12) in comparison to only using the WHO classification (3/16) by around 10% (Fig. 10f and h). It is proposed that this increased precision of risk groups provides valuable information for more refined treatment planning in human MDS.
- An expanded use of this combined WHO and GSK-3 signature for larger cohorts in both pediatric and adult MDS patients is warranted towards improved patient management and risk stratification.
- the findings described herein suggest the pathways tightly regulated by GSK-3 are critical for evolution of MDS from healthy HSCs that allow a state for additional insults, such as loss of GSK-3a, to lead to AML.
- GSK3 deficiency the study implicates an inter-relationship with the mTOR/AKT/PI3K pathways during MDS/AML progression not reported to date. Effects of GSK-3 deficiency to induce MDS was unique to HSCs and not progenitors and allowed emergence of MDS-IC capacity.
- GSK-3 is molecularly different from Gsk3a in hematopoiesis, correlating with distinct HSC transcriptomes.
- increase of GSK-3a protein levels in GSK-3 -deficient BM cells did not compensate or "rescue" the effects responsible of the observed MDS state.
- This is in contrast to previous reports showing functional redundancy between GSK-3a and ⁇ alleles in embryonic and hematopoietic development (Doble et al., 2007; Huang et al., 2009; Itoh et al., 2012).
- GSK3 deletion in the fetal LSK fraction might not affect fetal HSCs due to the lack of involvement of Akt/mTOR/Wnt signaling axis. More importantly, it is uniquely revealed herein that the GSK3 -null myelodysplastic state acquires sternness properties and dysregulated myeloid differentiation programs that are exacerbated upon additional Gsk3a deletion inducing a metabolic alteration specific to AML onset driven by GSK3 -null HSCs.
- mice homogenized and Lineage depleted. Then, freshly isolated 1 .5 x 10 6 cells were incubated in 6-well-plate culture dishes with Stem Span medium containing rm SCF (100ng/mL), rm IL-3 (10ng/mL) and rh IL-6 (10ng/mL) (StemCell Technologies) for 6 days. Fresh medium was added every 2 days. At day 7, cells were treated with 4-OH-Tamoxifen (SigmaAldrich) at 5 ⁇ for 24 hours. Media were replaced with fresh one and incubated cells for molecular analysis for another 5-7 days post-treatment (A).
- Notch signaling simplicity in design, versatility in function. Development 138, 3593-3612.
- Cazzola, M. (201 1 ). Risk assessment in myelodysplastic syndromes and myelodysplastic/myeloproliferative neoplasms. Haematologica 96, 349-352.
- Genome-wide profiling reveals epigenetic inactivation of the PU.1 pathway by histone H3 lysine 27 trimethylation in cytogenetically normal myelodysplastic syndrome. Leukemia 27, 1291 -1300.
- WNT-LRP5 signaling induces Warburg effect through mTORC2 activation during osteoblast differentiation. Cell Metab 17, 745-755.
- Hasle, H. Niemeyer, C. M., Chessells, J. M., Baumann, I., Bennett, J. M. , Kerndrup, G., and Head, D. R. (2003).
- mTOR complex 1 plays critical roles in hematopoiesis and Pten-loss-evoked leukemogenesis.
- beta-catenin enhances Oct-4 activity and reinforces pluripotency through a TCF-independent mechanism.
- Microarray-based classifiers and prognosis models identify subgroups with distinct clinical outcomes and high risk of AML transformation of myelodysplastic syndrome. Blood 1 14, 1063-1072.
- MDS a stem cell disorder-but what exactly is wrong with the primitive hematopoietic cells in this disease? Hematology Am Soc Hematol Educ Program, 43-51 .
- Kalicki-Veizer, J., O'Laughlin, M., et al. (201 1 ). Recurrent DNMT3A mutations in patients with myelodysplastic syndromes. Leukemia 25, 1 153-1 158. Wang, Y., Krivtsov, A. V., Sinha, A. U., North, T. E., Goessling, W., Feng, Z., Zon, L. I., and Armstrong, S. A. (2010). The Wnt/beta-catenin pathway is required for the development of leukemia stem cells in AML. Science 327, 1650-1653.
- C/EBPa controls acquisition and maintenance of adult haematopoietic stem cell quiescence. Nat Cell Biol 15, 385-394.
Landscapes
- Health & Medical Sciences (AREA)
- Life Sciences & Earth Sciences (AREA)
- Physics & Mathematics (AREA)
- Engineering & Computer Science (AREA)
- Genetics & Genomics (AREA)
- Chemical & Material Sciences (AREA)
- General Health & Medical Sciences (AREA)
- Molecular Biology (AREA)
- Bioinformatics & Cheminformatics (AREA)
- Biotechnology (AREA)
- Biophysics (AREA)
- Theoretical Computer Science (AREA)
- Medical Informatics (AREA)
- Spectroscopy & Molecular Physics (AREA)
- Evolutionary Biology (AREA)
- Bioinformatics & Computational Biology (AREA)
- Immunology (AREA)
- Organic Chemistry (AREA)
- Proteomics, Peptides & Aminoacids (AREA)
- Analytical Chemistry (AREA)
- Pathology (AREA)
- Zoology (AREA)
- Chemical Kinetics & Catalysis (AREA)
- Wood Science & Technology (AREA)
- Biochemistry (AREA)
- Hematology (AREA)
- General Physics & Mathematics (AREA)
- Hospice & Palliative Care (AREA)
- Oncology (AREA)
- Medicinal Chemistry (AREA)
- Microbiology (AREA)
- Food Science & Technology (AREA)
- Urology & Nephrology (AREA)
- Biomedical Technology (AREA)
- General Engineering & Computer Science (AREA)
- Measuring Or Testing Involving Enzymes Or Micro-Organisms (AREA)
Abstract
The present disclosure describes methods for creating a disease model of myelodysplastic syndrome and acute myeloid leukemia syndrome by creating gene knockouts of GSK-3β or double knockouts of GSK-3α and GSK-3β, respectively. Also described are uses of these models for classifying human myeloid pre-neoplastic and neoplastic subtypes in reference to a GSK-3β gene signature and determining risk stratification of a subject with myelodysplastic syndrome and prognosis based on their gene expression profile. The models and the GSK-3β signature are useful for guiding treatment decisions or for monitoring treatment response. The disease models and the cells derived from them as described herein are also useful for screening and evaluating the effectiveness of test agents for treatment of MDS or leukemia.
Description
TITLE: DISEASE MODELS AND PROGNOSTIC TOOLS FOR
P RE-LEUKEMIA AND LEUKEMIA
RELATED APPLICATIONS
[0001 ] This application claims the benefit of priority to United States Provisional application No. 62/276,496 filed January 8, 2016, the contents of which are incorporated herein by reference in their entirety.
FIELD
[0002] The disclosure relates to disease models of myelodysplastic syndromes (MDS) and acute myeloid leukemia (AML) and uses thereof. The disclosure also relates to methods and kits for detecting and/or screening for progression to AML, or an increased likelihood of progression to AML, in a subject with MDS.
BACKGROUND
[0003] Advances in divergent fields of hematology research have led to the collective appreciation that many, if not all, chronic and acute leukemias arise from proceeding, latent and/or preleukemic phases characterized by impaired hematopoiesis and defective differentiation (Meacham and Morrison, 2013; Shlush and Minden, 2015). Myelodysplastic syndromes (MDS) are considered to be preleukemic clonal diseases and are believed to originate from hematopoietic stem/progenitors cells (HSPCs) (Pandolfi et al., 2013; Woll et al., 2014), thereby affecting the development of one or more myeloid lineages causing cytopenias and dysplastic bone marrow (BM) (Garcia- Manero, 2010; Vardiman et al., 2009). These features are associated with morbid and fatal complications leading to overt acute myeloid leukemia (AML) in 30% of cases (Ades et al. , 2014) with an increased risk of treatment resistance (Garcia-Manero, 2014; Jonas and Greenberg, 2015). Thus, the term MDS/AML is often used to describe a biological continuum in leukemia pathogenesis (Cazzola et al., 2013; Kreso and Dick, 2014). However, the
molecular basis of MDS to AML transition remains poorly understood (Bejar and Steensma, 2014; Larsson et al., 2013; Zhang et al., 2015), underscoring the need to better understand the specific pathways responsible for disease initiation and progression.
[0004] Although developmental pathways (e.g. Wnt/p-catenin, Hedgehog, and Notch) were previously associated with self-renewal, deletion mutations or overexpression in these same signal mediators alone are insufficient to induce leukemic development (Takebe et al. , 201 1 ; Wang et al., 2010). Glycogen synthase kinase-3 (GSK-3) is an essential regulator of hematopoiesis (Huang et al., 2009; Trowbridge et al., 2006) and represents a signaling hub for Hedgehog (Briscoe and Therond, 2013), Wnt (Wu and Pan, 2010), and Notch (Andersson et al., 201 1 ) that has recently been reported to play a pivotal role in various leukemias (Abrahamsson et al., 2009; Banerji et al., 2012; Wang et al., 2008). Accordingly, GSK-3 mediated networks may represent a more universal initiator of numerous pathways in cancers (Takahashi-Yanaga, 2013). Previous studies have shown functional redundancy between the two homologues of GSK-3 (a and β) (Doble et al., 2007; Gillespie et al., 201 1 ; Itoh et al., 2012), which are encoded by separate genes on different chromosomes (Wada, 2009), but exhibit tissue-specific physiologically-important functions that may have varying impacts on human cancer etiology (Banerji et al., 2012; Takahashi-Yanaga, 2013). This suggests that the overriding tissue specific functions of GSK-3 and the interplay of a and β homologues are likely cell context specific.
SUMMARY
[0005] The roles of GSK-3 homologues have not been studied with respect to their individual impact on disease progression in MDS or AML. Here it is demonstrated that specific allelic targeting of GSK-3a and GSK-3p in hematopoietic tissue induces stepwise progression to AML state via a preneoplastic myeloid disorder that resembles human MDS. In particular, the present disclosure shows that the deletion of GSK-3p in a transgenic mouse
model leads to a MDS-like disease in vivo and the combined deletion of GSK- 3a and GSK-3 in a transgenic mouse model leads to an AML-like disease in vivo. These models are useful for screening for test agents to treat or prevent MDS, AML and/or progression from MDS to AML.
[0006] The present disclosure also defines a specific "GSK-3 molecular signature" using a systematic approach based on the transcriptome comparison between WT versus GSK-3 KO LSK cells of those genes with greater than 1 .5-fold change in whole gene expression (with p < 0.05). This subset of genes was further filtered to yield a 63-gene GSK-3 signature based on a fold change > 5 (with p < 0.05). This signature was able to predict clinical outcomes of MDS patients.
[0007] Accordingly, in an aspect, there is provided a method of detecting and/or screening for progression to AML or an increased likelihood of progression to AML, in a human subject having MDS, comprising:
determining a sample gene expression profile from a sample comprising DNA from said subject, said sample profile comprising:
(a) the gene expression level of at least 3, optionally at least 5, at least 10, at least 20, at least 30, at least 40, at least 50, at least 60, or all of the human orthologues of the genes listed in Table 5; and
(b) determining the level of similarity of said sample profile to one or more control profiles.
[0008] In one embodiment, (i) a high level of similarity of the sample profile to a high risk AML progression control profile; (ii) a low level of similarity to low risk AML progression control profile; and/or (iii) a higher level of similarity to a high risk AML progression control profile than to a low risk AML progression control profile indicates progression to AML or an increased likelihood of progression to AML.
[0009] In another embodiment, a higher level of similarity to a high risk AML progression control profile than to a low risk AML progression control profile is indicated by hierarchical clustering.
[0010] In another embodiment, a higher level of similarity to a high risk AML progression control profile than to a low risk AML progression control profile is indicated by a higher correlation value computed between the sample profile and the high risk AML progression control profile than an equivalent correlation value computed between the sample profile and the low risk AML progression control profile, optionally wherein the correlation value is a correlation coefficient.
[001 1 ] In another embodiment, (i) a low level of similarity of the sample profile to a high risk AML progression control profile; (ii) a high level of similarity to low risk AML progression control profile; and/or (iii) a lower level of similarity to a high risk AML progression control profile than to a low risk AML progression control profile indicates no progression to AML or an decreased likelihood of progression to AML.
[0012] In another embodiment, a lower level of similarity to a high risk AML progression control profile than to a low risk AML progression control profile is indicated by hierarchical clustering.
[0013] In another embodiment, a lower level of similarity to a high risk AML progression control profile than to a low risk AML progression control profile is indicated by a lower correlation value computed between the sample profile and the high risk AML progression control profile than an equivalent correlation value computed between the sample profile and the low risk AML progression control profile, optionally wherein the correlation value is a correlation coefficient.
[0014] In another embodiment, the method further comprises identifying the WHO MDS subtype of the subject, wherein
(a) (i) a high level of similarity of the sample profile to a high risk AML progression control profile; (ii) a low level of similarity to low risk AML progression control profile and/or (iii) a higher level of similarity to a high risk AML progression control profile than to a low risk AML progression control profile; and
(b) a high risk WHO MDS subtype,
indicates a high risk of progression to AML, progression to AML, or an increased likelihood of progression to AML.
[0015] In another embodiment, the method further comprises identifying the WHO MDS subtype of the subject, wherein
(a) (i) a low level of similarity of the sample profile to a high risk AML progression control profile; (ii) a high level of similarity to low risk AML progression control profile; and/or (iii) a lower level of similarity to a high risk AML progression control profile than to a low risk AML progression control profile indicates no progression to AML or an decreased likelihood of progression to AML; and
(b) a low risk WHO MDS subtype,
indicates a low risk of progression to AML, no progression to AML, or a decreased likelihood of progression to AML.
[0016] In another embodiment, the method further comprises identifying the WHO MDS subtype of the subject, wherein
(a) (i) a high level of similarity of the sample profile to a high risk AML progression control profile; (ii) a low level of similarity to low risk AML progression control profile and/or (iii) a higher level of similarity to a high risk AML progression control profile than to a low risk AML progression control profile; and
(b) a low risk WHO MDS subtype,
or
(a) (i) a low level of similarity of the sample profile to a high risk AML progression control profile; (ii) a high level of similarity to low risk AML
progression control profile; and/or (iii) a lower level of similarity to a high risk AML progression control profile than to a low risk AML progression control profile indicates no progression to AML or an decreased likelihood of progression to AML; and
(b) a high risk WHO MDS subtype,
indicates an intermediate risk of progression to AML.
[0017] In another embodiment, the subject identified as having progression to AML, an increased likelihood of progression to AML or a high risk of progression to AML is treated with chemotherapy, radiation, stem cell transplantation and/or bone marrow transplantation.
[0018] The disclosure also provides a method of selecting a treatment for a subject with progression to AML or an increased likelihood of progression to AML, comprising:
(a) identifying the subject with progression to AML, an increased likelihood of progression to AML or a high risk of progression to AML, according to the methods described herein; and
b) selecting a treatment for the subject, wherein the treatment comprises chemotherapy, radiation, stem cell transplantation and/or bone marrow transplantation.
[0019] The disclosure also provides a method of detecting and/or screening for myelodysplastic syndrome (MDS) or an increased likelihood of MDS, in a human subject, comprising: determining a sample gene expression profile from a sample comprising DNA from said subject, said sample profile comprising, consisting of, or consisting essentially of:
(a) the gene expression level of at least 3, optionally at least 5, at least 10, at least 20, at least 30, at least 40, at least 50, at least 60, or all of the human orthologues of the genes listed in Table 5; and
(b) determining the level of similarity of said sample profile to one or more control profiles, wherein (i) a high level of similarity of the sample profile to an MDS specific control profile; (ii) a low level of similarity to a non-MDS control profile; and/or (iii) a higher level of similarity to an MDS specific control profile than to a non-MDS control profile indicates the presence of, or an increased likelihood of, MDS.
[0020] In one embodiment, a higher level of similarity to an MDS specific control profile than to a non-MDS specific control profile is indicated by hierarchical clustering.
[0021 ] In another embodiment, a higher level of similarity to an MDS specific control profile than to a non-MDS specific control profile is indicated by a higher correlation value computed between the sample profile and the MDS specific control profile than an equivalent correlation value computed between the sample profile and non-MDS specific control profile, optionally wherein the correlation value is a correlation coefficient.
[0022] In another embodiment, the subject is a pediatric subject.
[0023] In another embodiment, determining the sample gene expression profile comprises the steps:
a) providing the sample comprising mRNA from the subject;
b) isolating mRNA from the sample;
c) amplifying the mRNA; and
d) determining the gene expression level of the at least 3 genes by means of RT-PCR.
[0024] In another embodiment, the sample is derived from a clinical specimen.
[0025] In another embodiment, the sample is derived from blood or bone marrow.
[0026] The disclosure also provides a kit for detecting and/or screening for progression to AML or an increased likelihood of progression to AML, in a human subject having MDS, in a sample, comprising:
a) at least one detection agent for determining the gene expression level of at least 3, optionally at least 5, at least 10, at least 20, at least 30, at least 40, at least 50, at least 60, or all of the human orthologues of the genes listed in Table 5; and
b) instructions for use.
[0027] The disclosure also provides a
kit for detecting and/or screening for MDS or an increased likelihood of MDS in a sample from a human subject, comprising:
c) at least one detection agent for determining the gene expression level of at least 3, optionally at least 5, at least 10, at least 20, at least 30, at least 40, at least 50, at least 60, or all of the human orthologues of the genes listed in Table 5; and
d) instructions for use.
[0028] In one embodiment, the detection agents are probes and/or primers.
[0029] In another embodiment, the kit further comprises PCR reagents.
[0030] In another embodiment, the kit further comprises a computer- readable medium that causes a computer to compare gene expression from a sample at the selected genes to one or more control profiles and compute a correlation value between the sample and control profile.
[0031 ] The disclosure also provides a method of screening a test agent for treatment or prevention of myelodysplastic syndrome (MDS), comprising a) administering a test agent to i) a transgenic mouse model of MDS whose genome comprises a disruption of GSK-3p, ii) a tissue from said transgenic mouse model, or iii) a cell derived from said transgenic mouse model; and b) determining the effect of said test agent on the mouse model, tissue or cell,
wherein a reduction of signs and/or symptoms of MDS in the mouse, tissue or cell identifies a test agent for the treatment or prevention of MDS.
[0032] In one embodiment, the disruption is a homozygous GSK-3 knockout.
[0033] In another embodiment, the GSK-3 knock out is a conditional knockout of GSK-3 .
[0034] The disclosure also provides a method of screening a test agent for treatment or prevention of acute myeloid leukemia (AML), comprising a) administering a test agent to i) a transgenic mouse model of AML whose genome comprises a disruption of GSK-3a and a disruption of
 a tissue from said transgenic mouse model, or iii) a cell derived from said transgenic mouse model; and b) determining the effect of said agent on the mouse model, tissue or cell, wherein a reduction of signs and/or symptoms of AML in the mouse, tissue or cell identifies a test agent for the treatment or prevention of AML.
[0035] In one embodiment, the disruption of GSK-3a is a homozygous GSK-3a knockout and/or the disruption of GSK-3 is a homozygous GSK-3 knockout.
[0036] In another embodiment, the GSK-3a knockout is a conditional knockout of GSK-3a and/or the GSK-3 knock out is a conditional knockout of GSK-3 .
[0037] The disclosure also provides a method screening a test agent for treatment or prevention of myelodysplastic syndrome (MDS), comprising a) administering a test agent to a cell comprising a disruption of GSK-3 and b) determining the effect of said agent on the cell.
[0038] In one embodiment, the disruption is a homozygous GSK-3 knockout.
[0039] In another embodiment, the GSK-3 knock out is a conditional knockout of GSK-3 .
[0040] The disclosure also provides a method of screening a test agent for treatment or prevention of acute myeloid leukemia (AML) comprising a) administering a test agent to a cell comprising a disruption of GSK-3a and a disruption of GSK-3 and b) determining the effect of said agent on the cell.
[0041 ] In one embodiment, the disruption of GSK-3a is a homozygous GSK-3a knockout and/or the disruption of GSK-3 is a homozygous GSK-3 knockout.
[0042] In another embodiment, the GSK-3a knockout is a conditional knockout of GSK-3a and/or the GSK-3 knock out is a conditional knockout of GSK-3 .
[0043] In another embodiment, the cell is a human cell.
[0044] The present disclosure also provides a method for creating a transgenic model for myelodysplastic syndrome by creating gene knockouts of GSK-3a.
[0045] Also provided is a method for creating a transgenic model for acute myeloid leukemia by creating gene knockouts of GSK-3a and GSK-3 .
[0046] Further provided is a method for classifying human myeloid pre- neoplasm subtypes comprising: determining in a subject the gene expression level for each of a set of genes selected from a GSK-3 gene signature listed in Table 5 to obtain a subject expression profile.
[0047] Further provided is a use of the GSK-3 signature alone or in combination with other methods for risk stratification of a subject with myelodysplastic syndrome.
[0048] Further provided is a use of the GSK-3 signature alone or in combination with other methods for determining a prognosis of a subject based on their expression profile.
[0049] Further provided is a use of the GSK-3 signature alone or in combination with other methods for guiding treatment based on gene expression profile.
[0050] Further provided is a use of the GSK-3 signature alone or in combination with other methods for monitoring treatment response.
[0051 ] Further provided is a use of models described above for screening test agents that are in development as treatments for MDS or leukemia.
[0052] Other features and advantages of the present disclosure will become apparent from the following detailed description. It should be understood, however, that the detailed description and the specific examples while indicating embodiments of the disclosure are given by way of illustration only, since various changes and modifications within the spirit and scope of the disclosure will become apparent to those skilled in the art from this detailed description.
BRIEF DESCRIPTION OF THE DRAWINGS
[0053] Embodiments are described below in relation to the drawings in which:
[0054] Figure 1 shows that the combined deletion of GSK-3a and β alleles leads to an AML-like disease in vivo, (a) Experimental design to generate conditional GSK-3a/ mutant mice

and transplant strategy, (b) Transplanted recipients with cells

(Lin" BM) display marked skin lesions with rapid mortality (n=15 mice for each condition) and show (c) BM hypercellularity and splenomegaly in mice transplanted with mice

exhibit elevated leukocytes counts in PB and lymph nodes (LN) (mean±S.D., n=6). (e-f) Presence of immature myeloid cells and leukemic blasts were found at high-levels in (g) BM, spleen, (h) PB and lymph node (LN) in Gsk3aA
 combined deletion on HSCs and myeloid progenitors increased LSK and GMP subsets (mean±S.D., n=10) and higher cell proliferation rate (mean±S.D., n=5). (j) High mortality and similar AML features are conserved in secondary transplants of primary engrafting
 comparison to both and for each condition),


[0055] Figure 2 shows the GSK-3 deficiency alone leads to myelodysplasia and impaired hematopoiesis. (a) BM transplant strategy, (b) Incremental mortality of transplanted and tamoxifen- treated recipient mice with
 lin" BM cells compared to the indicated control animals (n=15 mice for each condition), (c) Despite that the BM of
 mice displays normal to increased cellularity (n=10), (d) existence of myelodysplasia was evident by presence of lobated or hypersegmented neutrophils (arrowheads) (n=10) and (e) increased frequency of blasts (n=10). (f) Extramedullary hematopoiesis was also observed in 1 1/15
 mice examined for accumulation of monocytes and granulocytes in the spleen and accretion of hypersegmented neutrophils in PB and micro-megakaryocytes with hyperchromatic nuclei in the spleen (n=1 1 ). (g) BM serial transplantation strategy, (h) Sustained MDS disease occurrence in secondary recipients is dependent from transplanted cell dose; (n=10 mice for each condition), (i) High mortality and similar MDS features are conserved in secondary transplants of primary engrafting
 cells eg. myeloid blasts
 for
for

[0056] Figure 3 shows GSK-3 -MDS BM arises from HSCs and displays MDS-IC activity, (a) Experimental design for competitive reconstitution assays using sorted HSCs (LSK) and progenitors (non-LSK) from both
 mice
mice
 for each condition), (b) Despite mortality of non-LSK transplanted mice due to lack of hematopoietic regenerative capacity, only mice transplanted with Gsk3fiflx/flx LSK display high mortality and ineffective hematopoiesis (n=15 for each condition), as indicated by (c) dual features of hypercellular BM and splenomegaly (10/15 mice) (d)
with diffuse infiltration by myeloid and granulocytic cells and presence of dysplastic neutrophils (arrowheads) (n=10). (e-f) Both transplanted non-LSK
for each condition), (b) Despite mortality of non-LSK transplanted mice due to lack of hematopoietic regenerative capacity, only mice transplanted with Gsk3fiflx/flx LSK display high mortality and ineffective hematopoiesis (n=15 for each condition), as indicated by (c) dual features of hypercellular BM and splenomegaly (10/15 mice) (d)
with diffuse infiltration by myeloid and granulocytic cells and presence of dysplastic neutrophils (arrowheads) (n=10). (e-f) Both transplanted non-LSK
 mice exhibit normal blood counts and myeloid lineage
 HSCs display a higher hematopoietic stem cell function as determined by competitive reconstitution capacity (n=5), (h) along with the acquisition of higher proliferative cell rate 6 weeks post-transplant (n=5). (i) Progressive granulocytic accumulation in the BM of diseased
 mice (n=5). (j-k) Similar myelodysplasia features and worse survival are also conserved in secondary transplants of primary engrafting
 HSCs
HSCs

[0057] Figure 4 shows HSCs GSK-3 -null and α/β-null acquires dysregulated stem cell and myeloid differentiation gene programs driven by progressive activation of the Wnt/Akt/mTOR signaling axis, (a) Principle component analysis (PCA) on all entities from global gene expression profiling

(B KO) and Gene set enrichment analysis (GSEA)

showing the highest ranked gene signatures differentially expressed between GSK-3 genotypes, (c) Enrichment of Wnt canonical signaling signature (KEGG) in both GSK-3 B KO and DKO LSK cells correlates with (d) up- regulation of Wnt gene targets (e) significantly activated form and (f) progressive nuclear stabilization of β-catenin levels, (g) Enrichment in survival mTOR signaling (KEGG and BioCarta signatures) is also observed for both GSK-3 B KO and DKO LSK cells as well as (h) up-regulation of mTOR gene targets, (i) Except for DKO cells, mTOR complex inhibition reduces significantly total GSK-3 B KO derived-CFU-C at similar levels as WT control (mean±S.D., n=5). (j) Inhibition of PI3K/AKT/mTOR pathway at different levels shows marked and specific reduction of CFU-Cs derived from both GSK-3 B KO and DKO LSK cells (mean±S.D., n=5). (k) Oncogenic SANSOM_APC_MYC and WIERENGA_STAT5 targets gene signatures are also enriched in both GSK-3 KO and DKO LSK cells. (I) Progressive
activation of AKT/PI3K pathway (REACTOME signature) correlates with (m) the increase of phosphorylated AKT levels (active form) notably in DKO LSK cells, (n) Both gycolysis and oxidative phosphorylation gene signatures (KEGG) are gradually dysregulated in both Gsk3 β KO and αβ KO, (o) correlating with distinct resting metabolic activity and (p-q) differential responses to mitochondrial stress with respect to WT (mean±S. D. , n=5), **p<0.01 .
[0058] Figure 5 shows the GSK-3 -null BM expresses a unique gene expression profile and predicts pediatric MDS disease outcome, (a) Hierarchical cluster analysis of global gene profile shows similarity between mouse GSK-3 deleted BM cells and human MDS samples (MDS-LR: n=60, MDS-HR: n=44, 5q-: n=1 1 ), CMML (n=20) and AML (n=30). Profiles of human samples were generated using human orthologues to the mouse genes listed in Table 5. (b) Unique GSK-3p-deletion signature (63 genes, triangles) is determined between GSK-3 WT and βΚΟ (p < 0.05, fold-change >5). (c) GSK- 3β gene signature discriminates human myeloid neoplasm subtypes, (d) Both GSK-3 -deletion differential transcriptome (p < 0.05, fold-change >1 .5) and 63-gene signatures discriminate different disease diagnosis states in both adult (normal: n=6, stable-MDS: n=23 and transformed-MDS: n=12) and (e) pediatric myelodysplasia (RAEB: n=8, RAEB-t: n=8 and RC: n=16). (f-h) Correlation of GSK-3 -deletion gene signature with disease risk status and overall disease progression to AML in a cohort of pediatric MDS samples.
[0059] Figure 6 depicts the model of MDS onset and AML progression by allelic dosage of GSK-3a/ .
[0060] Figure 7 shows the effect on hematopoiesis is dependent on the allelic dosage of GSK-3a/ . (a) Experimental design outlining the strategy to generate conditional GSK-3 knockout mice, (b-c) GSK3fi deletion was demonstrated by genomic PCR (b) mRNA gene expression and (c) Western Blot analysis of total Lin" bone marrow cells from wild-type (+/+), heterozygous (+/flx) and homozygous (flx/flx) GSK-3 mice 2 weeks after Tamoxifen
injections (n=5). (d) Increased hematopoietic CFU progenitor output of
 Lineage-depleted bone marrow cells (Lin" BM) upon tamoxifen treatment (n=5, performed in triplicate), (e-f) Representative chimerism in bone marrow and peripheral blood between donor cells (CD45.2) and host cells (CD45.1 ) in primary recipients (n=5 for each condition), (g) Presence of severe anemia and (h) leukocytosis are detected in transplanted

mice, (i) along with neutrophilic dermatosis in skin lesions and granulocytic infiltration in the liver (n=5 for each condition), (j) Transplanted recipients with Gsk3a LSK cells display cellularities similar to those observed in controls (Gsk3a+/+) in both bone marrow and spleen as well similar leukocyte counts in PB and LN (n=8 mice for each condition), (k) A normal proportion of immature myeloid cells is present in BM, Spleen, PB and LN (mean±S.D., n=6), *p<0.05 and **p<0.01 .
[0061 ] Figure 8 shows GSK-3p-null MDS properties are accelerated in transplanted recipients, (a) Anemia, (b) granulocytosis and cytopenias were present in mice engrafted with
 Gsk3fi cells (n=10). (c) Higher frequency of immature myeloid cells in recipients (n=10). (d-g) Similar

myelodysplasia features are also present in peripheral blood and spleens of recipients transplanted with
 cells (n=10 for each condition), **p<0.01 .
[0062] Figure 9 shows the GSK-3p deletion leads to impaired hematopoiesis and MDS properties that are sustained in secondary recipients, (a-b) Representative bone marrow and spleen sections denoting progressive granulocytosis (MPO+) without monocytosis (Mac-2+) in GSK-3 - null (B KO) and α/β-null (DKO) (n=4 for each genotype), scale bar 200 μιη. (c) MDS features are also conserved in secondary transplants of primary engrafting
 cells, displaying superior regenerative capacity with (d) dramatically increased cellularity of BM recipients and (e) presence of immature blasts (n=10 for each condition), **p<0.01 .
[0063] Figure 10 shows the hematological disorder related to GSK-3 deficiency is initiated solely by HSCs. (a) Effect of GSK-3 deletion on HSCs subset demonstrating a specific increase of the LSK and CD150+48+ subsets (mean±S.D., n=10). (b) Absolute numbers of each progenitor subpopulation in the bone marrow showing enlargement of the GMP population (mean±S.D.,
cells, displaying superior regenerative capacity with (d) dramatically increased cellularity of BM recipients and (e) presence of immature blasts (n=10 for each condition), **p<0.01 .
[0063] Figure 10 shows the hematological disorder related to GSK-3 deficiency is initiated solely by HSCs. (a) Effect of GSK-3 deletion on HSCs subset demonstrating a specific increase of the LSK and CD150+48+ subsets (mean±S.D., n=10). (b) Absolute numbers of each progenitor subpopulation in the bone marrow showing enlargement of the GMP population (mean±S.D.,
Presence of increased proliferation of hematopoietic

stem/progenitor (HSPC) compartment (mean±S. D., n=5) was partially compensated by (d) increased apoptosis of hematopoietic progenitor cells in
 mice (mean±S.D., n=5). (e) Bone marrow transplant strategy in immunodeficient NOD/SCID mice, (f) Similar to congenic transplants, rapid mortality due to hematopoietic failure is observed in mice transplanted with
BM cells (n=15 mice for LSK cells, n=6 mice for Non-LSK cells),

Similar features of cellular cytopenias are also conserved in
peripheral blood of NOD/SCI D recipients transplanted with


Both transplanted and fl fl


recipient mice exhibit normal blood counts and myeloid lineage distribution (n=5 for each condition). (I) Representative flow gating plots demonstrating similar cell composition of myeloid progenitors subsets within the non-LSK population isolated from both BM cells (n=3). (m)

Similar myelodysplastic features are also conserved in secondary transplants of primary engrafting HSCs (n=8 for each condition), *p<0.05,


[0064] Figure 1 1 shows the GSK-3 α/β deletion displays specific dysregulated gene program that is not allelic dose dependent, (a-c) Most representative gene signatures present in LSK cells from GSK-3a KO, β KO and DKO LSK. (d-e) Most representative gene signatures discriminating GSK-
3 A KO from B KO LSK cells, (f) Protein levels of GSK-3 α/β in Lin" BM cells of different knockout genotypes, (g) Rapamycin treatment was inefficient to override the abnormal distribution of erythro-myeloid colony types for both GSK-3 B KO and DKO (mean±S.D., n=5).
[0065] Figure 12 shows the GSK-3 gene signatures predict MDS outcomes in humans, (a-b) GSEA analysis showing dysregulated epigenetic signatures previously associated with MDS/AML malignancies, (c) Mapping view of relevant functional association network of GSK-3 63-gene signature generated using STRING protein interaction database; stronger associations are represented by multiple lines and gene products involved in immune response are highlighted, (d) Kaplan-Meier curves demonstrate that WHO criteria as well as (e) both GSK-3 differential transcriptome and 63- gene signatures predict faithfully patient's prognosis and (f) AML transformation risk of pediatric MDS patients, as denoted by p-value.
[0066] Figure 13 shows in vitro deletion of the Gsk3 KO and Gsk3a + β DKO in highly enriched LSK BM cell lines allow the study of the molecular features for disease onset, a) An experimental design for in vitro analysis, b) a representative flow cytometry histograms showing the percentage of c-Kit+ and Sca-1 + from the Lin- BM analyzed at Day 0 and Day 7 after incubation, c) quantitative PCR validation of Gsk3 allele deletion after in vitro Tamoxifen treatment and d) representative western blots showing the decreased protein levels of GSK3a and/or β in the respective cell line after in vitro Tamoxifen treatment.
DETAILED DESCRIPTION
Method of detecting and/or screening for progression to AML
[0067] Myelodysplasia syndrome (MDS) is a pre-leukemic clonal disease which may progress to lethal acute myeloid leukemia (AML). As set out in Table 5, the disclosure identifies 63 distinct genes, each of which show a statistically significant (p-value < 0.05) difference in gene expression levels
between wild type cells and GSK-3p KO LSK cells. As described in the Examples, the gene expression levels of the disclosed genes and human orthologues thereof, or a subset thereof, may be used in diagnostic and prognostic testing for MDS and AML and in particular, in detecting and/or screening for the progression of MDS to AML.
[0068] Accordingly, the disclosure provides a method of detecting and/or screening for progression to AML or an increased likelihood of progression to AML, in a human subject having MDS, comprising:
determining a sample gene expression profile from a sample comprising DNA from said subject, said sample profile comprising, consisting of, or consisting essentially of:
(a) the gene expression level of at least 3, optionally at least 5, at least 10, at least 20, at least 30, at least 40, at least 50, at least 60, or all of the human orthologues of the genes listed in Table 5; and
(b) determining the level of similarity of said sample profile to one or more control profiles.
[0069] In one embodiment, (i) a high level of similarity of the sample profile to a high risk AML progression control profile; (ii) a low level of similarity to low risk AML progression control profile; and/or (iii) a higher level of similarity to a high risk AML progression control profile than to a low risk AML progression control profile indicates progression to AML or an increased likelihood of progression to AML.
[0070] Another aspect of the disclosure provides a method of detecting and/or screening for myelodysplastic syndrome (MDS) or an increased likelihood of MDS, in a human subject, comprising: determining a sample gene expression profile from a sample comprising DNA from said subject, said sample profile comprising, consisting of, or consisting essentially of:
(a) the gene expression level of at least 3, optionally at least 5, at least 10, at least 20, at least 30, at least 40, at least 50, at least 60, or all of the human orthologues of the genes listed in Table 5; and
(b) determining the level of similarity of said sample profile to one or more control profiles, wherein (i) a high level of similarity of the sample profile to an MDS specific control profile; (ii) a low level of similarity to a non-MDS control profile; and/or (iii) a higher level of similarity to an MDS specific control profile than to a non-MDS control profile indicates the presence of, or an increased likelihood of, MDS.
[0071 ] Another aspect of the disclosure provides a method of detecting and/or screening for acute myeloid leukemia (AML) or an increased likelihood of AML, in a human subject, comprising: determining a sample gene expression profile from a sample comprising DNA from said subject, said sample profile comprising, consisting of, or consisting essentially of:
(a) the gene expression level of at least 3, optionally at least 5, at least 10, at least 20, at least 30, at least 40, at least 50, at least 60, or all of the human orthologues of the genes listed in Table 5; and
(b) determining the level of similarity of said sample profile to one or more control profiles, wherein (i) a high level of similarity of the sample profile to an AML specific control profile; (ii) a low level of similarity to a non-AML control profile; and/or (iii) a higher level of similarity to an AML specific control profile than to a non-AML control profile indicates the presence of, or an increased likelihood of AML.
[0072] As used herein, the term "gene" refers to a genomic DNA sequence that comprises a coding sequence associated with the production of a polypeptide or polynucleotide product (e.g., rRNA, tRNA).
[0073] The term "expression level" of a gene as used herein refers to the measurable quantity of a gene product produced by the gene in a sample of a patient, such as a blood sample or a bone marrow sample, wherein the gene product can be a transcriptional product or a translated transcriptional product. Accordingly, the expression level can pertain to a nucleic acid gene product such as RNA or cDNA or a polypeptide gene product. The expression level is derived from a patient sample or cell and/or a control sample, and can for example be detected de novo or correspond to a previous determination.
[0074] As used herein, the term "orthologue" refers to genes in different species that evolved from a common ancestral gene by speciation. Normally, orthologues retain the same function in the course of evolution. Accordingly, the term "human orthologues of the genes in Table 5" refers to human orthologues of the mouse genes set out in Table 5. Determining human orthologues of mouse genes can be determined, for example, through the use of online databases such as GenBank. Table 5 provides accession numbers of human orthologues of the mouse genes listed therein.
[0075] Methods of determining gene expression levels can be determined by assaying nucleic acid expression products, for example mRNA or cDNA and/or by assaying polypeptide products. The level of gene expression can also be determined by assaying the presence and/or amount of a specific sequence in the gene, also known as a target sequence, optionally an mRNA target sequence. The level of gene expression can be determined or measured using a detection agent, wherein the agent detects a gene expression product of a gene or target sequence described herein. In an embodiment, the detection agent is an antibody, receptor protein or a nucleic acid such as a probe or primer set, capable of amplifying the gene or gene expression product.
[0076] In an embodiment, the methods comprise determining nucleic acid levels.
[0077] Wherein the gene expression level being determined is a nucleic acid, the gene expression levels can be determined using a number of methods for example a microarray chip or PCR, optionally multiplex PCR, northern blotting, or other methods and techniques designed to produce quantitative or relative data for the levels of mRNA species corresponding to specified nucleotide sequences present in a sample. Accordingly, in an embodiment, the gene expression level is determined using a microarray chip and/or PCR, optionally multiplex PCR.
[0078] Expression levels of the genes described herein can also be determined using primers (also known as target specific primers). In one embodiment, primers are attached to universal primer sequences that produce an amplification product (see for Example, US Patent No. 6,618,679). The multiplex amplification reaction used in the methods includes, but is not limited to PCR and the use of reverse transcription to generate cDNA from mRNA targets followed by nucleic acid sequence based amplification. These methods include single reaction RT-PCR, 2 step reverse transcription and PCR amplification, ligase chain reaction, cyclic probe amplification, an invader assay, bridge amplification or rolling circle amplification or a combination.
[0079] In another embodiment, the primers are designed to be intron spanning to minimize or eliminate genomic DNA signal interference. This can be accomplished using several primer design software products such as Primero (The Whitehead Institute, MA), OLIGO (Molecular Biology Insights, Inc, CO).
[0080] In another embodiment, amplified PCR products are separated by fragment sizes corresponding to the different target genes and the peak areas represent the mRNA level of expression. Amplified PCR products are separated by capillary electrophoresis or other separation techniques such as agarose and/or acrylamide gel, chromatography such as HPLC, or FPLC as well as microfluidic techniques. Detection is performed by, but not limited, to measuring the emission of laser induced fluorescence labels. Other methods
of detection include light absorptions and electrochemical signals. Amplified PCR products can also be detected by microarray, bead based analysis, and multiplex qPCR.
[0081 ] As used herein, a "gene expression profile" refers to the gene expression levels of one or more target genes. An expression profile can for example be detected by measuring RNA expression using methods described above such as microarray analysis, RT-PCR, multiplex PCR, directly quantitating RNA levels using for example RNA sequencing and/or by measuring polypeptide expression using methods such as flow cytometry and Western blotting.
[0082] As used herein, the term "sample gene expression profile" or "sample profile" refers to the gene expression levels of one or more target genes in a subject's genomic DNA. The gene expression profile of a sample tested according to the methods disclosed herein is referred to as a sample profile.
[0083] In some embodiments, the sample gene expression profile is compared to one or more control profiles. The control profile may be a reference value and/or may be derived from one or more samples, optionally from historical gene expression data for a patient or pool of patients who are known to have, or not have, MDS and/or AML and/or progression from MDS to AML. In such cases, the historical gene expression data can be a value that is continually updated as further samples are collected and individuals are identified as having MDS, AML and/or progression from MDS to AML as described herein. It will be understood that the control profile represents an average of the gene expression levels for selected genes as described herein. Average gene expression levels may, for example, be the mean levels or median levels.
[0084] For example, a "MDS specific control profile" or "MDS control profile" may be generated by measuring the gene expression levels of
specified genes in genomic DNA from an individual subject, or population of subjects, who are known to have MDS. Similarly, a "non-MDS control profile" may be generated by measuring the gene expression levels of specified genes in genomic DNA from an individual subject or population of subjects who are known to not have MDS.
[0085] In another example, an "AML specific control profile" or "AML control profile" may be generated by measuring the gene expression levels of specified genes in genomic DNA from an individual subject, or population of subjects, who are known to have AML. Similarly, a "non-AML control profile" may be generated by measuring the gene expression levels of specified genes in genomic DNA from an individual subject or population of subjects who are known to not have AML.
[0086] In another example, a "high risk AML progression control profile" may be generated by measuring the gene expression levels of specified genes in genomic DNA from an individual subject, or population of subjects, who are known to have a high risk of progressing from MDS to AML.
[0087] In another example, a "low risk AML progression control profile" may be generated by measuring the gene expression levels of specified genes in genomic DNA from an individual subject, or population of subjects, who are known to have a low risk of progressing from MDS to AML.
[0088] In certain embodiments, the tissue source from which the sample profile and control profile are derived is matched, so that they are both derived from the same or similar tissue.
[0089] As used herein "sample" includes but is not limited to a body fluid sample, tissue sample or tumor sample, which can be assayed for gene expression levels. The sample includes for example a blood sample, a biopsy, a frozen tissue sample, a fresh tissue specimen, a cell sample, and/or a paraffin embedded section, material from which, for example, RNA or DNA can be extracted in sufficient quantities and with adequate quality to permit
measurement of relative RNA levels or material from which polypeptides can be extracted in sufficient quantities and with adequate quality to permit measurement of relative polypeptide levels.
[0090] As used herein, the phrase "detecting and/or screening" for a condition refers to a method or process of determining if a subject has or does not have said condition. Where the condition is a likelihood or risk for a disease or disorder, the phrase "detecting and/or screening" will be understood to refer to a method or process of determining if a subject is at an increased or decreased likelihood for the disease or disorder.
[0091 ] As used herein, the term "progression to AML" refers to the process by which pre-leukemic syndromes such as MDS develop and/or transform into acute myeloid leukemia. It includes any and all steps along the continuum by which MDS proceeds to AML. The term "likelihood of progression to AML" refers to the likelihood that a subject diagnosed with, or suspected of having, MDS will develop AML.
[0092] A subject with an "increased likelihood of progression" or "an increased likelihood of MDS and/or AML" is also referred to having a high risk of progression or a high risk of MDS and/or AML. Likewise, a subject with a "decreased likelihood of progression" or "decreased likelihood of MDS and/or AML" is also referred to having a low risk of progression or a low risk of MDS and/or AML. An "intermediate" risk falls between high risk and low risk and a subject having a "moderate likelihood of progression" or a "moderate likelihood of MDS and/or AML" is also referred to having an intermediate risk of progression or an intermediate risk of MDS and/or AML.
[0093] The term "subject" as used herein refers to a human subject and includes, for example, a pediatric subject. In some embodiments, the subject is a patient diagnosed with, or suspected to have, MDS.
[0094] This disclosure also provides a process for normalizing target gene expression data or signal against at least one or against a geometric
means of multiple housekeeping gene target signals for improved gene expression analysis accuracy. Housekeeping genes are genes that are known to express at consistent mRNA level.
[0095] In an embodiment, the expression level is determined by one or more probes and/or one or more probe sets. In another embodiment, the one or more probes and/or the one or more probe sets, for example, include probes for the genes described herein comprised on a microarray.
[0096] The term "probe" as used herein refers to a nucleic acid molecule that comprises a sequence of nucleotides that will hybridize specifically to a target nucleic acid sequence such as the genes described herein. For example the probe comprises at least 10 or more bases or nucleotides that are complementary and hybridize to contiguous bases and/or nucleotides in the target nucleic acid sequence. The length of probe depends on the hybridization conditions and the sequences of the probe and nucleic acid target sequence and can for example be 10-20, 21 -70, 71 -100, 101 -500 or more bases or nucleotides in length. The probes can optionally be fixed to a solid support such as an array chip, a microarray chip or bead based solid support.
[0097] In another embodiment, the expression is determined using one or more primer sets. In another embodiment, the nucleic acid targets are mRNA and are assayed using one or more target specific probes or one or more target specific primer pairs complimentary to each target sequence.
[0098] The term "primer" as used herein refers to a nucleic acid molecule, whether occurring naturally as in a purified restriction digest or produced synthetically (for example, a synthetic peptide nucleic acid (PNA) or a locked nucleic acid (LNA)), which is capable of acting as a point of synthesis when placed under conditions in which synthesis of a primer extension product, which is complementary to a nucleic acid strand is induced (e.g. in the presence of nucleotides and an inducing agent such as DNA polymerase
and at a suitable temperature and pH). The primer must be sufficiently long to prime the synthesis of the desired extension product in the presence of the inducing agent. The exact length of the primer will depend upon factors, including temperature, sequences of the primer and the methods used. A primer typically contains 15-25 or more nucleotides, although it can contain less. The factors involved in determining the appropriate length of primer are readily known to one of ordinary skill in the art.
[0099] Accordingly, in an embodiment, gene expression levels are measured using an agent that provides for determination of gene expression levels of at least one, optionally all, of the selected genes, wherein the agent comprises an oligonucleotide-immobilized substrate comprising a plurality of oligonucleotide probes or primers corresponding to the selected genes. A non-limiting example of such an agent includes a "microarray", comprising an ordered set of probes fixed to a solid surface that permits analysis such as gene expression analysis of a plurality of genes or gene sequences.
[00100] In one embodiment, a method described herein also comprises first obtaining a sample from the subject. The sample, in an embodiment, comprises a clinical specimen. As used herein, the term "clinical specimen" includes any sample from a subject which comprises nucleic acids, for example, DNA. Examples of clinical specimens useful in the present methods include, but are not limited to, blood and bone marrow samples. Other examples of samples useful in the present methods include a bodily fluid sample, optionally plasma, serum, blood, bone marrow, saliva, urine or CSF or a tissue or tumor sample. In an embodiment, the sample is submerged in a RNA preservation solution, for example to allow for storage. In an embodiment, the RNA preservation solution comprises Trizol®. The sample is in an embodiment, treated with a RNAse inhibitor to prevent RNA degradation.
[00101 ] According to the methods described herein, similarity of the gene expression profile from a sample to one or more control profiles, may be
used to identify individuals having myelodysplastic syndrome (MDS) and/or acute myeloid leukemia (AML) or an increased likelihood of MDS and/or AML. For example, in an embodiment, the method comprises determining the level of similarity of a sample profile to one or more control profiles, wherein (i) a high level of similarity of the sample profile to an MDS and/or AML specific control profile; (ii) a low level of similarity to a non-MDS and/or non-AML control profile; and/or (iii) a higher level of similarity to an MDS and/or AML specific control profile than to a non-MDS and/or non-AML control profile indicates the presence of, or an increased likelihood of, MDS and/or AML.
[00102] Similarity of the gene expression profile from a sample to one or more control profiles, may also be used to identify individuals with MDS who have progressed to AML or have an increased likelihood of progression to AML. For example, in an embodiment, the method comprises determining the level of similarity of a sample profile to one or more control profiles, (i) a high level of similarity of the sample profile to a high risk AML progression control profile; (ii) a low level of similarity to low risk AML progression control profile; and/or (iii) a higher level of similarity to a high risk AML progression control profile than to a low risk AML progression control profile indicates progression to AML or an increased likelihood of progression to AML.
[00103] In an embodiment, the "MDS specific control profile" is generated by measuring the gene expression levels of specified genes in genomic DNA from an individual subject, or population of subjects, who are known to have MDS. Similarly, in an embodiment, the "non-MDS control profile" is generated by measuring the gene expression levels of specified genes in genomic DNA from an individual subject, or population of subjects, who are known to not have MDS. In certain embodiments, the sample source from which the sample profile and control profile are derived is matched, so that they are both derived from the same or similar tissue. In other embodiments, the sample profile and control profile are derived from different tissues. In certain other embodiments, the MDS specific control profile and the
non-MDS control profile are derived from historical data and can indicate similarity of a sample to either the MDS or non-MDS profiles.
[00104] In another embodiment, the "AML specific control profile" is generated by measuring the gene expression levels of specified genes in genomic DNA from an individual subject, or population of subjects, who are known to have AML. Similarly, in an embodiment, the "non-AML control profile" is generated by measuring the gene expression levels of specified genes in genomic DNA from an individual subject, or population of subjects, who are known to not have AML. In certain embodiments, the sample source from which the sample profile and control profile are derived is matched, so that they are both derived from the same or similar tissue. In other embodiments, the sample profile and control profile are derived from different tissues. In certain other embodiments, the AML specific control profile and the non-AML control profile are derived from historical data and can indicate similarity of a sample to either the AML or non-AML profiles.
[00105] In an embodiment, the "high risk AML progression control profile" is generated by measuring the gene expression levels of specified genes in genomic DNA from an individual subject, or population of subjects, who are known to have a high risk of progression from MDS to AML. Similarly, in an embodiment, the "low risk AML progression control profile" is generated by measuring the gene expression levels of specified genes in genomic DNA from an individual subject, or population of subjects, who are known to have a low risk of progression from MDS to AML. In certain embodiments, the sample source from which the sample profile and control profile are derived is matched, so that they are both derived from the same or similar tissue. In other embodiments, the sample profile and control profile are derived from different tissues. In certain other embodiments, the high risk AML progression control profile and the low risk AML progression control profile are derived from historical data and can indicate similarity of a sample to either the high
risk AML progression control profile or the low risk AML progression control profiles.
[00106] Methods of determining the similarity between gene expression profiles are well known in the art. Methods of determining similarity may in some embodiments provide a non-quantitative measure of similarity, for example, using visual clustering and hierarchical clustering. In another embodiment, similarity may be determined using methods which provide a quantitative measure of similarity.
[00107] For example, in an embodiment, similarity may be measured using hierarchical clustering, optionally using Manhattan distance. The Manhattan distance function computes the distance that would be traveled to get from one data point to the other if a grid-like path is followed. The Manhattan distance between two items is the sum of the differences of their corresponding components.
[00108] The formula for this distance between a p
and a point Y


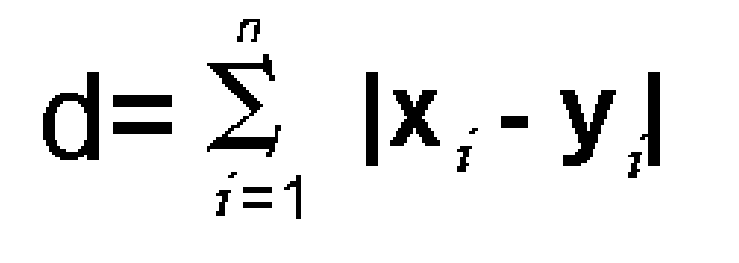
Where n is the number of variables, and Xi and Yi are the values of the variable, at points X and Y respectively.
[00109] In another embodiment, similarity may be measured by computing a "correlation coefficient", which is a measure of the interdependence of random variables that ranges in value from -1 to +1 , indicating perfect negative correlation at -1 , absence of correlation at zero, and perfect positive correlation at +1 . In an embodiment, the correlation coefficient may be a linear correlation coefficient, for example, a Pearson product-moment correlation coefficient.
[001 10] A Pearson correlation coefficient (r) is calculated using the following formula:

[001 1 1 ] In one embodiment, x and y are the beta values for various genes in a sample profile and a control profile, respectively.
[001 12] In an embodiment, a correlation coefficient calculated between the sample profile and the control profile indicates a high level of similarity to the control profile when the correlation coefficient has an absolute value between 0.5 to 1 , optionally between 0.75 to 1 , and a low level of similarity to the control profile when the correlation coefficient has an absolute value between 0 to 0.5, optionally between 0 to 0.25.
[001 13] It will be appreciated that any "correlation value" which provides a quantitative scaling measure of similarity between gene expression profiles may be used to measure similarity.
[001 14] The methods described herein may be used in combination with additional methods for classifying and/or prognosing MDS, AML and/or the progression from MDS to AML. In one embodiment, the methods further comprise identifying the WHO subtype of MDS. As used herein, the term "WHO subtype of MDS" refers to the WHO classification of myeloid neoplasms and acute leukemia (Arber DA, Orazi A, Hasserjian R, et al. The 2016 revision to the World Health Organization classification of myeloid neoplasms and acute leukemia. Blood. 2016; 127: 2391 -2405). In particular, patients may be classified according to the WHO classification as having either a "low-risk MDS" or a "high-risk MDS".
[001 15] Accordingly, in one embodiment, the methods further comprise identifying the WHO subtype of the subject, where a high risk WHO subtype
indicates progression to AML or an increased likelihood of progression to AML and a low risk WHO subtype indicates no progression to AML or a decreased likelihood of progression to AML.
[001 16] In another embodiment, the methods further comprise identifying the WHO MDS subtype of the subject, wherein
(a) (i) a high level of similarity of the sample profile to a high risk AML progression control profile; (ii) a low level of similarity to low risk AML progression control profile and/or (iii) a higher level of similarity to a high risk AML progression control profile than to a low risk AML progression control profile; and
(b) a high risk WHO MDS subtype,
indicates a high risk of progression to AML, progression to AML, or an increased likelihood of progression to AML.
[001 17] In another embodiment, the methods further comprise identifying the WHO MDS subtype of the subject, wherein
(a) (i) a low level of similarity of the sample profile to a high risk AML progression control profile; (ii) a high level of similarity to low risk AML progression control profile; and/or (iii) a lower level of similarity to a high risk AML progression control profile than to a low risk AML progression control profile indicates no progression to AML or an decreased likelihood of progression to AML; and
(b) a low risk WHO MDS subtype,
indicates a low risk of progression to AML, no progression to AML, or a decreased likelihood of progression to AML.
[001 18] In another embodiment, the methods further comprise identifying the WHO MDS subtype of the subject, wherein
(a) (i) a high level of similarity of the sample profile to a high risk AML progression control profile; (ii) a low level of similarity to low risk AML
progression control profile and/or (iii) a higher level of similarity to a high risk AML progression control profile than to a low risk AML progression control profile; and
(b) a low risk WHO MDS subtype,
or
(a) (i) a low level of similarity of the sample profile to a high risk AML progression control profile; (ii) a high level of similarity to low risk AML progression control profile; and/or (iii) a lower level of similarity to a high risk AML progression control profile than to a low risk AML progression control profile indicates no progression to AML or an decreased likelihood of progression to AML; and
(b) a high risk WHO MDS subtype,
indicates an intermediate risk of progression to AML.
[001 19] Confirmation of a diagnosis of MDS or AML, or an indication of an increased likelihood of progression from MDS to AML aids in medical management of these conditions by optimizing the opportunity for early intervention and management.
[00120] Accordingly, an aspect of the disclosure provides a method of determining a course of management for a subject with MDS, AML, an increased likelihood of MDS and/or AML and/or an increased likelihood of progression from MDS to AML, comprising:
a) identifying an individual with MDS, AML, an increased likelihood of MDS and/or AML and/or an increased likelihood of progression from MDS to AML, according to the methods described herein; and
b) assigning a course of management for the MDS, AML, increased likelihood of MDS and/or AML and/or an increased likelihood of progression from MDS to AML and/or symptoms of MDS and/or AML, comprising applying
an appropriate medical intervention and/or treatment based on the results of the identification.
[00121 ] Methods of treating MDS, AML and progression from MDS to AML include, but are not limited to chemotherapy, radiation, stem cell transplantation and/or bone marrow transplantation.
[00122] In one embodiment, a subject identified as having progression to AML or an increased likelihood of progression to AML is treated with chemotherapy, radiation, stem cell transplantation and/or bone marrow transplantation. In another embodiment, a subject identified as having progression to AML or an increased likelihood of progression to AML is treated with increased vigilance including regular physical exams, blood tests and/or imaging in order to identify early signs and symptoms of AML. In yet another embodiment, a subject identified as having an intermediate risk of progression to AML or a moderate likelihood of progression to AML is treated with increased vigilance including regular physical exams, blood tests and/or imaging in order to identify early signs and symptoms of AML. Physical exams, blood tests and/or imaging to identify early signs and symptoms of AML may also be referred to as "watchful waiting".
[00123] In another embodiment, the subject identified as not having progression to AML or a decreased likelihood of progression to AML is not treated with chemotherapy, radiation, stem cell transplantation and/or bone marrow transplantation.
[00124] The present disclosure also provides a method of selecting a treatment for a subject with progression to AML or an increased likelihood of progression to AML, comprising:
a) identifying the subject with progression to AML or an increased likelihood of progression to AML, according to the methods described herein; and
b) selecting a treatment for the subject, wherein the treatment comprises chemotherapy, radiation, stem cell transplantation, bone marrow transplantation and/or watchful waiting.
Kits
[00125] The disclosure also provides a kit for detecting and/or screening for MDS and/or acute myeloid leukemia (AML) or an increased likelihood of MDS and/or AML, in a sample, comprising, consisting of, or consisting essentially of:
a) at least one detection agent for determining the gene expression level of at least 3, optionally at least 5, at least 10, at least 20, at least 30, at least 40, at least 50, at least 60, or all of the human orthologues of the genes listed in Table 5; and optionally,
b) instructions for use.
[00126] The disclosure further provides a kit for detecting and/or screening for detecting and/or screening for progression to AML or an increased likelihood of progression to AML, in a human subject having MDS, in a sample, comprising, consisting of, or consisting essentially of:
a) at least one detection agent for determining the gene expression level of at least 3, optionally at least 5, at least 10, at least 20, at least 30, at least 40, at least 50, at least 60, or all of the human orthologues of the genes listed in Table 5; and optionally,
b) instructions for use.
[00127] In an embodiment, the detection agents comprise and/or are nucleic acid molecules. In a further embodiment, the detection agents are a set of probes or primers for determining the expression of at least 3, optionally at least 5, at least 10, at least 20, at least 30, at least 40, at least 50, at least 60, all of the human orthologues of the genes listed in Table 5.
[00128] In another embodiment, the detection agents comprise and/or are antibodies for determining the expression (e.g. polypeptide levels) of at least 3, optionally at least 5, at least 10, at least 20, at least 30, at least 40, at least 50, at least 60, or all of the human orthologues of the genes listed in Table 5.
[00129] In an embodiment, the kit comprises detection agents described herein, and optionally one or more specimen collectors, RNA preservation solutions and/or control samples.
[00130] In an embodiment, the specimen collector comprises a sterile vial or tube suitable for receiving a sample. In an embodiment, the specimen collector comprises RNA preservation solution.
[00131 ] In an embodiment the RNA preservation solution comprises one or more inhibitors of RNAse. In another embodiment, the RNA preservation solution comprises Trizoi® or other reagents designed to improve stability of RNA.
[00132] In another embodiment, the kit further comprises control samples. In one embodiment, the control sample is a positive control. In another embodiment, the control sample is a negative control.
[00133] In an embodiment, the antibody or probe is labeled. The label is optionally capable of producing, either directly or indirectly, a detectable signal. For example, the label may be radio-opaque or a radioisotope, such as 3H, 14C, 32P, 35S, 1231, 1251, 131 1; a fluorescent (fluorophore) or chemiluminescent (chromophore) compound, such as fluorescein isothiocyanate, rhodamine or luciferin; an enzyme, such as alkaline phosphatase, beta-galactosidase or horseradish peroxidase; an imaging agent; or a metal ion.
[00134] In another embodiment, the kit comprises a computer-readable medium that causes a computer to compare gene expression from a sample at the selected genes to one or more control profiles and compute a correlation value between the sample and control profile.
[00135] In an embodiment, the kit is for use in a method described herein. Disease models
[00136] The present disclosure shows that the deletion of GSK-3 in a transgenic mouse model leads to a MDS-like disease in vivo and the combined deletion of GSK-3a and GSK-3 in a transgenic mouse model leads to an AML-like disease in vivo. Accordingly, the present disclosure provides methods for creating a disease model of myelodysplastic syndrome by disrupting or deleting GSK-3/3 in a non-human transgenic model. The present disclosure provides methods for creating a disease model of acute myeloid leukemia by disrupting or deleting GSK-3cr and GSK-3 3 in a non- human transgenic model. These models are useful for screening for test agents to treat and/or prevent MDS, AML and/or the progression from MDS to AML.
[00137] In one aspect of the disclosure, a transgenic non-human model of MDS and/or AML is provided. In one embodiment, the transgenic non- human model is a transgenic mouse.
[00138] The term "transgenic non-human animal" includes any member of the animal kingdom, except humans, in which one or more cells contain a genomic alteration introduced by way of human intervention such as by transgenic techniques known in the art. In one example of a genomic alteration, a transgene or nucleic acid is introduced into the cell, directly or indirectly, by introduction into a precursor of the cell, by way of deliberate genetic manipulation, such as by microinjection or by infection with a recombinant virus. The term genetic manipulation does not include classical cross-breeding but rather is directed to the introduction of a recombinant DNA molecule. This molecule may be integrated within a chromosome, or it may be extrachromosomally replicating DNA. In another example of a genetic alteration, a specific gene or section of genomic sequence is disrupted or deleted.
[00139] Non-limiting examples of animals that may be used in the present disclosure include mice, rats, squirrels, hamsters, guinea pigs, rabbits, pigs, sheep, baboons, monkeys, chimpanzees, birds and amphibians. In one embodiment, the animal is a mouse.
[00140] In one embodiment of the present disclosure, the genomic alteration comprises a disruption of the gene GSK-3/3 and/or the gene GSK- 3a. In one embodiment, the disruption is a gene deletion or gene knock-out.
[00141 ] As used herein "GSK-3cr" refers to the gene encoding glycogen synthase kinase 3 alpha and includes, without limitation, GSK-3cr from any source such as those with sequences as shown in Genbank Accessions NM_019884 (human) and NM_001031667.1 (mouse), incorporated herein by reference in their entirety. In one embodiment, GSK-3cr is mouse GSK-3cr. In another embodiment, GSK-3cr is human GSK-3cr.
[00142] As used herein "GSK-3/3" refers to the gene encoding glycogen synthase kinase 3 beta and includes, without limitation, GSK-3/3 from any source such as those with sequences as shown in Genbank Accessions NM_002093 (human), NM_001347232.1 (mouse) and NM_019827.6 (mouse), incorporated herein by reference in their entirety. In one embodiment, GSK-3/3 is mouse GSK-3/3. In another embodiment, GSK-3/3 is human GSK-3/3.
[00143] As used herein, the term "gene disruption" is used synonymously with "gene mutation" to refer to an alteration to the gene such the expression of the gene is decreased or suppressed compared to an animal where the gene is not disrupted or that the protein encoded by the gene is non-functional or of reduced function compared to the protein encoded by the wild-type gene. One example of a gene disruption is a gene deletion or gene knockout.
[00144] As used herein, the term "gene deletion" is used synonymously with "gene knockout" to specify that the entire nucleic acid sequence
corresponding to the gene of interest is deleted from the genome in at least one allele.
[00145] In one embodiment, one allele of GSK-3cr is disrupted. This is also referred to as a heterozygous disruption. In another embodiment, both alleles of GSK-3cr are disrupted. This is referred to as a homozygous disruption. Similarly, in another embodiment, one allele of GSK-3/3 is disrupted. This is also referred to as a heterozygous disruption. In another embodiment, both alleles of GSK-3/3 are disrupted. This is referred to as a homozygous disruption.
[00146] In one embodiment, GSK-3cr and/or GSK-3/3 is conditionally disrupted. As is well known in the art, a conditional disruption such as a conditional deletion or knockout enables the disruption or deletion of a gene of interest in a specific tissue and/or at a specific time point (inducible), while in all other tissues or at all other time points the gene retains its wildtype function. For example, the Cre-lox system may be utilized for conditional deletions or disruptions of a gene. According, in one embodiment of the present disclosure, the transgenic mouse comprises a conditional disruption of one or both alleles of GSK-3/3 and/or GSK-3cr, for example a conditional knockout of one or both alleles of GSK-3/3 and/or GSK-3cr.
[00147] Methods of preparing transgenic animals having a deleted or disrupted gene are well known in the art. For example, embryonic stem cells containing a nucleic acid construct or vector of interest can be used to prepare a transgenic mouse. In particular, the embryonic stem cells are inserted into an early embryo for example using microinjection. For microinjection, approximately 10-20 embryonic stem cells are collected into a micropipette and injected into 3-5 day old blastocysts, preferably 3½ day old blastocysts, recovered from female mice. The injected blastocysts are re- implanted into a foster mother. When the pups are born, typically 20-21 days later, they are screened for the presence of the nucleic acid construct of the disclosure. For example, the tail tissue of the pups may be screened using
Southern blots and/or PCR. The heterozygotes are identified and can then be crossed with each other to generate homozygous animals with the gene deletion or disruption of interest. In another embodiment, as is known in art, the CRISPR/Cas9 system is used to generate a transgenic animal as described herein.
Uses of the disease models
[00148] In one embodiment, the transgenic animals described herein are useful models in studying MDS, AML and progression from MDS to AML. The animals can assist in studying the roles of GSK-3cr and/or GSK-3/3 in these diseases. As shown in Figure 1 , the combined deletion of GSK-3cr and GSK- 3/3 in a transgenic mouse leads to an AML-like disease in vivo. As shown in Figure 2, GSK-3/3 deficiency alone leads to myelodysplasia and impaired hematopoiesis.
[00149] Accordingly, in another embodiment, the transgenic animals of the disclosure are useful as animal models for testing potential agents that can modulate the effect of disruption of GSK-3/3 and/or GSK-3cr and treat conditions involving deletion and/or disruption of GSK-3/3 and/or GSK-3cr. The transgenic animals of the disclosure are also useful as animal models for testing potential agents that can treat or prevent MDS, AML and/or the progression of MDS to AML.
[00150] In particular, in one embodiment a method of screening a test agent for treatment or prevention of myelodysplastic syndrome (MDS) is provided, the method comprising a) administering a test agent to i) a transgenic mouse model of MDS whose genome comprises a disruption of GSK-3p, ii) a tissue from said transgenic mouse model, or iii) or a cell derived from said transgenic mouse model; and b) determining the effect of said test agent on the mouse model, tissue or cell, wherein a reduction of signs and/or symptoms of MDS in the mouse, tissue or cell identifies a test agent for the treatment or prevention of MDS.
[00151 ] Signs and/or symptoms of MDS in a mouse, cell or tissue model include, but are not limited to, impaired hematopoiesis, lobated or hypersegmented neutrophils, an increased frequency of blasts, extramedullary hematopoiesis, accumulation of monocytes and/or granulocytes in the spleen, accretion of hypersegmented neturophils in the peripheral blood, micromegakaryocytes with hyperchomatic nucleic in the spleen. Other signs and/or symptoms of MDS include increased mortality.
[00152] In one embodiment, a test agent for the treatment of MDS is identified when at least one of the signs/and or symptoms of MDS in a mouse cell or tissue model of MDS is reduced or decreased by at least 5, 10, 25, 50, 100% compared to a mouse model of MDS to which the test agent has not been administered.
[00153] In another embodiment, a method of screening a test agent for treatment or prevention of acute myeloid leukemia (AML) is provided, comprising a) administering a test agent to i) a transgenic mouse model of AML whose genome comprises a disruption of GSK-3a and a disruption of GSK-3p, ii) a tissue from said transgenic mouse model or iii) a cell derived from said transgenic mouse model; and b) determining the effect of said agent on mouse model, tissue or cell, wherein a reduction of signs and/or symptoms of AML in the mouse, tissue or cell identifies a test agent for the treatment or prevention of AML.
[00154] Signs and/or symptoms of AML in a mouse, cell or tissue model include, but are not limited to, increased mortality, skin lesions, bone marrow hypercellularity, splenomegaly, elevated leukocyte counts in peripheral blood and/or lymph nodes, increased presence of immature myeloid cells and leukemic blasts in the bone marrow, spleen, peripheral blood and/or lymph nodes. Other signs and/or symptoms of AML include increased mortality and/or cell death and an accumulation of blasts.
[00155] In one embodiment, a test agent for the treatment of AML is identified when at least one of the signs/and or symptoms of AML in a mouse, cell or tissue model of AML is reduced or decreased by at least 5, 10, 25, 50, 100% compared to a mouse model of AML to which the test agent has not been administered.
[00156] In embodiments where the GSK-3p and/or GSK-3a is a conditional disruption, the disruption is optionally induced prior to administering the test agent. The effects of the test agent on the signs and/or symptoms of MDS and/or AML can be compared to a control animal such as a transgenic animal not receiving the test agent following induction of the disruption.
[00157] The above screening methods of the disclosure can advantageously also use tissue, organs and/or cells isolated from the transgenic animal models described above.
[00158] The test agents contemplated herein include, but are not limited to chemical or biological molecules such as simple or complex organic molecules, biomolecules, metal-containing compounds, carbohydrates, peptides, proteins, peptidomimetics, glycoproteins, lipoproteins, sugars, polysaccharides, nucleic acids, antibodies, cells or combinations thereof. Such a test agent may be a naturally-occurring product or a synthetic product.
[00159] The test agents in the screening assays can be generated by methods well known to those skilled in the art, for example, well known methods for producing pluralities of compounds including without limitation: biological libraries; spatially addressable parallel solid phase or solution phase libraries; synthetic library methods requiring deconvolution; the "one-bead one-compound" library method; and synthetic library methods using affinity chromatography selection (see, e.g. Lam, 1997). Libraries containing large numbers of natural and synthetic compounds, including antibodies, also can be obtained from commercial sources. Combinatorial libraries of molecules
can be prepared using well known combinatorial chemistry methods (Gordon et al., J. Med. Chem. 37: 1233-1251 (1994); Gordon et al., J. Med. Chem. 37: 1385-1401 (1994); Gordon et al., Acc. Chem. Res. 29: 144-154 (1996); Wilson and Czarnik, eds.
Cells, cell lines and uses thereof
[00160] The present inventors have also shown that mouse cells comprising a GSK-3 knockout provides a MDS-like disease model and mouse cells comprising a GSK-3a and GSK-3 double knockout provides an AML-like disease model.
[00161 ] Mouse cells are commonly used as model mammalian cells. Accordingly, it is expected that human cells comprising a GSK-3 knockout would provide a MDS-like disease model. Similarly, it is expected that human cells comprising a GSK-3a and GSK-3 double knockout would provide an AML-like disease model.
[00162] Accordingly, a method of screening a test agent for treatment or prevention of myelodysplastic syndrome (MDS) is provided, comprising a) administering a test agent to a cell comprising a disruption of GSK-3 and b) detecting the effect of said agent on the cell. In one embodiment, the cell is a human cell.
[00163] In another embodiment, a method of screening a test agent for treatment or prevention of acute myeloid leukemia comprising a) administering a test agent to a cell comprising a disruption of GSK-3a and a disruption of GSK-3 and b) detecting the effect of said agent on the cell. In one embodiment, the cell is a human cell.
[00164] As used herein, the term cell refers to a single cell as well as a plurality of cells and also includes a cell line.
[00165] In one aspect, the methods described herein comprise screening a test agent for treatment or prevention of MDS or AML by
detecting an effect of the test agent on the cell. In one embodiment, the effect is indicative of the activity of the test agent to treat or prevent of MDS or AML.
[00166] In one embodiment, "detecting an effect" comprises monitoring or determining cell size or morphology, expression of cell markers, the emergence of cell types or the biochemical make-up of the cell. For example, in one embodiment "detecting an effect" includes, but is not limited to, using methods such as immunohistochemistry (I F1 C), ELISA, reporter genes, PCR or RT-PCR, fluorescent labels, cytometric bead arrays, DNA arrays, flow cytometry or optical analysis to detect the effect of a test agent on cells comprising a disruption of GSK-3 and/or GSK-3a or normal (wild-type) cells.
[00167] In one embodiment, the effect of said agent on the cell is compared to the effect of said agent on a cell which does not comprise a disruption of GSK-3 and/or GSK-3a. In one embodiment, a test agent which has a differential effect on a cell which comprises a disruption of GSK-3 and/or GSK-3a compared to a cell that does not comprise a disruption of GSK-3 and/or GSK-3a is identified as an agent for treating or preventing MDS and/or AML.
[00168] Cells derived from the transgenic model animals described above and cells wherein the GSK-3 and/or GSK-3a disruption is directly introduced into the cell or cell line (for example, using techniques of genetic engineering that are well known within the art) are both contemplated within the present disclosure.
[00169] Optionally, the methods described herein further comprise testing the agents identified using the screening methods described herein for toxicity.
[00170] In one embodiment, the method of screening a test agent is a high throughput screening assay. The term "high throughput screening" as used herein refers to automated in vitro testing of the effect of test agents on
cells and such screening is typically performed with the aid of computer or robot-controlled processes.
[00171 ] In one embodiment, there is provided a composition comprising microtitre plates with a plurality of receptacles wherein one or more of the receptacles contain cells comprising a disruption of GSK-3p and/or GSK-3a as described herein. In one embodiment, the microtiter plates are high- throughput format microtitre plates. In one embodiment, the plates are high- density plates suitable for cell-based assays or culture. In some embodiments, the plates have 2 or more, 96, 384, or 1536 individual receptacles or wells and are suitable for use in high-throughput screening such as in automated systems and/or robotic systems.
[00172] As used herein, the term "receptacle" refers to a container suitable for the maintenance and culture of cells. In some embodiments, the receptacle may be a well on a plate such as a microtitre plate, which optionally contains a plurality of wells or receptacles. Optionally, the receptacle is designed so as to prevent contamination from adjacent receptacles. Typically, the receptacle will also contain media to provide nutrients to the one or more cells and allow for cell growth.
[00173] Terms of degree such as "substantially", "about" and "approximately" as used herein mean a reasonable amount of deviation of the modified term such that the end result is not significantly changed. These terms of degree should be construed as including a deviation of at least ±5% of the modified term if this deviation would not negate the meaning of the word it modifies or unless the context suggests otherwise to a person skilled in the art.
[00174] The above disclosure generally describes the present disclosure. A more complete understanding can be obtained by reference to the following specific examples. These examples are described solely for the purpose of illustration and are not intended to limit the scope of the disclosure.
Changes in form and substitution of equivalents are contemplated as circumstances might suggest or render expedient. Although specific terms have been employed herein, such terms are intended in a descriptive sense and not for purposes of limitation.
[00175] The following non-limiting examples are illustrative of the present disclosure:
EXAMPLES
[00176] The following examples illustrate the scope of the disclosure. Specific elements of the example are for descriptive purposes only and are not intended to limit the scope of the disclosure. Those skilled in the art could develop equivalent methods and utilize comparable materials that are within the scope of the disclosure.
Example 1 Creation of disease models and gene signatures for MDS and AML
EXPERIMENTAL PROCEDURES AND MATERIALS
GSK-3 Mouse Models and In vivo Assays
[00177] The generation of conditional knockout mice for Gsk3a and Gsk3 has been described previously (MacAulay et al., 2007; Patel et al., 2008), and mice were kindly provided by Dr. Brad Doble (Stem Cell and Cancer Research Institute, Hamilton, Ontario, Canada). Tamoxifen-inducible Rosa26-CreER™ mice carrying the Cre recombinase and B6.SJL-Ptprca Pep3b/BoyJ (BI6/SJL) mice were purchased from the Jackson Laboratory. To obtain conditional GSK-3 -knockout mice were crossed with

Rosa26-CreER™ mice. Subsequently these mice were crossed with Gsk3a mice (obtained from germiine deletion of GSK-3a in conditional knockout animals, as previously described (MacAulay et al. , 2007) to obtain GSK-3- double mutant mice). Both, conditional GSK-3 -KO and GSK-3a/GSK-3 - knockout mice were used for experiments. Genotyping was performed on
genomic DNA isolated from ear notches with the Extract-NAmp Tissue PCR Kit (Sigma Aldhch). PCR analysis was performed with primers for GSK-3a, GSK-3 and Cre (Table 1 ).
[00178] For syngeneic transplantation, 1x10⁶ of freshly isolated or Lin" bone marrow (BM) cells from
 double

 double or wild-type mice were injected into the

tail vein of lethally irradiated congenic recipients. Three weeks after injection, conditional knockout was induced by 3 sequential injections of 250μΙ tamoxifen (diluted in 1 % captisol) into the tail vein, every 2-3 days. For competitive transplantation, 1x10⁴ Lin" Sca1 + c-Kit+ (LSK) or 1x10⁵ Lin"Sca1 c-Kit" (non-LSK) BM cells from mice were

admixed with 1x10⁶ BM cells from CD45.1 + mice and injected into lethally irradiated BI6/SJL mice (CD45.1 +) mice. GSK-3p-deletion was induced by tamoxifen. Similar transplantation settings were also applied in NOD/SCID mice with tamoxifen induction 2 weeks post-transplant. Prior to secondary transplants, CD45.1 + cells were removed from total BM of primary recipients using the Mouse Hematopoietic Progenitor Cell Enrichment Kit containing antibodies directed against CD45.1 , CD1 1 b, B220, GR-1 and Ter1 19 (Stem Cell Technologies). Mice were bred, transplanted and maintained in the SCC- Rl animal barrier facility and all procedures received the approval of the animal ethics board of McMaster University.
Flow Cytometry Analysis and Sorting
[00179] PB, spleen or BM single cell suspensions were washed in PBS, incubated for 15 min. at 4°C with a blocking solution and then stained for 20 min. at 4°C with antibodies. To check engraftment of freshly harvested BM, cells were stained with conjugated anti-mouse antibodies against CD45, CD45.1 , and CD45.2 (BD Biosciences) and analyzed using a LSR II or FACS Calibur flow cytometer (BD Biosciences).
[00180] Engrafted cells were further analyzed on a LSR II after staining with conjugated anti-mouse antibodies against CD45, CD45.1 , CD45.2, Granulocytes (CD1 1 b, Gr-1 ), Monocytes/Macrophages (CD14, F4/80), Erythrocytes (CD71 , Ter1 19), Megakaryocytes (CD61 ,CD41 ), B lymphocytes (B220, CD19, IgM), T lymphocytes (CD3, CD4, CD8) and HSCs/progenitors (Lineage, c-Kit, Sca-1 , CD150, CD48, CD34, FCgll/l ll, IL-7Ra) (BD Biosciences). For β-catenin activity, bone marrow cells were first stained with Iineage-antibodies and then stained with either hematopoietic stem cell or progenitor cocktails of antibodies followed by fixation with 0.8% paraformaldehyde for 10 min. Cells were then washed, permeabilized and stained with DAPI and an antibody recognizing the active (de-phosphorylated) form of β-catenin (ABC, clone 8E7, Millipore) or isotype controls directly labeled (Xenon kit, Invitrogen) with Alexa Fluor-488, as described previously (Abrahamsson et al. , 2009). Subsequent analyses were done with the FlowJo software (TreeStar). For sorting Lin- bone marrow, cells were stained with APC-conjugated c-Kit, PE-conjugated Sca-1 , PB-conjugated CD45.2 and 7AAD (all BD Biosciences). Cells were sorted on a FACS Aria I I (BD Biosciences).
Morphological Analysis
[00181 ] Cytospins from bone marrow, spleen or liver samples were prepared by diluting 1x10⁵ cells in 100 μΙ PBS and spinning them on glass microscope slides using the Shandon Cytospin 3 (Block Scientific, Inc.). Blood smears from peripheral blood were prepared by pipetting 50μΙ of fresh blood mixed with EDTA on a glass microscope slide and spreading it by pulling the edge of another microscope slide over the surface of the first slide starting from the blood drop. Differential staining using Wright's Giemsa stain was performed with the Shandon Kwik-Diff Stain Kit (Thermo Scientific). Tissues were fixed in 10% buffered Formalin (Fisher Scientific) and bones were decalcified using Immunocal (Decal Chemical). Sections were stained with hematoxylin and eosin (H&E) stain for morphologic and cytologic assessment.
For immunohistochemistry, MPO (A0398; Dako) and Mac2 (CL8942AP; Cedarlane) antibodies were used to identify myeloid cells. Images were acquired using either a Scanscope Slide Scanner with the Image Scope software (Aperio) or an Olympus IX 81 Inverted Microscope.
Cell cycle and apoptosis analysis
[00182] Mice were administered 200 μΙ of 10 mg/ml BrdU (BD) by intraperitoneal injection at 12 and 24 hrs prior to sacrifice. Isolated bone marrow cells were collected for flow cytometric detection of BrdU-FITC uptake according to the manufacturer's instructions (FITC-BrdU flow kit; BD Biosciences). For cell cycle analysis on live cells, stained cells were incubated with 5 μg/mL Hoechst 33342 (Invitrogen) for 10 min. prior to flow cytometric analysis. For the apoptosis assay, 7-AAD and Annexin V-APC (BD Biosciences) was used in combination with either hematopoietic stem cell or progenitor cocktails of antibodies. All procedures were analyzed on LSRII and FlowJo.
Hematopoietic Colony-Forming Cell Assay and Rapamycin treatment
[00183] Freshly isolated CD45.2 positive bone marrow cells from transplanted mice were counted by trypan blue exclusion and 3 x 10³ Lin- cells or 2 x 10⁴ to 5 x 10⁴ total BM cells were plated in triplicate in methylcellulose medium containing rm SCF, rm I L-3, rh IL-6 and rh EPO (Methocult M3434, StemCell Technologies). After 8 to 12 days the dishes were scored for different hematopoietic colonies. To block PI3K/Akt/mTOR signaling, either vehicle, dissolved 100nM Rapamycin (Calbiochem, Millipore), dissolved 10μΜ Wortmannin (Selleck Chemicals LLC) or dissolved 175nM LY2584702 (Selleck Chemicals LLC) was added to the methylcellulose mixture prior to plating as described previously (Janes et al., 2010).
Quantitative RT-PCR
[00184] Total RNA was extracted from mouse CD45.2-positive BM and Spleen cell or FACS-sorted LSK cells using the Norgen Total RNA Purification
Kit (Norgen Biotek Corp.). 100 to 200 ng of total RNA was reverse transcribed into cDNA with qScript™ cDNA SuperMix (Quanta Biosciences) according to the manufacturer's protocol. cDNA was diluted to a concentration of 0.5 ng/μΙ (based on the RNA concentration) and 1 or 2 μΙ of the dilution was mixed with 12.5 μΙ GoTaq® qPCR Master Mix (Promega), 2.5μΙ of 10 μΜ primer mix and nuclease-free water, to a final volume of 25 μΙ per reaction. Quantitative real time PCR was performed with the MX3000P QPCR System (Stratagene, CA). Each reaction was performed in triplicate and the mean Ct value was used to calculate the relative fold changes using the ΔΔ Ct method. The primers used are listed in Table 1 .
Western blot analysis
[00185] Total protein fraction from mouse Lin- bone marrow cells was extracted in 1 % SDS Laemmli Sample buffer (Bio-Rad), separated by SDS- PAGE, and transferred onto nitrocellulose membranes as previously described (Benoit et al., 2010). Nuclear proteins were extracted using the NEPER® Nuclear and Cytoplasmic Extraction kit (Pierce Thermo Scientific) according to the manufacturer's recommendations. Purity of the isolated nuclear fractions was validated by monitoring levels of pan histone H3 (nuclear) vs. GAPDH (cytoplasmic) by western blot. Membranes were blocked in PBS containing 5% skim milk and 0.1 % TWEEN 20 (Bio-Rad). Primary antibodies anti-p-Catenin (1 : 1000; mouse monoclonal, 610154; BD Transduction Laboratories), anti-histone H3 (1 :200 000; rabbit polyclonal, ab1791 ; Abeam), anti-phospho- S473-AKT (1 : 1000; mouse monoclonal, 4151 ; Cell Signaling Technology), anti-AKT (1 : 1000; rabbit monoclonal, clone C67E7; Cell Signaling Technology), anti-GAPDH (1 :80 000; mouse monoclonal, clone 6C5; Abeam), and anti-GSK-3 alpha/beta (1 :2000; mouse monoclonal, clone 21A; Life Technologies), as well as associated HRP- conjugated secondary antibodies (1 : 10 000, Bio-Rad) were used as described previously (Benoit et al., 2010). Images were acquired using a ChemiDoc™ XRS+ System with Image Lab™ Software (Bio Rad). Quantitative optical
densitometry analysis of bands was performed using Image J software (National Institutes of Health).
Metabolic characterization
[00186] Cells were washed and placed in XF96 V3 PS cell culture microplates (Seahorse Bioscience) on the XF Base Medium (Seahorse Bioscience) supplemented for final concentrations of 0.5 mM sodium pyruvate, 1 mM L-glutamine and 3.2 g/L glucose and adjusted to pH 7.4 at room temperature. Cells were incubated for 1 hour at 37°C in an XF Prep Station (Seahorse Bioscience). XFe96 Flux Pak hydrated cartridges were placed on top of the cells for data acquisition using an XFe96 analyzer (Seahorse Bioscience). The baseline levels of oxygen consumption rates (OCR) and extra-cellular acidification rates (ECAR) were used to establish the resting cellular metabolic activity (Zhang et al., 2012). To analyze mitochondrial function, pharmacological inhibitors properly optimized were added via port injection as follows: Oligomycin (1 mM), Carbonyl cyanide-4 (trifluoromethoxy)phenylhydrazone (FCCP, 1 mM), rotenone (0.5 mM) and antimycin A (0.5 mM). ATP-linked respiration was calculated as the difference in oxygen consumption rate between baseline and after oligomycin addition. Spare respiratory capacity was calculated as the difference between baseline and after addition of FCCP.
Global gene expression profiling and clinical outcome analysis
[00187] Freshly isolated LSK BM cells from

mice were

sorted based on surface marker expression (CD45.1 +) and total RNA was extracted and amplified from each purified population, as described previously (Wang et al., 2004). Amplified-labeled RNA was hybridized to Mouse 430 2.0 genechip microarrays (Affymetrix, USA) using standard protocols at the London Regional Genomics Center (Ontario, Canada). Arrays are available at GEO database under accession number GSE53352. The data analysis,
including RMA normalization and clustering was performed using Partek Genomics Suite 6.6 software. A list of over 1000 genes significantly dysregulated between GSK-3 WT and BKO (p < 0.05, fold-change 2 or < 1 .5) was used as a transcriptome differential gene list as well as a differential list of 63 genes with p < 0.05, fold-change 2 or < 5 was used as a GSK-3 gene signature list. Gene Ontology analysis was performed using DAVID bioinformatics resource 6.7 Functional Annotation Tool Suite. The top three GOTERM_BP_FAT annotations for a given set of gene inputs were listed as annotation terms (Huang da et al. , 2009). Both GSK-3 transcriptome and 63- gene GSK-3 molecular signature were applied to GEO data set of adult (Sridhar et al., 2009) (GSE18366) and pediatric MDS (Bresolin et al., 2012) (GSE29326) using clustering analysis to discriminate disease subtypes. Human array GEO dataset of non-diseased, MDS, CMML and AML patients (GSE 15061 ) (Mills et al., 2009) was compared to GSK-3 transcriptional profile using common gene entities between human and mouse array technologies as previously described (Schnerch et al., 2010). In particular, profiling of human samples was performed using arrays of human orthologues to the mouse genes. Detection of molecular signatures was performed using Gene Set Enrichment Analysis software (http://www.broadinstitute.org/gsea) using the MSigDB database of the Broad institute. Clinical prognostic analysis was performed as described previously (Eppert et al., 201 1 ). Briefly, array expression data from pediatric MDS samples (GSE29326) was filtered based on either a 63 gene signature or full differential GSK-3 gene list, multiple probe sets were averaged per gene. The log2 expression values were centered to zero median. The transformed values for genes that had been identified as being down-regulated in GSK-3 KO had their sign switched. Subsequently, the sum of the median-centered log2 expression values was used as the risk score for each patient, and 32 patients were split into high- or low-risk groups depending if the score was higher or lower than the mean risk score. These groups were assessed for MDS prognosis and AML
transformation risk using progression-free survival test or progression-time to AML test respectively (univariate Kaplan-Meier analysis with log-rank test statistics).
Statistical analysis
[00188] Statistical analyses were performed by using two-tailed f-test comparisons with GraphPad Prism (GraphPad Software, Inc. , San Diego, CA). Values were compared as means ± standard error of the mean, and p < 0.05 and <0.01 was considered statistically significant and is indicated by asterisks in the figures. PFS and time to AML transformation was demonstrated using Kaplan-Meier curves. The p-values between the curves were generated using Log-Rank (Mantel-Cox) test.
RESULTS
Combined GSK-3a and β allelic deficiency leads to AML
[00189] Despite structural redundancy,
 knockout mice die perinatally, whereas
 knockout mice are viable with no noticeable phenotype in hematopoiesis (Doble et al., 2007). However, deletion of both GSK-3a and β was required in order to manifest a block in stem cell differentiation and pluripotency retention in mouse embryonic stem cells (Kelly et al., 201 1 ), suggestive of a redundant role of GSK-3 a and β in mouse embryonic stem cells. To investigate the direct effect of GSK-3-deletion in adult hematopoietic stem/progenitor cells (HSPC) while circumventing allelic compensatory affects and early development mortality (Rossi et al., 2012; Wirth et al., 2007), a regulated GSK-3 -null genetic system was created by crossing floxed GSK-3 mice with tamoxifen-inducible ROSA26-Cre transgenic mice (Rosa26-CreER™) (Fig.1 a-c) that were then crossed with
 to generate both

Having established faithful targeting and effects on the

HSPC compartment (Fig.1 d), lineage-depleted bone marrow (Lin'BM, CD45.2) was transplanted into lethally irradiated congenic recipient mice
(CD45.1 ) to evaluate the effects of combinatorial GSK-3 allele deletion on in vivo hematopoietic regenerative capacity (Fig.2a). Five weeks after transplantation, peripheral blood from mice was analyzed to determine robust donor (CD45.2) chimerism (Fig. 1 e), and were subsequently administered tamoxifen to induce allele deletion (Gan et al., 2008; Lobry et al., 2013), then followed for 6 weeks, at which time a significant number of mice were analyzed The remaining mice were followed for longer-term survival

and changes in hematopoiesis (Fig.2b).
[00190] In contrast to recipient mice transplanted with either Gsk3aA or recipients displayed severe illness,

eruption of skin lesions, and rapid morbidity starting as early as 2 weeks post- tamoxifen treatment (Fig.2b). Since
 were equivalent to Gsk3aA BM recipients, this demonstrated that a single 13 allele is haplosufficient to sustain normal hematopoiesis even in the absence of Gsk3a. Further analysis of recipient hematopoietic tissue revealed competitive chimerism measured by serial transplantation (Fig. 1 e and f) accompanied by BM hypercellularity, severe splenomegaly (Fig. 2c), and more importantly, displayed a greater than 5-fold increase in total leukocytes in both lymph nodes (LN) and peripheral blood (Fig. 2d). Along with anemia, leukocytosis and granulocytic infiltration in the liver (Fig. 1 g and h), morphological assessment of
 skin lesions was consistent with neutrophilic dermatosis (Fig. 1 i), similar to previous reports describing human AML patients with acute febrile neutrophilic dermatosis or Sweet's syndrome (Anzalone and Cohen, 2013). By contrast, both groups of recipient mice transplanted with either or G BM demonstrated normal


hematopoiesis (Fig. 1j and k). Furthermore, in both BM and spleen compartments, immature myeloid cells, defined as Gr-1 + CD1 1 b+ ckit+ F4/80" CD1 15" blast cell population (Fig. 2e and f), were detected at high levels in
 recipients (Fig. 2g), along with evidence of granulocytosis in the blood (>20%) and lymph node (>10%) (Fig. 2h), when compared to both
and recipients (Fig. 1 k). Consistent with AML blast cell
recipients (Fig. 2g), along with evidence of granulocytosis in the blood (>20%) and lymph node (>10%) (Fig. 2h), when compared to both
and recipients (Fig. 1 k). Consistent with AML blast cell


morphology, pathological features of both GSK-3a and β deficient hematopoietic cells are in accordance with both Bethesda (Kogan et al., 2002) and WHO criteria for AML (Vardiman, 2010). Strikingly, expansion of HSPC (LSK) as well as GMPs in
 primary recipients (Fig. 2i), carried the AML disease to secondary recipients that experienced high mortality within a few weeks (Fig. 2j) owing to the presence of a leukemia initiating cell (L-IC) subset driven by combined
 deficiency.
[00191 ] These in vivo results demonstrate that induction of murine AML is not uniquely dependent on allelic dosage deficiency between GSK-3 homologues but is interdependent on a vs. β GSK-3, where disruption of GSK-3 is the main driver for the establishment of hematopoietic disorder leading to leukemic progression that is dependent on the absence of GSK-3a.
GSK-3S deficiency impairs hematopoiesis by inducing myelodysplasia.
[00192] Since
 mice have no phenotype, the effect of GSK-3 deletion in exclusion on hematopoiesis was tested. HSC enriched Lin'BM from both donor mutant mice (Fig. 1 a) were assessed for their

regenerative capacity in the transplantation settings (Fig. 3a). The majority of Gsk3fi flx/flx recipients developed symptoms of cachexia, abnormal gait and labored breathing, and had to be sacrificed by 8-10 weeks post-tamoxifen treatment compared to
 recipients or untreated mice (Fig. 3b). Loss of mice mainly occurred due to cachexia or BM failure, leading to severe anemia (Fig.4a). BM analysis showed significant difference in cellularity in
 recipients (Fig. 3c) with notable increases in granulocytes along with reduced erythrocyte, monocyte and lymphocyte frequencies but no change in platelet levels (Fig. 4b). In contrast, no abnormalities were observed in any controls (e.g. untreated mice or treated mice transplanted with or wild-type Lin'BM cells) (Fig. 3b-c). Among granulocytic

subsets, an increase in dysplastic neutrophils frequency (Fig. 3d), as well as undifferentiated myeloid
 levels, (Fig. 3e and Fig. 4c)
were also observed in BM of recipients. This indicated abnormal
levels, (Fig. 3e and Fig. 4c)
were also observed in BM of recipients. This indicated abnormal

myeloid differentiation and marked nuclear lobation with hypersegmentation in neutrophils (Fig. 4d) consistent with myelodysplasia (Kogan et al., 2002). Erythrocyte and platelet counts varied in some recipients illustrating features of cytopenia (Fig. 4e). In addition, examination of splenic composition of recipients showed a high incidence of splenomegaly (Fig. 4f) and

revealed extensive growth of the granulocytic-myeloid lineage, but lack of erythrocytes (Fig. 4g). Histologically, marked expansion of the red pulp with diffuse infiltration by myeloid and granulocytic cells was observed, resulting in the destruction of splenic architecture (Fig. 3f). Dysplastic megakaryocytes in the spleen, such as the presence of micro-megakaryocytes with hypolobulated and hyperchromatic nuclei consistent with myelodysplasia was also observed (Fig. 3f). This expansion of the granulocytic compartment was accompanied by suppressed monocytic generation in recipient

mice featuring myeloid proliferation without monocytosis in contrast to AML phenotype (Fig. 5a-b). Based on the Bethesda criteria (Kogan et

al., 2002), features from deletion of GSK-3 alleles are indicative of severe myelodysplasia that are morphologically similar to human MDS with presence of some degree of granulocytosis (Cazzola, 201 1 ; Natelson and Pyatt, 2013; Tiu and Sekeres, 2014).
[00193] To functionally address whether the myelodysplastic phenotype (Beurlet et al., 2013) observed contains cells with disease initiating properties, BM cells from primary recipients were serially transplanted into secondary mice (Fig. 3g). Secondary recipients developed an identical hematopoietic disorder as primary recipients, and the level of stable disease was dependent on the number of injected cells (Fig. 3h and Fig. 5c). Similar dysplastic features and lethality were also consistent with primary transplanted mice (Fig. 3i and Fig. 5d-e). Based on these results, and without being bound by theory, it is suggested that deletion of GSK-3 allows for the generation of self-renewing cells that can be functionally defined as MDS-lnitiating Cells
(MDS-ICs) capable of sustaining MDS in vivo. Accordingly, the present disclosure also provides self-renewing cells comprises a deletion of GSK-3 . These cells are also useful in the methods described herein for screening for test agents for treating or preventing MDS.
HSCs are vulnerable to GSK-33 disruption for disease onset
[00194] Since MDS is thought to be a group of clonal disorders likely to originate from HSPCs (Corey et al., 2007; Nimer, 2008), the composition of the HSPC compartment of
 recipients was examined. The BM LSK cells were increased, specifically the CD150+CD48+ subset, shown to have a myeloid commitment bias (Challen et al., 2010). However, this increase neither affected LT-HSCs (defined as LSK CD150+CD48") nor late multipotent progenitors (MPP, defined as LSK CD150"CD48+) (Fig. 6a). Observed differentiation bias linked to Gsk3fi deficiency was coupled with a significant increase in the absolute numbers of granulocytic/monocytic progenitors (GMP) together with a decrease of the megakaryocyte-erythrocyte progenitor population (MEP) with no effects on common myeloid and lymphoid progenitors (CMP and CLP) (Fig. 6b). This unbalanced progenitor phenotype is exacerbated by an increase of proliferation of the LSK and LT-HSC fraction in
 recipients (Fig. 6c) and is mitigated by apoptosis of LSK CD150+CD48+ progenitors (Fig. 6d).
[00195] Beyond phenotypic analysis, HSCs (LSK) and progenitors (non- LSK) were isolated from the BM (Chao et al., 2008; Passegue et al., 2003) of both donor mice and evaluated by
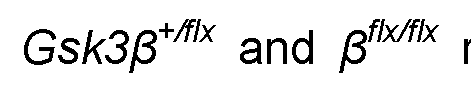


[00196] To characterize the kinetics of dysplasia emergence from HSCs, time course analyses revealed an acceleration of G
 LSK capacity within 4 weeks post-tarn oxifen treatment (Fig. 7e-f), assessing the celerity of dysplasia (Fig. 7g). Subsequent serial transplantations demonstrated a mere 55% survival of secondary recipients transplanted with primary

LSK-engrafted BM cells with no evidence of disease in mice transplanted with primary (Fig. 7h). Secondary recipients


retained a higher regenerative capacity compared to

recipients, thereby underscoring MDS-IC properties (Fig. 7i). Furthermore, secondary recipients exhibited disease features similar to primary recipients that included a marked increase in granulocytes frequency (Fig. 6m). Collectively, the results indicate that the HSC compartment represents the origin of MDS-IC that is dependent on GSK-3 deletion to induce transplantable and durable hematological disorder in vivo.
GSK-33 deletion drives Wnt/Akt/mTOR signaling and induces AML when combined with metabolic changes acerbated by the absence of GSK-3a.
[00197] To better understand the molecular nature and collaborative interplay between GSK-3a and GSK-3 deficiencies responsible for MDS (β- deficient) and subsequent AML (combined αβ-deficient) states, the regulatory

[00198] The LSK fractions were analyzed using whole genome expression profiling (Bowman et al., 2007) where each demonstrated a distinct transcriptome phenotype (Fig. 8a). Extended gene set enrichment analysis (GSEA) performed on LSKs revealed unique gene signatures for each GSK-3a/ allelic deletion combination (Fig. 8b). Enrichment in cell proliferation, DNA replication and mitochondria programs were observed in GSK-3a KO LSK cells (Fig. 9a) but had no measurable effect on the biology of HSC in transplanted hosts (Fig. 2). In contrast, enrichment in sternness and uncommitted progenitors gene expression signatures in GSK-3 KO LSK cells was observed (Fig. 9b) and reflected a potent dysregulation of myeloid cell differentiation associated MDS (Fig. 3). In combined GSK-3 + GSK-3a DKO LSK cells, sternness gene signatures were conjointly enriched with metabolic and cancer gene clusters (Fig.9c) associated with AML prognosis (Valk et al. , 2004; Wong et al. , 2008). Without being bound by theory, this suggests that GSK-3a deficiency contributes additively to metabolic alterations not seen in GSK-3 deletion alone. Although, these patterns of variation in gene signatures are shared between GSK-3a KO and GSK-3 KO (Fig. 9d-e) with presence of compensatory GSK-3 protein homologue levels (Fig.9f), the biological impact of each GSK-3 a and β deletion affects molecular networks in HSCs distinctively.
[00199] The canonical Wnt pathway was the most prevalent activated in GSK-3 KO and accordingly continued to be active in combined GSK-3 + a DKO cells (Fig. 8c) (Lane et al., 2010; Zhao et al., 2007). Up-regulation of β- catenin/Wnt gene targets, Axin 2, Lef-1 , c-Myc, CyclinDI (Fig. 8d) (Clevers and Nusse, 2012) correlated with enhanced β-catenin activity at protein level (Fig. 8e), along with progressive nuclear stabilization of β-catenin (Fig. 8f) in HSCs deleted for GSK-3 as well as GSK-3p + a DKO. Since Wnt/p-catenin
signaling manipulation alone does not alter dysplastic hematopoiesis (Kirstetter et al., 2006; Scheller et al., 2006), the transcriptome changes were further analyzed for additional cooperative pathways to Wnt signaling that may account for MDS to AML transition. Compared to WT or GSK-3a KO these analyses revealed that mTOR signaling, previously associated to myeloid disorders (Kalaitzidis et al., 2012; Magee et al., 2012; Yilmaz et al. , 2006), is enriched in GSK-3 KO, as well as GSK-3 + a DKO cells (Fig. 8g). This was accompanied with up-regulation of oncogenic gene targets associated to hematological diseases such as Jak2, Tcf4, Cebpa (Fig.8h). To broadly test the relevance of these transcriptome changes, mTOR kinase activity (Recher et al., 2005; Yilmaz et al., 2006) was inhibited by rapamycin in GSK-3 KO and GSK-3ap DKO cells that resulted in a significant reduction, albeit mild, of total CFU-C for GSK-3 KO cells, but had no effect on progenitor output of GSK-3a DKO BM cells (Fig. 8i). The aberrant distribution of erythro-myeloid colony types derived from either GSK-3 KO or αβ DKO cells, and observed in untreated conditions, was not altered by rapamycin treatment (Fig. 9g). This suggests that mTOR complex inhibition cannot solely override GSK3 BM deletion phenotype. To further characterize mTOR signaling along the PI3K/AKT pathway, additional pharmacological inhibitors were employed that perturb various stages of the pathway (illustrated in Fig. 8j). Inhibition of the PI3K/AKT/mTOR signaling effectively reduced progenitors from either GSK-3 KO or GSK-3a DKO in presence of pan-PI3K inhibitor (Wortmannin), which could be exacerbated with the inhibition of the S6K (LY2584702), a critical downstream effector of mTOR signal transduction (Fig. 8j). This involvement of PI3K/AKT/mTOR axis is also corroborated by the stimulation of downstream gene targets by signal transducers such APC/MYC in GSK-3r3 KO and STAT-5 in αβ DKO cells (Fig.8k), previously associated with impaired hematopoietic differentiation (Bar-Natan et al., 2012; Lane et al., 2010) and in parallel with upregulation of Akt/PI3K pathway (Fig.8l) due to the progressive accumulation of activated
in both GSK-3 KO and αβ DKO (Fig. 8m). These results

underscore the importance of the direct role of mTOR and PI3K/AKT arising from GSK-3a/ deletion that contributes to MDS and AML disease.
[00200] Consistent with Wnt/AKT/mTOR pathway involvement in metabolic processes (Cheng et al., 2014; Esen et al., 2013), distinct patterns of glycolysis and oxidative phosphorylation gene signatures were observed that might explain the functional discrepancy between the onset of MDS and AML based on the contribution of Gsk3 α/β allelic dosage (Fig. 8n). An analysis of the energetic status of Lin" BM cells show a gradual decrease of in vitro resting metabolic activity, measured by oxygen consumption (OCR) and extra-cellular acidification rates (ECAR), by loss of GSK-3 and αβ (Fig. 8o) that might be explained by mitochondrial dysregulation as suggested by gene signatures driven by Gsk3 a KO (Fig. 9a). GSK-3 KO and GSK-3 + a DKO cells show differential responses to mitochondrial stress with respect to WT, with the greatest effect when GSK-3a is deleted in GSK-3 deficient HSCs (Fig. 8p). Spare respiratory capacity, a measure of the mitochondria's ability to provide additional ATP-derived energy in response to stress, is significantly lost in both MDS and AML phenotypes represented by Gsk3$ KO and Gs/ 3 + a DKO cells (Fig.8q). These results are consistent with observations reporting that inactivation of GSK-3 activity decreases the contribution of OCRs to metabolic activity (Kim et al., 2010). While little is understood about the role of mitochondrial function towards AML initiation and progression, the observations in GSK-3 +a DKO BM cells are similar to human AML patients that present with decreased spare respiratory capacity (Sriskanthadevan et al., 2015). The findings indicate that GSK-3a has no biological impact on hematopoiesis, but deletion of this GSK-3 isoform contributes and is necessary to an altered state of metabolism and related cell cycle for evolution of MDS to AML disease in the absence GSK3 in HSCs.
Molecular Signature of GSK-33 deficient HSCs predicts outcomes of human MPS
[00201 ] Human patients with MDS encompass a heterogeneous group with distinct hematological features evident in the multiple revisions of their WHO classification into different MDS subtypes, and in the challenges presented by efforts towards early diagnosis (Cazzola et al., 2013; Garcia- Manero, 2014; Natelson and Pyatt, 2013). Understanding and applying results from early molecular pathogenesis is now critical to improve prediction of MDS patients' prognosis (Jonas and Greenberg, 2015). Based on hematopathologic resemblance of mouse GSK-3p-null MDS phenotype to clinically classified human patients, comparative human-mouse genome expression profiling was applied among murine Gsk3fi deficient and normal human (non-MDS and non-AML), along with profiles of diseased patients hematopoietic cells (Mills et al. , 2009). These analyses uncovered molecular similarity of GSK-3p-null transcriptome to human MDS and MDS/myeloproliferative neoplasm (MDS/MPN) patients' BM, which included human MDS subclasses (MDS-HR, high-risk: RAEB-1 and -2, MDS-LR, low- risk: RA and RARS and 5q deletion syndrome) as well as chronic myelomonocytic leukemia (CMML), an MDS/MPN overlap syndrome with potential risk to transform into AML (Itzykson and Solary, 2013; Parikh and Tefferi, 2012; Tiu and Sekeres, 2014) (Fig. 10a). This similarity was also supported by a dysregulated epigenomic profile, where both DNA methylation (DNMT3A) (Walter et al. , 201 1 ) and chromatin modification (EZH2) (Nikoloski et al., 2010) gene targets were disrupted upon deletion of GSK-3p (Fig.1 1 a), and found to be sustained by the lack of transcriptionally repressive marks on histone H3 (H3K27me3) (Fig. 1 1 b). These same defective gene signatures are similar to epigenomic alterations recently observed in human MDS patients (Cheng et al., 2013; Huang et al., 201 1 ; Issa, 2013; Jeong et al. , 2014; Lindsley and Ebert, 2013), suggesting molecular surrogacy of this mouse model to human MDS disease.
[00202] Differential transcriptome analysis was next performed to patient specific human MDS gene expression and their AML/survival outcomes. Despite the recent attempts to stratify AML patients by identifying specific molecular gene signatures (Eppert et al., 201 1 ; Shivarov and Bullinger, 2014), similar approaches have yet to be extended to MDS. A specific GSK-3 molecular signature was defined using a systematic approach based on the transcriptome comparison between WT vs. Gsk3$ KO LSK cells from those genes with greater than 1 .5 fold-change (FC) in whole gene expression with p value < 0.05 (~ 1000 genes). This subset of genes was further filtered to yield a "GSK-3 signature" based on an FC > 5 (with p-value < 0.05) that would allow a reasonable number of genes, totaling 63 (Fig.10b and Table 5) to be credibly applied to transcriptome comparisons and survival outcomes in patients. Gene ontology (GO) analysis of these 63 genes comprising the GSK-3 signature revealed an enrichment for cell adhesion molecules involved in immune response and chemotaxis (Table 6). Mapping functional protein association networks through the STRING protein interactions database revealed 33 significant interactions (p-value = 3.76x10"8) within the 63 gene products including those involved in immune response (Fig. 1 1 c and Table 3). These observations are consistent with previous clinical reports proposing that immune dysregulation acts as an early sign of pathophysiologic abnormality in MDS (Billstrom et al., 1995; Marisavljevic et al., 2006; Warlick and Miller, 201 1 ). Importantly, GSK-3p signature allowed for molecular discrimination among MDS, CMML and AML patient transcriptomes (Fig. 10c). Based on these findings, the clinical relevance of the GSK-3 signature was tested using two clinically annotated profiles from adult (Sridhar et al., 2009) and pediatric MDS (p-MDS) (Bresolin et al. , 2012) cohort studies with retrieved patient information and clinical annotations, together with published matching gene expression profiles. Hierarchical clustering analysis allowed for unique segregation of adult and pediatric patients based on their MDS subtype using the GSK-3 differential transcriptome and signature (Fig.
10d and e), suggesting the GSK-3 signature may have the potential to serve as a diagnostic biomarker.
[00203] Since p-MDS compared to adult MDS offers a unique opportunity to retrospectively study long-term clinical survival outcomes (Hasle et al., 2004; Hasle and Niemeyer, 201 1 ), the prognostic aptitude of GSK-3 differential transcriptome and molecular signature on pediatric MDS patients followed-up over an average period of 4.4 years (0.4-9.5 years) was further tested. Independent of the molecular results, using WHO subtyping (Hasle et al., 2003), this cohort of 32 p-MDS patients could be divided into a low risk-group that involved refractory cytopenia of childhood (RCC) subtype, and a high-risk group that comprised the other WHO subtypes of p-MDS. Expectedly, the low-risk group had a better progression free survival (PFS) (p=0.00198) (Fig. 1 1 d). When applying the GSK-3 molecular signature as a prognostic marker, irrespective of the WHO subtype for the PFS of these patients, this cohort could be divided into two additionally distinct risk groups (p=0.00634) and (p=0.0224), respectively (Fig. 1 1 e). Emphasizing the most detrimental end-point of this disease, AML evolution, the two risk groups based on WHO subtype continued to show two different outcomes (p=0.00246) (Fig.10f). Two patients were excluded due to lack of detailed follow-up data (Table 4). Applying the same stratification strategy with GSK- 3β molecular signature and differential transcriptome, results continued to show two distinctive groups with statistically significant results for AML transformation prediction (p=0.0044) and (p=0.00541 ), respectively (Fig. 10g and Fig. 1 1f). The application of the GSK-3 signature had nearly identical ability to risk-stratify human p-MDS patients, validating the prognostic capacity of the murine model of MDS.
[00204] Although prognostic systems like the International Prognostic Scoring System (IPSS) have been validated in adult MDS patients (Greenberg et al., 1997), the IPSS has failed to show prognostic value in p- MDS (Hasle et al. , 2004). Accordingly, the GSK-3p signature was combined
with the current WHO classification of p-MDS. Using this combined modeling, the patients could be divided into three risk groups: low, intermediate and high-risk with regards to AML transformation probability (p=0.00212) (Fig. 10h). Patients were labeled low-risk if they had low cut-off GSK-3 signature and low-risk WHO subtype. High-risk patients are the ones who had high cutoff GSK-3 signature and were defined as high-risk based on WHO classification. If a patient had either a significant GSK-3 signature or met the high-risk definition of WHO classification, he or she was labeled an intermediate-risk. This combined model was able to further risk-stratify our p- MDS cohort and provided valuable prognostic information by suggesting a third risk group, which is the intermediate-risk. These definitions for each risk group and especially the low-risk allowed an estimation of a lower probability for the low-risk group to evolve to AML using the GSK-3 -WHO combined model (1/12) in comparison to only using the WHO classification (3/16) by around 10% (Fig. 10f and h). It is proposed that this increased precision of risk groups provides valuable information for more refined treatment planning in human MDS. An expanded use of this combined WHO and GSK-3 signature for larger cohorts in both pediatric and adult MDS patients is warranted towards improved patient management and risk stratification.
DISCUSSION
[00205] Although it is widely accepted that genetic lesions identified in cancers play a major role in neoplasias (Alexandrov et al., 2013), evidence for mutations that initiate, drive or sustain human cancer is uncertain. For human MDS, the majority of genetic alterations have not been causally correlated to disease initiation, and seem to require dysregulated proliferative and survival pathways to perpetuate pre-leukemic disease for subsequent transition into AML (Zhang et al., 2015). It is proposed that stepwise allelic deficiency of GSK-3, a central integrative mediator of mitogenic/morphogenic signals, is sufficient for MDS disease initiation (β allele) and AML transformation (combined a and β alleles) as depicted in Fig. 6. Without being bound by
theory, the findings described herein suggest the pathways tightly regulated by GSK-3 are critical for evolution of MDS from healthy HSCs that allow a state for additional insults, such as loss of GSK-3a, to lead to AML. Upon GSK3 deficiency, the study implicates an inter-relationship with the mTOR/AKT/PI3K pathways during MDS/AML progression not reported to date. Effects of GSK-3 deficiency to induce MDS was unique to HSCs and not progenitors and allowed emergence of MDS-IC capacity. These findings are consistent with recent reports indicating that a specific pre-leukemic stem cell subset of human MDS from low to intermediate risk patients originates from the HSC compartment (Pang et al., 2013; Schanz et al., 2012; Tehranchi et al., 2010; Woll et al., 2014).
[00206] Despite sharing similar sequences, it is found that the role of GSK-3 is molecularly different from Gsk3a in hematopoiesis, correlating with distinct HSC transcriptomes. Notably, increase of GSK-3a protein levels in GSK-3 -deficient BM cells did not compensate or "rescue" the effects responsible of the observed MDS state. This is in contrast to previous reports showing functional redundancy between GSK-3a and β alleles in embryonic and hematopoietic development (Doble et al., 2007; Huang et al., 2009; Itoh et al., 2012). This discrepancy is likely due to fundamental differences between fetal and adult somatic HSCs revealed in this study, and is consistent with the idea that properties of HSCs change during ontogeny (Babovic and Eaves, 2014). Recent evidence suggests that this switch is orchestrated by a concordant change in the level of expression in HSCs of Pten and Cebpa (Ye et al. , 2013; Zhang et al., 2006). Both Pten and Cebpa, which play a crucial role in regulating the Akt/mTOR pathway, survival and quiescence of HSCs (Kharas et al., 2010), were dysregulated in
 deficient adult LSK fractions that develop MDS. Consequently, GSK3 deletion in the fetal LSK fraction (Huang et al., 2009) might not affect fetal HSCs due to the lack of involvement of Akt/mTOR/Wnt signaling axis. More importantly, it is uniquely revealed herein that the GSK3 -null myelodysplastic
state acquires sternness properties and dysregulated myeloid differentiation programs that are exacerbated upon additional Gsk3a deletion inducing a metabolic alteration specific to AML onset driven by GSK3 -null HSCs.
deficient adult LSK fractions that develop MDS. Consequently, GSK3 deletion in the fetal LSK fraction (Huang et al., 2009) might not affect fetal HSCs due to the lack of involvement of Akt/mTOR/Wnt signaling axis. More importantly, it is uniquely revealed herein that the GSK3 -null myelodysplastic
state acquires sternness properties and dysregulated myeloid differentiation programs that are exacerbated upon additional Gsk3a deletion inducing a metabolic alteration specific to AML onset driven by GSK3 -null HSCs.
[00207] Although previous mouse models have been found to be similar to MDS, transition of mouse MDS to AML, or any relationship to human MDS to AML evolution, has not been demonstrated. Using the GSK3 -null pre- leukemic gene signature, clinical outcomes of p-MDS patients were predicted. Without being bound by theory, it is suggested that a "combined GSK-3- WHO" risk stratification model will improve the probability to detect AML development (-10%) by discriminating the p-MDS cohort into three risk categories: Low, intermediate and high-risk. Although this analysis was performed on a small (n=32) but rare number of patients where survival and molecular gene expression profiles have been applied, it is believed that implementing this novel disease risk stratification approach will be crucial for better risk stratification of larger MDS patient cohorts. This is the first demonstration that a transcriptional phenotype of such pre-neoplastic state can allow risk stratification of MDS patients and may aid in early intervention by targeting molecular networks involved in the earliest stages of AML onset.
Example 2 In vitro deletion of the GSK-3P KO and GSK-3a + β DKO in highly enriched LSK BM cell lines allow the study of the molecular features for disease onset
[00208] In order to understand the transition steps driving MDS and/or AML onset, an in vitro deletion system was developed (Figure 13). Bone marrow cells were extracted from WT, Gsk3 (flx/flx) and

(flx/flx) mice, homogenized and Lineage depleted. Then, freshly isolated 1 .5 x 106 cells were incubated in 6-well-plate culture dishes with Stem Span medium containing rm SCF (100ng/mL), rm IL-3 (10ng/mL) and rh IL-6 (10ng/mL) (StemCell Technologies) for 6 days. Fresh medium was added every 2 days. At day 7, cells were treated with 4-OH-Tamoxifen
(SigmaAldrich) at 5 μΜ for 24 hours. Media were replaced with fresh one and incubated cells for molecular analysis for another 5-7 days post-treatment (A).
[00209] At Day 7, the percentage of LSK cells is robustly increased, allowing the study and targeting of this purified population along the progression to MDS or AML (B). As observed by PCR or western blot analysis, effective silencing took place after in vitro Tamoxifen treatment (C and D). Interestingly, Cyclin D1 expression (Ccndl) is increased in Gsk3p KO and Gsk3a + β DKO cells which resembles the in vivo data. Collectively, the in vitro model presented shows a suitable way to study the HSC transition from healthy state to MDS to AML.
[00210] Different embodiments of the disclosure have been shown by the above examples. Those skilled in the art could develop alternatives to the methods mentioned above that are within the scope of the disclosure and defined claims.


REFERENCES:
Abrahamsson, A. E., Geron, I ., Gotlib, J. , Dao, K. H., Barroga, C. F., Newton, I. G., Giles, F. J., Durocher, J., Creusot, R. S., Karimi, M., et al. (2009). Glycogen synthase kinase 3beta missplicing contributes to leukemia stem cell generation. Proc Natl Acad Sci U S A 106, 3925-3929.
Ades, L, Itzykson, R., and Fenaux, P. (2014). Myelodysplasia syndromes. Lancet.
Alexandrov, L. B., Nik-Zainal, S., Wedge, D. C , Aparicio, S. A., Behjati, S., Biankin, A. V., Bignell, G. R., Bolli, N., Borg, A. , Borresen-Dale, A. L, et al. (2013). Signatures of mutational processes in human cancer. Nature 500, 415-421 .
Andersson, E. R. , Sandberg, R., and Lendahl, U. (201 1 ). Notch signaling: simplicity in design, versatility in function. Development 138, 3593-3612.
Anzalone, C. L, and Cohen, P. R. (2013). Acute febrile neutrophilic dermatosis (Sweet's syndrome). Curr Opin Hematol 20, 26-35.
Babovic, S., and Eaves, C. J. (2014). Hierarchical organization of fetal and adult hematopoietic stem cells. Exp Cell Res 329, 185-191 .
Banerji, V., Frumm, S. M. , Ross, K. N., Li, L. S., Schinzel, A. C, Hahn, C. K., Kakoza, R. M., Chow, K. T., Ross, L, Alexe, G., et al. (2012). The intersection of genetic and chemical genomic screens identifies GSK-3alpha as a target in human acute myeloid leukemia. J Clin Invest 122, 935-947.
Bar-Natan, M. , Nelson, E. A., Xiang, M. , and Frank, D. A. (2012). STAT signaling in the pathogenesis and treatment of myeloid malignancies. JAKSTAT 1 , 55-64.
Bejar, R. , and Steensma, D. P. (2014). Recent developments in myelodysplastic syndromes. Blood 124, 2793-2803.
Beurlet, S., Chomienne, C, and Padua, R. A. (2013). Engineering mouse models with myelodysplastic syndrome human candidate genes; how relevant are they? Haematologica 98, 10-22.
Bhattacharya, D., Rossi, D. J. , Bryder, D., and Weissman, I. L. (2006). Purified hematopoietic stem cell engraftment of rare niches corrects severe lymphoid deficiencies without host conditioning. J Exp Med 203, 73- 85.
Billstrom, R. , Johansson, H., Johansson, B., and Mitelman, F. (1995). Immune-mediated complications in patients with myelodysplastic syndromes- clinical and cytogenetic features. Eur J Haematol 55, 42-48.
Bowman, T. V., Merchant, A. A., and Goodell, M. A. (2007). Molecular profiling of
hematopoietic stem cells. Methods Mol Med 134, 1 -16.
Bresolin, S., Trentin, L, Zecca, M., Giordan, M., Sainati, L, Locatelli, F. , Basso, G., and te Kronnie, G. (2012). Gene expression signatures of pediatric myelodysplastic syndromes are associated with risk of evolution into acute myeloid leukemia. Leukemia 26, 1717-1719.
Briscoe, J., and Therond, P. P. (2013). The mechanisms of Hedgehog signalling and its roles in development and disease. Nat Rev Mol Cell Biol 14, 416-429.
Cazzola, M. (201 1 ). Risk assessment in myelodysplastic syndromes and myelodysplastic/myeloproliferative neoplasms. Haematologica 96, 349-352.
Cazzola, M. , Delia Porta, M. G., and Malcovati, L. (2013). The genetic basis of myelodysplasia and its clinical relevance. Blood 122, 4021 -4034.
Challen, G. A., Boles, N. C, Chambers, S. M. , and Goodell, M. A. (2010). Distinct hematopoietic stem cell subtypes are differentially regulated by TGF- betal . Cell Stem Cell 6, 265-278.
Chao, M. P., Seita, J., and Weissman, I. L. (2008). Establishment of a normal hematopoietic and leukemia stem cell hierarchy. Cold Spring Harb Symp Quant Biol 73, 439-449.
Cheng, J. X. , Anastasi, J., Watanabe, K., Kleinbrink, E. L, Grimley, E., Knibbs, R., Shen, Q. J., and Vardiman, J. W. (2013). Genome-wide profiling reveals epigenetic inactivation of the PU.1 pathway by histone H3 lysine 27 trimethylation in cytogenetically normal myelodysplastic syndrome. Leukemia 27, 1291 -1300.
Cheng, S. C, Quintin, J., Cramer, R. A., Shepardson, K. M., Saeed, S. , Kumar, V., Giamarellos-Bourboulis, E. J., Martens, J. H., Rao, N. A., Aghajanirefah, A., et al. (2014). mTOR- and HIF-1 alpha-mediated aerobic glycolysis as metabolic basis for trained immunity. Science 345, 1250684.
Clevers, H., and Nusse, R. (2012). Wnt/beta-catenin signaling and disease. Cell 149, 1 192-1205.
Corey, S. J. , Minden, M. D., Barber, D. L, Kantarjian, H., Wang, J. C, and Schimmer, A. D. (2007). Myelodysplastic syndromes: the complexity of stem- cell diseases. Nat Rev Cancer 7, 1 18-129.
Doble, B. W., Patel, S., Wood, G. A. , Kockeritz, L. K., and Woodgett, J. R. (2007). Functional redundancy of GSK-3alpha and GSK-3beta in Wnt/beta- catenin signaling shown by using an allelic series of embryonic stem cell lines. Dev Cell 12, 957-971.
Eppert, K., Takenaka, K., Lechman, E. R., Waldron, L, Nilsson, B., van Galen, P., Metzeler, K. H. , Poeppl, A., Ling, V., Beyene, J., et al. (201 1 ). Stem cell gene expression programs influence clinical outcome in human leukemia. Nat Med 17, 1086-1093.
Esen, E., Chen, J., Karner, C. M., Okunade, A. L , Patterson, B. W., and Long, F. (2013). WNT-LRP5 signaling induces Warburg effect through mTORC2 activation during osteoblast differentiation. Cell Metab 17, 745-755.
Gan, B., Sahin, E., Jiang, S., Sanchez-Aguilera, A., Scott, K. L., Chin, L., Williams, D. A., Kwiatkowski, D. J., and DePinho, R. A. (2008). mTORCI - dependent and -independent regulation of stem cell renewal, differentiation, and mobilization. Proc Natl Acad Sci U S A 105, 19384-19389.
Garcia-Manero, G. (2010). Prognosis of myelodysplastic syndromes. Hematology Am Soc Hematol Educ Program 2010, 330-337.
Garcia-Manero, G. (2014). Myelodysplastic syndromes: 2014 update on diagnosis, risk-stratification, and management. Am J Hematol 89, 97-108.
Gillespie, J. R., Ulici, V., Dupuis, H., Higgs, A., Dimattia, A., Patel, S., Woodgett, J. R., and Beier, F. (201 1 ). Deletion of glycogen synthase kinase- 3beta in cartilage results in up-regulation of glycogen synthase kinase-3alpha protein expression. Endocrinology 152, 1755-Ί 766.
Greenberg, P. , Cox, C , LeBeau, M. M., Fenaux, P., Morel, P., Sanz, G. , Sanz, M., Vallespi, T., Hamblin, T., Oscier, D., et al. (1997). International scoring system for evaluating prognosis in myelodysplastic syndromes. Blood 89, 2079-2088.
Hasle, H., Baumann, I., Bergstrasser, E., Fenu, S., Fischer, A. , Kardos, G. , Kerndrup, G., Locatelli, F., Rogge, T., Schultz, K. R., et al. (2004). The International Prognostic Scoring System (IPSS) for childhood myelodysplastic syndrome (MDS) and juvenile myelomonocytic leukemia (JMML). Leukemia 18, 2008-2014.
Hasle, H., and Niemeyer, C. M. (201 1 ). Advances in the prognostication and management of advanced MDS in children. Br J Haematol 154, 185-195.
Hasle, H. , Niemeyer, C. M., Chessells, J. M., Baumann, I., Bennett, J. M. , Kerndrup, G., and Head, D. R. (2003). A pediatric approach to the WHO classification of myelodysplastic and myeloproliferative diseases. Leukemia 17, 277-282.
Huang, G., Zhao, X., Wang, L , Elf, S., Xu, H., Sashida, G., Zhang, Y. , Liu, Y., Lee, J. , Menendez, S., et al. (201 1 ). The ability of MLL to bind RUNX1 and
methylate H3K4 at PU.1 regulatory regions is impaired by MDS/AML- associated RUNX1 /AML1 mutations. Blood 1 18, 6544-6552.
Huang, J., Zhang, Y. , Bersenev, A., O'Brien, W. T., Tong, W., Emerson, S. G., and Klein, P. S. (2009). Pivotal role for glycogen synthase kinase-3 in hematopoietic stem cell homeostasis in mice. J Clin Invest 1 19, 3519-3529.
Issa, J. P. (2013). The myelodysplastic syndrome as a prototypical epigenetic disease. Blood 121 , 381 1 -3817.
Itoh, S., Saito, T., Hirata, M., Ushita, M. , Ikeda, T., Woodgett, J. R., Algul, H. , Schmid, R. M., Chung, U. I., and Kawaguchi, H. (2012). GSK-3alpha and GSK-3beta proteins are involved in early stages of chondrocyte differentiation with functional redundancy through RelA protein phosphorylation. J Biol Chem 287, 29227-29236.
Itzykson, R., and Solary, E. (2013). An evolutionary perspective on chronic myelomonocytic leukemia. Leukemia 27, 1441 -1450.
Jeong, M., Sun, D., Luo, M., Huang, Y., Challen, G. A., Rodriguez, B., Zhang, X. , Chavez, L, Wang, H. , Hannah, R., et al. (2014). Large conserved domains of low DNA methylation maintained by Dnmt3a. Nat Genet 46, 17-23.
Jonas, B. A. , and Greenberg, P. L. (2015). MDS prognostic scoring systems - Past, present, and future. Best Pract Res Clin Haematol 28, 3-13.
Kalaitzidis, D., Sykes, S. M., Wang, Z., Punt, N., Tang, Y., Ragu, C, Sinha, A. U., Lane, S. W., Souza, A. L, Clish, C. B., et al. (2012). mTOR complex 1 plays critical roles in hematopoiesis and Pten-loss-evoked leukemogenesis. Cell Stem Cell 1 1 , 429-439.
Kelly, K. F. , Ng, D. Y., Jayakumaran, G., Wood, G. A., Koide, H., and Doble, B. W. (201 1 ). beta-catenin enhances Oct-4 activity and reinforces pluripotency through a TCF-independent mechanism. Cell Stem Cell 8, 214- 227.
Kharas, M. G., Okabe, R., Ganis, J. J., Gozo, M., Khandan, T., Paktinat, M. , Gilliland, D. G., and Gritsman, K. (2010). Constitutively active AKT depletes hematopoietic stem cells and induces leukemia in mice. Blood 1 15, 1406- 1415.
Kim, Y. M., Seo, Y. H., Park, C. B., Yoon, S. H., and Yoon, G. (2010). Roles of GSK3 in metabolic shift toward abnormal anabolism in cell senescence. Ann N Y Acad Sci 1201 , 65--71 .
Kirstetter, P., Anderson, K., Porse, B. T., Jacobsen, S. E. , and Nerlov, C. (2006). Activation of the canonical Wnt pathway leads to loss of hematopoietic stem cell repopulation and multilineage differentiation block. Nat Immunol 7, 1048-1056.
Kogan, S. C, Ward, J. M., Anver, M. R., Berman, J. J., Brayton, C, Cardiff, R. D., Carter, J. S., de Coronado, S., Downing, J. R., Fredrickson, T. N., et al. (2002). Bethesda proposals for classification of nonlymphoid hematopoietic neoplasms in mice. Blood 100, 238-245.
Kreso, A. , and Dick, J. E. (2014). Evolution of the cancer stem cell model. Cell Stem Cell 14, 275-291 .
Lane, S. W., Sykes, S. M., Al-Shahrour, F., Shterental, S., Paktinat, M. , Lo Celso, C , Jesneck, J. L, Ebert, B. L, Williams, D. A. , and Gilliland, D. G.
(2010). The Apc(min) mouse has altered hematopoietic stem cell function and provides a model for MPD/MDS. Blood 1 15, 3489-3497.
Larsson, C. A. , Cote, G. , and Quintas-Cardama, A. (2013). The changing mutational landscape of acute myeloid leukemia and myelodysplastic syndrome. Mol Cancer Res 1 1 , 815-827.
Lindsley, R. C , and Ebert, B. L. (2013). The biology and clinical impact of genetic lesions in myeloid malignancies. Blood 122, 3741 -3748.
Lobry, C, Ntziachristos, P. , Ndiaye-Lobry, D. , Oh, P., Cimmino, L, Zhu, N., Araldi, E., Hu, W., Freund, J., Abdel-Wahab, O., et al. (2013). Notch pathway activation targets AML-initiating cell homeostasis and differentiation. J Exp Med 210, 301 -319.
Magee, J. A., Ikenoue, T., Nakada, D., Lee, J. Y., Guan, K. L., and Morrison, S. J. (2012). Temporal changes in PTEN and mTORC2 regulation of hematopoietic stem cell self-renewal and leukemia suppression. Cell Stem Cell 1 1 , 415-428.
Marisavljevic, D. , Kraguljac, N., and Rolovic, Z. (2006). Immunologic abnormalities in myelodysplastic syndromes: clinical features and characteristics of the lymphoid population. Med Oncol 23, 385-391 .
Meacham, C. E., and Morrison, S. J. (2013). Tumour heterogeneity and cancer cell plasticity. Nature 501 , 328-337.
Mills, K. I ., Kohlmann, A., Williams, P. M., Wieczorek, L, Liu, W. M., Li, R. , Wei, W., Bowen, D. T., Loeffler, H., Hernandez, J. M., et al. (2009). Microarray-based classifiers and prognosis models identify subgroups with
distinct clinical outcomes and high risk of AML transformation of myelodysplastic syndrome. Blood 1 14, 1063-1072.
Natelson, E. A., and Pyatt, D. (2013). Acquired myelodysplasia or myelodysplastic syndrome: clearing the fog. Adv Hematol 2013, 309637.
Nikoloski, G., Langemeijer, S. M. , Kuiper, R. P., Knops, R. , Massop, M., Tonnissen, E. R., van der Heijden, A., Scheele, T. N., Vandenberghe, P., de Witte, T., et al. (2010). Somatic mutations of the histone methyltransferase gene EZH2 in myelodysplastic syndromes. Nat Genet 42, 665-667.
Nimer, S. D. (2008). MDS: a stem cell disorder-but what exactly is wrong with the primitive hematopoietic cells in this disease? Hematology Am Soc Hematol Educ Program, 43-51 .
Pandolfi, A., Barreyro, L, and Steidl, U. (2013). Concise review: preleukemic stem cells: molecular biology and clinical implications of the precursors to leukemia stem cells. Stem Cells Transl Med 2, 143-150.
Pang, W. W., Pluvinage, J. V., Price, E. A., Sridhar, K., Arber, D. A. , Greenberg, P. L , Schrier, S. L , Park, C. Y., and Weissman, I. L. (2013). Hematopoietic stem cell and progenitor cell mechanisms in myelodysplastic syndromes. Proc Natl Acad Sci U S A 1 10, 301 1 -3016.
Parikh, S. A., and Tefferi, A. (2012). Chronic myelomonocytic leukemia: 2012 update on diagnosis, risk stratification, and management. Am J Hematol 87, 610-619.
Passegue, E., Jamieson, C. H., Allies, L. E., and Weissman, I. L. (2003). Normal and leukemic hematopoiesis: are leukemias a stem cell disorder or a
reacquisition of stem cell characteristics? Proc Natl Acad Sci U S A 100 Suppl 1 , 1 1842-1 1849.
Qing, Y., Lin, Y., and Gerson, S. L. (2012). An intrinsic BM hematopoietic niche occupancy defect of HSC in scid mice facilitates exogenous HSC engraftment. Blood 1 19, 1768-1771 .
Recher, C, Beyne-Rauzy, O., Demur, C , Chicanne, G. , Dos Santos, C, Mas, V. M., Benzaquen, D., Laurent, G. , Huguet, F., and Payrastre, B. (2005). Antileukemic activity of rapamycin in acute myeloid leukemia. Blood 105, 2527-2534.
Rossi, L , Lin, K. K., Boles, N. C, Yang, L, King, K. Y., Jeong, M., Mayle, A. , and Goodell, M. A. (2012). Less is more: unveiling the functional core of hematopoietic stem cells through knockout mice. Cell Stem Cell 1 1 , 302-317.
Schanz, J., Tuchler, H., Sole, F. , Mallo, M., Luno, E., Cervera, J. , Granada, I., Hildebrandt, B., Slovak, M. L, Ohyashiki, K., et al. (2012). New comprehensive cytogenetic scoring system for primary myelodysplastic syndromes (MDS) and oligoblastic acute myeloid leukemia after MDS derived from an international database merge. J Clin Oncol 30, 820-829.
Scheller, M., Huelsken, J. , Rosenbauer, F., Taketo, M. M., Birchmeier, W., Tenen, D. G. , and Leutz, A. (2006). Hematopoietic stem cell and multilineage defects generated by constitutive beta-catenin activation. Nat Immunol 7, 1037-1047.
Shivarov, V. , and Bullinger, L. (2014). Expression profiling of leukemia patients: key lessons and future directions. Exp Hematol 42, 651 -660.
Shlush, L. I., and Minden, M. D. (2015). Preleukemia: the normal side of cancer. Curr Opin Hematol 22, 77-84.
Sridhar, K., Ross, D. T., Tibshirani, R., Butte, A. J., and Greenberg, P. L. (2009). Relationship of differential gene expression profiles in CD34+ myelodysplastic syndrome marrow cells to disease subtype and progression. Blood 1 14, 4847-4858.
Sriskanthadevan, S., Jeyaraju, D. V., Chung, T. E. , Prabha, S., Xu, W., Skrtic, M. , Jhas, B., Hurren, R., Gronda, M., Wang, X., et al. (2015). AML cells have low spare reserve capacity in their respiratory chain that renders them susceptible to oxidative metabolic stress. Blood.
Takahashi-Yanaga, F. (2013). Activator or inhibitor? GSK-3 as a new drug target. Biochem Pharmacol 86, 191 -199.
Takebe, N. , Harris, P. J. , Warren, R. Q., and Ivy, S. P. (201 1 ). Targeting cancer stem cells by inhibiting Wnt, Notch, and Hedgehog pathways. Nat Rev Clin Oncol 8, 97-106.
Tehranchi, R., Woll, P. S., Anderson, K., Buza-Vidas, N., Mizukami, T., Mead, A. J.,
Astrand-Grundstrom, I., Strombeck, B. , Horvat, A. , Ferry, H., et al. (2010). Persistent malignant stem cells in del(5q) myelodysplasia in remission. N Engl J Med 363, 1025-1037.
Tiu, R. V., and Sekeres, M. A. (2014). Making sense of the myelodysplastic/myeloproliferative neoplasms overlap syndromes. Curr Opin Hematol 21 , 131 -140.
Trowbridge, J. J., Xenocostas, A., Moon, R. T. , and Bhatia, M. (2006). Glycogen synthase kinase-3 is an in vivo regulator of hematopoietic stem cell repopulation. Nat Med 12, 89-98.
Valk, P. J., Verhaak, R. G., Beijen, M. A., Erpelinck, C. A., Barjesteh van Waalwijk van Doorn-Khosrovani, S., Boer, J. M., Beverloo, H. B., Moorhouse, M. J., van der Spek, P. J., Lowenberg, B., and Delwel, R. (2004). Prognostically useful gene-expression profiles in acute myeloid leukemia. N Engl J Med 350, 1617-1628.
Vardiman, J. W. (2010). The World Health Organization (WHO) classification of tumors of the hematopoietic and lymphoid tissues: an overview with emphasis on the myeloid neoplasms. Chem Biol Interact 184, 16-20.
Vardiman, J. W., Thiele, J., Arber, D. A., Brunning, R. D., Borowitz, M. J. , Porwit, A., Harris, N. L, Le Beau, M. M., Hellstrom-Lindberg, E., Tefferi, A. , and Bloomfield, C. D. (2009). The 2008 revision of the World Health Organization (WHO) classification of myeloid neoplasms and acute leukemia: rationale and important changes. Blood 1 14, 937-951 .
Wada, A. (2009). GSK-3 inhibitors and insulin receptor signaling in health, disease, and therapeutics. Front Biosci 14, 1558-1570.
Walter, M. J., Ding, L, Shen, D., Shao, J., Grillot, M. , McLellan, M., Fulton, R. , Schmidt, H.,
Kalicki-Veizer, J., O'Laughlin, M., et al. (201 1 ). Recurrent DNMT3A mutations in patients with myelodysplastic syndromes. Leukemia 25, 1 153-1 158.
Wang, Y., Krivtsov, A. V., Sinha, A. U., North, T. E., Goessling, W., Feng, Z., Zon, L. I., and Armstrong, S. A. (2010). The Wnt/beta-catenin pathway is required for the development of leukemia stem cells in AML. Science 327, 1650-1653.
Wang, Z., Smith, K. S., Murphy, M. , Piloto, O., Somervaille, T. C , and Cleary, M. L. (2008). Glycogen synthase kinase 3 in MLL leukaemia maintenance and targeted therapy. Nature 455, 1205-1209.
Warlick, E. D., and Miller, J. S. (201 1 ). Myelodysplastic syndromes: the role of the immune system in pathogenesis. Leuk Lymphoma 52, 2045-2049.
Wirth, D., Gama-Norton, L., Riemer, P., Sandhu, U., Schucht, R. , and Hauser, H. (2007). Road to precision: recombinase-based targeting technologies for genome engineering. Curr Opin Biotechnol 18, 41 1 -419.
Woll, P. S., Kjallquist, U., Chowdhury, O., Doolittle, H., Wedge, D. C, Thongjuea, S., Erlandsson, R., Ngara, M., Anderson, K., Deng, Q., et al. (2014). Myelodysplastic syndromes are propagated by rare and distinct human cancer stem cells in vivo. Cancer Cell 25, 794-808.
Wong, D. J., Nuyten, D. S., Regev, A., Lin, M., Adler, A. S., Segal, E., van de Vijver, M. J. , and Chang, H. Y. (2008). Revealing targeted therapy for human cancer by gene module maps. Cancer Res 68, 369-378.
Wu, D., and Pan, W. (2010). GSK3: a multifaceted kinase in Wnt signaling. Trends Biochem Sci 35, 161 -168.
Ye, M., Zhang, H., Amabile, G., Yang, H., Staber, P. B., Zhang, P. , Levantini, E., Alberich-Jorda, M., Zhang, J., Kawasaki, A., and Tenen, D. G. (2013).
C/EBPa controls acquisition and maintenance of adult haematopoietic stem cell quiescence. Nat Cell Biol 15, 385-394.
Yilmaz, O. H., Valdez, R., Theisen, B. K., Guo, W., Ferguson, D. O., Wu, H. , and Morrison, S. J. (2006). Pten dependence distinguishes haematopoietic stem cells from leukaemia-initiating cells. Nature 441 , 475-482. Zhang, J., Grindley, J. C, Yin, T., Jayasinghe, S., He, X. C , Ross, J. T., Haug, J. S. , Rupp, D. , Porter- Westpfahl, K. S., Wiedemann, L. M., et al. (2006). PTEN maintains haematopoietic stem cells and acts in lineage choice and leukaemia prevention. Nature 441 , 518-522.
Zhang, L, Padron, E., and Lancet, J. (2015). The molecular basis and clinical significance of genetic mutations identified in myelodysplastic syndromes. Leuk Res 39, 6-17.
Zhao, C, Blum, J., Chen, A., Kwon, H. Y., Jung, S. H., Cook, J. M., Lagoo, A., and Reya, T. (2007). Loss of beta-catenin impairs the renewal of normal and CML stem cells in vivo. Cancer Cell 12, 528-541 .
Claims
1 . A method of detecting and/or screening for progression to AML or an increased likelihood of progression to AML, in a human subject having MDS, comprising:
determining a sample gene expression profile from a sample comprising DNA from said subject, said sample profile comprising:
(a) the gene expression level of at least 3, optionally at least 5, at least 10, at least 20, at least 30, at least 40, at least 50, at least 60, or all of the human orthologues of the genes listed in Table 5; and
(b) determining the level of similarity of said sample profile to one or more control profiles.
2. The method of claim 1 , wherein
(i) a high level of similarity of the sample profile to a high risk AML progression control profile; (ii) a low level of similarity to low risk AML progression control profile; and/or (iii) a higher level of similarity to a high risk AML progression control profile than to a low risk AML progression control profile indicates progression to AML or an increased likelihood of progression to AML.
3. The method of claim 2, wherein a higher level of similarity to a high risk AML progression control profile than to a low risk AML progression control profile is indicated by hierarchical clustering.
4. The method of claim 2, wherein a higher level of similarity to a high risk AML progression control profile than to a low risk AML progression control profile is indicated by a higher correlation value computed between the sample profile and the high risk AML progression control profile than an equivalent correlation value computed between the sample profile and the low
risk AML progression control profile, optionally wherein the correlation value is a correlation coefficient.
5. The method of claim 1 , wherein
(i) a low level of similarity of the sample profile to a high risk AML progression control profile; (ii) a high level of similarity to low risk AML progression control profile; and/or (iii) a lower level of similarity to a high risk AML progression control profile than to a low risk AML progression control profile indicates no progression to AML or an decreased likelihood of progression to AML.
6. The method of claim 5, wherein a lower level of similarity to a high risk AML progression control profile than to a low risk AML progression control profile is indicated by hierarchical clustering.
7. The method of claim 5, wherein a lower level of similarity to a high risk AML progression control profile than to a low risk AML progression control profile is indicated by a lower correlation value computed between the sample profile and the high risk AML progression control profile than an equivalent correlation value computed between the sample profile and the low risk AML progression control profile, optionally wherein the correlation value is a correlation coefficient.
8. The method of any one of claims 1 -7, further comprising identifying the WHO MDS subtype of the subject, wherein
(a) (i) a high level of similarity of the sample profile to a high risk AML progression control profile; (ii) a low level of similarity to low risk AML progression control profile and/or (iii) a higher level of similarity to a high risk AML progression control profile than to a low risk AML progression control profile; and
(b) a high risk WHO MDS subtype,
indicates a high risk of progression to AML, progression to AML, or an increased likelihood of progression to AML.
9. The method of any one of claims 1 -7, further comprising identifying the WHO MDS subtype of the subject, wherein
(a) (i) a low level of similarity of the sample profile to a high risk AML progression control profile; (ii) a high level of similarity to low risk AML progression control profile; and/or (iii) a lower level of similarity to a high risk AML progression control profile than to a low risk AML progression control profile indicates no progression to AML or an decreased likelihood of progression to AML; and
(b) a low risk WHO MDS subtype,
indicates a low risk of progression to AML, no progression to AML, or a decreased likelihood of progression to AML.
10. The method of any one of claims 1 -7, further comprising identifying the WHO MDS subtype of the subject, wherein
(a) (i) a high level of similarity of the sample profile to a high risk AML progression control profile; (ii) a low level of similarity to low risk AML progression control profile and/or (iii) a higher level of similarity to a high risk AML progression control profile than to a low risk AML progression control profile; and
(b) a low risk WHO MDS subtype,
or
(a) (i) a low level of similarity of the sample profile to a high risk AML progression control profile; (ii) a high level of similarity to low risk AML progression control profile; and/or (iii) a lower level of similarity to a high risk AML progression control profile than to a low risk AML progression control
profile indicates no progression to AML or an decreased likelihood of progression to AML; and
(b) a high risk WHO MDS subtype,
indicates an intermediate risk of progression to AML.
1 1 . The method of any one of claims 1 -10, wherein the subject identified as having progression to AML or an increased likelihood of progression to AML is treated with chemotherapy, radiation, stem cell transplantation and/or bone marrow transplantation.
12. A method of selecting a treatment for a subject with progression to AML or an increased likelihood of progression to AML, comprising:
(a) identifying the subject with progression to AML or an increased likelihood of progression to AML, according to the method of any one of claims 1 -1 1 ; and
(b) selecting a treatment for the subject, wherein the treatment comprises chemotherapy, radiation, stem cell transplantation and/or bone marrow transplantation.
13. A method of detecting and/or screening for myelodysplastic syndrome (MDS) or an increased likelihood of MDS, in a human subject, comprising: determining a sample gene expression profile from a sample comprising DNA from said subject, said sample profile comprising, consisting of, or consisting essentially of:
(a) the gene expression level of at least 3, optionally at least 5, at least 10, at least 20, at least 30, at least 40, at least 50, at least 60, or all of the human orthologues of the genes listed in Table 5; and
(b) determining the level of similarity of said sample profile to one or more control profiles, wherein (i) a high level of similarity of the sample profile
to an MDS specific control profile; (ii) a low level of similarity to a non-MDS control profile; and/or (iii) a higher level of similarity to an MDS specific control profile than to a non-MDS control profile indicates the presence of, or an increased likelihood of, MDS.
14. The method of claim 13, wherein a higher level of similarity to an MDS specific control profile than to a non-MDS control profile is indicated by hierarchical clustering.
15. The method of claim 13, wherein a higher level of similarity to an MDS specific control profile than to a non-MDS control profile is indicated by a higher correlation value computed between the sample profile and the MDS specific control profile than an equivalent correlation value computed between the sample profile and the non-MDS control profile, optionally wherein the correlation value is a correlation coefficient.
16. The method of any one of claims 1 -15, wherein the subject is a pediatric subject.
17. The method of any one of claims 1 -16, wherein determining the sample gene expression profile comprises the steps:
a) providing the sample comprising mRNA from the subject;
b) isolating mRNA from the sample;
c) amplifying the mRNA; and
d) determining the gene expression level of the at least 3 genes by means of RT-PCR.
18. The method of any one of claims 1 -17, wherein the sample is a clinical specimen.
19. The method of any one of claims 1 -17, wherein the sample is derived from blood and/or bone marrow.
20. A kit for detecting and/or screening for progression to AML or an increased likelihood of progression to AML, in a human subject having MDS, in a sample, comprising:
a) at least one detection agent for determining the gene expression level of at least 3, optionally at least 5, at least 10, at least 20, at least 30, at least 40, at least 50, at least 60, or all of the human orthologues of the genes listed in Table 5; and
b) instructions for use.
21 . A kit for detecting and/or screening for MDS or an increased likelihood of MDS in a sample from a human subject, comprising:
a) at least one detection agent for determining the gene expression level of at least 3, optionally at least 5, at least 10, at least 20, at least 30, at least 40, at least 50, at least 60, or all of the human orthologues of the genes listed in Table 5; and
b) instructions for use.
22. The kit according to claim 20 or 21 wherein the detection agents are probes and/or primers.
23. The kit according to any one of claims 20 to 22, further comprising, PCR reagents.
24. The kit according to any one of claims 20-23, further comprising a computer-readable medium that causes a computer to compare gene expression from a sample at the selected genes to one or more control
profiles and compute a correlation value between the sample and control profile.
25. A method of screening a test agent for treatment or prevention of myelodysplastic syndrome (MDS), comprising a) administering a test agent to i) a transgenic mouse model of MDS whose genome comprises a disruption of GSK-3p, ii) a tissue from said transgenic mouse model, or iii) a cell derived from said transgenic mouse model; and b) determining the effect of said test agent on the mouse model, tissue or cell, wherein a reduction of signs and/or symptoms of MDS in the mouse, tissue or cell identifies a test agent for the treatment or prevention of MDS.
26. The method of claim 25, wherein the disruption is a homozygous GSK- 3β knockout.
27. The method of claim 25 or 26, wherein the GSK-3p knock out is a conditional knockout of GSK-3p.
28. A method of screening a test agent for treatment or prevention of acute myeloid leukemia (AML), comprising a) administering a test agent to i) a transgenic mouse model of AML whose genome comprises a disruption of GSK-3a and a disruption of GSK-3p, ii) a tissue from said transgenic mouse model, or iii) a cell derived from said transgenic mouse model; and b) determining the effect of said agent on the mouse model, tissue or cell, wherein a reduction of signs and/or symptoms of AML in the mouse, tissue or cell identifies a test agent for the treatment or prevention of AML.
29. The method of claim 28, wherein the disruption of GSK-3a is a homozygous GSK-3a knockout and/or the disruption of GSK-3p is a homozygous GSK-3p knockout.
30. The method of claim 29, wherein the GSK-3a knockout is a conditional knockout of GSK-3a and/or the GSK-3p knock out is a conditional knockout of GSK-3p.
31 . A method of screening a test agent for treatment or prevention of myelodysplastic syndrome (MDS), comprising a) administering a test agent to a cell comprising a disruption of GSK-3p and b) determining the effect of said agent on the cell.
32. The method of claim 31 , wherein the disruption is a homozygous GSK- 3β knockout.
33. The method of claim 32, wherein the GSK-3p knock out is a conditional knockout of GSK-3p.
34. A method of screening a test agent for treatment or prevention of acute myeloid leukemia comprising a) administering a test agent to a cell comprising a disruption of GSK-3a and a disruption of GSK-3p and b) determining the effect of said agent on the cell.
35. The method of claim 32, wherein the disruption of GSK-3a is a homozygous GSK-3a knockout and/or the disruption of GSK-3p is a homozygous GSK-3p knockout.
36. The method of claim 25, wherein the GSK-3a knockout is a conditional knockout of GSK-3a and/or the GSK-3p knock out is a conditional knockout of GSK-3p.
37. The method of any one of claims 31 -36, wherein the cell is a human cell.
Applications Claiming Priority (2)
| Application Number | Priority Date | Filing Date | Title |
|---|---|---|---|
| US201662276496P | 2016-01-08 | 2016-01-08 | |
| US62/276,496 | 2016-01-08 |
Publications (1)
| Publication Number | Publication Date |
|---|---|
| WO2017117685A1 true WO2017117685A1 (en) | 2017-07-13 |
Family
ID=59273085
Family Applications (1)
| Application Number | Title | Priority Date | Filing Date |
|---|---|---|---|
| PCT/CA2017/050020 Ceased WO2017117685A1 (en) | 2016-01-08 | 2017-01-09 | Disease models and prognostic tools for pre-leukemia and leukemia |
Country Status (1)
| Country | Link |
|---|---|
| WO (1) | WO2017117685A1 (en) |
Cited By (1)
| Publication number | Priority date | Publication date | Assignee | Title |
|---|---|---|---|---|
| CN109657411A (en) * | 2019-01-18 | 2019-04-19 | 华东理工大学 | A kind of solvent deasphalting unit modeling and optimization method based on data-driven |
Citations (1)
| Publication number | Priority date | Publication date | Assignee | Title |
|---|---|---|---|---|
| US20050233330A1 (en) * | 2004-04-15 | 2005-10-20 | Fujisawa Pharmaceutical Co., Ltd. | Method for identifying myelodysplastic syndrome-specific genes |
-
2017
- 2017-01-09 WO PCT/CA2017/050020 patent/WO2017117685A1/en not_active Ceased
Patent Citations (1)
| Publication number | Priority date | Publication date | Assignee | Title |
|---|---|---|---|---|
| US20050233330A1 (en) * | 2004-04-15 | 2005-10-20 | Fujisawa Pharmaceutical Co., Ltd. | Method for identifying myelodysplastic syndrome-specific genes |
Non-Patent Citations (3)
| Title |
|---|
| BRESOLIN, S ET AL.: "Gene expression signatures of pediatric myelodysplastic syndromes are associated with risk of evolution into acute myeloid leukemia", LEUKEMIA, vol. 26, no. 7, July 2012 (2012-07-01), pages 1717 - 1719, XP055397806, ISSN: 08876924 * |
| MILLS, K.: "Microarray-based classifiers and prognosis models identify subgroups with distinct clinical outcomes and high risk of AML transformation of myelodysplastic syndrome", BLOOD, vol. 114, no. 5, 1 January 2009 (2009-01-01), pages 1063 - 1072, XP002658996, ISSN: 00064971 * |
| SRIDHAR, K.: "Relationship of differential gene expression profiles in CD 34+ myelodysplastic syndrome marrow cells to disease subtype and progression", BLOOD, vol. 114, no. 23, 26 November 2009 (2009-11-26), pages 4847 - 4858, XP055397809, ISSN: 00064971 * |
Cited By (1)
| Publication number | Priority date | Publication date | Assignee | Title |
|---|---|---|---|---|
| CN109657411A (en) * | 2019-01-18 | 2019-04-19 | 华东理工大学 | A kind of solvent deasphalting unit modeling and optimization method based on data-driven |
Similar Documents
| Publication | Publication Date | Title |
|---|---|---|
| Rodriguez-Meira et al. | Single-cell multi-omics identifies chronic inflammation as a driver of TP53-mutant leukemic evolution | |
| Guezguez et al. | GSK3 deficiencies in hematopoietic stem cells initiate pre-neoplastic state that is predictive of clinical outcomes of human acute leukemia | |
| Nagase et al. | Expression of mutant Asxl1 perturbs hematopoiesis and promotes susceptibility to leukemic transformation | |
| Ganuza et al. | The global clonal complexity of the murine blood system declines throughout life and after serial transplantation | |
| Celik et al. | Enforced differentiation of Dnmt3a-null bone marrow leads to failure with c-Kit mutations driving leukemic transformation | |
| Kirstetter et al. | Modeling of C/EBPα mutant acute myeloid leukemia reveals a common expression signature of committed myeloid leukemia-initiating cells | |
| Uni et al. | Modeling ASXL1 mutation revealed impaired hematopoiesis caused by derepression of p16Ink4a through aberrant PRC1-mediated histone modification | |
| King et al. | The ubiquitin ligase Huwe1 regulates the maintenance and lymphoid commitment of hematopoietic stem cells | |
| Wang et al. | Depletion of Sf3b1 impairs proliferative capacity of hematopoietic stem cells but is not sufficient to induce myelodysplasia | |
| Fang et al. | Asxl1 C-terminal mutation perturbs neutrophil differentiation in zebrafish | |
| Abbas et al. | Integrated genome-wide genotyping and gene expression profiling reveals BCL11B as a putative oncogene in acute myeloid leukemia with 14q32 aberrations | |
| JP2014507156A (en) | MYH10 as a novel diagnostic marker for pathology caused by RUNX1 inactivation | |
| WO2017049002A1 (en) | A humanized mouse model of de novo human acute myeloid leukemia with a matching human immune system | |
| Lai et al. | Cell fate decisions in malignant hematopoiesis: leukemia phenotype is determined by distinct functional domains of the MN1 oncogene | |
| WO2017117685A1 (en) | Disease models and prognostic tools for pre-leukemia and leukemia | |
| Hasapis et al. | Characterizing the role of Phlda3 in the development of acute toxicity and malignant transformation of hematopoietic cells induced by total-body irradiation in mice | |
| Yu et al. | RAG1 and RAG2 non-core regions are implicated in leukemogenesis and off-target V (D) J recombination in BCR-ABL1-driven B-cell lineage lymphoblastic leukemia | |
| El Bouchtaoui et al. | A constitutional activating MET mutation makes the genetic link between malignancies and chronic inflammatory diseases | |
| US20250382672A1 (en) | Method of detecting clonal haematopoiesis or cancer or performing antenatal screening and kits | |
| Li et al. | Loss of transcriptional factor Zbtb33 fails to induce clonal hematopoiesis in mice but plays a role in tumor immunity | |
| US20250388965A1 (en) | Methods and systems for processing cell-free samples | |
| Moding et al. | Stephanie Hasapis, Isibel Caraballo, Timothy J. Sears 3, Kennedy D. Brock, John B. Cart | |
| Rio-Machin et al. | PF213 THE GENETIC LANDSCAPE OF FAMILIAL MDS/AML; RECURRING MUTATIONS IN THE RNA HELICASE DHX34 LEADING TO DEFECTS IN NONSENSE-MEDIATED RNA DECAY | |
| Chaida et al. | RAS-mutant clones drive extramedullary acute myeloid leukemia | |
| Sun | Identification of new therapeutic targets and drug repositioning in myelodysplastic syndromes using transcriptional profiling and connectivity mapping |
Legal Events
| Date | Code | Title | Description |
|---|---|---|---|
| 121 | Ep: the epo has been informed by wipo that ep was designated in this application |
Ref document number: 17735795 Country of ref document: EP Kind code of ref document: A1 |
|
| NENP | Non-entry into the national phase |
Ref country code: DE |
|
| 122 | Ep: pct application non-entry in european phase |
Ref document number: 17735795 Country of ref document: EP Kind code of ref document: A1 |