WO2016168526A1 - Advanced tensor decompositions for computational assessment and prediction from data - Google Patents
Advanced tensor decompositions for computational assessment and prediction from data Download PDFInfo
- Publication number
- WO2016168526A1 WO2016168526A1 PCT/US2016/027642 US2016027642W WO2016168526A1 WO 2016168526 A1 WO2016168526 A1 WO 2016168526A1 US 2016027642 W US2016027642 W US 2016027642W WO 2016168526 A1 WO2016168526 A1 WO 2016168526A1
- Authority
- WO
- WIPO (PCT)
- Prior art keywords
- tensors
- tensor
- subject
- gsvd
- matrices
- Prior art date
- Legal status (The legal status is an assumption and is not a legal conclusion. Google has not performed a legal analysis and makes no representation as to the accuracy of the status listed.)
- Ceased
Links
Classifications
-
- G—PHYSICS
- G16—INFORMATION AND COMMUNICATION TECHNOLOGY [ICT] SPECIALLY ADAPTED FOR SPECIFIC APPLICATION FIELDS
- G16H—HEALTHCARE INFORMATICS, i.e. INFORMATION AND COMMUNICATION TECHNOLOGY [ICT] SPECIALLY ADAPTED FOR THE HANDLING OR PROCESSING OF MEDICAL OR HEALTHCARE DATA
- G16H50/00—ICT specially adapted for medical diagnosis, medical simulation or medical data mining; ICT specially adapted for detecting, monitoring or modelling epidemics or pandemics
- G16H50/20—ICT specially adapted for medical diagnosis, medical simulation or medical data mining; ICT specially adapted for detecting, monitoring or modelling epidemics or pandemics for computer-aided diagnosis, e.g. based on medical expert systems
-
- G—PHYSICS
- G01—MEASURING; TESTING
- G01N—INVESTIGATING OR ANALYSING MATERIALS BY DETERMINING THEIR CHEMICAL OR PHYSICAL PROPERTIES
- G01N33/00—Investigating or analysing materials by specific methods not covered by groups G01N1/00 - G01N31/00
- G01N33/48—Biological material, e.g. blood, urine; Haemocytometers
- G01N33/50—Chemical analysis of biological material, e.g. blood, urine; Testing involving biospecific ligand binding methods; Immunological testing
- G01N33/53—Immunoassay; Biospecific binding assay; Materials therefor
- G01N33/575—Immunoassay; Biospecific binding assay; Materials therefor for cancer
- G01N33/57545—Immunoassay; Biospecific binding assay; Materials therefor for cancer of the ovaries
-
- G—PHYSICS
- G16—INFORMATION AND COMMUNICATION TECHNOLOGY [ICT] SPECIALLY ADAPTED FOR SPECIFIC APPLICATION FIELDS
- G16B—BIOINFORMATICS, i.e. INFORMATION AND COMMUNICATION TECHNOLOGY [ICT] SPECIALLY ADAPTED FOR GENETIC OR PROTEIN-RELATED DATA PROCESSING IN COMPUTATIONAL MOLECULAR BIOLOGY
- G16B20/00—ICT specially adapted for functional genomics or proteomics, e.g. genotype-phenotype associations
-
- G—PHYSICS
- G16—INFORMATION AND COMMUNICATION TECHNOLOGY [ICT] SPECIALLY ADAPTED FOR SPECIFIC APPLICATION FIELDS
- G16B—BIOINFORMATICS, i.e. INFORMATION AND COMMUNICATION TECHNOLOGY [ICT] SPECIALLY ADAPTED FOR GENETIC OR PROTEIN-RELATED DATA PROCESSING IN COMPUTATIONAL MOLECULAR BIOLOGY
- G16B20/00—ICT specially adapted for functional genomics or proteomics, e.g. genotype-phenotype associations
- G16B20/10—Ploidy or copy number detection
-
- G—PHYSICS
- G16—INFORMATION AND COMMUNICATION TECHNOLOGY [ICT] SPECIALLY ADAPTED FOR SPECIFIC APPLICATION FIELDS
- G16B—BIOINFORMATICS, i.e. INFORMATION AND COMMUNICATION TECHNOLOGY [ICT] SPECIALLY ADAPTED FOR GENETIC OR PROTEIN-RELATED DATA PROCESSING IN COMPUTATIONAL MOLECULAR BIOLOGY
- G16B25/00—ICT specially adapted for hybridisation; ICT specially adapted for gene or protein expression
- G16B25/10—Gene or protein expression profiling; Expression-ratio estimation or normalisation
-
- G—PHYSICS
- G16—INFORMATION AND COMMUNICATION TECHNOLOGY [ICT] SPECIALLY ADAPTED FOR SPECIFIC APPLICATION FIELDS
- G16B—BIOINFORMATICS, i.e. INFORMATION AND COMMUNICATION TECHNOLOGY [ICT] SPECIALLY ADAPTED FOR GENETIC OR PROTEIN-RELATED DATA PROCESSING IN COMPUTATIONAL MOLECULAR BIOLOGY
- G16B40/00—ICT specially adapted for biostatistics; ICT specially adapted for bioinformatics-related machine learning or data mining, e.g. knowledge discovery or pattern finding
-
- G—PHYSICS
- G16—INFORMATION AND COMMUNICATION TECHNOLOGY [ICT] SPECIALLY ADAPTED FOR SPECIFIC APPLICATION FIELDS
- G16B—BIOINFORMATICS, i.e. INFORMATION AND COMMUNICATION TECHNOLOGY [ICT] SPECIALLY ADAPTED FOR GENETIC OR PROTEIN-RELATED DATA PROCESSING IN COMPUTATIONAL MOLECULAR BIOLOGY
- G16B50/00—ICT programming tools or database systems specially adapted for bioinformatics
- G16B50/20—Heterogeneous data integration
-
- G—PHYSICS
- G16—INFORMATION AND COMMUNICATION TECHNOLOGY [ICT] SPECIALLY ADAPTED FOR SPECIFIC APPLICATION FIELDS
- G16H—HEALTHCARE INFORMATICS, i.e. INFORMATION AND COMMUNICATION TECHNOLOGY [ICT] SPECIALLY ADAPTED FOR THE HANDLING OR PROCESSING OF MEDICAL OR HEALTHCARE DATA
- G16H50/00—ICT specially adapted for medical diagnosis, medical simulation or medical data mining; ICT specially adapted for detecting, monitoring or modelling epidemics or pandemics
- G16H50/30—ICT specially adapted for medical diagnosis, medical simulation or medical data mining; ICT specially adapted for detecting, monitoring or modelling epidemics or pandemics for calculating health indices; for individual health risk assessment
-
- Y—GENERAL TAGGING OF NEW TECHNOLOGICAL DEVELOPMENTS; GENERAL TAGGING OF CROSS-SECTIONAL TECHNOLOGIES SPANNING OVER SEVERAL SECTIONS OF THE IPC; TECHNICAL SUBJECTS COVERED BY FORMER USPC CROSS-REFERENCE ART COLLECTIONS [XRACs] AND DIGESTS
- Y02—TECHNOLOGIES OR APPLICATIONS FOR MITIGATION OR ADAPTATION AGAINST CLIMATE CHANGE
- Y02A—TECHNOLOGIES FOR ADAPTATION TO CLIMATE CHANGE
- Y02A90/00—Technologies having an indirect contribution to adaptation to climate change
- Y02A90/10—Information and communication technologies [ICT] supporting adaptation to climate change, e.g. for weather forecasting or climate simulation
Definitions
- the subject technology relates generally to computational assessment and prediction from data.
- GBM glioblastoma multiforme
- CNAs copy-number alterations
- the subject technology provides frameworks that can simultaneously compare and contrast two datasets arranged in large-scale tensors of the same column dimensions but with different row dimensions in order to find the similarities and dissimilarities among them.
- a tensor generalized singular value decomposition (tGSVD), described herein, is an exact, unique, simultaneous decomposition for comparing and contrasting two tensors of arbitrary order.
- HO GSVD are limited to datasets arranged in matrices, i.e., second-order tensors. Exact and unique simultaneous decomposition for two tensors can be performed to generalize the matrix GSVD to a tensor GSVD by following steps analogous to these that generalize the matrix SVD to the tensor, or higher-order SVD (HOSVD).
- This tensor GSVD transforms two tensors of the same numbers of columns across, e.g., the x- and the _y-axes, and different numbers of rows across the z- axes, into weighted sums of "subtensors," where each subtensor is an outer product of one x-, one y- and one z-axis vector.
- the sets of x-, y- and z-axes vectors are computed by using the matrix GSVD of the two tensors unfolded along their corresponding axes. This is different from previous tensor GSVDs, which, e.g., do not use the GSVD in the computation of each of the sets of vectors.
- the significance of the subtensor Si(a, b, c) in 7 is defined relative to that of the corresponding subtensor S 2 (a, b, c) in T 2 in terms of an "angular distance" that is a function of the ratio of the weighting coefficients r ⁇ abc and r 2 ,abc- This angular distance is a function of the generalized singular values that correspond to and U 2 only, and is independent of the values that correspond to either V x or V y .
- the matrix GSVD and the tensor HOSVD are special cases of this tensor GSVD.
- a method for characterization of data includes applying a decomposition algorithm, by a processor, to Nth-order tensors -4 and B representing data, wherein N > 2 and wherein tensors A and B have matching number of columns in all dimensions except an n th dimension, to generate, for each of the tensors, a weighted sum of a set of subtensors, the sets of subtensors having one-to-one correspondence and the sums having different weighting coefficients.
- a relative significance of the subtensors is determined as the ratio of the weighting coefficients.
- the data can include indicators, represented in respective rows and columns of the tensors, of values of at least two index parameters. According to some embodiments, an indicator of a health parameter of a subject is determined based on the relative significance of the subtensors.
- Applying the decomposition algorithm comprises unfolding each of the tensors along the n th dimension to generate, for each of the tensors, a basis vector corresponding to the n th dimension values preserved by the unfolding.
- Each of the subtensors can be or include an outer product of vectors from every dimension of the corresponding tensor
- the tensor GSVD can be used to transform tensor -4. and a tensor B into weighted sums of subtensors.
- Vectors in the tensor . along an n th index into a tensor GSVD (tGSVD) can be appended.
- Vectors in the tensor B along an n th index into the tGSVD can also be appended.
- a method, for characterization of data comprising: applying an unfolding algorithm, by a processor, to each of at least two Nth order tensors, representing data, to generate at least two matrices, wherein N > 2, wherein the at least two tensors have a matching number of columns in each of all dimensions except an Nth dimension, wherein the applying the unfolding algorithm preserves the number of columns in one dimension common to (a) one of the at least two tensors and (b) a corresponding one of the at least two matrices, wherein each of the at least two matrices is a full column rank matrix, wherein each of the matrices is a unique, weighted sum of subtensors having a matching number of columns in each of all dimensions, at least two of the sums having different weighting coefficients; determining a relative significance of the subtensors as a ratio of the weighting coefficients; determining and outputting, by a processor and based on the relative
- Clause 4 The method of clause 1, further comprising applying a decomposition algorithm, by a processor, to the at least two subtensors, to generate, from the at least two subtensors A and B, eigenvectors of each of AAT, ATA, BBT, and BTB.
- Clause 5 The method of clause 1, wherein the data comprises indicators, represented in respective rows and columns of the tensor, of values of at least two index parameters.
- Clause 7. The method of clause 1, wherein the applying the unfolding algorithm includes appending into a matrix the columns or rows across a preserved dimension in each tensor.
- Clause 8. The method of clause 1, wherein each subtensor is an outer product of one X-, one y- and one z-axis vector.
- Clause 10 The method of clause 1, further comprising, based on the indicator of the health parameter of the subject, applying a treatment to the subject.
- Clause 11 The method of clause 10, wherein the treatment comprises administering a drug to the subject, admitting the subject to a care facility, or performing an operation on the subject.
- Clause 12 The method of clause 1, wherein the tensors are generated by folding a plurality of matrices into the tensors.
- a method, for characterization of data comprising: receiving, an indicator of a health parameter of a subject, wherein the health parameter comprises at least one of a differential diagnosis, a first health status of the subject, a disease subtype, at least one of an estimated probability or an estimated risk of a second health status of the subject, an indicator of a prognosis of the subject, or a predicted response to a treatment of the subject; based on the indicator of the health parameter of the subject, applying a treatment to the subject; wherein the indicator is determined by: applying an unfolding algorithm, by a processor, to each of at least two Nth order tensors, representing data, to generate at least two matrices, wherein N > 2, wherein the at least two tensors have a matching number of columns in each of all dimensions except an Nth dimension, wherein the applying the unfolding algorithm preserves the number of columns in one dimension common to (a) one of the at least two tensors and (b) a corresponding one of
- Clause 14 The method of clause 13, wherein the treatment comprises administering a drug to the subject, admitting the subject to a care facility, or performing an operation on the subject.
- a system for characterization of data, comprising: an unfolding module configured to apply an unfolding algorithm, by a processor, to each of at least two Nth order tensors, representing data, to generate at least two matrices, wherein N > 2, wherein the at least two tensors have a matching number of columns in each of all dimensions except an Nth dimension, wherein the applying the unfolding algorithm preserves the number of columns in one dimension common to (a) one of the at least two tensors and (b) a corresponding one of the at least two matrices, wherein each of the at least two matrices is a full column rank matrix, wherein each of the matrices is a unique, weighted sum of subtensors having a matching number of columns in each of all dimensions, at least two of the sums having different weighting coefficients; a first determining module configured to determine a relative significance of the subtensors as a ratio of the weighting coefficients; a second
- Clause 16 The system of clause 15, wherein the tensors have one-to-one mappings among the columns across all but the Nth dimension of each of the tensors.
- Clause 17. The system of clause 15, wherein the tensors do not have one-to-one mappings among the rows across the Nth dimension of each of the tensors.
- Clause 18. The system of clause 15, further comprising applying a decomposition algorithm, by a processor, to the at least two subtensors, to generate, from the at least two subtensors A and B, eigenvectors of each of AAT, ATA, BBT, and BTB.
- Clause 19 The system of clause 15, wherein the data comprises indicators, represented in respective rows and columns of the tensor, of values of at least two index parameters.
- Clause 20 The system of clause 15, wherein the applying the unfolding algorithm includes appending into (N-l)th order tensors into (N-2)th order tensors that span (N-2) dimensions in each tensor.
- Clause 21 The system of clause 15, wherein the applying the unfolding algorithm includes appending into a matrix the columns or rows across a preserved dimension in each tensor.
- each subtensor is an outer product of one X-, one y- and one z-axis vector.
- Clause 23 The system of clause 22, wherein the sets of x-, y- and z-axes vectors are computed by using a matrix GSVD of the tensors unfolded along their corresponding axes.
- Clause 24 The system of clause 15, further comprising, based on the indicator of the health parameter of the subject, applying a treatment to the subject.
- Clause 25 The system of clause 24, wherein the treatment comprises administering a drug, admitting the subject to a care facility, or performing an operation on the subject.
- Clause 26 The system of clause 15, wherein the tensors are generated by folding a plurality of matrices into the tensors.
- FIG. 1 is a high-level diagram illustrating examples of tensors including biological datasets, according to some embodiments.
- FIG. 2 is a high-level diagram illustrating a linear transformation of three- dimensional arrays, according to some embodiments.
- FIG. 3 is a block diagram illustrating a biological data characterization system coupled to a database, according to some embodiments.
- FIG. 4 is a flowchart of a method for disease related characterization of biological data, according to some embodiments.
- FIG. 5 shows a matrix of higher-order tensors, according to some embodiments of the subject technology.
- FIG. 6 shows how a tensor GSVD generalizes the matrix GSVD from two matrices to two higher-order tensors, in analogy, but not in equivalent mathematical formulation, to the tensor HOSVD's generalization of the matrix SVD, according to some embodiments of the subject technology.
- FIG. 7 shows a tGSVD that has become the GSVD in the matrix limit, according to Corollary 1, according to some embodiments of the subject technology described herein.
- FIG. 8 shows a tGSVD that has become the HOSVD in the limit where one tensor has ones on the diagonal and zeros everywhere else, according to Corollary 2, according to some embodiments of the subject technology described herein.
- FIG. 9 shows GSVD of patient-matched but probe-independent GBM tumor and normal datasets. Raster display, with relative copy-number gain (red), no change (black) and loss (green). The significance of a pattern from FT, or "probelet,” in the tumor dataset relative to its significance in the normal dataset is defined in terms of an "angular distance" that is a function of the ratio of the pattern's significance in each dataset individually (i.e., the fraction of total information that the pattern contains). This is depicted in the bar chart display, where angular distances above 2 ⁇ /9 represent tumor-exclusive patterns and those below - ⁇ /6 represent normal- exclusive patterns.
- FIGS. 10A, 10B, and IOC show survival analyses of TCGA OV patients classified by tensor GSVD (FIG. 10A), tumor stage at diagnosis (FIG. 10B), and both (FIG. IOC).
- FIG. 11 is a simplified diagram of a system, in accordance with various embodiments of the subject technology.
- FIG. 12 is a block diagram illustrating an exemplary computer system with which a client device and/or a server of FIG. 11 can be implemented.
- the subject technology provides frameworks that can simultaneously compare and contrast two datasets arranged in large-scale tensors of the same column dimensions but with different row dimensions in order to find the similarities and dissimilarities among them.
- a tensor GSVD (tGSVD), described herein, is an exact, unique, simultaneous decomposition for comparing and contrasting two tensors of arbitrary order.
- script letters e.g. ⁇
- tensors capital letters
- indices where i,j or a, b, c are typically used.
- the maximum for an index is given by I.
- the index of the n th axis is ikie and n has maximum value N.
- the indices are given as z ' i to i N .
- the entry in the i th row and j th column of the matrix A is denoted ay.
- the subject technology can be applied to a variety of fields to analyze data used in an generated by entities within the field. Such fields include finance, advertising, medicine, biology, astronomy, among others.
- subject technology may be applied to personalize medicine for analysis of DNA copy number, DNA methylation, mRNA expression, imaging, and medical records.
- the subject technology may be used to analyze, in medicine, a large number of high-dimensional datasets, recording multiple aspects of a disease across the same set of patients, such as in The Cancer Genome Atlas (TCGA).
- TCGA Cancer Genome Atlas
- FIG. 1 is a high-level diagram illustrating examples of tensors 100 including biological datasets, according to some embodiments.
- a tensor representing a number of biological datasets may comprise an Nth-order tensor including a number of multi-dimensional (e.g., two or three dimensional) matrices.
- the Nth-order tensor may include a number of biological datasets.
- Some of the biological datasets may correspond to one or more biological samples.
- Some of the biological dataset may include a number of biological data arrays, some of which may be associated with one or more subjects.
- Some examples of biological data that may be represented by a tensor includes tensors (a), (b) and (c) shown in FIG. 1.
- the tensor (a) represents a third order tensor (i.e., a cuboid), in which each dimension (e.g., gene, condition and time) represent a degree of freedom in the cuboid. If unfolded into a matrix, these degrees of freedom may be lost and most of the data included in the tensor may also be lost.
- a tensor decomposition technique such as higher-order eigen-value decomposition (HOEVD) or higher-order single value decomposition (HOSVD) may uncover patterns of mRNA expression variations across the genes, the time points and conditions.
- the biological datasets are associated with genes and the one or more subjects comprises organisms and data arrays may include cell cycle stages.
- the tensor decomposition in this case may allow, for example, integrating global mRNA expressions measured for various organisms, removal of experimental artifacts and identification of significant combinations of patterns of expression variation across the genes, for various organisms and for different cell cycle stages.
- the biological datasets are associated with a network K of N-genes by N-genes. Where the network K may represent a number of studies on the genes.
- the tensor decomposition in this case may allow, for example, uncovering important relations among the genes (e.g., pheromone-response-dependent relation or orthogonal cell-cycle-dependent relation).
- important relations among the genes e.g., pheromone-response-dependent relation or orthogonal cell-cycle-dependent relation.
- FIG. 2 is a high-level diagram illustrating a linear transformation of a number of two dimensional (2-D) arrays forming a three-dimensional (3-D) array 200, according to some embodiments.
- the 3-D array 200 may be stored in memory 300 (see FIG. 3).
- the 3-D array 200 may include a number N of biological datasets that correspond to genetic sequences. In some embodiments, the number N can be greater than two.
- Each biological dataset may correspond to a tissue type and can include a number M of biological data arrays.
- Each biological data array may be associated with a patient or, more generally, an organism).
- Each biological data array may include a plurality of data units (e.g., chromosomes).
- a linear transformation such as a tensor decomposition algorithm may be applied to the 3-D array 200 to generate a plurality of eigen 2-D arrays 220, 230 and 240.
- the generated eigen 2-D arrays 220, 230 and 240 can be analyzed to determine one or more characteristics related to a disease (e.g., changes in glioblastoma multiforme (GBM) tumor with respect to normal tissue).
- the 3-D array 200 may comprise a number N of 2-D data arrays (Dl, D2, D3, ... DN) (for clarity only D1-D3 are shown in FIG. 2).
- Each of the 2-D data arrays (Dl, D2, D3, ... DN) can store one set of the biological datasets and includes M columns. Each column can store one of the M biological data arrays corresponding to a subject such as a patient.
- health status may refer to the presence, absence, quality, rank, or severity of any disease or health condition, history and physical examination finding, laboratory value, and the like.
- a “health parameter” can include a differential diagnosis, meaning a diagnosis that is potential, confirmed, unconfirmed, based on a likelihood, ranked, or the like.
- a health parameter can include at least one of a differential diagnosis, a first health status of the subject, a disease subtype, an estimated probability, an estimated risk of a second health status of the subject, an indicator of a prognosis of the subject, or a predicted response to a treatment of the subject.
- each biological data array may comprise biological data measurable by a DNA microarray (e.g., genomic DNA copy numbers, genome-wide mRNA expressions, binding of proteins to DNA and binding of proteins to RNA), a sequencing technology (e.g., using a different technology that covers the same ground as microarray s), a protein microarray or mass spectrometry, where protein abundance levels are measured on a large proteomic scale and a traditional measurement (e.g., immunohistochemical staining).
- the biological data may include chromatin or histone modification, a DNA copy number, an mRNA expression, a micro-RNA expression, a DNA methylation, binding of proteins to DNA, binding of proteins to RNA or protein abundance levels.
- the biological data may be derived from a patient-specific sample including a normal tissue, a disease-related tissue or a culture of a patient's cell.
- the biological datasets may also be associated with genes and the one or more subjects comprises at least one of time points or conditions.
- the tensor decomposition of the Nth-order tensor may allow for identifying abnormal patterns to identify genes or proteins which enable including or excluding a diagnosis. Further, the tensor decomposition may allow classifying a patient into a subgroup of patients based on patient-specific genomic data, resulting in an improved diagnosis by identifying the patient's disease subtype.
- the tensor decomposition may also be advantageous in patients therapy planning, for example, by allowing patient-specific therapy to be designed based criteria, such as, a correlation between an outcome of a therapeutic method and a global genomic predictor.
- the tensor decomposition may facilitate designing at least one of predicting a patient's survival or a patient's response to a therapeutic method such as chemotherapy.
- the Nth-order tensor may include a patient's routine examination data, in which case decomposition of the tensor may allow designing of a personalized preventive regimen for a patient based on analyses of the patient's routine examinations data.
- the biological datasets may be associated with imaging data including magnetic resonance imaging (MRI) data, electro cardiogram (ECG) data, electromyography (EMG) data or electroencephalogram (EEG) data.
- the biological datasets may be associated with vital statistics or phenotypic data.
- the tensor decomposition of the Nth-order tensor may allow removing normal pattern copy number variations (CNVs) and an experimental variation from a genomic sequence.
- the tensor decomposition of the Nth-order tensor may permit an improved prognostic prediction of the disease by revealing disease-associated changes in chromosome copy numbers, focal copy number variations (CNVs) nonfocal CNVs and the like.
- the tensor decomposition of the Nth-order tensor may also allow integrating global mRNA expressions measured in multiple time courses, removal of experimental artifacts and identification of significant combinations of patterns of expression variation across the genes, the time points and the conditions.
- applying the tensor decomposition algorithm may comprise applying at least one of a higher-order singular value decomposition (HOSVD), a higher-order generalized singular value decomposition (HO GSVD), a higher-order eigen-value decomposition (HOEVD) or parallel factor analysis (PARAFAC) to the Nth-order tensor.
- HOSVD higher-order singular value decomposition
- HO GSVD higher-order generalized singular value decomposition
- HOEVD higher-order eigen-value decomposition
- PARAFAC parallel factor analysis
- the HOSVD generated eigen 2-D arrays may comprise a set of N left-basis 2-D arrays 220.
- Each of the left-basis arrays 220 e.g., Ul, U2, U3, ... UN) (for clarity only U1-U3 are shown in FIG. 2) may correspond to a tissue type and can include a number M of columns, each of which stores a left-basis vector 222 associated with a patient.
- the eigen 2-D arrays 230 comprise a set of N diagonal arrays ( ⁇ 1, ⁇ 2, ⁇ 3, ... ⁇ N) (for clarity only ⁇ 1- ⁇ 3 are shown in FIG. 2).
- Each diagonal array (e.g., ⁇ 1, ⁇ 2, ⁇ 3, ... or ⁇ N) may correspond to a tissue type and can include a number N of diagonal elements 232.
- the 2-D array 240 comprises a right-basis array, which can include a number of right-basis vectors 242.
- decomposition of the Nth-order tensor may be employed for disease related characterization such as diagnosing, tracking a clinical course or estimating a prognosis, associated with the disease.
- FIG. 3 is a block diagram illustrating a data characterization system 300 coupled to a database 350, according to some embodiments.
- the system 300 includes a processor 310, memory 320, an analysis module 330 and a display module 340.
- Processor 310 may include one or more processors and may be coupled to memory 320.
- Memory 320 may comprise volatile memory such as random access memory (RAM) or nonvolatile memory (e.g., read only memory (ROM), flash memory, etc.).
- Memory 320 may also include machine-readable medium, such as magnetic or optical disks. Memory 320 may retrieve information related to the Nth-order tensors 100 of FIG. 1 or the 3-D array 200 of FIG.
- Database 350 may be coupled to system 300 via a network (e.g., Internet, wide area network (WNA), local area network (LNA), etc.). According to some embodiments, system 300 may encompass database 350.
- a network e.g., Internet, wide area network (WNA), local area network (LNA), etc.
- system 300 may encompass database 350.
- Processor 310 can apply a tensor decomposition algorithm, such as HOSVD, HO
- processor 310 may apply the HOSVD or HO GSVD algorithms to array comparative genomic hybridization (aCGH) data from patient-matched normal and glioblastoma multiforme (GBM) blood samples.
- aCGH array comparative genomic hybridization
- GBM glioblastoma multiforme
- Application of HOSVD algorithm may remove one or more normal pattern copy number variations (CNVs) or experimental variations from the aCGH data.
- the HOSVD algorithm can also reveal GBM-associated changes in at least one of chromosome copy numbers, focal CNVs and unreported CNVs existing in the aCGH data.
- processor 310 may apply a decomposition algorithm to an Nth- order tensor representing data (N > 2) to generate, from two or more submatrices A and B of the tensor, eigenvectors of each of AA , A A, BB , and B B.
- the data may comprise indicators, represented in respective rows and columns of the tensor, of values of at least two index parameters.
- Analysis module 330 can perform disease related characterizations as discussed above. For example, analysis module 330 can facilitate various analyses of eigen 2-D arrays 230 of FIG. 2, for example, by assigning each diagonal element 232 of FIG. 2 to an indicator of a significance of a respective element of a right-basis vector 222 of FIG.
- Analysis module 330 can determine an indicator of a health parameter of a subject, based on the eigenvectors and on values, associated with the subject, of the two or more index parameters.
- the display module 240 can display 2-D arrays 220, 230 and 240 and any other graphical or tabulated data resulting from analyses performed by analysis module 330.
- Display module 330 can display the indicator of the health parameter of the subject in various ways including digital readout, graphical display, or the like.
- the indicator of the health parameter may be communicated, to a user or a printer device, over a phone line, a computer network, or the like.
- Display module 330 may comprise software and/or firmware and may use one or more display units such as cathode ray tubes (CRTs) or flat panel displays.
- FIG. 4 is a flowchart of a method 400 for genomic prognostic prediction, according to some embodiments.
- Method 400 includes storing the N ⁇ -tensors 100 of FIG. 1 or 3-D array 200 of FIG. 2 in memory 320 of FIG. 3 (410).
- a tensor decomposition algorithm such as HOSVD, HO GSVD, or HOEVD may be applied, by processor 310 of FIG. 3, to the datasets stored in tensors 100 or 3-D array 200 to generate eigen 2-D arrays 220, 230 and 240 of FIG. 2 (420).
- the generated eigen 2-D arrays 220, 230 and 240 may be analyzed by analysis module 330 to determine one or more disease-related characteristics (430).
- the HOSVD algorithm is mathematically described herein with respect to N >2 matrices (i.e., arrays Di-D N ) of 3-D array 200. Each matrix can be a real mi x n matrix.
- matrix S is nondefective, i.e., S has n independent eigenvectors and that V is real and that the eigenvalues of S (i.e., ⁇ 1; ⁇ 2; . . . ⁇ ⁇ ) satisfy ⁇ > 1.
- ⁇ 1
- the matrix higher-order GSVD provides a framework that extends the GSVD by enabling a simultaneous decomposition of more than two such datasets, which by definition is exact and unique.
- the matrix HO GSVD for N > 2 matrices has been defined as Di ⁇ !& ⁇ " ⁇ each ⁇ th full column rank.
- a HOSVD algorithm is mathematically described herein with respect to N >2 matrices (i.e., arrays Di-D N ) of 3-D array 200.
- Each matrix can be a real mi x n matrix.
- a HOEVD tensor decomposition method can be used for decomposition of higher order tensors.
- the matrix EVD is equivalent to the matrix SVD for a symmetric nonnegative matrix
- this tensor HOEVD is different from the tensor higher-order SVD (14-16) for the series of symmetric nonnegative matrices ⁇ (1 ⁇ 2 ⁇ , where the higher-order SVD is computed from the SVD of the appended networks ((1 ⁇ 2, a 2 , . . . K ) rather than the appended signals.
- This HOEVD formulates each individual network in the tensor ⁇ fc ⁇ as a linear superposition of this series of M rank-1 symmetric decorrelated subnetworks and the series of M ⁇ M- 1)/2 rank-2 symmetric couplings among these subnetworks, such that
- the sign of this fraction indicates the direction of the coupling, such that p M > 0 corresponds to a transition from the /th to the mth subnetwork and p k m ⁇ 0 corresponds to the transition from the mth to the metric distribution of the annotations among the N-genes and the subsets of n _ ⁇ N genes with largest and smallest levels of expression in this eigenarray.
- the corresponding eigengene might be inferred to represent the corresponding biological process from its pattern of expression.
- the most likely association of a subnetwork with a pathway or of a coupling between two subnetworks with a transition between two pathways is that which corresponds to the smallest P value.
- each eigenarray with most likely cellular states, or none thereof, assuming hypergeometric distribution of the annotations among the N-genes and the subsets of n _ ⁇ N genes with largest and smallest levels of expression in this eigenarray.
- the corresponding eigengene might be inferred to represent the corresponding biological process from its pattern of expression.
- a higher-order EVD of the third-order series of the three networks ⁇ (1 ⁇ 2, a 2 , 3 ⁇ .
- the network a 3 is the pseudoinverse projection of the network x onto a genome-scale proteins' DNA-binding basis signal of 2,476-genes x 12-samples of development transcription factors [3] (Mathematica Notebook 3 and Data Set 4), computed for the 1,827 genes at the intersection of a x and the basis signal.
- each of the three networks as an approximate superposition of only the three most significant HOEVD subnetworks and the three couplings among them, in the subset of 26 genes which constitute the 100 correlations in each subnetwork and coupling that are largest in amplitude among the 435 correlations of 30 traditionally-classified cell cycle-regulated genes.
- This tensor HOEVD is different from the tensor higher-order SVD [14-16] for the series of symmetric nonnegative matrices a 2 , 3 ⁇ .
- the subnetworks correlate with the genomic pathways that are manifest in the series of networks.
- the most significant subnetwork correlates with the response to the pheromone.
- This subnetwork does not contribute to the expression correlations of the cell cycle-projected network a 2 , where ⁇ 0.
- the second and third subnetworks correlate with the two pathways of antipodal cell cycle expression oscillations, at the cell cycle stage Gi vs. those at G 2 , and at S vs. M, respectively.
- These subnetworks do not contribute to the expression correlations of the development-projected network a 3 , where e
- the couplings correlate with the transitions among these independent pathways that are manifest in the individual networks only.
- the coupling between the first and second subnetworks is associated with the transition between the two pathways of response to pheromone and cell cycle expression oscillations at Gi vs.
- the coupling between the first and third subnetworks is associated with the transition between the response to pheromone and cell cycle expression oscillations at S vs. those at M, i.e., cell cycle expression oscillations at Gi/S vs. those at M.
- the coupling between the second and third subnetworks is associated with the transition between the orthogonal cell cycle expression oscillations at Gi vs. those at G 2 and at S vs. M, i.e., cell cycle expression oscillations at the two antipodal cell cycle checkpoints of Gi/S vs. G 2 /M.
- a tensor GSVD arranged in two higher-than-second-order tensors of matched column dimensions but independent row dimensions is used in the methods herein.
- TCGA patients were selected. Each profile was measured in two replicates by the same set of two DNA microarray platforms.
- the structure of these tumor and normal discovery datasets D 1 and D 2 , of i-tumor and ⁇ -normal probes x J-patients, i.e., arrays x -platforms is that of two third-order tensors with one-to-one mappings between the column dimensions L and M, but different row dimensions K ⁇ and K 2 , where K K 2 ⁇ LM.
- This tensor GSVD simultaneously separates the paired datasets into weighted sums of LM paired "subtensors," i.e., combinations or outer products of three patterns each: Either one tumor-specific pattern of copy-number variation across the tumor probes, i.e., a "tumor arraylet” u , or the corresponding normal-specific pattern across the normal probes, i.e., the "normal arraylet” w 2,a , combined with one pattern of copy-number variation across the patients, i.e., an "x-probelet” v T x b and one pattern across the platforms, i.e., a "y-probelet” V y C , which are identical for both the tumor and normal datasets,
- V i R i X a U i X b V x X c V y Ri,abcSi( a > b> c )
- X a t/i, X- b V x and X c V y denote tensor-matrix multiplications, which contract the -arraylet, J-x-probelet, and - ⁇ -probelet dimensions of the "core tensor" 1 i with those of £/,, V x , and V y , respectively, and where ® denotes an outer product.
- the x- and _y-row bases vectors are, in general, non-orthogonal but normalized, and V x and V y are invertible.
- Unfolding is performed on tensors of the same order, the tensors having one-to- one mappings among the columns across all but one the of corresponding dimensions among the tensors, but not necessarily among the rows across the one remaining dimension in each tensor.
- Each tensor is unfolded by, for N order tensors, preserving 1, 2, 3, N-2 dimensions, e.g., by appending into 2, 3, 4, N-l order tensors the 1, 2, 3, N-2 order tensors that span these 1, 2, 3, N-2 dimensions in each tensor.
- third or higher-than-third order tensors one of the dimensions is preserved, e.g., by appending into a matrix the columns or rows across that dimension in each tensor.
- fourth or higher-than-fourth order tensors two of the dimensions are preserved, e.g., by appending into a third-order tensor the matrices that span these two dimensions in each tensor.
- fifth or higher order tensors three of the dimensions are preserved.
- the unfolding can be full-column rank unfolding, wherein, for N order tensors, each of the N unfoldings preserves one dimension (e.g., by appending into a matrix the vectors that span each of these dimensions in each tensor) and produces a full-column rank matrix.
- the generalized singular values are positive, and are arranged in 27,, ⁇ ix , and ⁇ iy in decreasing orders of the corresponding "GSVD angular distances," i.e., decreasing orders of the ratios ⁇ 1; ⁇ / ⁇ 2> ⁇ , o 1Xt blo 2x ,b, and o lyc lo 2y c, respectively.
- the "tensor generalized singular values" I ⁇ bc tabulated in the core tensors are real but not necessarily positive.
- Our tensor GSVD construction generalizes the GSVD to higher orders in analogy with the generalization of the singular value decomposition (SVD) by the HOSVD, and is different from other approaches to the decomposition of two tensors.
- the tensor GSVD exists for two tensors of any order because it is constructed from the GSVDs of the tensors unfolded into full column-rank matrices (Lemma A Example 5).
- the tensor GSVD has the same uniqueness properties as the GSVD, where the column bases vectors u a and the row bases vectors u x b and v y T c are unique, except in degenerate subspaces, defined by subsets of equal generalized singular values ⁇ ,, ⁇ ⁇ , and o iy , respectively, and up to phase factors of ⁇ 1 , such that each vector captures both parallel and antiparallel patterns.
- the tensor GSVD of two second-order tensors reduces to the GSVD of the corresponding matrices (see Example 5).
- the tensor GSVD of the tensor Z3 ⁇ 4 G ]R i xix j which row mode unfolding gives the identity matrix D ⁇ I E ⁇ LMxLM ⁇ anc j a tensor D 2 of the same column dimensions reduces to the HOSVD of D 2 (Theorem A in Example 5).
- 0a arctan( i;a /ff 2;a ; - ⁇ /4. (5)
- the row mode GSVD angular distances satisfy ⁇ ⁇ [- ⁇ /4, ⁇ /4].
- the angular distance ⁇ ⁇ which is a function of the arctangent of the ratio, i.e., arctan( i ;a / 2;a ), is the natural function to use, because the GSVD is related to the cosine-sine (CS) decomposition, as previously described, and, thus, ⁇ ⁇ ⁇ and ⁇ 2, ⁇ are related to the sine and the cosine functions of the angle ⁇ ⁇ , respectively.
- Lemma B The tensor GSVD has the same uniqueness properties as the GSVD.
- the tensor GSVD reduces to the GSVD of the corresponding matrices. Proof.
- the matrices D, G E ⁇ 1 ⁇ the tensor GSVD of Eq. (1) is
- An entropy of zero corresponds to an ordered and redundant dataset in which all the information is captured by a single subtensor.
- An entropy of one corresponds to a disordered and random dataset in which all subtensors are of equal significance.
- the matrix GSVD generalized by following steps analogous to those that generalize the matrix SVD to a tensor SVD.
- the GSVD simultaneously decomposes two matrices of the same numbers of columns and different numbers of rows, as shown in FIG. 5, into unique, weighted sums of combinations of patterns of variation (see FIG. 9).
- a different set of orthogonal left basis vectors 3 ⁇ 4 and U B is computed for each of the matrices A and B with a one-to-one correspondence among these vectors, as shown in FIG. 6.
- a tensor GSVD for two tensors of the same numbers of columns across, e.g., the x- and the _y-axes, and different numbers of rows across the z-axes, that transforms each of the two tensors into a unique is defined as weighted sum of combinations of patterns of variation.
- each of the sets of patterns is computed by using the matrix GSVD of the two tensors unfolded along their corresponding axes.
- This decomposition transforms each of the two tensors into a unique, weighted sum of "subtensors," where each subtensor is an outer product of one X-, one _y- and one z-axis vector.
- the sets of x-, y- and z-axes vectors are computed by using the matrix GSVD of the two tensors unfolded along their corresponding axes. From the GSVD it follows that a different set of orthogonal basis vectors UA and UB is computed for each of the tensors A and B across the z-axes, with a one-to-one correspondence among these vectors (see FIG. 6).
- the sets of vectors across the x- and _y-axes V x and V y are identical for both tensor factorizations, and are not, in general, orthogonal.
- each of the tensors is rewritten as a weighted sum of subtensors 3 ⁇ 4(a,b,c) and 3 ⁇ 4(a,b,c) with the weighting coefficients RA.abc and Re.abc-
- the subscript on the multiplication symbol indicates the axis for multiplication of a tensor by a matrix.
- dimension one corresponds to the z-axis, two to the x-axis, and three to the _y-axis.
- the core tensors, RA and RB are full and non-negative.
- the significance of the subtensor 3 ⁇ 4(a,b,c) in A relative to the significance of the corresponding subtensor Ss(a,b,c) in B is defined in terms of an angular distance that is a function of the ratio of the weighting coefficients Ri.abc and R B ,abc- This angular distance is a function of the generalized singular values corresponding to UA and UB only, and is independent of the generalized singular values corresponding to either V x or V y .
- the relative significance is defined as
- TA and r3 ⁇ 4 are corresponding elements of the core tensors, RA and RB. Values of ⁇ closer to ⁇ /4 indicate that the corresponding pattern is exclusive to dataset A, whereas values close to - ⁇ /4 indicate exclusivity to dataset B.
- the ratio TA ⁇ , ⁇ is dependent only on the row (z-axis), and is invariant across other dimensions and therefore only depends on the GSVD of the first unfolding (preserving the z-axis) which is used to generate £/,. Unfolding the tensor GSVD on the first axis gives,
- the tGSVD is constructed by unfolding the tensors, computing the matrix GSVD (mGSVD), and saving the set of basis vectors corresponding to the dimension preserved by the unfolding.
- An unfolding of the tensor along dimension n means appending the vectors of length / admir in A, i.e. those along n th index, into a matrix.
- the mGSVD of A and B unfolded to preserve the n th dimension is
- the superscript (n) indicates that the matrix corresponds to the n th unfolding. From the properties of the mGSVD, ' ⁇ and « are column-wise orthogonal. 4 and iJ s ' are diagonal, and ' is invertible. The order in which the columns of A( n) and B( n) are unfolded does not affect the decomposition because the column vectors of U A and l! s hold fundamental patterns from the column vectors of A (n) and B ( possibly ) , which are independent of ordering in the matrices.
- the tGSVD is constructed by setting
- each of the tensors will be rewritten as a weighted sum of a set of subtensors, ⁇ A ( , b, c) and ⁇ ⁇ a, b, c) for a third order tensor, with a one- to-one correspondence among these two sets of subtensors and with different weighting coefficients, 1 A ⁇ abc anc j t b.abe -
- the matrices and tensors comprising the tGSVD described above are unique up to a phase factor of ⁇ 1 in each element of the core tensors, except in the case of degenerate subspaces, defined by subsets of equal angular distances (i.e. relative significance) in the mGSVD calculation.
- Theorem 1 Theorem 1. The mGSVD of two matrices, A and B, reduces to the SVD of A if
- Theorem 2 The relative significance in the tGSVD defined as the ratio of corresponding entries in ' ⁇ and 3 ⁇ 4, i.e. ? *i *.s 8,*i*2-"»a , depends only on the first index, z ' i, and is identical to the relative significance of the mGSVD of ⁇ and B unfolded to preserve the first axis (i.e., the first unfolding of the data tensors, * and ⁇ > ⁇ ⁇ by preserving the row axis).
- the tGSVD exists and is unique up to sign in the core tensor.
- the tGSVD reduces to the mGSVD when second order tensors (i.e., matrices) are given as inputs.
- the tGSVD reduces to the Higher Order SVD when one of the input tensors has ones on the diagonal (i.e., when all indices are equal) and zeros everywhere else.
- the matrix HO GSVD' s left basis vectors £/ would be column-wise orthogonal also outside of the common subspace of the N matrices.
- An iterative matrix block HO GSVD can be defined. First, the common subspace of all N matrices is used to separate each of the matrices £/, into a column-wise orthogonal block € ⁇ ! ; ⁇ ; anc j he remaining block.
- the HO GSVD of the blocks ' «* x i w ⁇ *> 0 f a subset of, e.g., N-l matrices C 3 ⁇ 4 (that correspond to the remaining blocks in U,) is used to identify the subspace common to the N - 1 but not all N matrices Dj.
- the column-wise orthogonal blocks that correspond to the N - 1 (but not to the N) common subspace are used to rewrite the corresponding blocks of £/, that previously were not necessarily orthogonal. This step is repeated until all matrices Uj are completely column-wise orthogonal.
- the matrix HO GSVD is a special case of this iterative matrix block HO GSVD.
- the tGSVD To compare two datasets that are each of higher order than a matrix (e.g. order 3 tensors), the tGSVD simultaneously separates the paired datasets into paired weighted sums of subtensors, formed by the outer product of a single pattern of variation across each dimension, as shown above.
- the significance of the subtensor L? r l'2 ⁇ " ' ' ⁇ ⁇ '1 ⁇ " ⁇ ! ⁇ in the dataset X is proportional to the weight of the ' ' 2 ' ' * ' 5 ⁇ ⁇ ' entry of , i.e.,
- the "Shannon entropy" of each dataset measures the complexity of the data from the distribution of the overall information among the different subtensors.
- An entropy of zero corresponds to an ordered and redundant dataset in which all the information is captured by a single subtensor.
- An entropy of one corresponds to a disordered and random dataset in which all subtensors are of equal significance.
- the significance of the subtensor > *2 ⁇ ⁇ in A relative to the significance of '' s ⁇ 1, 3 ⁇ 4 ⁇ i v f in B is
- An angular distance of - ⁇ /4 indicates a subtensor that is exclusive to either dataset A or B, respectively, whereas an angular distance of zero indicates a subtensor that is common to both datasets A and B.
- the corresponding subtensors ⁇ , * ⁇ > 3 ⁇ 4> ⁇ - and ' « . i., i - , , ⁇ ⁇ ⁇ are constructed as an outer product of identical columns from each of the matrices Vn and corresponding non-identical columns of V A and ( 8 .
- Theorem 2 proves that the relative significance depends on the row index only. Therefore, only columns of ⁇ ' -4 and ⁇ contribute to the relative significance whereas columns of Vn contribute to significance within each dataset independently.
- the subject technology provides frameworks that can simultaneously compare and contrast two datasets arranged in large-scale tensors of the same column dimensions but with different row dimensions in order to find the similarities and dissimilarities among them.
- the subject technology may be applied in fields such as medicine, where the number of high- dimensional datasets, recording multiple aspects of a disease across the same set of patients, is increasing, such as in The Cancer Genome Atlas (TCGA).
- TCGA The Cancer Genome Atlas
- GBM glioblastoma multiforme
- CNAs tumor-exclusive co-occurring copy-number alterations
- the GSVD formulated as a framework for comparatively modeling two composite datasets, removes from the pattern copy-number variations (CNVs) that occur in the normal human genome (e.g., female- specific X chromosome amplification) and experimental variations (e.g., in tissue batch, genomic center, hybridization date and scanner), without a-priori knowledge of these variations.
- CNVs pattern copy-number variations
- the pattern includes most known GBM-associated changes in chromosome numbers and focal CNAs, as well as several previously unreported CNAs in > 3% of the patients.
- the pattern provides a better prognostic predictor than the chromosome numbers or any one focal CNA that it identifies, suggesting that the GBM survival phenotype is an outcome of its global genotype.
- the pattern is independent of age, and combined with age, makes a better predictor than age alone.
- OV ovarian serous cystadenocarcinoma
- a novel tensor GSVD enables the simultaneous decomposition of two datasets arranged in higher-order tensors, whereas the matrix GSVD is limited to two second-order tensors, i.e., matrices. The additional dimension allows separation of platform bias.
- a tensor GSVD can be defined for two large-scale tensors with different row dimensions and the same column dimensions.
- the tensor GSVD provides a framework for comparative modeling in personalized medicine, where the mathematical variables represent biomedical reality.
- the matrix GSVD enabled the discovery of CNAs correlated with GBM survival
- the tensor GSVD enables a comparison of two, higher dimensional datasets leading to the discovery of CNAs that are correlated with OV prognosis.
- This mathematical modeling makes it possible to similarly use recent high-throughput biotechnologies in the personalized prognosis and treatment of OV and other cancers.
- the pattern of particular biomedical interest is the most significant in the tumor dataset (i.e. the one that captures the largest fraction of information), is independent of platform, and is exclusive to the tumor dataset.
- the most significant pattern in the tumor data is used for V x,b
- the most platform-independent pattern for V y,c is used for 3 ⁇ 4 radiation.
- TCGA data can be illustrated by comparing normal and OV tumor genomic profiles from the same set of patients, each measured twice by the same two profiling platforms.
- the tensor GSVD has uncovered several tumor-exclusive chromosome arm -wide patterns of CNAs that are consistent across both profiling platforms and are significantly correlated with the patients' survival. This indicates several, previously unrecognized, subtypes of OV.
- the prognostic contributions of these patterns are comparable to and independent of the tumor' s stage (FIGS. lOA-C).
- Tensor GSVD classification of the OV profiles of an independent set of patients validates the prognostic contribution of these patterns.
- methods of the subject technology can be implemented in the field of epidemiology.
- data relating to infection rates can be tabulated in tensors.
- Each tensor can represent or contain values for infection rate data for a given region (e.g., continent, country, state, county, city, district, etc.).
- the shared x-axis can represent or contain values for time.
- the shared y-axis can represent or contain values for infectious diseases.
- the z-axis can represent or contain values for sub-regions (e.g., state, county, city, district, etc.) within the corresponding region represented by the tensor.
- the tensor GSVD and/or HO GSVD can be performed to determine similarities and dissimilarities between two regions or among three or more regions with respect to infection rates of different diseases across time.
- methods of the subject technology can be implemented in the field of agriculture.
- data relating to crop yields can be tabulated in tensors.
- Each tensor can represent or contain values for crop yield data for a given crop (e.g., corn, rice, wheat, etc.).
- the shared x-axis can represent or contain values for time.
- the shared y- axis (or multiple y-axes) can represent or contain values for geocoordinates.
- the z-axis (or multiple z-axes) can represent or contain values for different types of a given crop (e.g., different types of corn, different types of rice, different types of wheat, etc.).
- the tensor GSVD and/or HO GSVD can be performed to determine similarities and dissimilarities between the yields of two crops (or among more than two) across time and geocoordinates.
- methods of the subject technology can be implemented in the field of ecology.
- data relating to abundance levels can be tabulated in tensors.
- Each tensor can represent or contain values for abundance level data for a given disease vector (e.g., virus, fungi, pollen, etc.).
- the shared x-axis can represent or contain values for time.
- the shared y-axis (or multiple y-axes) can represent or contain values for geocoordinates.
- the z-axis (or multiple z-axes) can represent or contain values for different types of a given disease vector (e.g., different types of virus, different types of fungi, different types of pollen, etc.).
- the tensor GSVD and/or HO GSVD can be performed to similarities and dissimilarities between the abundance levels of two disease vectors (or among more than two) across time and geocoordinate.
- methods of the subject technology can be implemented in the field of political science.
- data relating to poll numbers can be tabulated in tensors.
- Each tensor can represent or contain values for polling data for a given voting territory (e.g., state, county, district, etc.).
- the shared x-axis can represent or contain values for time.
- the shared y-axis (or multiple y-axes) can represent or contain values for candidates and/or issues. Additional or alternative possible shared axes can include demographic factors (e.g., age, income, occupation, marital status, number of children, party membership, etc.).
- the z-axis can represent or contain values for sub-territories (e.g., precincts, etc.) within the corresponding voting territory represented by the tensor.
- the tensor GSVD and/or HO GSVD can be performed to determine similarities and dissimilarities between public opinion on candidates or issues in two states (or among more than two) across time.
- methods of the subject technology can be implemented in the field of macroeconomics.
- data relating to employment rates can be tabulated in tensors.
- One or more tensors can represent or contain values for employment data such as employment rate, government spending in dollars, levels of macroeconomic factors (e.g., tax rates, interest rates, etc.).
- the shared x-axis can represent or contain values for time.
- the shared y-axis (or multiple y-axes) can represent or contain values for regions (e.g., continent, country, state, county, city, district, etc.).
- the z-axis can represent or contain values for different areas of government spending and/or different types of macroeconomic factors (e.g., types of taxes, types of interest rates, etc.).
- the tensor GSVD and/or HO GSVD can be performed to determine similarities and dissimilarities between the two macroeconomic factors of employment and government spending (or among more than two factors, including, e.g., taxes, or interest rates) across time and cities.
- methods of the subject technology can be implemented in the field of finance.
- data relating to prices can be tabulated in tensors.
- Each tensor can represent or contain values for pricing data for a given asset or assets (e.g., stock prices, commodity prices, etc.) and/or pricing factors (e.g., housing prices).
- the shared x-axis can represent or contain values for time.
- the shared y-axis (or multiple y-axes) can represent or contain values for region(s).
- the z-axis (or multiple z-axes) can represent or contain values for different ones of the asset or assets (e.g., different stocks, different commodities, different pricing factors, etc.).
- the tensor GSVD and/or HO GSVD can be performed to determine similarities and dissimilarities between the two finance factors of stocks and commodities (or among more than two factors, including, e.g., housing prices) across time and regions.
- methods of the subject technology can be implemented in the field of sports.
- data relating to sports statistics e.g., offensive statistics, on-base percentage, defensive statistics, earned run average, etc.
- the statistics can relate to performance, results, training, and/or environmental factors.
- Each tensor can represent or contain values for statistical data for a given team, player, or other participant.
- the shared x-axis can represent or contain values for a span of time or group of events (e.g., season, game, inning, quarter, period, etc.).
- the shared y-axis can represent or contain values for game information, such as opposing team, location, opposing players, weather, time, duration, etc.
- the z-axis can represent or contain values for players or other participants corresponding to particular teams, for example.
- the tensor GSVD and/or HO GSVD can be performed to determine similarities and dissimilarities between the two teams (or among more than two teams) across season and games in season.
- methods of the subject technology can be implemented in the field of traffic analysis.
- data relating to traffic can be tabulated in tensors.
- Each tensor can represent a location (e.g., intersection, length of road, etc.) and contain values for individual experience (e.g., time that a car spends in a traffic intersection on each occasion, or mean speed of the car on a road on each occasion, etc.).
- the shared x-axis can represent or contain values for time (e.g., time of day, etc.).
- the shared y-axis (or multiple y-axes) can also represent or contain values for time (e.g., day of the week, etc.).
- the z-axis can represent or contain values for vehicles that travel through the corresponding location represented by the tensors.
- the tensor GSVD and/or HO GSVD can be performed to determine similarities and dissimilarities between the two traffic intersections, or roads (or among more than two intersections, or roads) across time of day, and day of the week, in terms of time spent, or mean speed driven.
- methods of the subject technology can be implemented in the field of social media applications.
- data relating to social media activity can be tabulated in tensors.
- Each tensor can represent or contain values for a number of posts (e.g., tweets, notifications, submissions, uploads, etc.) or individuals posting for a given identifier (e.g., hashtag, etc.).
- the shared x-axis can represent or contain values for time.
- the shared y-axis (or multiple y-axes) can represent or contain values for regions (e.g., continent, country, state, county, city, district, etc.).
- Additional or alternate possible shared axes include demographic factors (e.g., age, sex, income, occupation, relationship status, number of children, religious affiliation, political party membership, etc.).
- the z-axis (or multiple z-axes) can represent or contain values for people or number of people posting with a given identifier.
- the tensor GSVD and/or HO GSVD can be performed to determine similarities and dissimilarities between the levels of discussion of two hashtags (or among more than two) over time and in different regions (e.g., cities).
- methods of the subject technology can be implemented in the field of climate and environment.
- data relating to climate can be tabulated in tensors.
- Each tensor can represent or contain values for climate data for a given factor (e.g., atmosphere characteristics, infrared clouds, chemistry, ozone, aerosols, outgoing long wave energy, ocean characteristics, dissolved oxygen at different depths, land characteristics, vegetation, cryosphere characteristics, snow and ice cover, and climate, observations, simulations, factors created by humans, chemical characteristics, light pollution characteristics, geophysical measurements, satellite observations, data from the National Oceanic and Atmospheric Administration, biological measurements, abundance levels, genomic sequences of living organisms, etc.).
- the shared x-axis can represent or contain values for location (e.g., latitude, etc.).
- the shared y-axis (or multiple y-axes) can represent or contain values for location (e.g., longitude, etc.). Additional possible shared axes can include geophysical factors (e.g., elevation, day in the year, etc.).
- the tensor GSVD and/or HO GSVD can be performed to determine similarities and dissimilarities between the variations of two climate and environmental factors (or among more than two) across latitude and longitude (and possibly also, e.g., elevation, and day in the year).
- methods of the subject technology can be implemented in the field of recommendation systems.
- data relating to recommendations can be tabulated in tensors.
- Each tensor can represent or contain values for recommendation data for a given user (e.g., user identity, type of media, experience ratings, etc.).
- the shared x-axis (or multiple x-axes) and the shared y-axis (or multiple y-axes) can represent or contain values for demographic factors (e.g., income level, state, or city).
- the z-axis can represent or contain values for types of examples of media or other consumer products and servcies (e.g., movies, books, music, dining, vacation locations, etc.).
- the tensor GSVD and/or HO GSVD can be performed to determine similarities and dissimilarities between user, or experience ratings of movies and books (or among more than two consumer products, including, e.g., vacation sites) across consumer demographics (e.g., income level, location, state, city, etc.).
- the tensor GSVD can also be used to help individuals make life decisions such as college, field of study, where to live, etc., provided that some sort of quantified information (e.g., subject's satisfaction on a scale of 1 to 10) is available.
- Shared axes could include demographic data, grades, test scores, membership in various organizations, etc. This data could be cross-correlated with other fields (e.g., social media, politics) that have similar demographic data as shared axes.
- methods of the subject technology can be implemented in the field of fitness management.
- data relating to fitness e.g., frequencies or levels of one type of exercise, frequencies or amounts of any one food, SNP profiles, measured, e.g., by DNA microarrays, etc.
- tensors can represent or contain values for fitness data for a given user.
- the shared x-axis can represent or contain values for vital signs (e.g., blood pressure, heart rate, etc.). Additional possible shared axes can include additional fitness factors (e.g., additional vital signs, weight, cholesterol levels), life style indicators (e.g., occupation), and family history.
- Tensors can correspond to exercise data, nutrition data, and/or any one of additional possible effectors of fitness (e.g., genetics as measured by, e.g., single- nucleotide polymorphism, i.e., SNP, profile, etc.)
- the z-axis (or multiple z-axes) can represent or contain values for different types of exercises, different types of foods, different probes of a SNP profile.
- the tensor GSVD and/or HO GSVD can be performed to determine similarities and dissimilarities between the two fitness effectors of exercise and nutrition (or among more than two fitness effectors, including, e.g., genetics) and their correlations with two or more fitness factors, e.g., vital signs, life style indicators, and family history.
- methods of the subject technology can be implemented in the field of marketing and advertising.
- data relating to numbers of purchases can be tabulated in tensors.
- Each tensor can represent or contain values for purchase data for a given source of goods and/or services (e.g., store, chain of stores, website, etc.).
- the shared x-axis can represent or contain values for a first demographic factor (e.g., income level, etc.).
- the shared y-axis (or multiple y-axes) can represent or contain values for a second demographic factor (e.g., state or city, etc.).
- the z-axis can represent or contain values for different items from one or more stores (e.g., different items from store 1, or chain 1, different items from store 2, or chain 2, different items from store 3, or chain 3, etc.).
- the tensor GSVD and/or HO GSVD can be performed to determine similarities and dissimilarities between purchases in two stores or chains (or among more than two stores) across consumer demographics, e.g., income level, and state or city. This could also be used to inform, e.g., targeted advertising.
- methods of the subject technology can be implemented in the field of astrophysics.
- data relating to intensities can be tabulated in tensors.
- Each tensor can represent or contain values for data from a given telescope and/or operating parameter (e.g., frequency, etc.).
- the shared x-axis can represent or contain values for first celestial coordinates.
- the shared y-axis (or multiple y-axes) can represent or contain values for second celestial coordinates.
- the z-axis (or multiple z-axes) can represent or contain values for time points measured by different telescopes.
- the tensor GSVD and/or HO GSVD can be performed to determine similarities and dissimilarities between sky surveys of two telescopes (or among more than two telescopes) at the same or different frequencies across celestial coordinates. Dissimilar variations might correspond to experimental variation between the two (or among the more than two) telescopes. Similarities might correspond to different recordings of the same astrophysical event by the two, or more telescopes.
- methods of the subject technology can be implemented in the field of voice and speech recognition.
- data relating to intensities can be tabulated in tensors.
- Each tensor can represent or contain values for data for a given user.
- the shared x-axis can represent or contain values for a first speech characteristic (e.g., phonemes, etc.).
- the shared y-axis (or multiple y-axes) can represent or contain values for a second speech characteristic (e.g., notes, etc.).
- the z-axis (or multiple z-axes) can represent or contain values for time points in a recording of a corresponding user.
- the tensor GSVD and/or HO GSVD can be performed to determine similarities and dissimilarities between two speakers or singers (or among more than two) across commonly defined speech characteristics. This might identify the speech characteristics signature of each individual person, and be used in voice recognition.
- TF-IDFs term frequency-inverse document frequencies
- tensors can represent or contain values for data for a given language.
- the shared x- axis can represent or contain values for books or other literary works.
- the shared y-axis (or multiple y-axes) can represent or contain values for chapters and/or verses.
- the z-axis (or multiple z-axes) can represent or contain values for N-grams (e.g., phonemes, syllables, letters, words, etc.) with respect to the corresponding language represented by the tensor.
- the tensor GSVD and/or HO GSVD can be performed to determine similarities and dissimilarities between two languages (or among more than two languages) in TF-IDFs of different n-grams across books and chapters in books.
- methods of the subject technology can be implemented in the field of market demand and manufacturing.
- data relating to market activity can be tabulated in tensors.
- Each tensor can represent or contain values for market data for a given indicator (e.g., number of items sold, value of items sold, employment rate, weather indicator, time, etc.).
- the shared x-axis can represent or contain values for location.
- the shared y-axis (or multiple y-axes) can represent or contain values for time (e.g., day in the year).
- the z-axis (or multiple z-axes) can represent or contain values for availability of an item (e.g., measures in time span, etc.).
- the tensor GSVD and/or HO GSVD can be performed to determine similarities and dissimilarities between sales and an effector of sales, e.g., an economic indicator (or among sales, more than one effector, including, e.g., weather) and their correlations with location and day in the year. This could be used to predict market demand, and tailor manufacturing.
- an effector of sales e.g., an economic indicator (or among sales, more than one effector, including, e.g., weather) and their correlations with location and day in the year. This could be used to predict market demand, and tailor manufacturing.
- methods of the subject technology can be implemented in the field of education and personal development.
- data relating to student characteristics can be tabulated in tensors.
- Each tensor can represent or contain values for student data (e.g., books read, etc.) for a given characteristic (e.g., GPA, school attended, etc.).
- the shared x-axis (or multiple x-axes) and the shared y-axis (or multiple y-axes) can represent or contain values for demographic factors (e.g., income level of parents, state or city of high school, etc.).
- the z-axis can represent or contain values for books read (e.g., list of books read by at least one student with GPA 4.0, list of books read by at least one student with GPA 3.0, list of books read by at least one student with GPA 2.0, etc.).
- the tensor GSVD and/or HO GSVD can be performed to determine similarities and dissimilarities between students with GPA 4.0 and 3.0 (or among more than two groups of students, including, e.g., those with GPA 2.0) across demographic factors, and in terms of books read or unread. This could be used to identify the reading habits that are exclusive to students with high, 4.0 GPA at University X.
- FIG. 11 is a simplified diagram of a system 1100, in accordance with various embodiments of the subject technology.
- the system 1100 may include one or more remote client devices 1102 (e.g., client devices 1102a, 1102b, 1102c, 1102d, and 1102e) in communication with one or more server computing devices 1106 (e.g., servers 1106a and 1106b) via network 1104.
- a client device 1102 is configured to run one or more applications based on communications with a server 1106 over a network 1104.
- a server 1106 is configured to run one or more applications based on communications with a client device 1102 over the network 1104.
- a server 1106 is configured to run one or more applications that may be accessed and controlled at a client device 1102. For example, a user at a client device 1102 may use a web browser to access and control an application running on a server 1106 over the network 1104.
- a server 1106 is configured to allow remote sessions (e.g., remote desktop sessions) wherein users can access applications and files on a server 1106 by logging onto a server 1106 from a client device 1102. Such a connection may be established using any of several well-known techniques such as the Remote Desktop Protocol (RDP) on a Windows-based server.
- RDP Remote Desktop Protocol
- a server application is executed (or runs) at a server 1106. While a remote client device 1102 may receive and display a view of the server application on a display local to the remote client device 1102, the remote client device 1102 does not execute (or run) the server application at the remote client device 1102. Stated in another way from a perspective of the client side (treating a server as remote device and treating a client device as a local device), a remote application is executed (or runs) at a remote server 1106.
- a client device By way of illustration and not limitation, in some embodiments, a client device
- a client device 1102 can represent a desktop computer, a mobile phone, a laptop computer, a netbook computer, a tablet, a thin client device, a personal digital assistant (PDA), a portable computing device, and/or a suitable device with a processor.
- a client device 1102 is a smartphone (e.g., iPhone, Android phone, Blackberry, etc.).
- a client device 1102 can represent an audio player, a game console, a camera, a camcorder, a Global Positioning System (GPS) receiver, a television set top box an audio device, a video device, a multimedia device, and/or a device capable of supporting a connection to a remote server.
- a client device 1102 can be mobile.
- a client device 1102 can be stationary. According to certain embodiments, a client device 1102 may be a device having at least a processor and memory, where the total amount of memory of the client device 1102 could be less than the total amount of memory in a server 1106. In some embodiments, a client device 1102 does not have a hard disk. In some embodiments, a client device 1102 has a display smaller than a display supported by a server 1106. In some aspects, a client device 1102 may include one or more client devices.
- a server 1106 may represent a computer, a laptop computer, a computing device, a virtual machine (e.g., VMware® Virtual Machine), a desktop session (e.g., Microsoft Terminal Server), a published application (e.g., Microsoft Terminal Server), and/or a suitable device with a processor.
- a server 1106 can be stationary.
- a server 1 106 can be mobile.
- a server 1106 may be any device that can represent a client device.
- a server 1106 may include one or more servers.
- a first device is remote to a second device when the first device is not directly connected to the second device.
- a first remote device may be connected to a second device over a communication network such as a Local Area Network (LAN), a Wide Area Network (WAN), and/or other network.
- LAN Local Area Network
- WAN Wide Area Network
- a client device 1102 may connect to a server 1106 over the network 1104, for example, via a modem connection, a LAN connection including the Ethernet or a broadband WAN connection including DSL, Cable, Tl, T3, Fiber Optics, Wi-Fi, and/or a mobile network connection including GSM, GPRS, 3G, 4G, 4G LTE, WiMax or other network connection.
- Network 1104 can be a LAN network, a WAN network, a wireless network, the Internet, an intranet, and/or other network.
- the network 1104 may include one or more routers for routing data between client devices and/or servers.
- a remote device e.g., client device, server
- a corresponding network address such as, but not limited to, an Internet protocol (IP) address, an Internet name, a Windows Internet name service (WINS) name, a domain name, and/or other system name.
- IP Internet protocol
- WINS Windows Internet name service
- server and “remote server” are generally used synonymously in relation to a client device, and the word “remote” may indicate that a server is in communication with other device(s), for example, over a network connection(s).
- client device and “remote client device” are generally used synonymously in relation to a server, and the word “remote” may indicate that a client device is in communication with a server(s), for example, over a network connection(s).
- a "client device” may be sometimes referred to as a client or vice versa.
- a “server” may be sometimes referred to as a server device or server computer or like terms.
- the terms "local” and “remote” are relative terms, and a client device may be referred to as a local client device or a remote client device, depending on whether a client device is described from a client side or from a server side, respectively.
- a server may be referred to as a local server or a remote server, depending on whether a server is described from a server side or from a client side, respectively.
- an application running on a server may be referred to as a local application, if described from a server side, and may be referred to as a remote application, if described from a client side.
- devices placed on a client side may be referred to as local devices with respect to a client device and remote devices with respect to a server.
- devices placed on a server side may be referred to as local devices with respect to a server and remote devices with respect to a client device.
- FIG. 12 is a block diagram illustrating an exemplary computer system 1200 with which a client device 1102 and/or a server 1106 of FIG. 11 can be implemented.
- the computer system 1200 may be implemented using hardware or a combination of software and hardware, either in a dedicated server, or integrated into another entity, or distributed across multiple entities.
- the computer system 1200 (e.g., client 1102 and servers 1106) includes a bus
- the computer system 1200 may be implemented with one or more processors 1202.
- the processor 1202 may be a general-purpose microprocessor, a microcontroller, a Digital Signal Processor (DSP), an Application Specific Integrated Circuit (ASIC), a Field Programmable Gate Array (FPGA), a Programmable Logic Device (PLD), a controller, a state machine, gated logic, discrete hardware components, and/or any other suitable entity that can perform calculations or other manipulations of information.
- DSP Digital Signal Processor
- ASIC Application Specific Integrated Circuit
- FPGA Field Programmable Gate Array
- PLD Programmable Logic Device
- controller a state machine, gated logic, discrete hardware components, and/or any other suitable entity that can perform calculations or other manipulations of information.
- the computer system 1200 can include, in addition to hardware, code that creates an execution environment for the computer program in question, e.g., code that constitutes processor firmware, a protocol stack, a database management system, an operating system, or a combination of one or more of them stored in an included memory 1204, such as a Random Access Memory (RAM), a flash memory, a Read Only Memory (ROM), a Programmable Read-Only Memory (PROM), an Erasable PROM (EPROM), registers, a hard disk, a removable disk, a CD- ROM, a DVD, and/or any other suitable storage device, coupled to the bus 1208 for storing information and instructions to be executed by the processor 1202.
- the processor 1202 and the memory 1204 can be supplemented by, or incorporated in, special purpose logic circuitry.
- the instructions may be stored in the memory 1204 and implemented in one or more computer program products, i.e., one or more modules of computer program instructions encoded on a computer readable medium for execution by, or to control the operation of, the computer system 1200, and according to any method well known to those of skill in the art, including, but not limited to, computer languages such as data-oriented languages (e.g., SQL, dBase), system languages (e.g., C, Objective-C, C++, Assembly), architectural languages (e.g., Java, .NET), and/or application languages (e.g., PHP, Ruby, Perl, Python).
- data-oriented languages e.g., SQL, dBase
- system languages e.g., C, Objective-C, C++, Assembly
- architectural languages e.g., Java, .NET
- application languages e.g., PHP, Ruby, Perl, Python
- Instructions may also be implemented in computer languages such as array languages, aspect-oriented languages, assembly languages, authoring languages, command line interface languages, compiled languages, concurrent languages, curly-bracket languages, dataflow languages, data-structured languages, declarative languages, esoteric languages, extension languages, fourth-generation languages, functional languages, interactive mode languages, interpreted languages, iterative languages, list- based languages, little languages, logic-based languages, machine languages, macro languages, metaprogramming languages, multiparadigm languages, numerical analysis, non-English-based languages, object-oriented class-based languages, object-oriented prototype-based languages, offside rule languages, procedural languages, reflective languages, rule-based languages, scripting languages, stack-based languages, synchronous languages, syntax handling languages, visual languages, wirth languages, and/or xml-based languages.
- the memory 1204 may also be used for storing temporary variable or other intermediate information during execution of instructions to be executed by the processor 1202.
- a computer program as discussed herein does not necessarily correspond to a file in a file system.
- a program can be stored in a portion of a file that holds other programs or data (e.g., one or more scripts stored in a markup language document), in a single file dedicated to the program in question, or in multiple coordinated files (e.g., files that store one or more modules, subprograms, or portions of code).
- a computer program can be deployed to be executed on one computer or on multiple computers that are located at one site or distributed across multiple sites and interconnected by a communication network.
- the processes and logic flows described in this specification can be performed by one or more programmable processors executing one or more computer programs to perform functions by operating on input data and generating output.
- the computer system 1200 further includes a data storage device 1206 such as a magnetic disk or optical disk, coupled to the bus 1208 for storing information and instructions.
- the computer system 1200 may be coupled via an input/output module 1210 to various devices (e.g., devices 1214 and 1216).
- the input/output module 1210 can be any input/output module.
- Exemplary input/output modules 1210 include data ports (e.g., USB ports), audio ports, and/or video ports.
- the input/output module 1210 includes a communications module.
- Exemplary communications modules include networking interface cards, such as Ethernet cards, modems, and routers.
- the input/output module 1210 is configured to connect to a plurality of devices, such as an input device 1214 and/or an output device 1216.
- exemplary input devices 1214 include a keyboard and/or a pointing device (e.g., a mouse or a trackball) by which a user can provide input to the computer system 1200.
- Other kinds of input devices 1214 can be used to provide for interaction with a user as well, such as a tactile input device, visual input device, audio input device, and/or brain-computer interface device.
- feedback provided to the user can be any form of sensory feedback (e.g., visual feedback, auditory feedback, and/or tactile feedback), and input from the user can be received in any form, including acoustic, speech, tactile, and/or brain wave input.
- exemplary output devices 1216 include display devices, such as a cathode ray tube (CRT) or liquid crystal display (LCD) monitor, for displaying information to the user.
- CTR cathode ray tube
- LCD liquid crystal display
- a client device 1102 and/or server 1106 can be implemented using the computer system 1200 in response to the processor 1202 executing one or more sequences of one or more instructions contained in the memory 1204. Such instructions may be read into the memory 1204 from another machine-readable medium, such as the data storage device 1206. Execution of the sequences of instructions contained in the memory 1204 causes the processor 1202 to perform the process steps described herein. One or more processors in a multi-processing arrangement may also be employed to execute the sequences of instructions contained in the memory 1204. In some embodiments, hard-wired circuitry may be used in place of or in combination with software instructions to implement various aspects of the present disclosure. Thus, aspects of the present disclosure are not limited to any specific combination of hardware circuitry and software.
- a computing system that includes a back end component (e.g., a data server), or that includes a middleware component (e.g., an application server), or that includes a front end component (e.g., a client computer having a graphical user interface and/or a Web browser through which a user can interact with an implementation of the subject matter described in this specification), or any combination of one or more such back end, middleware, or front end components.
- the components of the system 1200 can be interconnected by any form or medium of digital data communication (e.g., a communication network). Examples of communication networks include a local area network and a wide area network.
- machine-readable storage medium or “computer readable medium” as used herein refers to any medium or media that participates in providing instructions to the processor 1202 for execution. Such a medium may take many forms, including, but not limited to, non-volatile media, volatile media, and transmission media.
- Non-volatile media include, for example, optical or magnetic disks, such as the data storage device 1206.
- Volatile media include dynamic memory, such as the memory 1204.
- Transmission media include coaxial cables, copper wire, and fiber optics, including the wires that comprise the bus 1208.
- Machine-readable media include, for example, floppy disk, a flexible disk, hard disk, magnetic tape, any other magnetic medium, a CD-ROM, DVD, any other optical medium, punch cards, paper tape, any other physical medium with patterns of holes, a RAM, a PROM, an EPROM, a FLASH EPROM, any other memory chip or cartridge, or any other medium from which a computer can read.
- the machine-readable storage medium can be a machine-readable storage device, a machine-readable storage substrate, a memory device, a composition of matter effecting a machine-readable propagated signal, or a combination of one or more of them.
- a "processor” can include one or more processors, and a
- module can include one or more modules.
- a machine-readable medium is a computer-readable medium encoded or stored with instructions and is a computing element, which defines structural and functional relationships between the instructions and the rest of the system, which permit the instructions' functionality to be realized. Instructions may be executable, for example, by a system or by a processor of the system. Instructions can be, for example, a computer program including code.
- a machine-readable medium may comprise one or more media.
- module refers to logic embodied in hardware or firmware, or to a collection of software instructions, possibly having entry and exit points, written in a programming language, such as, for example C++. Two or more modules may be embodied in a single piece of hardware, firmware or software. A software module may be compiled and linked into an executable program, installed in a dynamic link library, or may be written in an interpretive language such as BASIC. It will be appreciated that software modules may be callable from other modules or from themselves, and/or may be invoked in response to detected events or interrupts. Software instructions may be embedded in firmware, such as an EPROM or EEPROM.
- hardware modules may be comprised of connected logic units, such as gates and flip-flops, and/or may be comprised of programmable units, such as programmable gate arrays or processors.
- the modules described herein are preferably implemented as software modules, but may be represented in hardware or firmware.
- modules may be integrated into a fewer number of modules.
- One module may also be separated into multiple modules.
- the described modules may be implemented as hardware, software, firmware or any combination thereof. Additionally, the described modules may reside at different locations connected through a wired or wireless network, or the Internet.
- the processors can include, by way of example, computers, program logic, or other substrate configurations representing data and instructions, which operate as described herein.
- the processors can include controller circuitry, processor circuitry, processors, general purpose single-chip or multi-chip microprocessors, digital signal processors, embedded microprocessors, microcontrollers and the like.
- the program logic may advantageously be implemented as one or more components.
- the components may advantageously be configured to execute on one or more processors.
- the components include, but are not limited to, software or hardware components, modules such as software modules, object- oriented software components, class components and task components, processes methods, functions, attributes, procedures, subroutines, segments of program code, drivers, firmware, microcode, circuitry, data, databases, data structures, tables, arrays, and variables.
- a phrase such as "an aspect” does not imply that such aspect is essential to the subject technology or that such aspect applies to all configurations of the subject technology.
- a disclosure relating to an aspect may apply to all configurations, or one or more configurations.
- An aspect may provide one or more examples of the disclosure.
- a phrase such as “an aspect” may refer to one or more aspects and vice versa.
- a phrase such as “an embodiment” does not imply that such embodiment is essential to the subject technology or that such embodiment applies to all configurations of the subject technology.
- a disclosure relating to an embodiment may apply to all embodiments, or one or more embodiments.
- An embodiment may provide one or more examples of the disclosure.
- a phrase such "an embodiment” may refer to one or more embodiments and vice versa.
- a phrase such as "a configuration” does not imply that such configuration is essential to the subject technology or that such configuration applies to all configurations of the subject technology.
- a disclosure relating to a configuration may apply to all configurations, or one or more configurations.
- a configuration may provide one or more examples of the disclosure.
- a phrase such as "a configuration” may refer to one or more configurations and vice versa.
- the phrase "at least one of preceding a series of items, with the term “and” or “or” to separate any of the items, modifies the list as a whole, rather than each member of the list (i.e., each item).
- phrases “at least one of A, B, and C” or “at least one of A, B, or C” each refer to only A, only B, or only C; any combination of A, B, and C; and/or at least one of each of A, B, and C.
- top should be understood as referring to an arbitrary frame of reference, rather than to the ordinary gravitational frame of reference.
- a top surface, a bottom surface, a front surface, and a rear surface may extend upwardly, downwardly, diagonally, or horizontally in a gravitational frame of reference.
- GSVD novel tensor generalized singular value decomposition
- these patterns include most known OV-associated CNAs that map to these chromosome arms, as well as several previously unreported, yet frequent focal CNAs.
- differential mRNA, microRNA, and protein expression consistently map to the DNA CNAs. A coherent picture emerges for each pattern, suggesting roles for the CNAs in OV pathogenesis and personalized therapy.
- deletion of the p21-encoding CDKNlA and p38-encoding MAPK14 and amplification of RAD51AP1 and KRAS encode for human cell transformation, and are correlated with a cell's immortality, and a patient's shorter survival time.
- RPA3 deletion and P0LD2 amplification are correlated with DNA stability, and a longer survival.
- PABPC5 deletion and BCAP31 amplification are correlated with a cellular immune response, and a longer survival.
- Profiles of tumor and normal tissues from the same set of patients have the structure of two matrices, i.e., second-order tensors, with a one-to-one mapping between the columns that correspond to the same set of patients, but not necessarily between the rows that correspond to the DNA copy-number probes with valid data in either the tumor or the normal dataset, and may be different.
- the structure of the tumor and normal datasets is that of two third-order tensors, of matched columns that correspond to the same sets of patients and platforms, and independent rows that correspond to the probes in either the tumor or the normal dataset.
- the higher-order generalized singular value decomposition is the only simultaneous decomposition to date of more than two such column-matched but row-independent datasets, which is by definition exact, and which mathematical properties allow interpreting its variables and operations in terms of the similar as well as dissimilar, e.g., biomedical reality among the datasets [3, 4] .
- the HO GSVD generalizes the GSVD [5-12] , which was demonstrated in comparative modeling of, e.g., patient- matched but probe-independent glioblastoma (GBM) brain tumor and normal DNA copy-number profiles from TCGA [13] .
- GSVD and HO GSVD are limited to datasets arranged in second-order tensors, i.e., matrices.
- a novel tensor GSVD i.e., an exact simultaneous decomposition of two datasets, arranged in two higher-than-second-order tensors of matched column dimensions but independent row dimensions.
- the tensor GSVD factors or separates the pair of tensors into corresponding pairs of "subtensors," i.e., pairs of outer products or combinations of a paired set of patterns each: patterns, one across each of the matched column dimensions, which are identical for both tensors, combined with one pattern across the independent row dimension of either one of the two tensors.
- the pairs of subtensors are of varying relative mathematical significance, i.e., the significance of one subtensor in a pair in the corresponding tensor relative to the significance of the second subtensor in the second tensor varies among the pairs of subtensors.
- the tensor GSVD extends the GSVD and the tensor higher-order singular value decomposition (HOSVD) [25-28] from a decomposition of either two column- matched matrices or one tensor, respectively, to a decomposition of two order- matched, column-matched, and row-independent tensors [29] .
- HSVD singular value decomposition
- Discovery Datasets are Pairs of Column-Matched but Row-Independent Tensors.
- the structure of these tumor and normal discovery datasets T>i and T> 2 , of .ft ⁇ -tumor and _ftT 2 - norma l probes x ⁇ patients, i.e., arrays x -platforms, is that of two third-order tensors with one-to-one mappings between the column dimensions L and M, but different row dimensions K ⁇ and K ⁇ , where K ⁇ , K 2 > LM.
- a novel tensor GSVD that simultaneously separates the paired datasets into weighted sums of LM paired "subtensors," i.e., combinations or outer products of three patterns each: Either one tumor-specific pattern of copy-number variation across the tumor probes, i.e., a "tumor arraylet” u ⁇ a , or the corresponding normal-specific pattern across the normal probes, i.e., the "normal arraylet” « 2, a , combined with one pattern of copy-number variation across the patients, i.e., an "i-probelet” wj b and one pattern across the platforms, i.e., a "3 ⁇ 4 -probelet” c , which are identical for both the tumor and normal datasets (Fig. 1, and Figs. A and B in SI Appendix),
- x a Ui, x b V x and x c V y denote tensor-matrix multiplications, which contract the L -arraylet, L ⁇ x- probelet, and -3 ⁇ 4 -probelet dimensions of the "core tensor" 73 ⁇ 4 with those of Ui, V x , and V y , respectively, and where ® denotes an outer product.
- the column bases vectors are normalized and orthogonal, i.e., uncorrelated, such that Figure 1.
- GSVD Tensor generalized singular value decomposition
- the structure of the tumor and normal discovery datasets (T>i and 23 ⁇ 4) is that of two third-order tensors with one-to-one mappings between the column dimensions but different row dimensions.
- the patients, platforms, probes, and tissue types each represent a degree of freedom. Unfolded into a single matrix, some of the degrees of freedom are lost and much of the information in the datasets might also be lost.
- a tensor GSVD that simultaneously separates the paired datasets into weighted sums of paired subtensors, i.e., combinations or outer products of three patterns each: Either one tumor-specific pattern of copy-number variation across the tumor probes, i.e., a tumor arraylet (a column basis vector of U ⁇ ), or the corresponding normal-specific arraylet (a column basis vector of L3 ⁇ 4), combined with one pattern of variation across the patients, i.e., an i-probelet (a row basis vector of V X T ), and one pattern across the platforms, i.e., a j -probelet (a row basis vector of V ⁇ ), which are identical for both the tumor and normal datasets (Eq.
- a tumor arraylet a column basis vector of U ⁇
- the corresponding normal-specific arraylet a column basis vector of L3 ⁇ 4
- the tensor GSVD is depicted in a raster display, with relative copy-number gain (red), no change (black), and loss (green), explicitly showing the first through the 5th, and the 245th through the 249th 6p+12p i-probelets, both 6p+12p 3 ⁇ 4 -probelets, and the first through the 10th, and the 489th through the 498th 6p+12p tumor and normal arraylets.
- the significance of a subtensor in the tumor dataset relative to that of the corresponding subtensor in the normal dataset i.e., the tensor GSVD angular distance
- the row mode GSVD angular distance i.e., the significance of the corresponding tumor arraylet in the tumor dataset relative to that of the normal arraylet in the normal dataset.
- the tensor GSVD angular distances for the 498 pairs of 6p+12p arraylets are depicted in a bar chart display, where the angular distance corresponding to the first pair of arraylets is ⁇ /4.
- the most significant subtensor in the tumor dataset (which corresponds to the coefficient of largest magnitude in IZi) is a combination of (i) the first j -probelet, which is approximately invariant across the platforms, (ii) the first i-probelet, which classifies the discovery set of patients into two groups of high and low coefficients, of significantly and robustly different prognoses, and (in) the first, most tumor-exclusive tumor arraylet, which classifies the validation set of patients into two groups of high and low correlations of significantly different prognoses consistent with the i-probelet's classification of the discovery set.
- the generalized singular values are positive, and are arranged in ⁇ i 5 ⁇ ix , and ⁇ iy in decreasing orders of the corresponding "GSVD angular distances," i.e., decreasing orders of the ratios ⁇ ⁇ / ⁇ 2, ⁇ , cix, b /c'2x, b , and ai yt C /a2y,c, respectively.
- the "tensor generalized singular values" 73 ⁇ 4 ia t, c tabulated in the core tensors are real but not necessarily positive.
- Our tensor GSVD construction generalizes the GSVD to higher orders in analogy with the generalization of the singular value decomposition (SVD) by the HOSVD [25-28] , and is different from other approaches to the decomposition of two tensors [29] .
- the tensor GSVD has the same uniqueness properties as the GSVD, where the column bases vectors u ⁇ a and the row bases vectors wj b and wj c are unique, except in degenerate subspaces, defined by subsets of equal generalized singular values a ix , and a iy , respectively, and up to phase factors of ⁇ 1, such that each vector captures both parallel and antiparallel patterns (Lemma B in SI Appendix).
- the tensor GSVD of two second-order tensors reduces to the GSVD of the corresponding matrices (Corollary A in SI Appendix).
- ⁇ ⁇ arctan(CT li0 /CT 2i0 ) - ⁇
- the ratio ⁇ ⁇ / ⁇ 2 ⁇ indicates the significance of u ⁇ a in D relative to the significance of «2 i(I in I3 ⁇ 4) this relative significance is defined, as previously described [12, 13], by the angular distance ⁇ ⁇ , a function of the ratio ⁇ ⁇ / ⁇ 2 ⁇ , which is antisymmetric in D and !3 ⁇ 4 ⁇
- the angular distance ⁇ ⁇ which is a function of the arctangent of the ratio, i.
- the subtensor to be tumor-exclusive and platform-consistent: include the tumor arraylet u ⁇ a that is the most exclusive to the tumor dataset, i.e., « ⁇ , ⁇ , as well as a 3 ⁇ 4 -probelet Vy C of consistent, i.e., approximately equal copy numbers in both platforms.
- the subtensor to be correlated with an OV patient's prognosis in the discovery set of patients, i.e., include an i-probelet wj b that classifies the discovery set of patients into two groups of high (>0.5 standardized median absolute deviation, i.e., sMAD, from the median) and low coefficients, of significantly (log-rank test P- value ⁇ 0.05) and robustly (throughout the range of ⁇ 0.1 sMAD around the cutoff) different prognoses (Fig. 2).
- the subtensor to be correlated with prognosis in the validation set of patients, i.e., include an arraylet that classifies the validation set of patients into two groups of high and low Spearman's rank correlation coefficients of significantly different prognoses, consistent with the i-probelet's classification of the discovery set of patients (Fig. 3, and Sec. 1.3 in SI Appendix).
- the validation set includes 148 TCGA patients, mutually exclusive of the discovery set, with primary OV tumor profiles measured by at least one of the two DNA microarray platforms that were used to measure the discovery datasets (S2 Dataset).
- CNAs Tumor-exclusive and platform-consistent DNA copy-number alterations correlated with ovarian serous cystadenocarcinoma (OV) patients' survival
- Plot of the first 6p+12p tumor arraylet describes a pattern of tumor-exclusive and platform-consistent co-occurring CNAs across the combination of the two chromosome arms 6p+12p.
- the probes are ordered, and their copy numbers are colored according to each probe's chromosomal band location.
- Segments (black lines) amplified and deleted include most known OV-associated CNAs that map to 6p+12p (black), including an amplification of KRAS and a deletion of PRIM2.
- CNAs previously unrecognized in OV include a deletion of the p38-encoding MAPK14, and p21-encoding CDKNlA, and an amplification of RAD51AP1, a deletion of TNF, and focal amplifications of ASUN, ITPR2, and the 5' ends of isoforms a and e, and exons 5 and 6 of SOX5.
- a high 6p+12p arraylet correlation is significantly correlated with a patient's shorter survival time.
- Plot of the first 6p+12p i-probelet describes the classification of the discovery set of patients into two groups of high (blue) and low (red) coefficients.
- a high 6p+12p ⁇ -probelet coefficient is significantly and robustly correlated with a patient's shorter survival time
- (d) Plot of the first 7p tumor arraylet describes a pattern of CNAs across the chromosome arm 7p.
- CNAs previously unrecognized in OV (red) include a focal deletion of RPA3 and an amplification of POLD2.
- a high 7p arraylet correlation is significantly correlated with a patient's longer survival time.
- ( e) Plot of the first 7p i-probelet describes the classification of the discovery set of patients into two groups of high (red) and low (blue) coefficients.
- a high 7p i-probelet coefficient is significantly and robustly correlated with a patient's longer survival time.
- CNAs previously unrecognized in OV (red) include a focal deletion of PABPC5 and an amplification of BCAP31.
- a high Xq arraylet correlation is significantly correlated with a patient's longer survival time
- (h) Plot of the first Xq i-probelet describes the classification of the discovery set of patients into two groups of high (red) and low (blue) coefficients.
- a high Xq i-probelet coefficient is significantly and robustly correlated with a patient's longer survival time,
- the 6p+12p tensor GSVD and stage are independent predictors of survival. Therefore, combined with any one of the standard indicators, each of the three tensor GSVDs makes a better predictor than the standard indicator alone (Figs. H and I in SI Appendix).
- the Kaplan-Meier (KM) median survival time difference of 61 months among the discovery set of patients classified by both the 6p+12p tensor GSVD and stage is about 85% and more than two years greater than the 33 month difference between the patients classified by stage alone [19] .
- the KM median survival difference of 34 months among the validation set of patients classified by both the 6p+12p tensor GSVD and stage is about 62% and more than one year greater than the 21 month difference between the patients classified by stage alone.
- the validation set reflects the high-stage OV patient population, with approximately 20% and 80% of the patients diagnosed at stages III and IV, respectively.
- the 6p+12p, 7p, and Xq tensor GSVDs therefore, predict survival both in the general as well as in the high-stage OV patient population.
- the discovery and validation sets each include mostly, i.e., >95% high-grade, i.e., grades 2 and higher tumors. Tumor grade does not correlate with survival in either the discovery or the validation set of patients.
- group B the three combinations where just one of the three binomial classifications differs from that of group A, indicate shorter survival time and worse response to chemotherapy than those of group A.
- group C the four combinations where at least two of the three binomial classifications differ from that of group A, indicate shorter survival time and worse response to chemotherapy than those of group B as well as group A.
- the KM median survival times of the discovery set of patients classified into groups A, B, and C are 86, 52, and 36 months, such that the median survival time of group A is more than four years greater than, and more than twice that of group C.
- OV tumors exhibit significant CNA variation among them, much more so than, e.g., GBM brain tumors [2, 13] . Very few frequently occurring OV CNAs have been identified to date.
- the three tensor GSVD arraylets include most known OV-associated CNAs that map to the corresponding chromosome arms, and several previously unreported yet frequent CNAs in >23% of the patients.
- the 6p+12p arraylet includes two segments corresponding to the only known OV focal CNAs that map to 6p+12p, 7p, or Xq (Sec. 2.2 in SI Appendix).
- One, a deletion (6pll.2) overlaps the 3' end unique to isoform a of the DNA primase polypeptide 2- encoding PRIM2 [2] .
- the three arraylet patterns include novel frequent focal CNAs (segments ⁇ 125 probes).
- four amplifications and two deletions are significantly correlated with OV survival (Fig. J in SI Appendix).
- the amplifications flank the segment that contains KRAS.
- Two consecutive segments (12pl2.1) contain the 5' ends of isoforms a and e of SOX5, and exons 5 and 6, the first exons that are common to isoforms a, b, d, and e of SOX5 [35] .
- Two other consecutive segments (12pll.23) contain the inositol 1,4,5-trisphosphate receptor type 2-encoding ITPR2, and the asunder spermatogenesis regulator-encoding ASUN.
- ASUN was discovered in a screen of expressed sequence tags on 12pl l-pl2, which DNA amplification correlated with mRNA overexpression in four human testicular seminomas and one ovarian papillary serous adenocarcinoma cell line, exemplifying human germ cell tumors [36] .
- ASUN and its homologs are essential for nuclear division after DNA replication in the HeLa human cervical cancer cell line, the frog, and the fly [37] .
- One deletion (7p22.1-p21.3) contains the replication protein A3-encoding RPA3.
- the other (Xq21.31) contains the cytoplasmic poly(A)-binding protein 5-encoding PABPC5, and the sequence tag site DXS241 adjacent to translocation breakpoints observed in premature ovarian failure [38] . Possible Roles in OV Pathogenesis.
- the differential mRNA expression of genes from these enriched ontologies that are located on any one of the chromosome arms is consistent with the CNAs across that arm (Fig. K in SI Appendix, and S4 Dataset). Genes that map to amplifications or deletions on any one arraylet pattern, are overexpressed or underexpressed, respectively, in the patients which tumor profiles are classified, by the corresponding tensor GSVD, as highly similar to that pattern, i.e., patients of high i-probelet coefficients or arraylet correlations.
- the differential expression of all microRNAs and proteins that map to any one of the chromosome arms is also consistent with the CNAs across that arm (Sec. 2.3, and Figs. L and M in SI Appendix, and S5 and S6 Datasets). A coherent picture emerges for each pattern, suggesting roles for the CNAs in OV pathogenesis in addition to personalized diagnosis, prognosis, and treatment.
- 6p+12p A cell's transformation and immortality are correlated with a patient's shorter survival.
- MHC major histocompatibility
- GO:0071479 genes are underexpressed, including the p21 cyclin-dependent kinase inhibitor-encoding CDKNlA, and the p38 mitogen- activated protein kinase-encoding MAPK14, which map to a deletion >45 Mbp on the telomeric part of 6p (6p25.3-p21.1). Also underexpressed is p38, the protein encoded by MAPK14- All GO:0042611 genes, including the tumor necrosis factor-encoding TNF, are underexpressed, and map to the same deletion.
- the one microRNA that is significantly differentially expressed between the 6p+12p tensor GSVD classes, and maps to the same deletion, is the splicing-dependent microRNA miR-877*, which is encoded by the 13th intron of the ATP- binding cassette subfamily F member 1-encoding gene ABCF1 [44] . Both miR-877* and ABCF1 are consistently underexpressed.
- RAD51 -associated protein 1-encoding RAD51AP1 maps to an amplification >9 Mbp on the telomeric part of 12p (12pl3.33-pl3.31) that is significantly correlated with OV survival.
- the second protein that is significantly differentially expressed between the 6p+12p tensor GSVD classes is p27.
- the cyclin-dependent kinase inhibitor CDKN1B which encodes p27, maps to a 4.5 Mbp amplification (12pl3.2-pl2.3) that is significantly correlated with OV survival, and its mRNA is overexpressed.
- the mRNA encoded by KRAS is also overexpressed.
- the 6p+12p pattern therefore, which includes the loss of the p21-encoding CDKNlA and the p38-encoding MAPK14 on 6p, and the gain of KRAS on 12p, encodes for cellular conditions that combined but not separately can lead to transformation.
- p21 and p38 are necessary for p53- mediated cell cycle arrest [45] and apoptosis [46] , respectively, in response to DNA damage.
- Overexpression of the p21-encoding CDKNlA is correlated with a low malignant potential of an ovarian tumor [47] .
- RAD51AP1 overexpression disrupts cell cycle arrest and apoptosis, can lead to cellular resistance to DNA-damaging cancer therapies, such as platinum- based chemotherapy, and may increase DNA instability [48] .
- TNF- induced apoptosis is correlated with downregulation of ITPR2 [49] .
- the genes that are significantly differentially expressed between the 7p tensor GSVD classes are enriched (hypergeometric P- value ⁇ 10 -10 ) in the ontology of DNA strand elongation involved in DNA replication (GO:0006271). Most of these genes are overexpressed, including the DNA polymerase delta subunit 2-encoding POLD2 that is essential for DNA replication and repair, which maps to an amplification >17 Mbp on the centromeric part of 7p (7pl4.1-pll.2). Only two genes are underexpressed: RPA3 on 7p and the DNA ligase IV- encoding LIG4 on 13q.
- Xq. Cellular immune response is correlated with a longer survival.
- the genes that are differentially expressed between the Xq tensor GSVD classes are enriched (hypergeometric P-value ⁇ 10 -6 ) in the ontology of antigen processing and presentation of peptide antigen (GO:0048002). Most of these genes are overexpressed, including the B-cell receptor-associated protein 31-encoding BCAP31, which maps to an amplification >11 Mbp on the telomeric part of Xq (Xq27.3-q28).
- the GSVD comparative modeling of patient-matched GBM tumor and normal copy-number profiles separated the prognosis-correlated GBM tumor-exclusive pattern from the female-specific X chromosome amplification as well as from experimental artifacts (or batch effects) due to experimental variations in, e.g., tissue batch, genomic center, hybridization date, and scanner, without a-priori knowledge of these variations.
- Additional possible applications of the tensor GSVD in personalized medicine include comparative modeling of two patient- and tissue-matched datasets, each corresponding to (i) a set of large-scale molecular biological profiles, e.g., DNA copy numbers, acquired by a high-throughput technology, e.g., DNA microarrays; (ii) a set of biomedical images or signals; or (in) a set of cellular pathological observations, e.g., a tumor's stage.
- Such tensor GSVD comparative models can uncover variations across the patients and tissues that are common to, possibly causally coordinated between the two aspects of the disease. In clinical settings, such tensor GSVD comparative models can determine an individual patient's medical status in relation to all the other patients in a set, and inform the patient's diagnosis, prognosis and treatment.
- a novel poly(A)-binding protein gene maps to an X-specific subinterval in the Xq21.3/Ypll.2 homology block of the human sex chromosomes. Genomics. 2001;74: 1-11.
- SI Appendix A PDF format file, readable by Adobe Acrobat Reader.
- Discovery Datasets are Pairs of Column- higher-than-third order. ⁇ Matched but Row-Independent Tensors. The
- the discovery set of patients reflects the general primary, Corollary A .
- the tensor high-grade OV patient population with approximately GSVD reduces to the GSVD of the corresponding matri5%, 7%, 76%, and 12% of the patients diagnosed at ces.
- the tensor GSVD of Eq. (1) is boplatin, or oxaliplatin, and 240 of the 249, i.e., >95%
- third-order tensors T>i is constructed from the GSVDs (A3) of Eqs. (2) and (3), of the pairs of full column-rank
- V x or V y exist, and, therefore, the tensor GSVD of
- Lemma B The tensor GSVD has the same uniqueness
- T>2 are computed via the SVDs of the unfolded tensor is, therefore, reduced to the HOS VD of V 2 [25-27] .
- Fig. A (on p. A-3).
- the tensor GSVD is depicted in a raster display, with relative copy-number gain (red), no change (black), and loss (green), explicitly showing the first through the 5th, and the 245th through the 249th 7p i-probelets, both 7p 3 ⁇ 4 -probelets, and the first through the 10th, and the 489th through the 498th 7p tumor and normal arraylets.
- the significance of a subtensor in the tumor dataset relative to that of the corresponding subtensor in the normal dataset i.e., the tensor GSVD angular distance
- the row mode GSVD angular distance i.e., the significance of the corresponding tumor arraylet in the tumor dataset relative to that of the normal arraylet in the normal dataset.
- the tensor GSVD angular distances for the 498 pairs of 7p arraylets are depicted in a bar chart display, where the angular distance corresponding to the first pair of arraylets is ⁇ /4.
- the most significant subtensor in the tumor dataset is a combination of (i) the first j -probelet, which is approximately invariant across the platforms, (ii) the first i-probelet, which classifies the discovery set of patients into two groups of high and low coefficients, of significantly and robustly different prognoses, and (in) the first, most tumor-exclusive tumor arraylet, which classifies the validation set of patients into two groups of high and low correlations of significantly different prognoses consistent with the i-probelet's classification of the discovery set.
- Fig. B (on p. A-4).
- the tensor GSVD is depicted in a raster display, with relative copy-number gain (red), no change (black), and loss (green), explicitly showing the first through the 5th, and the 245th through the 249th Xq i-probelets, both Xq 3 ⁇ 4 -probelets, and the first through the 10th, and the 489th through the 498th Xq tumor and normal arraylets.
- the tensor GSVD angular distances for the 498 pairs of Xq arraylets are depicted in a bar chart display, where the angular distance corresponding to the first pair of arraylets is ⁇ /4.
- Fig. D Survival analyses of the discovery set of patients classified by the standard OV indicators.
- KM curves of the discovery set of 249 patients classified by (a) tumor stage at diagnosis, the best predictor of OV survival to date, ( 3 ⁇ 4) residual disease after surgery, i.e., no (No) or some (Yes) macroscopic disease, (c) outcome of subsequent therapy, i.e., complete remission (CR) or not (No), ( d) neoplasm status, i.e., with (W) tumor or without (WO).
- Fig. E Survival analyses of the validation set of patients classified by the standard OV indicators.
- KM curves of the validation set of 148 stage III-IV patients classified by (a) tumor stage at diagnosis, ( 6) residual disease after surgery, i.e., no (No) or some (Yes) macroscopic disease, (c) outcome of subsequent therapy, i.e., complete remission (CR) or not (No), ( d) neoplasm status, i.e., with (W) tumor or without (WO).
- Fig. F (on p. A-8). Survival analyses of the platinum- based chemotherapy patients in the discovery and validation sets classified by tensor GSVD, or tensor GSVD and tumor stage at diagnosis.
- the univariate Cox proportional hazard ratio is 2.0.
- Fig. G Survival analyses of the validation set of patients classified by tensor GSVD and tumor stage at diagnosis, (a) KM curves of the validation set of 148 stage III-IV patients classified by both the 6p+12p tensor GSVD and tumor stage at diagnosis, show the bivariate Cox hazard ratios of 1.9 and 1.8, which are the same as the corresponding univariate ratios. This means that the 6p+12p tensor GSVD is independent of stage, the best predictor of OV survival to date. The 34 months KM median survival time difference is about 62% and more than one year greater than the 21 month difference between the patients classified by stage alone. This means that the tensor GSVD and stage combined make a better predictor than stage alone. ( 3 ⁇ 4) The 148 patients classified by both the 7p tensor GSVD and stage, (c) The 148 patients classified by both the Xq tensor GSVD and stage.
- Fig. H Survival analyses of the discovery set of patients classified by tensor GSVD and standard OV indicators other than stage.
- Fig. I Survival analyses of the validation set of patients classified by tensor GSVD and standard OV indicators other than stage.
- Table A Cox univariate proportional hazard models of the discovery and validation sets of patients classified by any one of the tensor GSVDs or the standard OV indicators.
- Table B Cox bivariate proportional hazard models of the patients in the discovery and validation sets classified by both tensor GSVD and the standard OV indicators.
- 2.2 Novel Frequent Focal CNAs Indicating Surment's median copy number, and sMAD from the median vival.
- 6p+12p, 7p, and Xq tumor ar- in the corresponding arraylet. If the segment's median is raylets, we mapped the tumor probes onto the National at least one sMAD greater (or lesser) than the arraylet 's Center for Biotechnology Information (NCBI) human median, then the arraylet is assigned a gain (or a loss) in genome sequence build 37, by using the Agilent Techthe segment.
- NCBI Center for Biotechnology Information
- segment's menologies probe annotations posted at the University of dian copy number, and sMAD from the median in each California at Santa Cruz (UCSC) human genome browser tumor profile. If the segment's median is at least one [20] .
- sMAD greater (or lesser) than the profile's median, then each segment a P- value by using the circular binary segthe patient is assigned a gain (or a loss) in the segment. mentation (CBS) algorithm, as previously described [21] .
- CBS mentation
- Fig. J Survival analyses of the discovery and validation sets of patients classified by the novel frequent focal CNAs included in the tensor GSVD arraylets.
- Six novel frequent focal CNAs that are included in the tensor GSVD arraylets are significantly correlated with OV survival.
- Two amplified consecutive segments (12pl2.1) contain (a) the 5' ends of isoforms a and e of SOX5, and ( 6) exons 5 and 6, the first exons that are common to isoforms a, b, d, and e of SOX5.
- Two other amplified consecutive segments (12pll.23) contain (c) ITPR2 and (d) ASUN.
- One deletion (7p22.1-p21.3) contains ( e) RPA3.
- Xq21.31 contains (/) PABPC5, and the sequence tag site DXS241 adjacent to translocation breakpoints observed in premature ovarian failure.
- X chromosome microRNAs on the Agilent Human pare the variation in DNA copy numbers with that in microRNA Array 8xl5K platform with UCSC coordigene expression, we used mRNA expression profiles that nates. Medians of the profiles of samples from the same were available for 394 of the 397 TCGA patients in the patient were taken.
- Each profile lists TCGA To compare with the variation in protein expression, level 3 mRNA expression for 11,457 autosomal and X we used protein expression profiles that were available for chromosome genes on the Affymetrix Human Genome 282 of the 397 patients. Each profile lists TCGA level U133A Array platform with UCSC coordinates [20] and 3 protein expression for the 175 antibodies on the MD GO annotations [39] . Medians of the profiles of samAnderson Reverse Phase Protein Array (RPPA), which ples from the same patient were taken. To examine the probe for the abundance levels of 136 proteins encoded possible relations between a tensor GSVD class and the by autosomal and X chromosome genes.
- RPPA samAnderson Reverse Phase Protein Array
- OV pathogenesis we assessed the enrichment of the subWe find that the CNAs are consistent with differential sets of genes that are differentially expressed between the mRNA, microRNA, and protein expression between the tensor GSVD classes in any one of the multiple GO antensor GSVD classes (Figs. K-M).
- the mRNA and pronotations [40] .
- the P-value of a given enrichment was tein encoded by, e.g., M APR 14, which is deleted in the calculated assuming hypergeometric probability distribu6p+12p arraylet, are both significantly (Mann-Whitney- tion of the annotations among the genes in the global Wilcoxon P-values ⁇ 10 -5 ) underexpressed in the tensor set, and of the subset of annotations among the subset GSVD class of a high 6p+12p i-probelet coefficient, or of genes, as previously described [12] . arraylet correlation relative to the tensor GSVD class of a
- microRNA expression profiles that were The microRNA mir-877* that maps to the same deleavailable for 395 of the 397 patients.
- Each profile lists tion as MAPK14 is also significantly (Mann-Whitney- TCGA level 3 microRNA expression for 639 autosomal Wilcoxon P-value ⁇ 0.05) underexpressed.
- Fig. K (on p. A-15).
- Differential mRNA expression between the tensor GSVD classes is consistent with the CNAs.
- (a) TNF, ( b) MAPK14, and (c) CDKNlA, which are deleted in the 6p+12p arraylet are significantly (Mann- Whitney- Wilcoxon P-value ⁇ 0.05) underexpressed in the tensor GSVD class of a high 6p+12p i-probelet coefficient, or arraylet correlation relative to the tensor GSVD class of a low 6p+12p i-probelet coefficient, or arraylet correlation,
- (d) RAD51AP1, ( e) ITPR2, and (/) ASUN, which are amplified in the 6p+12p arraylet are significantly overexpressed in the tensor GSVD class of a high 6p+12p i-probelet coefficient, or arraylet correlation.
- Fig. L (on p. A-16).
- Differential microRNA expression between the tensor GSVD classes is consistent with the CNAs.
- (d) mir-141, and ( e) mir-141*, which are amplified in the 6p+12p arraylet are significantly (Mann- Whitney- Wilcoxon P-value ⁇ 0.05) underexpressed and overexpressed, respectively, in the tensor GSVD class of a high 6p+12p i-probelet coefficient, or arraylet correlation relative to the tensor GSVD class of a low 6p+12p i-probelet coefficient, or arraylet correlation.
- Fig. L (a) 6p+12p Probelet (Coeff.) (b) 6p+12p Probelet (Coeff.;
- Fig. M Differential protein expression between the tensor GSVD classes is consistent with the CNAs.
- MAPK14 which is deleted
- CDKN1B which is amplified in the 6p+12p arraylet
- MAPK14 which is deleted
- CDKN1B which is amplified in the 6p+12p arraylet
- MAPK14 which is deleted
- CDKN1B which is amplified in the 6p+12p arraylet
- 6p+12p Probelet (Coeff.; (b) 6p+12p Probelet (Coeff.; (c) 6p+12p Probelet (Coeff. ' miR-877* miR-200c miR-200c*
Landscapes
- Health & Medical Sciences (AREA)
- Engineering & Computer Science (AREA)
- Life Sciences & Earth Sciences (AREA)
- Physics & Mathematics (AREA)
- Medical Informatics (AREA)
- General Health & Medical Sciences (AREA)
- Bioinformatics & Cheminformatics (AREA)
- Biomedical Technology (AREA)
- Biotechnology (AREA)
- Public Health (AREA)
- Bioinformatics & Computational Biology (AREA)
- Molecular Biology (AREA)
- Biophysics (AREA)
- Evolutionary Biology (AREA)
- Spectroscopy & Molecular Physics (AREA)
- Theoretical Computer Science (AREA)
- Genetics & Genomics (AREA)
- Chemical & Material Sciences (AREA)
- Databases & Information Systems (AREA)
- Analytical Chemistry (AREA)
- Data Mining & Analysis (AREA)
- Epidemiology (AREA)
- Pathology (AREA)
- Proteomics, Peptides & Aminoacids (AREA)
- Primary Health Care (AREA)
- Immunology (AREA)
- Bioethics (AREA)
- Hematology (AREA)
- Urology & Nephrology (AREA)
- Medicinal Chemistry (AREA)
- Microbiology (AREA)
- Food Science & Technology (AREA)
- Cell Biology (AREA)
- Biochemistry (AREA)
- General Physics & Mathematics (AREA)
- Artificial Intelligence (AREA)
- Computer Vision & Pattern Recognition (AREA)
- Evolutionary Computation (AREA)
- Software Systems (AREA)
- Medical Treatment And Welfare Office Work (AREA)
Abstract
Data can be characterized and compared by applying an unfolding algorithm to each of at least two N th order tensors, representing the data, to generate at least two matrices, wherein N > 2. The at least two tensors can have a matching number of columns in each of all dimensions except an N th dimension. The applying the unfolding algorithm preserves the number of columns in one dimension common to (a) one of the at least two tensors and (b) a corresponding one of the at least two matrices, wherein each of the at least two matrices is a full column rank matrix. Each of the matrices is a unique, weighted sum of subtensors having a matching number of columns in each of all dimensions, at least two of the sums having different weighting coefficients. A relative significance of the subtensors is determined as a ratio of the weighting coefficients.
Description
ADVANCED TENSOR DECOMPOSITIONS FOR COMPUTATIONAL ASSESSMENT
AND PREDICTION FROM DATA
Cross-Reference to Related Applications
[0001] This application claims the benefit of the priority of U.S. Provisional
Application No. 62/147,555, entitled "Advanced Tensor Decompositions for Computational Assessment and Prediction from Data," and U.S. Provisional Application No. 62/147,545, entitled "Genetic Alterations in Ovarian Cancer," each filed on April 14, 2015, the disclosures of which are hereby incorporated by reference in their entirety.
Government License Rights
[0002] This invention was made with government support under DMS0847173 and
HG004302 awarded by National Science Foundation and National Institutes of Health. The government has certain rights in this invention.
Field
[0003] The subject technology relates generally to computational assessment and prediction from data.
Background
[0004] In many areas of science, especially in biotechnology, the number of high- dimensional datasets recording multiple aspects of a single phenomenon is increasing. This increase is accompanied by a fundamental need for mathematical frameworks that can compare multiple large-scale matrices with different row dimensions. Some of these areas may involve disease prediction based on biological data related to patient and normal samples.
[0005] For example, glioblastoma multiforme (GBM), the most common malignant brain tumor in adults, is characterized by poor prognosis. GBM tumors may exhibit a range of copy-number alterations (CNAs), many of which play roles in the cancer's pathogenesis. Large- scale gene expression and DNA methylation profiling efforts have identified GBM molecular
subtypes, distinguished by small numbers of biomarkers. However, the best prognostic predictor for GBM remains the patient's age at diagnosis.
Summary
[0006] According to some embodiments, the subject technology provides frameworks that can simultaneously compare and contrast two datasets arranged in large-scale tensors of the same column dimensions but with different row dimensions in order to find the similarities and dissimilarities among them. According to some embodiments, a tensor generalized singular value decomposition (tGSVD), described herein, is an exact, unique, simultaneous decomposition for comparing and contrasting two tensors of arbitrary order.
[0007] According to some embodiments, the matrix GSVD and the matrix higher-order
GSVD (HO GSVD) are limited to datasets arranged in matrices, i.e., second-order tensors. Exact and unique simultaneous decomposition for two tensors can be performed to generalize the matrix GSVD to a tensor GSVD by following steps analogous to these that generalize the matrix SVD to the tensor, or higher-order SVD (HOSVD). This tensor GSVD transforms two tensors of the same numbers of columns across, e.g., the x- and the _y-axes, and different numbers of rows across the z- axes, into weighted sums of "subtensors," where each subtensor is an outer product of one x-, one y- and one z-axis vector. The sets of x-, y- and z-axes vectors are computed by using the matrix GSVD of the two tensors unfolded along their corresponding axes. This is different from previous tensor GSVDs, which, e.g., do not use the GSVD in the computation of each of the sets of vectors. From the GSVD it follows that a different set of orthogonal basis vectors U is computed for each of the two tensors Γ, across the z-axes, with a one-to-one correspondence among these vectors. The sets of basis vectors across the x- and _y-axes, Vx and Vy, are identical for both tensor factorizations, and are not, in general, orthogonal:
% = ¾ y.xlli x-tVv XyVy = ∑ r*>«t* S^ 6> e) = ¾:**¾,&0^. ΐ = 3 , 2.
« ϊι if
[0008] To enable the interpretation of this tensor GSVD, the significance of the subtensor Si(a, b, c) in 7 is defined relative to that of the corresponding subtensor S2(a, b, c) in T2 in terms of an "angular distance" that is a function of the ratio of the weighting coefficients r\ abc and r2,abc- This angular distance is a function of the generalized singular values that correspond to
and U2 only, and is independent of the values that correspond to either Vx or Vy. The matrix GSVD and the tensor HOSVD are special cases of this tensor GSVD.
[0009] According to some embodiments, a method for characterization of data includes applying a decomposition algorithm, by a processor, to Nth-order tensors -4 and B representing data, wherein N > 2 and wherein tensors A and B have matching number of columns in all dimensions except an nth dimension, to generate, for each of the tensors, a weighted sum of a set of subtensors, the sets of subtensors having one-to-one correspondence and the sums having different weighting coefficients. A relative significance of the subtensors is determined as the ratio of the weighting coefficients. The data can include indicators, represented in respective rows and columns of the tensors, of values of at least two index parameters. According to some embodiments, an indicator of a health parameter of a subject is determined based on the relative significance of the subtensors.
[0010] Applying the decomposition algorithm comprises unfolding each of the tensors along the nth dimension to generate, for each of the tensors, a basis vector corresponding to the nth dimension values preserved by the unfolding. Each of the subtensors can be or include an outer product of vectors from every dimension of the corresponding tensor
[0011] The tensor GSVD (tGSVD) can be used to transform tensor -4. and a tensor B into weighted sums of subtensors. Vectors in the tensor . along an nth index into a tensor GSVD (tGSVD) can be appended. Vectors in the tensor B along an nth index into the tGSVD can also be appended.
[0012] The subject technology is illustrated, for example, according to various aspects described below. Various examples of aspects of the subject technology are described as numbered clauses (1, 2, 3, etc.) for convenience. These are provided as examples and do not limit the subject technology. It is noted that any of the dependent clauses may be combined in any combination, and placed into a respective independent clause, e.g., clause 1, clause 13, or clause 15. The other clauses can be presented in a similar manner.
[0013] Clause 1. A method, for characterization of data, comprising: applying an unfolding algorithm, by a processor, to each of at least two Nth order tensors, representing data, to generate at least two matrices, wherein N > 2, wherein the at least two tensors have a matching number of columns in each of all dimensions except an Nth
dimension, wherein the applying the unfolding algorithm preserves the number of columns in one dimension common to (a) one of the at least two tensors and (b) a corresponding one of the at least two matrices, wherein each of the at least two matrices is a full column rank matrix, wherein each of the matrices is a unique, weighted sum of subtensors having a matching number of columns in each of all dimensions, at least two of the sums having different weighting coefficients; determining a relative significance of the subtensors as a ratio of the weighting coefficients; determining and outputting, by a processor and based on the relative significance of the subtensors, an indicator of a health parameter of a subject, wherein the health parameter comprises at least one of a differential diagnosis, a first health status of the subject, a disease subtype, at least one of an estimated probability or an estimated risk of a second health status of the subject, an indicator of a prognosis of the subject, or a predicted response to a treatment of the subject.
[0014] Clause 2. The method of clause 1, wherein the tensors have one-to-one mappings among the columns across all but the Nth dimension of each of the tensors.
[0015] Clause 3. The method of clause 1, wherein the tensors do not have one-to-one mappings among the rows across the Nth dimension of each of the tensors.
[0016] Clause 4. The method of clause 1, further comprising applying a decomposition algorithm, by a processor, to the at least two subtensors, to generate, from the at least two subtensors A and B, eigenvectors of each of AAT, ATA, BBT, and BTB.
[0017] Clause 5. The method of clause 1, wherein the data comprises indicators, represented in respective rows and columns of the tensor, of values of at least two index parameters.
[0018] Clause 6. The method of clause 1, wherein the applying the unfolding algorithm includes appending into (N-l)th order tensors into (N-2)th order tensors that span (N-2) dimensions in each tensor.
[0019] Clause 7. The method of clause 1, wherein the applying the unfolding algorithm includes appending into a matrix the columns or rows across a preserved dimension in each tensor.
[0020] Clause 8. The method of clause 1, wherein each subtensor is an outer product of one X-, one y- and one z-axis vector.
[0021] Clause 9. The method of clause 8, wherein the sets of x-, y- and z-axes vectors are computed by using a matrix GSVD of the tensors unfolded along their corresponding axes.
[0022] Clause 10. The method of clause 1, further comprising, based on the indicator of the health parameter of the subject, applying a treatment to the subject.
[0023] Clause 11. The method of clause 10, wherein the treatment comprises administering a drug to the subject, admitting the subject to a care facility, or performing an operation on the subject.
[0024] Clause 12. The method of clause 1, wherein the tensors are generated by folding a plurality of matrices into the tensors.
[0025] Clause 13. A method, for characterization of data, comprising: receiving, an indicator of a health parameter of a subject, wherein the health parameter comprises at least one of a differential diagnosis, a first health status of the subject, a disease subtype, at least one of an estimated probability or an estimated risk of a second health status of the subject, an indicator of a prognosis of the subject, or a predicted response to a treatment of the subject; based on the indicator of the health parameter of the subject, applying a treatment to the subject; wherein the indicator is determined by: applying an unfolding algorithm, by a processor, to each of at least two Nth order tensors, representing data, to generate at least two matrices, wherein N > 2, wherein the at least two tensors have a matching number of columns in each of all dimensions except an Nth dimension, wherein the applying the unfolding algorithm preserves the number of columns in one dimension common to (a) one of the at least two tensors and (b) a corresponding one of the at least two matrices, wherein each of the at least two matrices is a full column rank matrix, wherein each of the matrices is a unique, weighted sum of subtensors having a matching number of columns in each of all dimensions, at least two of the sums having different weighting coefficients;
determining a relative significance of the subtensors as a ratio of the weighting coefficients; determining, based on the relative significance of the subtensors, the indicator.
[0026] Clause 14. The method of clause 13, wherein the treatment comprises administering a drug to the subject, admitting the subject to a care facility, or performing an operation on the subject.
[0027] Clause 15. A system, for characterization of data, comprising: an unfolding module configured to apply an unfolding algorithm, by a processor, to each of at least two Nth order tensors, representing data, to generate at least two matrices, wherein N > 2, wherein the at least two tensors have a matching number of columns in each of all dimensions except an Nth dimension, wherein the applying the unfolding algorithm preserves the number of columns in one dimension common to (a) one of the at least two tensors and (b) a corresponding one of the at least two matrices, wherein each of the at least two matrices is a full column rank matrix, wherein each of the matrices is a unique, weighted sum of subtensors having a matching number of columns in each of all dimensions, at least two of the sums having different weighting coefficients; a first determining module configured to determine a relative significance of the subtensors as a ratio of the weighting coefficients; a second determining module configured to determine, by a processor and based on the relative significance of the subtensors, an indicator of a health parameter of a subject, wherein the health parameter comprises at least one of a differential diagnosis, a first health status of the subject, a disease subtype, at least one of an estimated probability or an estimated risk of a second health status of the subject, an indicator of a prognosis of the subject, or a predicted response to a treatment of the subject; an outputting module, configured to output the indicator.
[0028] Clause 16. The system of clause 15, wherein the tensors have one-to-one mappings among the columns across all but the Nth dimension of each of the tensors.
[0029] Clause 17. The system of clause 15, wherein the tensors do not have one-to-one mappings among the rows across the Nth dimension of each of the tensors.
[0030] Clause 18. The system of clause 15, further comprising applying a decomposition algorithm, by a processor, to the at least two subtensors, to generate, from the at least two subtensors A and B, eigenvectors of each of AAT, ATA, BBT, and BTB.
[0031] Clause 19. The system of clause 15, wherein the data comprises indicators, represented in respective rows and columns of the tensor, of values of at least two index parameters.
[0032] Clause 20. The system of clause 15, wherein the applying the unfolding algorithm includes appending into (N-l)th order tensors into (N-2)th order tensors that span (N-2) dimensions in each tensor.
[0033] Clause 21. The system of clause 15, wherein the applying the unfolding algorithm includes appending into a matrix the columns or rows across a preserved dimension in each tensor.
[0034] Clause 22. The system of clause 15, wherein each subtensor is an outer product of one X-, one y- and one z-axis vector.
[0035] Clause 23. The system of clause 22, wherein the sets of x-, y- and z-axes vectors are computed by using a matrix GSVD of the tensors unfolded along their corresponding axes.
[0036] Clause 24. The system of clause 15, further comprising, based on the indicator of the health parameter of the subject, applying a treatment to the subject.
[0037] Clause 25. The system of clause 24, wherein the treatment comprises administering a drug, admitting the subject to a care facility, or performing an operation on the subject.
[0038] Clause 26. The system of clause 15, wherein the tensors are generated by folding a plurality of matrices into the tensors.
[0039] Additional features and advantages of the subject technology will be set forth in the description below, and in part will be apparent from the description, or may be learned by practice of the subject technology. The advantages of the subject technology will be realized and attained by the structure particularly pointed out in the written description and claims hereof as well as the appended drawings.
[0040] It is to be understood that both the foregoing general description and the following detailed description are exemplary and explanatory and are intended to provide further explanation of the subject technology as claimed.
Brief Description of the Drawings
[0041] The accompanying drawings, which are included to provide further understanding of the subject technology and are incorporated in and constitute a part of this description, illustrate aspects of the subject technology and, together with the specification, serve to explain principles of the subject technology.
[0042] FIG. 1 is a high-level diagram illustrating examples of tensors including biological datasets, according to some embodiments.
[0043] FIG. 2 is a high-level diagram illustrating a linear transformation of three- dimensional arrays, according to some embodiments.
[0044] FIG. 3 is a block diagram illustrating a biological data characterization system coupled to a database, according to some embodiments.
[0045] FIG. 4 is a flowchart of a method for disease related characterization of biological data, according to some embodiments.
[0046] FIG. 5 shows a matrix of higher-order tensors, according to some embodiments of the subject technology.
[0047] FIG. 6 shows how a tensor GSVD generalizes the matrix GSVD from two matrices to two higher-order tensors, in analogy, but not in equivalent mathematical formulation, to the tensor HOSVD's generalization of the matrix SVD, according to some embodiments of the subject technology.
[0048] FIG. 7 shows a tGSVD that has become the GSVD in the matrix limit, according to Corollary 1, according to some embodiments of the subject technology described herein.
[0049] FIG. 8 shows a tGSVD that has become the HOSVD in the limit where one tensor has ones on the diagonal and zeros everywhere else, according to Corollary 2, according to some embodiments of the subject technology described herein.
[0050] FIG. 9 shows GSVD of patient-matched but probe-independent GBM tumor and normal datasets. Raster display, with relative copy-number gain (red), no change (black) and loss (green). The significance of a pattern from FT, or "probelet," in the tumor dataset relative to its significance in the normal dataset is defined in terms of an "angular distance" that is a function of the ratio of the pattern's significance in each dataset individually (i.e., the fraction of total information that the pattern contains). This is depicted in the bar chart display, where angular distances above 2π/9 represent tumor-exclusive patterns and those below -π/6 represent normal- exclusive patterns.
[0051] FIGS. 10A, 10B, and IOC show survival analyses of TCGA OV patients classified by tensor GSVD (FIG. 10A), tumor stage at diagnosis (FIG. 10B), and both (FIG. IOC).
[0052] FIG. 11 is a simplified diagram of a system, in accordance with various embodiments of the subject technology.
[0053] FIG. 12 is a block diagram illustrating an exemplary computer system with which a client device and/or a server of FIG. 11 can be implemented.
Detailed Description
[0054] In the following detailed description, specific details are set forth to provide an understanding of the subject technology. It will be apparent, however, to one ordinarily skilled in the art that the subject technology may be practiced without some of these specific details. In other instances, well-known structures and techniques have not been shown in detail so as not to obscure the subject technology. U.S. Provisional Application No. 61/553,840, entitled "Genomic Tensor Analysis for Medical Assessment and Prediction," was filed on October 31, 2011 and published on March 14, 2013 as WO 2013/036874. U.S. Provisional Application No. 61/553,870, entitled "Genetic Alterations in Glioblastoma," was filed on October 31, 2011 and published on May 10, 2013 as WO 2013/067050. The technical subject matter of U.S. Provisional Application Nos. 61/553,840 and 61/553,870, and the corresponding publications, WO 2013/036874 and WO 2013/067050, are hereby incorporated by reference in their entirety.
[0055] According to some embodiments, the subject technology provides frameworks that can simultaneously compare and contrast two datasets arranged in large-scale tensors of the same column dimensions but with different row dimensions in order to find the similarities and
dissimilarities among them. According to some embodiments, a tensor GSVD (tGSVD), described herein, is an exact, unique, simultaneous decomposition for comparing and contrasting two tensors of arbitrary order.
[0056] As used herein, script letters (e.g. Λ) are used to denote tensors, capital letters
(e.g. A) to indicate matrices, and lower case letters (e.g. a) to represent scalars. The exception is for indices, where i,j or a, b, c are typically used. The maximum for an index is given by I. The index of the nth axis is i„ and n has maximum value N. For an N-dimensional tensor, the indices are given as z'i to iN. Also, the entry in the ith row and jth column of the matrix A is denoted ay. When talking about multidimensional tensors, row is used to refer to the first dimension, whereas column is used for all others.
[0057] The subject technology can be applied to a variety of fields to analyze data used in an generated by entities within the field. Such fields include finance, advertising, medicine, biology, astronomy, among others. For example, subject technology may be applied to personalize medicine for analysis of DNA copy number, DNA methylation, mRNA expression, imaging, and medical records. By further example, the subject technology may be used to analyze, in medicine, a large number of high-dimensional datasets, recording multiple aspects of a disease across the same set of patients, such as in The Cancer Genome Atlas (TCGA).
[0058] FIG. 1 is a high-level diagram illustrating examples of tensors 100 including biological datasets, according to some embodiments. In general, a tensor representing a number of biological datasets may comprise an Nth-order tensor including a number of multi-dimensional (e.g., two or three dimensional) matrices. The Nth-order tensor may include a number of biological datasets. Some of the biological datasets may correspond to one or more biological samples. Some of the biological dataset may include a number of biological data arrays, some of which may be associated with one or more subjects. Some examples of biological data that may be represented by a tensor includes tensors (a), (b) and (c) shown in FIG. 1. The tensor (a) represents a third order tensor (i.e., a cuboid), in which each dimension (e.g., gene, condition and time) represent a degree of freedom in the cuboid. If unfolded into a matrix, these degrees of freedom may be lost and most of the data included in the tensor may also be lost. However, decomposing the cuboid using a tensor decomposition technique, such as higher-order eigen-value decomposition (HOEVD) or higher-order single value decomposition (HOSVD) may uncover patterns of mRNA expression variations across the genes, the time points and conditions.
[0059] In the example tensor (b) the biological datasets are associated with genes and the one or more subjects comprises organisms and data arrays may include cell cycle stages. The tensor decomposition in this case may allow, for example, integrating global mRNA expressions measured for various organisms, removal of experimental artifacts and identification of significant combinations of patterns of expression variation across the genes, for various organisms and for different cell cycle stages. Similarly, in tensor (c) the biological datasets are associated with a network K of N-genes by N-genes. Where the network K may represent a number of studies on the genes. The tensor decomposition (e.g., HOEVD) in this case may allow, for example, uncovering important relations among the genes (e.g., pheromone-response-dependent relation or orthogonal cell-cycle-dependent relation). An example of a tensor represented by a three-dimensional array is discussed below with respect to FIG. 2.
[0060] FIG. 2 is a high-level diagram illustrating a linear transformation of a number of two dimensional (2-D) arrays forming a three-dimensional (3-D) array 200, according to some embodiments. The 3-D array 200 may be stored in memory 300 (see FIG. 3). The 3-D array 200 may include a number N of biological datasets that correspond to genetic sequences. In some embodiments, the number N can be greater than two. Each biological dataset may correspond to a tissue type and can include a number M of biological data arrays. Each biological data array may be associated with a patient or, more generally, an organism). Each biological data array may include a plurality of data units (e.g., chromosomes). A linear transformation, such as a tensor decomposition algorithm may be applied to the 3-D array 200 to generate a plurality of eigen 2-D arrays 220, 230 and 240. The generated eigen 2-D arrays 220, 230 and 240 can be analyzed to determine one or more characteristics related to a disease (e.g., changes in glioblastoma multiforme (GBM) tumor with respect to normal tissue). The 3-D array 200 may comprise a number N of 2-D data arrays (Dl, D2, D3, ... DN) (for clarity only D1-D3 are shown in FIG. 2). Each of the 2-D data arrays (Dl, D2, D3, ... DN) can store one set of the biological datasets and includes M columns. Each column can store one of the M biological data arrays corresponding to a subject such as a patient.
[0061] As used herein, "health status" may refer to the presence, absence, quality, rank, or severity of any disease or health condition, history and physical examination finding, laboratory value, and the like. As used herein, a "health parameter" can include a differential diagnosis, meaning a diagnosis that is potential, confirmed, unconfirmed, based on a likelihood, ranked, or the like. A health parameter can include at least one of a differential diagnosis, a first health status of the subject, a disease subtype, an estimated probability, an estimated risk of a second health status
of the subject, an indicator of a prognosis of the subject, or a predicted response to a treatment of the subject.
[0062] According to some embodiments, each biological data array may comprise biological data measurable by a DNA microarray (e.g., genomic DNA copy numbers, genome-wide mRNA expressions, binding of proteins to DNA and binding of proteins to RNA), a sequencing technology (e.g., using a different technology that covers the same ground as microarray s), a protein microarray or mass spectrometry, where protein abundance levels are measured on a large proteomic scale and a traditional measurement (e.g., immunohistochemical staining). The biological data may include chromatin or histone modification, a DNA copy number, an mRNA expression, a micro-RNA expression, a DNA methylation, binding of proteins to DNA, binding of proteins to RNA or protein abundance levels.
[0063] According to some embodiments, the biological data may be derived from a patient-specific sample including a normal tissue, a disease-related tissue or a culture of a patient's cell. The biological datasets may also be associated with genes and the one or more subjects comprises at least one of time points or conditions. The tensor decomposition of the Nth-order tensor may allow for identifying abnormal patterns to identify genes or proteins which enable including or excluding a diagnosis. Further, the tensor decomposition may allow classifying a patient into a subgroup of patients based on patient-specific genomic data, resulting in an improved diagnosis by identifying the patient's disease subtype. The tensor decomposition may also be advantageous in patients therapy planning, for example, by allowing patient-specific therapy to be designed based criteria, such as, a correlation between an outcome of a therapeutic method and a global genomic predictor.
[0064] In patients' disease prognosis, the tensor decomposition may facilitate designing at least one of predicting a patient's survival or a patient's response to a therapeutic method such as chemotherapy. The Nth-order tensor may include a patient's routine examination data, in which case decomposition of the tensor may allow designing of a personalized preventive regimen for a patient based on analyses of the patient's routine examinations data. According to some embodiments, the biological datasets may be associated with imaging data including magnetic resonance imaging (MRI) data, electro cardiogram (ECG) data, electromyography (EMG) data or electroencephalogram (EEG) data. The biological datasets may be associated with vital statistics or phenotypic data.
[0065] According to some embodiments, the tensor decomposition of the Nth-order tensor may allow removing normal pattern copy number variations (CNVs) and an experimental variation from a genomic sequence. The tensor decomposition of the Nth-order tensor may permit an improved prognostic prediction of the disease by revealing disease-associated changes in chromosome copy numbers, focal copy number variations (CNVs) nonfocal CNVs and the like. The tensor decomposition of the Nth-order tensor may also allow integrating global mRNA expressions measured in multiple time courses, removal of experimental artifacts and identification of significant combinations of patterns of expression variation across the genes, the time points and the conditions.
[0066] According to some embodiments, applying the tensor decomposition algorithm may comprise applying at least one of a higher-order singular value decomposition (HOSVD), a higher-order generalized singular value decomposition (HO GSVD), a higher-order eigen-value decomposition (HOEVD) or parallel factor analysis (PARAFAC) to the Nth-order tensor. Some of the present embodiments apply HOSVD to decompose the 3-D array 200, as described in more detail herein. The PARAFAC method is known in the art and will not be described with respect to the present embodiments.
[0067] The HOSVD generated eigen 2-D arrays may comprise a set of N left-basis 2-D arrays 220. Each of the left-basis arrays 220 (e.g., Ul, U2, U3, ... UN) (for clarity only U1-U3 are shown in FIG. 2) may correspond to a tissue type and can include a number M of columns, each of which stores a left-basis vector 222 associated with a patient. The eigen 2-D arrays 230 comprise a set of N diagonal arrays (∑1,∑2,∑3, ...∑N) (for clarity only Σ1-Σ3 are shown in FIG. 2). Each diagonal array (e.g., ∑1,∑2,∑3, ... or∑N) may correspond to a tissue type and can include a number N of diagonal elements 232. The 2-D array 240 comprises a right-basis array, which can include a number of right-basis vectors 242.
[0068] According to some embodiments, decomposition of the Nth-order tensor may be employed for disease related characterization such as diagnosing, tracking a clinical course or estimating a prognosis, associated with the disease.
[0069] FIG. 3 is a block diagram illustrating a data characterization system 300 coupled to a database 350, according to some embodiments. The system 300 includes a processor 310, memory 320, an analysis module 330 and a display module 340. Processor 310 may include one or more processors and may be coupled to memory 320. Memory 320 may comprise volatile memory
such as random access memory (RAM) or nonvolatile memory (e.g., read only memory (ROM), flash memory, etc.). Memory 320 may also include machine-readable medium, such as magnetic or optical disks. Memory 320 may retrieve information related to the Nth-order tensors 100 of FIG. 1 or the 3-D array 200 of FIG. 2 from a database 350 coupled to the system 300 and store tensors 100 or the 3-D array 200 along with 2-D eigen-arrays 220, 230 and 240 of FIG. 2. Database 350 may be coupled to system 300 via a network (e.g., Internet, wide area network (WNA), local area network (LNA), etc.). According to some embodiments, system 300 may encompass database 350.
[0070] Processor 310 can apply a tensor decomposition algorithm, such as HOSVD, HO
GSVD, or HOEVD to the tensors 100 or 3-D array 200 and generate eigen 2-D arrays 220, 230 and 240. According to some embodiments, processor 310 may apply the HOSVD or HO GSVD algorithms to array comparative genomic hybridization (aCGH) data from patient-matched normal and glioblastoma multiforme (GBM) blood samples. Application of HOSVD algorithm may remove one or more normal pattern copy number variations (CNVs) or experimental variations from the aCGH data. The HOSVD algorithm can also reveal GBM-associated changes in at least one of chromosome copy numbers, focal CNVs and unreported CNVs existing in the aCGH data. According to some embodiments, processor 310 may apply a decomposition algorithm to an Nth- order tensor representing data (N > 2) to generate, from two or more submatrices A and B of the tensor, eigenvectors of each of AA , A A, BB , and B B. The data may comprise indicators, represented in respective rows and columns of the tensor, of values of at least two index parameters. Analysis module 330 can perform disease related characterizations as discussed above. For example, analysis module 330 can facilitate various analyses of eigen 2-D arrays 230 of FIG. 2, for example, by assigning each diagonal element 232 of FIG. 2 to an indicator of a significance of a respective element of a right-basis vector 222 of FIG. 2, as described herein in more detail. According to some embodiments, Analysis module 330 can determine an indicator of a health parameter of a subject, based on the eigenvectors and on values, associated with the subject, of the two or more index parameters. The display module 240 can display 2-D arrays 220, 230 and 240 and any other graphical or tabulated data resulting from analyses performed by analysis module 330. Display module 330 can display the indicator of the health parameter of the subject in various ways including digital readout, graphical display, or the like. In embodiments, the indicator of the health parameter may be communicated, to a user or a printer device, over a phone line, a computer network, or the like. Display module 330 may comprise software and/or firmware and may use one or more display units such as cathode ray tubes (CRTs) or flat panel displays.
[0071] FIG. 4 is a flowchart of a method 400 for genomic prognostic prediction, according to some embodiments. Method 400 includes storing the N^-tensors 100 of FIG. 1 or 3-D array 200 of FIG. 2 in memory 320 of FIG. 3 (410). A tensor decomposition algorithm such as HOSVD, HO GSVD, or HOEVD may be applied, by processor 310 of FIG. 3, to the datasets stored in tensors 100 or 3-D array 200 to generate eigen 2-D arrays 220, 230 and 240 of FIG. 2 (420). The generated eigen 2-D arrays 220, 230 and 240 may be analyzed by analysis module 330 to determine one or more disease-related characteristics (430). The HOSVD algorithm is mathematically described herein with respect to N >2 matrices (i.e., arrays Di-DN) of 3-D array 200. Each matrix can be a real mi x n matrix. Each matrix is exactly factored as Di = Ui∑iVT, where V, identical in all factorizations, is obtained from the balanced eigensystem SV = VA of the arithmetic mean S of all pairwise quotients AiAj "1 of the matrices Ai = DiT Di, where i is not equal to j, independent of the order of the matrices Di. It can be proved that this decomposition extends to higher orders all of the mathematical properties of the GSVD except for column-wise orthogonality of the matrices Ui (e.g., 2-D arrays 220 of FIG. 2).
[0072] It can be proved that matrix S is nondefective, i.e., S has n independent eigenvectors and that V is real and that the eigenvalues of S (i.e., λ1; λ2; . . . λΝ) satisfy λ^> 1. In the described HO GSVD comparison of two matrices, the kth diagonal element of∑i = diag (al;k) (e.g., the kth element 232 of FIG. 2) is interpreted in the factorization of the ith matrix Di as indicating the significance of the k^ right basis vector Vk in Di in terms of the overall information that Vk captures in Di. The ratio σ^ σ^ indicates the significance of Vk in Di relative to its significance in Dj. It can also be proved that an eigenvalue λ^ = 1 corresponds to a right basis vector Vk of equal significance in all matrices Di and Dj for all i and j, when the corresponding left basis vector uyj is orthonormal to all other left basis vectors in Ui for all i. Detailed description of various analysis results corresponding to application of the HOSVD to a number of datasets related to patients and other subjects will be discussed below.
[0073] The matrix higher-order GSVD (HO GSVD) provides a framework that extends the GSVD by enabling a simultaneous decomposition of more than two such datasets, which by definition is exact and unique. The matrix HO GSVD for N > 2 matrices has been defined as Di ~ !&·"■ each ^th full column rank. Each matrix is exactly factored as = &'»¾H , where V , identical in all factorizations, is obtained from the eigensystem SV = VA of the arithmetic mean
S of all pairwise quotients ' :lt lj of the matrices A i = D *≠ ? .
[0074] This decomposition extends to higher orders all of the mathematical properties of the GSVD except for complete column-wise orthogonality of the left basis vectors that form the matrix U, in each factorization. The matrix S is nondefective with V and Λ real. Its eigenvalues satisfy > 1. Equality holds if and only if the corresponding eigenvector vk is a right basis vector of equal significance in all matrices D, and D7, i.e., σ,,^/σ,^ = 1 for all i and j, and the corresponding left basis vector is orthogonal to all other vectors in Ut for all i. The eigenvalues k = 1, therefore, define the "common matrix HO GSVD subspace."
EXAMPLE 1
[0075] A HOSVD algorithm is mathematically described herein with respect to N >2 matrices (i.e., arrays Di-DN) of 3-D array 200. Each matrix can be a real mi x n matrix. Each matrix is exactly factored as Di = Ui∑iVT, where V, identical in all factorizations, is obtained from the balanced eigensystem SV = VA of the arithmetic mean S of all pairwise quotients AiAj "1 of the matrices Ai = DiT Di, where i is not equal to j, independent of the order of the matrices Di. It can be proved that this decomposition extends to higher orders, all of the mathematical properties of the GSVD except for column-wise orthogonality of the matrices Ui. It can be proved that matrix S is nondefective. In other words, S has n independent eigenvectors and that V is real and the eigenvalues of S (i.e., λ1; λ2; .. . N) satisfy λ^> 1.
[0076] In the described HO GSVD comparison of two matrices, the kth diagonal element of ∑i = diag(al;k) is interpreted in the factorization of the ith matrix Di as indicating the significance of the right basis vector Vk in Di in terms of the overall information that Vk captures in Di. The ratio σ^ σ^ indicates the significance of Vk in Di relative to its significance in Dj. It can also be proved that an eigenvalue = 1 corresponds to a right basis vector Vk of equal significance in all matrices Di and Dj for all i and j when the corresponding left basis vector Ui;k is orthonormal to all other left basis vectors in Ui for all i. Detailed description of various analysis results corresponding to application of the HOSVD to a number of datasets obtained from patients and other subjects will be discussed below.
[0077] A HOEVD tensor decomposition method can be used for decomposition of higher order tensors. Herein, as an example, the HOEVD tensor decomposition method is described in relation with a the third-order tensor of size K-networks x N-genes x N-genes as follows:
[0078] Let the third-order tensor {(½ } of size -networks X N-genes X N-genes tabulate a series of K genome-scale networks computed from a series of K genome-scale signals {ek}, of size N-genes x A4-arrays each, such that ak= ekek , for all k = 1, 2, ... , K. We define and compute a HOEVD of the tensor of networks {% },
 using the SVD of the appended signals e≡ e , e2, eK) = ύεντ, where the mth column of u, \am) ≡ u\m), lists the genome-scale expression of the mth eigenarray of e. Whereas the matrix EVD is equivalent to the matrix SVD for a symmetric nonnegative matrix, this tensor HOEVD is different from the tensor higher-order SVD (14-16) for the series of symmetric nonnegative matrices {(½ }, where the higher-order SVD is computed from the SVD of the appended networks ((½, a2, . . . K) rather than the appended signals. This HOEVD formulates the overall network computed from the appended signals a = eeT as a linear superposition of a series of M ≡ ∑k=1 Mk rank-1 symmetric "subnetworks" that are decorrelated of each other, a =
 Each subnetwork is also decoupled of all other subnetworks in the overall network a, since ε is diagonal.
[0079] This HOEVD formulates each individual network in the tensor { fc }as a linear superposition of this series of M rank-1 symmetric decorrelated subnetworks and the series of M{M- 1)/2 rank-2 symmetric couplings among these subnetworks, such that
M
% — ^ £k,m \ am)(am \
m=l
M M
+ ^ ^ £2k,lm (.\ al )(am \ + \ <Xm){<*l )> I6] m=l l= m+l
for all k = 1, 2, ... , K. The subnetworks are not decoupled in any one of the networks {(½ }, since, in general, {ek} are symmetric but not diagonal, such that B^ im ≡ (l\ek \m) = (m|¾ |Z) ≠ 0. The significance of the mth subnetwork in the kth network is indicated by the mth fraction of eigen expression of the kth network pk m = ek rn I (∑ =i ¾= 1 £fc,m) ≥ 0, i.e., the expression correlation captured by the mth subnetwork in the Mi network relative to that captured by all subnetworks (and all couplings among them,
 sk lm = 0 for all 1≠ m) in all networks. Similarly, the amplitude of the fraction p k,im = ek,im / (∑k=i ∑m=i ek,m) indicates the
significance of the coupling between the /th and mth subnetworks in the kth network. The sign of this fraction indicates the direction of the coupling, such that p M > 0 corresponds to a transition from the /th to the mth subnetwork and p k m < 0 corresponds to the transition from the mth to the metric distribution of the annotations among the N-genes and the subsets of n _Ξ N genes with largest and smallest levels of expression in this eigenarray. The corresponding eigengene might be inferred to represent the corresponding biological process from its pattern of expression.
sk lm = 0 for all 1≠ m) in all networks. Similarly, the amplitude of the fraction p k,im = ek,im / (∑k=i ∑m=i ek,m) indicates the
significance of the coupling between the /th and mth subnetworks in the kth network. The sign of this fraction indicates the direction of the coupling, such that p M > 0 corresponds to a transition from the /th to the mth subnetwork and p k m < 0 corresponds to the transition from the mth to the metric distribution of the annotations among the N-genes and the subsets of n _Ξ N genes with largest and smallest levels of expression in this eigenarray. The corresponding eigengene might be inferred to represent the corresponding biological process from its pattern of expression.
[0080] For visualization, we set the x correlations among the X pairs of genes largest in amplitude in each subnetwork and coupling equal to ± 1, i.e., correlated or anticorrelated, respectively, according to their signs. The remaining correlations are set equal to 0, i.e., decorrelated. We compare the discretized subnetworks and couplings using Boolean functions (6).
[0081] We parallel- and antiparallel-associate each subnetwork or coupling with most likely expression correlations, or none thereof, according to the annotations of the two groups of x pairs of genes each, with largest and smallest levels of correlations in this subnetwork or coupling among all X = N(N— l)/2 pairs of genes, respectively. The P value of a given association by annotation is calculated by using combinatorics and assuming hypergeometric probability distribution of the Y pairs of annotations among the X pairs of genes, and of the subset of y -Ξ Y pairs of annotations among the subset of x -Ξ X pairs of genes, P(x;y, Y, X) = ( )_1∑z=y ( ( x-z X where ( ) =
 is the binomial coefficient (17). The most likely association of a subnetwork with a pathway or of a coupling between two subnetworks with a transition between two pathways is that which corresponds to the smallest P value. Independently, we also parallel- and antiparallel-associate each eigenarray with most likely cellular states, or none thereof, assuming hypergeometric distribution of the annotations among the N-genes and the subsets of n _Ξ N genes with largest and smallest levels of expression in this eigenarray. The corresponding eigengene might be inferred to represent the corresponding biological process from its pattern of expression.
[0082] For visualization, we set the x correlations among the X pairs of genes largest in amplitude in each subnetwork and coupling equal to ± 1, i.e., correlated or anticorrelated, respectively, according to their signs. The remaining correlations are set equal to 0, i.e., decorrelated. We compare the discretized subnetworks and couplings using Boolean functions (6).
[0083] With reference to Fig. 39 as shown in U.S. Published Application No.
2014/0303029, incorporated herein by reference, a higher-order EVD (HOEVD) of the third-order series of the three networks {(½, a2, 3 }. The network a3 is the pseudoinverse projection of the
network x onto a genome-scale proteins' DNA-binding basis signal of 2,476-genes x 12-samples of development transcription factors [3] (Mathematica Notebook 3 and Data Set 4), computed for the 1,827 genes at the intersection of ax and the basis signal. The HOEVD is computed for the 868 genes at the intersection of a , d2 and d3. Raster display of dk « ∑m=i £k,m. \ m)( m \ +
 visualizing each of the three networks as an approximate superposition of only the three most significant HOEVD subnetworks and the three couplings among them, in the subset of 26 genes which constitute the 100 correlations in each subnetwork and coupling that are largest in amplitude among the 435 correlations of 30 traditionally-classified cell cycle-regulated genes. This tensor HOEVD is different from the tensor higher-order SVD [14-16] for the series of symmetric nonnegative matrices a2, 3 }. The subnetworks correlate with the genomic pathways that are manifest in the series of networks. The most significant subnetwork correlates with the response to the pheromone. This subnetwork does not contribute to the expression correlations of the cell cycle-projected network a2, where
 ~ 0. The second and third subnetworks correlate with the two pathways of antipodal cell cycle expression oscillations, at the cell cycle stage Gi vs. those at G2, and at S vs. M, respectively. These subnetworks do not contribute to the expression correlations of the development-projected network a3, where e| 2 ~ e| 3 ~ 0. The couplings correlate with the transitions among these independent pathways that are manifest in the individual networks only. The coupling between the first and second subnetworks is associated with the transition between the two pathways of response to pheromone and cell cycle expression oscillations at Gi vs. those G2, i.e., the exit from pheromone-induced arrest and entry into cell cycle progression. The coupling between the first and third subnetworks is associated with the transition between the response to pheromone and cell cycle expression oscillations at S vs. those at M, i.e., cell cycle expression oscillations at Gi/S vs. those at M. The coupling between the second and third subnetworks is associated with the transition between the orthogonal cell cycle expression oscillations at Gi vs. those at G2 and at S vs. M, i.e., cell cycle expression oscillations at the two antipodal cell cycle checkpoints of Gi/S vs. G2/M. All these couplings add to the expression correlation of the cell cycle-projected a2, where €2,i3> €2,23 > their contributions to the expression correlations of dx and the development- projected a3 are negligible (see also Fig. 4 of US 2014/0303029).
[0084] In embodiments, a tensor GSVD arranged in two higher-than-second-order tensors of matched column dimensions but independent row dimensions is used in the methods herein.
[0085] Primary OV tumor and normal DNA copy-number profiles of a set of 249
TCGA patients were selected. Each profile was measured in two replicates by the same set of two DNA microarray platforms. For each chromosome arm or combination of two chromosome arms, the structure of these tumor and normal discovery datasets D1 and D2, of i-tumor and ^-normal probes x J-patients, i.e., arrays x -platforms, is that of two third-order tensors with one-to-one mappings between the column dimensions L and M, but different row dimensions K\ and K2, where K K2≥ LM.
[0086] This tensor GSVD simultaneously separates the paired datasets into weighted sums of LM paired "subtensors," i.e., combinations or outer products of three patterns each: Either one tumor-specific pattern of copy-number variation across the tumor probes, i.e., a "tumor arraylet" u , or the corresponding normal-specific pattern across the normal probes, i.e., the "normal arraylet" w2,a, combined with one pattern of copy-number variation across the patients, i.e., an "x-probelet" v T x b and one pattern across the platforms, i.e., a "y-probelet" V y C, which are identical for both the tumor and normal datasets,
Vi = Ri X aUi X bVx X cVy Ri,abcSi(a> b> c)

St(a, b, c) = u a®vx T b ®v^c, i = 1, 2, (1)
where Xat/i, X-bVx and XcVy denote tensor-matrix multiplications, which contract the -arraylet, J-x-probelet, and -^-probelet dimensions of the "core tensor" 1 i with those of £/,, Vx, and Vy, respectively, and where ® denotes an outer product.
[0087] It was found that unfolding (or matricizing) both tensors Di into matrices, each preserving the i-row dimension, e.g., by appending the LM columns Di :im of the corresponding tensor, gives two full column-rank matrices G RfcixiM. The column bases vectors Ui were obtained from the GSVD of A, i.e., the "row mode GSVD"
Dl=(. . . , Oi:!m, . . . ) = \Jl∑l\T, i=l,2. (2)
[0088] Similarly, that unfolding both tensors Di into matrices, each preserving the L-x-
(or M-y-) column dimension, e.g., by appending the KjM rows D Jk.:m (or the KtL rows D Jk.i-) of the corresponding tensor, gives two full column-rank matrices Dix G M.KiMxL (or Diy G RfciixM). We obtain the x- (or y-) row basis vectors VT X (or Vy), from the GSVD of Dix (or Diy), i.e., the x- (or y-) column mode GSVD,
Djx-(. . . , T)j fc;m, · · · ) ~ Uix∑;x Vx,
Diy=(. . . , V k;l, . . . ) = Uij fy Vy T, i=l,2. (3)
[0089] Note that the x- and _y-row bases vectors are, in general, non-orthogonal but normalized, and Vx and Vy are invertible. The column bases vectors are normalized and orthogonal, i.e., uncorrected, such that U J lli = I.
[0090] Unfolding is performed on tensors of the same order, the tensors having one-to- one mappings among the columns across all but one the of corresponding dimensions among the tensors, but not necessarily among the rows across the one remaining dimension in each tensor. Each tensor is unfolded by, for N order tensors, preserving 1, 2, 3, N-2 dimensions, e.g., by appending into 2, 3, 4, N-l order tensors the 1, 2, 3, N-2 order tensors that span these 1, 2, 3, N-2 dimensions in each tensor. For example, for third or higher-than-third order tensors, one of the dimensions is preserved, e.g., by appending into a matrix the columns or rows across that dimension in each tensor. By further example, for fourth or higher-than-fourth order tensors, two of the dimensions are preserved, e.g., by appending into a third-order tensor the matrices that span these two dimensions in each tensor. By further example, for fifth or higher order tensors, three of the dimensions are preserved. The unfolding can be full-column rank unfolding, wherein, for N order tensors, each of the N unfoldings preserves one dimension (e.g., by appending into a matrix the vectors that span each of these dimensions in each tensor) and produces a full-column rank matrix.
[0091] The generalized singular values are positive, and are arranged in 27,,∑ix, and∑iy in decreasing orders of the corresponding "GSVD angular distances," i.e., decreasing orders of the ratios σ1;α/σ2>α, o1Xtblo2x,b, and olyclo2yc, respectively. We then compute the core tensors ¾ by contracting the row-, x-, and _y-column dimensions of the tensors D, with those of the matrices £/,, Vx1, and Vy1, respectively. For real tensors, the "tensor generalized singular values" I ^bc tabulated in the core tensors are real but not necessarily positive. Our tensor GSVD construction generalizes the GSVD to higher orders in analogy with the generalization of the singular value decomposition (SVD) by the HOSVD, and is different from other approaches to the decomposition of two tensors.
[0092] It is proven herein that the tensor GSVD exists for two tensors of any order because it is constructed from the GSVDs of the tensors unfolded into full column-rank matrices (Lemma A Example 5). The tensor GSVD has the same uniqueness properties as the GSVD, where the column bases vectors u a and the row bases vectors ux b and vy T c are unique, except in
degenerate subspaces, defined by subsets of equal generalized singular values σ,, σίχ, and oiy, respectively, and up to phase factors of ±1 , such that each vector captures both parallel and antiparallel patterns. The tensor GSVD of two second-order tensors reduces to the GSVD of the corresponding matrices (see Example 5). The tensor GSVD of the tensor Z¾ G ]Ri xix j which row mode unfolding gives the identity matrix D\ = I E ^LMxLM ^ ancj a tensor D2 of the same column dimensions reduces to the HOSVD of D2 (Theorem A in Example 5).
[0093] The significance of the subtensor St{a, b, c) in the tensor D, is defined proportional to the magnitude of the corresponding tensor generalized singular values Ri,abc (Fig. 5), in analogy with the HOSVD,

[0094] The significance of Si(a, b, c) in Di relative to that of S2(a, b, c) in D2 is defined by the "tensor GSVD angular distance" ©abc as a function of the ratio Ri,ab</R2,abc- This is in analogy with, e.g., the row mode GSVD angular distance θα, which defines the significance of the column basis vector
 of Eq. (2) relative to that of u2,a in D2 as a function of the ratio σ α/σ2 α,
Qabc = arctan (RiAbc/ R2,abc) - π/4,
0a = arctan( i;a/ff2;a; - π/4. (5)
[0095] Because the ratios of the positive generalized singular values satisfy oi o a e
[0, ∞), the row mode GSVD angular distances satisfy θα [-π/4, π/4]. The maximum (or minimum) angular distance, i.e., θα = π/4, which corresponds to oi o a » 1 (or -π/4, which corresponds to oi o a « 1 ), indicates that the row basis vector υτ α of Eq. (2), which corresponds to the column basis vectors
 and u2,a in D2, is exclusive to (or D2). An angular distance of θα = 0, which corresponds to oi ol = 1 , indicates a row basis vector υτ α which is of equal significance in, i.e., common to both D and D2.
[0096] Thus, while the ratio oi o2ta indicates the significance of
 relative to the significance of u2,a in D2, this relative significance is defined, as previously described, by the angular distance θα, a function of the ratio σ\ αΙσ α, which is antisymmetric in D\ and D2. Note also that while other functions of the ratio
 exist that are antisymmetric in and D2, the angular distance θα, which is a function of the arctangent of the ratio, i.e., arctan( i;a/ 2;a), is the natural function to use, because the GSVD is related to the cosine-sine (CS) decomposition, as previously
described, and, thus, σ\ α and σ2,α are related to the sine and the cosine functions of the angle θα, respectively.
exist that are antisymmetric in and D2, the angular distance θα, which is a function of the arctangent of the ratio, i.e., arctan( i;a/ 2;a), is the natural function to use, because the GSVD is related to the cosine-sine (CS) decomposition, as previously
described, and, thus, σ\ α and σ2,α are related to the sine and the cosine functions of the angle θα, respectively.
[0097] Theorem 1. The tensor GSVD angular distance equals the row mode GSVD angular distance, i.e., 0a¾c = θα.
[0098] Proof. The unfolding of ¾ of Eq. (1) into A of Eq. (2) unfolds the core tensors
I i of Eq. (1) into matrices which preserve the row dimensions, i.e., the JAf-column bases dimensions of and gives

R, = (∑lVT (V -T <g) V -T), i=l, 2, (6)
where ®denotes a Kronecker product. Because∑t are positive diagonal matrices, it follows that
 = i,J 2,a = σ1αΙσ2,α- Substituting this in Eq. (5) gives <dabc = θα. Note that the proof holds for tensors of higher-than-third order.
[0099] From this it follows that the tensor GSVD angular distance
 π/4, and that, therefore, the ratio of the tensor generalized singular values 1 i,ab 2,abc > 0, even though I abc Cmd 2,abc are not necessarily positive. It also follows that ©abc = ±π/4 indicate a subtensor exclusive to either Z¾ or Z¾, respectively, and that ©abc = 0 indicates a subtensor common to both.
[0100] Note that in this embodiment since the generalized singular values are arranged in∑i of Eq. (2) in a decreasing order of the row mode GSVD angular distances θα, the most tumor- exclusive tumor subtensors, i.e., S (a, b, c) where a maximizes θα of Eq. (5), correspond to a = 1, whereas the most normal-exclusive normal sub-tensors, i.e., S2(a, b, c) where a minimizes θα, correspond to a = LM.
[0101] Lemma A. The tensor GSVD exists for any two, e.g., third-order tensors ¾ E Kl' XLxMof the same column dimensions L and M but different row dimensions Kit where Kt > LM or i = 1, 2, if the tensors unfold into full column-rank matrices, D, E Ki XLM, Dix £r EKiMxL, and Djy £: KiLxM, each preserving the Kj-row dimension, L-x-, or M-y-column dimension, respectively.
[0102] Proof. The tensor GSVD of Eq. (1), of the pair of third-order tensors ¾ is constructed from the GSVDs of Eqs. (2) and (3), of the pairs of full column-rank matrices , , and Djy, where / = 1, 2. From the existence of the GSVDs of Eqs. (2) and (3) [5, 6], the orthonormal column bases vectors of A, as well as the normalized x- and _y-row bases vectors of the
invertible V or V , exist, and, therefore, the tensor GSVD of Eq. (1) also exists. Note that the proof holds for tensors of higher-than-third order.
[0103] Lemma B. The tensor GSVD has the same uniqueness properties as the GSVD.
[0104] Proof. From the uniqueness properties of the GSVDs of Eqs. (2) and (3), the orthonormal column bases vectors ui , and the normalized row bases vectors , and V c of the tensor GSVD of Eq. (1) are unique, except in degenerate subspaces, defined by subsets of equal generalized singular values σ,, σ;χ, and ciy, respectively, and up to phase factors of ±1. The tensor GSVD, therefore, has the same uniqueness properties as the GSVD. Note that the proof holds for tensors of higher-than-third order.
[0105] For two second-order tensors, the tensor GSVD reduces to the GSVD of the corresponding matrices. Proof. For two second-order tensors, e.g., the matrices D, G E κίχ1^ the tensor GSVD of Eq. (1) is
D, = R, Xa U, b Vx
= U,RN l (Al)
[0106] The row- and x-column mode GSVDs of Eqs. (2) and (3) are identical, because unfolding each matrix Dt while preserving either its ,-row dimension, or J-x-column dimension results in Z¾, up to permutations of either its columns or rows, respectively,
Di = Ui∑i V l = Dix, / - 1, 2. (A2)
[0107] From the uniqueness properties of the tensor GSVD of Eq. (Al), and the GSVDs of Eq. (A2) it follows that R, =∑,·, and that for two second-order tensors, i.e., matrices, the tensor GSVD is equivalent to the GSVD.
[0108] Theorem A. The tensor GSVD of the tensor ¾ £ M™χΙχ , which row mode unfolding gives the identity matrix D] = I £ M LMxLM f and a tensor Z¾ of the same column dimensions reduces to the HOSVD of V2.
[0109] Proof. Consider the GSVD of Eq. (2), of the matrices D1 = I and D2, as computed by using the QR decomposition of the appended Di and D2, and the SVD of the block of the resulting column-wise orthonormal Q that corresponds to D2, i.e., Q2 = ,


where R is upper triangular and, therefore, invertible. Since Q is column-wise orthonormal, VQ is orthonormal, and∑Q2 is positive diagonal, it follows that

= R-T R-1 + ( 1∑¾2 ¾
(V^Ryl + ( V^R l +∑2 Q
(A4)
and that (7 -∑Q2)2 VQ R is orthonormal. The GSVD of Eq. (2) factors the matrix D2 into a
1
column-wise or-thonormal UQ2 , a positive diagonal ∑Q2(I ~∑Q2)" and an orthonormal (I -
1
∑Q2)5 VQ2 R > and is' therefore, reduced to the SVD of D .
[0110] This proof holds for the GSVDs of Eq. (3). This is because the x- and _y-column unfoldings of the tensor Z¾ G LMxLxM, which row mode unfolding gives the identity matrix Di = I
KLMXLM gives

[0111] The GSVDs of Eqs. (2) and (3), of any one of the matrices Di, DJx, or Dly with the corresponding full column-rank matrices D2, D2X, or D2Y, are, therefore, reduced to the SVDs of D2, D2X, or D2Y, respectively.
[0112] The tensor GSVD of Eq. (1), where the orthonormal column bases vectors u2,a, and the normalized row bases vectors and Vy C in the factorization of the tensor Z¾ are
computed via the SVDs of the unfolded tensor is, therefore, reduced to the HOSVD of Z¾ [25-27]. Note that the proof holds for tensors of higher-than-third order.
[0113] The "tensor generalized Shannon entropy" of each dataset,

EXAMPLE 2
[0114] According to some embodiments, to define the tensor GSVD, the matrix GSVD generalized by following steps analogous to those that generalize the matrix SVD to a tensor SVD. The GSVD simultaneously decomposes two matrices of the same numbers of columns and different numbers of rows, as shown in FIG. 5, into unique, weighted sums of combinations of patterns of variation (see FIG. 9). A different set of orthogonal left basis vectors ¾ and UB is computed for each of the matrices A and B with a one-to-one correspondence among these vectors, as shown in FIG. 6. The Uj (for i=A,B) matrices are column-wise orthonormal such that =/ but UiU≠I in general. The set of right basis vectors VT is identical for both matrix factorizations and the vectors are not, in general, orthogonal, but are normalized: =¼∑ = ¾ x1 ¼ x2 F
B =UB∑BVT =∑B xxUB x2 V
[0115] In analogy, a tensor GSVD for two tensors of the same numbers of columns across, e.g., the x- and the _y-axes, and different numbers of rows across the z-axes, that transforms each of the two tensors into a unique, is defined as weighted sum of combinations of patterns of variation. In this case, each of the sets of patterns is computed by using the matrix GSVD of the two tensors unfolded along their corresponding axes. This decomposition transforms each of the two tensors into a unique, weighted sum of "subtensors," where each subtensor is an outer product of one X-, one _y- and one z-axis vector. The sets of x-, y- and z-axes vectors are computed by using
the matrix GSVD of the two tensors unfolded along their corresponding axes. From the GSVD it follows that a different set of orthogonal basis vectors UA and UB is computed for each of the tensors A and B across the z-axes, with a one-to-one correspondence among these vectors (see FIG. 6). The Ui matrices are column-wise orthogonal such that £/,·¾· =/ but U≠I in general. The sets of vectors across the x- and _y-axes Vx and Vy are identical for both tensor factorizations, and are not, in general, orthogonal. Thus, each of the tensors is rewritten as a weighted sum of subtensors ¾(a,b,c) and ¾(a,b,c) with the weighting coefficients RA.abc and Re.abc-

Sg (a, b»c) ** UB il€) Vxjf ® where the ® symbol represents the outer product of vectors.
[0116] To enable the use of this tensor GSVD in the comparative modeling of two data tensors in order to find similarities and dissimilarities in the datasets, the significance of the subtensor ¾(a,b,c) in A relative to the significance of the corresponding subtensor Ss(a,b,c) in B is defined in terms of an angular distance that is a function of the ratio of the weighting coefficients Ri.abc and RB,abc- This angular distance is a function of the generalized singular values corresponding to UA and UB only, and is independent of the generalized singular values corresponding to either Vx or Vy. The relative significance is defined as
Θ = arctan (¾,· / ¾,·) - π 1 4 where TA and r¾, are corresponding elements of the core tensors, RA and RB. Values of Θ closer to π/4 indicate that the corresponding pattern is exclusive to dataset A, whereas values close to -π/4 indicate exclusivity to dataset B. The ratio TA ΙΤΒ,Ι is dependent only on the row (z-axis), and is
invariant across other dimensions and therefore only depends on the GSVD of the first unfolding (preserving the z-axis) which is used to generate £/,. Unfolding the tensor GSVD on the first axis gives,
where the ® symbol represents the Kronecker product, i.e. the outer product of matrices, and the subscripts in parenthesis represent unfolding along the corresponding dimension. Performing the GSVD on A(i) and B(1) allows one to solve for the core tensors as,
J? - T - where W is simply a matrix (identical in both equations) and∑A and∑B are the diagonal core matrices from the matrix GSVD. The matrix W cancels when dividing corresponding elements of RA and RB and the ratio of corresponding singular values from the matrix GSVD (¾, and cB,,) remains:

EXAMPLE 3
[0117] Given two real tensors A€ Ws-* *-i*y '" ! }*1 and B (= Ji's >< ½ "' K/A' that have full column rank when unfolded along each dimension, the tGSVD of A and B is
.4 RA ; V.A - > 2 ■ - · > v
where ^'.4 £ I ! " ! ¾ ancj i¾ ^A, ,t, " a'8 have orthonormal columns, ^ & are nonsingular, and -4 - ' Vfi c ^ are the two core tensors and are generally full. The subscripts A and B distinguish non-identical entities corresponding to the tensors A and £?, respectively. The notation Xn denotes multiplication of a tensor by a matrix on the nth dimension.
[0118] According to some embodiments, the tGSVD is constructed by unfolding the tensors, computing the matrix GSVD (mGSVD), and saving the set of basis vectors corresponding to the dimension preserved by the unfolding. An unfolding of the tensor along dimension n means appending the vectors of length /„ in A, i.e. those along nth index, into a matrix. The mGSVD of A and B unfolded to preserve the nth dimension is

B(N = ■ D ]■ ν(ηϊ'
[0119] Where the subscript (n) denotes unfolding along the nth dimension, the superscript (n) indicates that the matrix corresponds to the nth unfolding. From the properties of the mGSVD, ' · and « are column-wise orthogonal. 4 and iJs ' are diagonal, and ' is invertible. The order in which the columns of A(n) and B(n) are unfolded does not affect the decomposition because the column vectors of UA and l!s hold fundamental patterns from the column vectors of A(n) and B(„), which are independent of ordering in the matrices.
[0120] According to some embodiments, the tGSVD is constructed by setting
L'A = LU' ' TJ« = TJB and V„ = V(n) for 2< n≤N. The core tensors, KA and "&B, are then computed as

[0121] The tGSVD can be reformulated so each of the tensors will be rewritten as a weighted sum of a set of subtensors, ^A( , b, c) and ^ {a, b, c) for a third order tensor, with a one- to-one correspondence among these two sets of subtensors and with different weighting coefficients, 1 A<abc ancj t b.abe -
A = ~ * . ^ " i*..4<abt<i».. {«, 6, c) b, c) = f.^ ,« -¾.¾ (¾ i¾,c
B = y
 ¾■ c) Ss - , h. c) = 1¾.Λ ¾- V2 :¾ V' * where the subscripts a, b, and c index column vectors of the matrices and ® denotes an outer product of vectors.
[0122] Following from the existence of the mGSVD, existence of the tGSVD is shown in this lemma from its construction: Lemma 1 (Existence). For any two tensors, Λ and B, each with dimensionality N and matching number of columns in all dimensions except one (labeled as the first), there exists a decomposition of the form shown above given that the dimensions of the tensors satisfy the relationship .A > / .
¾■ c) Ss - , h. c) = 1¾.Λ ¾- V2 :¾ V' * where the subscripts a, b, and c index column vectors of the matrices and ® denotes an outer product of vectors.
[0122] Following from the existence of the mGSVD, existence of the tGSVD is shown in this lemma from its construction: Lemma 1 (Existence). For any two tensors, Λ and B, each with dimensionality N and matching number of columns in all dimensions except one (labeled as the first), there exists a decomposition of the form shown above given that the dimensions of the tensors satisfy the relationship .A > / .
/ : . * > /.: /;; · v

[0123] Lemma 2 (Uniqueness). Given the method of construction, the matrices and tensors comprising the tGSVD described above are unique up to a phase factor of ±1 in each element of the core tensors, except in the case of degenerate subspaces, defined by subsets of equal angular distances (i.e. relative significance) in the mGSVD calculation.
[0124] Corollary 1 (Reduction to mGSVD). Let A and B be matrices of full column rank with I^A and ,B number of rows, respectively, and both with I2 columns. Also let min { ^, Ι\,Β] > - The tGSVD of A and B is equivalent to the mGSVD of A and B, as shown in FIG. 7.
[0125] Theorem 1. The mGSVD of two matrices, A and B, reduces to the SVD of A if
B is of the form, f f 1
B = J;" |
0 where /„ is the n χ n identity matrix. Theorem 1 shows that the mGSVD, performed on the unfoldings of A and B on every axis, becomes the SVD of A(n) on each axis, which is exactly how the HOSVD of A is constructed.
[0126] Corollary 2. Let A and B be tensors with N dimensions of size
respectively. Also let B have ones on the diagonal, i.e. when all indices are equal, and zeros everywhere else. Then, the tGSVD of Λ and B is equivalent to the HOSVD of as shown in FIG. 8.
[0127] Theorem 2. The relative significance in the tGSVD defined as the ratio of corresponding entries in ' Λ and ¾, i.e. ? *i *.s 8,*i*2-"»a , depends only on the first index, z'i, and is identical to the relative significance of the mGSVD of Λ and B unfolded to preserve the first axis (i.e., the first unfolding of the data tensors, * and ~>π · by preserving the row axis).
[0128] Therefore, the tGSVD exists and is unique up to sign in the core tensor. The tGSVD reduces to the mGSVD when second order tensors (i.e., matrices) are given as inputs. The tGSVD reduces to the Higher Order SVD when one of the input tensors has ones on the diagonal (i.e., when all indices are equal) and zeros everywhere else.
[0129] Ideally, the matrix HO GSVD' s left basis vectors £/, would be column-wise orthogonal also outside of the common subspace of the N matrices. An iterative matrix block HO GSVD can be defined. First, the common subspace of all N matrices is used to separate each of the matrices £/, into a column-wise orthogonal block€ ίϊ! ; Χ<; ancj he remaining block. Next, the HO GSVD of the blocks€ '«* xiw~*> 0f a subset of, e.g., N-l matrices C ¾ (that correspond to the remaining blocks in U,) is used to identify the subspace common to the N - 1 but not all N matrices Dj. The column-wise orthogonal blocks that correspond to the N - 1 (but not to the N) common subspace are used to rewrite the corresponding blocks of £/, that previously were not necessarily orthogonal. This step is repeated until all matrices Uj are completely column-wise orthogonal. Thus, the matrix HO GSVD is a special case of this iterative matrix block HO GSVD.
EXAMPLE 4
[0130] To compare two datasets that are each of higher order than a matrix (e.g. order 3 tensors), the tGSVD simultaneously separates the paired datasets into paired weighted sums of subtensors, formed by the outer product of a single pattern of variation across each dimension, as shown above. The significance of the subtensor L? r l'2~ " ' ' ^ ^'1 ^ "~ ! ^ in the dataset X , in terms of the overall information that it captures in this dataset, is proportional to the weight of the ' ' 2' ' * ' 5 < Λ' entry of , i.e.,

The "Shannon entropy" of each dataset,
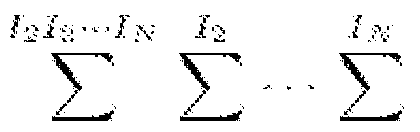 measures the complexity of the data from the distribution of the overall information among the different subtensors. An entropy of zero corresponds to an ordered and redundant dataset in which all the information is captured by a single subtensor. An entropy of one corresponds to a disordered and random dataset in which all subtensors are of equal significance. The significance of the subtensor
 > *2 · · in A relative to the significance of '' s ί1, ¾ ί i v f in B is
f ■
defined in terms of an "angular distance," ' ,¾ * " ' '*'v, that is proportional to the ratio of the corresponding weights,
~~~/4 < .i ; = arctais
 -- ττ/4 JT/4.
EXAMPLE 5
[0131] An angular distance of -π/4 indicates a subtensor that is exclusive to either dataset A or B, respectively, whereas an angular distance of zero indicates a subtensor that is common to both datasets A and B. Note that the corresponding subtensors <,*}> ¾> · - and '« .i., i- , , ΪΝΊ ^ are constructed as an outer product of identical columns from each of the matrices Vn and corresponding non-identical columns of VA and ( 8. Theorem 2 proves that the relative significance depends on the row index only. Therefore, only columns of ^'-4 and ^ contribute to the relative significance whereas columns of Vn contribute to significance within each dataset independently.
[0132] The subject technology provides frameworks that can simultaneously compare and contrast two datasets arranged in large-scale tensors of the same column dimensions but with different row dimensions in order to find the similarities and dissimilarities among them. The subject technology may be applied in fields such as medicine, where the number of high- dimensional datasets, recording multiple aspects of a disease across the same set of patients, is increasing, such as in The Cancer Genome Atlas (TCGA).
[0133] For example, despite recent large-scale profiling efforts, the best prognostic predictor of glioblastoma multiforme (GBM) has been the patient's age at diagnosis. A global pattern of tumor-exclusive co-occurring copy-number alterations (CNAs) is correlated, possibly coordinated with GBM patients' survival and response to chemotherapy. The pattern was revealed by generalized singular value decomposition (GSVD) comparison of patient-matched but probe- independent GBM and normal array CGH datasets from TCGA (FIG. 9).
[0134] According to some embodiments of the subject technology, the GSVD, formulated as a framework for comparatively modeling two composite datasets, removes from the pattern copy-number variations (CNVs) that occur in the normal human genome (e.g., female- specific X chromosome amplification) and experimental variations (e.g., in tissue batch, genomic center, hybridization date and scanner), without a-priori knowledge of these variations. Second, the pattern includes most known GBM-associated changes in chromosome numbers and focal CNAs, as well as several previously unreported CNAs in > 3% of the patients. These include the biochemically putative drug target, cell cycle-regulated serine/threonine kinase-encoding TLK2, the cyclin El-encoding CCNEl, and the Rb-binding histone demethylase-encoding KDM5A. Third, the pattern provides a better prognostic predictor than the chromosome numbers or any one focal CNA that it identifies, suggesting that the GBM survival phenotype is an outcome of its global genotype. The pattern is independent of age, and combined with age, makes a better predictor than age alone.
[0135] Similarly, the best predictor of the ovarian serous cystadenocarcinoma (OV) remains the tumor's stage, an assessment - numbering I to IV - of the spread of the cancer. To identify CNAs that might predict OV patients' survival, patient- and platform-matched OV and normal copy-number profiles can be comparatively modeled by using a novel tensor GSVD. This tensor GSVD enables the simultaneous decomposition of two datasets arranged in higher-order tensors, whereas the matrix GSVD is limited to two second-order tensors, i.e., matrices. The additional dimension allows separation of platform bias.
[0136] A tensor GSVD can be defined for two large-scale tensors with different row dimensions and the same column dimensions. The tensor GSVD provides a framework for comparative modeling in personalized medicine, where the mathematical variables represent biomedical reality. Just as the matrix GSVD enabled the discovery of CNAs correlated with GBM survival, the tensor GSVD enables a comparison of two, higher dimensional datasets leading to the discovery of CNAs that are correlated with OV prognosis. This mathematical modeling makes it
possible to similarly use recent high-throughput biotechnologies in the personalized prognosis and treatment of OV and other cancers.
[0137] The pattern of particular biomedical interest is the most significant in the tumor dataset (i.e. the one that captures the largest fraction of information), is independent of platform, and is exclusive to the tumor dataset. To build this subtensor, the most significant pattern in the tumor data is used for Vx,b, the most platform-independent pattern for Vy,c, and the most tumor exclusive pattern, determined by relative significance, is used for ¾„.
[0138] As shown in FIGS. lOA-C, an exemplary embodiment of the tensor GSVD with
TCGA data can be illustrated by comparing normal and OV tumor genomic profiles from the same set of patients, each measured twice by the same two profiling platforms. The tensor GSVD has uncovered several tumor-exclusive chromosome arm -wide patterns of CNAs that are consistent across both profiling platforms and are significantly correlated with the patients' survival. This indicates several, previously unrecognized, subtypes of OV. The prognostic contributions of these patterns are comparable to and independent of the tumor' s stage (FIGS. lOA-C). Tensor GSVD classification of the OV profiles of an independent set of patients validates the prognostic contribution of these patterns.
EXAMPLE 6
[0139] According to some embodiments, methods of the subject technology can be implemented in the field of epidemiology. For example, data relating to infection rates can be tabulated in tensors. Each tensor can represent or contain values for infection rate data for a given region (e.g., continent, country, state, county, city, district, etc.). The shared x-axis can represent or contain values for time. The shared y-axis can represent or contain values for infectious diseases. The z-axis can represent or contain values for sub-regions (e.g., state, county, city, district, etc.) within the corresponding region represented by the tensor. The tensor GSVD and/or HO GSVD can be performed to determine similarities and dissimilarities between two regions or among three or more regions with respect to infection rates of different diseases across time.
EXAMPLE 7
[0140] According to some embodiments, methods of the subject technology can be implemented in the field of agriculture. For example, data relating to crop yields can be tabulated in tensors. Each tensor can represent or contain values for crop yield data for a given crop (e.g., corn, rice, wheat, etc.). The shared x-axis can represent or contain values for time. The shared y- axis (or multiple y-axes) can represent or contain values for geocoordinates. The z-axis (or
multiple z-axes) can represent or contain values for different types of a given crop (e.g., different types of corn, different types of rice, different types of wheat, etc.). The tensor GSVD and/or HO GSVD can be performed to determine similarities and dissimilarities between the yields of two crops (or among more than two) across time and geocoordinates.
EXAMPLE 8
[0141] According to some embodiments, methods of the subject technology can be implemented in the field of ecology. For example, data relating to abundance levels can be tabulated in tensors. Each tensor can represent or contain values for abundance level data for a given disease vector (e.g., virus, fungi, pollen, etc.). The shared x-axis can represent or contain values for time. The shared y-axis (or multiple y-axes) can represent or contain values for geocoordinates. The z-axis (or multiple z-axes) can represent or contain values for different types of a given disease vector (e.g., different types of virus, different types of fungi, different types of pollen, etc.). The tensor GSVD and/or HO GSVD can be performed to similarities and dissimilarities between the abundance levels of two disease vectors (or among more than two) across time and geocoordinate.
EXAMPLE 9
[0142] According to some embodiments, methods of the subject technology can be implemented in the field of political science. For example, data relating to poll numbers can be tabulated in tensors. Each tensor can represent or contain values for polling data for a given voting territory (e.g., state, county, district, etc.). The shared x-axis can represent or contain values for time. The shared y-axis (or multiple y-axes) can represent or contain values for candidates and/or issues. Additional or alternative possible shared axes can include demographic factors (e.g., age, income, occupation, marital status, number of children, party membership, etc.). The z-axis (or multiple z-axes) can represent or contain values for sub-territories (e.g., precincts, etc.) within the corresponding voting territory represented by the tensor. The tensor GSVD and/or HO GSVD can be performed to determine similarities and dissimilarities between public opinion on candidates or issues in two states (or among more than two) across time.
EXAMPLE 10
[0143] According to some embodiments, methods of the subject technology can be implemented in the field of macroeconomics. For example, data relating to employment rates can be tabulated in tensors. One or more tensors can represent or contain values for employment data such as employment rate, government spending in dollars, levels of macroeconomic factors (e.g.,
tax rates, interest rates, etc.). The shared x-axis can represent or contain values for time. The shared y-axis (or multiple y-axes) can represent or contain values for regions (e.g., continent, country, state, county, city, district, etc.). The z-axis (or multiple z-axes) can represent or contain values for different areas of government spending and/or different types of macroeconomic factors (e.g., types of taxes, types of interest rates, etc.). The tensor GSVD and/or HO GSVD can be performed to determine similarities and dissimilarities between the two macroeconomic factors of employment and government spending (or among more than two factors, including, e.g., taxes, or interest rates) across time and cities.
EXAMPLE 11
[0144] According to some embodiments, methods of the subject technology can be implemented in the field of finance. For example, data relating to prices can be tabulated in tensors. Each tensor can represent or contain values for pricing data for a given asset or assets (e.g., stock prices, commodity prices, etc.) and/or pricing factors (e.g., housing prices). The shared x-axis can represent or contain values for time. The shared y-axis (or multiple y-axes) can represent or contain values for region(s). The z-axis (or multiple z-axes) can represent or contain values for different ones of the asset or assets (e.g., different stocks, different commodities, different pricing factors, etc.). The tensor GSVD and/or HO GSVD can be performed to determine similarities and dissimilarities between the two finance factors of stocks and commodities (or among more than two factors, including, e.g., housing prices) across time and regions.
EXAMPLE 12
[0145] According to some embodiments, methods of the subject technology can be implemented in the field of sports. For example, data relating to sports statistics (e.g., offensive statistics, on-base percentage, defensive statistics, earned run average, etc.) can be tabulated in tensors for one or more teams, players, or other participants. The statistics can relate to performance, results, training, and/or environmental factors. Each tensor can represent or contain values for statistical data for a given team, player, or other participant. The shared x-axis can represent or contain values for a span of time or group of events (e.g., season, game, inning, quarter, period, etc.). The shared y-axis (or multiple y-axes) can represent or contain values for game information, such as opposing team, location, opposing players, weather, time, duration, etc. The z-axis (or multiple z-axes) can represent or contain values for players or other participants corresponding to particular teams, for example. The tensor GSVD and/or HO GSVD can be performed to determine similarities and dissimilarities between the two teams (or among more than two teams) across season and games in season.
EXAMPLE 13
[0146] According to some embodiments, methods of the subject technology can be implemented in the field of traffic analysis. For example, data relating to traffic can be tabulated in tensors. Each tensor can represent a location (e.g., intersection, length of road, etc.) and contain values for individual experience (e.g., time that a car spends in a traffic intersection on each occasion, or mean speed of the car on a road on each occasion, etc.). The shared x-axis can represent or contain values for time (e.g., time of day, etc.). The shared y-axis (or multiple y-axes) can also represent or contain values for time (e.g., day of the week, etc.). The z-axis (or multiple z- axes) can represent or contain values for vehicles that travel through the corresponding location represented by the tensors. The tensor GSVD and/or HO GSVD can be performed to determine similarities and dissimilarities between the two traffic intersections, or roads (or among more than two intersections, or roads) across time of day, and day of the week, in terms of time spent, or mean speed driven.
EXAMPLE 14
[0147] According to some embodiments, methods of the subject technology can be implemented in the field of social media applications. For example, data relating to social media activity can be tabulated in tensors. Each tensor can represent or contain values for a number of posts (e.g., tweets, notifications, submissions, uploads, etc.) or individuals posting for a given identifier (e.g., hashtag, etc.). The shared x-axis can represent or contain values for time. The shared y-axis (or multiple y-axes) can represent or contain values for regions (e.g., continent, country, state, county, city, district, etc.). Additional or alternate possible shared axes include demographic factors (e.g., age, sex, income, occupation, relationship status, number of children, religious affiliation, political party membership, etc.). The z-axis (or multiple z-axes) can represent or contain values for people or number of people posting with a given identifier. The tensor GSVD and/or HO GSVD can be performed to determine similarities and dissimilarities between the levels of discussion of two hashtags (or among more than two) over time and in different regions (e.g., cities).
EXAMPLE 15
[0148] According to some embodiments, methods of the subject technology can be implemented in the field of climate and environment. For example, data relating to climate can be tabulated in tensors. Each tensor can represent or contain values for climate data for a given factor (e.g., atmosphere characteristics, infrared clouds, chemistry, ozone, aerosols, outgoing long wave energy, ocean characteristics, dissolved oxygen at different depths, land characteristics, vegetation,
cryosphere characteristics, snow and ice cover, and climate, observations, simulations, factors created by humans, chemical characteristics, light pollution characteristics, geophysical measurements, satellite observations, data from the National Oceanic and Atmospheric Administration, biological measurements, abundance levels, genomic sequences of living organisms, etc.). The shared x-axis can represent or contain values for location (e.g., latitude, etc.). The shared y-axis (or multiple y-axes) can represent or contain values for location (e.g., longitude, etc.). Additional possible shared axes can include geophysical factors (e.g., elevation, day in the year, etc.). The tensor GSVD and/or HO GSVD can be performed to determine similarities and dissimilarities between the variations of two climate and environmental factors (or among more than two) across latitude and longitude (and possibly also, e.g., elevation, and day in the year).
EXAMPLE 16
[0149] According to some embodiments, methods of the subject technology can be implemented in the field of recommendation systems. For example, data relating to recommendations can be tabulated in tensors. Each tensor can represent or contain values for recommendation data for a given user (e.g., user identity, type of media, experience ratings, etc.). The shared x-axis (or multiple x-axes) and the shared y-axis (or multiple y-axes) can represent or contain values for demographic factors (e.g., income level, state, or city). The z-axis (or multiple z- axes) can represent or contain values for types of examples of media or other consumer products and servcies (e.g., movies, books, music, dining, vacation locations, etc.). The tensor GSVD and/or HO GSVD can be performed to determine similarities and dissimilarities between user, or experience ratings of movies and books (or among more than two consumer products, including, e.g., vacation sites) across consumer demographics (e.g., income level, location, state, city, etc.). The tensor GSVD can also be used to help individuals make life decisions such as college, field of study, where to live, etc., provided that some sort of quantified information (e.g., subject's satisfaction on a scale of 1 to 10) is available. Shared axes could include demographic data, grades, test scores, membership in various organizations, etc. This data could be cross-correlated with other fields (e.g., social media, politics) that have similar demographic data as shared axes.
EXAMPLE 17
[0150] According to some embodiments, methods of the subject technology can be implemented in the field of fitness management. For example, data relating to fitness (e.g., frequencies or levels of one type of exercise, frequencies or amounts of any one food, SNP profiles, measured, e.g., by DNA microarrays, etc.) can be tabulated in tensors. Each tensor can represent or contain values for fitness data for a given user. The shared x-axis can represent or contain values
for vital signs (e.g., blood pressure, heart rate, etc.). Additional possible shared axes can include additional fitness factors (e.g., additional vital signs, weight, cholesterol levels), life style indicators (e.g., occupation), and family history. Tensors can correspond to exercise data, nutrition data, and/or any one of additional possible effectors of fitness (e.g., genetics as measured by, e.g., single- nucleotide polymorphism, i.e., SNP, profile, etc.) The z-axis (or multiple z-axes) can represent or contain values for different types of exercises, different types of foods, different probes of a SNP profile. The tensor GSVD and/or HO GSVD can be performed to determine similarities and dissimilarities between the two fitness effectors of exercise and nutrition (or among more than two fitness effectors, including, e.g., genetics) and their correlations with two or more fitness factors, e.g., vital signs, life style indicators, and family history.
EXAMPLE 18
[0151] According to some embodiments, methods of the subject technology can be implemented in the field of marketing and advertising. For example, data relating to numbers of purchases can be tabulated in tensors. Each tensor can represent or contain values for purchase data for a given source of goods and/or services (e.g., store, chain of stores, website, etc.). The shared x-axis can represent or contain values for a first demographic factor (e.g., income level, etc.). The shared y-axis (or multiple y-axes) can represent or contain values for a second demographic factor (e.g., state or city, etc.). The z-axis (or multiple z-axes) can represent or contain values for different items from one or more stores (e.g., different items from store 1, or chain 1, different items from store 2, or chain 2, different items from store 3, or chain 3, etc.). The tensor GSVD and/or HO GSVD can be performed to determine similarities and dissimilarities between purchases in two stores or chains (or among more than two stores) across consumer demographics, e.g., income level, and state or city. This could also be used to inform, e.g., targeted advertising.
EXAMPLE 19
[0152] According to some embodiments, methods of the subject technology can be implemented in the field of astrophysics. For example, data relating to intensities can be tabulated in tensors. Each tensor can represent or contain values for data from a given telescope and/or operating parameter (e.g., frequency, etc.). The shared x-axis can represent or contain values for first celestial coordinates. The shared y-axis (or multiple y-axes) can represent or contain values for second celestial coordinates. The z-axis (or multiple z-axes) can represent or contain values for time points measured by different telescopes. The tensor GSVD and/or HO GSVD can be performed to determine similarities and dissimilarities between sky surveys of two telescopes (or among more than two telescopes) at the same or different frequencies across celestial coordinates.
Dissimilar variations might correspond to experimental variation between the two (or among the more than two) telescopes. Similarities might correspond to different recordings of the same astrophysical event by the two, or more telescopes.
EXAMPLE 20
[0153] According to some embodiments, methods of the subject technology can be implemented in the field of voice and speech recognition. For example, data relating to intensities can be tabulated in tensors. Each tensor can represent or contain values for data for a given user. The shared x-axis can represent or contain values for a first speech characteristic (e.g., phonemes, etc.). The shared y-axis (or multiple y-axes) can represent or contain values for a second speech characteristic (e.g., notes, etc.). The z-axis (or multiple z-axes) can represent or contain values for time points in a recording of a corresponding user. The tensor GSVD and/or HO GSVD can be performed to determine similarities and dissimilarities between two speakers or singers (or among more than two) across commonly defined speech characteristics. This might identify the speech characteristics signature of each individual person, and be used in voice recognition.
EXAMPLE 21
[0154] According to some embodiments, methods of the subject technology can be implemented in the field of natural language processing and machine translation. For example, data relating to term frequency-inverse document frequencies (TF-IDFs) can be tabulated in tensors. Each tensor can represent or contain values for data for a given language. The shared x- axis can represent or contain values for books or other literary works. The shared y-axis (or multiple y-axes) can represent or contain values for chapters and/or verses. The z-axis (or multiple z-axes) can represent or contain values for N-grams (e.g., phonemes, syllables, letters, words, etc.) with respect to the corresponding language represented by the tensor. The tensor GSVD and/or HO GSVD can be performed to determine similarities and dissimilarities between two languages (or among more than two languages) in TF-IDFs of different n-grams across books and chapters in books.
EXAMPLE 22
[0155] According to some embodiments, methods of the subject technology can be implemented in the field of market demand and manufacturing. For example, data relating to market activity can be tabulated in tensors. Each tensor can represent or contain values for market data for a given indicator (e.g., number of items sold, value of items sold, employment rate, weather indicator, time, etc.). The shared x-axis can represent or contain values for location. The
shared y-axis (or multiple y-axes) can represent or contain values for time (e.g., day in the year). The z-axis (or multiple z-axes) can represent or contain values for availability of an item (e.g., measures in time span, etc.). The tensor GSVD and/or HO GSVD can be performed to determine similarities and dissimilarities between sales and an effector of sales, e.g., an economic indicator (or among sales, more than one effector, including, e.g., weather) and their correlations with location and day in the year. This could be used to predict market demand, and tailor manufacturing.
EXAMPLE 23
[0156] According to some embodiments, methods of the subject technology can be implemented in the field of education and personal development. For example, data relating to student characteristics can be tabulated in tensors. Each tensor can represent or contain values for student data (e.g., books read, etc.) for a given characteristic (e.g., GPA, school attended, etc.). The shared x-axis (or multiple x-axes) and the shared y-axis (or multiple y-axes) can represent or contain values for demographic factors (e.g., income level of parents, state or city of high school, etc.). The z-axis (or multiple z-axes) can represent or contain values for books read (e.g., list of books read by at least one student with GPA 4.0, list of books read by at least one student with GPA 3.0, list of books read by at least one student with GPA 2.0, etc.). The tensor GSVD and/or HO GSVD can be performed to determine similarities and dissimilarities between students with GPA 4.0 and 3.0 (or among more than two groups of students, including, e.g., those with GPA 2.0) across demographic factors, and in terms of books read or unread. This could be used to identify the reading habits that are exclusive to students with high, 4.0 GPA at University X.
SYSTEMS
[0157] FIG. 11 is a simplified diagram of a system 1100, in accordance with various embodiments of the subject technology. The system 1100 may include one or more remote client devices 1102 (e.g., client devices 1102a, 1102b, 1102c, 1102d, and 1102e) in communication with one or more server computing devices 1106 (e.g., servers 1106a and 1106b) via network 1104. In some embodiments, a client device 1102 is configured to run one or more applications based on communications with a server 1106 over a network 1104. In some embodiments, a server 1106 is configured to run one or more applications based on communications with a client device 1102 over the network 1104. In some embodiments, a server 1106 is configured to run one or more applications that may be accessed and controlled at a client device 1102. For example, a user at a client device 1102 may use a web browser to access and control an application running on a server 1106 over the network 1104. In some embodiments, a server 1106 is configured to allow remote
sessions (e.g., remote desktop sessions) wherein users can access applications and files on a server 1106 by logging onto a server 1106 from a client device 1102. Such a connection may be established using any of several well-known techniques such as the Remote Desktop Protocol (RDP) on a Windows-based server.
[0158] By way of illustration and not limitation, in some embodiments, stated from a perspective of a server side (treating a server as a local device and treating a client device as a remote device), a server application is executed (or runs) at a server 1106. While a remote client device 1102 may receive and display a view of the server application on a display local to the remote client device 1102, the remote client device 1102 does not execute (or run) the server application at the remote client device 1102. Stated in another way from a perspective of the client side (treating a server as remote device and treating a client device as a local device), a remote application is executed (or runs) at a remote server 1106.
[0159] By way of illustration and not limitation, in some embodiments, a client device
1102 can represent a desktop computer, a mobile phone, a laptop computer, a netbook computer, a tablet, a thin client device, a personal digital assistant (PDA), a portable computing device, and/or a suitable device with a processor. In one example, a client device 1102 is a smartphone (e.g., iPhone, Android phone, Blackberry, etc.). In certain configurations, a client device 1102 can represent an audio player, a game console, a camera, a camcorder, a Global Positioning System (GPS) receiver, a television set top box an audio device, a video device, a multimedia device, and/or a device capable of supporting a connection to a remote server. In some embodiments, a client device 1102 can be mobile. In some embodiments, a client device 1102 can be stationary. According to certain embodiments, a client device 1102 may be a device having at least a processor and memory, where the total amount of memory of the client device 1102 could be less than the total amount of memory in a server 1106. In some embodiments, a client device 1102 does not have a hard disk. In some embodiments, a client device 1102 has a display smaller than a display supported by a server 1106. In some aspects, a client device 1102 may include one or more client devices.
[0160] In some embodiments, a server 1106 may represent a computer, a laptop computer, a computing device, a virtual machine (e.g., VMware® Virtual Machine), a desktop session (e.g., Microsoft Terminal Server), a published application (e.g., Microsoft Terminal Server), and/or a suitable device with a processor. In some embodiments, a server 1106 can be stationary. In some embodiments, a server 1 106 can be mobile. In certain configurations, a server
1106 may be any device that can represent a client device. In some embodiments, a server 1106 may include one or more servers.
[0161] In some embodiments, a first device is remote to a second device when the first device is not directly connected to the second device. In some embodiments, a first remote device may be connected to a second device over a communication network such as a Local Area Network (LAN), a Wide Area Network (WAN), and/or other network.
[0162] When a client device 1102 and a server 1106 are remote with respect to each other, a client device 1102 may connect to a server 1106 over the network 1104, for example, via a modem connection, a LAN connection including the Ethernet or a broadband WAN connection including DSL, Cable, Tl, T3, Fiber Optics, Wi-Fi, and/or a mobile network connection including GSM, GPRS, 3G, 4G, 4G LTE, WiMax or other network connection. Network 1104 can be a LAN network, a WAN network, a wireless network, the Internet, an intranet, and/or other network. The network 1104 may include one or more routers for routing data between client devices and/or servers. A remote device (e.g., client device, server) on a network may be addressed by a corresponding network address, such as, but not limited to, an Internet protocol (IP) address, an Internet name, a Windows Internet name service (WINS) name, a domain name, and/or other system name. These illustrate some examples as to how one device may be remote to another device, but the subject technology is not limited to these examples.
[0163] According to certain embodiments of the subject technology, the terms "server" and "remote server" are generally used synonymously in relation to a client device, and the word "remote" may indicate that a server is in communication with other device(s), for example, over a network connection(s).
[0164] According to certain embodiments of the subject technology, the terms "client device" and "remote client device" are generally used synonymously in relation to a server, and the word "remote" may indicate that a client device is in communication with a server(s), for example, over a network connection(s).
[0165] In some embodiments, a "client device" may be sometimes referred to as a client or vice versa. Similarly, a "server" may be sometimes referred to as a server device or server computer or like terms.
[0166] In some embodiments, the terms "local" and "remote" are relative terms, and a client device may be referred to as a local client device or a remote client device, depending on whether a client device is described from a client side or from a server side, respectively. Similarly, a server may be referred to as a local server or a remote server, depending on whether a server is described from a server side or from a client side, respectively. Furthermore, an application running on a server may be referred to as a local application, if described from a server side, and may be referred to as a remote application, if described from a client side.
[0167] In some embodiments, devices placed on a client side (e.g., devices connected directly to a client device(s) or to one another using wires or wirelessly) may be referred to as local devices with respect to a client device and remote devices with respect to a server. Similarly, devices placed on a server side (e.g., devices connected directly to a server(s) or to one another using wires or wirelessly) may be referred to as local devices with respect to a server and remote devices with respect to a client device.
[0168] FIG. 12 is a block diagram illustrating an exemplary computer system 1200 with which a client device 1102 and/or a server 1106 of FIG. 11 can be implemented. In certain embodiments, the computer system 1200 may be implemented using hardware or a combination of software and hardware, either in a dedicated server, or integrated into another entity, or distributed across multiple entities.
[0169] The computer system 1200 (e.g., client 1102 and servers 1106) includes a bus
1208 or other communication mechanism for communicating information, and a processor 1202 coupled with the bus 1208 for processing information. By way of example, the computer system 1200 may be implemented with one or more processors 1202. The processor 1202 may be a general-purpose microprocessor, a microcontroller, a Digital Signal Processor (DSP), an Application Specific Integrated Circuit (ASIC), a Field Programmable Gate Array (FPGA), a Programmable Logic Device (PLD), a controller, a state machine, gated logic, discrete hardware components, and/or any other suitable entity that can perform calculations or other manipulations of information.
[0170] The computer system 1200 can include, in addition to hardware, code that creates an execution environment for the computer program in question, e.g., code that constitutes processor firmware, a protocol stack, a database management system, an operating system, or a combination of one or more of them stored in an included memory 1204, such as a Random Access Memory (RAM), a flash memory, a Read Only Memory (ROM), a Programmable Read-Only
Memory (PROM), an Erasable PROM (EPROM), registers, a hard disk, a removable disk, a CD- ROM, a DVD, and/or any other suitable storage device, coupled to the bus 1208 for storing information and instructions to be executed by the processor 1202. The processor 1202 and the memory 1204 can be supplemented by, or incorporated in, special purpose logic circuitry.
[0171] The instructions may be stored in the memory 1204 and implemented in one or more computer program products, i.e., one or more modules of computer program instructions encoded on a computer readable medium for execution by, or to control the operation of, the computer system 1200, and according to any method well known to those of skill in the art, including, but not limited to, computer languages such as data-oriented languages (e.g., SQL, dBase), system languages (e.g., C, Objective-C, C++, Assembly), architectural languages (e.g., Java, .NET), and/or application languages (e.g., PHP, Ruby, Perl, Python). Instructions may also be implemented in computer languages such as array languages, aspect-oriented languages, assembly languages, authoring languages, command line interface languages, compiled languages, concurrent languages, curly-bracket languages, dataflow languages, data-structured languages, declarative languages, esoteric languages, extension languages, fourth-generation languages, functional languages, interactive mode languages, interpreted languages, iterative languages, list- based languages, little languages, logic-based languages, machine languages, macro languages, metaprogramming languages, multiparadigm languages, numerical analysis, non-English-based languages, object-oriented class-based languages, object-oriented prototype-based languages, offside rule languages, procedural languages, reflective languages, rule-based languages, scripting languages, stack-based languages, synchronous languages, syntax handling languages, visual languages, wirth languages, and/or xml-based languages. The memory 1204 may also be used for storing temporary variable or other intermediate information during execution of instructions to be executed by the processor 1202.
[0172] A computer program as discussed herein does not necessarily correspond to a file in a file system. A program can be stored in a portion of a file that holds other programs or data (e.g., one or more scripts stored in a markup language document), in a single file dedicated to the program in question, or in multiple coordinated files (e.g., files that store one or more modules, subprograms, or portions of code). A computer program can be deployed to be executed on one computer or on multiple computers that are located at one site or distributed across multiple sites and interconnected by a communication network. The processes and logic flows described in this specification can be performed by one or more programmable processors executing one or more computer programs to perform functions by operating on input data and generating output.
[0173] The computer system 1200 further includes a data storage device 1206 such as a magnetic disk or optical disk, coupled to the bus 1208 for storing information and instructions. The computer system 1200 may be coupled via an input/output module 1210 to various devices (e.g., devices 1214 and 1216). The input/output module 1210 can be any input/output module. Exemplary input/output modules 1210 include data ports (e.g., USB ports), audio ports, and/or video ports. In some embodiments, the input/output module 1210 includes a communications module. Exemplary communications modules include networking interface cards, such as Ethernet cards, modems, and routers. In certain aspects, the input/output module 1210 is configured to connect to a plurality of devices, such as an input device 1214 and/or an output device 1216. Exemplary input devices 1214 include a keyboard and/or a pointing device (e.g., a mouse or a trackball) by which a user can provide input to the computer system 1200. Other kinds of input devices 1214 can be used to provide for interaction with a user as well, such as a tactile input device, visual input device, audio input device, and/or brain-computer interface device. For example, feedback provided to the user can be any form of sensory feedback (e.g., visual feedback, auditory feedback, and/or tactile feedback), and input from the user can be received in any form, including acoustic, speech, tactile, and/or brain wave input. Exemplary output devices 1216 include display devices, such as a cathode ray tube (CRT) or liquid crystal display (LCD) monitor, for displaying information to the user.
[0174] According to certain embodiments, a client device 1102 and/or server 1106 can be implemented using the computer system 1200 in response to the processor 1202 executing one or more sequences of one or more instructions contained in the memory 1204. Such instructions may be read into the memory 1204 from another machine-readable medium, such as the data storage device 1206. Execution of the sequences of instructions contained in the memory 1204 causes the processor 1202 to perform the process steps described herein. One or more processors in a multi-processing arrangement may also be employed to execute the sequences of instructions contained in the memory 1204. In some embodiments, hard-wired circuitry may be used in place of or in combination with software instructions to implement various aspects of the present disclosure. Thus, aspects of the present disclosure are not limited to any specific combination of hardware circuitry and software.
[0175] Various aspects of the subject matter described in this specification can be implemented in a computing system that includes a back end component (e.g., a data server), or that includes a middleware component (e.g., an application server), or that includes a front end component (e.g., a client computer having a graphical user interface and/or a Web browser through
which a user can interact with an implementation of the subject matter described in this specification), or any combination of one or more such back end, middleware, or front end components. The components of the system 1200 can be interconnected by any form or medium of digital data communication (e.g., a communication network). Examples of communication networks include a local area network and a wide area network.
[0176] The term "machine-readable storage medium" or "computer readable medium" as used herein refers to any medium or media that participates in providing instructions to the processor 1202 for execution. Such a medium may take many forms, including, but not limited to, non-volatile media, volatile media, and transmission media. Non-volatile media include, for example, optical or magnetic disks, such as the data storage device 1206. Volatile media include dynamic memory, such as the memory 1204. Transmission media include coaxial cables, copper wire, and fiber optics, including the wires that comprise the bus 1208. Common forms of machine- readable media include, for example, floppy disk, a flexible disk, hard disk, magnetic tape, any other magnetic medium, a CD-ROM, DVD, any other optical medium, punch cards, paper tape, any other physical medium with patterns of holes, a RAM, a PROM, an EPROM, a FLASH EPROM, any other memory chip or cartridge, or any other medium from which a computer can read. The machine-readable storage medium can be a machine-readable storage device, a machine-readable storage substrate, a memory device, a composition of matter effecting a machine-readable propagated signal, or a combination of one or more of them.
[0177] As used herein, a "processor" can include one or more processors, and a
"module" can include one or more modules.
[0178] In an aspect of the subject technology, a machine-readable medium is a computer-readable medium encoded or stored with instructions and is a computing element, which defines structural and functional relationships between the instructions and the rest of the system, which permit the instructions' functionality to be realized. Instructions may be executable, for example, by a system or by a processor of the system. Instructions can be, for example, a computer program including code. A machine-readable medium may comprise one or more media.
[0179] As used herein, the word "module" refers to logic embodied in hardware or firmware, or to a collection of software instructions, possibly having entry and exit points, written in a programming language, such as, for example C++. Two or more modules may be embodied in a single piece of hardware, firmware or software. A software module may be compiled and linked into an executable program, installed in a dynamic link library, or may be written in an interpretive
language such as BASIC. It will be appreciated that software modules may be callable from other modules or from themselves, and/or may be invoked in response to detected events or interrupts. Software instructions may be embedded in firmware, such as an EPROM or EEPROM. It will be further appreciated that hardware modules may be comprised of connected logic units, such as gates and flip-flops, and/or may be comprised of programmable units, such as programmable gate arrays or processors. The modules described herein are preferably implemented as software modules, but may be represented in hardware or firmware.
[0180] It is contemplated that the modules may be integrated into a fewer number of modules. One module may also be separated into multiple modules. The described modules may be implemented as hardware, software, firmware or any combination thereof. Additionally, the described modules may reside at different locations connected through a wired or wireless network, or the Internet.
[0181] In general, it will be appreciated that the processors can include, by way of example, computers, program logic, or other substrate configurations representing data and instructions, which operate as described herein. In other embodiments, the processors can include controller circuitry, processor circuitry, processors, general purpose single-chip or multi-chip microprocessors, digital signal processors, embedded microprocessors, microcontrollers and the like.
[0182] Furthermore, it will be appreciated that in one embodiment, the program logic may advantageously be implemented as one or more components. The components may advantageously be configured to execute on one or more processors. The components include, but are not limited to, software or hardware components, modules such as software modules, object- oriented software components, class components and task components, processes methods, functions, attributes, procedures, subroutines, segments of program code, drivers, firmware, microcode, circuitry, data, databases, data structures, tables, arrays, and variables.
[0183] A phrase such as "an aspect" does not imply that such aspect is essential to the subject technology or that such aspect applies to all configurations of the subject technology. A disclosure relating to an aspect may apply to all configurations, or one or more configurations. An aspect may provide one or more examples of the disclosure. A phrase such as "an aspect" may refer to one or more aspects and vice versa. A phrase such as "an embodiment" does not imply that such embodiment is essential to the subject technology or that such embodiment applies to all configurations of the subject technology. A disclosure relating to an embodiment may apply to all
embodiments, or one or more embodiments. An embodiment may provide one or more examples of the disclosure. A phrase such "an embodiment" may refer to one or more embodiments and vice versa. A phrase such as "a configuration" does not imply that such configuration is essential to the subject technology or that such configuration applies to all configurations of the subject technology. A disclosure relating to a configuration may apply to all configurations, or one or more configurations. A configuration may provide one or more examples of the disclosure. A phrase such as "a configuration" may refer to one or more configurations and vice versa.
[0184] The foregoing description is provided to enable a person skilled in the art to practice the various configurations described herein. While the subject technology has been particularly described with reference to the various figures and configurations, it should be understood that these are for illustration purposes only and should not be taken as limiting the scope of the subject technology.
[0185] There may be many other ways to implement the subject technology. Various functions and elements described herein may be partitioned differently from those shown without departing from the scope of the subject technology. Various modifications to these configurations will be readily apparent to those skilled in the art, and generic principles defined herein may be applied to other configurations. Thus, many changes and modifications may be made to the subject technology, by one having ordinary skill in the art, without departing from the scope of the subject technology.
[0186] It is understood that the specific order or hierarchy of steps in the processes disclosed is an illustration of exemplary approaches. Based upon design preferences, it is understood that the specific order or hierarchy of steps in the processes may be rearranged. Some of the steps may be performed simultaneously. The accompanying method claims present elements of the various steps in a sample order, and are not meant to be limited to the specific order or hierarchy presented.
[0187] As used herein, the phrase "at least one of preceding a series of items, with the term "and" or "or" to separate any of the items, modifies the list as a whole, rather than each member of the list (i.e., each item). The phrase "at least one of does not require selection of at least one of each item listed; rather, the phrase allows a meaning that includes at least one of any one of the items, and/or at least one of any combination of the items, and/or at least one of each of the items. By way of example, the phrases "at least one of A, B, and C" or "at least one of A, B, or
C" each refer to only A, only B, or only C; any combination of A, B, and C; and/or at least one of each of A, B, and C.
[0188] Terms such as "top," "bottom," "front," "rear" and the like as used in this disclosure should be understood as referring to an arbitrary frame of reference, rather than to the ordinary gravitational frame of reference. Thus, a top surface, a bottom surface, a front surface, and a rear surface may extend upwardly, downwardly, diagonally, or horizontally in a gravitational frame of reference.
[0189] Furthermore, to the extent that the term "include," "have," or the like is used in the description or the claims, such term is intended to be inclusive in a manner similar to the term "comprise" as "comprise" is interpreted when employed as a transitional word in a claim.
[0190] The word "exemplary" is used herein to mean "serving as an example, instance, or illustration." Any embodiment described herein as "exemplary" is not necessarily to be construed as preferred or advantageous over other embodiments.
[0191] A reference to an element in the singular is not intended to mean "one and only one" unless specifically stated, but rather "one or more." Pronouns in the masculine (e.g., his) include the feminine and neuter gender (e.g., her and its) and vice versa. The term "some" refers to one or more. Underlined and/or italicized headings and subheadings are used for convenience only, do not limit the subject technology, and are not referred to in connection with the interpretation of the description of the subject technology. All structural and functional equivalents to the elements of the various configurations described throughout this disclosure that are known or later come to be known to those of ordinary skill in the art are expressly incorporated herein by reference and intended to be encompassed by the subject technology. Moreover, nothing disclosed herein is intended to be dedicated to the public regardless of whether such disclosure is explicitly recited in the above description.
[0192] While certain aspects and embodiments of the subject technology have been described, these have been presented by way of example only, and are not intended to limit the scope of the subject technology. Indeed, the novel methods and systems described herein may be embodied in a variety of other forms without departing from the spirit thereof. The accompanying claims and their equivalents are intended to cover such forms or modifications as would fall within the scope and spirit of the subject technology.
Tensor GSVD of patient- and platform-matched tumor and normal DNA copy-number profiles uncovers chromosome arm-wide patterns of tumor-exclusive platform-consistent alterations encoding for cell transformation and predicting ovarian cancer survival
Preethi Sankaranarayanan1'2*, Theodore E. Schomay1'2* , Katherine A. Aiello1'2, and Orly Alter1'2'3*
1 Scientific Computing and Imaging (SCI) Institute, University of Utah, Salt Lake City, Utah, United States of America
2 Department of Bioengineering, University of Utah, Salt Lake City, Utah, United States of America, and
3 Department of Human Genetics, University of Utah, Salt Lake City, Utah, United States of America
* E-mail: orly@sci.utah.edu
These authors contributed equally to this work.
Abstract
The number of large-scale high-dimensional datasets recording different aspects of a single disease is growing, accompanied by a need for frameworks that can create one coherent model from multiple tensors of matched columns, e.g., patients and platforms, but independent rows, e.g., probes. We define and prove the mathematical properties of a novel tensor generalized singular value decomposition (GSVD), which can simultaneously find the similarities and dissimilarities, i.e., patterns of varying relative significance, between any two such tensors. We demonstrate the tensor GSVD in comparative modeling of patient- and platform-matched but probe-independent ovarian serous cystadenocarcinoma (OV) tumor, mostly high-grade, and normal DNA copy-number profiles, across each chromosome arm, and combination of two arms, separately. The modeling uncovers previously unrecognized patterns of tumor-exclusive platform- consistent co-occurring copy-number alterations (CNAs). We find, first, and validate that each of the patterns across only 7p and Xq, and the combination of 6p+12p, is correlated with a patient's prognosis, is independent of the tumor's stage, the best predictor of OV survival to date, and together with stage makes a better predictor than stage alone. Second, these patterns include most known OV-associated CNAs that map to these chromosome arms, as well as several previously unreported, yet frequent focal CNAs. Third, differential mRNA, microRNA, and protein expression consistently map to the DNA CNAs. A coherent picture emerges for each pattern, suggesting roles for the CNAs in OV pathogenesis and personalized therapy. In 6p+12p, deletion of the p21-encoding CDKNlA and p38-encoding MAPK14 and amplification of RAD51AP1 and KRAS encode for human cell transformation, and are correlated with a cell's immortality, and a patient's shorter survival time. In 7p, RPA3 deletion and P0LD2 amplification are correlated with DNA stability, and a longer survival. In Xq, PABPC5 deletion and BCAP31 amplification are correlated with a cellular immune response, and a longer survival.
Introduction
The growing number of large-scale high-dimensional datasets recording different aspects of a single disease promise to enhance basic understanding of life on the molecular level as well as medical diagnosis, prognosis, and treatment. This is accompanied by a fundamental need for mathematical frameworks that can create one coherent model from multiple datasets arranged in multiple order-matched, column-matched, and row- independent tensors, i.e., tensors of the same number of dimensions each, with one-to-one mappings among the columns across all but one the of corresponding dimensions among the tensors, but
not necessarily among the rows across the one remaining dimension in each tensor. Consider, e.g., the structure of the DNA copy-number datasets in the Cancer Genome Atlas (TCGA) [1, 2] . Profiles of tumor and normal tissues from the same set of patients have the structure of two matrices, i.e., second-order tensors, with a one-to-one mapping between the columns that correspond to the same set of patients, but not necessarily between the rows that correspond to the DNA copy-number probes with valid data in either the tumor or the normal dataset, and may be different. When the tumor and normal profiles are measured in replicates, e.g., by the same set of profiling platforms, then the structure of the tumor and normal datasets is that of two third-order tensors, of matched columns that correspond to the same sets of patients and platforms, and independent rows that correspond to the probes in either the tumor or the normal dataset.
The higher-order generalized singular value decomposition (HO GSVD) is the only simultaneous decomposition to date of more than two such column-matched but row-independent datasets, which is by definition exact, and which mathematical properties allow interpreting its variables and operations in terms of the similar as well as dissimilar, e.g., biomedical reality among the datasets [3, 4] . The HO GSVD generalizes the GSVD [5-12] , which was demonstrated in comparative modeling of, e.g., patient- matched but probe-independent glioblastoma (GBM) brain tumor and normal DNA copy-number profiles from TCGA [13] . The modeling uncovered a previously unrecognized genome- wide pattern of tumor- exclusive copy- number alterations (CNAs). Prior to the modeling, DNA copy- number subtypes of GBM predictive of survival and response to chemotherapy were not conclusively identified [14, 15] , and the best predictor of GBM survival was the patient's age at diagnosis [16, 17] . Survival analyses [18, 19] showed and validated that the pattern is correlated with a GBM patient's prognosis and response to chemotherapy, is independent of age, and together with age makes a better predictor than age alone. Segmentation [20, 21] of the pattern showed that it includes most known GBM-associated changes in chromosome numbers and focal CNAs, as well as several previously unreported, yet frequent CNAs. This suggested that the pattern is not only correlated, but also possibly causally coordinated with the GBM tumor's pathogenesis. Previously unrecognized targets for personalized GBM drug therapy were also suggested, the tousled-like kinase 2 TLK2 and the methyltransferase-like 2A METTL2A [22-24] . The GSVD comparative modeling, therefore, resulted in new insights into the poorly understood relations between a GBM tumor's genome and a patient's survival phenotype.
The GSVD and HO GSVD, however, are limited to datasets arranged in second-order tensors, i.e., matrices. We define, therefore, a novel tensor GSVD, i.e., an exact simultaneous decomposition of two datasets, arranged in two higher-than-second-order tensors of matched column dimensions but independent row dimensions. The tensor GSVD factors or separates the pair of tensors into corresponding pairs of "subtensors," i.e., pairs of outer products or combinations of a paired set of patterns each: patterns, one across each of the matched column dimensions, which are identical for both tensors, combined with one pattern across the independent row dimension of either one of the two tensors. The pairs of subtensors are of varying relative mathematical significance, i.e., the significance of one subtensor in a pair in the corresponding tensor relative to the significance of the second subtensor in the second tensor varies among the pairs of subtensors. We prove that the tensor GSVD extends the GSVD and the tensor higher-order singular value decomposition (HOSVD) [25-28] from a decomposition of either two column- matched matrices or one tensor, respectively, to a decomposition of two order- matched, column-matched, and row-independent tensors [29] . We also show that the mathematical properties of the tensor GSVD allow interpreting the subtensors in terms of the biomedical similarities and dissimilarities between the two corresponding high-dimensional datasets.
We demonstrate the tensor GSVD in comparative modeling of patient- and platform-matched but probe-independent ovarian serous cystadenocarcinoma (OV) tumor and normal DNA copy-number profiles from TCGA. Most of the tumors, i.e., >95%, are high-grade tumors [30] . OV accounts for about 90% of all ovarian cancers. Despite recent large-scale profiling efforts, the best predictor of OV survival to date has remained the tumor's stage at diagnosis, a pathological assessment of the spread of the cancer number-
ing I to IV [31] . About 25% of primary OV tumors are resistant, and most recurrent OV tumors develop resistance to platinum-based chemotherapy, the first-line treatment for more than 30 years now [32] . Even though there exist drugs for platinum-based chemotherapy-resistant OV tumors, no pathology laboratory diagnostic exists that distinguishes between resistant and sensitive tumors before the treatment [33] . OV tumors exhibit significant CNA variation among them, much more so than, e.g., GBM tumors, and very few frequent CNAs typical of OV have been identified so far. We, therefore, model the profiles across each chromosome arm, and each combination of two chromosome arms, separately. The modeling uncovers previously unrecognized chromosome arm-wide patterns of tumor-exclusive and platform-consistent co-occurring CNAs.
By using survival analyses of the discovery and, separately, validation set of patients, as well as only the platinum-based chemotherapy patients in the discovery and validation sets, we find, first, and validate that each of the patterns across only the chromosome arms 7p and Xq, and across only the combination of the two chromosome arms 6p+12p (but not 6p nor 12p separately), is correlated with an OV patient's prognosis and response to platinum-based chemotherapy, is independent of stage, and together with stage makes a better predictor than stage alone. By using survival analyses of only the >95% patients with high-grade tumors, we find and validate that these patterns are also independent of the OV tumor's grade. We observe three groups of significantly different prognoses among the patients classified by a combination of the 6p+12p, 7p, and Xq tensor GSVD classifications, suggesting a possible implementation of the patterns in a pathology laboratory test. Second, by using segmentation of the 6p+12p, 7p, and Xq patterns, we find that the amplifications and deletions identified by these patterns include most known OV-associated CNAs that map to these chromosome arms [34] , as well as several previously unreported, yet frequent focal CNAs [35-38] . Third, by using gene ontology enrichment analyses of the OV tumor mRNA expression profiles of the patients [39, 40] , we find that differential mRNA expression between the patients, classified by any one of the three tensor GSVDs, is enriched in ontologies corresponding to one of three hallmarks of cancer [41] : a cell's immortality in 6p+12p, DNA instability in 7p, and cellular immune response suppression in Xq. The differential mRNA expression of genes from these enriched ontologies that are located on any one of the chromosome arms is consistent with the CNAs across that arm. Genes that map to amplifications or deletions on any one pattern, are overexpressed or underexpressed, respectively, in the patients which tumor profiles are classified as highly similar to that pattern. The differential expression of all microRNAs and proteins that map to any one of the chromosome arms is also consistent with the CNAs across that arm.
Taken together, a coherent picture emerges for each of these previously unrecognized chromosome arm-wide patterns of tumor-exclusive and platform-consistent co-occurring alterations, suggesting roles for the DNA CNAs in OV pathogenesis in addition to personalized diagnosis, prognosis, and treatment. In 6p+12p, loss of the p21-encoding CDKNlA and the p38-encoding MAPK14 on 6p, and gain of KRAS on 12p, combined but not separately, can lead to transformation of human normal to tumor cells [42, 43] . These transformation-encoding CNAs, together with deletion of TNF on 6p, and amplification of RAD51AP1 and ITPR2 on 12p, are correlated with a suppression of cell cycle arrest, senescence, and apoptosis, i.e., a tumor cell's immortality, and a patient's shorter survival time [44-55] . Note that there already exist drugs that interact with CDKNlA, MAPK14, and RAD51AP1, even though these genes were not recognized previously as targets for OV drug therapy [56] . In 7p, RPA3 deletion and POLD2 amplification are correlated with DNA repair during replication, i.e., DNA stability, and a longer survival time [57, 58] . In Xq, PABPC5 deletion and BCAP31 amplification are correlated with a cellular immune response, and a longer survival time [59] .
Mathematical Method: Tensor GSVD
Discovery Datasets are Pairs of Column-Matched but Row-Independent Tensors.
We selected primary OV tumor and normal DNA copy-number profiles of a set of 249 TCGA patients [2] (Sec. 1.1 in SI Appendix, and SI Dataset). Each profile was measured in two replicates by the same set of two DNA microarray platforms. For each chromosome arm or combination of two chromosome arms, the structure of these tumor and normal discovery datasets T>i and T>2, of .ft^-tumor and _ftT2-normal probes x ^patients, i.e., arrays x -platforms, is that of two third-order tensors with one-to-one mappings between the column dimensions L and M, but different row dimensions K\ and K^, where K\, K2 > LM.
The Tensor GSVD.
We define, therefore, a novel tensor GSVD that simultaneously separates the paired datasets into weighted sums of LM paired "subtensors," i.e., combinations or outer products of three patterns each: Either one tumor-specific pattern of copy-number variation across the tumor probes, i.e., a "tumor arraylet" u ^a, or the corresponding normal-specific pattern across the normal probes, i.e., the "normal arraylet" «2, a , combined with one pattern of copy-number variation across the patients, i.e., an "i-probelet" wjb and one pattern across the platforms, i.e., a "¾ -probelet" c, which are identical for both the tumor and normal datasets (Fig. 1, and Figs. A and B in SI Appendix),

LM L M
= Ki,abcSi(a, b, c),
a=l 6=1 c=l
Si(a, b, c) = u » v » Vy C, i = 1, 2, (1) where x aUi, xbVx and xcVy denote tensor-matrix multiplications, which contract the L -arraylet, L·x- probelet, and -¾ -probelet dimensions of the "core tensor" 7¾ with those of Ui, Vx, and Vy, respectively, and where ® denotes an outer product.
Construction. Suppose that unfolding (or matricizing) both tensors T>i into matrices, each preserving the Ki-row dimension, e.g., by appending the LM columns T>i^im of the corresponding tensor, gives two full column-rank matrices 7¾ € mKt XLM. We obtain the column bases vectors Ui from the GSVD of Di [5-13] , i.e., the "row mode GSVD"
Z¼ = (. . . , Pi,:!m, . . .) = E/i∑iVT, i = l, 2. (2)
Suppose, similarly, that unfolding both tensors T>i into matrices, each preserving the L·x- (or M-y-) column dimension, e.g., by appending the ¾M rows 2?f¾..m (or the KiL rows 2?f¾ .;.) of the corresponding tensor, gives two full column-rank matrices DIX € ^KtM x L ^Qr J^ g -^KtL x M w/e obtain the x- (or y-) row basis vectors Vx (or Vy ), from the GSVD of DIX (or DIY), i.e., the x- (or y-) column mode GSVD,

Diy = (. . . , ¾, . . .) = Uw wVy T, 1 = 1, 2. (3)
Note that the x- and ¾ -row bases vectors are, in general, non-orthogonal but normalized, and Vx and
The column bases vectors are normalized and orthogonal, i.e., uncorrelated, such that
Figure 1. Tensor generalized singular value decomposition (GSVD) of the patient- and platform-matched DNA copy-number profiles of the 6p+12p chromosome arm. For each chromosome arm or combination of two chromosome arms, the structure of the tumor and normal discovery datasets (T>i and 2¾) is that of two third-order tensors with one-to-one mappings between the column dimensions but different row dimensions. The patients, platforms, probes, and tissue types, each represent a degree of freedom. Unfolded into a single matrix, some of the degrees of freedom are lost and much of the information in the datasets might also be lost. We define a tensor GSVD that simultaneously separates the paired datasets into weighted sums of paired subtensors, i.e., combinations or outer products of three patterns each: Either one tumor-specific pattern of copy-number variation across the tumor probes, i.e., a tumor arraylet (a column basis vector of U\), or the corresponding normal-specific arraylet (a column basis vector of L¾), combined with one pattern of variation across the patients, i.e., an i-probelet (a row basis vector of VX T), and one pattern across the platforms, i.e., a j -probelet (a row basis vector of V^), which are identical for both the tumor and normal datasets (Eq. 1). The tensor GSVD is depicted in a raster display, with relative copy-number gain (red), no change (black), and loss (green), explicitly showing the first through the 5th, and the 245th through the 249th 6p+12p i-probelets, both 6p+12p ¾ -probelets, and the first through the 10th, and the 489th through the 498th 6p+12p tumor and normal arraylets. We prove that the significance of a subtensor in the tumor dataset relative to that of the corresponding subtensor in the normal dataset, i.e., the tensor GSVD angular distance, equals the row mode GSVD angular distance, i.e., the significance of the corresponding tumor arraylet in the tumor dataset relative to that of the normal arraylet in the normal dataset. The tensor GSVD angular distances for the 498 pairs of 6p+12p arraylets are depicted in a bar chart display, where the angular distance corresponding to the first pair of arraylets is ~π/4. For the 6p+12p combination of two chromosome arms, we find that the most significant subtensor in the tumor dataset (which corresponds to the coefficient of largest magnitude in IZi) is a combination of (i) the first j -probelet, which is approximately invariant across the platforms, (ii) the first i-probelet, which classifies the discovery set of patients into two groups of high and low coefficients, of significantly and robustly different prognoses, and (in) the first, most tumor-exclusive tumor arraylet, which classifies the validation set of patients into two groups of high and low correlations of significantly different prognoses consistent with the i-probelet's classification of the discovery set.
The generalized singular values are positive, and are arranged in ∑i 5 ∑ix , and ∑iy in decreasing orders of the corresponding "GSVD angular distances," i.e., decreasing orders of the ratios σι<α/σ2,α, cix,b/c'2x,b, and aiyt C/a2y,c, respectively. We then compute the core tensors 7¾ by contracting the row-, X-, and j -column dimensions of the tensors T>i with those of the matrices Ui, V~ x , and ^_ 1 , respectively. For real tensors, the "tensor generalized singular values" 7¾iat,c tabulated in the core tensors are real but not necessarily positive. Our tensor GSVD construction generalizes the GSVD to higher orders in analogy with the generalization of the singular value decomposition (SVD) by the HOSVD [25-28] , and is different from other approaches to the decomposition of two tensors [29] .
Existence, uniqueness and special cases. We prove that our tensor GSVD exists for two tensors of any order because it is constructed from the GSVDs of the tensors unfolded into full column-rank matrices (Lemma A in SI Appendix). The tensor GSVD has the same uniqueness properties as the GSVD, where the column bases vectors u^a and the row bases vectors wjb and wjc are unique, except in degenerate subspaces, defined by subsets of equal generalized singular values aix, and aiy, respectively, and up to phase factors of ±1, such that each vector captures both parallel and antiparallel patterns (Lemma B in SI Appendix). The tensor GSVD of two second-order tensors reduces to the GSVD of the corresponding matrices (Corollary A in SI Appendix). The tensor GSVD of the tensor Ό € ]R,LM x L x M ; which row
mode unfolding gives the identity matrix D\ = I ζ -^LM x LM ^ an(j a Censor p2 Gf the same column dimensions reduces to the HOSVD of 2¾ (Theorem A in SI Appendix).
Interpretation. The significance of the subtensor <¾(α, b, c) in the tensor T>i is defined proportional to the magnitude of the corresponding tensor generalized singular values
 (Fig. C in SI Appendix), in analogy with the HOSVD,
LM L M
a=l 6=1 c=l
The significance of S\ {a, b, c) in V relative to that of ¾(α, b, c) in 2¾ is defined by the "tensor GSVD angular distance" Oabc as a function of the ratio 7? iat,c/7¾,a&c- This is in analogy with, e.g., the row mode GSVD angular distance θα, which defines the significance of the column basis vector u ^a in the matrix D\ of Eq. (2) relative to that of «2,α m■¾ as a function of the ratio σχια/σ2ι(Ι,

θα = arctan(CTli0/CT2i0) - π
Because the ratios of the positive generalized singular values satisfy σχια/σ2ι(Ι the row mode GSVD angular distances satisfy θα€ [— π π The maximum (or minimum) angular distance, i.e., θα = π which corresponds to σχια/σ2ι(Ι >> 1 (or— vr which corresponds to σχια/σ2ι(Ι << 1), indicates that the row basis vector of Eq. (2), which corresponds to the column basis vectors u ^a in D\ and «2i(I in D'2, is exclusive to D\ (or !¾)· An angular distance of θα = 0, which corresponds to σχια/σ2ια = 1, indicates a row basis vector which is of equal significance in, i.e., common to both D and D'2-
Thus, while the ratio σχια/σ2ια indicates the significance of u ^a in D relative to the significance of «2i(I in I¾, this relative significance is defined, as previously described [12, 13], by the angular distance θα, a function of the ratio σχια/σ2ια, which is antisymmetric in D and !¾· Note also that while other functions of the ratio σχια/σ2ια exist that are and 7¾, the angular distance θα, which is a function of the arctangent of the ratio, i.
 is the natural function to use, because the GSVD is related to the cosine-sine (CS) decomposition, as previously described [9], and, thus, σχια and σ2,α are related to the sine and the cosine functions of the angle θα, respectively.
Theorem 1. The tensor GSVD angular distance equals the row mode GSVD angular distance, i.e., Oabc =
Proof. The unfolding of T>i of Eq. (1) into 7¾ of Eq. (2) unfolds the core tensors TZi of Eq. (1) into matrices i¾, which preserve the row dimensions, i.e., the L -column bases dimensions of TZi, and gives
Rt = Y,tVT{V-T ® V~T), * = 1, 2,
where ® denotes a Kronecker product. Because ∑j are positive diagonal matrices, it follows that Tli,abc/Tl2,abc = ¾α/¾α = σι,α/σ2,α· Substituting this in Eq. gives Oabc = θα . Note that the proof holds for tensors of higher-than-third order. □
From this it follows that the tensor GSVD angular distance |θα6ε | < vr and that, therefore, the ratio of not necessarily
 , respectively, and that Oabc = 0 indicates a subtensor common to both.
Note that since the generalized singular values are arranged in∑j of Eq. (2) in a decreasing order of the row mode GSVD angular distances θα, the most tumor-exclusive tumor subtensors, i.e., <Si (a, b, c)
where a maximizes θα of Eq. (5), correspond to a = 1, whereas the most normal-exclusive normal sub- tensors, i.e., S' {a, b, c) where a minimizes θα, correspond to a = LM.
Discovery and Validation of CNAs Predicting OV Survival.
We compute the tensor GSVD of the tumor and normal discovery datasets for each chromosome arm and each combination of two chromosome arms, separately (SI Mathematica Notebook). For each arm or arms we examine the most significant subtensor in the tumor dataset, i.e., <Si (a, b, c), where a, 6, and c maximize Vi,abc of Eq. (4).
We, first, require the subtensor to be tumor-exclusive and platform-consistent: include the tumor arraylet u ^a that is the most exclusive to the tumor dataset, i.e., «ι,ι , as well as a ¾ -probelet Vy C of consistent, i.e., approximately equal copy numbers in both platforms. Second, we require the subtensor to be correlated with an OV patient's prognosis in the discovery set of patients, i.e., include an i-probelet wjb that classifies the discovery set of patients into two groups of high (>0.5 standardized median absolute deviation, i.e., sMAD, from the median) and low coefficients, of significantly (log-rank test P- value <0.05) and robustly (throughout the range of ±0.1 sMAD around the cutoff) different prognoses (Fig. 2). Third, we require the subtensor to be correlated with prognosis in the validation set of patients, i.e., include an arraylet that classifies the validation set of patients into two groups of high and low Spearman's rank correlation coefficients of significantly different prognoses, consistent with the i-probelet's classification of the discovery set of patients (Fig. 3, and Sec. 1.3 in SI Appendix). Note that the validation set includes 148 TCGA patients, mutually exclusive of the discovery set, with primary OV tumor profiles measured by at least one of the two DNA microarray platforms that were used to measure the discovery datasets (S2 Dataset).
We find that each of the tensor GSVDs of only the chromosome arms 7p and Xq, and only the combination of the two chromosome arms 6p+12p (but not 6p nor 12p separately), uncovers a pattern of tumor-exclusive and platform-consistent co-occurring CNAs that is correlated with an OV patient's prognosis in the discovery and, separately, validation set of patients.
Biological Results
Independent Chromosome Arm-Wide Predictors of OV Survival and Response to Platinum-Based Chemotherapy.
To date, the best predictor of OV survival has remained the tumor's stage at diagnosis [31] (Sec. 2.1, and Figs. D and E in SI Appendix). Additional indicators, such as the residual disease after surgery, the outcome of subsequent therapy, and the neoplasm status, which is the last known status of the disease, are determined during treatment. No diagnostic exists that distinguishes between platinum- based chemotherapy-resistant and -sensitive tumors before the treatment [32, 33] .
We find and validate, by using survival analyses of the discovery and, separately, validation set of patients, as well as only the 88% and 95% platinum-based chemotherapy patients in the discovery and validation sets, respectively (Fig. F in SI Appendix), that each of the patterns, across 6p+12, 7p, and Xq, is correlated with an OV patient's prognosis and response to platinum-based chemotherapy, is independent of stage, and together with stage makes a better predictor than stage alone.
We also find and validate that each of these three tensor GSVDs is independent of each of the additional standard indicators (Tables A and B in SI Appendix). For example, survival analyses of the discovery set classified by the 6p+12p tensor GSVD into high and low i-probelet coefficients, and by pathology at diagnosis into tumor stages I-II and III-IV, give the bivariate Cox hazard ratios of 1.5 and 4.0, which are similar to the corresponding univariate ratios of 1.7 and 4.4, respectively [18] . Similarly,
Figure 2. Tumor-exclusive and platform-consistent DNA copy-number alterations (CNAs) correlated with ovarian serous cystadenocarcinoma (OV) patients' survival, (a) Plot of the first 6p+12p tumor arraylet describes a pattern of tumor-exclusive and platform-consistent co-occurring CNAs across the combination of the two chromosome arms 6p+12p. The probes are ordered, and their copy numbers are colored according to each probe's chromosomal band location. Segments (black lines) amplified and deleted include most known OV-associated CNAs that map to 6p+12p (black), including an amplification of KRAS and a deletion of PRIM2. CNAs previously unrecognized in OV (red) include a deletion of the p38-encoding MAPK14, and p21-encoding CDKNlA, and an amplification of RAD51AP1, a deletion of TNF, and focal amplifications of ASUN, ITPR2, and the 5' ends of isoforms a and e, and exons 5 and 6 of SOX5. A high 6p+12p arraylet correlation is significantly correlated with a patient's shorter survival time. ( 6) Plot of the first 6p+12p i-probelet describes the classification of the discovery set of patients into two groups of high (blue) and low (red) coefficients. A high 6p+12p ίΕ-probelet coefficient is significantly and robustly correlated with a patient's shorter survival time, (c) Raster display of the 6p+12p tumor profiles, where medians of the profiles of the same patient measured by the two platforms were taken, with relative gain (red), no change (black), and loss (green) of DNA copy numbers, (d) Plot of the first 7p tumor arraylet describes a pattern of CNAs across the chromosome arm 7p. CNAs previously unrecognized in OV (red) include a focal deletion of RPA3 and an amplification of POLD2. A high 7p arraylet correlation is significantly correlated with a patient's longer survival time. ( e) Plot of the first 7p i-probelet describes the classification of the discovery set of patients into two groups of high (red) and low (blue) coefficients. A high 7p i-probelet coefficient is significantly and robustly correlated with a patient's longer survival time. (/) Raster display of the 7p tumor profiles, (g) Plot of the first Xq tumor arraylet. CNAs previously unrecognized in OV (red) include a focal deletion of PABPC5 and an amplification of BCAP31. A high Xq arraylet correlation is significantly correlated with a patient's longer survival time, (h) Plot of the first Xq i-probelet describes the classification of the discovery set of patients into two groups of high (red) and low (blue) coefficients. A high Xq i-probelet coefficient is significantly and robustly correlated with a patient's longer survival time, ( i ) Raster display of the Xq tumor profiles. survival analyses of the validation set classified by the 6p+12p tensor GSVD into high and low arraylet correlation coefficients, and by pathology at diagnosis into tumor stages III and IV, give the bivariate Cox hazard ratios of 1.9 and 1.8, which are the same as the corresponding univariate ratios (Fig. G in SI Appendix). This means that the 6p+12p tensor GSVD and stage are independent predictors of survival. Therefore, combined with any one of the standard indicators, each of the three tensor GSVDs makes a better predictor than the standard indicator alone (Figs. H and I in SI Appendix). For example, the Kaplan-Meier (KM) median survival time difference of 61 months among the discovery set of patients classified by both the 6p+12p tensor GSVD and stage, is about 85% and more than two years greater than the 33 month difference between the patients classified by stage alone [19] . The KM median survival difference of 34 months among the validation set of patients classified by both the 6p+12p tensor GSVD and stage, is about 62% and more than one year greater than the 21 month difference between the patients classified by stage alone.
Note that while the discovery set of patients reflects the general OV patient population, with approximately 5%, 7%, 76%, and 12% of the patients diagnosed at stages I, II, III, and IV, respectively, the validation set reflects the high-stage OV patient population, with approximately 20% and 80% of the patients diagnosed at stages III and IV, respectively. The 6p+12p, 7p, and Xq tensor GSVDs, therefore, predict survival both in the general as well as in the high-stage OV patient population. Note also that the discovery and validation sets each include mostly, i.e., >95% high-grade, i.e., grades 2 and higher tumors. Tumor grade does not correlate with survival in either the discovery or the validation set of patients.
Figure 3. Survival analyses of the discovery and validation sets of patients classified by tensor GSVD, or tensor GSVD and tumor stage at diagnosis, (a) Kaplan-Meier (KM) curves of the discovery set of 249 patients classified by the 6p+ 12p -probelet coefficient, show a median survival time difference of 11 months, with the corresponding log-rank test P-value < 10- 2. The univariate Cox proportional hazard ratio is 1.7. ( 6) Survival analyses of the 249 patients classified by the 7p -probelet coefficient, ( c) The 249 patients classified by the Xq -probelet coefficient, (d) The 249 patients classified by both the 6p+12p tensor GSVD and tumor stage at diagnosis, show the bivariate Cox hazard ratios of 1.5 and 4.0, which do not differ significantly from the corresponding univariate hazard ratios of 1.7 and 4.4, respectively. This means that the 6p+12p tensor GSVD is independent of stage, the best predictor of OV survival to date. The 61 months KM median survival time difference is about 85% and more than two years greater than the 33 month difference between the patients classified by stage alone. This means that the tensor GSVD and stage combined make a better predictor than stage alone, The 249 patients classified by both the 7p tensor GSVD and stage. (/) The 249 patients classified by both the Xq tensor GSVD and stage, (g) KM curves of the validation set of 148 stage III-IV patients classified by the 6p+12p arraylet correlation, show a median survival time difference of 22 months, with the corresponding log-rank test P-value < 10- 2 , and the univariate Cox proportional hazard ratio 1.9. This validates the survival analyses of the discovery set of 249 patients, (h) Survival analyses of the 148 patients classified by the 7p arraylet correlation, The 148 patients classified by the Xq arraylet correlation.
Survival analyses of only the >95% patients with high-grade tumors in the discovery and, separately, validation set give qualitatively the same and quantitatively similar results to those of the analyses of 100% of the patients in each set, respectively. The 6p+ 12p, 7p, and Xq tensor GSVDs, therefore, predict survival in the high-grade OV patient population, and are independent of the OV tumor's grade as well as the molecular distinctions between high- and low-grade OV tumors [30] .
We observe three groups of significantly different prognoses among the discovery and, separately, validation set of patients, as well as only the platinum-based chemotherapy patients, classified by a combination of the three, i.e., 6p+ 12p, 7p, and Xq, tensor GSVD classifications, each of which is binomial (Fig. 4) . In group A, a combination of a low 6p+ 12p -probelet coefficient or arraylet correlation, and high 7p and Xq -probelet coefficients or arraylet correlations is indicative of a patient's significantly longer survival time and better response to platinum-based chemotherapy. In group B, the three combinations where just one of the three binomial classifications differs from that of group A, indicate shorter survival time and worse response to chemotherapy than those of group A. In group C, the four combinations where at least two of the three binomial classifications differ from that of group A, indicate shorter survival time and worse response to chemotherapy than those of group B as well as group A. For example, the KM median survival times of the discovery set of patients classified into groups A, B, and C are 86, 52, and 36 months, such that the median survival time of group A is more than four years greater than, and more than twice that of group C.
This suggests a possible implementation of the 6p+12p, 7p, and Xq patterns in a pathology laboratory test, where a patient's survival and response to platinum-based chemotherapy is predicted based upon the combination of the correlations of the OV tumor's DNA copy-number profile with the 6p+ 12p, 7p, and Xq patterns.
Figure 4. Survival analyses of the discovery and validation sets of patients, as well as only the platinum-based chemotherapy patients in the discovery and validation sets, classified by the 6p+12p, 7p, and Xq tensor GSVD combined, (a) KM curves of the discovery set of 249 patients classified by combination of the 6p+12p, 7p, and Xq i-probelet coefficients, show median survival times of 86, 52, and 36 months for the groups A, B, and C, respectively, with the corresponding log-rank test P-value < 10-3. (6) KM survival analysis of only the 218, i.e., ~88% platinum-based chemotherapy patients in the discovery set, classified by combination of the three tensor GSVDs, gives qualitatively the same and quantitatively similar results to those of the analyses of 100% of the patients. This means that the combination of the three tensor GSVDs predicts survival in the platinum-based chemotherapy patient population, (c) KM curves of the validation set of 148 stage III-IV patients classified by combination of the 6p+12p, 7p, and Xq arraylet correlation coefficients, show median survival times of 72, 57, and 33 months for the groups A, B, and C, respectively, with the corresponding log-rank test P-value < 10-3. This validates the survival analyses of the discovery set of 249 patients, (d) KM survival analysis of only the 140, i.e., ~95% platinum-based chemotherapy patients in the validation set, classified by combination of the three tensor GSVDs.
Novel Frequent Focal CNAs Indicating Survival.
OV tumors exhibit significant CNA variation among them, much more so than, e.g., GBM brain tumors [2, 13] . Very few frequently occurring OV CNAs have been identified to date.
We find, by using segmentation [20, 21] , that the three tensor GSVD arraylets include most known OV-associated CNAs that map to the corresponding chromosome arms, and several previously unreported yet frequent CNAs in >23% of the patients. For example, the 6p+12p arraylet includes two segments corresponding to the only known OV focal CNAs that map to 6p+12p, 7p, or Xq (Sec. 2.2 in SI Appendix). One, a deletion (6pll.2), overlaps the 3' end unique to isoform a of the DNA primase polypeptide 2- encoding PRIM2 [2] . The other, an amplification (12pl2.l-pll.23), contains several genes, including the Kirsten rat sarcoma viral oncogene homolog KRAS, one of three human Ras genes, and the 5' ends of isoforms b and d of the SRY (sex determining region Y)-box 5-encoding SOX5 [34] , and is significantly (log-rank test P-value <0.05, and KM median survival time difference > 12 months) correlated with OV survival (S3 Dataset).
We also find that the three arraylet patterns include novel frequent focal CNAs (segments <125 probes). Among these, four amplifications and two deletions are significantly correlated with OV survival (Fig. J in SI Appendix). The amplifications flank the segment that contains KRAS. Two consecutive segments (12pl2.1) contain the 5' ends of isoforms a and e of SOX5, and exons 5 and 6, the first exons that are common to isoforms a, b, d, and e of SOX5 [35] . Two other consecutive segments (12pll.23) contain the inositol 1,4,5-trisphosphate receptor type 2-encoding ITPR2, and the asunder spermatogenesis regulator-encoding ASUN. ASUN was discovered in a screen of expressed sequence tags on 12pl l-pl2, which DNA amplification correlated with mRNA overexpression in four human testicular seminomas and one ovarian papillary serous adenocarcinoma cell line, exemplifying human germ cell tumors [36] . ASUN and its homologs are essential for nuclear division after DNA replication in the HeLa human cervical cancer cell line, the frog, and the fly [37] . One deletion (7p22.1-p21.3) contains the replication protein A3-encoding RPA3. The other (Xq21.31) contains the cytoplasmic poly(A)-binding protein 5-encoding PABPC5, and the sequence tag site DXS241 adjacent to translocation breakpoints observed in premature ovarian failure [38] .
Possible Roles in OV Pathogenesis.
We find, by using gene ontology enrichment analyses of the OV tumor mRNA expression profiles of the patients [39, 40] , that differential mRNA expression between the patients, classified by any one of the three tensor GSVDs, is enriched in ontologies corresponding to one of three hallmarks of cancer [41] : cell immortality in 6p+12p, DNA instability in 7p, and cellular immune response suppression in Xq.
The differential mRNA expression of genes from these enriched ontologies that are located on any one of the chromosome arms is consistent with the CNAs across that arm (Fig. K in SI Appendix, and S4 Dataset). Genes that map to amplifications or deletions on any one arraylet pattern, are overexpressed or underexpressed, respectively, in the patients which tumor profiles are classified, by the corresponding tensor GSVD, as highly similar to that pattern, i.e., patients of high i-probelet coefficients or arraylet correlations. The differential expression of all microRNAs and proteins that map to any one of the chromosome arms is also consistent with the CNAs across that arm (Sec. 2.3, and Figs. L and M in SI Appendix, and S5 and S6 Datasets). A coherent picture emerges for each pattern, suggesting roles for the CNAs in OV pathogenesis in addition to personalized diagnosis, prognosis, and treatment.
6p+12p. A cell's transformation and immortality are correlated with a patient's shorter survival. The genes, which are significantly (Mann- Whitney- Wilcoxon P-values <0.05) differentially expressed between the 6p+12p tensor GSVD classes, i.e., in the patient group of high 6p+12p x- probelet coefficient or arraylet correlation, relative to the patient group of low coefficient or correlation, are enriched (hypergeometric P-values <10-3) in the ontologies of cellular response to ionizing radiation (GO:0071479), and major histocompatibility (MHC) protein complex (GO:0042611). Most of the GO:0071479 genes are underexpressed, including the p21 cyclin-dependent kinase inhibitor-encoding CDKNlA, and the p38 mitogen- activated protein kinase-encoding MAPK14, which map to a deletion >45 Mbp on the telomeric part of 6p (6p25.3-p21.1). Also underexpressed is p38, the protein encoded by MAPK14- All GO:0042611 genes, including the tumor necrosis factor-encoding TNF, are underexpressed, and map to the same deletion. The one microRNA that is significantly differentially expressed between the 6p+12p tensor GSVD classes, and maps to the same deletion, is the splicing-dependent microRNA miR-877*, which is encoded by the 13th intron of the ATP- binding cassette subfamily F member 1-encoding gene ABCF1 [44] . Both miR-877* and ABCF1 are consistently underexpressed.
One of only two GO:0071479 overexpressed genes is the RAD51 -associated protein 1-encoding RAD51AP1, which maps to an amplification >9 Mbp on the telomeric part of 12p (12pl3.33-pl3.31) that is significantly correlated with OV survival. All four microRNAs that are differentially expressed between the 6p+12p tensor GSVD classes, and map to the same amplification, miR-200c, miR-200c*, miR-141, and miR-141*, are consistently overexpressed. The second protein that is significantly differentially expressed between the 6p+12p tensor GSVD classes is p27. Consistently, the cyclin-dependent kinase inhibitor CDKN1B, which encodes p27, maps to a 4.5 Mbp amplification (12pl3.2-pl2.3) that is significantly correlated with OV survival, and its mRNA is overexpressed. The mRNA encoded by KRAS is also overexpressed.
Note that while the 6p+12p pattern of CNAs is correlated with survival in the discovery and, separately, validation sets, neither the 6p nor the 12p pattern alone are correlated with survival. Indeed, experiments studying the conditions for the transformation of human normal to tumor cells indicate that cells, where both p21 and p38 are inactive, are susceptible to Ras-mediated transformation [42, 43] . However, the activation of Ras alone induces tumor-suppressing cellular senescence via the activities of either p21 or p38. The 6p+12p pattern, therefore, which includes the loss of the p21-encoding CDKNlA and the p38-encoding MAPK14 on 6p, and the gain of KRAS on 12p, encodes for cellular conditions that combined but not separately can lead to transformation.
In addition, p21 and p38 are necessary for p53- mediated cell cycle arrest [45] and apoptosis [46] , respectively, in response to DNA damage. Overexpression of the p21-encoding CDKNlA is correlated with a low malignant potential of an ovarian tumor [47] . RAD51AP1 overexpression disrupts cell cycle
arrest and apoptosis, can lead to cellular resistance to DNA-damaging cancer therapies, such as platinum- based chemotherapy, and may increase DNA instability [48] . TNF- induced apoptosis is correlated with downregulation of ITPR2 [49] . Overexpression of miR-200c, and miR-141, both of which putatively target the BRCAl associated protein-1 oncosuppressor-encoding BAP1, is correlated with OV tumor growth, dedifferentiation, and invasiveness [50, 51] . Overexpression of the CDKNIB-encoded p27, which can promote cellular migration [52] and even proliferation [53] , is correlated with a poor OV patient's prognosis [54, 55] .
Taken together, previously unrecognized co-occurring deletion of CDKNlA and MAPK14 on 6p and amplification of KRAS on 12p, which encode for human cell transformation, together with deletion of TNF on 6p, and amplification of RAD51AP1 and ITPR2 on 12p, are correlated with a suppression of cell cycle arrest, senescence, and apoptosis, i.e., a tumor cell's immortality, and a patient's shorter survival time. Note that there already exist drugs that interact with CDKNlA, MAPK14, and RAD51AP1, even though these genes were not recognized previously as targets for OV drug therapy [56] .
7p. A cell's DNA stability is correlated with a longer survival. The genes that are significantly differentially expressed between the 7p tensor GSVD classes are enriched (hypergeometric P- value <10-10) in the ontology of DNA strand elongation involved in DNA replication (GO:0006271). Most of these genes are overexpressed, including the DNA polymerase delta subunit 2-encoding POLD2 that is essential for DNA replication and repair, which maps to an amplification >17 Mbp on the centromeric part of 7p (7pl4.1-pll.2). Only two genes are underexpressed: RPA3 on 7p and the DNA ligase IV- encoding LIG4 on 13q. The interaction of p53 with the RPAS-encoded protein mediates suppression of homologous recombination (HR), the preferred cellular mechanism for DNA double-strand break (DSB) repair during replication [57] . LIG4 is essential for DSB repair via the more error-prone nonhomologous end joining pathway [58] . HR defects are thought to facilitate the significant CNA heterogeneity among OV tumors [2] .
Taken together, previously unrecognized co-occurring deletion and underexpression of RPA3, and amplification and overexpression of POLD2 on 7p are correlated with DNA DSB repair via HR during replication, i.e., DNA stability, and a longer survival time.
Xq. Cellular immune response is correlated with a longer survival. The genes that are differentially expressed between the Xq tensor GSVD classes are enriched (hypergeometric P-value <10-6) in the ontology of antigen processing and presentation of peptide antigen (GO:0048002). Most of these genes are overexpressed, including the B-cell receptor-associated protein 31-encoding BCAP31, which maps to an amplification >11 Mbp on the telomeric part of Xq (Xq27.3-q28). All three microRNAs that are differentially expressed between the Xq tensor GSVD classes, and map to the same amplification, miR-888, miR-224, and miR-452, together with the gamma-aminobutyric acid (GABA) A receptor epsilon-encoding GABRE, which hosts mir-224 and mir-452 in its introns, are consistently overexpressed. Underexpression of miR-224 was implicated in OV pathogenesis [50] . PABPC5, which maps to a focal deletion on Xq, is suppressed upon viral infection [59] .
Taken together, previously unrecognized co-occurring deletion of PABPC5, and amplification and overexpression of BCAP31 on Xq are correlated with a cellular immune response, and a longer survival time.
Discussion
We defined a novel tensor GSVD, an exact simultaneous decomposition of two datasets, arranged in two higher-than-second-order tensors of matched column dimensions but independent row dimensions. We showed that the mathematical properties of the tensor GSVD allow interpreting its variables and operations in terms of the similar as well as dissimilar, e.g., biomedical reality between the datasets. We
demonstrated the tensor GSVD in comparative modeling of patient- and platform-matched but probe- independent OV tumor and normal DNA copy-number profiles from TCGA. The modeling resulted in new insights into the poorly understood relations between an OV tumor's genome and a patient's survival phenotype. Three previously unrecognized chromosome arm-wide patterns of tumor-exclusive and platform-consistent co-occurring alterations were uncovered, across 6p+12p, 7p, and Xq, that are correlated with an OV patient's survival and response to platinum-based chemotherapy, and are of possible roles in OV pathogenesis, and of a possible implementation in a pathology laboratory test for personalized OV diagnosis, prognosis, and treatment.
Note that unlike previous analyses of the TCGA OV DNA copy- number data, notably by TCGA [2] , our analyses were not limited to the 22 human autosomal chromosomes, and include the X chromosome. This is because the tensor GSVD, like the GSVD, comparatively - based upon the structure of the data - separates the matched datasets into uncorrelated, i.e., orthogonal patterns across the tumor and normal probes. Patterns of copy-number variation across the tumor probes that occur in the normal human genome, and are common to the tumor and normal datasets, such as the female-specific X chromosome amplification, are orthogonal to, and, therefore, are separated from the patterns that are exclusive to the tumor dataset. For example, the GSVD comparative modeling of patient-matched GBM tumor and normal copy-number profiles separated the prognosis-correlated GBM tumor-exclusive pattern from the female-specific X chromosome amplification as well as from experimental artifacts (or batch effects) due to experimental variations in, e.g., tissue batch, genomic center, hybridization date, and scanner, without a-priori knowledge of these variations.
Unlike recent approaches to the integrative modeling of different types of large-scale molecular biological profiles from the same set of patients, notably clustering [60, 61] , our comparative modeling was not limited to tumor profiles, and included also patient- and platform-matched normal DNA copy-number profiles. This is because the tensor GSVD, like the GSVD, finds not just the similarities but, at the same time also the dissimilarities among the profiles without making any assumptions, except for the structure of the data: two third-order tensors, of matched columns that correspond to the same sets of patients and platforms, and independent rows that correspond to the probes in either the tumor or the normal dataset. The patients, platforms, tumor and normal probes as well as the tissue types, each represent a degree of freedom. Unfolded into two matrices or appended into a single tensor (or even unfolded and appended into a single matrix), some of the degrees of freedom are lost and much of the information in the datasets might also be lost. For example, SVD of the GBM tumor and normal profiles appended into a single matrix, while it is related to the GSVD of the data, would not separate the tumor dataset into patterns across the tumor probes that are orthogonal.
Additional possible applications of the tensor GSVD in personalized medicine include comparative modeling of two patient- and tissue-matched datasets, each corresponding to (i) a set of large-scale molecular biological profiles, e.g., DNA copy numbers, acquired by a high-throughput technology, e.g., DNA microarrays; (ii) a set of biomedical images or signals; or (in) a set of cellular pathological observations, e.g., a tumor's stage. Such tensor GSVD comparative models can uncover variations across the patients and tissues that are common to, possibly causally coordinated between the two aspects of the disease. In clinical settings, such tensor GSVD comparative models can determine an individual patient's medical status in relation to all the other patients in a set, and inform the patient's diagnosis, prognosis and treatment.
Acknowledgements
We thank RA Horn for thoughtful discussions of matrix analysis in general, and the tensor GSVD in particular. We thank DDL Bowtell and MM Janat-Amsbury for useful notes on OV in general, and the molecular distinctions between high- and low-grade OV tumors in particular. We also thank RA Weinberg for helpful comments on the hallmarks of cancer in general, and the transformation of human
normal to tumor cells in particular.
References
1. Cancer Genome Atlas Research Network. Comprehensive genomic characterization defines human glioblastoma genes and core pathways. Nature. 2008;455: 1061-1068.
2. Cancer Genome Atlas Research Network. Integrated genomic analyses of ovarian carcinoma. Nature. 2011;474: 609-615.
3. Ponnapalli SP, Golub GH, Alter O. A novel higher-order generalized singular value decomposition for comparative analysis of multiple genome-scale datasets. Stanford University and Yahoo! Research Workshop on Algorithms for Modern Massive Datasets (MMDS) (Stanford, CA); 2006 June 21-24.
4. Ponnapalli SP, Saunders MA, Van Loan CF, Alter O. A higher-order generalized singular value decomposition for comparison of global mRNA expression from multiple organisms. PLoS One. 2011;6: e28072.
5. Golub GH, Van Loan CF. Matrix Computations. 4th ed. Baltimore, MD: Johns Hopkins University Press; 2012.
6. Horn RA, Johnson CR. Matrix Analysis. 2nd ed. Cambridge, UK: Cambridge University Press;
2012.
7. Van Loan CF. Generalizing the singular value decomposition. SIAM J Numer Anal. 1976;13:
76-83.
8. Paige CC, Saunders MA. Towards a generalized singular value decomposition. SIAM J Numer Anal. 1981;18: 398-405.
9. Van Loan CF. Computing the CS and the generalized singular value decompositions. Numer Math.
1985;46: 479-491.
10. Bai Z, Demmel JW. Computing the generalized singular value decomposition. SIAM J Sci Comput.
1993;14: 1464-1486.
11. Friedland S. A new approach to generalized singular value decomposition. SIAM J Matrix Anal Appl. 2005;27: 434-444.
12. Alter O, Brown PO, Botstein D. Generalized singular value decomposition for comparative analysis of genome-scale expression data sets of two different organisms. Proc Natl Acad Sci USA. 2003;100: 3351-3356.
13. Lee CH, Alpert BO, Sankaranarayanan P, Alter O. GSVD comparison of patient-matched normal and tumor aCGH profiles reveals global copy-number alterations predicting glioblastoma multiforme survival. PLoS One. 2012;7: e30098.
14. Wiltshire RN, Rasheed BK, Friedman HS, Friedman AH, Bigner SH. Comparative genetic patterns of glioblastoma multiforme: potential diagnostic tool for tumor classification. Neuro Oncol. 2000;2: 164-173.
15. Misra A, Pellarin M, Nigro J, Smirnov I, Moore D, Lamborn KR, et al. Array comparative genomic hybridization identifies genetic subgroups in grade 4 human astrocytoma. Clin Cancer Res. 2005;11: 2907-2918.
Curran WJ Jr, Scott CB, Horton J, Nelson JS, Weinstein AS, Fisclibacli AJ, et al. Recursive partitioning analysis of prognostic factors in three Radiation Therapy Oncology Group malignant glioma trials. J Natl Cancer Inst. 1993;85: 704-710.
Gorlia T, van den Bent MJ, Hegi ME, Mirimanoff RO, Weller M, Cairncross JG, et al. Nomograms for predicting survival of patients with newly diagnosed glioblastoma: prognostic factor analysis of EORTC and NCIC trial 26981-22981/CE.3. Lancet Oncol. 2008;9: 29-38.
Cox DR. Regression models and life-tables. J Roy Statist Soc B. 1972;34: 187-220.
Kaplan EL, Meier P. Nonparametric estimation from incomplete observations. J Amer Statist Assn. 1958;53: 457-481.
Kent WJ, Sugnet CW, Furey TS, Roskin KM, Pringle TH, Zahler AM, et al. The human genome browser at UCSC. Genome Res. 2002;12: 996-1006.
Olshen AB, Venkatraman ES, Lucito R, Wigler M. Circular binary segmentation for the analysis of array-based DNA copy number data. Biostatistics. 2004;5: 557-572.
Hopkins AL, Groom CR. The druggable genome. Nat Rev Drug Discov. 2002; 1: 727-730.
Sillje HH, Takahashi K, Tanaka K, Van Houwe G, Nigg EA. Mammalian homologues of the plant Tousled gene code for cell-cycle-regulated kinases with maximal activities linked to ongoing DNA replication. EMBO J. 1999;18: 5691-5702.
Pellegrini M, Cheng JC, Voutila J, Judelson D, Taylor J, Nelson SF, et al. Expression profile of CREB knockdown in myeloid leukemia cells. BMC Cancer. 2008;8: 264.
De Lathauwer L, De Moor B, Vandewalle J. A multilinear singular value decomposition. SIAM J Matrix Anal Appl. 2000;21: 1253-1278.
Omberg L, Golub GH, Alter O. A tensor higher-order singular value decomposition for integrative analysis of DNA microarray data from different studies. Proc Natl Acad Sci USA. 2007; 104: 18371-18376.
Omberg L, Meyerson JR, Kobayashi K, Drury LS, Diffley JFX, Alter O. Global effects of DNA replication and DNA replication origin activity on eukaryotic gene expression. Mol Syst Biol. 2009;5: 312.
Kolda TG, Bader BW. Tensor decompositions and applications. SIAM Rev. 2009;51: 455-500. Vandewalle J, De Lathauwer L, Comon P. The generalized higher order singular value decomposition and the oriented signal-to-signal ratios of pairs of signal tensors and their use in signal processing. In: Proc ECCTD'03 - European Conf on Circuit Theory and Design; 2003. pp. 1-389- 1-392.
Ayhan A, Kurman RJ, Yemelyanova A, Vang R, Logani S, Seidman JD, et al. Defining the cut point between low-grade and high-grade ovarian serous carcinomas: a clinicopathologic and molecular genetic analysis. Am J Surg Pathol. 2009;33: 1220-1224.
Prisco MG, Zannoni GF, De Stefano I, Vellone VG, Tortorella L, Fagotti A, et al. Prognostic role of metastasis tumor antigen 1 in patients with ovarian cancer: a clinical study. Hum Pathol. 2012;43: 282-288.
Harries M, Gore M. Chemotherapy for epithelial ovarian cancer— treatment at first diagnosis. Lancet Oncol. 2002;3: 529-536.
Pujade-Lauraine E, Hilpert F, Weber B, Reuss A, Poveda A, Kristensen G, et al. Bevacizumab combined with chemotherapy for platinum-resistant recurrent ovarian cancer: The AURELIA open- label randomized phase III trial. J Clin Oncol. 2014;32: 1302-1308.
Engler DA, Gupta S, Growdon WB, Drapkin RI, Nitta M, Sergent PA, et al. Genome wide DNA copy number analysis of serous type ovarian carcinomas identifies genetic markers predictive of clinical outcome. PLoS One. 2012;7: e30996.
Ikeda T, Zhang J, Chano T, Mabuchi A, Fukuda A, Kawaguchi H, et al. Identification and characterization of the human long form of Sox5 (L-SOX5) gene. Gene. 2002;298: 59-68.
Bourdon V, Naef F, Rao PH, Reuter V, Mok SC, Bosl GJ, et al. Genomic and expression analysis of the 12pll-pl2 amplicon using EST arrays identifies two novel amplified and overexpressed genes. Cancer Res. 2002;62: 6218-6223.
Lee LA, Lee E, Anderson MA, Vardy L, Tahinci E, Ali SM, et al. Drosophila genome-scale screen for PAN GU kinase substrates identifies Mat89Bb as a cell cycle regulator. Dev Cell. 2005;8: 435-442.
Blanco P, Sargent CA, Boucher CA, Howell G, Ross M, Affara NA. A novel poly(A)-binding protein gene (PABPC5) maps to an X-specific subinterval in the Xq21.3/Ypll.2 homology block of the human sex chromosomes. Genomics. 2001;74: 1-11.
Ashburner M, Ball CA, Blake JA, Botstein D, Butler H, Cherry JM, et al. Gene ontology: tool for the unification of biology. Nat Genet. 2000;25: 25-29.
Eden E, Navon R, Steinfeld I, Lipson D, Yakhini Z. GOrilla: a tool for discovery and visualization of enriched GO terms in ranked gene lists. BMC Bioinformatics. 2009;10: 48.
Hanahan D, Weinberg RA. Hallmarks of cancer: the next generation. Cell. 2011;144: 646-674. Karnoub AE, Weinberg RA. Ras oncogenes: split personalities. Nat Rev Mol Cell Biol. 2008;9: 517-531.
Hahn WC, Counter CM, Lundberg AS, Beijersbergen RL, Brooks MW, Weinberg RA. Creation of human tumour cells with defined genetic elements. Nature. 1999;400: 464-468.
Sibley CR, Seow Y, Saayman S, Dijkstra KK, El Andaloussi, Weinberg MS, et al. The biogenesis and characterization of mammalian microRNAs of mirtron origin. Nucleic Acids Res. 2012;40: 438-448.
Waldman T, Kinzler KW, Vogelstein B. p21 is necessary for the p53-mediated Gi arrest in human cancer cells. Cancer Res. 1995;55: 5187-5190.
Bulavin DV, Saito S, Hollander MC, Sakaguchi K, Anderson CW, Appella E, et al. Phosphorylation of human p53 by p38 kinase coordinates N-terminal phosphorylation and apoptosis in response to UV radiation. EMBO J. 1999; 18: 6845-6854.
Anglesio MS, Arnold JM, George J, Tinker AV, Tothill R, Waddell N, et al. Mutation of ERBB2 provides a novel alternative mechanism for the ubiquitous activation of RAS-MAPK in ovarian serous low malignant potential tumors. Mol Cancer Res. 2008;6: 1678-1690.
Klein HL. The consequences of Rad51 overexpression for normal and tumor cells. DNA Repair. 2008;7: 686-693.
49. Diaz F, Bourguignon LY. Selective down-regulation of IP3 receptor subtypes by caspases and calpain during TNFa-induced apoptosis of human T-lymphoma cells. Cell Calcium. 2000;27: 315- 328.
50. Iorio MV, Visone R, Di Leva G, Donati V, Petrocca F, Casalini P, et al. MicroRNA signatures in human ovarian cancer. Cancer Res. 2007;67: 8699-8707.
51. Yang D, Sun Y, Hu L, Zheng H, Ji P, Pecot CV, et al. Integrated analyses identify a master microRNA regulatory network for the mesenchymal subtype in serous ovarian cancer. Cancer Cell. 2013;23: 186-199.
52. Nagahara H, Vocero-Akbani AM, Snyder EL, Ho A, Latham DC, Lissy NA, et al. Transduction of full-length TAT fusion proteins into mammalian cells: TAT-p27Klpl induces cell migration. Nat Med. 1998;4: 1449-1452.
53. Kwon YH, Jovanovic A, Serfas MS, Tyner AL. The Cdk inhibitor p21 is required for necrosis, but it inhibits apoptosis following toxin-induced liver injury. J Biol Chem. 2003;278: 30348-30355.
54. Chu IM, Hengst L, Slingerland JM. The Cdk inhibitor p27 in human cancer: prognostic potential and relevance to anticancer therapy. Nat Rev Cancer. 2008;8: 253-267.
55. Duncan TJ, Al- Attar A, Rolland P, Harper S, Spendlove I, Durrant LG. Cytoplasmic p27 expression is an independent prognostic factor in ovarian cancer. Int J Gynecol Pathol. 2010;29: 8-18.
56. Ahmed J, Meinel T, Dunkel M, Murgueitio MS, Adams R, Blasse C, et al. CancerResource: a comprehensive database of cancer-relevant proteins and compound interactions supported by experimental knowledge. Nucleic Acids Res. 2011;39: D960-D967.
57. Romanova LY, Willers H, Blagosklonny MV, Powell SN. The interaction of p53 with replication protein A mediates suppression of homologous recombination. Oncogene. 2004;23: 9025-9033.
58. Moynahan ME, Jasin M. Mitotic homologous recombination maintains genomic stability and suppresses tumorigenesis. Nat Rev Mol Cell Biol. 2010;11: 196-207.
59. Kumar GR, Shum L, Glaunsinger BA. Importin a-mediated nuclear import of cytoplasmic poly(A) binding protein occurs as a direct consequence of cytoplasmic mRNA depletion. Mol Cell Biol. 2011;31: 3113-3125.
60. Shen R, Olshen AB, Ladanyi M. Integrative clustering of multiple genomic data types using a joint latent variable model with application to breast and lung cancer subtype analysis. Bioinformatics. 2009;25: 2906-2912.
61. Mo Q, Wang S, Seshan VE, Olshen AB, Schultz N, Sander C, et al. Pattern discovery and cancer gene identification in integrated cancer genomic data. Proc Natl Acad Sci USA. 2013;110: 4245- 4250.
Supporting Information
SI Appendix. A PDF format file, readable by Adobe Acrobat Reader.
(PDF)
SI Mathematica Notebook. Tensor GSVD of patient- and platform-matched tumor and normal genomic profiles. A PDF format file, readable by Adobe Acrobat Reader. The corresponding
Mathematica 9.0.1 code file, executable by Matliematica and readable by Matliematica Player, is available at litt p : / /www . alt erlab. org/O V_prognosis / .
(PDF)
51 Dataset. Discovery Set of Patients. A tab-delimited text format file, readable by both Mathematica and Microsoft Excel, reproducing TCGA annotations of the discovery set of 249 patients. The tumor and normal profiles of the discovery set of patients measured by each of the two DNA microarray platforms, tabulating relative copy- number variation across the 6p+12p, 7p, and Xq tumor and normal probes, are available in tab-delimited text format files at http://www.alterlab.org/OV_prognosis/. (PDF)
52 Dataset. Validation Set of Patients. A tab-delimited text format file reproducing TCGA annotations of the validation set of 148 patients. The tumor profiles of the validation set of patients, tabulating relative copy- number variation across the 6p+12p, 7p, and Xq tumor probes, are available in tab-delimited text format files at http://www.alterlab.org/OV_prognosis/.
(TXT)
53 Dataset. First, Most Tumor-Exclusive Tumor Arraylets. A tab-delimited text format file tabulating the segments of the first, most tumor-exclusive tumor arraylets computed by tensor GSVD of the discovery set of patients across 6p+12p, 7p, or Xq.
(TXT)
54 Dataset. Differential mRNA Expression. A tab-delimited text format file tabulating differential expression of 11,457 autosomal and X chromosome mRNAs in the 6p+12p, 7p, and Xq tensor GSVD classes. The mRNA expression profiles of 394 of the 397 patients in the discovery and validation sets are available in tab-delimited text format files at http://www.alterlab.org/OV_prognosis/.
(TXT)
55 Dataset. Differential microRNA Expression. A tab-delimited text format file tabulating differential expression of 639 autosomal and X chromosome microRNAs in the 6p+12p, 7p, and Xq tensor GSVD classes. The microRNA expression profiles of 395 patients are available in tab-delimited text format files at http://www.alterlab.org/OV_prognosis/.
(TXT)
56 Dataset. Differential Protein Expression. A tab-delimited text format file tabulating differential expression of 175 antibodies that probe for 136 autosomal and X chromosome proteins in the 6p+12p, 7p, and Xq tensor GSVD classes. The protein expression profiles of 282 patients are available in tab-delimited text format files at http://www.alterlab.org/OV_prognosis/.
(TXT)
1. Mathematical Method: Tensor GSVD GSVD, therefore, has the same uniqueness properties as the GSVD. Note that the proof holds for tensors of
1.1. Discovery Datasets are Pairs of Column- higher-than-third order. □ Matched but Row-Independent Tensors. The
discovery set of patients reflects the general primary, Corollary A . For two second-order tensors, the tensor high-grade OV patient population, with approximately GSVD reduces to the GSVD of the corresponding matri5%, 7%, 76%, and 12% of the patients diagnosed at ces.
stages I, II, III, and IV, and 218, i.e., ~88%, treated Proof. For two second-order tensors, e.g., the matrices with platinum-based chemotherapy, i.e., cisplatin, car- Di e K* x L, the tensor GSVD of Eq. (1) is boplatin, or oxaliplatin, and 240 of the 249, i.e., >95%
of the tumors at grades 2 and higher. D,
Each profile in the discovery datasets lists log2 of U,R,V , 1, 2. (Al) TCGA level 1 background-subtracted intensity in the
sample relative to the male Promega DNA reference, The row- and ^-column mode GSVDs of Eqs. (2) and with signal to background >2.5 for both the sample and (3) are identical, because unfolding each matrix 7¾ while reference in >90% of the 391,190 autosomal probes and preserving either its Ki-iaw dimension, or

>65% of the 10,911 X chromosome probes that match dimension results in Di, up to permutations of either its between the two Agilent Human array CGH (aCGH) columns or rows, respectively,
DNA microarray platforms, G4447A and G4124A.
Tumor and normal probes were selected with valid D, D, 1, 2. (A2) data in >99% of the tumor or normal arrays of each
platform, respectively. For each chromosome arm or From the uniqueness properties of the tensor GSVD combination of two chromosome arms, and for each of Eq. (Al), and the GSVDs of Eq. (A2) it follows platform, the <0.5% missing data entries in the tumor that Ri = ∑j, and that for two second-order tensors, and normal profiles were estimated by using the SVD, i.e., matrices, the tensor GSVD is equivalent to the as previously described [12] . Each profile was then GSVD. □ centered at its copy-number median, and normalized by
its copy-number sMAD. Theorem A . The tensor GSVD of the tensor V €
RLM x L x M, which row mode unfolding gives the iden¬
1.2. The Tensor GSVD. tity matrix D\ = I€ ]R,LM x LM ; and a tensor T>2 of the
Existence, uniqueness and special cases. same column dimensions reduces to the HOSVD of V2.
Lemma A . The tensor GSVD exists for any two, e.g., Proof. Consider the GSVD of Eq. (2), of the matrices third-order tensors T>i€ E^ xL xM of the same column D = I and Z¾, as computed by using the QR decompodimensions L and M but different row dimensions Ki} sition of the appended D\ and Z¾, and the SVD of the where Kt > LM for i = 1 , 2, if the tensors unfold into full block of the resulting column-wise orthonormal Q that column-rank matrices, 7¾ e ~RK' X L M , Dix e ~RK'M X L , corresponds to D2 , i.e., Q2 = UQ2∑Q2 VQ2 [5] , and Diy€ ,KT L X M , each preserving the Ki-row dimension, L-x-, or M-y- column dimension, respectively. I Qi R R- R
QR
Proof. The tensor GSVD of Eq. (1), of the pair of D2 D2 Q-2 UQ2
third-order tensors T>i, is constructed from the GSVDs (A3) of Eqs. (2) and (3), of the pairs of full column-rank
matrices 7¾, Dix, and Diy, where i = 1, 2. From the where R is upper triangular and, therefore, invertible. existence of the GSVDs of Eqs. (2) and (3) [5, 6] , the Since Q is column-wise orthonormal, VQ2 is orthonormal, orthonormal column bases vectors of Ui, as well as the and∑Q2 is positive diagonal, it follows that normalized x- and ¾ -row bases vectors of the invertible
Vx or Vy , exist, and, therefore, the tensor GSVD of
Eq. (1) also exists. Note that the proof holds for tensors
of higher-than-third order. □

Lemma B. The tensor GSVD has the same uniqueness
properties as the GSVD. (j-¾r (v R) (v R)T,
Proof. From the uniqueness properties of the GSVDs (A4) of Eqs. (2) and (3), the orthonormal column bases
vectors «iia, and the normalized row bases vectors wjb, and that (/ -∑Q2 ) ' ¾ ? is orthonormal. The GSVD and Vy C of the tensor GSVD of Eq. (1) are unique, of Eq. (2) factors the matrix D2 into a column-wise orexcept in degenerate subspaces, defined by subsets thonormal UQ2 , a positive diagonal∑Q2 (/—∑Q2 ) ~ 2 and of equal generalized singular values aix, and aiy, an orthonormal (/—∑Q2) VQ2 R, and isi therefore, rerespectively, and up to phase factors of ±1. The tensor duced to the SVD of Z¾.2
Note that this proof holds for the GSVDs of Eq. (3). SVDs of D'2 , D'2x , or respectively.
This is because the x- and ¾ -column unfoldings of the The tensor GSVD of Eq. (f), where the orthonormal tensor T>i€ ]R,LM x L x M ; which row mode unfolding gives column bases vectors «2 a, and the normalized row bases the identity matrix D = I e ]RLM x LM ; give vectors v x. ,b' and v in the factorization of the tensor
T>2 are computed via the SVDs of the unfolded tensor is, therefore, reduced to the HOS VD of V2 [25-27] . Note
M that the proof holds for tensors of higher-than-third order. □
M(M - 1) Interpretation. The "tensor generalized Shannon entropy" of each dataset,


The GSVDs of Eqs. (2) and (3), of any one of the matrices captured by a single subtensor. An entropy of one correDi , D x , or D y with the corresponding full column-rank sponds to a disordered and random dataset in which all matrices Z¾, D'ix, or are, therefore, reduced to the subtensors are of equal significance.
Fig. A (on p. A-3). The tensor GSVD of the patient- and platform-matched DNA copy-number profiles of the 7p chromosome arm. The tensor GSVD is depicted in a raster display, with relative copy-number gain (red), no change (black), and loss (green), explicitly showing the first through the 5th, and the 245th through the 249th 7p i-probelets, both 7p ¾ -probelets, and the first through the 10th, and the 489th through the 498th 7p tumor and normal arraylets. We prove that the significance of a subtensor in the tumor dataset relative to that of the corresponding subtensor in the normal dataset, i.e., the tensor GSVD angular distance, equals the row mode GSVD angular distance, i.e., the significance of the corresponding tumor arraylet in the tumor dataset relative to that of the normal arraylet in the normal dataset. The tensor GSVD angular distances for the 498 pairs of 7p arraylets are depicted in a bar chart display, where the angular distance corresponding to the first pair of arraylets is ~π/4. For the 7p chromosome arm, we find that the most significant subtensor in the tumor dataset is a combination of (i) the first j -probelet, which is approximately invariant across the platforms, (ii) the first i-probelet, which classifies the discovery set of patients into two groups of high and low coefficients, of significantly and robustly different prognoses, and (in) the first, most tumor-exclusive tumor arraylet, which classifies the validation set of patients into two groups of high and low correlations of significantly different prognoses consistent with the i-probelet's classification of the discovery set.
Fig. B (on p. A-4). The tensor GSVD of the patient- and platform- matched DNA copy- number profiles of the Xq chromosome arm. The tensor GSVD is depicted in a raster display, with relative copy-number gain (red), no change (black), and loss (green), explicitly showing the first through the 5th, and the 245th through the 249th Xq i-probelets, both Xq ¾ -probelets, and the first through the 10th, and the 489th through the 498th Xq tumor and normal arraylets. The tensor GSVD angular distances for the 498 pairs of Xq arraylets are depicted in a bar chart display, where the angular distance corresponding to the first pair of arraylets is ~π/4.
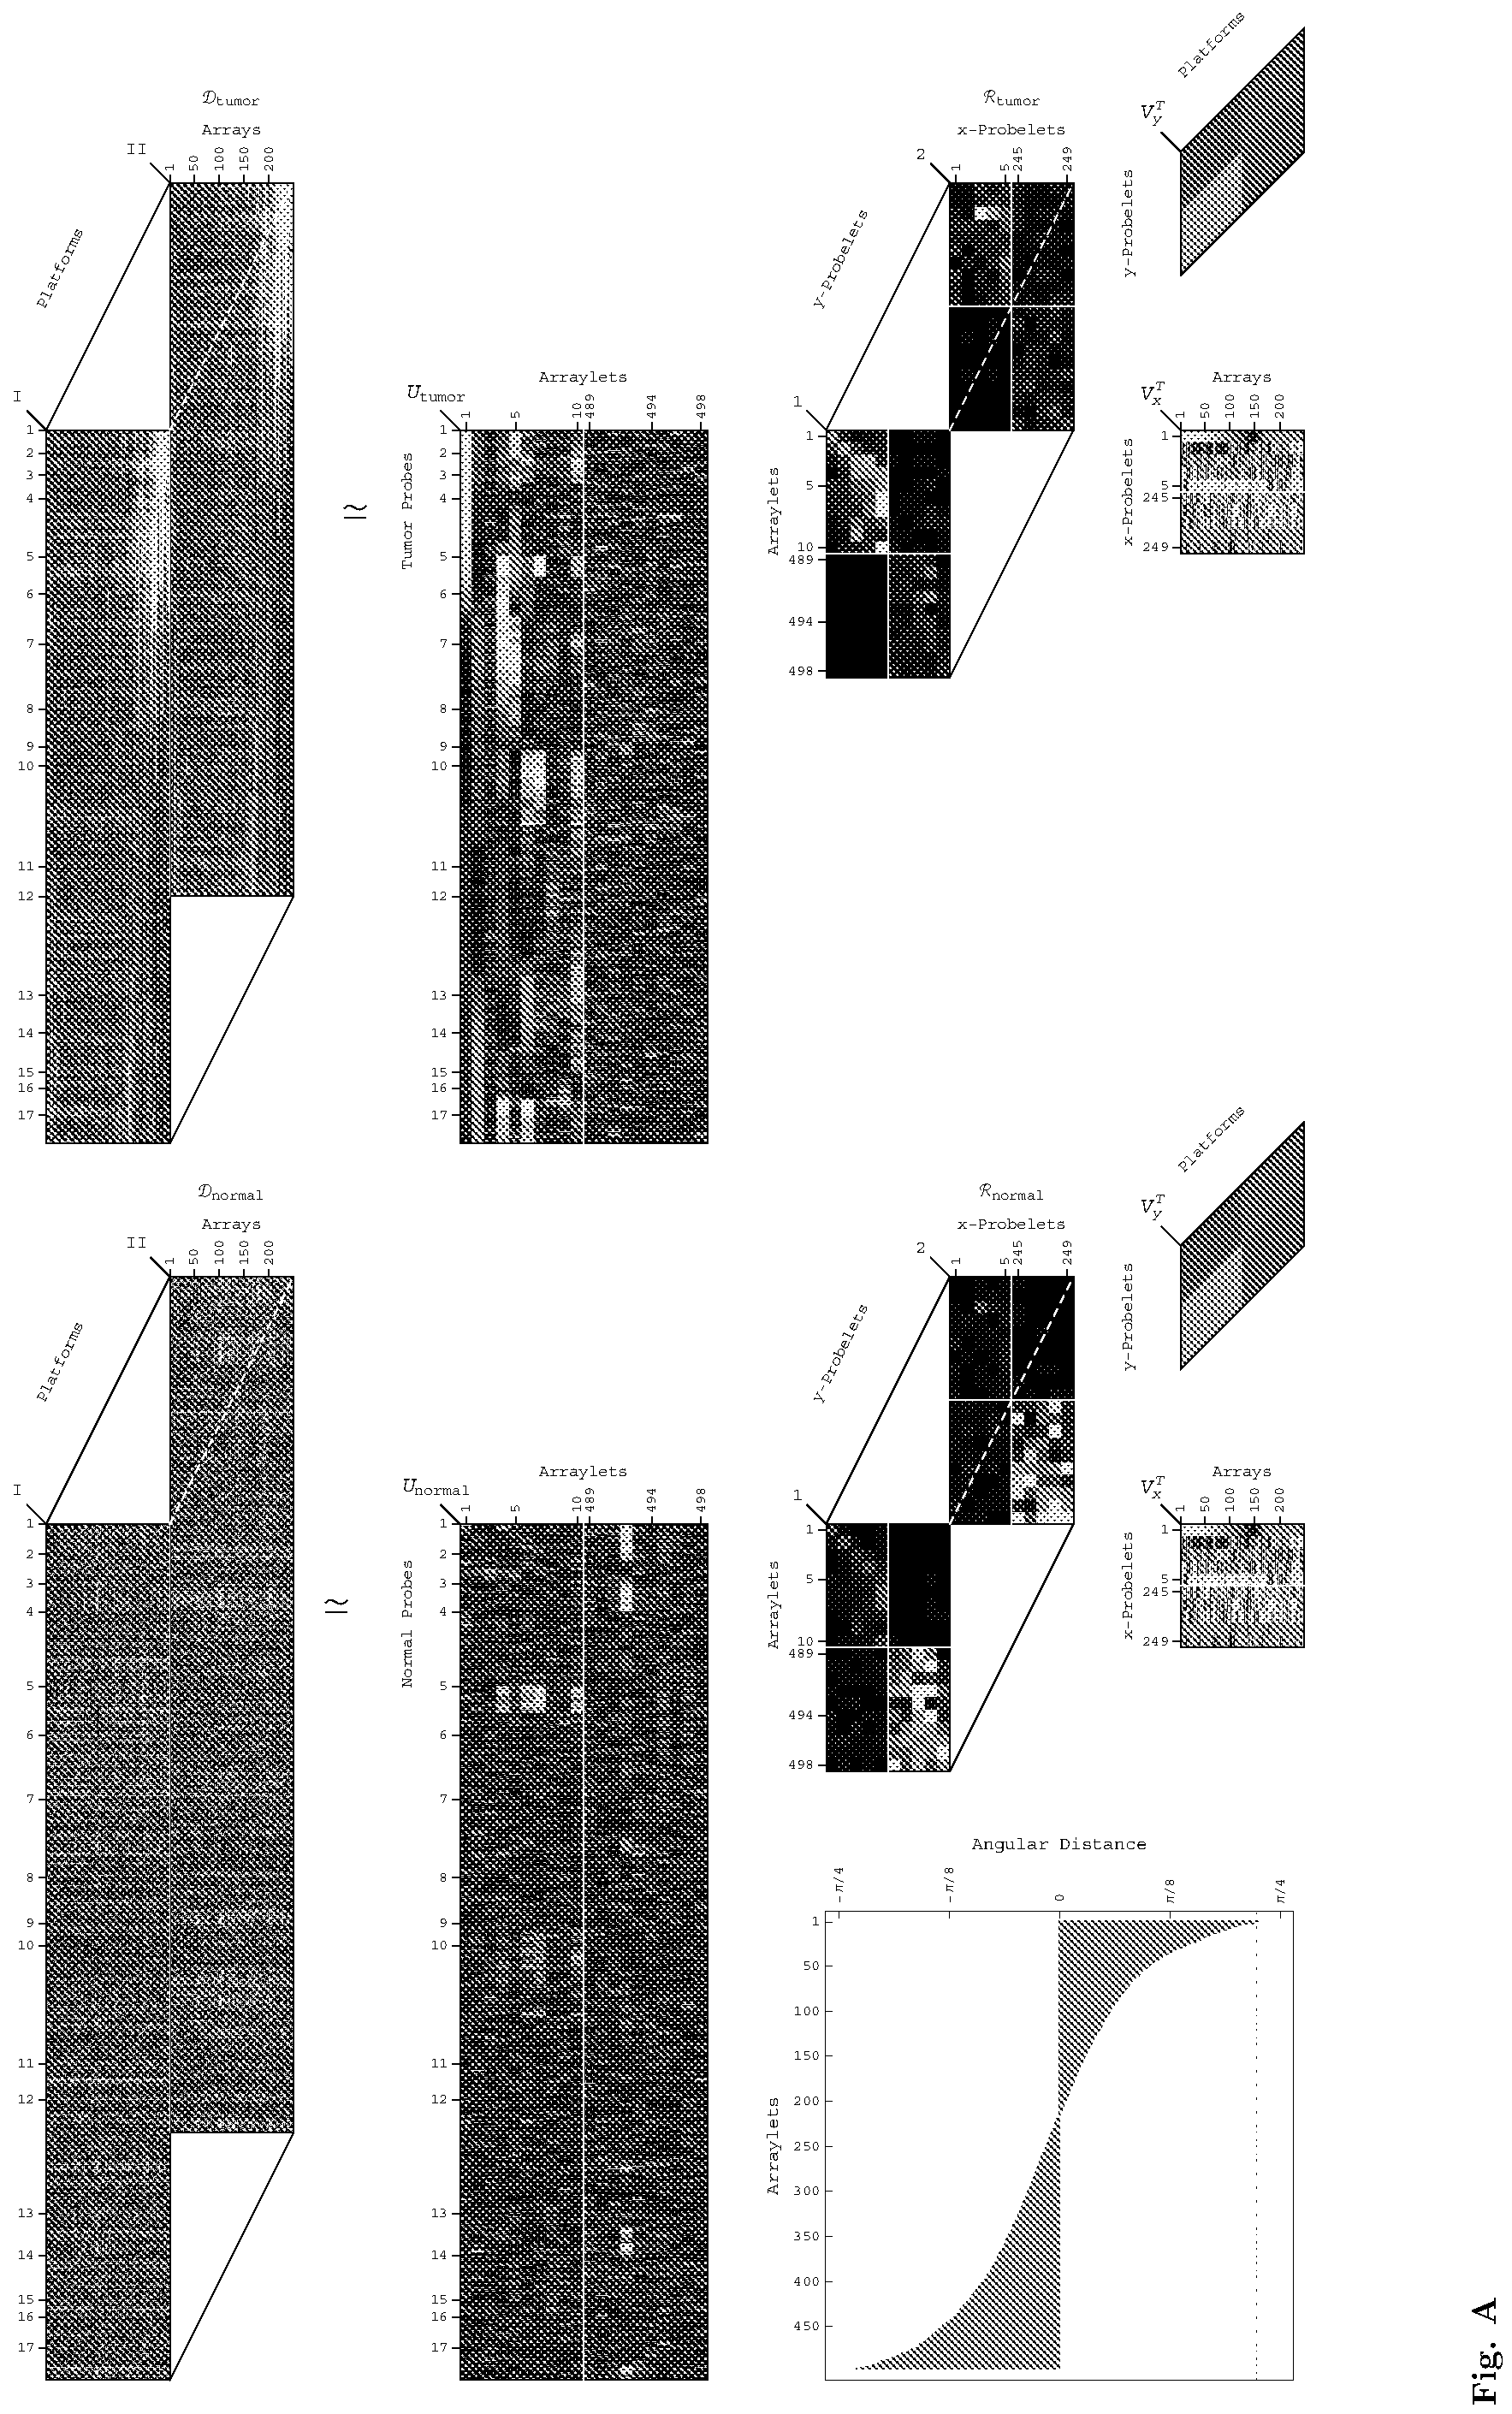

72
Tumor Generalized Fraction Normal Generalized Fraction ( a ) ¾ = 0.48 (b) d2 = 0.G4

( c ) ¾ = 0. G 2 (d) d2 = 0.GG


~95%, were treated with platinum-based chemotherapy, The arraylet correlation cutoff is the i-probelet

Therapy Outcome Neoplasm Status
Hazard Ratio = 3.8 Hazard Ratio =13

Survival Time (Months) Survival Time (Months)
Fig. D. Survival analyses of the discovery set of patients classified by the standard OV indicators. KM curves of the discovery set of 249 patients classified by (a) tumor stage at diagnosis, the best predictor of OV survival to date, ( ¾) residual disease after surgery, i.e., no (No) or some (Yes) macroscopic disease, (c) outcome of subsequent therapy, i.e., complete remission (CR) or not (No), ( d) neoplasm status, i.e., with (W) tumor or without (WO).
Tumor Stage Residual Disease
P-value = 3.8 x lCT2 P-value = 1.4 x lCT2

Therapy Outcome (d) Neoplasm Status

Survival Time (Months) Survival Time (Months)
Fig. E. Survival analyses of the validation set of patients classified by the standard OV indicators. KM curves of the validation set of 148 stage III-IV patients classified by (a) tumor stage at diagnosis, ( 6) residual disease after surgery, i.e., no (No) or some (Yes) macroscopic disease, (c) outcome of subsequent therapy, i.e., complete remission (CR) or not (No), ( d) neoplasm status, i.e., with (W) tumor or without (WO).
Fig. F (on p. A-8). Survival analyses of the platinum- based chemotherapy patients in the discovery and validation sets classified by tensor GSVD, or tensor GSVD and tumor stage at diagnosis.
(a) Kaplan-Meier (KM) curves of only the 218, i.e., ~88% platinum-based chemotherapy patients in the discovery set, classified by the 6p+12p i-probelet coefficient, show a median survival time difference of 14 months, with the corresponding log-rank test P-value < 10-3. The univariate Cox proportional hazard ratio is 2.0. ( 6) Survival analyses of the 218 patients classified by the 7p i-probelet coefficient, (c) The 218 patients classified by the Xq ίΕ-probelet coefficient, ( d) The 218 patients classified by both the 6p+12p tensor GSVD and tumor stage at diagnosis, show the bivariate Cox hazard ratios of 1.8 and 4.1, which do not differ significantly from the corresponding univariate hazard ratios of 2.0 and 4.4, respectively. This means that the 6p+12p tensor GSVD is independent of stage, the best predictor of OV survival to date, ( e) The 218 patients classified by both the 7p tensor GSVD and stage. (/) The 218 patients classified by both the Xq tensor GSVD and stage, (g) KM curves of only the 140, i.e., ~95% platinum-based chemotherapy patients in the validation set, classified by the 6p+12p arraylet correlation, show a median survival time difference of 18 months, with the univariate Cox proportional hazard ratio 1.8. This validates the survival analyses of the 218 chemotherapy patients in the discovery set. (h) Survival analyses of the 148 patients classified by the 7p arraylet correlation, (i ) The 148 patients classified by the Xq arraylet correlation.

Arraylet (Corr.) Arraylet (Corr. Arraylet (Corr.) P-value = 2.5 x lCT2 P-value = 1.9x10 P-value = 3.3x10 Hazard Ratio =1.8 Hazard Ratio = 1. Hazard Ratio = 2.

Survival Time (Months) Survival Time (Months) Survival Time (Months)
Fig. F
6p+12p V Xq
Arraylet/Tumor Stage (b) Arraylet/Tumor Stage Arraylet/Tumor Stage P-value = 5.4 x lCT3 P-value = 1.6x10" P-value = 1.1 x lCT4

Survival Time (Months) Survival Time (Months) Survival Time (Months)
Fig. G. Survival analyses of the validation set of patients classified by tensor GSVD and tumor stage at diagnosis, (a) KM curves of the validation set of 148 stage III-IV patients classified by both the 6p+12p tensor GSVD and tumor stage at diagnosis, show the bivariate Cox hazard ratios of 1.9 and 1.8, which are the same as the corresponding univariate ratios. This means that the 6p+12p tensor GSVD is independent of stage, the best predictor of OV survival to date. The 34 months KM median survival time difference is about 62% and more than one year greater than the 21 month difference between the patients classified by stage alone. This means that the tensor GSVD and stage combined make a better predictor than stage alone. ( ¾) The 148 patients classified by both the 7p tensor GSVD and stage, (c) The 148 patients classified by both the Xq tensor GSVD and stage.
6p+12p V Xq
Probelet/Residual Disease Probelet/Residual Disease Probelet/Residual Disease P-value = 6.6 x lCT4 P-value = 1.1 x lCT3 P-value = 4.0 x lCT4

(d) Probelet/Therapy Outcome (e) Probelet/Therapy Outcome (f) Probelet/Therapy Outcome
P-value = 8.1 lO"1 P-value = 3.9 lO"" P-value = 1.8x10

(g) Probelet/Neoplasm Status (h) Probelet/Neoplasm Status (i) Probelet/Neoplasm Status P-value = 2.2 x lCT8 P-value = 6.1 x 1 CT9 P-value = 2.1 x lCT8

Survival Time (Months) Survival Time (Months) Survival Time (Months)
Fig. H. Survival analyses of the discovery set of patients classified by tensor GSVD and standard OV indicators other than stage. KM curves of the discovery set of 249 patients classified by both the (a) 6p+12p, ( 6) 7p, or (c) Xq tensor GSVD, and residual disease after surgery, the ( d) 6p+12p, (e) 7p, or (/) Xq tensor GSVD, and outcome of subsequent therapy, and (g) 6p+12p, (h) 7p, or (i) Xq tensor GSVD, and neoplasm status.
6p+12p 7p Xq
(a) Arraylet/Residual Disease (b) Arraylet/Residual Disease (c) Arraylet/Residual Disease
P-value = 2.6x10 P-value = 1.2 x lCT3 P-value = 1.3x10

(d) Arraylet/Therapy Outcome (e) Arraylet/Therapy Outcome (f) Arraylet/Therapy Outcome
P-value = 3.8x10 P-value = 3.5x10 P-value = 6.6x10

(h) Arraylet/Neoplasm Status
P-value = 8.0x10 P-value = 7.0 x 10~5 P-value = 1.2x10
Hazard Ratios = 1.8 / 15.6 Hazard Ratios = 1.8/16.6 Hazard Ratios = 1.8 / 16.0

Fig. I. Survival analyses of the validation set of patients classified by tensor GSVD and standard OV indicators other than stage. KM curves of the validation set of 148 stage III-IV patients classified by both the (a) 6p+12p, (6) 7p, or (c) Xq tensor GSVD, and residual disease after surgery, the (d) 6p+12p, ( e) 7p, or (/) Xq tensor GSVD, and outcome of subsequent therapy, and (g) 6p+12p, (h) 7p, or (i) Xq tensor GSVD, and neoplasm status.

Table A. Cox univariate proportional hazard models of the discovery and validation sets of patients classified by any one of the tensor GSVDs or the standard OV indicators.

Table B. Cox bivariate proportional hazard models of the patients in the discovery and validation sets classified by both tensor GSVD and the standard OV indicators.
2.2. Novel Frequent Focal CNAs Indicating Surment's median copy number, and sMAD from the median vival. To interpret the 6p+12p, 7p, and Xq tumor ar- in the corresponding arraylet. If the segment's median is raylets, we mapped the tumor probes onto the National at least one sMAD greater (or lesser) than the arraylet 's Center for Biotechnology Information (NCBI) human median, then the arraylet is assigned a gain (or a loss) in genome sequence build 37, by using the Agilent Techthe segment. Similarly, we calculated the segment's menologies probe annotations posted at the University of dian copy number, and sMAD from the median in each California at Santa Cruz (UCSC) human genome browser tumor profile. If the segment's median is at least one [20] . We segmented each of the arraylets and assigned sMAD greater (or lesser) than the profile's median, then each segment a P- value by using the circular binary segthe patient is assigned a gain (or a loss) in the segment. mentation (CBS) algorithm, as previously described [21] .
To assign a CNA in a segment, we calculated the seg¬
J
(a) 6p+12p Segment 10 (SOX5)

(d) 6p+12p Segment 14 (ASUN) (e) 7p Segment 4 (RPA3 Xq Segment 10 (PABPC5
Hazard Ratio =1.6 Hazard Ratio = 1.4

Fig. J. Survival analyses of the discovery and validation sets of patients classified by the novel frequent focal CNAs included in the tensor GSVD arraylets. Six novel frequent focal CNAs that are included in the tensor GSVD arraylets are significantly correlated with OV survival. Two amplified consecutive segments (12pl2.1) contain (a) the 5' ends of isoforms a and e of SOX5, and ( 6) exons 5 and 6, the first exons that are common to isoforms a, b, d, and e of SOX5. Two other amplified consecutive segments (12pll.23) contain (c) ITPR2 and (d) ASUN. One deletion (7p22.1-p21.3) contains ( e) RPA3. Another deletion (Xq21.31) contains (/) PABPC5, and the sequence tag site DXS241 adjacent to translocation breakpoints observed in premature ovarian failure.
2.3. Possible Roles in OV Pathogenesis. To comand X chromosome microRNAs on the Agilent Human pare the variation in DNA copy numbers with that in microRNA Array 8xl5K platform with UCSC coordigene expression, we used mRNA expression profiles that nates. Medians of the profiles of samples from the same were available for 394 of the 397 TCGA patients in the patient were taken.
discovery and validation sets. Each profile lists TCGA To compare with the variation in protein expression, level 3 mRNA expression for 11,457 autosomal and X we used protein expression profiles that were available for chromosome genes on the Affymetrix Human Genome 282 of the 397 patients. Each profile lists TCGA level U133A Array platform with UCSC coordinates [20] and 3 protein expression for the 175 antibodies on the MD GO annotations [39] . Medians of the profiles of samAnderson Reverse Phase Protein Array (RPPA), which ples from the same patient were taken. To examine the probe for the abundance levels of 136 proteins encoded possible relations between a tensor GSVD class and the by autosomal and X chromosome genes.
OV pathogenesis, we assessed the enrichment of the subWe find that the CNAs are consistent with differential sets of genes that are differentially expressed between the mRNA, microRNA, and protein expression between the tensor GSVD classes in any one of the multiple GO antensor GSVD classes (Figs. K-M). The mRNA and pronotations [40] . The P-value of a given enrichment was tein encoded by, e.g., M APR 14, which is deleted in the calculated assuming hypergeometric probability distribu6p+12p arraylet, are both significantly (Mann-Whitney- tion of the annotations among the genes in the global Wilcoxon P-values < 10-5) underexpressed in the tensor set, and of the subset of annotations among the subset GSVD class of a high 6p+12p i-probelet coefficient, or of genes, as previously described [12] . arraylet correlation relative to the tensor GSVD class of a
To compare with the variation in microRNA expreslow 6p+12p ίΕ-probelet coefficient, or arraylet correlation. sion, we used microRNA expression profiles that were The microRNA mir-877* that maps to the same deleavailable for 395 of the 397 patients. Each profile lists tion as MAPK14 is also significantly (Mann-Whitney- TCGA level 3 microRNA expression for 639 autosomal Wilcoxon P-value <0.05) underexpressed.
I
Fig. K (on p. A-15). Differential mRNA expression between the tensor GSVD classes is consistent with the CNAs. (a) TNF, ( b) MAPK14, and (c) CDKNlA, which are deleted in the 6p+12p arraylet, are significantly (Mann- Whitney- Wilcoxon P-value <0.05) underexpressed in the tensor GSVD class of a high 6p+12p i-probelet coefficient, or arraylet correlation relative to the tensor GSVD class of a low 6p+12p i-probelet coefficient, or arraylet correlation, (d) RAD51AP1, ( e) ITPR2, and (/) ASUN, which are amplified in the 6p+12p arraylet, are significantly overexpressed in the tensor GSVD class of a high 6p+12p i-probelet coefficient, or arraylet correlation. (g) RPA3, which is deleted, and (h) POLD2, which is amplified, in the 7p arraylet, are significantly underexpressed and overexpressed, respectively, in the tensor GSVD class of a high 7p i-probelet coefficient, or arraylet correlation, (i) BCAP31, which is amplified in the Xq arraylet, is significantly overexpressed in the tensor GSVD class of a high Xq i-probelet coefficient, or arraylet correlation.
Fig. L (on p. A-16). Differential microRNA expression between the tensor GSVD classes is consistent with the CNAs. (a) mir-877*, which is deleted, and ( ¾) mir-200c, (c) mir-200c*, (d) mir-141, and ( e) mir-141*, which are amplified in the 6p+12p arraylet, are significantly (Mann- Whitney- Wilcoxon P-value <0.05) underexpressed and overexpressed, respectively, in the tensor GSVD class of a high 6p+12p i-probelet coefficient, or arraylet correlation relative to the tensor GSVD class of a low 6p+12p i-probelet coefficient, or arraylet correlation. (/) mir-888, (g) mir-224, and (h) mir-452, which are amplified in the Xq arraylet, are significantly overexpressed in the tensor GSVD class of a high Xq i-probelet coefficient, or arraylet correlation.

. K
(a) 6p+12p Probelet (Coeff. (b) 6p+12p Probelet (Coeff. (c) 6p+12p Probelet (Coeff. miR-877* miR-200c miR-200c*
P-value = 2.6 x lCT2 P-value = 3.1x10"" P-value = 6.7 x lCT8

(d) 6p+12p Probelet (Coeff.) (e) 6p+12p Probelet (Coeff.

(f) Xq Probelet (Coeff. (g) Xq Probelet (Coeff. (h) Xq Probelet (Coeff. miR-888 miR-224 miR-452
P-value = 1.2 x 10"2 P-value = 3.5 x 10"4 P-value = 2.1 x 10"3

Fig. L
(a) 6p+12p Probelet (Coeff.) (b) 6p+12p Probelet (Coeff.;
P-value = 4.5 x 1CT6 P-value = 5.4 x 10"4

Fig. M. Differential protein expression between the tensor GSVD classes is consistent with the CNAs. (a) MAPK14, which is deleted, and (6) CDKN1B, which is amplified in the 6p+12p arraylet, are significantly (Mann- Whitney- Wilcoxon P-value <0.05) underexpressed and overexpressed, respectively, in the tensor GSVD class of a high 6p+12p ^-probelet coefficient, or arraylet correlation relative to the tensor GSVD class of a low 6p+12p ίΕ-probelet coefficient, or arraylet correlation.

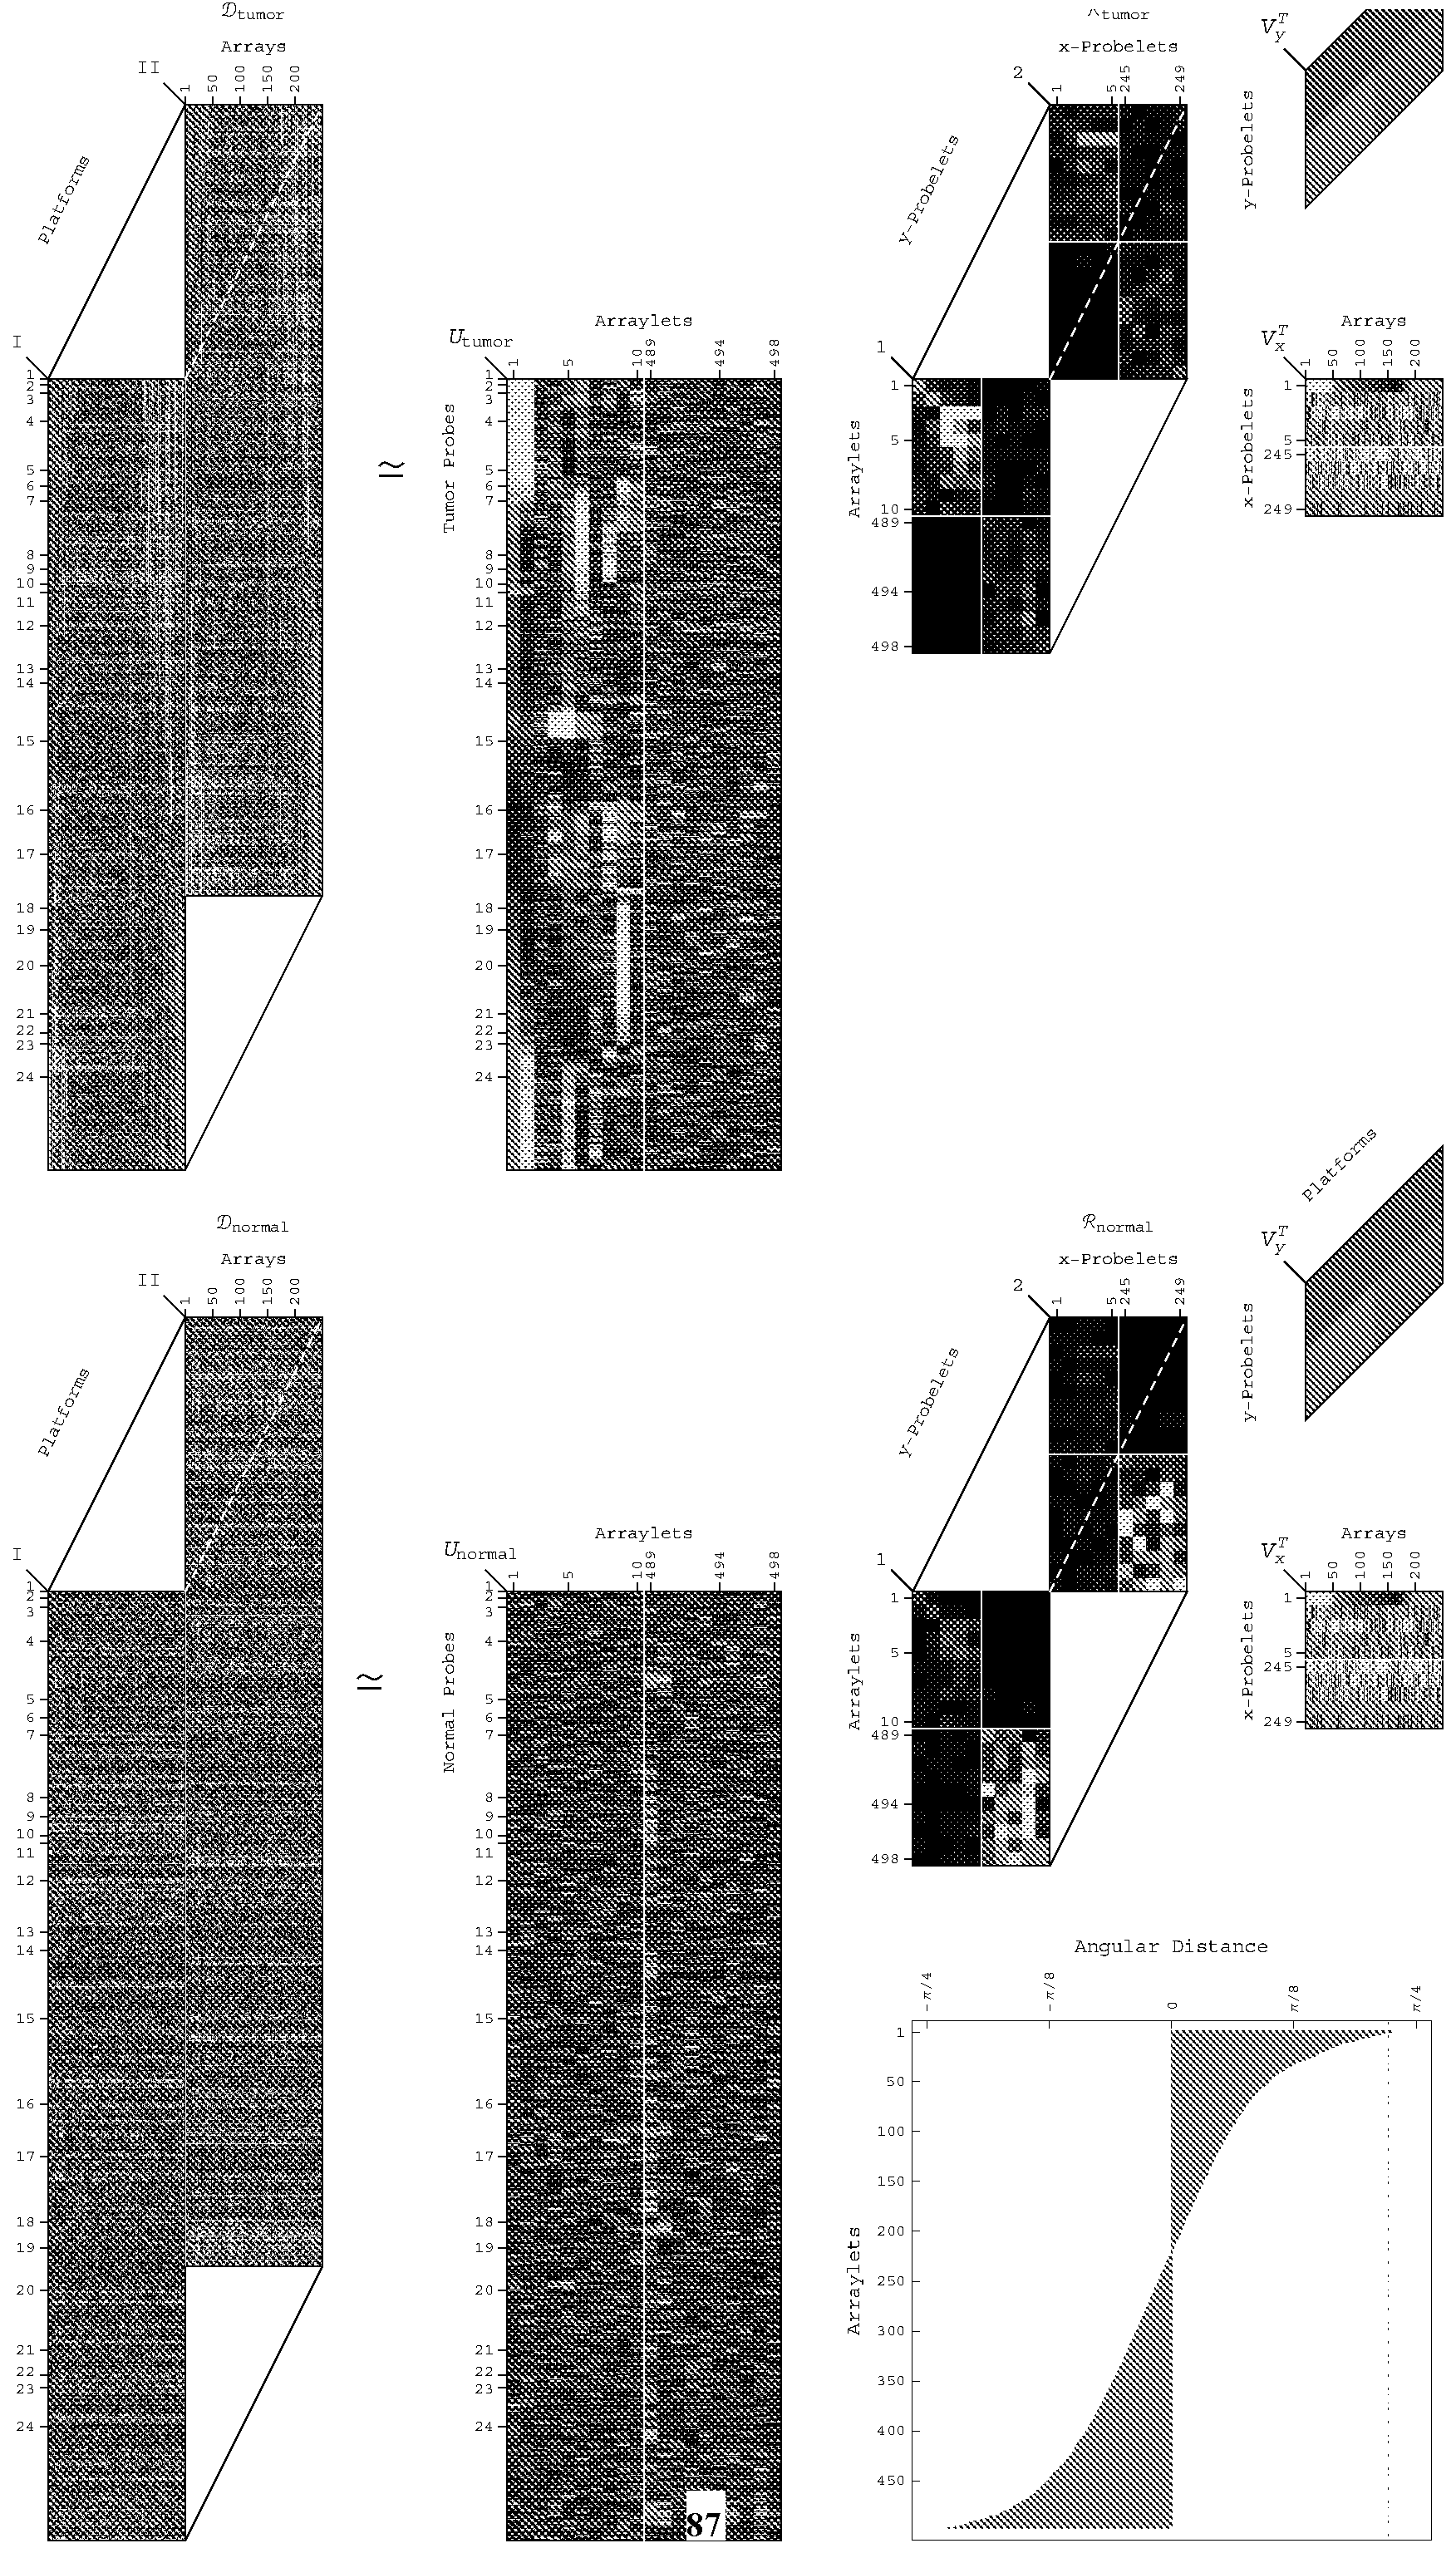

0.62 (d) d2 = 0.66
CM CM CO <Φ O o O o

( e ) di = 0.61 ; f ) d2 = 0.6
^t1 >x>
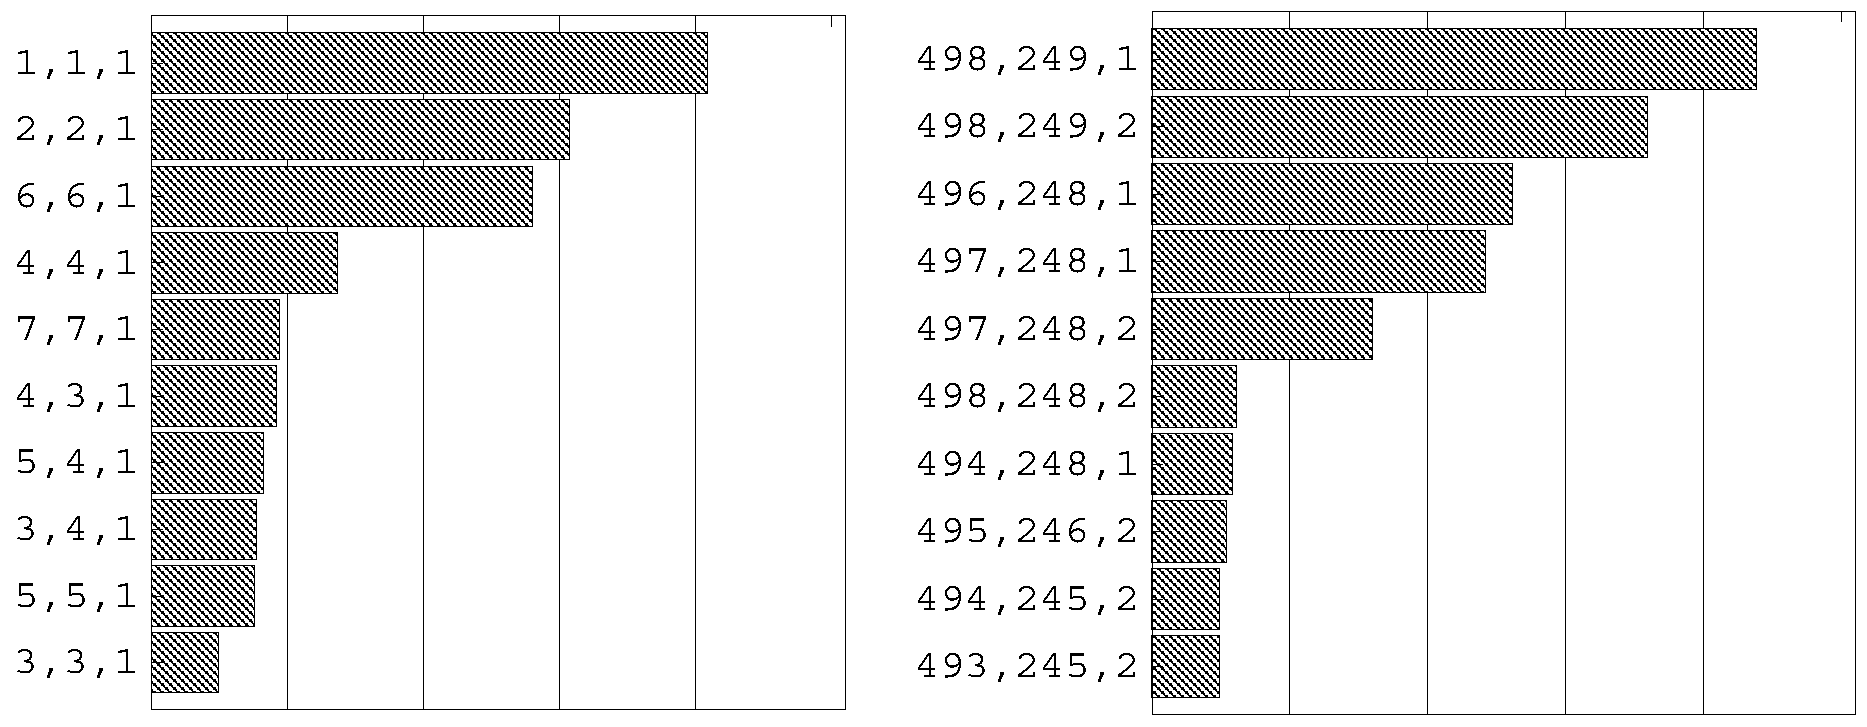

Tumor Stage (b) Residual Disease
P-value = 3.8 x 10"2 P-value = 1.4 x 10"2
Hazard Ratio = 1.8 Hazard Ratio = 2.4

80 80
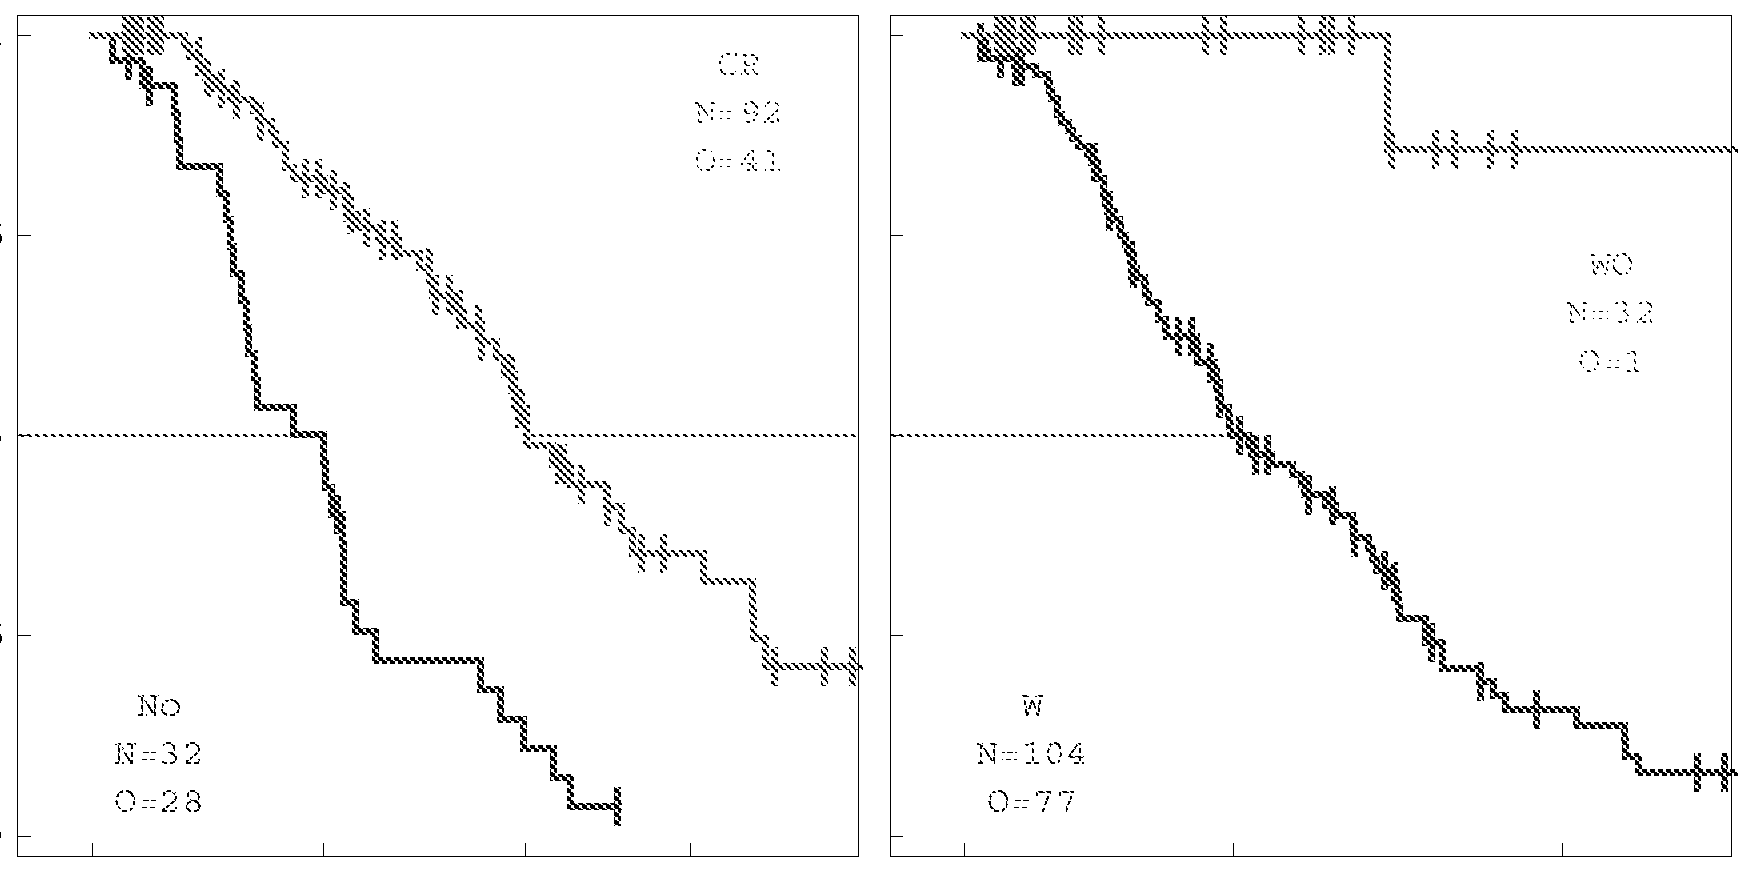 6p+12p 7P Xq
Probelet (Coeff.) Probelet (Coeff.) Probelet (Coeff. P-value = 2.4 x lCT4 P-value = 3.1 x lCT2 P-value = 1.6x10"

(d) Probelet/Tumor Stage Probelet/Tumor Stage Probelet/Tumor Stage P-value = 4.8 x 10~5 P-value = 1.6 x 1CT3 P-value = 9.0 x 1CT4

Arraylet (Corr. Arraylet (Corr.) Arraylet (Corr. P-value = 2.5x10 P-value = 1.9x10" P-value = 3.3x10

0 4 :".,·: 80
Survival Time (Months) Survival Time (Months) Survival Time (Months)
6p+12p V Xq
(a) Arraylet/Tumor Stage (b) Arraylet/Tumor Stage (c) Arraylet/Tumor Stage
P-value = 5.4 x 10"3 P-value = 1.6 x 10"2 P-value = 1.1 x 10"4
Hazard Ratios = 2.1/2.1

0 21 3134 33 80 0 21 38 33 80 0 19 11 33 32 80
Survival Time (Months) Survival Time (Months) Survival Time (Months)
(d) Prob P-va
Haza


Hazard Ratios = 1.8/15.6 Hazard Ratios = 1.8/16.6 Hazard Ratios = 1.8/16.0
Fraction of Surviving Patients from Fraction of Surviving Patients from the Discovery and Validation Sets the Discovery and Validation Sets


Zt9/.Z0/9l0ZSil/I3d 9Ζ589Ϊ/9Ϊ0Ζ OAV
(a) 6p+12p Probelet (Coeff. (b) 6p+12p Probelet (Coeff. (c) 6p+12p Probelet (Coeff. TNF MAPK14 CDKN1A
P-value - 3.1 x lCT3 P-value = 6.2 x 1CT11 P-value = 2.5 x 1CT2

(d) 6p+12p Probelet (Coeff. (e) 6p+12p Probelet (Coeff. (f) 6p+12p Probelet (Coeff.
RAD51AP1 ITPR2 ASU
P-value = 1.9 x 10~3 P-value = 8.7 x 1CT6 P-value = 7.6 x 1CT6

7p Probelet (Coeff (h) 7p Probelet (Coeff. Xq Probelet (Coeff RPA3 POLD2 BCAP31

P-value - 6.7 x 10"

High High
(d) 6p+12p Probelet (Coeff. (e) 6p+12p Probelet (Coeff.
miR-141 miR-141*
P-value = 2.0 x 10"8

Xq Probelet (Coeff. (g) Xq Probelet (Coeff. (h) Xq Probelet (Coeff. miR-888 miR-224 miR-452
P-value = 1.2 x 10"2 P-value = 3.5 x 10"4 P-value = 2.1 x 10"3


Claims
1. A method, for characterization of data, comprising: administering treatment to a patient based on an indicator of a health parameter of a subject, wherein the indicator is determined by, applying an unfolding algorithm, by a processor, to each of at least two N"1 order tensors, representing data, to generate at least two matrices, wherein N > 2, wherein the at least two tensors have a matching number of columns in each of all dimensions except an N111 dimension, wherein the applying the unfolding algorithm preserves the number of columns in one dimension common to (a) one of the at least two tensors and (b) a corresponding one of the at least two matrices, wherein each of the at least two matrices is a full column rank matrix, wherein each of the matrices is a unique, weighted sum of subtensors having a matching number of columns in each of all dimensions, at least two of the sums having different weighting coefficients; determining a relative significance of the subtensors as a ratio of the weighting coefficients; determining and outputting, by a processor and based on the relative significance of the subtensors, the indicator of the health parameter of the subject, wherein the health parameter comprises at least one of a differential diagnosis, a first health status of the subject, a disease subtype, at least one of an estimated
probability or an estimated risk of a second health status of the subject, a prognosis of the subject, or a predicted response to a treatment of the subject.
2. The method of claim 1, wherein the tensors have one-to-one mappings among the columns across all but the N111 dimension of each of the tensors.
3. The method of claim 1, wherein the tensors do not have one-to-one mappings among the rows across the N111 dimension of each of the tensors.
4. The method of claim 1, further comprising applying a decomposition algorithm, by a processor, to the at least two subtensors, to generate, from the at least two subtensors A and B, eigenvectors of each of AAT, ATA, BBT, and BTB.
5. The method of claim 1, wherein the data comprises indicators, represented in respective rows and columns of the tensor, of values of at least two index parameters.
6. The method of claim 1, wherein the applying the unfolding algorithm includes appending into (N-l)th order tensors into (N-2)th order tensors that span (N-2) dimensions in each tensor.
7. The method of claim 1, wherein the applying the unfolding algorithm includes appending into a matrix the columns or rows across a preserved dimension in each tensor.
8. The method of claim 1, wherein each subtensor is an outer product of one x-, one _y- and one z-axis vector.
9. The method of claim 8, wherein the sets of x-, y- and z-axes vectors are computed by using a matrix GSVD of the tensors unfolded along their corresponding axes.
10. The method of claim 1, wherein administering the treatment comprises administering a drug to the subject, admitting the subject to a care facility, or performing an operation on the subject.
11. The method of claim 1, wherein the tensors are generated by folding a plurality of matrices into the tensors.
12. A method, for characterization of data, comprising: administering treatment to a patient based on an indicator of a health parameter of a subject, receiving the indicator of the health parameter of the subject, wherein the health parameter comprises at least one of a differential diagnosis, a first health status of the subject, a disease subtype, at least one of an estimated probability or an estimated risk of a second health status of the subject, a prognosis of the subject, or a predicted response to a treatment of the subject; wherein the indicator is determined by: applying an unfolding algorithm, by a processor, to each of at least two N"1 order tensors, representing data, to generate at least two matrices, wherein N > 2, wherein the at least two tensors have a matching number of columns in each of all dimensions except an N111 dimension, wherein the applying the unfolding algorithm preserves the number of columns in one dimension common to (a) one of the at least two tensors and (b) a corresponding one of the at least two matrices, wherein each of the at least two matrices is a full column rank matrix, wherein each of the matrices is
a unique, weighted sum of subtensors having a matching number of columns in each of all dimensions, at least two of the sums having different weighting coefficients; determining a relative significance of the subtensors as a ratio of the weighting coefficients; determining, based on the relative significance of the subtensors, the indicator.
13. The method of claim 12, wherein the treatment comprises administering a drug to the subject, admitting the subject to a care facility, or performing an operation on the subject.
14. A system, for characterization of data, comprising: an unfolding module configured to apply an unfolding algorithm, by a processor, to each of at least two N"1 order tensors, representing data, to generate at least two matrices, wherein N> 2, wherein the at least two tensors have a matching number of columns in each of all dimensions except an N111 dimension, wherein the applying the unfolding algorithm preserves the number of columns in one dimension common to (a) one of the at least two tensors and (b) a corresponding one of the at least two matrices, wherein each of the at least two matrices is a full column rank matrix, wherein each of the matrices is a unique, weighted sum of subtensors having a matching number of columns in each of all dimensions, at least two of the sums having different weighting coefficients; a first determining module configured to determine a relative significance of the subtensors as a ratio of the weighting coefficients; a second determining module configured to determine, by a processor and based on the relative significance of the subtensors, an indicator of a health parameter of a subject, the indicator being used to determine whether to administer treatment to the subject, wherein the health parameter comprises at least one of a differential diagnosis, a first health status of the subject, a disease subtype, at least one of an estimated probability or an estimated risk of a second health status of the subject, a prognosis of the subject, or a predicted response to a treatment of the subject; an outputting module, configured to output the indicator.
15. The system of claim 14, wherein the tensors have one-to-one mappings among the columns across all but the N111 dimension of each of the tensors.
16. The system of claim 14, wherein the tensors do not have one-to-one mappings among the rows across the N"1 dimension of each of the tensors.
17. The system of claim 14, further comprising applying a decomposition algorithm, by a processor, to the at least two subtensors, to generate, from the at least two subtensors A and B, eigenvectors of each of AAT, ATA, BBT, and BTB.
18. The system of claim 14, wherein the data comprises indicators, represented in respective rows and columns of the tensor, of values of at least two index parameters.
19. The system of claim 14, wherein the applying the unfolding algorithm includes appending into (N-l)th order tensors into (N-2)th order tensors that span (N-2) dimensions in each tensor.
20. The system of claim 14, wherein the applying the unfolding algorithm includes appending into a matrix the columns or rows across a preserved dimension in each tensor.
21. The system of claim 14, wherein each subtensor is an outer product of one x-, one_y- and one z-axis vector.
22. The system of claim 21, wherein the sets of x-, y- and z-axes vectors are computed by using a matrix GSVD of the tensors unfolded along their corresponding axes.
23. The system of claim 14, wherein administering the treatment comprises administering a drug, admitting the subject to a care facility, or performing an operation on the subject.
24. The system of claim 14, wherein the tensors are generated by folding a plurality of matrices into the tensors.
25. A method, for characterization of data, comprising: applying an unfolding algorithm, by a processor, to each of at least two N"1 order tensors, representing data, to generate at least two matrices, wherein N > 2, wherein the at least two tensors have a matching number of columns in each of all dimensions except an N111 dimension, wherein the applying the unfolding algorithm preserves the number of columns in one dimension common to (a) one of the at least two tensors and (b) a corresponding one of the at least two matrices, wherein each of the at least two matrices is a full column rank matrix, wherein each of the matrices is a unique, weighted sum of subtensors having a matching number of columns in each of all dimensions, at least two of the sums having different weighting coefficients;
determining a relative significance of the subtensors as a ratio of the weighting coefficients; determining and outputting, by a processor and based on the relative significance of the subtensors, an indicator of a health parameter of a subject, wherein the health parameter comprises at least one of a differential diagnosis, a first health status of the subject, a disease subtype, at least one of an estimated probability or an estimated risk of a second health status of the subject, a prognosis of the subject, or a predicted response to a treatment of the subject.
26. The method of claim 25, wherein the tensors have one-to-one mappings among the columns across all but the N111 dimension of each of the tensors.
27. The method of claim 25, wherein the tensors do not have one-to-one mappings among the rows across the N"1 dimension of each of the tensors.
28. The method of claim 25, further comprising applying a decomposition algorithm, by a processor, to the at least two subtensors, to generate, from the at least two subtensors A and B, eigenvectors of each of AAT, ATA, BBT, and BTB.
29. The method of claim 25, wherein the data comprises indicators, represented in respective rows and columns of the tensor, of values of at least two index parameters.
30. The method of claim 25, wherein the applying the unfolding algorithm includes appending into (N-l)th order tensors into (N-2)th order tensors that span (N-2) dimensions in each tensor.
31. The method of claim 25, wherein the applying the unfolding algorithm includes appending into a matrix the columns or rows across a preserved dimension in each tensor.
32. The method of claim 25, wherein each subtensor is an outer product of one x-, one y- and one z-axis vector.
33. The method of claim 32, wherein the sets of x-, y- and z-axes vectors are computed by using a matrix GSVD of the tensors unfolded along their corresponding axes.
34. The method of claim 25, wherein the tensors are generated by folding a plurality of matrices into the tensors.
35. A system, for characterization of data, comprising:
an unfolding module configured to apply an unfolding algorithm, by a processor, to each of at least two N"1 order tensors, representing data, to generate at least two matrices, wherein N> 2, wherein the at least two tensors have a matching number of columns in each of all dimensions except an N111 dimension, wherein the applying the unfolding algorithm preserves the number of columns in one dimension common to (a) one of the at least two tensors and (b) a corresponding one of the at least two matrices, wherein each of the at least two matrices is a full column rank matrix, wherein each of the matrices is a unique, weighted sum of subtensors having a matching number of columns in each of all dimensions, at least two of the sums having different weighting coefficients; a first determining module configured to determine a relative significance of the subtensors as a ratio of the weighting coefficients; a second determining module configured to determine, by a processor and based on the relative significance of the subtensors, an indicator of a health parameter of a subject, wherein the health parameter comprises at least one of a differential diagnosis, a first health status of the subject, a disease subtype, at least one of an estimated probability or an estimated risk of a second health status of the subject, a prognosis of the subject, or a predicted response to a treatment of the subject; an outputting module, configured to output the indicator.
36. The system of claim 35, wherein the tensors have one-to-one mappings among the columns across all but the N111 dimension of each of the tensors.
37. The system of claim 35, wherein the tensors do not have one-to-one mappings among the rows across the N"1 dimension of each of the tensors.
38. The system of claim 35, further comprising applying a decomposition algorithm, by a processor, to the at least two subtensors, to generate, from the at least two subtensors A and B, eigenvectors of each of AAT, ATA, BBT, and BTB.
39. The system of claim 35, wherein the data comprises indicators, represented in respective rows and columns of the tensor, of values of at least two index parameters.
40. The system of claim 35, wherein the applying the unfolding algorithm includes appending into (N-l)th order tensors into (N-2)th order tensors that span (N-2) dimensions in each tensor.
41. The system of claim 35, wherein the applying the unfolding algorithm includes appending into a matrix the columns or rows across a preserved dimension in each tensor.
42. The system of claim 35, wherein each subtensor is an outer product of one x-, one_y- and one z-axis vector.
43. The system of claim 42, wherein the sets of x-, y- and z-axes vectors are computed by using a matrix GSVD of the tensors unfolded along their corresponding axes.
44. The system of claim 35, wherein the tensors are generated by folding a plurality of matrices into the tensors.
Priority Applications (1)
| Application Number | Priority Date | Filing Date | Title |
|---|---|---|---|
| US15/566,298 US20180301223A1 (en) | 2015-04-14 | 2016-04-14 | Advanced Tensor Decompositions For Computational Assessment And Prediction From Data |
Applications Claiming Priority (4)
| Application Number | Priority Date | Filing Date | Title |
|---|---|---|---|
| US201562147545P | 2015-04-14 | 2015-04-14 | |
| US201562147555P | 2015-04-14 | 2015-04-14 | |
| US62/147,555 | 2015-04-14 | ||
| US62/147,545 | 2015-04-14 |
Publications (1)
| Publication Number | Publication Date |
|---|---|
| WO2016168526A1 true WO2016168526A1 (en) | 2016-10-20 |
Family
ID=57125980
Family Applications (2)
| Application Number | Title | Priority Date | Filing Date |
|---|---|---|---|
| PCT/US2016/027642 Ceased WO2016168526A1 (en) | 2015-04-14 | 2016-04-14 | Advanced tensor decompositions for computational assessment and prediction from data |
| PCT/US2016/027641 Ceased WO2016168525A1 (en) | 2015-04-14 | 2016-04-14 | Genetic alterations in ovarian cancer |
Family Applications After (1)
| Application Number | Title | Priority Date | Filing Date |
|---|---|---|---|
| PCT/US2016/027641 Ceased WO2016168525A1 (en) | 2015-04-14 | 2016-04-14 | Genetic alterations in ovarian cancer |
Country Status (2)
| Country | Link |
|---|---|
| US (2) | US20180301223A1 (en) |
| WO (2) | WO2016168526A1 (en) |
Cited By (4)
| Publication number | Priority date | Publication date | Assignee | Title |
|---|---|---|---|---|
| US10202643B2 (en) | 2011-10-31 | 2019-02-12 | University Of Utah Research Foundation | Genetic alterations in glioma |
| CN111528794A (en) * | 2017-08-08 | 2020-08-14 | 北京航空航天大学 | Source localization method based on sensor array decomposition and beamforming |
| CN115948562A (en) * | 2020-11-16 | 2023-04-11 | 武汉艾米森生命科技有限公司 | Application and kit of reagent for detecting gene methylation in diagnosis of cervical cancer |
| CN120994743A (en) * | 2025-07-25 | 2025-11-21 | 杭州师范大学 | A digital asset management method and system based on multi-objective optimization |
Families Citing this family (14)
| Publication number | Priority date | Publication date | Assignee | Title |
|---|---|---|---|---|
| WO2019113432A1 (en) * | 2017-12-08 | 2019-06-13 | University Of Washington | Methods and compositions for detecting and promoting cardiolipin remodeling and cardiomyocyte maturation and related methods of treating mitochondrial dysfunction |
| US10555390B2 (en) | 2018-02-28 | 2020-02-04 | Andrew Schuyler | Integrated programmable effect and functional lighting module |
| US11100417B2 (en) * | 2018-05-08 | 2021-08-24 | International Business Machines Corporation | Simulating quantum circuits on a computer using hierarchical storage |
| CN110138614B (en) * | 2019-05-20 | 2022-02-11 | 湖南友道信息技术有限公司 | Tensor model-based online network flow anomaly detection method and system |
| CN110149228B (en) * | 2019-05-20 | 2021-11-23 | 湖南友道信息技术有限公司 | Top-k elephant flow prediction method and system based on discretization tensor filling |
| US11107100B2 (en) * | 2019-08-09 | 2021-08-31 | International Business Machines Corporation | Distributing computational workload according to tensor optimization |
| WO2021062366A1 (en) * | 2019-09-27 | 2021-04-01 | The Brigham And Women's Hospital, Inc. | Multimodal fusion for diagnosis, prognosis, and therapeutic response prediction |
| US11651261B2 (en) * | 2019-10-29 | 2023-05-16 | The Boeing Company | Hyperdimensional simultaneous belief fusion using tensors |
| WO2022015532A1 (en) * | 2020-07-13 | 2022-01-20 | University Of Pittsburgh-Of The Commonwealth System Of Higher Education | Compositions and methods for detecting gene fusions of rad51ap1 and dyrk4 and for diagnosing and treating cancer |
| CN112632028B (en) * | 2020-12-04 | 2021-08-24 | 中牟县职业中等专业学校 | Industrial production element optimization method based on multi-dimensional matrix outer product database configuration |
| GB2605991A (en) * | 2021-04-21 | 2022-10-26 | Zeta Specialist Lighting Ltd | Traffic control at an intersection |
| JP2024541076A (en) * | 2021-11-09 | 2024-11-06 | ヤンセン バイオテツク,インコーポレーテツド | Microfluidic co-encapsulation devices, systems and methods for identifying T cell receptor ligands |
| US20240070534A1 (en) * | 2022-08-23 | 2024-02-29 | Unitedhealth Group Incorporated | Individualized classification thresholds for machine learning models |
| US20250140409A1 (en) * | 2023-10-27 | 2025-05-01 | Imacular Regeneration Llc | Artificial intelligence and bioinformatics system for age-related macular degeneration |
Citations (6)
| Publication number | Priority date | Publication date | Assignee | Title |
|---|---|---|---|---|
| US6249692B1 (en) * | 2000-08-17 | 2001-06-19 | The Research Foundation Of City University Of New York | Method for diagnosis and management of osteoporosis |
| US6745173B1 (en) * | 2000-06-14 | 2004-06-01 | International Business Machines Corporation | Generating in and exists queries using tensor representations |
| US20090299705A1 (en) * | 2008-05-28 | 2009-12-03 | Nec Laboratories America, Inc. | Systems and Methods for Processing High-Dimensional Data |
| US20100149214A1 (en) * | 2005-08-11 | 2010-06-17 | Koninklijke Philips Electronics, N.V. | Rendering a view from an image dataset |
| US20110172514A1 (en) * | 2008-09-29 | 2011-07-14 | Koninklijke Philips Electronics N.V. | Method for increasing the robustness of computer-aided diagnosis to image processing uncertainties |
| US20140249762A1 (en) * | 2011-09-09 | 2014-09-04 | University Of Utah Research Foundation | Genomic tensor analysis for medical assessment and prediction |
Family Cites Families (3)
| Publication number | Priority date | Publication date | Assignee | Title |
|---|---|---|---|---|
| WO2009153774A2 (en) * | 2008-06-17 | 2009-12-23 | Rosetta Genomics Ltd. | Compositions and methods for prognosis of ovarian cancer |
| CN104395755A (en) * | 2012-06-15 | 2015-03-04 | 斯特林医药公司 | Methods and compositions for personalized medicine by point-of-care devices for FSH, LH, HCG and BNP |
| WO2015023552A1 (en) * | 2013-08-13 | 2015-02-19 | Bionumerik Pharmaceuticals, Inc. | Administration of karenitecin for the treatment of advanced ovarian cancer, including chemotherapy-resistant and/or the mucinous adenocarcinoma sub-types |
-
2016
- 2016-04-14 WO PCT/US2016/027642 patent/WO2016168526A1/en not_active Ceased
- 2016-04-14 US US15/566,298 patent/US20180301223A1/en not_active Abandoned
- 2016-04-14 US US15/566,294 patent/US20180122507A1/en not_active Abandoned
- 2016-04-14 WO PCT/US2016/027641 patent/WO2016168525A1/en not_active Ceased
Patent Citations (6)
| Publication number | Priority date | Publication date | Assignee | Title |
|---|---|---|---|---|
| US6745173B1 (en) * | 2000-06-14 | 2004-06-01 | International Business Machines Corporation | Generating in and exists queries using tensor representations |
| US6249692B1 (en) * | 2000-08-17 | 2001-06-19 | The Research Foundation Of City University Of New York | Method for diagnosis and management of osteoporosis |
| US20100149214A1 (en) * | 2005-08-11 | 2010-06-17 | Koninklijke Philips Electronics, N.V. | Rendering a view from an image dataset |
| US20090299705A1 (en) * | 2008-05-28 | 2009-12-03 | Nec Laboratories America, Inc. | Systems and Methods for Processing High-Dimensional Data |
| US20110172514A1 (en) * | 2008-09-29 | 2011-07-14 | Koninklijke Philips Electronics N.V. | Method for increasing the robustness of computer-aided diagnosis to image processing uncertainties |
| US20140249762A1 (en) * | 2011-09-09 | 2014-09-04 | University Of Utah Research Foundation | Genomic tensor analysis for medical assessment and prediction |
Cited By (6)
| Publication number | Priority date | Publication date | Assignee | Title |
|---|---|---|---|---|
| US10202643B2 (en) | 2011-10-31 | 2019-02-12 | University Of Utah Research Foundation | Genetic alterations in glioma |
| CN111528794A (en) * | 2017-08-08 | 2020-08-14 | 北京航空航天大学 | Source localization method based on sensor array decomposition and beamforming |
| CN111528794B (en) * | 2017-08-08 | 2021-03-19 | 北京航空航天大学 | Source positioning method based on sensor array decomposition and beam forming |
| CN115948562A (en) * | 2020-11-16 | 2023-04-11 | 武汉艾米森生命科技有限公司 | Application and kit of reagent for detecting gene methylation in diagnosis of cervical cancer |
| CN115948562B (en) * | 2020-11-16 | 2024-04-12 | 武汉艾米森生命科技有限公司 | Application of reagent for detecting gene methylation in cervical cancer diagnosis and kit |
| CN120994743A (en) * | 2025-07-25 | 2025-11-21 | 杭州师范大学 | A digital asset management method and system based on multi-objective optimization |
Also Published As
| Publication number | Publication date |
|---|---|
| US20180122507A1 (en) | 2018-05-03 |
| WO2016168525A1 (en) | 2016-10-20 |
| US20180301223A1 (en) | 2018-10-18 |
Similar Documents
| Publication | Publication Date | Title |
|---|---|---|
| WO2016168526A1 (en) | Advanced tensor decompositions for computational assessment and prediction from data | |
| Yang et al. | Subtype-GAN: a deep learning approach for integrative cancer subtyping of multi-omics data | |
| Chen et al. | Efficient variant set mixed model association tests for continuous and binary traits in large-scale whole-genome sequencing studies | |
| Watters et al. | Genome-wide discovery of loci influencing chemotherapy cytotoxicity | |
| Fiscon et al. | Network-based approaches to explore complex biological systems towards network medicine | |
| Ha et al. | DINGO: differential network analysis in genomics | |
| Henn et al. | Hunter-gatherer genomic diversity suggests a southern African origin for modern humans | |
| Duarte et al. | Global reconstruction of the human metabolic network based on genomic and bibliomic data | |
| Sardiu et al. | Probabilistic assembly of human protein interaction networks from label-free quantitative proteomics | |
| Xu et al. | Genetic dating indicates that the Asian–Papuan admixture through Eastern Indonesia corresponds to the Austronesian expansion | |
| Li et al. | Network-constrained regularization and variable selection for analysis of genomic data | |
| Li et al. | Dynamic scan procedure for detecting rare-variant association regions in whole-genome sequencing studies | |
| Chen et al. | HOGMMNC: a higher order graph matching with multiple network constraints model for gene–drug regulatory modules identification | |
| Lin et al. | Simultaneous dimension reduction and adjustment for confounding variation | |
| Kaplan et al. | Prediction with dimension reduction of multiple molecular data sources for patient survival | |
| Wang et al. | Efficient gene–environment interaction tests for large biobank‐scale sequencing studies | |
| Zhou et al. | Analysis of factorial time-course microarrays with application to a clinical study of burn injury | |
| Demir Karaman et al. | Multi-omics data analysis identifies prognostic biomarkers across cancers | |
| Han et al. | Integration of molecular features with clinical information for predicting outcomes for neuroblastoma patients | |
| Young et al. | Pathway-informed classification system (PICS) for cancer analysis using gene expression data | |
| Pham et al. | Network-based prediction for sources of transcriptional dysregulation using latent pathway identification analysis | |
| Zhang et al. | Construction of dose prediction model and identification of sensitive genes for space radiation based on single-sample networks under spaceflight conditions | |
| Rahman et al. | Protein structure–based gene expression signatures | |
| Arshad et al. | A computational approach to generate highly conserved gene co-expression networks with RNA-seq data | |
| Doderer et al. | Pathway Distiller-multisource biological pathway consolidation |
Legal Events
| Date | Code | Title | Description |
|---|---|---|---|
| 121 | Ep: the epo has been informed by wipo that ep was designated in this application |
Ref document number: 16780792 Country of ref document: EP Kind code of ref document: A1 |
|
| DPE1 | Request for preliminary examination filed after expiration of 19th month from priority date (pct application filed from 20040101) | ||
| NENP | Non-entry into the national phase |
Ref country code: DE |
|
| 122 | Ep: pct application non-entry in european phase |
Ref document number: 16780792 Country of ref document: EP Kind code of ref document: A1 |