WO2016168525A1 - Genetic alterations in ovarian cancer - Google Patents
Genetic alterations in ovarian cancer Download PDFInfo
- Publication number
- WO2016168525A1 WO2016168525A1 PCT/US2016/027641 US2016027641W WO2016168525A1 WO 2016168525 A1 WO2016168525 A1 WO 2016168525A1 US 2016027641 W US2016027641 W US 2016027641W WO 2016168525 A1 WO2016168525 A1 WO 2016168525A1
- Authority
- WO
- WIPO (PCT)
- Prior art keywords
- seq
- copy
- survival
- expression
- mrna
- Prior art date
- Legal status (The legal status is an assumption and is not a legal conclusion. Google has not performed a legal analysis and makes no representation as to the accuracy of the status listed.)
- Ceased
Links
Classifications
-
- G—PHYSICS
- G16—INFORMATION AND COMMUNICATION TECHNOLOGY [ICT] SPECIALLY ADAPTED FOR SPECIFIC APPLICATION FIELDS
- G16H—HEALTHCARE INFORMATICS, i.e. INFORMATION AND COMMUNICATION TECHNOLOGY [ICT] SPECIALLY ADAPTED FOR THE HANDLING OR PROCESSING OF MEDICAL OR HEALTHCARE DATA
- G16H50/00—ICT specially adapted for medical diagnosis, medical simulation or medical data mining; ICT specially adapted for detecting, monitoring or modelling epidemics or pandemics
- G16H50/20—ICT specially adapted for medical diagnosis, medical simulation or medical data mining; ICT specially adapted for detecting, monitoring or modelling epidemics or pandemics for computer-aided diagnosis, e.g. based on medical expert systems
-
- G—PHYSICS
- G01—MEASURING; TESTING
- G01N—INVESTIGATING OR ANALYSING MATERIALS BY DETERMINING THEIR CHEMICAL OR PHYSICAL PROPERTIES
- G01N33/00—Investigating or analysing materials by specific methods not covered by groups G01N1/00 - G01N31/00
- G01N33/48—Biological material, e.g. blood, urine; Haemocytometers
- G01N33/50—Chemical analysis of biological material, e.g. blood, urine; Testing involving biospecific ligand binding methods; Immunological testing
- G01N33/53—Immunoassay; Biospecific binding assay; Materials therefor
- G01N33/575—Immunoassay; Biospecific binding assay; Materials therefor for cancer
- G01N33/57545—Immunoassay; Biospecific binding assay; Materials therefor for cancer of the ovaries
-
- G—PHYSICS
- G16—INFORMATION AND COMMUNICATION TECHNOLOGY [ICT] SPECIALLY ADAPTED FOR SPECIFIC APPLICATION FIELDS
- G16B—BIOINFORMATICS, i.e. INFORMATION AND COMMUNICATION TECHNOLOGY [ICT] SPECIALLY ADAPTED FOR GENETIC OR PROTEIN-RELATED DATA PROCESSING IN COMPUTATIONAL MOLECULAR BIOLOGY
- G16B20/00—ICT specially adapted for functional genomics or proteomics, e.g. genotype-phenotype associations
-
- G—PHYSICS
- G16—INFORMATION AND COMMUNICATION TECHNOLOGY [ICT] SPECIALLY ADAPTED FOR SPECIFIC APPLICATION FIELDS
- G16B—BIOINFORMATICS, i.e. INFORMATION AND COMMUNICATION TECHNOLOGY [ICT] SPECIALLY ADAPTED FOR GENETIC OR PROTEIN-RELATED DATA PROCESSING IN COMPUTATIONAL MOLECULAR BIOLOGY
- G16B20/00—ICT specially adapted for functional genomics or proteomics, e.g. genotype-phenotype associations
- G16B20/10—Ploidy or copy number detection
-
- G—PHYSICS
- G16—INFORMATION AND COMMUNICATION TECHNOLOGY [ICT] SPECIALLY ADAPTED FOR SPECIFIC APPLICATION FIELDS
- G16B—BIOINFORMATICS, i.e. INFORMATION AND COMMUNICATION TECHNOLOGY [ICT] SPECIALLY ADAPTED FOR GENETIC OR PROTEIN-RELATED DATA PROCESSING IN COMPUTATIONAL MOLECULAR BIOLOGY
- G16B25/00—ICT specially adapted for hybridisation; ICT specially adapted for gene or protein expression
- G16B25/10—Gene or protein expression profiling; Expression-ratio estimation or normalisation
-
- G—PHYSICS
- G16—INFORMATION AND COMMUNICATION TECHNOLOGY [ICT] SPECIALLY ADAPTED FOR SPECIFIC APPLICATION FIELDS
- G16B—BIOINFORMATICS, i.e. INFORMATION AND COMMUNICATION TECHNOLOGY [ICT] SPECIALLY ADAPTED FOR GENETIC OR PROTEIN-RELATED DATA PROCESSING IN COMPUTATIONAL MOLECULAR BIOLOGY
- G16B40/00—ICT specially adapted for biostatistics; ICT specially adapted for bioinformatics-related machine learning or data mining, e.g. knowledge discovery or pattern finding
-
- G—PHYSICS
- G16—INFORMATION AND COMMUNICATION TECHNOLOGY [ICT] SPECIALLY ADAPTED FOR SPECIFIC APPLICATION FIELDS
- G16B—BIOINFORMATICS, i.e. INFORMATION AND COMMUNICATION TECHNOLOGY [ICT] SPECIALLY ADAPTED FOR GENETIC OR PROTEIN-RELATED DATA PROCESSING IN COMPUTATIONAL MOLECULAR BIOLOGY
- G16B50/00—ICT programming tools or database systems specially adapted for bioinformatics
- G16B50/20—Heterogeneous data integration
-
- G—PHYSICS
- G16—INFORMATION AND COMMUNICATION TECHNOLOGY [ICT] SPECIALLY ADAPTED FOR SPECIFIC APPLICATION FIELDS
- G16H—HEALTHCARE INFORMATICS, i.e. INFORMATION AND COMMUNICATION TECHNOLOGY [ICT] SPECIALLY ADAPTED FOR THE HANDLING OR PROCESSING OF MEDICAL OR HEALTHCARE DATA
- G16H50/00—ICT specially adapted for medical diagnosis, medical simulation or medical data mining; ICT specially adapted for detecting, monitoring or modelling epidemics or pandemics
- G16H50/30—ICT specially adapted for medical diagnosis, medical simulation or medical data mining; ICT specially adapted for detecting, monitoring or modelling epidemics or pandemics for calculating health indices; for individual health risk assessment
-
- Y—GENERAL TAGGING OF NEW TECHNOLOGICAL DEVELOPMENTS; GENERAL TAGGING OF CROSS-SECTIONAL TECHNOLOGIES SPANNING OVER SEVERAL SECTIONS OF THE IPC; TECHNICAL SUBJECTS COVERED BY FORMER USPC CROSS-REFERENCE ART COLLECTIONS [XRACs] AND DIGESTS
- Y02—TECHNOLOGIES OR APPLICATIONS FOR MITIGATION OR ADAPTATION AGAINST CLIMATE CHANGE
- Y02A—TECHNOLOGIES FOR ADAPTATION TO CLIMATE CHANGE
- Y02A90/00—Technologies having an indirect contribution to adaptation to climate change
- Y02A90/10—Information and communication technologies [ICT] supporting adaptation to climate change, e.g. for weather forecasting or climate simulation
Definitions
- the subject technology relates generally to computational biology and its use to identify genetic patterns related to cancer.
- Ovarian serous cystadenocarcinoma accounts for about 90% of all ovarian cancers. Most of the OV tumors, i.e. greater than 95%, are high-grade tumors. OV exhibits a range of copy-number alterations (CNA), some of which are believed to play a role in the cancer's pathogenesis. OV copy number alteration data are available from The Cancer Genome Atlas (TCGA).
- a method of determining an estimated outcome or predicting a clinical response to chemotherapy for a patient having ovarian serous cystadenocarcinoma comprises obtaining a biological sample from a patient diagnosed with OV, said sample comprising at least one of nucleic acids and proteins from the patient; detecting in said sample a value of an indicator of a differential expression of at least one of (a) a nucleotide sequence having at least 90% sequence identity to at least one of the genes selected from CkdnlA, Mapkl4, Kras, Rad51APl, Tnf, Itpr2, Rpa3, Pold2, Lig4, Pabpc5, BcapSl, and Gabre; (b) a protein encoded by the genes of (a); (c) a nucleotide sequence having at least 90% sequence identity to at least one of cytogenic bands 1-7 and 11 -17; (d
- the method further comprises recommending administering a treatment regimen based on the predicted length of survival of the patient or clinical response to chemotherapy. In embodiments, the method comprises administering a treatment regimen based on the predicted length of survival or clinical response to chemotherapy of the patient. In embodiments, the method further comprises recommending a treatment regimen based on the predicted length of survival or clinical response to chemotherapy of the patient.
- At least one nucleotide sequence has at least 90% sequence identity to at least one one of the genes selected from CkdnlA, Mapkl4, Kras, Rad51APl, Tnf, Itpr2, Rpa3, Pold2, Lig4, Pabpc5, Bcap31, and Gabre; and wherein the indicator of differential expression is differential copy number relative to a copy number of the at least one nucleotide sequence in normal cells.
- at least one nucleotide sequence has at least 90% sequence identity to at least one of cytogenic band 1 -7 and cytogenic band 11 -17; and wherein the indicator of differential expression is differential copy number relative to a copy number of the at least one nucleotide sequence in normal cells.
- the at least one protein encoded by the genes of (a) is selected from CKDN1A, MAPK14, KRAS, RAD51AP1, TNF, ITPR2, RPA3, POLD2, LIG4, PABPC5, BCAP31 , and GABRE; and wherein the indicator of differential expression is differential protein expression relative to protein expression of the at least one protein in normal cells.
- the microRNA sequence is at least one of miR-877, miR-877*, miR-200c, miR-141 , miR-888, miR-452, and miR-224; and wherein the indicator of differential expression is differential copy number relative to a copy number of the at least one nucleotide sequence in normal cells.
- the differential copy number is an increase in copy number relative to a copy number of the at least one nucleotide sequence in normal cells. In embodiments, the differential copy number is a decrease in copy number relative to a copy number of the at least one nucleotide sequence in normal cells. In embodiments, the differential protein expression is an increase in protein expression relative to protein expression in normal cells. In embodiments, the differential protein expression is a decrease in protein expression relative to protein expression in normal cells. In embodiments, the differential copy number is an increase in copy number relative to a copy number of the at least one nucleotide sequence in normal cells. In embodiments, the differential copy number is a decrease in copy number relative to a copy number of the at least one nucleotide sequence in normal cells.
- the differential expression is microRNA expression. In embodiments, the differential microRNA expression is an increase in microRNA expression relative to microRNA expression of the at least one nucleotide sequence in normal cells. In embodiments, the differential microRNA expression is a decrease in microRNA expression relative to microRNA expression of the at least one nucleotide in normal cells.
- the method comprises correlating at least one of the indicators of differential expression selected from (a)-(f) below:
- the differential expression of (c) further includes correlating copy- number loss of sequence tag site DXS214 and gain or mRNA overexpression of Bcap31 and Gabre with at least one of longer survival time and sensitivity of platinum-based chemotherapy.
- the method comprises correlating at least one of the indicators of differential expression selected from (al)-(dl) below:
- the method comprises correlating at least one of the indicators of differential expression selected from (a2)-(g2) below:
- the method comprises the differential expression of at least one of
- m2 a reduced abundance of Brcal -associated genome surveillance protein complex (BASC); with at least one of a patient's shorter survival time and resistance to platinum-based chemotherapy.
- BASC Brcal -associated genome surveillance protein complex
- the method comprises correlating at least one of the indicators of differential expression selected from (a)-(f), (al)-(dl), and (a2)-(e2).
- the method further comprises correlating at least one of:
- the method comprises: (i) correlating at least two of (2), (4), (6), (9)-(12), (14)-(16), (18), and (24);
- methods of estimating an outcome for a patient having an OV tumor comprises: obtaining a biological sample from a patient diagnosed with OV, said sample comprising at least one of nucleic acids and proteins from the patient; detecting in said sample a value of an indicator of a differential copy number of each of at least one of (a) a nucleotide sequence, each sequence having at least 90% sequence identity to at least one gene selected from CkdnlA, Mapkl4, Kras, Rad51APl, Tnf, Itpr2, Rpa3, Pold2, Lig4, Pabpc5, Bcap31, and Gabre; (b) a protein encoded by the genes of (a); (c) a nucleotide sequence having at least 90% sequence identity to at least one of cytogenic bands 1-7 and 11-17; (d) a microRNA sequence selected from miR-877, miR-877*, miR-200c, miR-141, miR-888, miR-452, and miR-224
- the at least one nucleotide sequence has at least 90 % sequence identity to at least one of the genes selected from Rad51APl, CdknlB, Kras, Itpr2, Rpa3, and Pabpc5, wherein the copy number of one or more of the genes is increased relative to a copy number of the at least one nucleotide sequence in normal cells and reflects an enhanced probability of length of survival of the patient relative to a probability of length of survival of patients without the increased copy number.
- the at least one nucleotide has at least 90 % sequence identity to at least one of the genes selected from Rad51APl, CdknlB, Kras, Itpr2, Rpa3, and Pabpc5; and wherein the copy number of one or more of the genes is decreased relative to a copy number of the at least one nucleotide sequence in normal cells and reflects an enhanced probability of length of survival of the patient relative to a probability of length of survival of patients without the decreased copy number.
- the copy number of the nucleotide sequence having at least 90% sequence identity to at least one of the genes selected from CdknlA, Mapkl4, Tnf, Pold2, Bcap31 is increased relative to a copy number of the gene in normal cells which reflects an enhanced probability of length of survival of the patient relative to a probability of length of survival of patients without the increased copy number.
- the nucleotide sequences may have at least about 85 percent sequence identity, at least about 95% sequence identity, at least about 96% sequence identity, at least about 97% sequence identity, at least about 98% sequence identity, at least about 99% sequence identity, or 100% sequence identity to at least one of the genes selected from CdknlA, Mapkl4, Tnf, Poldl, Bcap31. Sequence similarity or identity can be identified using a suitable sequence alignment algorithm, such as ClustalW2 (http://www.ebi.ac.uk/Tools/clustalw2/index.html) or "BLAST 2 Sequences" using default parameters (Tatusova, T. et al, FEMS Microbiol. Lett., 174: 187-188 (1999)).
- ClustalW2 http://www.ebi.ac.uk/Tools/clustalw2/index.html
- BLAST 2 Sequences using default parameters (Tatusova, T. et al, FEMS Microbiol. Lett.,
- the copy number of one or more of the genes is increased relative to a copy number of the at least one nucleotide sequence in normal cells and reflects an enhanced probability of length of survival of the patient relative to a probability of length of survival of patients without the increased copy number.
- the copy number of one or more of the genes is decreased relative to a copy number of the at least one nucleotide sequence in normal cells and reflects an enhanced probability of length of survival of the patient relative to a probability of length of survival of patients without the decreased copy number.
- the copy number of the nucleotide sequence having at least 90% sequence identity to at least one of the genes selected from Rad51APl, CdknlB, Kras, Itprl, Rpa3, Pabpc5 is decreased relative to a copy number of the gene in normal cells reflects an enhanced probability of length survival of the patient relative to a probability of length survival of patients without the decreased copy number.
- Bcap31 is increased relative to a copy number of the gene in normal cells reflects an enhanced probability of length of survival of the patient relative to a probability of length of survival of patients without the increased copy number.
- the copy number of the nucleotide sequence having at least 90% sequence identity to CdknlA, Mapkl4, Tnf is decreased relative to a copy number of the gene in normal cells and wherein the copy number of the nucleotide sequence having at least 90% sequence identity to Kras, Rad51APl and ITPR2 is increased relative to a copy number of the gene in normal cells reflects a decreased probability of length of survival relative to a probability of length of survival of patients without this pattern of increased and decreased copy number.
- the copy number of the nucleotide sequence having at least 90% sequence identity to CdknlA and Mapkl4 is decreased relative to a copy number of the gene in normal cells
- the copy number of the nucleotide sequence having at least 90% sequence identity to Kras and Rad51APl is increased relative to a copy number of the gene in normal cells reflects a decreased probability of length of survival relative to a probability of length of survival of patients without this pattern of increased and decreased copy number.
- the copy number of the nucleotide sequence having at least 90% sequence identity to RpaS is decreased relative to a copy number of the gene in normal cells
- the copy number of the nucleotide sequence having at least 90% sequence identity to Poldl is increased relative to a copy number of the gene in normal cells reflects an increased probability of length of survival relative to a probability of length of survival of patients without this pattern of increased and decreased copy number.
- the copy number of the nucleotide sequence having at least 90% sequence identity to Pabpc5 is decreased relative to a copy number of the gene in normal cells
- the copy number of the nucleotide sequence having at least 90% sequence identity to BcapSl is increased relative to a copy number of the gene in normal cells reflects an increased probability of length of survival relative to a probability of length of survival of patients without this pattern of increased and decreased copy number.
- the nucleotide sequence comprises DNA. In some embodiments, the nucleotide sequence comprises mRNA. [0025] In some embodiments, the indicator comprises at least one of a mRNA level, a gene product quantity (such as the expression level of a protein encoded by the gene), a gene product activity level (such as the activity level of a protein encoded by the gene), or a copy number of: at least one of (i) the at least one gene or (ii) the one or more chromosome segments.
- the indicator of increased expression reflects an enhanced probability of survival of the patient relative to a probability of survival of patients without the increased expression. In other embodiments, the indicator of increased expression reflects a decreased probability of survival of the patient relative to a probability of survival of patients without the increased expression.
- the estimating comprises comparing the copy number to a copy number of the at least one nucleotide sequence found in cells of at least one person who does not have an OV tumor.
- the copy number is determined by a technique selected from the group consisting of: fluorescent in-situ hybridization, complementary genomic hybridization, array complementary genomic hybridization, fluorescence microscopy, and any combination thereof.
- a further indicator including but not limited to, an evaluation at least one of tumor stage at diagnosis, residual disease after surgery, therapy outcome, and neoplasm status is used in conjunction with the indicator of copy number in evaluating a patient's probability of survival.
- a tumor stage at diagnosis of III or IV reflects a decreased probability of length of survival relative to a probability of length of survival of patients with the tumor stage at diagnosis of I or II; or no macroscopic residual disease after surgery reflects an increased probability of length of survival relative to a probability of length of survival of patients with macroscopic residual disease after surgery; or the therapy outcome of complete remission after therapy reflects an increased probability of length of survival relative to a probability of length of survival of patients not in complete remission after therapy; or the neoplasm status of no tumor after therapy reflects an increased probability of length of survival relative to a probability of length of survival of patients with tumor after therapy.
- the therapy comprises chemotherapy including, but not limited to, platinum-based chemotherapy.
- a method of estimating an outcome for a patient having a high- grade ovarian serous cystadenocarcinoma (OV) tumor comprises obtaining a biological sample from a patient diagnosed with OV, said sample comprising nucleic acids from the patient; detecting in said nucleic acids a value of an indicator of a differential expression of at least one nucleotide sequence, each sequence having at least 90% sequence identity to at least one gene selected from CkdnlA, Mapkl4, Tnf, Rad51APl, CdknlB, Kras, Itpr2, Rpa3, Pold2, Pabpc5, and BcapSl; and estimating, by a processor and based on the value of the indicators of differential expression, a predicted length of survival of the patient.
- the nucleotide sequence comprises DNA. In some embodiments, the nucleotide sequence comprises mRNA.
- the indicator comprises at least one of an mRNA level, a gene product quantity, a gene product activity level, or a copy number of at least one of the at least one gene.
- the indicator of differential expression is an indicator of increased expression.
- the indicator of increased expression may indicate increased expression of one or more gene selected from Rad51APl, Kras, Rpa3, and Pabpc5 which reflects a decreased probability of survival of the patient relative to a probability of survival of patients without the increased expression.
- the indicator of increased expression indicates increased expression of one or more gene selected from CdknlA, Mapkl4, Poldl, and BcapSl which reflects an increased probability of survival of the patient relative to a probability of survival of patients without the increased expression.
- the indicator of differential expression is an indicator of decreased expression.
- the indicator of decreased expression indicates decreased expression of one or more gene selected from Rad51APl, Kras, RpaS, and Pabpc5, which reflects an increased probability of length of survival of the patient relative to a probability of length of survival of patients without the decreased expression.
- the indicator of decreased expression indicates increased expression of one or more gene selected from CdknlA, Mapkl4, Pold2, and Bcap31, which reflects an increased probability of length of survival of the patient relative to a probability of length of survival of patients without the decreased expression.
- the indicator of differential expression comprises increased expression of the CdknlB gene, which reflects a decreased probability of length of survival of the patient relative to a probability of length of survival of patients without the increased expression.
- the indicator of differential expression comprises increased expression of the Kras and Rad51APl genes and decreased expression of the CdknlA, and Mapkl4 genes, which reflects a decreased probability of length of survival of the patient relative to a probability of length of survival of patients without the differential expression.
- the indicator of differential expression comprises increased expression of the Pold2 gene and decreased expression of the RpaS gene, which reflects an increased probability of length of survival of the patient relative to a probability of length of survival of patients without the differential expression.
- the therapy comprises at least one of chemotherapy or radiotherapy.
- the mRNA level is measured by a technique selected from the group consisting of: northern blotting, gene expression profiling, serial analysis of gene expression, and any combination thereof.
- the gene product level is measured by a technique selected from the group consisting of enzyme-linked immunosorbent assay, fluorescence microscopy, and any combination thereof.
- a method of predicting a clinical response to platinum-based chemotherapy for a patient diagnosed with a cancer comprises obtaining a biological sample from a patient diagnosed with the cancer, said sample comprising nucleic acids from the patient; detecting in said nucleic acids a value of an indicator of a differential expression of at least one nucleotide sequence, each sequence having at least 90% sequence identity to at least one gene selected from CkdnlA, Mapkl4, Tnf, Rad51APl, CdknlB, Kras, Itpr2, Rpa3, Pold2, Pabpc5, and BcapSl; and estimating, by a processor and based on the value of the indicators of differential expression, the likelihood for the patient to have a beneficial clinical response to the platinum- based chemotherapy.
- the nucleotide sequence comprises DNA. In some embodiments, the nucleotide sequence comprises mRNA.
- the mRNA level is measured by a technique selected from the group consisting of: northern blotting, gene expression profiling, serial analysis of gene expression, and any combination thereof.
- the gene product level is measured by a technique selected from the group consisting of enzyme-linked immunosorbent assay, fluorescence microscopy, and any combination thereof.
- the indicator of differential expression is an indicator of increased expression.
- the indicator of increased expression indicates increased expression of one or more gene selected from Rad51APl, Kras, RpaS, and Pabpc5 which reflects a likelihood for the patient to have a beneficial clinical response to the platinum-based chemotherapy of the patient relative to a likelihood for patients without the increased expression.
- the indicator of increased expression indicates increased expression of one or more gene selected from CdknlA, Mapkl4, Pold2, and Bcap31 which reflects an increased likelihood for the patient to have a beneficial clinical response to the platinum-based chemotherapy relative to a likelihood for patients without the increased expression.
- the indicator of differential expression is an indicator of decreased expression.
- the indicator of decreased expression indicates decreased expression of one or more gene selected from Rad51APl, Kras, RpaS, and Pabpc5, which reflects an increased likelihood for the patient to have a beneficial clinical response to the platinum-based chemotherapy relative to a likelihood for patients without the decreased expression.
- the indicator of decreased expression indicates increased expression of one or more gene selected from CdknlA, Mapkl4, Pold2, and Bcap31, which reflects an increased likelihood for the patient to have a beneficial clinical response to the platinum-based chemotherapy relative to a likelihood for patients without the decreased expression.
- the indicator of differential expression comprises increased expression of the Kras and Rad51APl genes and decreased expression of the CdknlA, and Mapkl4 genes, which reflects a decreased likelihood for the patient to have a beneficial clinical response to the platinum-based chemotherapy relative to a likelihood for patients without the decreased expression.
- the indicator of differential expression comprises increased expression of the Poldl gene and decreased expression of the RpaS gene, which reflects an increased likelihood for the patient to have a beneficial clinical response to the platinum-based chemotherapy relative to a likelihood for patients without the decreased expression.
- an inhibitor in treating an ovarian serous cystadenocarcinoma (OV) tumor cell wherein said inhibitor (i) down-regulates the expression level of a nucleic acid sequence selected from the group consisting SEQ ID NO: 56, SEQ ID NO: 7, SEQ ID NO: 25, and SEQ ID NO: 27, or a combination thereof; or (ii) down- regulates the activity of an amino acid sequence selected from SEQ ID NO: 57, SEQ ID NO: 8, SEQ ID NO: 26, and SEQ ID NO: 28, or a combination thereof; and/or Use of an activator in treating an ovarian serous cystadenocarcinoma (OV) tumor cell, wherein said activator (i) up-regulates the expression level of a nucleic acid sequence selected from the group consisting of SEQ ID NO: 31, SEQ ID NO: 41, SEQ ID NO: 64, and SEQ ID NO: 70, or a combination thereof; or (ii) up-regulates the activity of an amino acid sequence selected from SEQ ID
- an inhibitor in the manufacture of a medicament for reducing the proliferation or viability of an ovarian serous cystadenocarcinoma (OV) tumor cell, wherein said inhibitor (i) down-regulates the expression level of nucleic acid sequence selected from the group consisting of SEQ ID NO: 56, SEQ ID NO: 7, SEQ ID NO: 25, or a combination thereof; or (ii) down-regulates the activity of an amino acid sequence selected from SEQ ID NO: 57, SEQ ID NO: 8, SEQ ID NO: 26, and SEQ ID NO: 28, or a combination thereof.
- an activator in the manufacture of a medicament for reducing the proliferation or viability of an ovarian serous cystadenocarcinoma (OV) tumor cell, wherein said activator (i) up-regulates the expression level of a nucleic acid sequence selected from the group consisting of SEQ ID NO: 31, SEQ ID NO: 41, SEQ ID NO: 64, and SEQ ID NO: 70, or a combination thereof; or (ii) up-regulates the activity of an amino acid sequence selected from SEQ ID NO: 32, SEQ ID NO: 42, SEQ ID NO: 65, and SEQ ID NO: 71, or a combination thereof.
- the cancer is an ovarian serous cystadenocarcinoma (OV) tumor.
- the cancer is selected from small cell lung cancer, non-small cell lung cancer, testicular cancer, stomach cancer, bladder cancer, colon cancer, breast cancer, adrenocortical cancer, anal cancer, endometrial cancer, non-Hodgkin lymphoma, melanoma, and head and neck cancers.
- a method for reducing the proliferation or viability of an ovarian serous cystadenocarcinoma (OV) tumor cell comprises contacting the cancer cell with (i) an inhibitor that down-regulates the expression level of a gene selected from the group consisting of Rad51APl, Kras, Rpa3, and Pabpc5, and a combination thereof; and/or (ii) an activator that up-regulates the expression level of a gene selected from the group consisting of CdknlA, Mapkl4, Pold2, and Bcap31, or a combination thereof.
- the inhibitor is an RNA effector molecule that down-regulates expression of a gene selected from the group consisting of Rad51APl, Kras, RpaS, and Pabpc5, or a combination thereof.
- the RNA effector molecule is an siRNA or shRNA that targets Rad51APl, Kras, Rpa3, and Pabpc5, or a combination thereof.
- non-transitory machine-readable mediums encoded with instructions executable by a processing system to perform a method of estimating an outcome for a patient having a high-grade ovarian serous cystadenocarcinoma (OV) tumor are provided.
- the instructions comprise code for: receiving a value of an indicator of a copy number of each of at least one nucleotide sequence, each sequence having at least 90 percent sequence identity to at least one of (i) a respective chromosome segment in cells of the OV, and (ii) at least one gene on the segment; and estimating, by a processor and based on the value, at least one of a predicted length of survival of the patient, a probability of survival of the patient, or a predicted response of the patient to a therapy for the OV.
- a method for treating a patient having ovarian serous cystadenocarcinoma comprises administering, in a patient diagnosed with OV, a treatment regimen based on predicted length of survival or clinical response to chemotherapy, wherein predicting estimated outcome or clinical response comprises: (1) detecting, in a biological sample from a patient having OV, differential expression of at least one of (a) a nucleic acid sequence having sequence identity to at least two of the genes selected from CkdnlA, Mapkl4, Kras, Rad51APl, Tnf, Itpr2, Rpa3, Pold2, Lig4, Pabpc5, Bcap31, and Gabre; (b) a protein encoded by one or more of the genes of (a); (c) a cytogenic band of one or more of the genes of (a) selected from the group consisting of bands 1-7 and 11-17; (d) one or more micro RNAs selected from miR-877, miR-877*, miR-200c, miR
- the at least one nucleic acid has sequence identity to one of the genes selected from CkdnlA, Mapkl4, Kras, Rad51APl , Tnf, Itpr2, Rpa3, Pold2, Lig4, Pabpc5, Bcap31 , and Gabre; and wherein the indicator of differential expression is differential copy number relative to a copy number of the at least one nucleic acid sequence in normal cells.
- the differential copy number is an increase or decrease in copy number relative to a copy number of the at least one nucleic acid sequence in normal cells.
- the at least one protein encoded by the genes of (a) is selected from CKDN1A, MAPK14, KRAS, RAD51AP1, TNF, ITPR2, RPA3, POLD2, LIG4, PABPC5, BCAP31, and GABRE; and the indicator of differential expression is differential protein expression relative to protein expression of the at least one protein in normal cells.
- the microRNA sequence is at least one of miR-877, miR-877*, miR- 200c, miR-141, miR-888, miR-452, and miR-224; and wherein the indicator of differential expression is differential copy number relative to a copy number of the at least one nucleotide sequence in normal cells.
- the differential copy number is an increase in copy number relative to a copy number of the at least one nucleotide sequence in normal cells.
- the differential copy number is a decrease in copy number relative to a copy number of the at least one nucleotide sequence in normal cells.
- the differential protein expression is an increase in protein expression relative to protein expression in normal cells.
- the differential protein expression is a decrease in protein expression relative to protein expression in normal cells.
- the differential copy number is an increase in copy number relative to a copy number of the at least one nucleotide sequence in normal cells.
- the differential copy number is a decrease in copy number relative to a copy number of the at least one nucleotide sequence in normal cells.
- the differential expression is microRNA expression.
- the differential microRNA expression is an increase in microRNA expression relative to microRNA expression of the at least one nucleotide sequence in normal cells.
- the differential microRNA expression is a decrease in microRNA expression relative to microRNA expression of the at least one nucleotide in normal cells.
- the differential expression of (c) further includes correlating copy- number loss of sequence tag site DXS214 and gain or mRNA overexpression of Bcap31 and Gabre with at least one of longer survival time and sensitivity of platinum-based chemotherapy.
- the method comprises correlating at least one of the indicators of differential expression selected from (al)-(dl) below:
- the method comprises correlating at least one of the indicators of differential expression selected from (a2)-(g2) below:
- the method comprises the differential expression of at least one of
- m2 a reduced abundance of Brcal -associated genome surveillance protein complex (BASC); with at least one of a patient's shorter survival time and resistance to platinum-based chemotherapy.
- BASC Brcal -associated genome surveillance protein complex
- the method comprises correlating at least one of the indicators of differential expression selected from (a)-(f), (al)-(dl), and (a2)-(e2).
- the method further comprises correlating at least one of:
- the method comprises: (i) correlating at least two of (2), (4), (6), (9)-(12), (14)-(16), (18), and (24);
- a method for treating a patient having ovarian serous cystadenocarcinoma comprises administering, in a patient having OV, a treatment regimen based on predicted length of survival or clinical response to chemotherapy, wherein the predicted length of survival or predicted clinical response to chemotherapy was derived from: detecting, in a biological sample from a patient having OV, a differential expression of at least one of (a) at least two nucleic acid sequences selected from the group consisting of SEQ ID NO: 1, SEQ ID NO: 7, SEQ ID NO: 21, SEQ ID NO: 25, SEQ ID NO: 27, SEQ ID NO: 29 , SEQ ID NO: 31, SEQ ID NO: 41, SEQ ID NO: 47, SEQ ID NO: 56, SEQ ID NO: 64, SEQ ID NO: 70, SEQ ID NO: 81, SEQ ID NO: 96; (b) at least one amino acid sequence encoded by one or more of (a); or (c) at least one micro RNA selected from SEQ ID NO
- the indicator of differential expression for the nucleic acid sequences is differential copy number relative to copy number of the nucleic acid sequences in normal cells.
- the differential copy number is an increase in copy number relative to a copy number of the nucleic acid sequences in normal cells.
- the differential copy number is a decrease in copy number relative to a copy number of the nucleic acid sequences in normal cells.
- the amino acid sequences is proteins selected from SEQ ID NO: 8, SEQ ID NO: 22, SEQ ID NO: 26, SEQ ID NO: 28, SEQ ID NO: 32, SEQ ID NO: 42, SEQ ID NO: 50, SEQ ID NO: 57, SEQ ID NO: 65, SEQ ID NO: 71, and SEQ ID NO: 82, SEQ ID NO: 97; and wherein the indicator of differential expression is differential protein expression relative to protein expression of the at least one protein in normal cells.
- the differential protein expression is an increase in protein expression relative to protein expression in normal cells.
- the differential protein expression is a decrease in protein expression relative to protein expression in normal cells.
- the microRNA sequence is at least one SEQ ID NO: 51, SEQ ID NO: 60, SEQ ID NO: 61, SEQ ID NO: 78, SEQ ID NO: 79, and SEQ ID NO: 80; and wherein the indicator of differential expression is differential copy number relative to a copy number of the at least one nucleic acid sequence in normal cells.
- the differential copy number is an increase in copy number relative to a copy number of the at least one nucleic acid sequence in normal cells.
- the differential copy number is a decrease in copy number relative to a copy number of the at least one nucleic acid sequence in normal cells.
- the microRNA sequence is at least one SEQ ID NO: 51, SEQ ID NO: 60, SEQ ID NO: 61, SEQ ID NO: 78, SEQ ID NO: 79, and SEQ ID NO: 80; and wherein the indicator of differential expression is differential microRNA expression relative to microRNA expression of the sequence in normal cells.
- the differential microRNA expression is an increase in microRNA expression relative to microRNA expression of the at least one nucleic acid sequence in normal cells.
- the differential microRNA expression is a decrease in microRNA expression relative to microRNA expression of the at least one nucleic acid in normal cells.
- the method further comprises correlating at least one of the indicators of differential expression selected from (a)-(f) below:
- the differential expression of (c) further includes correlating copy- number loss of sequence tag site DXS214 and gain or mRNA overexpression of Bcap31 and Gabre with at least one of longer survival time and sensitivity of platinum-based chemotherapy.
- the method comprises correlating at least one of the indicators of differential expression selected from (al)-(dl) below:
- the method comprises correlating at least one of the indicators of differential expression selected from (a2)-(g2) below:
- the method comprises the differential expression of at least one of
- the method comprises correlating at least one of the indicators of differential expression selected from (a)-(f), (al)-(dl), and (a2)-(e2).
- a method of treating a patient having a high-grade ovarian serous cystadenocarcinoma (OV) tumor comprises administering, in a patient having high-grade OV, a treatment regimen based on the predicted length of survival of the patient, wherein the predicting length of survival comprises: (1) detecting, in a biological sample from a patient having OV, an indicator of differential expression comprising at least two nucleic acid sequences selected from the group consisting of SEQ ID NO: 7, SEQ ID NO: 21, SEQ ID NO: 25, SEQ ID NO: 27, SEQ ID NO: 31, SEQ ID NO: 41, SEQ ID NO: 47, SEQ ID NO: 56, SEQ ID NO: 64, SEQ ID NO: 70, SEQ ID NO: 81, SEQ ID NO: 96; (b) level of expression of the nucleic acid sequences in (a); or (c) copy number of at least one of (a); and (2) calculating, by a processor, a weighted sum pattern based on
- the indicator of differential expression is an indicator of increased expression.
- the indicator of increase in expression indicates increased expression of at least two nucleic acid sequences selected from SEQ ID NO 56. SEQ ID NO: 7, SEQ ID NO: 25. SEQ ID NO: 27, SEQ ID NO: 31, SEQ ID NO: 41, SEQ ID NO: 64, and SEQ ID NO: 70, which reflects a decreased probability of survival of the patient relative to a probability of survival of patients without the increased expression.
- the indicator of differential expression is an indicator of decreased expression.
- the indicator of decreased expression indicates decreased expression of the nucleic acid sequences selected from SEQ ID NO: 31, SEQ ID NO: 41, SEQ ID NO: 64, SEQ ID NO: 56, SEQ ID NO: 7, SEQ ID NO: 25, SEQ ID NO 27, and SEQ ID NO: 70, which reflects an increased probability of length of survival of the patient relative to a probability of length of survival of patients without the decreased expression.
- the indicator of differential expression comprises increased expression of SEQ ID NO: 62, which reflects a decreased probability of length of survival of the patient relative to a probability of length of survival of patients without the increased expression.
- the indicator of differential expression comprises increased expression of SEQ ID NO: 7 and SEQ ID NO: 56 and decreased expression of SEQ ID NO: 31 and SEQ ID NO: 41 , which reflects a decreased probability of length of survival of the patient relative to a probability of length of survival of patients without the differential expression.
- the indicator of differential expression comprises increased expression of SEQ ID NO: 64 and decreased expression of SEQ ID NO: 25, which reflects an increased probability of length of survival of the patient relative to a probability of length of survival of patients without the differential expression.
- the treatment regimen comprises at least one of chemotherapy or radiotherapy.
- expression level of the nucleic acid sequences is measured by a technique selected from the group consisting of: northern blotting, gene expression profiling, serial analysis of gene expression, enzyme-linked immunosorbent assay, fluorescence microscopy, and any combination thereof.
- a method of treating a patient with a cancer comprises administering, in a patient diagnosed with a cancer, a treatment regimen based on clinical response to platinum-based chemotherapy, wherein predicting clinical response comprises: (1) detecting, in a biological sample from a patient having with OV, an indicator of differential expression consisting of at least two nucleotide sequences selected from of SEQ ID NO: 7, SEQ ID NO: 21, SEQ ID NO: 25, SEQ ID NO: 27, SEQ ID NO: 31, SEQ ID NO: 41, SEQ ID NO: 47, SEQ ID NO: 56, SEQ ID NO: 64, SEQ ID NO: 70, SEQ ID NO: 96; (b) level of expression of the nucleic acid sequences in (a); or (c) copy number of at least one of (a); and (2) calculating, by a processor, a weighted sum pattern based on the value of one or more indicators of differential expression; and (3) estimating, by the processor and based on the value of the indicators of differential expression, the
- the method comprises recommending one of (i) a platinum-based chemotherapy or (ii) an alternative treatment regimen based on the predicted clinical response to platinum-based chemotherapy. In embodiments, the method further comprises administering one of (i) a platinum-based chemotherapy or (ii) an alternative treatment regimen based on the predicted clinical response to platinum-based chemotherapy.
- the nucleotide sequence comprises DNA. In embodiments, the nucleotide sequence comprises mRNA.
- the indicator of differential expression is an indicator of increased expression. In embodiments, the indicator of increase in expression indicates increased expression of the nucleic acid sequences selected from SEQ ID NO: 31, SEQ ID NO: 41, SEQ ID NO: 64, SEQ ID NO: 56, SEQ ID NO: 7, SEQ ID NO: 25, SEQ ID NO: 27, and SEQ ID NO: 70 which reflects a likelihood for the patient to have a beneficial clinical response to the platinum-based chemotherapy of the patient relative to a likelihood for patients without the increased expression. In some embodiments, the indicator of differential expression is an indicator of decreased expression.
- the indicator of decreased expression indicates decreased expression of the nucleic acid sequences selected from SEQ ID NO: 56, SEQ ID NO: 7; SEQ ID NO: 25, SEQ ID NO: 27, which reflects an increased likelihood for the patient to have a beneficial clinical response to the platinum-based chemotherapy relative to a likelihood for patients without the decreased expression.
- the indicator of decreased expression indicates increased expression of the nucleic acid sequences selected from SEQ ID NO: 31, SEQ ID NO: 41, SEQ ID NO: 64, and SEQ ID NO: 70, which reflects an increased likelihood for the patient to have a beneficial clinical response to the platinum-based chemotherapy relative to a likelihood for patients without the decreased expression.
- the indicator of differential expression comprises increased expression of SEQ ID NO: 7 and SEQ ID NO: 56 and decreased expression of SEQ ID NO: 31 and SEQ ID NO: 41, which reflects a decreased likelihood for the patient to have a beneficial clinical response to the platinum-based chemotherapy relative to a likelihood for patients without the decreased expression.
- the indicator of differential expression comprises increased expression of SEQ ID NO: 64 and decreased expression of SEQ ID NO: 25, which reflects an increased likelihood for the patient to have a beneficial clinical response to the platinum-based chemotherapy relative to a likelihood for patients without the decreased expression.
- the cancer is an ovarian serous cystadenocarcinoma (OV) tumor.
- the cancer is selected from small cell lung cancer, non-small cell lung cancer, testicular cancer, stomach cancer, bladder cancer, colon cancer, breast cancer, adrenocortical cancer, anal cancer, endometrial cancer, non-Hodgkin lymphoma, melanoma, and head and neck cancers.
- a method for reducing the proliferation or viability of an ovarian serous cystadenocarcinoma (OV) tumor cell comprises contacting the cancer cell with (i) an inhibitor that down-regulates the expression level of a gene selected from the group consisting of SEQ ID NO: 56, SEQ ID NO: 7, SEQ ID NO: 25, SEQ ID NO: 27, and a combination thereof; and/or (ii) an activator that up-regulates the expression level of a gene selected from the group consisting of SEQ ID NO: 31, SEQ ID NO: 41, SEQ ID NO: 64, SEQ ID NO: 70, or a combination thereof.
- said inhibitor is an RNA effector molecule that down- regulates expression of a gene selected from the group consisting of SEQ ID NO: 56, SEQ ID NO: 7, SEQ ID NO: 25, SEQ ID NO: 27, or a combination thereof.
- said RNA effector molecule is an siRNA or shRNA that targets SEQ ID NO: 56, SEQ ID NO: 7, SEQ ID NO: 25, SEQ ID NO: 27, or a combination thereof.
- an inhibitor in treating an ovarian serous cystadenocarcinoma (OV) tumor cell, wherein said inhibitor (i) down-regulates the expression level of a gene selected from the group consisting of SEQ ID NO: 56, SEQ ID NO: 7, SEQ ID NO: 25, SEQ ID NO: 27, or a combination thereof; or (ii) down-regulates the activity of a protein selected from SEQ ID NO: 57, SEQ ID NO: 8, SEQ ID NO: 26, SEQ ID NO: 28, or a combination thereof.
- an activator in treating an ovarian serous cystadenocarcinoma (OV) tumor cell, wherein said activator (i) up-regulates the expression level of a gene selected from the group consisting of SEQ ID NO: 31, SEQ ID NO: 41, SEQ ID NO: 64, and SEQ ID NO: 70, or a combination thereof; or (ii) up-regulates the activity of a protein selected from SEQ ID NO: 32, SEQ ID NO: 42, SEQ ID NO: 65, and SEQ ID NO: 71, and a combination thereof.
- an inhibitor in the manufacture of a medicament for reducing the proliferation or viability of an ovarian serous cystadenocarcinoma (OV) tumor cell, wherein said inhibitor (i) down-regulates the expression level of a gene selected from the group consisting of SEQ ID NO: 56, SEQ ID NO: 7, SEQ ID NO: 25, and SEQ ID NO: 27, or a combination thereof; or (ii) down-regulates the activity of a protein selected from SEQ ID NO: 57, SEQ ID NO: 8, SEQ ID NO: 26, and SEQ ID NO: 28, or a combination thereof.
- an activator in the manufacture of a medicament for reducing the proliferation or viability of an ovarian serous cystadenocarcinoma (OV) tumor cell, wherein said activator (i) up-regulates the expression level of a gene selected from the group consisting of SEQ ID NO: 31, SEQ ID NO: 41, SEQ ID NO: 64, and SEQ ID NO: 70, or a combination thereof; or (ii) up-regulates the activity of a protein selected from SEQ ID NO: 32, SEQ ID NO: 42, SEQ ID NO: 65, and SEQ ID NO: 71, and a combination thereof.
- the indicator of differential expression is an indicator of decreased expression.
- the indicator of decreased expression indicates decreased expression of one or more gene selected from Rad51APl, Kras, RpaS, and Pabpc5, which reflects an increased likelihood for the patient to have a beneficial clinical response to the platinum-based chemotherapy relative to a likelihood for patients without the decreased expression.
- the indicator of decreased expression indicates increased expression of one or more gene selected from CdknlA, Mapkl4, Pold2, and Bcap31, which reflects an increased likelihood for the patient to have a beneficial clinical response to the platinum-based chemotherapy relative to a likelihood for patients without the decreased expression.
- the indicator of differential expression comprises increased expression of the Kras and Rad51APl genes and decreased expression of the CdknlA, and Mapkl4 genes, which reflects a decreased likelihood for the patient to have a beneficial clinical response to the platinum-based chemotherapy relative to a likelihood for patients without the decreased expression.
- the indicator of differential expression comprises increased expression of the Poldl gene and decreased expression of the RpaS gene, which reflects an increased likelihood for the patient to have a beneficial clinical response to the platinum-based chemotherapy relative to a likelihood for patients without the decreased expression.
- an inhibitor in treating an ovarian serous cystadenocarcinoma (OV) tumor cell wherein said inhibitor (i) down-regulates the expression level of a nucleic acid sequence selected from the group consisting SEQ ID NO: 56, SEQ ID NO: 7, SEQ ID NO: 25, and SEQ ID NO: 27, or a combination thereof; or (ii) down- regulates the activity of an amino acid sequence selected from SEQ ID NO: 57, SEQ ID NO: 8, SEQ ID NO: 26, and SEQ ID NO: 28, or a combination thereof; and/or Use of an activator in treating an ovarian serous cystadenocarcinoma (OV) tumor cell, wherein said activator (i) up-regulates the expression level of a nucleic acid sequence selected from the group consisting of SEQ ID NO: 31, SEQ ID NO: 41, SEQ ID NO: 64, and SEQ ID NO: 70, or a combination thereof; or (ii) up-regulates the activity of an amino acid sequence selected from SEQ ID
- an inhibitor in the manufacture of a medicament for reducing the proliferation or viability of an ovarian serous cystadenocarcinoma (OV) tumor cell, wherein said inhibitor (i) down-regulates the expression level of nucleic acid sequence selected from the group consisting of SEQ ID NO: 56, SEQ ID NO: 7, SEQ ID NO: 25, or a combination thereof; or (ii) down-regulates the activity of an amino acid sequence selected from SEQ ID NO: 57, SEQ ID NO: 8, SEQ ID NO: 26, and SEQ ID NO: 28, or a combination thereof.
- an activator in the manufacture of a medicament for reducing the proliferation or viability of an ovarian serous cystadenocarcinoma (OV) tumor cell, wherein said activator (i) up-regulates the expression level of a nucleic acid sequence selected from the group consisting of SEQ ID NO: 31, SEQ ID NO: 41, SEQ ID NO: 64, and SEQ ID NO: 70, or a combination thereof; or (ii) up-regulates the activity of an amino acid sequence selected from SEQ ID NO: 32, SEQ ID NO: 42, SEQ ID NO: 65, and SEQ ID NO: 71, or a combination thereof.
- normal cell refers to a cell that does not exhibit a disease phenotype.
- a normal cell refers to a cell that is not a tumor cell (non-malignant, non-cancerous, or without DNA damage characteristic of a tumor or cancerous cell).
- tumor cell refers to a cell displaying one or more phenotype of a tumor, such as OV.
- tumor refers to the presence of cells possessing characteristics typical of cancer- causing cells, such as uncontrolled proliferation, immortality, metastatic potential, rapid growth or proliferation rate, and certain characteristic morphological features.
- Normal cells can be cells from a healthy subject.
- normal cells can be non-malignant, non-cancerous cells from a subject having OV.
- the comparison of the mRNA level, the gene product level, or the copy number of a particular nucleotide sequence between a normal cell and a tumor cell can be determined in parallel experiments, in which one sample is based on a normal cell, and the other sample is based on a tumor cell.
- the mRNA level, the gene product level, or the copy number of a particular nucleotide sequence in a normal cell can be a pre-determined "control," such as a value from other experiments, a known value, or a value that is present in a database (e.g., a table, electronic database, spreadsheet, etc.).
- Figures 1A-1C are illustrations of high-level diagrams illustrating examples of tensors including biological datasets, according to some embodiments.
- Figure 2 is an illustration of a high-level diagram illustrating a linear transformation of a three- dimensional array, according to some embodiments.
- Figure 3 depicts diagrams illustrating tensor GSVD of patient-matched and platform- matched DNA copy-number profiles for the 6p+12p chromosome, according to some embodiments.
- Figure 4 depicts diagrams illustrating the tensor GSVD of TCGA patient-matched and platform-matched tumor and normal DNA copy-number profiles for the 7p chromosome, according to some embodiments.
- Figure 5 depicts diagrams illustrating the tensor GSVD of TCGA patient-matched and platform-matched tumor and normal DNA copy-number profiles for the Xq chromosome, according to some embodiments.
- Figure 6 depicts diagrams illustrating tumor-exclusive and platform-consistent DNA CNA correlated with OV patients' survival for the 6p+12p chromosome, according to some embodiments.
- Figure 7 depicts diagrams illustrating tumor-exclusive and platform-consistent DNA CNA correlated with OV patients' survival for the 7p chromosome, according to some embodiments.
- Figure 8 depicts diagrams illustrating tumor-exclusive and platform-consistent DNA CNA correlated with OV patients' survival for the Xq chromosome, according to some embodiments.
- Figure 9 is an illustration of bar charts illustrating the most significant probelets in tumor and normal data sets for the 6p+12p, 7p, and Xq chromosomes, according to some embodiments.
- the X-axis (a, c, e) is the tumor generalized fraction.
- the X-axis (b, d, f) is the normal generalized fraction.
- the Y-axis (all charts) are the subtensors.
- Figure 10 shows illustrations of graphs illustrating survival analyses of 249 patients classified by the standard OV indicators: tumor stage (a), residual disease (b), outcome of subsequent therapy (c) and neoplasm status (d), according to some embodiments.
- Figure 11 shows illustrations of graphs illustrating survival analyses of the validation set of patients classified by the standard OV indicators: tumor stage (a), residual disease (b), outcome of subsequent therapy (c) and neoplasm status (d), according to some embodiments.
- Figure 12 is a diagram illustrating survival analyses of discovery and validation sets of patients classified by GSVD or tensor GSVD and tumor stage at diagnosis, according to some embodiments.
- Figures 13A-13I are diagrams illustrating survival analyses of platinum-based chemotherapy patients in a discovery set (Figs. 13A-13F) and a validation set (Figs. 13G-13I) of a number of patients classified by tensor GSVD (Figs. 13A-13C) or tensor GSVD and tumor stage at diagnosis (Figs. 13D-13I), according to some embodiments.
- X-axis (all graphs) survival time (months);
- Y-axis (all graphs) Fraction of surviving patients.
- Figures 1 A-14C are diagrams illustrating survival analyses of a validation set of a number of patients classified by tensor GSVD and tumor stage at diagnosis, according to some embodiments.
- X-axis all graphs: survival time (months);
- Y-axis anterior graphs: Fraction of surviving patients,
- Figures 15A-15I are diagrams illustrating survival analyses of the fraction of surviving platmum-based chemotherapy patients in the discovery set classified by tensor GSVD and residual disease (Figs. 15A-15C), tensor GSVD and therapy outcome (Figs. 15D-15F), or tensor GSVD and neoplasm status (Figs. 1.5G-15I), according to some embodiments.
- Figures 16A-16I are diagrams illustrating survival analyses of the fraction of surviving platinum-based chemotherapy patients in the discovery set of a number of patients classified by tensor GSVD and residual disease (Figs. 16A-16C), tensor GSVD and therapy outcome (Figs. 16D-1.6F), or tensor GSVD and neoplasm status (Figs. 16G-16I), according to some embodiments.
- X-axis all graphs
- survival time months
- Y-axis (ail graphs): Fraction of survi ing patients.
- Figures 17A-17F are diagrams illustrating the Kaplan-Meier (KM) curves for survival analyses of discovery and validations sets of patients classified by copy number changes in selected segments, according to some embodiments.
- X-axis (ail graphs) survival time (months);
- Figure 18 is a diagram illustrating survival analyses of discovery and validation sets of patients classified by 6p+12p, 7p, and Xq tensor GSVD combined, according to some embodiments.
- Figures 19A-19X are diagrams illustrating differences in relative inRNA expression between the tensor GSVD classes for selected segments, according to some embodiments.
- X- axis (all graphs): high or low x-probelet coefficient or arraylet correlation
- Y-axis (all graphs): relative niR A expression.
- Figures 20A-2QH are diagrams illustrating differences in relative microRNA expression between the tensor GSVD classes for selected segments, according to some embodiments.
- X- axis (all graphs): high or low x-probelet coefficient or arraylet correlation
- Y-axis (all graphs): relative mRNA expression.
- Figures 2I A-21B are diagrams illustrating differences in relative protein expression between the tensor GSVD classes for selected segments, according to some embodiments.
- X- axis (all graphs): high or low x-probelet coefficient or arraylet correlation
- Y-axis (all graphs): relative protein expression.
- Ovarian serous cystadenocarcinoma is a tumor arising from epithelial cells and originating in the ovaries. OV tumors are typically categorized according to their stage.
- the most common adopted staging system for ovarian cancer including OV tumors is the FIGO staging system: stage I tumors are limited to the ovaries, stage II tumors involve one or both ovaries with pelvic extension; stage III tumors involve one or both ovaries with peritoneal implants outside the pelvis or with retroperitoneal lymph node metastasis; stage IV tumors present with distant metastases, including liver parenchyma (Radiopaedia.org).
- OV tumors are further categorized according to their grade, as determined by pathologic evaluation of the tumor; residual macroscopic disease after surgery, outcome of subsequent therapy, i.e. complete remission or not, and neoplasm status, i.e., with or without tumor.
- Low-grade tumors (WHO grade II) are well-differentiated (not anaplastic), portending a better prognosis.
- High-grade (WHO grade III-IV) tumors are undifferentiated or anaplastic; these are malignant and carry a worse prognosis.
- the best predictor of an OV patient's survival has been tumor stage, i.e. the spread of disease at diagnosis. Additional indicators, such as the residual disease after surgery, the outcome of subsequent therapy, and the neoplasm status, which is the last known status of the disease, are determined during treatment. Other factors considered for more favorable prognosis include younger age, cell type other than mucinous and clear cell, smaller disease volume, and absence of ascites.
- the subject technology provides tensor mathematical models that can compare and integrate different types of large-scale molecular biological datasets, such as, but not limited to, mRNA expression levels, DNA microarray data, DNA copy number alterations, protein expression, etc.
- Additional possible applications of the tensor GSVD in personalized medicine include comparative modeling of two patient- and tissue-matched datasets, each corresponding to (i) a set of large-scale molecular biological profiles, e.g., DNA copy numbers, acquired by a high- throughput technology, e.g., DNA microarrays; (ii) a set of biomedical images or signals; or (iii) a set of cellular pathological observations, e.g., a tumor's stage.
- Such tensor GSVD comparative models can uncover variations across the patients and tissues that are common to, possibly causally coordinated between the two aspects of the disease. In clinical settings, such tensor GSVD comparative models can determine an individual patient's medical status in relation to all the other patients in a set, and inform the patient's diagnosis, prognosis and treatment.
- Figures 1A-1C are high-level diagrams illustrating suitable examples of tensors 100, according to some embodiments of the subject technology.
- a tensor representing a number of biological datasets may comprise an N -order tensor including a number of multidimensional (e.g., two or three dimensional) matrices. Datasets may relate to biological information as shown in Figure 1.
- An N th -order tensor may include a number of biological datasets. Some of the biological datasets may correspond to one or more biological samples. Some of the biological dataset may include a number of biological data arrays, some of which may be associated with one or more subjects.
- tensor represents a third order tensor (i.e., a cuboid), in which each dimension (e.g., gene, conditions, and time) represents a degree of freedom in the cuboid. If the cuboid is unfolded into a matrix, these degrees of freedom and along with it, most of the data included in the tensor may be lost.
- a cuboid a third order tensor
- decomposing the cuboid using a tensor decomposition technique such as a higher- order eigen-value decomposition (HOEVD) or a higher-order single value decomposition (HOSVD) may uncover patterns of variations (e.g., of mRNA expression) across genes, time points and conditions.
- a tensor decomposition technique such as a higher- order eigen-value decomposition (HOEVD) or a higher-order single value decomposition (HOSVD) may uncover patterns of variations (e.g., of mRNA expression) across genes, time points and conditions.
- the tensor is a biological dataset that may be associated with genes across one or more organisms. Each data array also includes cell cycle stages.
- the tensor decomposition may allow, for example, the integration of global mRNA expressions measured for one or more organisms, the removal of experimental artifacts, and the identification of significant combinations of patterns of expression variation across the genes, for various organisms and for different cell cycle stages.
- the tensor contains biological datasets associated with a network K of N-genes by N-genes.
- the network K represents the number of studies on the genes.
- the tensor decomposition e.g., HOEVD
- the tensor decomposition may allow, for example, uncovering important relationships among the genes (e.g., pheromone- response-dependent relation or orthogonal cell-cycle-dependent relation).
- An example of a tensor comprising a three-dimensional array is discussed below in reference to Figure 2.
- FIG 2 is a high-level diagram illustrating a linear transformation of a number of two dimensional (2-D) arrays forming a three-dimensional (3-D) array 200, according to some embodiments.
- the 3-D array 200 may be stored in a memory.
- the 3-D array 200 may include an N number of biological datasets (e.g., Dl, D2, and D3) that correspond to, for example, genetic sequences.
- the 3-D array 200 may comprise an N number of 2-D data arrays (Dl , D2, D3, ... D ) (for clarity only D1-D3 are shown in Figure 2).
- N is equal to 3.
- this is not intended to be limiting as N may be any number (1 or greater).
- N is greater than 2.
- each biological dataset may correspond to a tissue type and include an M number of biological data arrays.
- Each biological data array may be associated with a patient or, more generally, an organism.
- Each biological data array may include a plurality of data units (e.g., genes, chromosome segments, chromosomes).
- Each 2-D data array can store one set of the biological datasets and includes M columns. Each column can store one of the M biological data arrays corresponding to a subject such as a patient.
- a linear transformation such as a tensor decomposition algorithm may be applied to the 3-D array 200 to generate a plurality of eigen 2-D arrays 220, 230, and 240.
- the eigen 2-D arrays 220, 230, and 240 can then be analyzed to determine one or more characteristics related to a disease.
- Each data array generally comprises measurable data.
- each data array may comprise biological data that represent a physical reality such as the specific stage of a cell cycle.
- the biological data may be measured by, for example, DNA microarray technology, sequencing technology, protein microarray, mass spectrometry in which protein abundance levels are measured on a large proteomic scale as well as traditional measurement technologies (e.g., immunohistochemical staining).
- Suitable examples of biological data include, but are not limited to, mRNA expression level, gene product level, DNA copy number, micro-RNA expression, presence of DNA methylation, binding of proteins to DNA or RNA, protein expression, and the like.
- the biological data may be derived from a patient-specific sample including a normal tissue, a disease-related tissue or a culture of a patient's cell (normal and/or disease-related).
- the biological datasets may comprise genes from one or more subjects along with time points and/or other conditions.
- a tensor decomposition of the N ⁇ -order tensor may allow for the identification of abnormal patterns (e.g., abnormal copy number variations) in a subject.
- these patterns may identify genes that may correlate or possibly coordinate with a particular disease. Once these genes are identified, they may be useful in the diagnosis, prognosis, and potentially treatment of the disease.
- a tensor decomposition may identify genes that enables classification of patients into subgroups based on patient-specific genomic data.
- the tensor decomposition may allow for the identification of a particular disease subtype.
- the subtype may be a patient's increased response to a therapeutic method such as chemotherapy, lack of increased response to chemotherapy, increased life expectancy, lack of increased life expectancy and the like.
- the tensor decomposition may be advantageous in the treatment of patient's disease by allowing subgroup- or subtype-specific therapies (e.g., chemotherapy, surgery, radiotherapy, etc.) to be designed.
- these therapies may be tailored based on certain criteria, such as, the correlation between an outcome of a therapeutic method and a global genomic predictor.
- the tensor decomposition may also predict a patient's survival.
- An N ⁇ -order tensor may include a patient's routine examinations data, in which case decomposition of the tensor may allow for the designing of a personalized preventive regimen for the patient based on analyses of the patient's routine examinations data.
- the biological datasets may be associated with imaging data including magnetic resonance imaging (MRI) data, electro cardiogram (ECG) data, electromyography (EMG) data or electroencephalogram (EEG) data.
- a biological datasets may also be associated with vital statistics, phenotypical data, as well as molecular biological data (e.g., DNA copy number, mRNA expression level, gene product level, etc.).
- prognosis may be estimated based on an analysis of the biological data in conjunction with traditional risk factors such as, age, sex, race, etc.
- Tensor decomposition may also identify genes useful for performing diagnosis, prognosis, treatment, and tracking of a particular disease. Once these genes are identified, the genes may be analyzed by any known techniques in the relevant art. For example, in order to perform a diagnosis, prognosis, treatment, or tracking of a disease, the DNA copy number may be measured by a technique such as, but not limited to, fluorescent in-situ hybridization, complementary genomic hybridization, array complementary genomic hybridization, and fluorescence microscopy. Other commonly used techniques to determine copy number variations include, e.g.
- oligonucleotide genotyping sequencing, southern blotting, dynamic allele-specific hybridization (DASH), paralogue ratio test (PRT), multiple amplicon quantification (MAQ), quantitative polymerase chain reaction (QPCR), multiplex ligation dependent probe amplification (MLPA), multiplex amplification and probe hybridization (MAPH), quantitative multiplex PCR of short fluorescent fragment (QMPSF), dynamic allele- specific hybridization, fluorescence in situ hybridization (FISH), semiquantitative fluorescence in situ hybridization (SQ-FISH) and the like.
- DASH dynamic allele-specific hybridization
- PRT paralogue ratio test
- MAQ multiple amplicon quantification
- QPCR quantitative polymerase chain reaction
- MLPA multiplex ligation dependent probe amplification
- MAH multiplex amplification and probe hybridization
- QMPSF quantitative multiplex PCR of short fluorescent fragment
- FISH fluorescence in situ hybridization
- SQ-FISH semiquantitative fluorescence in situ hybridization
- the mRNA level may be measured by a technique such as, northern blotting, gene expression profiling, and serial analysis of gene expression. Other commonly used techniques include RT-PCR and microarray technology.
- a microarray is hybridized with differentially labeled RNA or DNA populations derived from two different samples. Ratios of fluorescence intensity (red/green, R/G) represent the relative expression levels of the mRNA corresponding to each cDNA/gene represented on the microarray.
- Realtime polymerase chain reaction also called quantitative real time PCR (QRT-PCR) or kinetic polymerase chain reaction
- QRT-PCR quantitative real time PCR
- kinetic polymerase chain reaction may be highly useful to determine the expression level of a mRNA because the technique can simultaneously quantify and amplify a specific part of a given polynucleotide.
- the gene product level may be measured by a technique such as, enzyme-linked immunosorbent assay (ELISA) and fluorescence microscopy.
- ELISA enzyme-linked immunosorbent assay
- fluorescence microscopy When the gene product is a protein, traditional methodologies for protein quantification include 2-D gel electrophoresis, mass spectrometry and antibody binding. Commonly used antibody-based techniques include immunoblotting (western blotting), immunohistological assay, enzyme linked immunosorbent assay (ELISA), radioimmunoassay (RIA), or protein chips. Gel electrophoresis, immunoprecipitation and mass spectrometry may be carried out using standard techniques, for example, such as those described in Molecular Cloning A Laboratory Manual, 2nd Ed., ed.
- the tensor decomposition of the N th -order tensor may allow for the removal of normal pattern copy number alterations and/or an experimental variation from a genomic sequence.
- a tensor decomposition of the N th -order tensor may permit an improved prognostic prediction of the disease by revealing real disease-associated changes in chromosome copy numbers, focal copy number alterations (CNAs), non-focal CNAs and the like.
- a tensor decomposition of the N th -order tensor may also allow integrating global mRNA expressions measured in multiple time courses, removal of experimental artifacts, and identification of significant combinations of patterns of expression variation across genes, time points and conditions.
- applying the tensor decomposition algorithm may comprise applying at least one of a higher-order singular value decomposition (HOSVD), a higher-order generalized singular value decomposition (HO GSVD), a higher-order eigen-value decomposition (HOEVD), or parallel factor analysis (PARAFAC) to the N th -order tensor.
- HOSVD higher-order singular value decomposition
- HO GSVD higher-order generalized singular value decomposition
- HOEVD higher-order eigen-value decomposition
- PARAFAC parallel factor analysis
- HOSVD may be utilized to decompose a 3-D array 200, as described in more detail herein.
- eigen 2-D arrays generated by HOSVD may comprise a set of N left-basis 2-D arrays 220.
- Each of the left-basis arrays 220 (e.g., Ul, U2, U3, ... L1 ⁇ 2) (for clarity, only U1-U3 are shown in Figure 2) may correspond, for example, to a tissue type and can include an M number of columns, each of which stores a left-basis vector 222 associated with a patient.
- the eigen 2-D arrays 230 comprise a set of N diagonal arrays ( ⁇ 1, ⁇ 2, ⁇ 3 ... ⁇ N) (for clarity only ⁇ 1- ⁇ 3 are shown in Figure 2).
- Each diagonal array (e.g., ⁇ 1, ⁇ 2, ⁇ 3 ... or ⁇ N) may correspond to a tissue type and can include an N number of diagonal elements 232.
- the 2-D array 240 comprises a right-basis array, which can include a number of right-basis vectors 242.
- decomposition of the N th -order tensor may be employed for disease related characterization such as identifying genes or chromosomal segments useful for diagnosing, tracking a clinical course, estimating a prognosis or treating the disease.
- the biological data characterization system may be a computer system as known in the art.
- the system will typically include a processor, memory, an analysis module, and a display module.
- the processor may include one or more processors and may be coupled to the memory.
- Information related to the N th -order tensors 100 of Figure 1 or the 3-D array 200 of Figure 2 may be retrieved from a database coupled to the system and store tensors 100 or the 3-D array 200 along with 2-D eigen-arrays 220, 230, and 240 of Figure 2.
- a database may be coupled to the system via a network (e.g., Internet, wide area network (WAN), local area network (LAN), etc.).
- the system may encompass the database.
- the processor can apply a tensor decomposition algorithm, such as HOSVD, HO GSVD, or HOEVD, to tensor 100 or 3-D array 200 in order to generate eigen 2-D arrays 220, 230 and 240.
- the processor may apply the HOSVD or HO GSVD algorithms to data obtained from array comparative genomic hybridization (aCGH) of patient- matched normal and ovarian serous cystadenocarcinoma (OV) blood samples (see Example 2).
- aCGH array comparative genomic hybridization
- OV cystadenocarcinoma
- Application of HOSVD algorithm may remove one or more normal pattern copy number alterations (PCAs) or experimental variations from the aCGH data.
- PCAs normal pattern copy number alterations
- a HOSVD algorithm can also reveal OV-associated changes in at least one of chromosome copy numbers, focal CNAs, and unreported CNAs existing in the aCGH data. Analysis may be performed for disease related characterizations as discussed above. For example, various analyses of eigen 2-D arrays 230 of Figure 2 may be facilitated by assigning each diagonal element 232 of Figure 2 to an indicator of a significance of a respective element of a right-basis vector 222 of Figure 2, as described herein in more detail.
- a display module 240 can display 2-D arrays 220, 230, 240 and any other graphical or tabulated data resulting from analyses performed by an analysis module.
- a display module may comprise software and/or firmware and may use one or more display units such as cathode ray tubes (CRTs) or flat panel displays.
- a method for genomic prognostic prediction includes storing the N th -tensors 100 of Figure 1 or 3-D array 200 of Figure 2 in a memory.
- a tensor decomposition algorithm such as HOSVD, HO GSVD or HOEVD may be applied by a processor to the datasets stored in tensors 100 or 3-D array 200 to generate eigen 2- D arrays 220, 230, and 240 of Figure 2.
- a generated eigen 2-D arrays 220, 230, and 240 may be analyzed, e.g. by an analysis module, to determine one or more disease-related characteristics.
- a HOSVD algorithm is mathematically described herein with respect to N >2 matrices (i.e., arrays DI-D ) of 3-D array 200.
- Each matrix can be a real mi x n matrix.
- the ratio ⁇ / ⁇ indicates the significance of Vk in Di relative to its significance in D j .
- an eigenvalue 1 corresponds to a right basis vector Vk of equal significance in all matrices Di and D j for all i and j when the corresponding left basis vector 3 ⁇ 4k is orthonormal to all other left basis vectors in Ui for all i.
- Detailed description of various analysis results corresponding to application of the HOSVD to a number of datasets obtained from patients and other subjects will be discussed below. For clarity, a more detailed treatment of the mathematical aspects of HOSVD is skipped here but provided in the attached Appendices A, B, and C.
- a HOEVD tensor decomposition method can be used for decomposition of higher order tensors.
- the HOEVD tensor decomposition method is described in relation with a the third-order tensor of size K-networks x N-genes x N-genes as follows:
- HEVD Higher-Order EVD
- This HOEVD formulates each individual network in the tensor ⁇ fe ⁇ as a linear superposition of this series of M rank-1 symmetric decorrelated subnetworks and the series of M(M- 1)12 rank-2 symmetric couplings among these subnetworks (Fig. 7 in Supporting Appendix), such that M M
- the sign of this fraction indicates the direction of the coupling, such that p k m > 0 corresponds to a transition from the Ith to the mth subnetwork and p k m ⁇ 0 corresponds to the transition from the mth to the metric distribution of the annotations among the N-genes and the subsets of n _ ⁇ N genes with largest and smallest levels of expression in this eigenarray.
- the corresponding eigengene might be inferred to represent the corresponding biological process from its pattern of expression.
- the most likely association of a subnetwork with a pathway or of a coupling between two subnetworks with a transition between two pathways is that which corresponds to the smallest P value.
- each eigenarray with most likely cellular states, or none thereof, assuming hypergeometric distribution of the annotations among the N-genes and the subsets of n _ ⁇ N genes with largest and smallest levels of expression in this eigenarray.
- the corresponding eigengene might be inferred to represent the corresponding biological process from its pattern of expression.
- a higher-order EVD (HOEVD) of the third-order series of the three networks ⁇ a l5 a 2 , a 3 ⁇ .
- the network a 3 is the pseudo inverse projection of the network x onto a genome-scale proteins' DNA-binding basis signal of 2,476-genes x 12-samples of development transcription factors [3] (Mathematica Notebook 3 and Data Set 4), computed for the 1,827 genes at the intersection of ⁇ ⁇ and the basis signal.
- the HOEVD is computed for the 868 genes at the intersection of x , d 2 and a 3 .
- This tensor HOEVD is different from the tensor higher-order SVD [14-16] for the series of symmetric nonnegative matrices a 2 , a 3 ⁇ .
- the subnetworks correlate with the genomic pathways that are manifest in the series of networks. The most significant subnetwork correlates with the response to the pheromone. This subnetwork does not contribute to the expression correlations of the cell cycle- projected network a 2 , where e
- the second and third subnetworks correlate with the two pathways of antipodal cell cycle expression oscillations, at the cell cycle stage Gi vs. those at G 2 , and at S vs. M, respectively.
- the couplings correlate with the transitions among these independent pathways that are manifest in the individual networks only.
- the coupling between the first and second subnetworks is associated with the transition between the two pathways of response to pheromone and cell cycle expression oscillations at Gi vs. those G 2 , i.e., the exit from pheromone- induced arrest and entry into cell cycle progression.
- the coupling between the first and third subnetworks is associated with the transition between the response to pheromone and cell cycle expression oscillations at S vs.
- a tensor GSVD arranged in two higher-than-second-order tensors of matched column dimensions but independent row dimensions is used in the methods herein.
- a more detailed treatment of the mathematical aspects of this tensor GSVD provided in the attached Appendix A.
- This tensor GSVD simultaneously separates the paired datasets into weighted sums of L paired "subtensors," i.e., combinations or outer products of three patterns each: Either one tumor-specific pattern of copy-number variation across the tumor probes, i.e., a "tumor arraylet” Mi a, or the corresponding normal-specific pattern across the normal probes, i.e., the "normal array let” « 2 ⁇ 3 , combined with one pattern of copy-number variation across the patients, i.e., an "x- probelet” v T x b and one pattern across the platforms, i.e., a "y-probelet” v j_ c , which are identical for both the tumor and normal datasets (see Figs. 3-5),
- X a Ui, X ⁇ ,V X and X c V y denote tensor-matrix multiplications, which contract the L -arraylet, L-x-probelet, and - -probelet dimensions of the "core tensor" 7 ⁇ i with those of U V x , and V y , respectively, and where ® denotes an outer product.
- T k;m, - - ⁇ ) Ui x ⁇ ;x V T X ,
- the x- and -row bases vectors are, in general, non-orthogonal but normalized, and V x and V y are invertible.
- the generalized singular values are positive, and are arranged in ⁇ ⁇ ix , and ⁇ iy in decreasing orders of the corresponding "GSVD angular distances," i.e., decreasing orders of the ratios ⁇ 3 ⁇ 4 ⁇ ,/ ⁇ 3 ⁇ 4 ⁇ ,, and oi yc l 2 c , respectively.
- the "tensor generalized singular values" 3 ⁇ 4, a z >c tabulated in the core tensors are real but not necessarily positive.
- Our tensor GSVD construction generalizes the GSVD to higher orders in analogy with the generalization of the singular value decomposition (SVD) by the HOSVD, and is different from other approaches to the decomposition of two tensors.
- the tensor GSVD exists for two tensors of any order because it is constructed from the GSVDs of the tensors unfolded into full column-rank matrices (Lemma A Example 5).
- the tensor GSVD has the same uniqueness properties as the GSVD, where the column bases vectors u a and the row bases vectors u T x b and V y C are unique, except in degenerate subspaces, defined by subsets of equal generalized singular values a a ix , and o iy , respectively, and up to phase factors of ⁇ 1, such that each vector captures both parallel and antiparallel patterns (Lemma B in SI Appendix).
- the tensor GSVD of two second-order tensors reduces to the GSVD of the corresponding matrices (see Example 5).
- the tensor GSVD of the tensor Z3 ⁇ 4 6 M iMxi xM , which row mode unfolding gives the identity matrix Di l E LM LM , and a tensor 3 ⁇ 4 of the same column dimensions reduces to the HOSVD of 3 ⁇ 4 (Theorem A in Example 5).
- the row mode GSVD angular distances satisfy ⁇ ⁇ 6 [- ⁇ /4, ⁇ /4].
- the angular distance ⁇ ⁇ which is a function of the arctangent of the ratio, i.e., arctan( i i£l / 2i£l ), is the natural function to use, because the GSVD is related to the cosine-sine (CS) decomposition, as previously described, and, thus, a ⁇ a and ⁇ 2, ⁇ are related to the sine and the cosine functions of the angle ⁇ ⁇ , respectively.
- a tensor GSVD i.e., an exact simultaneous decomposition of datasets, arranged in two higher-than-second-order tensors of matched column dimensions but independent row dimensions is used to create a model for OV.
- a method for predicting the survival of OV patients and/or predicting an OV patient's response to a therapy such as platinum-based chemotherapy.
- analysis of changes in genomic features e.g. copy number alterations, changes in protein expression, and changes in mRNA expression
- the therapy is a platinum-based chemotherapy and the methods are used to predict a clinical response to the chemotherapy.
- indicators of differential expression here CNA
- Figs. 6-8 show mathematical patterns extracted from measured, biological data.
- Figs. 6-8 show across a region of DNA probes, a weighted sum of the pattern of CNAs for the relevant chromosome.
- Fig. 6 shows the increase or decrease in CNA for Tnf, Mapkl4, CdkNIA, Rad51APl, Prim2, CdknlB, Sox5, Kras, Asun, Itpr2, miR-877, miR-200c, and miR-141 having at least one segment on the 6p or 12p chromosome.
- Fig. 7 shows the increase or decrease in CNA for Rpa3 and Pold2 having at least one segment on the 7p chromosome.
- At least some segments comprising at least one of Tnf, Mapkl4, CdkNlA, RadSlAPl, Prim2, CdknlB, Sox5, Kras, Asun, Itprl, RpaS, Poldl, Pabpc5, Bcap31, miR-877, miR-200c, miR-141, miR-888, miR-224, and miR-452 are differentially expressed.
- the antisense of the microRNA sequence (designated by *) is differentially expressed.
- Table 1 Cox univariate proportional hazard models of the discovery and validation sets of patients classified by any one of the tensor GSVDs or the standard OV indicators.
- Table 2 Cox bivariate proportional hazard models of the patients in the discovery and validation sets classified by both tensor GSVD and the standard OV indicators. Chromosome Arm Predictor Discovery and Validation Sets
- survival analyses of the discovery set classified by the 6p+12p tensor GSVD into high and low x-probelet coefficients, and by pathology at diagnosis into tumor stages I-II and III-IV give the bivariate Cox hazard ratios of 1.5 and 4.0, which are similar to the corresponding univariate ratios of 1.7 and 4.4, respectively.
- survival analyses of the validation set classified by the 6p+12p tensor GSVD into high and low array let correlation coefficients, and by pathology at diagnosis into tumor stages III and IV give the bivariate Cox hazard ratios of 1.9 and 1.8, which are the same as the corresponding univariate ratios (Fig. 14).
- the Kaplan-Meier (KM) median survival time difference of 61 months among the discovery set of patients classified by both the 6p+12p tensor GSVD and stage is about 85% and more than two years greater than the 33 month difference between the patients classified by stage alone.
- the KM median survival difference of 34 months among the validation set of patients classified by both the 6p+12p tensor GSVD and stage is about 62% and more than one year greater than the 21 month difference between the patients classified by stage alone.
- the discovery set of patients reflects the general OV patient population, with approximately 5%, 7%, 76%, and 12% of the patients diagnosed at stages I, II, III, and IV, respectively
- the validation set reflects the high-stage OV patient population, with approximately 20% and 80% of the patients diagnosed at stages III and IV, respectively.
- the 6p+12p, 7p, and Xq tensor GSVDs therefore, predict survival both in the general as well as in the high-stage OV patient population.
- the discovery and validation sets each include mostly, i.e., >95% high-grade, i.e., grades 2 and higher tumors. Tumor grade does not correlate with survival in either the discovery or the validation set of patients.
- the differential mRNA expression of genes from these enriched ontologies that are located on any one of the chromosome arms is consistent with the CNAs across that arm. Genes that map to amplifications or deletions on any one pattern, are overexpressed or underexpressed, respectively, in the patients which tumor profiles are classified as highly similar to that pattern.
- the differential expression of all microRNAs and proteins that map to any one of the chromosome arms is also consistent with the CNAs across that arm.
- Example 2 As described in Example 2, three groups of significantly different prognoses among the discovery and, separately, validation set of patients, as well as only the platinum-based chemotherapy patients, were observed and classified by a combination of the three, i.e., 6p+12p, 7p, and Xq, tensor GSVD classifications, each of which is binomial (Fig. 18).
- group A a combination of a low 6p+12p x-probelet coefficient or array let correlation, and high 7p and Xq x-probelet coefficients or arraylet correlations is indicative of a patient's significantly longer survival time and better response to platinum-based chemotherapy.
- group B the three combinations where just one of the three binomial classifications differs from that of group A, indicate shorter survival time and worse response to chemotherapy than those of group A.
- group C the four combinations where at least two of the three binomial classifications differ from that of group A, indicate shorter survival time and worse response to chemotherapy than those of group B as well as group A.
- the KM median survival times of the discovery set of patients classified into groups A, B, and C are 86, 52, and 36 months, such that the median survival time of group A is more than four years greater than, and more than twice that of group C.
- OV tumors exhibit significant CNA variation among them, much more so than, e.g., GBM brain tumors. Very few frequently occurring OV CNAs have been identified to date. In one aspect, CNAs for predicting OV survival are provided.
- the three tensor GSVD arraylets include most known OV-associated CNAs that map to the corresponding chromosome arms, and several previously unreported yet frequent CNAs in >23% of the patients.
- the 6p+12p arraylet includes two segments corresponding to the only known OV focal CNAs that map to 6p+12p, 7p, or Xq (see Example 3).
- the three arraylet patterns include novel frequent focal CNAs (segments ⁇ 125 probes). Among these, four amplifications and two deletions are significantly correlated with OV survival (Fig. 17). The amplifications flank the segment that contains Kras. Two consecutive segments (12pl2.1) contain the 5' ends of isoforms a and e of Sox5, and exons 5 and 6, the first exons that are common to isoforms a, b, d, and e of Sox5. Two other consecutive segments (12pl l.23) contain the inositol 1,4,5-trisphosphate receptor type 2- encoding Itpr2, and the asunder spermatogenesis regulator-encoding Asun.
- the present methods provide patterns of differential expression, which may be used to predict or determine an outcome for the patient.
- the outcome is at least one of a predicted length of survival or a clinical response to therapy.
- the therapy is administration of an alkylating agent.
- administration of the alkylating agent comprises a chemotherapy.
- the chemotherapy is a platinum- based chemotherapy.
- Differential expression is with reference to genomic features, including, but not limited to genes, proteins encoded by the genes, and mRNA.
- differential expression is measured by at least one of gene expression, mRNA expression, protein expression, etc.
- differential expression refers to CNA for a genomic feature.
- the differential expression comprises DNA copy-number loss or gain, mRNA overexpression or underexpression, microRNA overexpression or underexpression, or protein overexpression or underexpression for a genomic feature.
- differential expression refers to a genomic feature of at least one of the 6p+12p, 7p or Xq chromosomes.
- differential expression of a genomic feature for 6p+12p includes, but is not limited to differential expression of at least one of Tnf, Mapkl4, CdknlA, Rad51APl, Sox5, CdknlB, Kras, Asun, miR-877, miR-200c, and miR-141.
- differential expression of a genomic feature for 6p+12p includes one or more of:
- copy-number loss, or mRNA or protein underexpression of CdknlA is correlated with a patient's shorter survival time, and resistance to platinum-based chemotherapy;
- copy-number loss, or mRNA or protein underexpression of Mapkl4 on 6p is correlated with a patient's shorter survival time, and resistance to platinum-based chemotherapy
- copy-number gain, or mRNA or protein overexpression of Kras on 12p is correlated with a patient's shorter survival time, and resistance to platinum-based chemotherapy
- copy-number gain, or mRNA or protein overexpression of Rad51APl on 12p is correlated with a patient's shorter survival time, and resistance to platinum-based chemotherapy
- copy-number loss, or mRNA or protein underexpression of Tnf on 6p is correlated with a patient's shorter survival time, and resistance to platinum-based chemotherapy;
- copy-number gain, or mRNA or protein overexpression of Itprl on 12p is correlated with a patient's shorter survival time, and resistance to platinum-based chemotherapy;
- copy-number loss, or mircoRNA underexpression of miR-877* on 6p is correlated with a patient's shorter survival time, and resistance to platinum-based chemotherapy;
- copy-number gain, or microRNA overexpression, of miR-200c, miR-200c*, miR-141 , or miR-141 * on 12p is correlated with a patient's shorter survival time, and resistance to platinum-based chemotherapy.
- differential expression of a genomic feature for 7p includes, but is not limited to differential expression of at least one of Rpa3 and Pold2. In embodiments, differential expression of a genomic feature for 7p includes one or more of:
- copy-number gain, or mRNA overexpression of Pold2 on 7p is correlated with a longer survival time, and sensitivity to platinum-based chemotherapy;
- differential expression of a genomic feature for Xq includes, but is not limited to differential expression of at least one of Pabpc5, Bcap31, miR-888, miR-224, and miR-452.
- differential expression of a genomic feature for Xq includes one or more of:
- copy-number loss of Pabpc5 is correlated with a longer survival time and/or sensitivity to platinum-based chemotherapy
- BcapSl gain, or mRNA overexpression of BcapSl is correlated with a longer survival time and/or sensitivity to platinum-based chemotherapy
- co-occurring patterns of differential expression are described herein.
- a co-occurring pattern includes differential expression of one or more genomic features identified above for 6p+12p and 7p.
- a co-occurring pattern includes differential expression of one or more genomic features identified above for 6p+12p and Xq.
- a co-occurring pattern includes differential expression of one or more genomic features identified above for 7p and Xq.
- a co-occurring pattern of differential expression includes one or more of a)-f):
- a co-occurring pattern comprises the differential expression of (c) and further correlating copy-number loss of sequence tag site DXS214 and gain or mRNA overexpression of Bcap31 and Gabre with at least one of longer survival time and sensitivity of platinum-based chemotherapy.
- a co-occurring pattern of differential expression includes one or more of al)-dl):
- a co-occurring pattern of differential expression includes one or more of a2)-g2):
- a co-occurring pattern of differential expression includes one or more of a2)-g2) and additionally at least one of h2)-m2):
- BASC iJrcai-associated genome surveillance protein complex
- a pattern of differential expression includes one or more of:
- BRCA1 -associated BAPl e.g., reduced abundance of the BRCA1 -associated genome surveillance protein complex (BASC) with at least one of decreased length of patient survival and resistance to platinum-based chemotherapy.
- BASC BRCA1 -associated genome surveillance protein complex
- a co-occurring pattern of any one of the genomic features of (l)-(26) is contemplated.
- the genomic feature of (1) may be combined with any one of the genomic features of (2)-(26).
- the genomic feature of (1) may be combined with multiple or all of the genomic features of (2)-(26). Any combination or sub-combination of the genomic features of (l)-(24) are contemplated herein.
- a co-occurring pattern is selected from (l) correlating at least two of (2), (4), (6), (9)-(12), (14)-(16), (18), and (24); (n) correlating at least two of (2), (4), (7), (9)-(12), (14)-(16), (19)-(23); or (iii) correlating at least two of (6)-(7), and (18)-(24).
- co-occurring patterns of differential expression may include differential expression of genomic features from additional chromosomes such as Lig4 on chromosome 13q.
- a cell's transformation and immortality are correlated with a patient's shorter survival.
- the genes which are significantly (Mann- Whitney -Wilcoxon P- values ⁇ 0.05) differentially expressed between the 6p+12p tensor GSVD classes, i.e., in the patient group of high 6p+12p x-probelet coefficient or arraylet correlation, relative to the patient group of low coefficient or correlation, are enriched (hypergeometric f-values ⁇ 10 ⁇ 3 ) in the ontologies of cellular response to ionizing radiation (GO: 0071479), and major histocompatibility (MHC) protein complex (GO:0042611).
- MHC major histocompatibility
- GO:0071479 genes are underexpressed, including the p21 cyclin-dependent kinase inhibitor-encoding CdknlA, and the p38 mitogen- activated protein kinase-encoding Mapkl4, which map to a deletion >45 Mbp on the telomeric part of 6p (6p25.3-p21.1). Also underexpressed is p38, the protein encoded by Mapkl4. All GO:0042611 genes, including the tumor necrosis factor-encoding TNF, are underexpressed, and map to the same deletion.
- the one microRNA that is significantly differentially expressed between the 6p+12p tensor GSVD classes, and maps to the same deletion, is the splicing - dependent microRNA miR-877*, which is encoded by the 13th intron of the ATP-binding cassette subfamily F member 1 -encoding gene Abcfl . Both miR-877* and Abcfl are consistently underexpressed.
- Rad51 -associated protein 1- encoding Rad51APl maps to an amplification >9 Mbp on the telomeric part of 12p (12pl3.33-pl3.31) that is significantly correlated with OV survival.
- the second protein that is significantly differentially expressed between the 6p+12p tensor GSVD classes is p27.
- the cyclin-dependent kinase inhibitor CdknlB which encodes p27, maps to a 4.5 Mbp amplification (12pl3.2-pl2.3) that is significantly correlated with OV survival, and its mRNA is overexpressed.
- the mRNA encoded by Kras is also overexpressed.
- the 6p+12p pattern therefore, which includes the loss of the p21-encoding CdknlA and the p38-encoding Mapkl4 on 6p, and the gain of Kras on 12p, encodes for cellular conditions that combined but not separately can lead to transformation.
- p21 and p38 are necessary for p53-mediated cell cycle arrest and apoptosis, respectively, in response to DNA damage.
- Overexpression of the p21 -encoding CdknlA is correlated with a low malignant potential of an ovarian tumor. Rad51APl overexpression disrupts cell cycle arrest and apoptosis, can lead to cellular resistance to DNA-damaging cancer therapies, such as platinum-based chemotherapy, and may increase DNA instability.
- Tnf- induced apoptosis is correlated with downregulation of Itprl.
- a cell's DNA stability is correlated with a longer survival.
- the genes that are significantly differentially expressed between the 7p tensor GSVD classes are enriched (hypergeometric f-value ⁇ 10 10 ) in the ontology of DNA strand elongation involved in DNA replication (GO: 0006271). Most of these genes are overexpressed, including the DNA polymerase delta subunit 2-encoding Pold2 that is essential for DNA replication and repair, which maps to an amplification >17 Mbp on the centromeric part of 7p (7pl4.1 -pl l .2). Only two genes are underexpressed: RpaS on 7p and the DNA ligase IV-encoding Lig4 on 13q.
- methods of predicting survival time and/or predicting a clinical response to a treatment regimen such as chemotherapy involve determining at least one indicator of differential expression selected from one or more of: gain in copy numbers of a segment overlapping the Priml gene is correlated with poor survival and resistance to platinum-based chemotherapy; gain in copy numbers of Kras is correlated with poor survival and resistance to platinum-based chemotherapy; gain in copy numbers of Sox5 is correlated with poor survival and resistance to platinum-based chemotherapy; gain in copy numbers, or mRNA or protein overexpression of Itprl is correlated with poor survival and resistance to platinum-based chemotherapy; gain in copy numbers, or mRNA or protein overexpression of Asun is correlated with poor survival and resistance to platinum-based chemotherapy; loss in copy numbers, or mRNA or protein under-expression of Rpa3 is correlated with a longer survival time, and sensitivity to platinum-based chemotherapy; loss in copy numbers, or mRNA or protein under- expression of Rpa3 is correlated with a longer survival time, and sensitivity to platinum-based chemotherapy; loss in copy numbers,
- the CNA signatures and expression profiles described above may be used to predict response to platinum-based chemotherapy agents for other cancers where platinum-based chemotherapy is used.
- the methods described herein may be used to predict response to platinum-based chemotherapy agents for advanced, metastatic forms of colon cancer, small cell and non-small cell lung cancer, breast cancer, adrenocortical cancer, anal cancer, endometrial cancer, non-Hodgkin lymphoma, ovarian cancer, testicular cancer, melanoma and head and neck cancers, among others.
- suitable genes include, but are limited to CkdnlA, Mapkl4, Rad51APl, Kras, Rpa3, Pold2, Pabpc5, Tnf, Prim2, Sox5, Asun, Itpr2, and Bcap31.
- Embodiments of mRNA include, but are not limited to miR-877, miR-200c, miR-141 , miR-888, miR-224, miR-452, or antisense sequences thereof.
- deletion of the p21 -encoding CdknlA and p38- encoding Mapkl4 and amplification of Rad51APl and Kras encode for human cell transformation and are correlated with a cell's immortality and a patient's shorter survival time.
- RpaS deletion and Poldl amplification are correlated with DNA stability, and a longer survival time.
- the cancer is selected from ovarian serous cystadenocarcinoma, small cell lung cancers, non-small cell lung cancers, testicular cancer, stomach cancers, bladder cancers, colon cancers, breast cancer, adrenocortical cancer, anal cancer, endometrial cancer, non-Hodgkin lymphoma, melanoma, and head and neck cancers.
- inhibitors can be used to reduce the expression of one or more genes described herein, or reduce the activity of one or more gene products (e.g., proteins encoded by the genes) described herein.
- exemplary inhibitors include, e.g., RNA effector molecules that target a gene, antibodies that bind to a gene product, a dominant negative mutant of the gene product, etc.
- Inhibition can be achieved at the mRNA level, e.g., by reducing the mRNA level of a target gene using RNA interference.
- Inhibition can be also achieved at the protein level, e.g., by using an inhibitor or an antagonist that reduces the activity of a protein.
- activators can be used to activate the expression of one or more genes described herein, or increase the activity of one or more gene products (e.g., proteins encoded by the genes) described herein.
- exemplary activators include, e.g., RNA effector molecules that target a gene, activators that enhance the interaction between RNA polymerase and a promoter, activators that activate or deactivate receptors, etc.
- Activation can be achieved at the mRNA level, e.g., by increasing the mRNA level of a target gene.
- Inhibition can be also achieved at the protein level, e.g., by using an agent that increases the activity of a protein.
- the disclosure provides a method for reducing the proliferation or viability of an OV cancer cell comprising: contacting the cell with an inhibitor that (i) downregulates the expression of a gene selected from the group consisting of Rad51APl, Kras, RpaS, and/or Pabpc5, and a combination thereof; or (ii) down-regulates the activity of a protein selected from RAD51AP1, KRAS, RPA3, or PABPC5, and a combination thereof, and/or contacting the cell with an activator that up-regulates the expression level of a gene selected from the group consisting of CdknlA, Mapkl4, Pold2, and Bcap31, or a combination thereof.
- an inhibitor that (i) downregulates the expression of a gene selected from the group consisting of Rad51APl, Kras, RpaS, and/or Pabpc5, and a combination thereof; or (ii) down-regulates the activity of a protein selected from RAD51AP1, KRAS,
- the disclosure provides a method of treating OV comprising: administering an inhibitor that (i) downregulates the expression of a gene selected from the group consisting of Rad51APl, Kras, Rpa3, or Pabpc5, and a combination thereof; or (ii) down- regulates the activity of a protein selected from RAD51AP1, KRAS, RPA3, or PABPC5, and a combination thereof; and/or administering an activator that up-regulates the expression level of a gene selected from the group consisting of CdknlA, Mapkl4, Pold2, and Bcap31, or a combination thereof.
- Exemplary inhibitors that reduce the expression of one or more genes described herein, or reduce the activity of one or more gene products described herein include, e.g., RNA effector molecules that target a gene, antibodies that bind to a gene product, a dominant negative mutant of the gene product, etc.
- a therapeutically effective amount of an inhibitor is administered, which is an amount that, upon single or multiple dose administration to a subject (such as a human patient), prevents, cures, delays, reduces the severity of, and/or ameliorating at least one symptom of OV, prolongs the survival of the subject beyond that expected in the absence of treatment, or increases the responsiveness or reduces the resistance of a subject to another therapeutic treatment (e.g., increasing the sensitivity or reducing the resistance to a chemotherapeutic drug).
- a therapeutically effective amount of an activator is administered, which is an amount that, upon single or multiple dose administration to a subject (such as a human patient), prevents, cures, delays, reduces the severity of, and/or ameliorating at least one symptom of OV, prolongs the survival of the subject beyond that expected in the absence of treatment, or increases the responsiveness or reduces the resistance of a subject to another therapeutic treatment (e.g., increasing the sensitivity or reducing the resistance to a chemotherapeutic drug).
- treatment refers to a therapeutic, preventative or prophylactic measures.
- Also described herein are the use of the inhibitors and/or activators described herein for reducing the proliferation or viability of an OV cancer cell, or for treating OV; and the use of the inhibitors described herein in the manufacture of a medicament for reducing the proliferation or viability of an OV cancer cell, or for treating OV.
- the inhibitor is an RNA effector molecule, such as an antisense RNA, or a double-stranded RNA that mediates RNA interference.
- the activator is an RNA effector molecule that mediates RNA regulation. RNA effector molecules that are suitable for the subject technology have been disclosed in detail in WO 2011/005786, and is described briefly below.
- RNA effector molecules are ribonucleotide agents that are capable of reducing or preventing the expression of a target gene within a host cell, or ribonucleotide agents capable of forming a molecule that can reduce the expression level of a target gene within a host cell.
- a portion of a RNA effector molecule, wherein the portion is at least 10, at least 12, at least 15, at least 17, at least 18, at least 19, or at least 20 nucleotide long, is substantially complementary to the target gene.
- the complementary region may be the coding region, the promoter region, the 3' untranslated region (3'-UTR), and/or the 5'-UTR of the target gene.
- RNA effector molecules are complementary to the target sequence (e.g., at least 17, at least 18, at least 19, or more contiguous nucleotides of the RNA effector molecule are complementary to the target sequence).
- the RNA effector molecules interact with RNA transcripts of target genes and mediate their selective degradation or otherwise prevent their translation.
- RNA effector molecules can comprise a single RNA strand or more than one RNA strand.
- RNA effector molecules include, e.g., double stranded RNA (dsRNA), microRNA (miRNA), antisense RNA, promoter- directed RNA (pdRNA), Piwi-interacting RNA (piRNA), expressed interfering RNA (eiRNA), short hairpin RNA (shRNA), antagomirs, decoy RNA, DNA, plasmids and aptamers.
- dsRNA double stranded RNA
- miRNA microRNA
- antisense RNA promoter- directed RNA
- pdRNA promoter- directed RNA
- piRNA Piwi-interacting RNA
- eiRNA expressed interfering RNA
- shRNA short hairpin RNA
- antagomirs decoy RNA, DNA, plasmids and aptamers.
- the RNA effector molecule can be single-stranded or double
- a single-stranded RNA effector molecule can have double-stranded regions and a double-stranded RNA effector can have single-stranded regions.
- the RNA effector molecules are double-stranded RNA, wherein the antisense strand comprises a sequence that is substantially complementary to the target gene.
- RNA effector molecule e.g., within a dsRNA (a double-stranded ribonucleic acid) may be fully complementary or substantially complementary. Generally, for a duplex up to 30 base pairs, the dsRNA comprises no more than 5, 4, 3 or 2 mismatched base pairs upon hybridization, while retaining the ability to regulate the expression of its target gene.
- the RNA effector molecule comprises a single-stranded oligonucleotide that interacts with and directs the cleavage of RNA transcripts of a target gene.
- single stranded RNA effector molecules comprise a 5' modification including one or more phosphate groups or analogs thereof to protect the effector molecule from nuclease degradation.
- the RNA effector molecule can be a single-stranded antisense nucleic acid having a nucleotide sequence that is complementary to a "sense" nucleic acid of a target gene, e.g., the coding strand of a double-stranded cDNA molecule or a RNA sequence, e.g., a pre-mRNA, mRNA, miRNA, or pre-miRNA. Accordingly, an antisense nucleic acid can form hydrogen bonds with a sense nucleic acid target.
- antisense nucleic acids can be designed according to the rules of Watson-Crick base pairing.
- the antisense nucleic acid can be complementary to the coding or noncoding region of a RNA, e.g., the region surrounding the translation start site of a pre-mRNA or mRNA, e.g., the 5' UTR.
- An antisense oligonucleotide can be, for example, about 10 to 25 nucleotides in length (e.g., 10, 11, 12, 13, 14, 15, 16, 17, 18, 19, 20, 21, 22, 23, or 24 nucleotides in length).
- the antisense oligonucleotide comprises one or more modified nucleotides, e.g., phosphorothioate derivatives and/or acridine substituted nucleotides, designed to increase its biological stability of the molecule and/or the physical stability of the duplexes formed between the antisense and target nucleic acids.
- Antisense oligonucleotides can comprise ribonucleotides only, deoxyribonucleotides only (e.g., oligodeoxynucleotides), or both deoxyribonucleotides and ribonucleotides.
- an antisense agent consisting only of ribonucleotides can hybridize to a complementary RNA and prevent access of the translation machinery to the target RNA transcript, thereby preventing protein synthesis.
- An antisense molecule including only deoxyribonucleotides, or deoxyribonucleotides and ribonucleotides, can hybridize to a complementary RNA and the RNA target can be subsequently cleaved by an enzyme, e.g., RNAse H, to prevent translation.
- the flanking RNA sequences can include 2'-0-methylated nucleotides, and phosphorothioate linkages, and the internal DNA sequence can include phosphorothioate internucleotide linkages.
- the internal DNA sequence is preferably at least five nucleotides in length when targeting by RNAseH activity is desired.
- the RNA effector comprises a double-stranded ribonucleic acid (dsRNA), wherein said dsRNA (a) comprises a sense strand and an antisense strand that are substantially complementary to each other; and (b) wherein said antisense strand comprises a region of complementarity that is substantially complementary to one of the target genes, and wherein said region of complementarity is from 10 to 30 nucleotides in length.
- dsRNA double-stranded ribonucleic acid
- RNA effector molecule is a double-stranded oligonucleotide .
- the duplex region formed by the two strands is small, about 30 nucleotides or less in length.
- dsRNA is also referred to as siRNA.
- the siRNA may be from 15 to 30 nucleotides in length, from 10 to 26 nucleotides in length, from 17 to 28 nucleotides in length, from 18 to 25 nucleotides in length, or from 19 to 24 nucleotides in length, etc.
- the duplex region can be of any length that permits specific degradation of a desired target RNA through a RISC pathway, but will typically range from 9 to 36 base pairs in length, e.g., 15 to 30 base pairs in length.
- the duplex region may be 15 to 30 base pairs, 15 to 26 base pairs, 15 to 23 base pairs, 15 to 22 base pairs, 15 to 21 base pairs, 15 to 20 base pairs, 15 to 19 base pairs, 15 to 18 base pairs, 15 to 17 base pairs, 18 to 30 base pairs, 18 to 26 base pairs, 18 to 23 base pairs, 18 to 22 base pairs, 18 to 21 base pairs, 18 to 20 base pairs, 19 to 30 base pairs, 19 to 26 base pairs, 19 to 23 base pairs, 19 to 22 base pairs, 19 to 21 base pairs, 19 to 20 base pairs, 20 to 30 base pairs, 20 to 26 base pairs, 20 to 25 base pairs, 20 to 24 base pairs, 20 to 23 base pairs, 20 to 22 base pairs, 20 to 21 base pairs, 21 to 30 base pairs, 21 to 26 base pairs, 21 to 25 base pairs,
- the two strands forming the duplex structure of a dsRNA can be from a single RNA molecule having at least one self-complementary region, or can be formed from two or more separate RNA molecules. Where the duplex region is formed from two strands of a single molecule, the molecule can have a duplex region separated by a single stranded chain of nucleotides (a "hairpin loop") between the 3 '-end of one strand and the 5 '-end of the respective other strand forming the duplex structure.
- a single stranded chain of nucleotides a "hairpin loop"
- the hairpin loop can comprise at least one unpaired nucleotide; in some embodiments the hairpin loop can comprise at least 3, at least 4, at least 5, at least 6, at least 7, at least 8, at least 9, at least 10, at least 20, at least 23 or more unpaired nucleotides.
- the two substantially complementary strands of a dsRNA are formed by separate RNA strands, the two strands can be optionally covalently linked.
- the connecting structure is referred to as a "linker.”
- a double-stranded oligonucleotide can include one or more single-stranded nucleotide overhangs, which are one or more unpaired nucleotide that protrudes from the terminus of a duplex structure of a double-stranded oligonucleotide, e.g., a dsRNA.
- a double-stranded oligonucleotide can comprise an overhang of at least one nucleotide; alternatively the overhang can comprise at least two nucleotides, at least three nucleotides, at least four nucleotides, at least five nucleotides or more.
- the overhang(s) can be on the sense strand, the antisense strand or any combination thereof. Furthermore, the nucleotide(s) of an overhang can be present on the 5' end, 3' end, or both ends of either an antisense or sense strand of a dsRNA.
- At least one end of a dsRNA has a single-stranded nucleotide overhang of 1 to 4, generally 1 or 2 nucleotides.
- the overhang can comprise a deoxyribonucleoside or a nucleoside analog. Further, one or more of the internucloside linkages in the overhang can be replaced with a phosphorothioate.
- the overhang comprises one or more deoxyribonucleoside or the overhang comprises one or more dT, e.g., the sequence 5'-dTdT-3' or 5'-dTdTdT-3'.
- overhang comprises the sequence 5'-dT*dT-3, wherein * is a phosphorothioate internucleoside linkage.
- RNA effector molecule as described herein can contain one or more mismatches to the target sequence.
- a RNA effector molecule as described herein contains no more than three mismatches.
- the antisense strand of the RNA effector molecule contains one or more mismatches to a target sequence, it is preferable that the mismatch(s) is (are) not located in the center of the region of complementarity, but are restricted to be within the last 5 nucleotides from either the 5' or 3' end of the region of complementarity.
- the antisense strand generally does not contain any mismatch within the central 13 nucleotides.
- the RNA effector molecule is a promoter-directed RNA (pdRNA) which is substantially complementary to a noncoding region of an mRNA transcript of a target gene.
- pdRNA promoter-directed RNA
- the pdRNA is substantially complementary to the promoter region of a target gene mRNA at a site located upstream from the transcription start site, e.g., more than 100, more than 200, or more than 1,000 bases upstream from the transcription start site.
- the pdRNA is substantially complementary to the 3'-UTR of a target gene mRNA transcript.
- the pdRNA comprises dsRNA of 18-28 bases optionally having 3 ' di- or tri-nucleotide overhangs on each strand.
- the pdRNA comprises a gapmer consisting of a single stranded polynucleotide comprising a DNA sequence which is substantially complementary to the promoter or the 3'-UTR of a target gene mRNA transcript, and flanking the polynucleotide sequences (e.g., comprising the 5 terminal bases at each of the 5' and 3' ends of the gapmer) comprises one or more modified nucleotides, such as 2' MOE, 2'OMe, or Locked Nucleic Acid bases (LNA), which protect the gapmer from cellular nucleases.
- modified nucleotides such as 2' MOE, 2'OMe, or Locked Nucleic Acid bases (LNA), which protect the gapmer from cellular nucleases.
- pdRNA can be used to selectively increase, decrease, or otherwise modulate expression of a target gene. Without being limited to theory, it is believed that pdRNAs modulate expression of target genes by binding to endogenous antisense RNA transcripts which overlap with noncoding regions of a target gene mRNA transcript, and recruiting Argonaute proteins (in the case of dsRNA) or host cell nucleases (e.g., RNase H) (in the case of gapmers) to selectively degrade the endogenous antisense RNAs. In some embodiments, the endogenous antisense RNA negatively regulates expression of the target gene and the pdRNA effector molecule activates expression of the target gene.
- Argonaute proteins in the case of dsRNA
- RNase H host cell nucleases
- pdRNAs can be used to selectively activate the expression of a target gene by inhibiting the negative regulation of target gene expression by endogenous antisense RNA.
- Methods for identifying antisense transcripts encoded by promoter sequences of target genes and for making and using promoter-directed RNAs are known, see, e.g., WO 2009/046397.
- the RNA effector molecule comprises an aptamer which binds to a non-nucleic acid ligand, such as a small organic molecule or protein, e.g., a transcription or translation factor, and subsequently modifies (e.g., inhibits) activity.
- a non-nucleic acid ligand such as a small organic molecule or protein, e.g., a transcription or translation factor
- An aptamer can fold into a specific structure that directs the recognition of a targeted binding site on the non-nucleic acid ligand.
- Aptamers can contain any of the modifications described herein.
- the RNA effector molecule comprises an antagomir.
- Antagomirs are single stranded, double stranded, partially double stranded or hairpin structures that target a microRNA.
- An antagomir consists essentially of or comprises at least 10 or more contiguous nucleotides substantially complementary to an endogenous miRNA and more particularly a target sequence of an miRNA or pre-miRNA nucleotide sequence.
- Antagomirs preferably have a nucleotide sequence sufficiently complementary to a miRNA target sequence of about 12 to 25 nucleotides, such as about 15 to 23 nucleotides, to allow the antagomir to hybridize to the target sequence.
- the target sequence differs by no more than 1, 2, or 3 nucleotides from the sequence of the antagomir.
- the antagomir includes a non- nucleotide moiety, e.g., a cholesterol moiety, which can be attached, e.g., to the 3' or 5' end of the oligonucleotide agent.
- antagomirs are stabilized against nucleolytic degradation by the incorporation of a modification, e.g., a nucleotide modification.
- antagomirs contain a phosphorothioate comprising at least the first, second, and/or third internucleotide linkages at the 5' or 3' end of the nucleotide sequence.
- antagomirs include a 2'-modified nucleotide, e.g., a 2'-deoxy, 2'-deoxy-2'-fluoro, 2'-0-methyl, 2'-0-methoxyethyl (2'-0-MOE), 2'-0-aminopropyl (2'-0-AP), 2 -0- dimethylaminoethyl (2'-0-DMAOE), 2'-0-dimethylaminopropyl (2'-0-DMAP), 2 -0- dimethylaminoethyloxyethyl (2'-0-DMAEOE), or 2'-0-N-methylacetamido (2'-0-NMA).
- antagomirs include at least one 2'-0-methyl-modified nucleotide.
- the RNA effector molecule is a promoter-directed RNA (pdRNA) which is substantially complementary to a noncoding region of an mRNA transcript of a target gene.
- pdRNA promoter-directed RNA
- the pdRNA can be substantially complementary to the promoter region of a target gene mRNA at a site located upstream from the transcription start site, e.g., more than 100, more than 200, or more than 1,000 bases upstream from the transcription start site.
- the pdRNA can substantially complementary to the 3'-UTR of a target gene mRNA transcript.
- the pdRNA comprises dsRNA of 18 to 28 bases optionally having 3' di- or tri-nucleotide overhangs on each strand.
- the dsRNA is substantially complementary to the promoter region or the 3'-UTR region of a target gene mRNA transcript.
- the pdRNA comprises a gapmer consisting of a single stranded polynucleotide comprising a DNA sequence which is substantially complementary to the promoter or the 3'-UTR of a target gene mRNA transcript, and flanking the polynucleotide sequences (e.g., comprising the five terminal bases at each of the 5' and 3' ends of the gapmer) comprising one or more modified nucleotides, such as 2'MOE, 2'OMe, or Locked Nucleic Acid bases (LNA), which protect the gapmer from cellular nucleases.
- modified nucleotides such as 2'MOE, 2'OMe, or Locked Nucleic Acid bases (LNA), which protect the gapmer from cellular nucleases.
- Expressed interfering RNA can be used to selectively increase, decrease, or otherwise modulate expression of a target gene.
- the dsRNA is expressed in the first transfected cell from an expression vector.
- the sense strand and the antisense strand of the dsRNA can be transcribed from the same nucleic acid sequence using e.g., two convergent promoters at either end of the nucleic acid sequence or separate promoters transcribing either a sense or antisense sequence.
- two plasmids can be cotransfected, with one of the plasmids designed to transcribe one strand of the dsRNA while the other is designed to transcribe the other strand.
- Methods for making and using eiRNA effector molecules are known in the art. See, e.g., WO 2006/033756; U.S. Patent Pubs. No. 2005/0239728 and No. 2006/0035344.
- the RNA effector molecule comprises a small single-stranded Piwi- interacting RNA (piRNA effector molecule) which is substantially complementary to a target gene, and which selectively binds to proteins of the Piwi or Aubergine subclasses of Argonaute proteins.
- a piRNA effector molecule can be about 10 to 50 nucleotides in length, about 25 to 39 nucleotides in length, or about 26 to 31 nucleotides in length. See, e.g., U.S. Patent Application Pub. No. 2009/0062228.
- MicroRNAs are a highly conserved class of small RNA molecules that are transcribed from DNA in the genomes of plants and animals, but are not translated into protein. Pre- microRNAs are processed into miRNAs. Processed microRNAs are single stranded -17 to 25 nucleotide (nt) RNA molecules that become incorporated into the RNA-induced silencing complex (RISC) and have been identified as key regulators of development, cell proliferation, apoptosis and differentiation. They are believed to play a role in regulation of gene expression by binding to the 3 '-untranslated region of specific mRNAs.
- RISC RNA-induced silencing complex
- MicroRNAs cause post- transcriptional silencing of specific target genes, e.g., by inhibiting translation or initiating degradation of the targeted mRNA.
- the miRNA is completely complementary with the target nucleic acid.
- the miRNA has a region of noncomplementarity with the target nucleic acid, resulting in a "bulge" at the region of non- complementarity.
- the region of noncomplementarity (the bulge) is flanked by regions of sufficient complementarity, e.g., complete complementarity, to allow duplex formation.
- the regions of complementarity are at least 8 to 10 nucleotides long (e.g., 8, 9, or 10 nucleotides long).
- miRNA can inhibit gene expression by, e.g., repressing translation, such as when the miRNA is not completely complementary to the target nucleic acid, or by causing target RNA degradation, when the miRNA binds its target with perfect or a high degree of complementarity.
- the RNA effector molecule can include an oligonucleotide agent which targets an endogenous miRNA or pre-miRNA.
- the RNA effector can target an endogenous miRNA which negatively regulates expression of a target gene, such that the RNA effector alleviates miRNA-based inhibition of the target gene.
- the miRNA can comprise naturally occurring nucleobases, sugars, and covalent internucleotide (backbone) linkages, or comprise one or more non-naturally-occurring features that confer desirable properties, such as enhanced cellular uptake, enhanced affinity for the endogenous miRNA target, and/or increased stability in the presence of nucleases.
- an miRNA designed to bind to a specific endogenous miRNA has substantial complementarity, e.g., at least 70%, 80%, 90%, or 100% complementary, with at least 10, 20, or 25 or more bases of the target miRNA.
- Exemplary oligonucleiotde agents that target miRNAs and pre-miRNAs are described, for example, in U.S. Patent Pubs. No.
- a miRNA or pre-miRNA can be 10 to 200 nucleotides in length, for example from 16 to 80 nucleotides in length.
- Mature miRNAs can have a length of 16 to 30 nucleotides, such as 21 to 25 nucleotides, particularly 21 , 22, 23, 24, or 25 nucleotides in length.
- miRNA precursors can have a length of 70 to 100 nucleotides and can have a hairpin conformation.
- miRNAs are generated in vivo from pre-miRNAs by the enzymes cDicer and Drosha. miRNAs or pre-miRNAs can be synthesized in vivo by a cell-based system or can be chemically synthesized.
- miRNAs can comprise modifications which impart one or more desired properties, such as superior stability, hybridization thermodynamics with a target nucleic acid, targeting to a particular tissue or cell-type, and/or cell permeability, e.g., by an endocytosis- dependent or -independent mechanism. Modifications can also increase sequence specificity, and consequently decrease off-site targeting.
- an RNA effector may biochemically modified to enhance stability or other beneficial characteristics.
- Oligonucleotides can be modified to prevent rapid degradation of the oligonucleotides by endo- and exo-nucleases and avoid undesirable off-target effects.
- the nucleic acids featured in the invention can be synthesized and/or modified by methods well established in the art, such as those described in CURRENT PROTOCOLS IN NUCLEIC ACID CHEMISTRY (Beaucage et al, eds., John Wiley & Sons, Inc., NY).
- Modifications include, for example, (a) end modifications, e.g., 5' end modifications (phosphorylation, conjugation, inverted linkages, etc.), or 3' end modifications (conjugation, DNA nucleotides, inverted linkages, etc.); (b) base modifications, e.g., replacement with stabilizing bases, destabilizing bases, or bases that base pair with an expanded repertoire of partners, removal of bases (abasic nucleotides), or conjugated bases; (c) sugar modifications (e.g., at the 2' position or 4' position) or replacement of the sugar; as well as (d) internucleoside linkage modifications, including modification or replacement of the phosphodiester linkages.
- end modifications e.g., 5' end modifications (phosphorylation, conjugation, inverted linkages, etc.), or 3' end modifications (conjugation, DNA nucleotides, inverted linkages, etc.
- base modifications e.g., replacement with stabilizing bases, destabilizing bases, or bases that base
- oligonucleotide compounds useful in this invention include, but are not limited to RNAs containing modified backbones or no natural internucleoside linkages. RNAs having modified backbones include, among others, those that do not have a phosphorus atom in the backbone. Specific examples of oligonucleotide compounds useful in this invention include, but are not limited to oligonucleotides containing modified or non-natural internucleoside linkages. Oligonucleotides having modified internucloside linkages include, among others, those that do not have a phosphorus atom in the internucleoside linkage.
- Modified internucleoside linkages include (e.g., RNA backbones) include, for example, phosphorothioates, chiral phosphorothioates, phosphorodithioates, phosphotriesters, aminoalkylphosphotri esters, methyl and other alkyl phosphonates including 3'-alkylene phosphonates and chiral phosphonates, phosphinates, phosphoramidates including 3 '-amino phosphoramidate and aminoalkylphosphoramidates, thionophosphoramidates, thionoalkylphosphonates, thionoalkylphosphotriesters, and boranophosphates having normal 3 '-5' linkages, 2' -5' linked analogs of these, and those) having inverted polarity wherein the adjacent pairs of nucleoside units are linked 3'-5' to 5'-3' or 2'-5' to 5'-2'.
- Various salts, mixed salts and free acid forms are
- both the sugar and the internucleoside linkage may be modified, i.e., the backbone, of the nucleotide units are replaced with novel groups.
- One such oligomeric compound an RNA mimetic that has been shown to have excellent hybridization properties, is referred to as a peptide nucleic acid (PNA).
- PNA peptide nucleic acid
- Modified oligonucleotides can also contain one or more substituted sugar moieties.
- the RNA effector molecules e.g., dsRNAs, can include one of the following at the 2' position: H (deoxyribose); OH (ribose); F; 0-, S-, or N-alkyl; 0-, S-, or N-alkenyl; 0-, S- or N-alkynyl; or O-alkyl-O-alkyl, wherein the alkyl, alkenyl and alkynyl can be substituted or unsubstituted Ci to Cio alkyl or C 2 to C 10 alkenyl and alkynyl.
- Other modifications include 2'-methoxy (2'-0 ⁇ 3 ⁇ 4), 2'-aminopropoxy ( ⁇ -OCH J CH J CH J NH J ) and 2'-fluoro (2 * -F).
- the oligonucleotides can also be modified to include one or more locked nucleic acids (LNA).
- LNA locked nucleic acids
- a locked nucleic acid is a nucleotide having a modified ribose moiety in which the ribose moiety comprises an extra bridge connecting the 2' and 4' carbons. This structure effectively "locks" the ribose in the 3'-endo structural conformation.
- the addition of locked nucleic acids to oligonucleotide molecules has been shown to increase oligonucleotide molecule stability in serum, and to reduce off-target effects. Elmen et al., 33 Nucl. Acids Res. 439-47 (2005); Mook et al, 6 Mol. Cancer Ther.
- the activator is an molecule or agent that is effective to increase expression of one or more genes.
- the activator is an agent that is effective to increase initiation of transcription binding factors and/or decrease transcription inhibitors.
- the activator is an activator protein that modulates expression of the selected gene or genes to be upregulated.
- RNA effector molecules The discussion below is with reference to delivery of RNA effector molecules. However, it will be understood that the delivery methods described below are applicable to activators.
- the delivery of RNA effector molecules to cells can be achieved in a number of different ways. Several suitable delivery methods are well known in the art. For example, the skilled person is directed to WO 2011/005786, which discloses exemplary delivery methods can be used in this invention at pages 187-219, the teachings of which are incorporated herein by reference.
- a reagent that facilitates RNA effector molecule uptake may be used.
- an emulsion, a cationic lipid, a non-cationic lipid, a charged lipid, a liposome, an anionic lipid, a penetration enhancer, a transfection reagent or a modification to the RNA effector molecule for attachment e.g., a ligand, a targeting moiety, a peptide, a lipophilic group, etc.
- RNA effector molecules can be delivered using a drug delivery system such as a nanoparticle, a dendrimer, a polymer, a liposome, or a cationic delivery system.
- a drug delivery system such as a nanoparticle, a dendrimer, a polymer, a liposome, or a cationic delivery system.
- Positively charged cationic delivery systems facilitate binding of a RNA effector molecule (negatively charged) and also enhance interactions at the negatively charged cell membrane to permit efficient cellular uptake.
- Cationic lipids, dendrimers, or polymers can either be bound to RNA effector molecules, or induced to form a vesicle, liposome, or micelle that encases the RNA effector molecule. See, e.g., Kim et al, 129 J. Contr. Release 107-16 (2008).
- RNA effector molecules described herein can be encapsulated within liposomes or can form complexes thereto, in particular to cationic liposomes.
- the RNA effector molecules can be complexed to lipids, in particular to cationic lipids.
- Suitable fatty acids and esters include but are not limited to arachidonic acid, oleic acid, eicosanoic acid, lauric acid, caprylic acid, capric acid, myristic acid, palmitic acid, stearic acid, linoleic acid, linolenic acid, dicaprate, tricaprate, monoolein, dilaurin, glyceryl 1 -monocaprate, 1-dodecylazacycloheptan- 2-one, an acylcarnitine, an acylcholine, or a CI -20 alkyl ester (e.g., isopropylmyristate IPM), monoglyceride, diglyceride, or acceptable salts thereof.
- arachidonic acid oleic acid, eicosanoic acid, lauric acid, caprylic acid, capric acid, myristic acid, palmitic acid, stearic acid, linoleic acid, lin
- the lipid to RNA ratio (mass/mass ratio) (e.g., lipid to dsRNA ratio) can be in ranges of from about 1 : 1 to about 50: 1, from about 1 : 1 to about 25: 1 , from about 3: 1 to about 15: 1 , from about 4: 1 to about 10: 1 , from about 5 : 1 to about 9: 1 , or about 6: 1 to about 9: 1 , inclusive.
- a cationic lipid of the formulation can comprise at least one protonatable group having a pKa of from 4 to 15.
- the cationic lipid can be, for example, N,N-dioleyl-N,N- dimethylammonium chloride (DODAC), N,N-distearyl-N,N-dimethylammonium bromide (DDAB), N-(I-(2,3- dioleoyloxy)propyl)-N,N,N-tnmethylammonium chloride (DOTAP), N-(I- (2,3- dioleyloxy)propyl)-N,N,N-trimethylammonium chloride (DOTMA), N,N-dimethyl-2,3- dioleyloxy)propylamine (DODMA), 1 ,2-DiLinoleyloxy-N,N-dimethylaminopropane (DLinDMA), l,2-Dilinolenyloxy-N,N-didi
- the cationic lipid can comprise from about 20 mol% to about 70 mol%, inclusive, or about 40 mol% to about 60 mol%, inclusive, of the total lipid present in the particle. In one embodiment, cationic lipid can be further conjugated to a ligand.
- a non-cationic lipid can be an anionic lipid or a neutral lipid, such as distearoyl- phosphatidylcholine (DSPC), dioleoylphosphatidylcholine (DOPC), dipalmitoyl- phosphatidylcholine (DPPC), dioleoylphosphatidylglycerol (DOPG), dipalmitoyl- phosphatidylglycerol (DPPG), dioleoyl-phosphatidylethanolamine (DOPE), palmitoyloleoyl- phosphatidylcholine (POPC), palmitoyloleoyl- phosphatidylethanolamine (POPE), dioleoyl- phosphatidylethanolamine 4-(N-maleimidomethyl)-cyclohexane-l- carboxylate (DOPE-mal), dipalmitoyl phosphatidyl ethanolamine (DPPE), dimyristoylphosphol, such as
- the inhibitor is an antibody that binds to a gene product described herein (e.g., a protein encoded by the gene), such as a neutralizing antibody that reduces the activity of the protein.
- a gene product described herein e.g., a protein encoded by the gene
- antibody refers to an immunoglobulin or fragment thereof, and encompasses any such polypeptide comprising an antigen-binding fragment of an antibody.
- the term includes but is not limited to polyclonal, monoclonal, monospecific, polyspecific, humanized, human, single-chain, chimeric, synthetic, recombinant, hybrid, mutated, grafted, and in vitro generated antibodies.
- An antibody may also refer to antigen-binding fragments of an antibody.
- antigen-binding fragments include, but are not limited to, Fab fragments (consisting of the VL, VH, CL and CHI domains); Fd fragments (consisting of the VH and CHI domains); Fv fragments (referring to a dimer of one heavy and one light chain variable domain in tight, non-covalent association); dAb fragments (consisting of a VH domain); isolated CDR regions; (Fab') 2 fragments, bivalent fragments (comprising two Fab fragments linked by a disulphide bridge at the hinge region), scFv (referring to a fusion of the VL and VH domains, linked together with a short linker), and other antibody fragments that retain antigen-binding function.
- An antigen-binding fragment of an antibody can be produced by conventional biochemical techniques, such as enzyme cleavage, or recombinant DNA techniques known in the art. These fragments may be produced by proteolytic cleavage of intact antibodies by methods well known in the art, or by inserting stop codons at the desired locations in the vectors using site-directed mutagenesis, such as after C H I to produce Fab fragments or after the hinge region to produce (Fab') 2 fragments.
- Papain digestion of antibodies produces two identical antigen-binding fragments, called “Fab” fragments, each with a single antigen-binding site, and a residual "Fc” fragment.
- Pepsin treatment of an antibody yields an F(ab') 2 fragment that has two antigen-combining sites and is still capable of cross-linking antigen.
- Single chain antibodies may be produced by joining V L and V H coding regions with a DNA that encodes a peptide linker connecting the V L and V H protein fragments
- An antigen-binding fragment/domain may comprise an antibody light chain variable region (V L ) and an antibody heavy chain variable region (V H ); however, it does not have to comprise both.
- Fd fragments for example, have two V H regions and often retain some antigen- binding function of the intact antigen-binding domain.
- antigen-binding fragments of an antibody examples include (1 ) a Fab fragment, a monovalent fragment having the V L , V H , C L and C H I domains; (2) a F(ab') 2 fragment, a bivalent fragment having two Fab fragments linked by a disulfide bridge at the hinge region; (3) a Fd fragment having the two V H and C H I domains; (4) a Fv fragment having the V L and V H domains of a single arm of an antibody, (5) a dAb fragment (Ward et al., (1989) Nature 341 : 544-546), that has a V H domain; (6) an isolated complementarity determining region (CDR), and (7) a single chain Fv (scFv).
- a Fab fragment a monovalent fragment having the V L , V H , C L and C H I domains
- F(ab') 2 fragment a bivalent fragment having two Fab fragments linked by a disulfide bridge at the hinge
- V L and V H are coded for by separate genes, they can be joined, using recombinant DNA methods, by a synthetic linker that enables them to be made as a single protein chain in which the V L and V H regions pair to form monovalent molecules (known as single chain Fv (scFv); see e.g., Bird et al. (1988) Science 242:423-426; and Huston et al. (1988) Proc. Natl. Acad. Sci. USA 85 : 5879-5883).
- scFv single chain Fv
- Antibodies described herein, or an antigen-binding fragment thereof can be prepared, for example, by recombinant DNA technologies and/or hybridoma technology.
- a host cell may be transfected with one or more recombinant expression vectors carrying DNA fragments encoding the immunoglobulin light and heavy chains of the antibody, or an antigen- binding fragment of the antibody, such that the light and heavy chains are expressed in the host cell and, preferably, secreted into the medium in which the host cell is cultured, from which medium the antibody can be recovered.
- Antibodies derived from murine or other non-human species can be humanized, e.g., by CDR drafting.
- Standard recombinant DNA methodologies may be used to obtain antibody heavy and light chain genes or a nucleic acid encoding the heavy or light chains, incorporate these genes into recombinant expression vectors and introduce the vectors into host cells, such as those described in Sambrook, Fritsch and Maniatis (eds), Molecular Cloning; A Laboratory Manual, Second Edition, Cold Spring Harbor, N. Y.,(1989), Ausubel, F. M. et al. (eds. ) Current Protocols in Molecular Biology, Greene Publishing Associates, (1989) and in U. S. Pat. No. 4,816, 397 by Boss et al.
- inhibitors described herein may be used in combination with another therapeutic agent. Further, the methods of treatment described herein may be carried out in combination with another treatment regimen, such as chemotherapy, radiotherapy, surgery, etc.
- Suitable chemotherapeutic drugs include, e.g., alkylating agents, anti-metabolites, anti- mitototics, alkaloids (e.g., plant alkaloids and terpenoids, or vinca alkaloids), podophyllotoxin, taxanes, topoisomerase inhibitors, cytotoxic antibiotics, or a combination thereof.
- alkaloids e.g., plant alkaloids and terpenoids, or vinca alkaloids
- podophyllotoxin e.g., taxanes
- topoisomerase inhibitors cytotoxic antibiotics, or a combination thereof.
- platinum-based drugs include platinum-based drugs, bevacizumab, paclitaxel, docetaxel, pegylated liposomal doxorubicin, topotecan, letrozole, tamoxifen citrate, topotecan hydrochloride, and trametinib.
- platinum-based drugs include, but are not limited to
- the inhibitors described herein can also be administered in combination with radiotherapy or surgery.
- an inhibitor can be administered prior to, during or after surgery or radiotherapy.
- Administration during surgery can be as a bathing solution for the operation site.
- RNA effector molecules described herein may be used in combination with additional RNA effector molecules that target additional genes (such as a growth factor, or an oncogene) to enhance efficacy.
- additional genes such as a growth factor, or an oncogene
- oncogenes are known to increase the malignancy of a tumor cell. Some oncogenes, usually involved in early stages of cancer development, increase the chance that a normal cell develops into a tumor cell. Accordingly, one or more oncogenes may be targeted in addition to CdknlA, Mapkl4, Rad51APl, Kras, Rpa3, Pold2, Pabpc5, and Bcap31.
- oncogenes include growth factors or mitogens (such as Platelet-derived growth factor), receptor tyrosine kinases (such as HER2/neu, also known as ErbB-2), cytoplasmic tyrosine kinases (such as the Src-family, Syk-ZAP-70 family and BTK family of tyrosine kinases), regulatory GTPases (such as Ras), cytoplasmic serine/threonine kinases (such as cyclin dependent kinases) and their regulatory subunits, and transcription factors (such as myc).
- growth factors or mitogens such as Platelet-derived growth factor
- receptor tyrosine kinases such as HER2/neu, also known as ErbB-2
- cytoplasmic tyrosine kinases such as the Src-family, Syk-ZAP-70 family and BTK family of tyrosine kinases
- regulatory GTPases such as Ras
- Inhibitors and activators described herein may be formulated into pharmaceutical compositions.
- the pharmaceutical compositions usually one or more pharmaceutical carrier(s) and/or excipient(s). A thorough discussion of such components is available in Gennaro (2000) Remington: The Science and Practice of Pharmacy (20th edition).
- Such carriers or additives include water, a pharmaceutical acceptable organic solvent, collagen, polyvinyl alcohol, polyvinylpyrrolidone, a carboxyvinyl polymer, carboxymethylcellulose sodium, polyacrylic sodium, sodium alginate, water-soluble dextran, carboxymethyl starch sodium, pectin, methyl cellulose, ethyl cellulose, xanthan gum, gum Arabic, casein, gelatin, agar, diglycerin, glycerin, propylene glycol, polyethylene glycol, Vaseline, paraffin, stearyl alcohol, stearic acid, human serum albumin (HSA), mannitol, sorbitol, lactose, a pharmaceutically acceptable surfactant and the like.
- Formulation of the pharmaceutical composition will vary according to the route of administration selected.
- the amounts of an inhibitor and/or activator in a given dosage will vary according to the size of the individual to whom the therapy is being administered as well as the characteristics of the disorder being treated. In exemplary treatments, it may be necessary to administer about 1 mg/day, about 5 mg/day, about 10 mg/day, about 20 mg/day, about 50 mg/day, about 75 mg/day, about 100 mg/day, about 150 mg/day, about 200 mg/day, about 250 mg/day, about 400 mg/day, about 500 mg/day, about 800 mg/day, about 1000 mg/day, about 1600 mg/day or about 2000 mg/day.
- the doses may also be administered based on weight of the patient, at a dose of 0.01 to 50 mg/kg.
- the glycoprotein may be administered in a dose range of 0.015 to 30 mg/kg, such as in a dose of about 0.015, about 0.05, about 0.15, about 0.5, about 1.5, about 5, about 15 or about
- compositions described herein may be administered to a subject orally, topically, transdermally, parenterally, by inhalation spray, vaginally, rectally, or by intracranial injection.
- parenteral as used herein includes subcutaneous injections, intravenous, intramuscular, intracisternal injection, or infusion techniques. Administration by intravenous, intradermal, intramusclar, intramammary, intraperitoneal, intrathecal, retrobulbar, intrapulmonary injection and or surgical implantation at a particular site is contemplated as well.
- GSVD generalized singular value decomposition
- Figure 3 is a diagram of a tensor generalized singular value decomposition (GSVD) of the patient- and platform-matched DNA copy-number profiles of the 6p+12p chromosome arms, according to some embodiments.
- GSVD generalized singular value decomposition
- the structure of the tumor and normal discovery datasets (Dj and 3 ⁇ 4) is that of two third- order tensors with one-to-one mappings between the column dimensions but different row dimensions.
- the patients, platforms, probes, and tissue types each represent a degree of freedom.
- the tensor GSVD is depicted in a raster display, with relative copy-number gain, no change, and loss, explicitly showing the first through the 5th, and the 245th through the 249th 6p+12p x-probelets, both 6p+12p -probelets, and the first through the 10th, and the 489th through the 498th 6p+12p tumor and normal arraylets.
- This display shows that the significance of a subtensor in the tumor dataset relative to that of the corresponding subtensor in the normal dataset, i.e., the tensor GSVD angular distance, equals the row mode GSVD angular distance, i.e., the significance of the corresponding tumor arraylet in the tumor dataset relative to that of the normal arraylet in the normal dataset.
- the tensor GSVD angular distances for the 498 pairs of 6p+12p arraylets are depicted in a bar chart display, where the angular distance corresponding to the first pair of arraylets is ⁇ /4.
- the most significant subtensor in the tumor dataset (which corresponds to the coefficient of largest magnitude in R/) is a combination of (z) the first -probelet, which is approximately invariant across the platforms, (/ ' / ' ) the first x-probelet, which classifies the discovery set of patients into two groups of high and low coefficients, of significantly and robustly different prognoses, and (/ ' / ' / ' ) the first, most tumor-exclusive tumor arraylet, which classifies the validation set of patients into two groups of high and low correlations of significantly different prognoses consistent with the x-probelet' s classification of the discovery set.
- Figure 4 is a diagram illustrating a GSVD of biological data, according to some embodiments.
- the tensor GSVD of the patient- and platform-matched DNA copy-number profiles of the 7p chromosome arm is depicted in a raster display.
- the raster display is depicted with relative copy-number gain, no change, and loss, explicitly showing the first through the 5th, and the 245th through the 249th 7p x-probelets, both 7p -probelets, and the first through the 10th, and the 489th through the 498th 7p tumor and normal arraylets.
- the display shows that the significance of a subtensor in the tumor dataset relative to that of the corresponding subtensor in the normal dataset, i.e., the tensor GSVD angular distance, equals the row mode GSVD angular distance, i.e., the significance of the corresponding tumor arraylet in the tumor dataset relative to that of the normal arraylet in the normal dataset.
- the tensor GSVD angular distances for the 498 pairs of 7p arraylets are depicted in a bar chart display (Fig. 9), where the angular distance corresponding to the first pair of arraylets is ⁇ /4.
- the most significant subtensor in the tumor dataset is a combination of (z) the first -probelet, which is approximately invariant across the platforms, (z ' z) the first x-probelet, which classifies the discovery set of patients into two groups of high and low coefficients, of significantly and robustly different prognoses, and (/ ' / ' / ' ) the first, most tumor-exclusive tumor arraylet, which classifies the validation set of patients into two groups of high and low correlations of significantly different prognoses consistent with the x-probelet' s classification of the discovery set.
- Figure 5 is a diagram illustrating the tensor GSVD of the patient- and platform-matched DNA copy-number profiles of the Xq chromosome arm, according to some embodiments.
- the tensor GSVD is depicted in a raster display, with relative copy-number gain, no change, and loss, explicitly showing the first through the 5th, and the 245th through the 249th Xq x-probelets, both Xq -probelets, and the first through the 10th, and the 489th through the 498th Xq tumor and normal arraylets.
- the tensor GSVD angular distances for the 498 pairs of Xq arraylets are depicted in a bar chart display (Fig. 9), where the angular distance corresponding to the first pair of arraylets is ⁇ /4.
- FIG. 9 Bar charts of the ten subtensors Sj(a, b, c) that are most significant in the 6p+12p (a) tumor, and (b) normal, 7p (c) tumor, and (d ) normal, and Xq (e) tumor, and ( / ) normal datasets, in terms of the fractions V abc , i.e., the subtensors which correspond to the coefficients of largest magnitudes are shown in Fig. 9.
- the most significant subtensor in each of the tumor datasets e.g., is Si( ⁇ , 1 , 1), which is a combination or an outer product of the first, most tumor-exclusive tumor arraylet, and the first x- and -probelets.
- the most significant subtensor in each of the normal datasets is ⁇ 3 ⁇ 4(498, 249, 1), which is a combination or an outer product of the 498th, most normal-exclusive normal arraylet, the 249th x-probelet and the first -probelet.
- the tensor generalized Shannon entropy d t of each dataset is also noted.
- a GSVD has been used to identify a global pattern of tumor-exclusive co-occurring CNAs that is correlated and possibly coordinated with OV survival. This pattern is revealed by GSVD comparison of array comparative genomic hydridization (aCGH) data from discovery and validation patient profiles from The Cancer Genome Atlas (TCGA).
- aCGH array comparative genomic hydridization
- the discovery set of patients reflects the general primary, high-grade OV patient population, with approximately 5%, 7%, 76%, and 12% of the patients diagnosed at stages I, II, III, and IV, and 218, i.e., ⁇ 88%, treated with platinum-based chemotherapy, i.e., cisp latin, carboplatin, or oxaliplatin, and 240 of the 249, i.e., >95% of the tumors at grades 2 and higher.
- platinum-based chemotherapy i.e., cisp latin, carboplatin, or oxaliplatin
- Each profile in the discovery datasets lists log 2 of TCGA level 1 background-subtracted intensity in the sample relative to the male Promega DNA reference, with signal to background >2.5 for both the sample and reference in >90% of the 391,190 autosomal probes and >65% of the 10,911 X chromosome probes that match between the two Agilent Human array CGH (aCGH) DNA microarray platforms, G4447A and G4124A. Tumor and normal probes were selected with valid data in >99% of the tumor or normal arrays of each platform, respectively. For each chromosome arm or combination of two chromosome arms, and for each platform, the ⁇ 0.5% missing data entries in the tumor and normal profiles were estimated by using the SVD, as previously described. Each profile was then centered at its copy-number median, and normalized by its copy-number sMAD.
- Each profile lists log 2 of TCGA level 1 background- subtracted intensity in the sample relative to the male Promega DNA reference, with signal to background >2.5 for both the sample and reference in >99.5% of the 391,190 autosomal probes and >96.5% of the 10,911 X chromosome probes that match between the platforms. Medians of the profiles of samples from the same patient were then taken.
- FIGS. 6-8 show tumor-exclusive and platform-consistent DNA copy-number alterations (CNAs) correlated with OV patients' survival, in some embodiments.
- CNAs DNA copy-number alterations
- a plot of the first 6p+12p tumor array let describes a pattern of tumor-exclusive and platform-consistent co- occurring CNAs across the combination of the two chromosome arms 6p+12p (see (a)).
- the probes are ordered, and their copy numbers are colored according to each probe's chromosomal band location.
- Segments (black lines) amplified and deleted include most known OV-associated CNAs that map to 6p+12p (black), including an amplification of Kras and a deletion of Priml.
- CNAs previously unrecognized in OV include a deletion of the p38-encoding Mapkl4, and p21- encoding CdknlA, and an amplification of Rad51APl, a deletion of Tnf, and focal amplifications of Asun, Itpr2, and the 5' ends of isoforms a and e, and exons 5 and 6 of Sox5.
- a high 6p+12p arraylet correlation is significantly correlated with a patient's shorter survival time.
- a plot of the first 6p+12p x-probelet describes the classification of the discovery set of patients into two groups of high and low coefficients (see (b)).
- a high 6p+12p x-probelet coefficient is significantly and robustly correlated with a patient's shorter survival time.
- a raster display of the 6p+12p tumor profiles, where medians of the profiles of the same patient measured by the two platforms were taken, with relative gain, no change, and loss of DNA copy numbers is shown in (c).
- a plot of the first 7p tumor arraylet describes a pattern of CNAs across the chromosome arm 7p (see (d)).
- CNAs previously unrecognized in OV include a focal deletion of Rpa3 and an amplification of Pold2.
- a high 7p arraylet correlation is significantly correlated with a patient's longer survival time.
- a plot of the first 7p x-probelet describes the classification of the discovery set of patients into two groups of high and low coefficients is shown in (e).
- a high 7p x-probelet coefficient is significantly and robustly correlated with a patient's longer survival time.
- a raster display of the 7p tumor profiles is shown in (f).
- a plot of the first Xq tumor arraylet is shown in (g).
- CNAs previously unrecognized in OV include a focal deletion of Pabpc5 and an amplification of Bcap31.
- a high Xq arraylet correlation is significantly correlated with a patient's longer survival time.
- a plot of the first Xq x-probelet describes the classification of the discovery set of patients into two groups of high and low coefficients (see (h)).
- a high Xq x-probelet coefficient is significantly and robustly correlated with a patient's longer survival time.
- a raster display of the Xq tumor profiles is shown in (i).
- KM Kaplan-Meier curves of the discovery set of 249 patients classified by the standard OV indicators are shown in Fig. 10: (a) tumor stage at diagnosis, the best predictor of OV survival to date, (b) residual disease after surgery, i.e., no (No) or some (Yes) macroscopic disease, (c) outcome of subsequent therapy, i.e., complete remission (CR) or not (No), (d) neoplasm status, i.e., with (W) tumor or without (WO).
- Fig. 11 shows KM curves of survival analysis for the validation set of 148 stage III-IV patients classified by (a) tumor stage at diagnosis, (b) residual disease after surgery, i.e., no (No) or some (Yes) macroscopic disease, (c) outcome of subsequent therapy, i.e., complete remission (CR) or not (No), (d) neoplasm status, i.e., with (W) tumor or without (WO).
- Figure 12 shows survival analyses of the discovery and validation sets of patients classified by tensor GSVD, or tensor GSVD and tumor stage at diagnosis.
- KM curves of the discovery set of 249 patients classified by the 6p+12p x-probelet coefficient show a median survival time difference of 1 1 months, with the corresponding log-rank test f-value ⁇ 10 ⁇ 2 .
- the univariate Cox proportional hazard ratio is 1.7.
- KM curve (b) shows survival analyses of the 249 patients classified by the 7p x-probelet coefficient.
- KM curve (c) shows survival analysis of the 249 patients classified by the Xq x-probelet coefficient.
- KM curve (d) shows survival analysis of the 249 patients classified by both the 6p+12p tensor GSVD and tumor stage at diagnosis, show the bivariate Cox hazard ratios of 1.5 and 4.0, which do not differ significantly from the corresponding univariate hazard ratios of 1.7 and 4.4, respectively.
- 6p+12p tensor GSVD is independent of stage, the best predictor of OV survival to date.
- the 61 months KM median survival time difference is about 85% and more than two years greater than the 33 month difference between the patients classified by stage alone. This means that the tensor GSVD and stage combined make a better predictor than stage alone.
- KM curve (e) shows survival analysis for the 249 patients classified by both the 7p tensor GSVD and stage.
- KM curve (f) shows survival analysis for the 249 patients classified by both the Xq tensor GSVD and stage.
- KM curves of the validation set of 148 stage III-IV patients classified by the 6p+12p arraylet correlation show a median survival time difference of 22 months, with the corresponding log-rank test P- value ⁇ 10 ⁇ 2 , and the univariate Cox proportional hazard ratio 1.9. This validates the survival analyses of the discovery set of 249 patients.
- KM curve (h) shows survival analyses of the 148 patients classified by the 7p arraylet correlation.
- KM curve (i) shows survival analysis for the 148 patients classified by the Xq arraylet correlation.
- Figure 13 shows survival analyses of the platinum-based chemotherapy patients in the discovery and validation sets classified by tensor GSVD, or tensor GSVD and tumor stage at diagnosis.
- the univariate Cox proportional hazard ratio is 2.0.
- KM curve (b) shows survival analyses of the 218 patients classified by the 7p x-probelet coefficient.
- KM curve (c) shows survival analysis for the 218 patients classified by the Xq x-probelet coefficient.
- the 218 patients classified by both the 6p+12p tensor GSVD and tumor stage at diagnosis show the bivariate Cox hazard ratios of 1.8 and 4.1 , which do not differ significantly from the corresponding univariate hazard ratios of 2.0 and 4.4, respectively (see KM curve (d). This means that the 6p+12p tensor GSVD is independent of stage, the best predictor of OV survival to date.
- KM curve (e) shows survival analysis for the 218 patients classified by both the 7p tensor GSVD and stage.
- KM curve ( ⁇ ) shows survival analysis for tThe 218 patients classified by both the Xq tensor GSVD and stage.
- KM curves of only the 140, i.e., -95% platinum-based chemotherapy patients in the validation set, classified by the 6p+12p arraylet correlation show a median survival time difference of 18 months, with the univariate Cox proportional hazard ratio 1.8 (see (g)). This validates the survival analyses of the 218 chemotherapy patients in the discovery set.
- KM curve (h) shows survival analyses of the 148 patients classified by the 7p arraylet correlation.
- KM curve ( ⁇ ) shows survival analysis for tThe 148 patients classified by the Xq arraylet correlation.
- Figure 14 shows survival analyses of the validation set of patients classified by tensor GSVD and tumor stage at diagnosis.
- KM curves of the validation set of 148 stage III-IV patients classified by both the 6p+12p tensor GSVD and tumor stage at diagnosis show the bivariate Cox hazard ratios of 1.9 and 1.8, which are the same as the corresponding univariate ratios (see (a)).
- the 34 months KM median survival time difference is about 62% and more than one year greater than the 21 month difference between the patients classified by stage alone.
- KM curve (b) shows survival analysis for the 148 patients classified by both the 7p tensor GSVD and stage.
- KM curve (c) shows survival analysis for the 148 patients classified by both the Xq tensor GSVD and stage.
- Figure 15 shows survival analyses of the discovery set of patients classified by tensor GSVD and standard OV indicators other than stage.
- Figure 16 shows survival analyses of the validation set of patients classified by tensor GSVD and standard OV indicators other than stage.
- Figure 17 shows survival analyses of the discovery and validation sets of patients classified by the novel frequent focal CNAs included in the tensor GSVD arraylets.
- Six novel frequent focal CNAs that are included in the tensor GSVD arraylets are significantly correlated with OV survival.
- Two amplified consecutive segments (12pl2.1) contain (a) the 5' ends of isoforms a and e of Sox5, and (b) exons 5 and 6, the first exons that are common to isoforms a, b, d, and e of Sox5.
- Two other amplified consecutive segments (12pl 1.23) contain (c) Itprl and (d) Asun.
- One deletion (7p22.1 -p21.3) contains (e) Rpa3.
- Another deletion (Xq21.31) contains (J) Pabpc5, and the sequence tag site DXS241 adjacent to translocation breakpoints observed in premature ovarian failure.
- Figure 18 shows survival analyses of the discovery and validation sets of patients, as well as only the platinum-based chemotherapy patients in the discovery and validation sets, classified by the 6p+12p, 7p, and Xq tensor GSVD combined.
- KM curves of the discovery set of 249 patients classified by combination of the 6p+12p, 7p, and Xq x-probelet coefficients show median survival times of 86, 52, and 36 months for the groups A, B, and C, respectively, with the corresponding log-rank test f-value ⁇ 10 ⁇ 3 is shown in (a).
- KM curves of the validation set of 148 stage III-IV patients classified by combination of the 6p+12p, 7p, and Xq arraylet correlation coefficients show median survival times of 72, 57, and 33 months for the groups A, B, and C, respectively, with the corresponding log-rank test P- value ⁇ 10 ⁇ 3 (see (c)).
- the f-value of a given enrichment was calculated assuming hypergeometric probability distribution of the annotations among the genes in the global set, and of the subset of annotations among the subset of genes, as previously described (Alter et al, PNAS USA, 2003, 100:3351-3356].
- Figure 19 shows differential mRNA expression between the tensor GSVD classes is consistent with the CNAs. Differential mRNA expression is shown for: (a) Tnf, (b) Mapkl4, and (c) CdknlA, which are deleted in the 6p+12p arraylet, are significantly (Mann-Whitney - Wilcoxon P- value ⁇ 0.05) underexpressed in the tensor GSVD class of a high 6p+12p x-probelet coefficient, or arraylet correlation relative to the tensor GSVD class of a low 6p+12p x-probelet coefficient, or arraylet correlation, (d) Rad51AP 1 , (e) Itpr2, and (/) Asun, which are amplified in the 6p+12p arraylet, are significantly overexpressed in the tensor GSVD class of a high 6p+12p x-probelet coefficient, or arraylet correlation, (g) Rpa3, which is deleted,
- microRNA expression profiles that were available for 395 of the 397 patients. Each profile lists TCGA level 3 microRNA expression for 639 autosomal and X chromosome microRNAs on the Agilent Human microRNA Array 8x15K platform with UCSC coordinates. Medians of the profiles of samples from the same patient were taken.
- Figure 20 shows differential microRNA expression between the tensor GSVD classes is consistent with the CNAs. Differential microRNA expression is shown for: (a) mir-877*, which is deleted, and (b) mir-200c, (c) mir-200c*, (d) mir-141 , and (e) mir-141 *, which are amplified in the 6p+12p arraylet, are significantly (Mann-Whitney-Wilcoxon f-value ⁇ 0.05) underexpressed and overexpressed, respectively, in the tensor GSVD class of a high 6p+12p x- probelet coefficient, or arraylet correlation relative to the tensor GSVD class of a low 6p+12p x- probelet coefficient, or arraylet correlation.
- Figure 21 shows differential protein expression between the tensor GSVD classes is consistent with the CNAs. Relative protein expression is shown for: (a) MAPK14, which is deleted, and (b) CDKN1B, which is amplified in the 6p+12p arraylet, are significantly (Mann- Whitney-Wilcoxon f-value ⁇ 0.05) underexpressed and overexpressed, respectively, in the tensor GSVD class of a high 6p+12p x-probelet coefficient, or arraylet correlation relative to the tensor GSVD class of a low 6p+12p x-probelet coefficient, or arraylet correlation.
- the CNAs are consistent with differential mRNA, microRNA, and protein expression between the tensor GSVD classes.
- the mRNA and protein encoded by, e.g., Mapkl4, which is deleted in the 6p+12p arraylet, are both significantly (Mann-Whitney- Wilcoxon f-values ⁇ 10 5 ) underexpressed in the tensor GSVD class of a high 6p+12p x-probelet coefficient, or arraylet correlation relative to the tensor GSVD class of a low 6p+12p x-probelet coefficient, or arraylet correlation.
- the microRNA mir-877* that maps to the same deletion as Mapkl4 is also significantly (Mann- Whitney -Wilcoxon P-value ⁇ 0.05) underexpressed.
- the discovery set of patients reflects the general primary, high-grade OV patient population, with approximately 5%, 7%, 76%, and 12% of the patients diagnosed at stages I, II, III, and IV, and 218, i.e., ⁇ 88%, treated with platinum-based chemotherapy, i.e., cisp latin, carboplatin, or oxaliplatin, and 240 of the 249, i.e., >95% of the tumors at grades 2 and higher.
- platinum-based chemotherapy i.e., cisp latin, carboplatin, or oxaliplatin
- Each profile in the discovery datasets lists log 2 of TCGA level 1 background-subtracted intensity in the sample relative to the male Promega DNA reference, with signal to background >2.5 for both the sample and reference in >90% of the 391 ,190 autosomal probes and >65% of the 10,911 X chromosome probes that match between the two Agilent Human array CGH (aCGH) DNA microarray platforms, G4447A and G4124A. Tumor and normal probes were selected with valid data in >99% of the tumor or normal arrays of each platform, respectively. For each chromosome arm or combination of two chromosome arms, and for each platform, the ⁇ 0.5% missing data entries in the tumor and normal profiles were estimated by using the SVD, as previously described. Each profile was then centered at its copy-number median, and normalized by its copy-number sMAD.
- Lemma B The tensor GSVD has the same uniqueness properties as the GSVD.
- the tensor GSVD reduces to the GSVD of the corresponding matrices. Proof.
- the tensor GSVD of Eq. (1) is
- An entropy of zero corresponds to an ordered and redundant dataset in which all the information is captured by a single subtensor.
- An entropy of one corresponds to a disordered and random dataset in which all subtensors are of equal significance.
- Table 3 describes exemplary sequences for use herein. All sequences are human.
- Affymetrix microarray probes which are mapped to a known genomic coordinate, were used to determine differential expression.
- the UCSC genome browser was used to identify genes and genomic features for the regions identified as having differential expression. Exemplary sequences were obtained from the UCSC genome browser for the relevant genes and genomic features. It will be appreciated that the relevant genes and genomic features may include variations and alternative specific sequences as known in the art.
- a phrase such as "an aspect” may refer to one or more aspects and vice versa.
- a phrase such as “an embodiment” does not imply that such embodiment is essential to the subject technology or that such embodiment applies to all configurations of the subject technology.
- a disclosure relating to an embodiment may apply to all embodiments, or one or more embodiments.
- An embodiment may provide one or more examples of the disclosure.
- a phrase such "an embodiment” may refer to one or more embodiments and vice versa.
- a phrase such as "a configuration” does not imply that such configuration is essential to the subject technology or that such configuration applies to all configurations of the subject technology.
- a disclosure relating to a configuration may apply to all configurations, or one or more configurations.
- a configuration may provide one or more examples of the disclosure.
- a phrase such as "a configuration” may refer to one or more configurations and vice versa.
- GSVD novel tensor generalized singular value decomposition
- these patterns include most known OV-associated CNAs that map to these chromosome arms, as well as several previously unreported, yet frequent focal CNAs.
- differential mRNA, microRNA, and protein expression consistently map to the DNA CNAs. A coherent picture emerges for each pattern, suggesting roles for the CNAs in OV pathogenesis and personalized therapy.
- deletion of the p21-encoding CDKNlA and p38-encoding MAPK14 and amplification of RAD51AP1 and KRAS encode for human cell transformation, and are correlated with a cell's immortality, and a patient's shorter survival time.
- RPA3 deletion and P0LD2 amplification are correlated with DNA stability, and a longer survival.
- PABPC5 deletion and BCAP31 amplification are correlated with a cellular immune response, and a longer survival.
- Profiles of tumor and normal tissues from the same set of patients have the structure of two matrices, i.e., second-order tensors, with a one-to-one mapping between the columns that correspond to the same set of patients, but not necessarily between the rows that correspond to the DNA copy-number probes with valid data in either the tumor or the normal dataset, and may be different.
- the structure of the tumor and normal datasets is that of two third-order tensors, of matched columns that correspond to the same sets of patients and platforms, and independent rows that correspond to the probes in either the tumor or the normal dataset.
- the higher-order generalized singular value decomposition is the only simultaneous decomposition to date of more than two such column-matched but row-independent datasets, which is by definition exact, and which mathematical properties allow interpreting its variables and operations in terms of the similar as well as dissimilar, e.g., biomedical reality among the datasets [3, 4] .
- the HO GSVD generalizes the GSVD [5-12] , which was demonstrated in comparative modeling of, e.g., patient- matched but probe-independent glioblastoma (GBM) brain tumor and normal DNA copy-number profiles from TCGA [13] .
- GSVD and HO GSVD are limited to datasets arranged in second-order tensors, i.e., matrices.
- a novel tensor GSVD i.e., an exact simultaneous decomposition of two datasets, arranged in two higher-than-second-order tensors of matched column dimensions but independent row dimensions.
- the tensor GSVD factors or separates the pair of tensors into corresponding pairs of "subtensors," i.e., pairs of outer products or combinations of a paired set of patterns each: patterns, one across each of the matched column dimensions, which are identical for both tensors, combined with one pattern across the independent row dimension of either one of the two tensors.
- the pairs of subtensors are of varying relative mathematical significance, i.e., the significance of one subtensor in a pair in the corresponding tensor relative to the significance of the second subtensor in the second tensor varies among the pairs of subtensors.
- the tensor GSVD extends the GSVD and the tensor higher-order singular value decomposition (HOSVD) [25-28] from a decomposition of either two column- matched matrices or one tensor, respectively, to a decomposition of two order- matched, column-matched, and row-independent tensors [29] .
- HSVD singular value decomposition
- Discovery Datasets are Pairs of Column-Matched but Row-Independent Tensors.
- the structure of these tumor and normal discovery datasets T>i and T> 2 , of .ft ⁇ -tumor and _ftT 2 - norma l probes x ⁇ patients, i.e., arrays x -platforms, is that of two third-order tensors with one-to-one mappings between the column dimensions L and M, but different row dimensions K ⁇ and K ⁇ , where K ⁇ , K2 > LM.
- a novel tensor GSVD that simultaneously separates the paired datasets into weighted sums of LM paired "subtensors," i.e., combinations or outer products of three patterns each: Either one tumor-specific pattern of copy-number variation across the tumor probes, i.e., a "tumor arraylet” u ⁇ a , or the corresponding normal-specific pattern across the normal probes, i.e., the "normal arraylet” « 2, a , combined with one pattern of copy-number variation across the patients, i.e., an "i-probelet” wj b and one pattern across the platforms, i.e., a "3 ⁇ 4 -probelet” c , which are identical for both the tumor and normal datasets (Fig. 1, and Figs. A and B in SI Appendix),
- x a Ui, x b V x and x c V y denote tensor-matrix multiplications, which contract the L -arraylet, L ⁇ x- probelet, and -3 ⁇ 4 -probelet dimensions of the "core tensor" 73 ⁇ 4 with those of Ui, V x , and V y , respectively, and where ® denotes an outer product.
- the x- and 3 ⁇ 4 -row bases vectors are, in general, non-orthogonal but normalized, and V x and V y are invertible.
- Figure 1 Tensor generalized singular value decomposition (GSVD) of the patient- and platform-matched DNA copy-number profiles of the 6p+12p chromosome arm.
- GSVD Tensor generalized singular value decomposition
- the patients, platforms, probes, and tissue types each represent a degree of freedom. Unfolded into a single matrix, some of the degrees of freedom are lost and much of the information in the datasets might also be lost.
- a tensor GSVD that simultaneously separates the paired datasets into weighted sums of paired subtensors, i.e., combinations or outer products of three patterns each: Either one tumor-specific pattern of copy-number variation across the tumor probes, i.e., a tumor arraylet (a column basis vector of U ⁇ ), or the corresponding normal-specific arraylet (a column basis vector of L3 ⁇ 4), combined with one pattern of variation across the patients, i.e., an i-probelet (a row basis vector of V X T ), and one pattern across the platforms, i.e., a j -probelet (a row basis vector of V ⁇ ), which are identical for both the tumor and normal datasets (Eq.
- the tensor GSVD is depicted in a raster display, with relative copy-number gain (red), no change (black), and loss (green), explicitly showing the first through the 5th, and the 245th through the 249th 6p+12p i-probelets, both 6p+12p 3 ⁇ 4 -probelets, and the first through the 10th, and the 489th through the 498th 6p+12p tumor and normal arraylets.
- the significance of a subtensor in the tumor dataset relative to that of the corresponding subtensor in the normal dataset i.e., the tensor GSVD angular distance
- the row mode GSVD angular distance i.e., the significance of the corresponding tumor arraylet in the tumor dataset relative to that of the normal arraylet in the normal dataset.
- the tensor GSVD angular distances for the 498 pairs of 6p+12p arraylets are depicted in a bar chart display, where the angular distance corresponding to the first pair of arraylets is ⁇ /4.
- the most significant subtensor in the tumor dataset (which corresponds to the coefficient of largest magnitude in IZi) is a combination of (i) the first j -probelet, which is approximately invariant across the platforms, (ii) the first i-probelet, which classifies the discovery set of patients into two groups of high and low coefficients, of significantly and robustly different prognoses, and (in) the first, most tumor-exclusive tumor arraylet, which classifies the validation set of patients into two groups of high and low correlations of significantly different prognoses consistent with the i-probelet's classification of the discovery set.
- the generalized singular values are positive, and are arranged in ⁇ i 5 ⁇ ix , and ⁇ iy in decreasing orders of the corresponding "GSVD angular distances," i.e., decreasing orders of the ratios ⁇ ⁇ / ⁇ 2, ⁇ , cix, b /c'2x, b , and ai yt C /a2y,c, respectively.
- the "tensor generalized singular values" 73 ⁇ 4 ia t, c tabulated in the core tensors are real but not necessarily positive.
- Our tensor GSVD construction generalizes the GSVD to higher orders in analogy with the generalization of the singular value decomposition (SVD) by the HOSVD [25-28] , and is different from other approaches to the decomposition of two tensors [29] .
- the tensor GSVD has the same uniqueness properties as the GSVD, where the column bases vectors u ⁇ a and the row bases vectors wj b and wj c are unique, except in degenerate subspaces, defined by subsets of equal generalized singular values a ix , and a iy , respectively, and up to phase factors of ⁇ 1, such that each vector captures both parallel and antiparallel patterns (Lemma B in SI Appendix).
- the tensor GSVD of two second-order tensors reduces to the GSVD of the corresponding matrices (Corollary A in SI Appendix).
- ⁇ ⁇ arctan(CT li0 /CT 2i0 ) - ⁇
- the ratio ⁇ ⁇ / ⁇ 2 ⁇ indicates the significance of u ⁇ a in D relative to the significance of «2 i(I in I3 ⁇ 4) this relative significance is defined, as previously described [12, 13], by the angular distance ⁇ ⁇ , a function of the ratio ⁇ ⁇ / ⁇ 2 ⁇ , which is antisymmetric in D and !3 ⁇ 4 ⁇
- the angular distance ⁇ ⁇ which is a function of the arctangent of the ratio, i.
- the subtensor to be tumor-exclusive and platform-consistent: include the tumor arraylet u ⁇ a that is the most exclusive to the tumor dataset, i.e., « ⁇ , ⁇ , as well as a 3 ⁇ 4 -probelet Vy C of consistent, i.e., approximately equal copy numbers in both platforms.
- the subtensor to be correlated with an OV patient's prognosis in the discovery set of patients, i.e., include an i-probelet wj b that classifies the discovery set of patients into two groups of high (>0.5 standardized median absolute deviation, i.e., sMAD, from the median) and low coefficients, of significantly (log-rank test P- value ⁇ 0.05) and robustly (throughout the range of ⁇ 0.1 sMAD around the cutoff) different prognoses (Fig. 2).
- the subtensor to be correlated with prognosis in the validation set of patients, i.e., include an arraylet that classifies the validation set of patients into two groups of high and low Spearman's rank correlation coefficients of significantly different prognoses, consistent with the i-probelet's classification of the discovery set of patients (Fig. 3, and Sec. 1.3 in SI Appendix).
- the validation set includes 148 TCGA patients, mutually exclusive of the discovery set, with primary OV tumor profiles measured by at least one of the two DNA microarray platforms that were used to measure the discovery datasets (S2 Dataset).
- CNAs Tumor-exclusive and platform-consistent DNA copy-number alterations correlated with ovarian serous cystadenocarcinoma (OV) patients' survival
- Plot of the first 6p+12p tumor arraylet describes a pattern of tumor-exclusive and platform-consistent co-occurring CNAs across the combination of the two chromosome arms 6p+12p.
- the probes are ordered, and their copy numbers are colored according to each probe's chromosomal band location.
- Segments (black lines) amplified and deleted include most known OV-associated CNAs that map to 6p+12p (black), including an amplification of KRAS and a deletion of PRIM2.
- CNAs previously unrecognized in OV include a deletion of the p38-encoding MAPK14, and p21-encoding CDKNlA, and an amplification of RAD51AP1, a deletion of TNF, and focal amplifications of ASUN, ITPR2, and the 5' ends of isoforms a and e, and exons 5 and 6 of SOX5.
- a high 6p+12p arraylet correlation is significantly correlated with a patient's shorter survival time.
- Plot of the first 6p+12p i-probelet describes the classification of the discovery set of patients into two groups of high (blue) and low (red) coefficients.
- a high 6p+12p ⁇ -probelet coefficient is significantly and robustly correlated with a patient's shorter survival time
- (d) Plot of the first 7p tumor arraylet describes a pattern of CNAs across the chromosome arm 7p.
- CNAs previously unrecognized in OV (red) include a focal deletion of RPA3 and an amplification of POLD2.
- a high 7p arraylet correlation is significantly correlated with a patient's longer survival time.
- ( e) Plot of the first 7p i-probelet describes the classification of the discovery set of patients into two groups of high (red) and low (blue) coefficients.
- a high 7p i-probelet coefficient is significantly and robustly correlated with a patient's longer survival time.
- CNAs previously unrecognized in OV (red) include a focal deletion of PABPC5 and an amplification of BCAP31.
- a high Xq arraylet correlation is significantly correlated with a patient's longer survival time
- (h) Plot of the first Xq i-probelet describes the classification of the discovery set of patients into two groups of high (red) and low (blue) coefficients.
- a high Xq i-probelet coefficient is significantly and robustly correlated with a patient's longer survival time,
- the 6p+12p tensor GSVD and stage are independent predictors of survival. Therefore, combined with any one of the standard indicators, each of the three tensor GSVDs makes a better predictor than the standard indicator alone (Figs. H and I in SI Appendix).
- the Kaplan-Meier (KM) median survival time difference of 61 months among the discovery set of patients classified by both the 6p+12p tensor GSVD and stage is about 85% and more than two years greater than the 33 month difference between the patients classified by stage alone [19] .
- the KM median survival difference of 34 months among the validation set of patients classified by both the 6p+12p tensor GSVD and stage is about 62% and more than one year greater than the 21 month difference between the patients classified by stage alone.
- the validation set reflects the high-stage OV patient population, with approximately 20% and 80% of the patients diagnosed at stages III and IV, respectively.
- the 6p+12p, 7p, and Xq tensor GSVDs therefore, predict survival both in the general as well as in the high-stage OV patient population.
- the discovery and validation sets each include mostly, i.e., >95% high-grade, i.e., grades 2 and higher tumors. Tumor grade does not correlate with survival in either the discovery or the validation set of patients.
- group B the three combinations where just one of the three binomial classifications differs from that of group A, indicate shorter survival time and worse response to chemotherapy than those of group A.
- group C the four combinations where at least two of the three binomial classifications differ from that of group A, indicate shorter survival time and worse response to chemotherapy than those of group B as well as group A.
- the KM median survival times of the discovery set of patients classified into groups A, B, and C are 86, 52, and 36 months, such that the median survival time of group A is more than four years greater than, and more than twice that of group C.
- OV tumors exhibit significant CNA variation among them, much more so than, e.g., GBM brain tumors [2, 13] . Very few frequently occurring OV CNAs have been identified to date.
- the three tensor GSVD arraylets include most known OV-associated CNAs that map to the corresponding chromosome arms, and several previously unreported yet frequent CNAs in >23% of the patients.
- the 6p+12p arraylet includes two segments corresponding to the only known OV focal CNAs that map to 6p+12p, 7p, or Xq (Sec. 2.2 in SI Appendix).
- One, a deletion (6pll.2) overlaps the 3' end unique to isoform a of the DNA primase polypeptide 2- encoding PRIM2 [2] .
- the three arraylet patterns include novel frequent focal CNAs (segments ⁇ 125 probes).
- four amplifications and two deletions are significantly correlated with OV survival (Fig. J in SI Appendix).
- the amplifications flank the segment that contains KRAS.
- Two consecutive segments (12pl2.1) contain the 5' ends of isoforms a and e of SOX5, and exons 5 and 6, the first exons that are common to isoforms a, b, d, and e of SOX5 [35] .
- Two other consecutive segments (12pll.23) contain the inositol 1,4,5-trisphosphate receptor type 2-encoding ITPR2, and the asunder spermatogenesis regulator-encoding ASUN.
- ASUN was discovered in a screen of expressed sequence tags on 12pl l-pl2, which DNA amplification correlated with mRNA overexpression in four human testicular seminomas and one ovarian papillary serous adenocarcinoma cell line, exemplifying human germ cell tumors [36] .
- ASUN and its homologs are essential for nuclear division after DNA replication in the HeLa human cervical cancer cell line, the frog, and the fly [37] .
- One deletion (7p22.1-p21.3) contains the replication protein A3-encoding RPA3.
- the other (Xq21.31) contains the cytoplasmic poly(A)-binding protein 5-encoding PABPC5, and the sequence tag site DXS241 adjacent to translocation breakpoints observed in premature ovarian failure [38] . Possible Roles in OV Pathogenesis.
- the differential mRNA expression of genes from these enriched ontologies that are located on any one of the chromosome arms is consistent with the CNAs across that arm (Fig. K in SI Appendix, and S4 Dataset). Genes that map to amplifications or deletions on any one arraylet pattern, are overexpressed or underexpressed, respectively, in the patients which tumor profiles are classified, by the corresponding tensor GSVD, as highly similar to that pattern, i.e., patients of high i-probelet coefficients or arraylet correlations.
- the differential expression of all microRNAs and proteins that map to any one of the chromosome arms is also consistent with the CNAs across that arm (Sec. 2.3, and Figs. L and M in SI Appendix, and S5 and S6 Datasets). A coherent picture emerges for each pattern, suggesting roles for the CNAs in OV pathogenesis in addition to personalized diagnosis, prognosis, and treatment.
- 6p+12p A cell's transformation and immortality are correlated with a patient's shorter survival.
- MHC major histocompatibility
- GO:0071479 genes are underexpressed, including the p21 cyclin-dependent kinase inhibitor-encoding CDKNlA, and the p38 mitogen- activated protein kinase-encoding MAPK14, which map to a deletion >45 Mbp on the telomeric part of 6p (6p25.3-p21.1). Also underexpressed is p38, the protein encoded by MAPK14- All GO:0042611 genes, including the tumor necrosis factor-encoding TNF, are underexpressed, and map to the same deletion.
- the one microRNA that is significantly differentially expressed between the 6p+12p tensor GSVD classes, and maps to the same deletion, is the splicing-dependent microRNA miR-877*, which is encoded by the 13th intron of the ATP- binding cassette subfamily F member 1-encoding gene ABCF1 [44] . Both miR-877* and ABCF1 are consistently underexpressed.
- RAD51 -associated protein 1-encoding RAD51AP1 maps to an amplification >9 Mbp on the telomeric part of 12p (12pl3.33-pl3.31) that is significantly correlated with OV survival.
- the second protein that is significantly differentially expressed between the 6p+12p tensor GSVD classes is p27.
- the cyclin-dependent kinase inhibitor CDKN1B which encodes p27, maps to a 4.5 Mbp amplification (12pl3.2-pl2.3) that is significantly correlated with OV survival, and its mRNA is overexpressed.
- the mRNA encoded by KRAS is also overexpressed.
- the 6p+12p pattern therefore, which includes the loss of the p21-encoding CDKNlA and the p38-encoding MAPK14 on 6p, and the gain of KRAS on 12p, encodes for cellular conditions that combined but not separately can lead to transformation.
- p21 and p38 are necessary for p53- mediated cell cycle arrest [45] and apoptosis [46] , respectively, in response to DNA damage.
- Overexpression of the p21-encoding CDKNlA is correlated with a low malignant potential of an ovarian tumor [47] .
- RAD51AP1 overexpression disrupts cell cycle arrest and apoptosis, can lead to cellular resistance to DNA-damaging cancer therapies, such as platinum- based chemotherapy, and may increase DNA instability [48] .
- TNF- induced apoptosis is correlated with downregulation of ITPR2 [49] .
- the genes that are significantly differentially expressed between the 7p tensor GSVD classes are enriched (hypergeometric P- value ⁇ 10 -10 ) in the ontology of DNA strand elongation involved in DNA replication (GO:0006271). Most of these genes are overexpressed, including the DNA polymerase delta subunit 2-encoding POLD2 that is essential for DNA replication and repair, which maps to an amplification >17 Mbp on the centromeric part of 7p (7pl4.1-pll.2). Only two genes are underexpressed: RPA3 on 7p and the DNA ligase IV- encoding LIG4 on 13q.
- Xq. Cellular immune response is correlated with a longer survival.
- the genes that are differentially expressed between the Xq tensor GSVD classes are enriched (hypergeometric P-value ⁇ 10 -6 ) in the ontology of antigen processing and presentation of peptide antigen (GO:0048002). Most of these genes are overexpressed, including the B-cell receptor-associated protein 31-encoding BCAP31, which maps to an amplification >11 Mbp on the telomeric part of Xq (Xq27.3-q28).
- the GSVD comparative modeling of patient-matched GBM tumor and normal copy-number profiles separated the prognosis-correlated GBM tumor-exclusive pattern from the female-specific X chromosome amplification as well as from experimental artifacts (or batch effects) due to experimental variations in, e.g., tissue batch, genomic center, hybridization date, and scanner, without a-priori knowledge of these variations.
- Additional possible applications of the tensor GSVD in personalized medicine include comparative modeling of two patient- and tissue-matched datasets, each corresponding to (i) a set of large-scale molecular biological profiles, e.g., DNA copy numbers, acquired by a high-throughput technology, e.g., DNA microarrays; (ii) a set of biomedical images or signals; or (in) a set of cellular pathological observations, e.g., a tumor's stage.
- Such tensor GSVD comparative models can uncover variations across the patients and tissues that are common to, possibly causally coordinated between the two aspects of the disease. In clinical settings, such tensor GSVD comparative models can determine an individual patient's medical status in relation to all the other patients in a set, and inform the patient's diagnosis, prognosis and treatment.
- a novel poly(A)-binding protein gene maps to an X-specific subinterval in the Xq21.3/Ypll.2 homology block of the human sex chromosomes. Genomics. 2001;74: 1-11.
- SI Appendix A PDF format file, readable by Adobe Acrobat Reader.
- Discovery Datasets are Pairs of Column- higher-than-third order. ⁇ Matched but Row-Independent Tensors. The
- the discovery set of patients reflects the general primary, Corollary A .
- the tensor high-grade OV patient population with approximately GSVD reduces to the GSVD of the corresponding matri5%, 7%, 76%, and 12% of the patients diagnosed at ces.
- the tensor GSVD of Eq. (1) is boplatin, or oxaliplatin, and 240 of the 249, i.e., >95%
- third-order tensors T>i is constructed from the GSVDs (A3) of Eqs. (2) and (3), of the pairs of full column-rank
- V x or V y exist, and, therefore, the tensor GSVD of
Landscapes
- Health & Medical Sciences (AREA)
- Engineering & Computer Science (AREA)
- Life Sciences & Earth Sciences (AREA)
- Physics & Mathematics (AREA)
- Medical Informatics (AREA)
- General Health & Medical Sciences (AREA)
- Bioinformatics & Cheminformatics (AREA)
- Biomedical Technology (AREA)
- Biotechnology (AREA)
- Public Health (AREA)
- Bioinformatics & Computational Biology (AREA)
- Molecular Biology (AREA)
- Biophysics (AREA)
- Evolutionary Biology (AREA)
- Spectroscopy & Molecular Physics (AREA)
- Theoretical Computer Science (AREA)
- Genetics & Genomics (AREA)
- Chemical & Material Sciences (AREA)
- Databases & Information Systems (AREA)
- Analytical Chemistry (AREA)
- Data Mining & Analysis (AREA)
- Epidemiology (AREA)
- Pathology (AREA)
- Proteomics, Peptides & Aminoacids (AREA)
- Primary Health Care (AREA)
- Immunology (AREA)
- Bioethics (AREA)
- Hematology (AREA)
- Urology & Nephrology (AREA)
- Medicinal Chemistry (AREA)
- Microbiology (AREA)
- Food Science & Technology (AREA)
- Cell Biology (AREA)
- Biochemistry (AREA)
- General Physics & Mathematics (AREA)
- Artificial Intelligence (AREA)
- Computer Vision & Pattern Recognition (AREA)
- Evolutionary Computation (AREA)
- Software Systems (AREA)
- Medical Treatment And Welfare Office Work (AREA)
Abstract
According to various embodiments herein, methods for performing diagnosis and prognosis of OV have been provided. In embodiments, a method of determining an estimated outcome or predicting a clinical response to chemotherapy for a patient having ovarian serous cystadenocarcinoma (OV), comprises obtaining a biological sample from a patient diagnosed with OV, said sample comprising at least one of nucleic acids and proteins from the patient; detecting in said sample a value of an indicator of a differential expression;and calculating, by a processor, a weighted sum pattern based on the value of one or more of the indicators of differential expression;and estimating, by the processor and based on the weighted sum pattern, a predicted length of survival of the patient or a predicted clinical response to chemotherapy for the patient.
Description
GENETIC ALTERATIONS IN OVARIAN CANCER
CROSS REFERENCE TO RELATED APPLICATIONS
[0001] This application claims priority to U.S. Provisional Application No. 62/147,555, entitled "Advanced Tensor Decompositions for Computational Assessment in Ovarian Cancer," and U.S. Provisional Application No. 62/147,545, entitled "Genetic Alterations in Ovarian Cancer," each filed April 14, 2015, the disclosures of which are hereby incorporated by reference in their entireties.
GOVERNMENT LICENSE RIGHTS
[0002] This invention was made with government support under the Utah Science Technology and Research (USTAR) Initiative and the National Human Genome Research Institute (NHGRI) R01 Grant HG-004302; and the National Science Foundation (NSF) CAREER Award DMS- 0847173. The government has certain rights in this invention.
FIELD
[0003] The subject technology relates generally to computational biology and its use to identify genetic patterns related to cancer.
BACKGROUND
[0004] In many areas of science, especially in biotechnology, the number of high-dimensional datasets recording multiple aspects of a single phenomenon is increasing. This increase is accompanied by a fundamental need for mathematical frameworks that can compare multiple large-scale matrices with different row dimensions. In the field of biotechnology, these matrices may represent biological reality through large-scale molecular biological data such as, for example, mRNA expression measured by DNA microarray.
[0005] Recent efforts have focused on developing ways of modeling and analyzing large-scale molecular biological data through the use of the matrices and their generalizations in different types of genomic data. One of the goals of these efforts is to computationally predict mechanisms that govern the activity of DNA and RNA. For example, matrices have been used to predict global causal coordination between DNA replication origin activity and mRNA
expression from mathematical modeling of DNA microarray data. The mathematical variables, that is patterns, uncovered in the data correlate with activities of cellular elements such as regulators or transcription factors. The operations, such as classification, rotation, or reconstruction in subspaces of these patterns, simulate experimental observation of the correlations and possibly even the causal coordination of these activities.
[0006] Recently, a generalized singular value decomposition was demonstrated in comparative modeling of patient-matched but probe-independent glioblastoma (GBM) brain tumor and normal DNA copy-number profiles in the TCGA. Analysis showed and validated a pattern correlated with a GBM patient's prognosis and response to chemotherapy.
[0007] These types of analyses also have the potential to be extended to the study of pathological diseases to identify patterns that correlate and possibly coordinate with the diseases.
Summary
[0008] Ovarian serous cystadenocarcinoma (OV) accounts for about 90% of all ovarian cancers. Most of the OV tumors, i.e. greater than 95%, are high-grade tumors. OV exhibits a range of copy-number alterations (CNA), some of which are believed to play a role in the cancer's pathogenesis. OV copy number alteration data are available from The Cancer Genome Atlas (TCGA).
[0009] Despite recent large-scale profiling efforts, the best predictor of OV survival to date has remained the tumor's stage at diagnosis, a pathological assessment of the spread of the cancer numbering I to IV. Other indicators of prognosis are dense adherence and the presence of large- volume ascites. Traditional treatments of OV include, but are not limited to, platinum-based chemotherapy, radiation, radiosurgery, surgery, etc. About 25% of primary OV tumors are resistant to platinum-based chemotherapy. Further, most recurrent OV tumors develop resistance to platinum-based chemotherapy. Even though drugs exist for platinum-based chemotherapy resistant OV, no pathology laboratory diagnostic currently exists that distinguishes between resistant and sensitive tumors before treatment. OV tumors exhibit significant CNA variation, much more so than, e.g., GBM tumors. Further, very few frequent CNAs typical of OV have been identified so far.
[0010] Therefore, there is a need to model and analyze the large scale molecular biological data of OV patients in order to identify genomic features or factors (e.g., genes) and mechanisms
that allow one to make predictions on the course of the disease and/or possible treatments. The subject technology identifies and utilizes such genomic features that are useful in the diagnosis and prognosis of OV.
[0011] According to various embodiments of the subject technology, methods for performing diagnosis and prognosis of OV have been provided. In embodiments, a method of determining an estimated outcome or predicting a clinical response to chemotherapy for a patient having ovarian serous cystadenocarcinoma (OV), comprises obtaining a biological sample from a patient diagnosed with OV, said sample comprising at least one of nucleic acids and proteins from the patient; detecting in said sample a value of an indicator of a differential expression of at least one of (a) a nucleotide sequence having at least 90% sequence identity to at least one of the genes selected from CkdnlA, Mapkl4, Kras, Rad51APl, Tnf, Itpr2, Rpa3, Pold2, Lig4, Pabpc5, BcapSl, and Gabre; (b) a protein encoded by the genes of (a); (c) a nucleotide sequence having at least 90% sequence identity to at least one of cytogenic bands 1-7 and 11 -17; (d) a microRNA sequence selected from miR-877, miR-877*, miR-200c, miR-141 , miR-888, miR-452, and miR- 224; (e) a segment overlapping with the Prim2 gene; and (f) a nucleotide sequence having at least 90% sequence identity to DSX214; calculating, by a processor, a weighted sum pattern based on the value of one or more of the indicators of differential expression; and estimating, by the processor and based on the weighted sum pattern, a predicted length of survival of the patient or a predicted clinical response to chemotherapy for the patient. In embodiments, the method further comprises recommending administering a treatment regimen based on the predicted length of survival of the patient or clinical response to chemotherapy. In embodiments, the method comprises administering a treatment regimen based on the predicted length of survival or clinical response to chemotherapy of the patient. In embodiments, the method further comprises recommending a treatment regimen based on the predicted length of survival or clinical response to chemotherapy of the patient.
[0012] In embodiments, at least one nucleotide sequence has at least 90% sequence identity to at least one one of the genes selected from CkdnlA, Mapkl4, Kras, Rad51APl, Tnf, Itpr2, Rpa3, Pold2, Lig4, Pabpc5, Bcap31, and Gabre; and wherein the indicator of differential expression is differential copy number relative to a copy number of the at least one nucleotide sequence in normal cells. In embodiments, at least one nucleotide sequence has at least 90% sequence
identity to at least one of cytogenic band 1 -7 and cytogenic band 11 -17; and wherein the indicator of differential expression is differential copy number relative to a copy number of the at least one nucleotide sequence in normal cells. In embodiments, the at least one protein encoded by the genes of (a) is selected from CKDN1A, MAPK14, KRAS, RAD51AP1, TNF, ITPR2, RPA3, POLD2, LIG4, PABPC5, BCAP31 , and GABRE; and wherein the indicator of differential expression is differential protein expression relative to protein expression of the at least one protein in normal cells. In embodiments, the microRNA sequence is at least one of miR-877, miR-877*, miR-200c, miR-141 , miR-888, miR-452, and miR-224; and wherein the indicator of differential expression is differential copy number relative to a copy number of the at least one nucleotide sequence in normal cells.
[0013] In embodiments, the differential copy number is an increase in copy number relative to a copy number of the at least one nucleotide sequence in normal cells. In embodiments, the differential copy number is a decrease in copy number relative to a copy number of the at least one nucleotide sequence in normal cells. In embodiments, the differential protein expression is an increase in protein expression relative to protein expression in normal cells. In embodiments, the differential protein expression is a decrease in protein expression relative to protein expression in normal cells. In embodiments, the differential copy number is an increase in copy number relative to a copy number of the at least one nucleotide sequence in normal cells. In embodiments, the differential copy number is a decrease in copy number relative to a copy number of the at least one nucleotide sequence in normal cells. In embodiments, the differential expression is microRNA expression. In embodiments, the differential microRNA expression is an increase in microRNA expression relative to microRNA expression of the at least one nucleotide sequence in normal cells. In embodiments, the differential microRNA expression is a decrease in microRNA expression relative to microRNA expression of the at least one nucleotide in normal cells.
[0014] In embodiments, the method comprises correlating at least one of the indicators of differential expression selected from (a)-(f) below:
a) co-occurring copy-number loss of Pabpc5, and gain, or mRNA overexpression of Bcap31; or
b) co-occurring copy number loss of Pabpc5, and gain, or mRNA overexpression of Bcap31, and gain, or microRNA overexpression of miR-888, and miR-452; or c) co-occurring copy number loss of Pabpc5, and gain, or mRNA overexpression of Bcap31, and gain, or microRNA overexpression of miR-888, miR-452, and miR- 224; or
d) co-occurring copy-number copy number loss of Pabpc5 and sequence tag site (STS) DXS214, and gain, or mRNA overexpression of Bcap31; or e) co-occurring copy number loss of Pabpc5, and gain, or mRNA overexpression of Bcap31 and Gabre; or
f) co-occurring copy-number loss from cytogenetic bands 1-14, and gain in cytogenetic bands 16-24;
with at least one of longer survival time and sensitivity to platinum-based chemotherapy.
[0015] In embodiments the differential expression of (c) further includes correlating copy- number loss of sequence tag site DXS214 and gain or mRNA overexpression of Bcap31 and Gabre with at least one of longer survival time and sensitivity of platinum-based chemotherapy.
[0016] In embodiments, the method comprises correlating at least one of the indicators of differential expression selected from (al)-(dl) below:
al) co-occurring copy-number loss, or mRNA underexpression of Rpa3, and copy- number gain, or mRNA overexpression of Pold2; or
bl) co-occurring copy-number loss, or mRNA underexpression of Rpa3 on 7p and Lig4 on 13q, and copy-number gain, or mRNA overexpression of Pold2; or
cl) co-occurring copy-number loss, or mRNA underexpression of Lig4 on chromosome 13q, and copy-number gain, or mRNA overexpression of Pold2; or
dl) co-occurring copy-number loss from cytogenetic bands 1-7, and gain in cytogenetic bands 11-17;
with at least one of a longer survival time and sensitivity to platinum-based chemotherapy.
[0017] In embodiments, the method comprises correlating at least one of the indicators of differential expression selected from (a2)-(g2) below:
a2) co-occurring copy-number loss on chromosome 6p and gain on chromosome 12p; or
b2) co-occurring copy-number loss, or mRNA or protein under-expression of CdknlA and Mapkl4 on chromosome 6p, and copy-number gain, or mRNA or protein overexpression oiKras on chromosome 12p; or
c2) co-occurring copy-number loss, or mRNA or protein under-expression of CdknlA and Mapkl4 on 6p, and copy-number gain, or mRNA or protein overexpression of Kras and Rad51 API on 12p; or
d2) co-occurring copy-number loss, or mRNA or protein under-expression of CdknlA, Mapkl4, and Tnf on chromosome 6p, and copy-number gain, or mRNA or protein overexpression oiKras, Rad51APl, and Itpr2 on chromosome 12p; or
e2) co-occurring copy-number loss, or microRNA under-expression of miR-877* on chromosome 6p, and copy-number gain, or microRNA overexpression, of miR-200c, miR-200c*, miR-141, or miR-141 * on chromosome 12p;
(f2) co-occurring copy-number loss, or mRNA or protein under-expression of CdknlA and Mapkl4 on chromosome 6p, and copy-number gain, or mRNA or protein overexpression of Rad51APl on chromosome 12p;
(g2) co-occuring copy-number loss, or mRNA or protein under-expression of Tnf on chromosome 6p, and copy-number gain, or mRNA or protein overexpression of Itpr2 on chromosome 12p;
with at least one of shorter survival time and resistance to platinum-based chemotherapy.
[0018] In embodiments, the method comprises the differential expression of at least one of
(a2)-(g2) and further comprises correlating at least one of:
(h2) a gain in copy numbers or mRNA or protein overexpression of Sox5; or
(i2) a gain in copy numbers or mRNA or protein overexpression oiAsun; or
(j2) a gain in copy numbers or mRNA or protein overexpression oiAbcfl; or
(k2) a gain in copy numbers or mRNA or protein overexpression of CdknlB; or
(12) an mRNA or protein under-expression or loss in copy numbers of Bapl; or
(m2) a reduced abundance of Brcal -associated genome surveillance protein complex (BASC);
with at least one of a patient's shorter survival time and resistance to platinum-based chemotherapy.
[0019] In embodiments, the method comprises correlating at least one of the indicators of differential expression selected from (a)-(f), (al)-(dl), and (a2)-(e2).
[0020] In embodiments, the method further comprises correlating at least one of:
(1) an increase in copy number of the segment overlapping with SEQ ID NO: 1 with at least one of reduced length of patient survival and resistance to platinum-based chemotherapy;
(2) an increase in copy number of SEQ ID NO: 7 with at least one of reduced length of patient survival and resistance to platinum-based chemotherapy;
(3) an increase in copy number of SEQ ID NO: 10 with at least one of reduced length of patient survival and resistance to platinum-based chemotherapy;
(4) an increase in copy number of SEQ ID NO: 21 with at least one of reduced length of patient survival and resistance to platinum-based chemotherapy;
(5) an increase in copy number of SEQ ID NO: 23 with at least one of reduced length of patient survival and resistance to platinum-based chemotherapy;
(6) a decrease in copy number of SEQ ID NO: 25 with at least one of increased length of patient survival and sensitivity to platinum-based chemotherapy;
(7) a decrease in copy number of SEQ ID NO: 27 with at least one of increased length of patient survival and sensitivity to platinum-based chemotherapy;
(8) a decrease in copy number of SEQ ID NO: 29 with at least one of increased length of patient survival and sensitivity to platinum-based chemotherapy;
(9) a decrease in copy number of SEQ ID NO: 31 with at least one of reduced length of patient survival and resistance to platinum-based chemotherapy;
(10) a decrease in copy number of SEQ ID NO: 41 with at least one of reduced length of patient survival and resistance to platinum-based chemotherapy;
(11) a decrease in copy number of SEQ ID NO: 39 with at least one of reduced length of patient survival and resistance to platinum-based chemotherapy;
(12) a decrease in copy number of SEQ ID NO: 51 with at least one of reduced length of patient survival and resistance to platinum-based chemotherapy;
(13) a decrease in copy number of SEQ ID NO: 52 with at least one of reduced length of patient survival and resistance to platinum-based chemotherapy;
(14) an increase in copy number of SEQ ID NO: 56 with at least one of reduced length of patient survival and resistance to platinum-based chemotherapy;
(15) an increase in copy number of SEQ ID NO: 60 with at least one of reduced length of patient survival and resistance to platinum-based chemotherapy;
(16) an increase in copy number of SEQ ID NO: 61 with at least one of reduced length of patient survival and resistance to platinum-based chemotherapy;
(17) an increase in copy number of SEQ ID NO: 62 with at least one of reduced length of patient survival and resistance to platinum-based chemotherapy;
(18) an increase in copy number of SEQ ID NO: 64 with at least one of increased length of patient survival and sensitivity to platinum-based chemotherapy;
(19) an increase in copy number of SEQ ID NO: 70 with at least one of increased length of patient survival and sensitivity to platinum-based chemotherapy;
(20) an increase in copy number of SEQ ID NO: 78 with at least one of increased length of patient survival and sensitivity to platinum-based chemotherapy;
(21) an increase in copy number of SEQ ID NO: 79 with at least one of increased length of patient survival and sensitivity to platinum-based chemotherapy;
(22) an increase in copy number of SEQ ID NO: 80 with at least one of increased length of patient survival and sensitivity to platinum-based chemotherapy;
(23) an increase in copy number of SEQ ID NO: 81 gene with at least one of increased length of patient survival and sensitivity to platinum-based chemotherapy;
(24) a decrease in copy number of SEQ ID NO: 96 gene with at least one of increased length of patient survival and sensitivity to platinum-based chemotherapy; or any combination of (l)-(24). In embodiments, the method comprises: (i) correlating at least two of (2), (4), (6), (9)-(12), (14)-(16), (18), and (24);
(n) correlating at least two of (2), (4), (7), (9)-(12), (14)-(16), (19)-(23); or
(iii) correlating at least two of (6)-(7), and (18)-(24).
[0021] In some embodiments, methods of estimating an outcome for a patient having an OV tumor, comprises: obtaining a biological sample from a patient diagnosed with OV, said sample comprising at least one of nucleic acids and proteins from the patient; detecting in said sample a value of an indicator of a differential copy number of each of at least one of (a) a nucleotide sequence, each sequence having at least 90% sequence identity to at least one gene selected from CkdnlA, Mapkl4, Kras, Rad51APl, Tnf, Itpr2, Rpa3, Pold2, Lig4, Pabpc5, Bcap31, and Gabre; (b) a protein encoded by the genes of (a); (c) a nucleotide sequence having at least 90% sequence identity to at least one of cytogenic bands 1-7 and 11-17; (d) a microRNA sequence selected from miR-877, miR-877*, miR-200c, miR-141, miR-888, miR-452, and miR-224; (e) a segment overlapping with the Prim2 gene; and (f) a nucleotide sequence having at least 90% sequence identity to DSX214; calculating, by a processor, a weighted sum pattern based on the value of one or more of the differential copy number; and estimating, by the processor and based on the weighted sum pattern, a predicted length of survival of the patient or a predicted clinical response to chemotherapy for the patient. In embodiments, the at least one nucleotide sequence has at least 90 % sequence identity to at least one of the genes selected from Rad51APl, CdknlB, Kras, Itpr2, Rpa3, and Pabpc5, wherein the copy number of one or more of the genes is increased relative to a copy number of the at least one nucleotide sequence in normal cells and reflects an enhanced probability of length of survival of the patient relative to a probability of length of survival of patients without the increased copy number. In embodiments, the at least one nucleotide has at least 90 % sequence identity to at least one of the genes selected from
Rad51APl, CdknlB, Kras, Itpr2, Rpa3, and Pabpc5; and wherein the copy number of one or more of the genes is decreased relative to a copy number of the at least one nucleotide sequence in normal cells and reflects an enhanced probability of length of survival of the patient relative to a probability of length of survival of patients without the decreased copy number. In embodiments, the copy number of the nucleotide sequence having at least 90% sequence identity to at least one of the genes selected from CdknlA, Mapkl4, Tnf, Pold2, Bcap31 is increased relative to a copy number of the gene in normal cells which reflects an enhanced probability of length of survival of the patient relative to a probability of length of survival of patients without the increased copy number.
[0022] Alternatively, the nucleotide sequences may have at least about 85 percent sequence identity, at least about 95% sequence identity, at least about 96% sequence identity, at least about 97% sequence identity, at least about 98% sequence identity, at least about 99% sequence identity, or 100% sequence identity to at least one of the genes selected from CdknlA, Mapkl4, Tnf, Poldl, Bcap31. Sequence similarity or identity can be identified using a suitable sequence alignment algorithm, such as ClustalW2 (http://www.ebi.ac.uk/Tools/clustalw2/index.html) or "BLAST 2 Sequences" using default parameters (Tatusova, T. et al, FEMS Microbiol. Lett., 174: 187-188 (1999)).
[0023] In some embodiments, the copy number of one or more of the genes is increased relative to a copy number of the at least one nucleotide sequence in normal cells and reflects an enhanced probability of length of survival of the patient relative to a probability of length of survival of patients without the increased copy number. In other embodiments, the copy number of one or more of the genes is decreased relative to a copy number of the at least one nucleotide sequence in normal cells and reflects an enhanced probability of length of survival of the patient relative to a probability of length of survival of patients without the decreased copy number. In one particular embodiment, where the copy number of the nucleotide sequence having at least 90% sequence identity to at least one of the genes selected from Rad51APl, CdknlB, Kras, Itprl, Rpa3, Pabpc5 is decreased relative to a copy number of the gene in normal cells reflects an enhanced probability of length survival of the patient relative to a probability of length survival of patients without the decreased copy number. In another embodiment, where the copy number of the nucleotide sequence having at least 90% sequence identity to at least one of the
genes selected from CdknlA, Mapkl4, Tnf Pold2, Bcap31 is increased relative to a copy number of the gene in normal cells reflects an enhanced probability of length of survival of the patient relative to a probability of length of survival of patients without the increased copy number. In a further embodiment, where the copy number of the nucleotide sequence having at least 90% sequence identity to CdknlA, Mapkl4, Tnf is decreased relative to a copy number of the gene in normal cells and wherein the copy number of the nucleotide sequence having at least 90% sequence identity to Kras, Rad51APl and ITPR2 is increased relative to a copy number of the gene in normal cells reflects a decreased probability of length of survival relative to a probability of length of survival of patients without this pattern of increased and decreased copy number. In yet another embodiment, where the copy number of the nucleotide sequence having at least 90% sequence identity to CdknlA and Mapkl4 is decreased relative to a copy number of the gene in normal cells, and the copy number of the nucleotide sequence having at least 90% sequence identity to Kras and Rad51APl is increased relative to a copy number of the gene in normal cells reflects a decreased probability of length of survival relative to a probability of length of survival of patients without this pattern of increased and decreased copy number. In another embodiment, where wherein the copy number of the nucleotide sequence having at least 90% sequence identity to RpaS is decreased relative to a copy number of the gene in normal cells, and the copy number of the nucleotide sequence having at least 90% sequence identity to Poldl is increased relative to a copy number of the gene in normal cells reflects an increased probability of length of survival relative to a probability of length of survival of patients without this pattern of increased and decreased copy number. In a further embodiment, where the copy number of the nucleotide sequence having at least 90% sequence identity to Pabpc5 is decreased relative to a copy number of the gene in normal cells, and the copy number of the nucleotide sequence having at least 90% sequence identity to BcapSl is increased relative to a copy number of the gene in normal cells reflects an increased probability of length of survival relative to a probability of length of survival of patients without this pattern of increased and decreased copy number.
[0024] In some embodiments, the nucleotide sequence comprises DNA. In some embodiments, the nucleotide sequence comprises mRNA.
[0025] In some embodiments, the indicator comprises at least one of a mRNA level, a gene product quantity (such as the expression level of a protein encoded by the gene), a gene product activity level (such as the activity level of a protein encoded by the gene), or a copy number of: at least one of (i) the at least one gene or (ii) the one or more chromosome segments.
[0026] In some embodiments, the indicator of increased expression reflects an enhanced probability of survival of the patient relative to a probability of survival of patients without the increased expression. In other embodiments, the indicator of increased expression reflects a decreased probability of survival of the patient relative to a probability of survival of patients without the increased expression.
[0027] In some embodiments, the estimating comprises comparing the copy number to a copy number of the at least one nucleotide sequence found in cells of at least one person who does not have an OV tumor. In some embodiments, the copy number is determined by a technique selected from the group consisting of: fluorescent in-situ hybridization, complementary genomic hybridization, array complementary genomic hybridization, fluorescence microscopy, and any combination thereof. In further embodiments, a further indicator, including but not limited to, an evaluation at least one of tumor stage at diagnosis, residual disease after surgery, therapy outcome, and neoplasm status is used in conjunction with the indicator of copy number in evaluating a patient's probability of survival. In one embodiment, a tumor stage at diagnosis of III or IV reflects a decreased probability of length of survival relative to a probability of length of survival of patients with the tumor stage at diagnosis of I or II; or no macroscopic residual disease after surgery reflects an increased probability of length of survival relative to a probability of length of survival of patients with macroscopic residual disease after surgery; or the therapy outcome of complete remission after therapy reflects an increased probability of length of survival relative to a probability of length of survival of patients not in complete remission after therapy; or the neoplasm status of no tumor after therapy reflects an increased probability of length of survival relative to a probability of length of survival of patients with tumor after therapy. In embodiments, the therapy comprises chemotherapy including, but not limited to, platinum-based chemotherapy.
[0028] In some embodiments, A method of estimating an outcome for a patient having a high- grade ovarian serous cystadenocarcinoma (OV) tumor, comprises obtaining a biological sample
from a patient diagnosed with OV, said sample comprising nucleic acids from the patient; detecting in said nucleic acids a value of an indicator of a differential expression of at least one nucleotide sequence, each sequence having at least 90% sequence identity to at least one gene selected from CkdnlA, Mapkl4, Tnf, Rad51APl, CdknlB, Kras, Itpr2, Rpa3, Pold2, Pabpc5, and BcapSl; and estimating, by a processor and based on the value of the indicators of differential expression, a predicted length of survival of the patient.
[0029] In some embodiments, the nucleotide sequence comprises DNA. In some embodiments, the nucleotide sequence comprises mRNA.
[0030] In some embodiments, the indicator comprises at least one of an mRNA level, a gene product quantity, a gene product activity level, or a copy number of at least one of the at least one gene.
[0031] In some embodiments, the indicator of differential expression is an indicator of increased expression. In these embodiments, the indicator of increased expression may indicate increased expression of one or more gene selected from Rad51APl, Kras, Rpa3, and Pabpc5 which reflects a decreased probability of survival of the patient relative to a probability of survival of patients without the increased expression. In other embodiments, the indicator of increased expression indicates increased expression of one or more gene selected from CdknlA, Mapkl4, Poldl, and BcapSl which reflects an increased probability of survival of the patient relative to a probability of survival of patients without the increased expression.
[0032] In other embodiments, the indicator of differential expression is an indicator of decreased expression. In some of these embodiments, the indicator of decreased expression indicates decreased expression of one or more gene selected from Rad51APl, Kras, RpaS, and Pabpc5, which reflects an increased probability of length of survival of the patient relative to a probability of length of survival of patients without the decreased expression. In other embodiments, the indicator of decreased expression indicates increased expression of one or more gene selected from CdknlA, Mapkl4, Pold2, and Bcap31, which reflects an increased probability of length of survival of the patient relative to a probability of length of survival of patients without the decreased expression.
[0033] In some particular embodiments, the indicator of differential expression comprises increased expression of the CdknlB gene, which reflects a decreased probability of length of
survival of the patient relative to a probability of length of survival of patients without the increased expression. In other embodiments, the indicator of differential expression comprises increased expression of the Kras and Rad51APl genes and decreased expression of the CdknlA, and Mapkl4 genes, which reflects a decreased probability of length of survival of the patient relative to a probability of length of survival of patients without the differential expression. In further embodiments, the indicator of differential expression comprises increased expression of the Pold2 gene and decreased expression of the RpaS gene, which reflects an increased probability of length of survival of the patient relative to a probability of length of survival of patients without the differential expression.
[0034] In some embodiments, the therapy comprises at least one of chemotherapy or radiotherapy.
[0035] In some embodiments, the mRNA level is measured by a technique selected from the group consisting of: northern blotting, gene expression profiling, serial analysis of gene expression, and any combination thereof. In some embodiments, the gene product level is measured by a technique selected from the group consisting of enzyme-linked immunosorbent assay, fluorescence microscopy, and any combination thereof.
[0036] In other embodiments, a method of predicting a clinical response to platinum-based chemotherapy for a patient diagnosed with a cancer, comprises obtaining a biological sample from a patient diagnosed with the cancer, said sample comprising nucleic acids from the patient; detecting in said nucleic acids a value of an indicator of a differential expression of at least one nucleotide sequence, each sequence having at least 90% sequence identity to at least one gene selected from CkdnlA, Mapkl4, Tnf, Rad51APl, CdknlB, Kras, Itpr2, Rpa3, Pold2, Pabpc5, and BcapSl; and estimating, by a processor and based on the value of the indicators of differential expression, the likelihood for the patient to have a beneficial clinical response to the platinum- based chemotherapy.
[0037] In some embodiments, the nucleotide sequence comprises DNA. In some embodiments, the nucleotide sequence comprises mRNA.
[0038] In some embodiments, the mRNA level is measured by a technique selected from the group consisting of: northern blotting, gene expression profiling, serial analysis of gene expression, and any combination thereof. In some embodiments, the gene product level is
measured by a technique selected from the group consisting of enzyme-linked immunosorbent assay, fluorescence microscopy, and any combination thereof.
[0039] In some embodiments, wherein the indicator of differential expression is an indicator of increased expression. In some particular embodiments, the indicator of increased expression indicates increased expression of one or more gene selected from Rad51APl, Kras, RpaS, and Pabpc5 which reflects a likelihood for the patient to have a beneficial clinical response to the platinum-based chemotherapy of the patient relative to a likelihood for patients without the increased expression. In other embodiments, the indicator of increased expression indicates increased expression of one or more gene selected from CdknlA, Mapkl4, Pold2, and Bcap31 which reflects an increased likelihood for the patient to have a beneficial clinical response to the platinum-based chemotherapy relative to a likelihood for patients without the increased expression.
[0040] In some embodiments, the indicator of differential expression is an indicator of decreased expression. In some particular embodiments, the indicator of decreased expression indicates decreased expression of one or more gene selected from Rad51APl, Kras, RpaS, and Pabpc5, which reflects an increased likelihood for the patient to have a beneficial clinical response to the platinum-based chemotherapy relative to a likelihood for patients without the decreased expression. In other embodiments, the indicator of decreased expression indicates increased expression of one or more gene selected from CdknlA, Mapkl4, Pold2, and Bcap31, which reflects an increased likelihood for the patient to have a beneficial clinical response to the platinum-based chemotherapy relative to a likelihood for patients without the decreased expression. In further embodiments, the indicator of differential expression comprises increased expression of the Kras and Rad51APl genes and decreased expression of the CdknlA, and Mapkl4 genes, which reflects a decreased likelihood for the patient to have a beneficial clinical response to the platinum-based chemotherapy relative to a likelihood for patients without the decreased expression. In additional embodiments, the indicator of differential expression comprises increased expression of the Poldl gene and decreased expression of the RpaS gene, which reflects an increased likelihood for the patient to have a beneficial clinical response to the platinum-based chemotherapy relative to a likelihood for patients without the decreased expression. Use of an inhibitor in treating an ovarian serous cystadenocarcinoma (OV) tumor
cell, wherein said inhibitor (i) down-regulates the expression level of a nucleic acid sequence selected from the group consisting SEQ ID NO: 56, SEQ ID NO: 7, SEQ ID NO: 25, and SEQ ID NO: 27, or a combination thereof; or (ii) down- regulates the activity of an amino acid sequence selected from SEQ ID NO: 57, SEQ ID NO: 8, SEQ ID NO: 26, and SEQ ID NO: 28, or a combination thereof; and/or Use of an activator in treating an ovarian serous cystadenocarcinoma (OV) tumor cell, wherein said activator (i) up-regulates the expression level of a nucleic acid sequence selected from the group consisting of SEQ ID NO: 31, SEQ ID NO: 41, SEQ ID NO: 64, and SEQ ID NO: 70, or a combination thereof; or (ii) up-regulates the activity of an amino acid sequence selected from SEQ ID NO: 32, SEQ ID NO: 42, SEQ ID NO: 65, and SEQ ID NO: 71, and a combination thereof.
[0041] In embodiments, Use of an inhibitor in the manufacture of a medicament for reducing the proliferation or viability of an ovarian serous cystadenocarcinoma (OV) tumor cell, wherein said inhibitor (i) down-regulates the expression level of nucleic acid sequence selected from the group consisting of SEQ ID NO: 56, SEQ ID NO: 7, SEQ ID NO: 25, or a combination thereof; or (ii) down-regulates the activity of an amino acid sequence selected from SEQ ID NO: 57, SEQ ID NO: 8, SEQ ID NO: 26, and SEQ ID NO: 28, or a combination thereof.
[0042] In embodiments, Use of an activator in the manufacture of a medicament for reducing the proliferation or viability of an ovarian serous cystadenocarcinoma (OV) tumor cell, wherein said activator (i) up-regulates the expression level of a nucleic acid sequence selected from the group consisting of SEQ ID NO: 31, SEQ ID NO: 41, SEQ ID NO: 64, and SEQ ID NO: 70, or a combination thereof; or (ii) up-regulates the activity of an amino acid sequence selected from SEQ ID NO: 32, SEQ ID NO: 42, SEQ ID NO: 65, and SEQ ID NO: 71, or a combination thereof.
[0043] In some embodiments, the cancer is an ovarian serous cystadenocarcinoma (OV) tumor. In other embodiments, the cancer is selected from small cell lung cancer, non-small cell lung cancer, testicular cancer, stomach cancer, bladder cancer, colon cancer, breast cancer, adrenocortical cancer, anal cancer, endometrial cancer, non-Hodgkin lymphoma, melanoma, and head and neck cancers.
[0044] In other embodiments, A method for reducing the proliferation or viability of an ovarian serous cystadenocarcinoma (OV) tumor cell, comprises contacting the cancer cell with
(i) an inhibitor that down-regulates the expression level of a gene selected from the group consisting of Rad51APl, Kras, Rpa3, and Pabpc5, and a combination thereof; and/or (ii) an activator that up-regulates the expression level of a gene selected from the group consisting of CdknlA, Mapkl4, Pold2, and Bcap31, or a combination thereof.
[0045] In some embodiments, the inhibitor is an RNA effector molecule that down-regulates expression of a gene selected from the group consisting of Rad51APl, Kras, RpaS, and Pabpc5, or a combination thereof. In further embodiments, the RNA effector molecule is an siRNA or shRNA that targets Rad51APl, Kras, Rpa3, and Pabpc5, or a combination thereof.
[0046] In some embodiments, non-transitory machine-readable mediums encoded with instructions executable by a processing system to perform a method of estimating an outcome for a patient having a high-grade ovarian serous cystadenocarcinoma (OV) tumor, are provided. The instructions comprise code for: receiving a value of an indicator of a copy number of each of at least one nucleotide sequence, each sequence having at least 90 percent sequence identity to at least one of (i) a respective chromosome segment in cells of the OV, and (ii) at least one gene on the segment; and estimating, by a processor and based on the value, at least one of a predicted length of survival of the patient, a probability of survival of the patient, or a predicted response of the patient to a therapy for the OV.
[0047] In some embodiments, a method for treating a patient having ovarian serous cystadenocarcinoma (OV) comprises administering, in a patient diagnosed with OV, a treatment regimen based on predicted length of survival or clinical response to chemotherapy, wherein predicting estimated outcome or clinical response comprises: (1) detecting, in a biological sample from a patient having OV, differential expression of at least one of (a) a nucleic acid sequence having sequence identity to at least two of the genes selected from CkdnlA, Mapkl4, Kras, Rad51APl, Tnf, Itpr2, Rpa3, Pold2, Lig4, Pabpc5, Bcap31, and Gabre; (b) a protein encoded by one or more of the genes of (a); (c) a cytogenic band of one or more of the genes of (a) selected from the group consisting of bands 1-7 and 11-17; (d) one or more micro RNAs selected from miR-877, miR-877*, miR-200c, miR-141, miR-888, miR-452, and miR-224; (e) a segment overlapping with the Prim2 gene; or (f) the nucleic acid sequence tag site DSX214; (2) calculating, by a processor, a weighted sum pattern based on the value of one or more of the indicators of differential expression; and (3) estimating, by the processor and based on the
weighted sum pattern, a predicted length of survival of the patient or a predicated clinical response to chemotherapy for the patient. In embodiments, wherein the at least one nucleic acid has sequence identity to one of the genes selected from CkdnlA, Mapkl4, Kras, Rad51APl , Tnf, Itpr2, Rpa3, Pold2, Lig4, Pabpc5, Bcap31 , and Gabre; and wherein the indicator of differential expression is differential copy number relative to a copy number of the at least one nucleic acid sequence in normal cells.
[0048] In embodiments, the differential copy number is an increase or decrease in copy number relative to a copy number of the at least one nucleic acid sequence in normal cells. In embodiments, the at least one protein encoded by the genes of (a) is selected from CKDN1A, MAPK14, KRAS, RAD51AP1, TNF, ITPR2, RPA3, POLD2, LIG4, PABPC5, BCAP31, and GABRE; and the indicator of differential expression is differential protein expression relative to protein expression of the at least one protein in normal cells.
[0049] In embodiments, the microRNA sequence is at least one of miR-877, miR-877*, miR- 200c, miR-141, miR-888, miR-452, and miR-224; and wherein the indicator of differential expression is differential copy number relative to a copy number of the at least one nucleotide sequence in normal cells. In embodiments, the differential copy number is an increase in copy number relative to a copy number of the at least one nucleotide sequence in normal cells. In embodiments, the differential copy number is a decrease in copy number relative to a copy number of the at least one nucleotide sequence in normal cells. In embodiments, the differential protein expression is an increase in protein expression relative to protein expression in normal cells. In embodiments, the differential protein expression is a decrease in protein expression relative to protein expression in normal cells. In embodiments, the differential copy number is an increase in copy number relative to a copy number of the at least one nucleotide sequence in normal cells. In embodiments, the differential copy number is a decrease in copy number relative to a copy number of the at least one nucleotide sequence in normal cells. In embodiments, the differential expression is microRNA expression. In embodiments, the differential microRNA expression is an increase in microRNA expression relative to microRNA expression of the at least one nucleotide sequence in normal cells. In embodiments, the differential microRNA expression is a decrease in microRNA expression relative to microRNA expression of the at least one nucleotide in normal cells.
[0050] In embodiments, the method comprises correlating at least one of the indicators of differential expression selected from (a)-(f) below:
a) co-occurring copy-number loss of Pabpc5, and gain, or mRNA overexpression of Bcap31; or
b) co-occurring copy number loss of Pabpc5, and gain, or mRNA overexpression of Bcap31, and gain, or microRNA overexpression of miR-888, and miR-452; or c) co-occurring copy number loss of Pabpc5, and gain, or mRNA overexpression of Bcap31, and gain, or microRNA overexpression of miR-888, miR-452, and miR- 224; or
d) co-occurring copy-number loss of Pabpc5 and sequence tag site (STS) DXS214, and gain, or mRNA overexpression of Bcap31; or
e) co-occurring copy number loss of Pabpc5, and gain, or mRNA overexpression of Bcap31 and Gabre; or
f) co-occurring copy-number loss from cytogenetic bands 1-14, and gain in cytogenetic bands 16-24;
with at least one of longer survival time and sensitivity to platinum-based chemotherapy.
[0051] In embodiments the differential expression of (c) further includes correlating copy- number loss of sequence tag site DXS214 and gain or mRNA overexpression of Bcap31 and Gabre with at least one of longer survival time and sensitivity of platinum-based chemotherapy.
[0052] In embodiments, the method comprises correlating at least one of the indicators of differential expression selected from (al)-(dl) below:
al) co-occurring copy-number loss, or mRNA underexpression of Rpa3, and copy- number gain, or mRNA overexpression of Pold2; or
bl) co-occurring copy-number loss, or mRNA underexpression of Rpa3 on 7p and Lig4 on 13q, and copy-number gain, or mRNA overexpression of Pold2; or
cl) co-occurring copy-number loss, or mRNA underexpression of Lig4 on chromosome 13q, and copy-number gain, or mRNA overexpression of Pold2; or
dl) co-occurring copy-number loss from cytogenetic bands 1-7, and gain in cytogenetic bands 11-17;
with at least one of a longer survival time and sensitivity to platinum-based chemotherapy.
[0053] In embodiments, the method comprises correlating at least one of the indicators of differential expression selected from (a2)-(g2) below:
a2) co-occurring copy-number loss on chromosome 6p and gain on chromosome 12p; or b2) co-occurring copy-number loss, or mRNA or protein under-expression of CdknlA and Mapkl4 on chromosome 6p, and copy-number gain, or mRNA or protein overexpression oiKras on chromosome 12p; or
c2) co-occurring copy-number loss, or mRNA or protein under-expression of CdknlA and Mapkl4 on 6p, and copy-number gain, or mRNA or protein overexpression of Kras and Rad51 API on 12p; or
d2) co-occurring copy-number loss, or mRNA or protein under-expression of CdknlA, Mapkl4, and Tnf on chromosome 6p, and copy-number gain, or mRNA or protein overexpression oiKras, Rad51APl, and Itpr2 on chromosome 12p; or
e2) co-occurring copy-number loss, or microRNA under-expression of miR-877* on chromosome 6p, and copy-number gain, or microRNA overexpression, of miR-200c, miR-200c*, miR-141, or miR-141 * on chromosome 12p;
(f2) co-occurring copy-number loss, or mRNA or protein under-expression of CdknlA and Mapkl4 on chromosome 6p, and copy-number gain, or mRNA or protein overexpression of Rad51APl on chromosome 12p;
(g2) co-occuring copy-number loss, or mRNA or protein under-expression of Tnf on chromosome 6p, and copy-number gain, or mRNA or protein overexpression of Itpr2 on chromosome 12p;
with at least one of shorter survival time and resistance to platinum-based chemotherapy.
[0054] In embodiments, the method comprises the differential expression of at least one of
(a2)-(g2) and further comprises correlating at least one of:
(h2) a gain in copy numbers or mRNA or protein overexpression of Sox5; or
(i2) a gain in copy numbers or mRNA or protein overexpression oiAsun; or
(j2) a gain in copy numbers or mRNA or protein overexpression oiAbcfl; or
(k2) a gain in copy numbers or mRNA or protein overexpression of CdknlB; or
(12) an mRNA or protein under-expression or loss in copy numbers of Bapl; or
(m2) a reduced abundance of Brcal -associated genome surveillance protein complex (BASC); with at least one of a patient's shorter survival time and resistance to platinum-based chemotherapy.
[0055] In embodiments, the method comprises correlating at least one of the indicators of differential expression selected from (a)-(f), (al)-(dl), and (a2)-(e2).
[0056] In embodiments, the method further comprises correlating at least one of:
(1) an increase in copy number of the segment overlapping with SEQ ID NO: 1 with at least one of reduced length of patient survival and resistance to platinum-based chemotherapy;
(2) an increase in copy number of SEQ ID NO: 7 with at least one of reduced length of patient survival and resistance to platinum-based chemotherapy;
(3) an increase in copy number of SEQ ID NO: 10 with at least one of reduced length of patient survival and resistance to platinum-based chemotherapy;
(4) an increase in copy number of SEQ ID NO: 21 with at least one of reduced length of patient survival and resistance to platinum-based chemotherapy;
(5) an increase in copy number of SEQ ID NO: 23 with at least one of reduced length of patient survival and resistance to platinum-based chemotherapy;
(6) a decrease in copy number of SEQ ID NO: 25 with at least one of increased length of patient survival and sensitivity to platinum-based chemotherapy;
(7) a decrease in copy number of SEQ ID NO: 27 with at least one of increased length of patient survival and sensitivity to platinum-based chemotherapy;
(8) a decrease in copy number of SEQ ID NO: 29 with at least one of increased length of patient survival and sensitivity to platinum-based chemotherapy;
(9) a decrease in copy number of SEQ ID NO: 31 with at least one of reduced length of patient survival and resistance to platinum-based chemotherapy;
(10) a decrease in copy number of SEQ ID NO: 41 with at least one of reduced length of patient survival and resistance to platinum-based chemotherapy;
(11) a decrease in copy number of SEQ ID NO: 39 with at least one of reduced length of patient survival and resistance to platinum-based chemotherapy;
(12) a decrease in copy number of SEQ ID NO: 51 with at least one of reduced length of patient survival and resistance to platinum-based chemotherapy;
(13) a decrease in copy number of SEQ ID NO: 52 with at least one of reduced length of patient survival and resistance to platinum-based chemotherapy;
(14) an increase in copy number of SEQ ID NO: 56 with at least one of reduced length of patient survival and resistance to platinum-based chemotherapy;
(15) an increase in copy number of SEQ ID NO: 60 with at least one of reduced length of patient survival and resistance to platinum-based chemotherapy;
(16) an increase in copy number of SEQ ID NO: 61 with at least one of reduced length of patient survival and resistance to platinum-based chemotherapy;
(17) an increase in copy number of SEQ ID NO: 62 with at least one of reduced length of patient survival and resistance to platinum-based chemotherapy;
(18) an increase in copy number of SEQ ID NO: 64 with at least one of increased length of patient survival and sensitivity to platinum-based chemotherapy;
(19) an increase in copy number of SEQ ID NO: 70 with at least one of increased length of patient survival and sensitivity to platinum-based chemotherapy;
(20) an increase in copy number of SEQ ID NO: 78 with at least one of increased length of patient survival and sensitivity to platinum-based chemotherapy;
(21) an increase in copy number of SEQ ID NO: 79 with at least one of increased length of patient survival and sensitivity to platinum-based chemotherapy;
(22) an increase in copy number of SEQ ID NO: 80 with at least one of increased length of patient survival and sensitivity to platinum-based chemotherapy;
(23) an increase in copy number of SEQ ID NO: 81 gene with at least one of increased length of patient survival and sensitivity to platinum-based chemotherapy;
(24) a decrease in copy number of SEQ ID NO: 96 gene with at least one of increased length of patient survival and sensitivity to platinum-based chemotherapy; or any combination of (l)-(24). In embodiments, the method comprises: (i) correlating at least two of (2), (4), (6), (9)-(12), (14)-(16), (18), and (24);
(n) correlating at least two of (2), (4), (7), (9)-(12), (14)-(16), (19)-(23); or
(iii) correlating at least two of (6)-(7), and (18)-(24).
[0057] In some embodiments, a method for treating a patient having ovarian serous cystadenocarcinoma (OV), comprises administering, in a patient having OV, a treatment regimen based on predicted length of survival or clinical response to chemotherapy, wherein the predicted length of survival or predicted clinical response to chemotherapy was derived from: detecting, in a biological sample from a patient having OV, a differential expression of at least one of (a) at least two nucleic acid sequences selected from the group consisting of SEQ ID NO: 1, SEQ ID NO: 7, SEQ ID NO: 21, SEQ ID NO: 25, SEQ ID NO: 27, SEQ ID NO: 29 , SEQ ID NO: 31, SEQ ID NO: 41, SEQ ID NO: 47, SEQ ID NO: 56, SEQ ID NO: 64, SEQ ID NO: 70, SEQ ID NO: 81, SEQ ID NO: 96; (b) at least one amino acid sequence encoded by one or more of (a); or (c) at least one micro RNA selected from SEQ ID NO: 51, SEQ ID NO: 60, SEQ ID NO: 61, SEQ ID NO: 78, SEQ ID NO: 79, and SEQ ID NO: 80; calculating, by a processor, a weighted sum based on the value of one or more of the indicators of differential expression; and estimating, by a processor and based on the weighted sum, the predicted length of survival of the patient or the predicted clinical response to chemotherapy. In embodiments, the indicator of
differential expression for the nucleic acid sequences is differential copy number relative to copy number of the nucleic acid sequences in normal cells. In embodiments, the differential copy number is an increase in copy number relative to a copy number of the nucleic acid sequences in normal cells. In embodiments, the differential copy number is a decrease in copy number relative to a copy number of the nucleic acid sequences in normal cells.
[0058] In some embodiments, the amino acid sequences is proteins selected from SEQ ID NO: 8, SEQ ID NO: 22, SEQ ID NO: 26, SEQ ID NO: 28, SEQ ID NO: 32, SEQ ID NO: 42, SEQ ID NO: 50, SEQ ID NO: 57, SEQ ID NO: 65, SEQ ID NO: 71, and SEQ ID NO: 82, SEQ ID NO: 97; and wherein the indicator of differential expression is differential protein expression relative to protein expression of the at least one protein in normal cells. In embodiments, the differential protein expression is an increase in protein expression relative to protein expression in normal cells. In embodiments, the differential protein expression is a decrease in protein expression relative to protein expression in normal cells. In some embodiments, the microRNA sequence is at least one SEQ ID NO: 51, SEQ ID NO: 60, SEQ ID NO: 61, SEQ ID NO: 78, SEQ ID NO: 79, and SEQ ID NO: 80; and wherein the indicator of differential expression is differential copy number relative to a copy number of the at least one nucleic acid sequence in normal cells. In embodiments, the differential copy number is an increase in copy number relative to a copy number of the at least one nucleic acid sequence in normal cells. In embodiments, the differential copy number is a decrease in copy number relative to a copy number of the at least one nucleic acid sequence in normal cells. In embodiments, the microRNA sequence is at least one SEQ ID NO: 51, SEQ ID NO: 60, SEQ ID NO: 61, SEQ ID NO: 78, SEQ ID NO: 79, and SEQ ID NO: 80; and wherein the indicator of differential expression is differential microRNA expression relative to microRNA expression of the sequence in normal cells. In further embodiments, the differential microRNA expression is an increase in microRNA expression relative to microRNA expression of the at least one nucleic acid sequence in normal cells.
[0059] In embodiments, the differential microRNA expression is a decrease in microRNA expression relative to microRNA expression of the at least one nucleic acid in normal cells. In embodiments, the method further comprises correlating at least one of the indicators of differential expression selected from (a)-(f) below:
[0060]
a) co-occurring copy-number loss of Pabpc5, and gain, or mRNA overexpression of B cap 31; or
b) co-occurring copy number loss of Pabpc5, and gain, or mRNA overexpression of Bcap31, and gain, or microRNA overexpression of miR-888, and miR-452; or c) co-occurring copy number loss of Pabpc5, and gain, or mRNA overexpression of Bcap31, and gain, or microRNA overexpression of miR-888, miR-452, and miR- 224; or
d) co-occurring copy-number loss of Pabpc5 and sequence tag site (STS) DXS214, and gain, or mRNA overexpression of Bcap31; or
e) co-occurring copy number loss of Pabpc5, and gain, or mRNA overexpression of Bcap31 and Gabre; or
f) co-occurring copy-number copy number loss from cytogenetic bands 1-14, and gain in cytogenetic bands 16-24;
with at least one of longer survival time and sensitivity to platinum-based chemotherapy.
[0061] In embodiments the differential expression of (c) further includes correlating copy- number loss of sequence tag site DXS214 and gain or mRNA overexpression of Bcap31 and Gabre with at least one of longer survival time and sensitivity of platinum-based chemotherapy.
[0062] In embodiments, the method comprises correlating at least one of the indicators of differential expression selected from (al)-(dl) below:
al) co-occurring copy-number loss, or mRNA underexpression of Rpa3, and copy- number gain, or mRNA overexpression of Pold2; or
bl) co-occurring copy-number loss, or mRNA underexpression of Rpa3 on 7p and Lig4 on 13q, and copy-number gain, or mRNA overexpression of Poldl; or
cl) co-occurring copy-number loss, or mRNA underexpression of Lig4 on chromosome 13q, and copy-number gain, or mRNA overexpression of Poldl; or
dl) co-occurring copy-number loss from cytogenetic bands 1-7, and gain in cytogenetic bands 11-17;
with at least one of a longer survival time and sensitivity to platinum-based chemotherapy.
[0063] In embodiments, the method comprises correlating at least one of the indicators of differential expression selected from (a2)-(g2) below:
a2) co-occurring copy-number loss on chromosome 6p and gain on chromosome 12p; or b2) co-occurring copy-number loss, or mRNA or protein under-expression of CdknlA and Mapkl4 on chromosome 6p, and copy-number gain, or mRNA or protein overexpression oiKras on chromosome 12p; or
c2) co-occurring copy-number loss, or mRNA or protein under-expression of CdknlA and Mapkl4 on 6p, and copy-number gain, or mRNA or protein overexpression of Kras and Rad51 API on 12p; or
d2) co-occurring copy-number loss, or mRNA or protein under-expression of CdknlA, Mapkl4, and Tnf on chromosome 6p, and copy-number gain, or mRNA or protein overexpression oiKras, Rad51APl, and Itpr2 on chromosome 12p; or
e2) co-occurring copy-number loss, or microRNA under-expression of miR-877* on chromosome 6p, and copy-number gain, or microRNA overexpression, of miR-200c, miR-200c*, miR-141, or miR-141 * on chromosome 12p;
(f2) co-occurring copy-number loss, or mRNA or protein under-expression of CdknlA and Mapkl4 on chromosome 6p, and copy-number gain, or mRNA or protein overexpression of Rad51APl on chromosome 12p;
(g2) co-occuring copy-number loss, or mRNA or protein under-expression of Tnf on chromosome 6p, and copy-number gain, or mRNA or protein overexpression of Itpr2 on chromosome 12p;
with at least one of shorter survival time and resistance to platinum-based chemotherapy.
[0064] In embodiments, the method comprises the differential expression of at least one of
(a2)-(g2) and further comprises correlating at least one of:
(h2) a gain in copy numbers or mRNA or protein overexpression of Sox5; or
(i2) a gain in copy numbers or mRNA or protein overexpression oiAsun; or
(j2) a gain in copy numbers or mRNA or protein overexpression oiAbcfl; or
(k2) a gain in copy numbers or mRNA or protein overexpression of CdknlB; or
(12) an mRNA or protein under-expression or loss in copy numbers of Bapl; or
(m2) a reduced abundance of Brcal -associated genome surveillance protein complex (BASC); with at least one of a patient's shorter survival time and resistance to platinum-based chemotherapy.
[0065] In embodiments, the method comprises correlating at least one of the indicators of differential expression selected from (a)-(f), (al)-(dl), and (a2)-(e2).
[0066] In some embodiments, a method of treating a patient having a high-grade ovarian serous cystadenocarcinoma (OV) tumor, comprises administering, in a patient having high-grade OV, a treatment regimen based on the predicted length of survival of the patient, wherein the predicting length of survival comprises: (1) detecting, in a biological sample from a patient having OV, an indicator of differential expression comprising at least two nucleic acid sequences selected from the group consisting of SEQ ID NO: 7, SEQ ID NO: 21, SEQ ID NO: 25, SEQ ID NO: 27, SEQ ID NO: 31, SEQ ID NO: 41, SEQ ID NO: 47, SEQ ID NO: 56, SEQ ID NO: 64, SEQ ID NO: 70, SEQ ID NO: 81, SEQ ID NO: 96; (b) level of expression of the nucleic acid sequences in (a); or (c) copy number of at least one of (a); and (2) calculating, by a processor, a weighted sum pattern based on the value of one or more indicators of differential expression; and (3) estimating, by the processor and based on the weighted sum pattern, a predicted length of survival of the patient. In embodiments, the nucleic acid sequence comprises DNA or mRNA.
[0067] In embodiments, the indicator of differential expression is an indicator of increased expression. In embodiments, the indicator of increase in expression indicates increased expression of at least two nucleic acid sequences selected from SEQ ID NO 56. SEQ ID NO: 7, SEQ ID NO: 25. SEQ ID NO: 27, SEQ ID NO: 31, SEQ ID NO: 41, SEQ ID NO: 64, and SEQ ID NO: 70, which reflects a decreased probability of survival of the patient relative to a probability of survival of patients without the increased expression. In further embodiments, the indicator of differential expression is an indicator of decreased expression. In embodiments, the indicator of decreased expression indicates decreased expression of the nucleic acid sequences selected from SEQ ID NO: 31, SEQ ID NO: 41, SEQ ID NO: 64, SEQ ID NO: 56, SEQ ID NO: 7, SEQ ID NO: 25, SEQ ID NO 27, and SEQ ID NO: 70, which reflects an increased probability of length of survival of the patient relative to a probability of length of survival of patients without the decreased expression. In embodiments, the indicator of differential expression
comprises increased expression of SEQ ID NO: 62, which reflects a decreased probability of length of survival of the patient relative to a probability of length of survival of patients without the increased expression. In some embodiments, the indicator of differential expression comprises increased expression of SEQ ID NO: 7 and SEQ ID NO: 56 and decreased expression of SEQ ID NO: 31 and SEQ ID NO: 41 , which reflects a decreased probability of length of survival of the patient relative to a probability of length of survival of patients without the differential expression. In embodiments, the indicator of differential expression comprises increased expression of SEQ ID NO: 64 and decreased expression of SEQ ID NO: 25, which reflects an increased probability of length of survival of the patient relative to a probability of length of survival of patients without the differential expression.
[0068] In some embodiments, the treatment regimen comprises at least one of chemotherapy or radiotherapy. In embodiments, expression level of the nucleic acid sequences is measured by a technique selected from the group consisting of: northern blotting, gene expression profiling, serial analysis of gene expression, enzyme-linked immunosorbent assay, fluorescence microscopy, and any combination thereof.
[0069] In some embodiments, a method of treating a patient with a cancer comprises administering, in a patient diagnosed with a cancer, a treatment regimen based on clinical response to platinum-based chemotherapy, wherein predicting clinical response comprises: (1) detecting, in a biological sample from a patient having with OV, an indicator of differential expression consisting of at least two nucleotide sequences selected from of SEQ ID NO: 7, SEQ ID NO: 21, SEQ ID NO: 25, SEQ ID NO: 27, SEQ ID NO: 31, SEQ ID NO: 41, SEQ ID NO: 47, SEQ ID NO: 56, SEQ ID NO: 64, SEQ ID NO: 70, SEQ ID NO: 96; (b) level of expression of the nucleic acid sequences in (a); or (c) copy number of at least one of (a); and (2) calculating, by a processor, a weighted sum pattern based on the value of one or more indicators of differential expression; and (3) estimating, by the processor and based on the value of the indicators of differential expression, the likelihood for the patient to have a beneficial response to the platinum-based chemotherapy. In embodiments, the method comprises recommending one of (i) a platinum-based chemotherapy or (ii) an alternative treatment regimen based on the predicted clinical response to platinum-based chemotherapy. In embodiments, the method further
comprises administering one of (i) a platinum-based chemotherapy or (ii) an alternative treatment regimen based on the predicted clinical response to platinum-based chemotherapy.
[0070] In embodiments, the nucleotide sequence comprises DNA. In embodiments, the nucleotide sequence comprises mRNA. In embodiments, the indicator of differential expression is an indicator of increased expression. In embodiments, the indicator of increase in expression indicates increased expression of the nucleic acid sequences selected from SEQ ID NO: 31, SEQ ID NO: 41, SEQ ID NO: 64, SEQ ID NO: 56, SEQ ID NO: 7, SEQ ID NO: 25, SEQ ID NO: 27, and SEQ ID NO: 70 which reflects a likelihood for the patient to have a beneficial clinical response to the platinum-based chemotherapy of the patient relative to a likelihood for patients without the increased expression. In some embodiments, the indicator of differential expression is an indicator of decreased expression. In embodiments, the indicator of decreased expression indicates decreased expression of the nucleic acid sequences selected from SEQ ID NO: 56, SEQ ID NO: 7; SEQ ID NO: 25, SEQ ID NO: 27, which reflects an increased likelihood for the patient to have a beneficial clinical response to the platinum-based chemotherapy relative to a likelihood for patients without the decreased expression. In embodiments, the indicator of decreased expression indicates increased expression of the nucleic acid sequences selected from SEQ ID NO: 31, SEQ ID NO: 41, SEQ ID NO: 64, and SEQ ID NO: 70, which reflects an increased likelihood for the patient to have a beneficial clinical response to the platinum-based chemotherapy relative to a likelihood for patients without the decreased expression. In embodiments, the indicator of differential expression comprises increased expression of SEQ ID NO: 7 and SEQ ID NO: 56 and decreased expression of SEQ ID NO: 31 and SEQ ID NO: 41, which reflects a decreased likelihood for the patient to have a beneficial clinical response to the platinum-based chemotherapy relative to a likelihood for patients without the decreased expression. In further embodiments, the indicator of differential expression comprises increased expression of SEQ ID NO: 64 and decreased expression of SEQ ID NO: 25, which reflects an increased likelihood for the patient to have a beneficial clinical response to the platinum-based chemotherapy relative to a likelihood for patients without the decreased expression.
[0071] In some embodiments, the cancer is an ovarian serous cystadenocarcinoma (OV) tumor. In other embodiments, the cancer is selected from small cell lung cancer, non-small cell lung cancer, testicular cancer, stomach cancer, bladder cancer, colon cancer, breast cancer,
adrenocortical cancer, anal cancer, endometrial cancer, non-Hodgkin lymphoma, melanoma, and head and neck cancers.
[0072] In embodiments, a method for reducing the proliferation or viability of an ovarian serous cystadenocarcinoma (OV) tumor cell, comprises contacting the cancer cell with (i) an inhibitor that down-regulates the expression level of a gene selected from the group consisting of SEQ ID NO: 56, SEQ ID NO: 7, SEQ ID NO: 25, SEQ ID NO: 27, and a combination thereof; and/or (ii) an activator that up-regulates the expression level of a gene selected from the group consisting of SEQ ID NO: 31, SEQ ID NO: 41, SEQ ID NO: 64, SEQ ID NO: 70, or a combination thereof. In embodiments, said inhibitor is an RNA effector molecule that down- regulates expression of a gene selected from the group consisting of SEQ ID NO: 56, SEQ ID NO: 7, SEQ ID NO: 25, SEQ ID NO: 27, or a combination thereof. In embodiments, said RNA effector molecule is an siRNA or shRNA that targets SEQ ID NO: 56, SEQ ID NO: 7, SEQ ID NO: 25, SEQ ID NO: 27, or a combination thereof.
[0073] In some embodiments, use of an inhibitor in treating an ovarian serous cystadenocarcinoma (OV) tumor cell, wherein said inhibitor (i) down-regulates the expression level of a gene selected from the group consisting of SEQ ID NO: 56, SEQ ID NO: 7, SEQ ID NO: 25, SEQ ID NO: 27, or a combination thereof; or (ii) down-regulates the activity of a protein selected from SEQ ID NO: 57, SEQ ID NO: 8, SEQ ID NO: 26, SEQ ID NO: 28, or a combination thereof. I embodiments, use of an activator in treating an ovarian serous cystadenocarcinoma (OV) tumor cell, wherein said activator (i) up-regulates the expression level of a gene selected from the group consisting of SEQ ID NO: 31, SEQ ID NO: 41, SEQ ID NO: 64, and SEQ ID NO: 70, or a combination thereof; or (ii) up-regulates the activity of a protein selected from SEQ ID NO: 32, SEQ ID NO: 42, SEQ ID NO: 65, and SEQ ID NO: 71, and a combination thereof. In embodiments, use of an inhibitor in the manufacture of a medicament for reducing the proliferation or viability of an ovarian serous cystadenocarcinoma (OV) tumor cell, wherein said inhibitor (i) down-regulates the expression level of a gene selected from the group consisting of SEQ ID NO: 56, SEQ ID NO: 7, SEQ ID NO: 25, and SEQ ID NO: 27, or a combination thereof; or (ii) down-regulates the activity of a protein selected from SEQ ID NO: 57, SEQ ID NO: 8, SEQ ID NO: 26, and SEQ ID NO: 28, or a combination thereof. In embodiments, use of an activator in the manufacture of a medicament for reducing the
proliferation or viability of an ovarian serous cystadenocarcinoma (OV) tumor cell, wherein said activator (i) up-regulates the expression level of a gene selected from the group consisting of SEQ ID NO: 31, SEQ ID NO: 41, SEQ ID NO: 64, and SEQ ID NO: 70, or a combination thereof; or (ii) up-regulates the activity of a protein selected from SEQ ID NO: 32, SEQ ID NO: 42, SEQ ID NO: 65, and SEQ ID NO: 71, and a combination thereof.
[0074] In some embodiments, the indicator of differential expression is an indicator of decreased expression. In some particular embodiments, the indicator of decreased expression indicates decreased expression of one or more gene selected from Rad51APl, Kras, RpaS, and Pabpc5, which reflects an increased likelihood for the patient to have a beneficial clinical response to the platinum-based chemotherapy relative to a likelihood for patients without the decreased expression. In other embodiments, the indicator of decreased expression indicates increased expression of one or more gene selected from CdknlA, Mapkl4, Pold2, and Bcap31, which reflects an increased likelihood for the patient to have a beneficial clinical response to the platinum-based chemotherapy relative to a likelihood for patients without the decreased expression. In further embodiments, the indicator of differential expression comprises increased expression of the Kras and Rad51APl genes and decreased expression of the CdknlA, and Mapkl4 genes, which reflects a decreased likelihood for the patient to have a beneficial clinical response to the platinum-based chemotherapy relative to a likelihood for patients without the decreased expression. In additional embodiments, the indicator of differential expression comprises increased expression of the Poldl gene and decreased expression of the RpaS gene, which reflects an increased likelihood for the patient to have a beneficial clinical response to the platinum-based chemotherapy relative to a likelihood for patients without the decreased expression. Use of an inhibitor in treating an ovarian serous cystadenocarcinoma (OV) tumor cell, wherein said inhibitor (i) down-regulates the expression level of a nucleic acid sequence selected from the group consisting SEQ ID NO: 56, SEQ ID NO: 7, SEQ ID NO: 25, and SEQ ID NO: 27, or a combination thereof; or (ii) down- regulates the activity of an amino acid sequence selected from SEQ ID NO: 57, SEQ ID NO: 8, SEQ ID NO: 26, and SEQ ID NO: 28, or a combination thereof; and/or Use of an activator in treating an ovarian serous cystadenocarcinoma (OV) tumor cell, wherein said activator (i) up-regulates the expression level of a nucleic acid sequence selected from the group consisting of SEQ ID NO: 31, SEQ ID NO:
41, SEQ ID NO: 64, and SEQ ID NO: 70, or a combination thereof; or (ii) up-regulates the activity of an amino acid sequence selected from SEQ ID NO: 32, SEQ ID NO: 42, SEQ ID NO: 65, and SEQ ID NO: 71, and a combination thereof.
[0075] In embodiments, Use of an inhibitor in the manufacture of a medicament for reducing the proliferation or viability of an ovarian serous cystadenocarcinoma (OV) tumor cell, wherein said inhibitor (i) down-regulates the expression level of nucleic acid sequence selected from the group consisting of SEQ ID NO: 56, SEQ ID NO: 7, SEQ ID NO: 25, or a combination thereof; or (ii) down-regulates the activity of an amino acid sequence selected from SEQ ID NO: 57, SEQ ID NO: 8, SEQ ID NO: 26, and SEQ ID NO: 28, or a combination thereof.
[0076] In embodiments, Use of an activator in the manufacture of a medicament for reducing the proliferation or viability of an ovarian serous cystadenocarcinoma (OV) tumor cell, wherein said activator (i) up-regulates the expression level of a nucleic acid sequence selected from the group consisting of SEQ ID NO: 31, SEQ ID NO: 41, SEQ ID NO: 64, and SEQ ID NO: 70, or a combination thereof; or (ii) up-regulates the activity of an amino acid sequence selected from SEQ ID NO: 32, SEQ ID NO: 42, SEQ ID NO: 65, and SEQ ID NO: 71, or a combination thereof.
[0077] The term "normal cell" (or "healthy cell") as used herein, refers to a cell that does not exhibit a disease phenotype. For example, in a diagnosis of OV, a normal cell (or a noncancerous cell) refers to a cell that is not a tumor cell (non-malignant, non-cancerous, or without DNA damage characteristic of a tumor or cancerous cell). The term a "tumor cell" (or "cancer cell") refers to a cell displaying one or more phenotype of a tumor, such as OV. The terms "tumor" or "cancer" refer to the presence of cells possessing characteristics typical of cancer- causing cells, such as uncontrolled proliferation, immortality, metastatic potential, rapid growth or proliferation rate, and certain characteristic morphological features.
[0078] Normal cells can be cells from a healthy subject. Alternatively, normal cells can be non-malignant, non-cancerous cells from a subject having OV.
[0079] The comparison of the mRNA level, the gene product level, or the copy number of a particular nucleotide sequence between a normal cell and a tumor cell can be determined in parallel experiments, in which one sample is based on a normal cell, and the other sample is based on a tumor cell. Alternatively, the mRNA level, the gene product level, or the copy
number of a particular nucleotide sequence in a normal cell can be a pre-determined "control," such as a value from other experiments, a known value, or a value that is present in a database (e.g., a table, electronic database, spreadsheet, etc.).
[0080] In general, standard gene and protein nomenclature is followed herein. Unless the description indicates otherwise, gene symbols are generally italicized, with first letter in upper case all the rest in lower case; and a protein encoded by a gene generally uses the same symbol as the gene, but without italics and all in upper case.
[0081] Additional features and advantages of the subject technology will be set forth in the description below, and in part will be apparent from the description, or may be learned by practice of the subject technology. The advantages of the subject technology will be realized and attained by the structure particularly pointed out in the written description and claims hereof as well as the appended drawings.
[0082] It is to be understood that both the foregoing general description and the following detailed description are exemplary and explanatory and are intended to provide further explanation of the subject technology as claimed.
BRIEF DESCRIPTION OF THE DRAWINGS
[0083] Figures 1A-1C are illustrations of high-level diagrams illustrating examples of tensors including biological datasets, according to some embodiments.
[0084] Figure 2 is an illustration of a high-level diagram illustrating a linear transformation of a three- dimensional array, according to some embodiments.
[0085] Figure 3 depicts diagrams illustrating tensor GSVD of patient-matched and platform- matched DNA copy-number profiles for the 6p+12p chromosome, according to some embodiments.
[0086] Figure 4 depicts diagrams illustrating the tensor GSVD of TCGA patient-matched and platform-matched tumor and normal DNA copy-number profiles for the 7p chromosome, according to some embodiments.
[0087] Figure 5 depicts diagrams illustrating the tensor GSVD of TCGA patient-matched and platform-matched tumor and normal DNA copy-number profiles for the Xq chromosome, according to some embodiments.
[0088] Figure 6 depicts diagrams illustrating tumor-exclusive and platform-consistent DNA CNA correlated with OV patients' survival for the 6p+12p chromosome, according to some embodiments.
[0089] Figure 7 depicts diagrams illustrating tumor-exclusive and platform-consistent DNA CNA correlated with OV patients' survival for the 7p chromosome, according to some embodiments.
[0090] Figure 8 depicts diagrams illustrating tumor-exclusive and platform-consistent DNA CNA correlated with OV patients' survival for the Xq chromosome, according to some embodiments.
[0091] Figure 9 is an illustration of bar charts illustrating the most significant probelets in tumor and normal data sets for the 6p+12p, 7p, and Xq chromosomes, according to some embodiments. The X-axis (a, c, e) is the tumor generalized fraction. The X-axis (b, d, f) is the normal generalized fraction. The Y-axis (all charts) are the subtensors.
[0092] Figure 10 shows illustrations of graphs illustrating survival analyses of 249 patients classified by the standard OV indicators: tumor stage (a), residual disease (b), outcome of subsequent therapy (c) and neoplasm status (d), according to some embodiments. X-axis (all graphs): survival time (months); Y-axis, graphs (all graphs): Fraction of surviving patients from the discovery set.
[0093] Figure 11 shows illustrations of graphs illustrating survival analyses of the validation set of patients classified by the standard OV indicators: tumor stage (a), residual disease (b), outcome of subsequent therapy (c) and neoplasm status (d), according to some embodiments. X- axis (all graphs): survival time (months); Y-axis, graphs (all graphs): Fraction of surviving patients from the validation set.
[0094] Figure 12 is a diagram illustrating survival analyses of discovery and validation sets of patients classified by GSVD or tensor GSVD and tumor stage at diagnosis, according to some embodiments.
[0095] Figures 13A-13I are diagrams illustrating survival analyses of platinum-based chemotherapy patients in a discovery set (Figs. 13A-13F) and a validation set (Figs. 13G-13I) of a number of patients classified by tensor GSVD (Figs. 13A-13C) or tensor GSVD and tumor stage at diagnosis (Figs. 13D-13I), according to some embodiments. X-axis (all graphs): survival time (months); Y-axis (all graphs): Fraction of surviving patients.
[0096] Figures 1 A-14C are diagrams illustrating survival analyses of a validation set of a number of patients classified by tensor GSVD and tumor stage at diagnosis, according to some embodiments. X-axis (all graphs): survival time (months); Y-axis (ail graphs): Fraction of surviving patients,
[0097] Figures 15A-15I are diagrams illustrating survival analyses of the fraction of surviving platmum-based chemotherapy patients in the discovery set classified by tensor GSVD and residual disease (Figs. 15A-15C), tensor GSVD and therapy outcome (Figs. 15D-15F), or tensor GSVD and neoplasm status (Figs. 1.5G-15I), according to some embodiments. X-axis (all graphs): survival time (months); Y-axis (all graphs): Fraction of surviving patients.
[0098] Figures 16A-16I are diagrams illustrating survival analyses of the fraction of surviving platinum-based chemotherapy patients in the discovery set of a number of patients classified by tensor GSVD and residual disease (Figs. 16A-16C), tensor GSVD and therapy outcome (Figs. 16D-1.6F), or tensor GSVD and neoplasm status (Figs. 16G-16I), according to some embodiments. X-axis (all graphs): survival time (months); Y-axis (ail graphs): Fraction of survi ing patients.
[0099] Figures 17A-17F are diagrams illustrating the Kaplan-Meier (KM) curves for survival analyses of discovery and validations sets of patients classified by copy number changes in selected segments, according to some embodiments. X-axis (ail graphs): survival time (months); Y-axis (ail graphs): Fraction of surviving patients from the discovery and validation sets.
[00100] Figure 18 is a diagram illustrating survival analyses of discovery and validation sets of patients classified by 6p+12p, 7p, and Xq tensor GSVD combined, according to some embodiments.
[00101] Figures 19A-19X are diagrams illustrating differences in relative inRNA expression between the tensor GSVD classes for selected segments, according to some embodiments. X-
axis (all graphs): high or low x-probelet coefficient or arraylet correlation; Y-axis (all graphs): relative niR A expression.
[00102] Figures 20A-2QH are diagrams illustrating differences in relative microRNA expression between the tensor GSVD classes for selected segments, according to some embodiments. X- axis (all graphs): high or low x-probelet coefficient or arraylet correlation; Y-axis (all graphs): relative mRNA expression.
[00103] Figures 2I A-21B are diagrams illustrating differences in relative protein expression between the tensor GSVD classes for selected segments, according to some embodiments. X- axis (all graphs): high or low x-probelet coefficient or arraylet correlation; Y-axis (all graphs): relative protein expression.
DETAILED DESCRD7TION
[00104] In the following detailed description, numerous specific details are set forth to provide a full understanding of the subject technology. It will be apparent, however, to one ordinarily skilled in the art that the subject technology may be practiced without some of these specific details. In other instances, well-known structures and techniques have not been shown in detail so as not to obscure the subject technology.
[00105] U.S. Provisional Application No. 61/553,840, entitled "Genomic Tensor Analysis for Medical Assessment and Prediction," was filed on October 31, 2011 and published on March 14, 2013 as WO 2013/036874. U.S. Provisional Application No. 61/553,870, entitled "Genetic Alterations in Glioblastoma," was filed on October 31, 2011 and published on May 10, 2013 as WO 2013/067050. The technical subject matter of U.S. Provisional Application Nos. 61/553,840 and 61/553,870, and the corresponding publications, WO 2013/036874 and WO 2013/067050, are hereby incorporated by reference in their entirety.
I. Overview of Ovarian Serous Cystadenocarcinoma
[00106] Ovarian serous cystadenocarcinoma (OV) is a tumor arising from epithelial cells and originating in the ovaries. OV tumors are typically categorized according to their stage. The most common adopted staging system for ovarian cancer including OV tumors is the FIGO staging system: stage I tumors are limited to the ovaries, stage II tumors involve one or both ovaries with pelvic extension; stage III tumors involve one or both ovaries with peritoneal
implants outside the pelvis or with retroperitoneal lymph node metastasis; stage IV tumors present with distant metastases, including liver parenchyma (Radiopaedia.org).
[00107] OV tumors are further categorized according to their grade, as determined by pathologic evaluation of the tumor; residual macroscopic disease after surgery, outcome of subsequent therapy, i.e. complete remission or not, and neoplasm status, i.e., with or without tumor. Low-grade tumors (WHO grade II) are well-differentiated (not anaplastic), portending a better prognosis. High-grade (WHO grade III-IV) tumors are undifferentiated or anaplastic; these are malignant and carry a worse prognosis.
[00108] For about 30 years, the best predictor of an OV patient's survival has been tumor stage, i.e. the spread of disease at diagnosis. Additional indicators, such as the residual disease after surgery, the outcome of subsequent therapy, and the neoplasm status, which is the last known status of the disease, are determined during treatment. Other factors considered for more favorable prognosis include younger age, cell type other than mucinous and clear cell, smaller disease volume, and absence of ascites.
II. Genomic Tensor Analysis For Medical Assessment And Prediction
[00109] The subject technology provides tensor mathematical models that can compare and integrate different types of large-scale molecular biological datasets, such as, but not limited to, mRNA expression levels, DNA microarray data, DNA copy number alterations, protein expression, etc.
[00110] Additional possible applications of the tensor GSVD in personalized medicine include comparative modeling of two patient- and tissue-matched datasets, each corresponding to (i) a set of large-scale molecular biological profiles, e.g., DNA copy numbers, acquired by a high- throughput technology, e.g., DNA microarrays; (ii) a set of biomedical images or signals; or (iii) a set of cellular pathological observations, e.g., a tumor's stage. Such tensor GSVD comparative models can uncover variations across the patients and tissues that are common to, possibly causally coordinated between the two aspects of the disease. In clinical settings, such tensor GSVD comparative models can determine an individual patient's medical status in relation to all the other patients in a set, and inform the patient's diagnosis, prognosis and treatment.
[00111] Figures 1A-1C are high-level diagrams illustrating suitable examples of tensors 100, according to some embodiments of the subject technology. In general, a tensor representing a
number of biological datasets may comprise an N -order tensor including a number of multidimensional (e.g., two or three dimensional) matrices. Datasets may relate to biological information as shown in Figure 1. An Nth-order tensor may include a number of biological datasets. Some of the biological datasets may correspond to one or more biological samples. Some of the biological dataset may include a number of biological data arrays, some of which may be associated with one or more subjects.
[00112] Referring to the specific embodiments illustrated in Figure 1A, tensor represents a third order tensor (i.e., a cuboid), in which each dimension (e.g., gene, conditions, and time) represents a degree of freedom in the cuboid. If the cuboid is unfolded into a matrix, these degrees of freedom and along with it, most of the data included in the tensor may be lost. However, decomposing the cuboid using a tensor decomposition technique, such as a higher- order eigen-value decomposition (HOEVD) or a higher-order single value decomposition (HOSVD) may uncover patterns of variations (e.g., of mRNA expression) across genes, time points and conditions.
[00113] As shown in Figure IB, the tensor is a biological dataset that may be associated with genes across one or more organisms. Each data array also includes cell cycle stages. In this case, the tensor decomposition may allow, for example, the integration of global mRNA expressions measured for one or more organisms, the removal of experimental artifacts, and the identification of significant combinations of patterns of expression variation across the genes, for various organisms and for different cell cycle stages.
[00114] Similarly, as seen in Fig. 1C, the tensor contains biological datasets associated with a network K of N-genes by N-genes. The network K represents the number of studies on the genes. The tensor decomposition (e.g., HOEVD) in this case may allow, for example, uncovering important relationships among the genes (e.g., pheromone- response-dependent relation or orthogonal cell-cycle-dependent relation). An example of a tensor comprising a three-dimensional array is discussed below in reference to Figure 2.
[00115] Figure 2 is a high-level diagram illustrating a linear transformation of a number of two dimensional (2-D) arrays forming a three-dimensional (3-D) array 200, according to some embodiments. The 3-D array 200 may be stored in a memory. The 3-D array 200 may include an N number of biological datasets (e.g., Dl, D2, and D3) that correspond to, for example,
genetic sequences. In some cases, the 3-D array 200 may comprise an N number of 2-D data arrays (Dl , D2, D3, ... D ) (for clarity only D1-D3 are shown in Figure 2). In this case, N is equal to 3. However, this is not intended to be limiting as N may be any number (1 or greater). In some embodiments, N is greater than 2.
[00116] In some cases, each biological dataset may correspond to a tissue type and include an M number of biological data arrays. Each biological data array may be associated with a patient or, more generally, an organism. Each biological data array may include a plurality of data units (e.g., genes, chromosome segments, chromosomes). Each 2-D data array can store one set of the biological datasets and includes M columns. Each column can store one of the M biological data arrays corresponding to a subject such as a patient.
[00117] A linear transformation such as a tensor decomposition algorithm may be applied to the 3-D array 200 to generate a plurality of eigen 2-D arrays 220, 230, and 240. The eigen 2-D arrays 220, 230, and 240 can then be analyzed to determine one or more characteristics related to a disease.
[00118] Each data array generally comprises measurable data. In some embodiments, each data array may comprise biological data that represent a physical reality such as the specific stage of a cell cycle. In some embodiments the biological data may be measured by, for example, DNA microarray technology, sequencing technology, protein microarray, mass spectrometry in which protein abundance levels are measured on a large proteomic scale as well as traditional measurement technologies (e.g., immunohistochemical staining). Suitable examples of biological data include, but are not limited to, mRNA expression level, gene product level, DNA copy number, micro-RNA expression, presence of DNA methylation, binding of proteins to DNA or RNA, protein expression, and the like. In some embodiments, the biological data may be derived from a patient-specific sample including a normal tissue, a disease-related tissue or a culture of a patient's cell (normal and/or disease-related).
[00119] In some embodiments, the biological datasets may comprise genes from one or more subjects along with time points and/or other conditions. A tensor decomposition of the N^-order tensor may allow for the identification of abnormal patterns (e.g., abnormal copy number variations) in a subject. In some cases, these patterns may identify genes that may correlate or
possibly coordinate with a particular disease. Once these genes are identified, they may be useful in the diagnosis, prognosis, and potentially treatment of the disease.
[00120] For example, a tensor decomposition may identify genes that enables classification of patients into subgroups based on patient-specific genomic data. In some cases, the tensor decomposition may allow for the identification of a particular disease subtype. In some cases, the subtype may be a patient's increased response to a therapeutic method such as chemotherapy, lack of increased response to chemotherapy, increased life expectancy, lack of increased life expectancy and the like. Thus, the tensor decomposition may be advantageous in the treatment of patient's disease by allowing subgroup- or subtype-specific therapies (e.g., chemotherapy, surgery, radiotherapy, etc.) to be designed. Moreover, these therapies may be tailored based on certain criteria, such as, the correlation between an outcome of a therapeutic method and a global genomic predictor.
[00121] In facilitating or enabling prognosis of a disease, the tensor decomposition may also predict a patient's survival. An N^-order tensor may include a patient's routine examinations data, in which case decomposition of the tensor may allow for the designing of a personalized preventive regimen for the patient based on analyses of the patient's routine examinations data. In some embodiments, the biological datasets may be associated with imaging data including magnetic resonance imaging (MRI) data, electro cardiogram (ECG) data, electromyography (EMG) data or electroencephalogram (EEG) data. A biological datasets may also be associated with vital statistics, phenotypical data, as well as molecular biological data (e.g., DNA copy number, mRNA expression level, gene product level, etc.). In some cases, prognosis may be estimated based on an analysis of the biological data in conjunction with traditional risk factors such as, age, sex, race, etc.
[00122] Tensor decomposition may also identify genes useful for performing diagnosis, prognosis, treatment, and tracking of a particular disease. Once these genes are identified, the genes may be analyzed by any known techniques in the relevant art. For example, in order to perform a diagnosis, prognosis, treatment, or tracking of a disease, the DNA copy number may be measured by a technique such as, but not limited to, fluorescent in-situ hybridization, complementary genomic hybridization, array complementary genomic hybridization, and fluorescence microscopy. Other commonly used techniques to determine copy number
variations include, e.g. oligonucleotide genotyping, sequencing, southern blotting, dynamic allele-specific hybridization (DASH), paralogue ratio test (PRT), multiple amplicon quantification (MAQ), quantitative polymerase chain reaction (QPCR), multiplex ligation dependent probe amplification (MLPA), multiplex amplification and probe hybridization (MAPH), quantitative multiplex PCR of short fluorescent fragment (QMPSF), dynamic allele- specific hybridization, fluorescence in situ hybridization (FISH), semiquantitative fluorescence in situ hybridization (SQ-FISH) and the like. For more detail description of some of the methods described herein, see, e.g. Sambrook, Molecular Cloning - A Laboratory Manual, Cold Spring Harbor Laboratory, Cold Spring Harbor, N.Y., (1989), Kallioniemi et al, Proc. Natl. Acad Sci USA, 89:5321-5325 (1992), and PCR Protocols, A Guide to Methods and Applications, Innis et al, Academic Press, Inc. N.Y., (1990).
[00123] The mRNA level may be measured by a technique such as, northern blotting, gene expression profiling, and serial analysis of gene expression. Other commonly used techniques include RT-PCR and microarray technology. In a typical microarray experiment, a microarray is hybridized with differentially labeled RNA or DNA populations derived from two different samples. Ratios of fluorescence intensity (red/green, R/G) represent the relative expression levels of the mRNA corresponding to each cDNA/gene represented on the microarray. Realtime polymerase chain reaction, also called quantitative real time PCR (QRT-PCR) or kinetic polymerase chain reaction, may be highly useful to determine the expression level of a mRNA because the technique can simultaneously quantify and amplify a specific part of a given polynucleotide.
[00124] The gene product level may be measured by a technique such as, enzyme-linked immunosorbent assay (ELISA) and fluorescence microscopy. When the gene product is a protein, traditional methodologies for protein quantification include 2-D gel electrophoresis, mass spectrometry and antibody binding. Commonly used antibody-based techniques include immunoblotting (western blotting), immunohistological assay, enzyme linked immunosorbent assay (ELISA), radioimmunoassay (RIA), or protein chips. Gel electrophoresis, immunoprecipitation and mass spectrometry may be carried out using standard techniques, for example, such as those described in Molecular Cloning A Laboratory Manual, 2nd Ed., ed. by Sambrook, Fritsch and Maniatis (Cold Spring Harbor Laboratory Press: 1989), Harlow and Lane,
Antibodies: A Laboratory Manual (1988 Cold Spring Harbor Laboratory), G. Suizdak, Mass Spectrometry for Biotechnology (Academic Press 1996), as well as other references cited herein.
[00125] In some embodiments, the tensor decomposition of the Nth-order tensor may allow for the removal of normal pattern copy number alterations and/or an experimental variation from a genomic sequence. Thus, a tensor decomposition of the Nth-order tensor may permit an improved prognostic prediction of the disease by revealing real disease-associated changes in chromosome copy numbers, focal copy number alterations (CNAs), non-focal CNAs and the like. A tensor decomposition of the Nth-order tensor may also allow integrating global mRNA expressions measured in multiple time courses, removal of experimental artifacts, and identification of significant combinations of patterns of expression variation across genes, time points and conditions.
[00126] In some embodiments, applying the tensor decomposition algorithm may comprise applying at least one of a higher-order singular value decomposition (HOSVD), a higher-order generalized singular value decomposition (HO GSVD), a higher-order eigen-value decomposition (HOEVD), or parallel factor analysis (PARAFAC) to the Nth-order tensor. The PARAFAC method is known in the art and will not be described with respect to the present embodiments. In some embodiments, HOSVD may be utilized to decompose a 3-D array 200, as described in more detail herein.
[00127] Referring again to Figure 2, eigen 2-D arrays generated by HOSVD may comprise a set of N left-basis 2-D arrays 220. Each of the left-basis arrays 220 (e.g., Ul, U2, U3, ... L½) (for clarity, only U1-U3 are shown in Figure 2) may correspond, for example, to a tissue type and can include an M number of columns, each of which stores a left-basis vector 222 associated with a patient. The eigen 2-D arrays 230 comprise a set of N diagonal arrays (∑1,∑2,∑3 ...∑N) (for clarity only∑1-∑3 are shown in Figure 2). Each diagonal array (e.g.,∑1,∑2,∑3 ... or∑N) may correspond to a tissue type and can include an N number of diagonal elements 232. The 2-D array 240 comprises a right-basis array, which can include a number of right-basis vectors 242.
[00128] In some embodiments, decomposition of the Nth-order tensor may be employed for disease related characterization such as identifying genes or chromosomal segments useful for diagnosing, tracking a clinical course, estimating a prognosis or treating the disease.
[00129] In some embodiments, the biological data characterization system may be a computer system as known in the art. The system will typically include a processor, memory, an analysis module, and a display module. The processor may include one or more processors and may be coupled to the memory. Information related to the Nth-order tensors 100 of Figure 1 or the 3-D array 200 of Figure 2 may be retrieved from a database coupled to the system and store tensors 100 or the 3-D array 200 along with 2-D eigen-arrays 220, 230, and 240 of Figure 2. A database may be coupled to the system via a network (e.g., Internet, wide area network (WAN), local area network (LAN), etc.). In some embodiments, the system may encompass the database.
[00130] Such systems are known in the art and include computer systems as described, for example, in U.S. Publication No. 2014/0249762 and 2014/0303029, both of which are incorporated herein by reference.
[00131] The processor can apply a tensor decomposition algorithm, such as HOSVD, HO GSVD, or HOEVD, to tensor 100 or 3-D array 200 in order to generate eigen 2-D arrays 220, 230 and 240. In some embodiments, the processor may apply the HOSVD or HO GSVD algorithms to data obtained from array comparative genomic hybridization (aCGH) of patient- matched normal and ovarian serous cystadenocarcinoma (OV) blood samples (see Example 2). Application of HOSVD algorithm may remove one or more normal pattern copy number alterations (PCAs) or experimental variations from the aCGH data. A HOSVD algorithm can also reveal OV-associated changes in at least one of chromosome copy numbers, focal CNAs, and unreported CNAs existing in the aCGH data. Analysis may be performed for disease related characterizations as discussed above. For example, various analyses of eigen 2-D arrays 230 of Figure 2 may be facilitated by assigning each diagonal element 232 of Figure 2 to an indicator of a significance of a respective element of a right-basis vector 222 of Figure 2, as described herein in more detail. A display module 240 can display 2-D arrays 220, 230, 240 and any other graphical or tabulated data resulting from analyses performed by an analysis module. A display module may comprise software and/or firmware and may use one or more display units such as cathode ray tubes (CRTs) or flat panel displays.
[00132] In some embodiments a method for genomic prognostic prediction is provided. The method includes storing the Nth-tensors 100 of Figure 1 or 3-D array 200 of Figure 2 in a memory. A tensor decomposition algorithm such as HOSVD, HO GSVD or HOEVD may be
applied by a processor to the datasets stored in tensors 100 or 3-D array 200 to generate eigen 2- D arrays 220, 230, and 240 of Figure 2. A generated eigen 2-D arrays 220, 230, and 240 may be analyzed, e.g. by an analysis module, to determine one or more disease-related characteristics.
[00133] A HOSVD algorithm is mathematically described herein with respect to N >2 matrices (i.e., arrays DI-D ) of 3-D array 200. Each matrix can be a real mi x n matrix. Each matrix is exactly factored as Di = Ui∑iVT, where V, identical in all factorizations, is obtained from the balanced eigensystem SV = VA of the arithmetic mean S of all pairwise quotients AiAj "1 of the matrices At = DiT Di, where i is not equal to j, independent of the order of the matrices Di. It can be proved that this decomposition extends to higher orders, all of the mathematical properties of the GSVD except for column-wise orthogonality of the matrices Ui (e.g., 2-D arrays 120 of Figure 1). It can be proved that matrix S is nondefective. In other words, S has n independent eigenvectors and that V is real and the eigenvalues of S (i.e., λ1; λ2ι ... λκ) satisfy λ^ > \ .
[00134] In the described HO GSVD comparison of two matrices, the kth diagonal element of∑i = diag(al k) (e.g., the kth element 132 of Figure 1) is interpreted in the factorization of the ith matrix Di as indicating the significance of the kth right basis vector Vk in Di in terms of the overall information that Vk captures in Di. The ratio σ^/σ^ indicates the significance of Vk in Di relative to its significance in Dj. It can also be proved that an eigenvalue = 1 corresponds to a right basis vector Vk of equal significance in all matrices Di and Dj for all i and j when the corresponding left basis vector ¾k is orthonormal to all other left basis vectors in Ui for all i. Detailed description of various analysis results corresponding to application of the HOSVD to a number of datasets obtained from patients and other subjects will be discussed below. For clarity, a more detailed treatment of the mathematical aspects of HOSVD is skipped here but provided in the attached Appendices A, B, and C. Disclosures in Appendix A have also been published as Lee et al., (2012) GSVD Comparison of Patient-Matched Normal and Tumor aCGH Profiles Reveals Global Copy-Number Alterations Predicting Glioblastoma Multiforme Survival, in PLoS ONE 7(1): e30098. doi: 10.1371/jounial.pone.0030098. Disclosures in Appendices B and C have been published as Ponnapalli et al, (2011) A Higher-Order Generalized Singular Value Decomposition for Comparison of Global mRNA Expression from Multiple Organisms in PLoS ONE 6(12): e28072. doi: 10.1371/journal.pone.0028072.
[00135] A HOEVD tensor decomposition method can be used for decomposition of higher order tensors. Herein, as an example, the HOEVD tensor decomposition method is described in relation with a the third-order tensor of size K-networks x N-genes x N-genes as follows:
Higher-Order EVD (HOEVD).
[00136] Let the third-order tensor {¾} of size ^-networks x N-genes x N-genes tabulate a series of K genome-scale networks computed from a series of K genome-scale signals {ek}, of size N-genes x M arrays each, such that
 for all k = 1, 2, ... , K. We define and compute a HOEVD of the tensor of networks {¾},
 using the SVD of the appended signals e≡ (e1( e2, ... , eK) = ύεντ, where the mt column of u, \am) ≡ u\m), lists the genome-scale expression of the mt eigenarray of e. Whereas the matrix EVD is equivalent to the matrix SVD for a symmetric nonnegative matrix, this tensor HOEVD is different from the tensor higher-order SVD (14-16) for the series of symmetric nonnegative matrices {¾}, where the higher-order SVD is computed from the SVD of the appended networks (al5 a2, . . . aK) rather than the appended signals. This HOEVD formulates the overall network computed from the appended signals a = eeT as a linear superposition of a series of M ≡ ∑fe=! Mk rank-1 symmetric "subnetworks" that are decorrelated of each other,
^ = ∑?n=i Em \ am)( m l Each subnetwork is also decoupled of all other subnetworks in the overall network a, since έ is diagonal.
[00137] This HOEVD formulates each individual network in the tensor { fe}as a linear superposition of this series of M rank-1 symmetric decorrelated subnetworks and the series of M(M- 1)12 rank-2 symmetric couplings among these subnetworks (Fig. 7 in Supporting Appendix), such that
 M M
M M
+ ^ ^ ε¾,ίτη ( Ι αί Χα7η Ι + \ 0Cm)(ttl \ > [6] m=l i= m+ l
for all k = 1, 2, K. The subnetworks are not decoupled in any one of the networks { k}, since, in general, {¾} are symmetric but not diagonal, such that sk lm≡ (l\ek \m) = (m\ek \l) ≠ 0. The significance of the mth subnetwork in the kth network is indicated by the mth fraction of eigen expression of the Mi network pk m = ek m I (∑k=1 ∑"=ι ε ι7η)≥ 0, i.e., the expression correlation captured by the «¾th subnetwork in the kth network relative to that captured by all subnetworks (and all couplings among them, where∑¾=! sk lm = 0 for all 1≠ m) in all networks. Similarly, the amplitude of the fraction p k im = sk lm / (∑¾=ι ∑?n=i E k,m) indicates the significance of the coupling between the Ith and mth subnetworks in the kth network. The sign of this fraction indicates the direction of the coupling, such that p k m > 0 corresponds to a transition from the Ith to the mth subnetwork and p k m < 0 corresponds to the transition from the mth to the metric distribution of the annotations among the N-genes and the subsets of n _≡ N genes with largest and smallest levels of expression in this eigenarray. The corresponding eigengene might be inferred to represent the corresponding biological process from its pattern of expression.
[00138] For visualization, we set the x correlations among the X pairs of genes largest in amplitude in each subnetwork and coupling equal to ± 1, i.e., correlated or anti correlated, respectively, according to their signs. The remaining correlations are set equal to 0, i.e., decorrelated. We compare the discretized subnetworks and couplings using Boolean functions (6).
Interpretation of the Subnetworks and Their Couplings.
[00139] We parallel- and antiparallel-associate each subnetwork or coupling with most likely expression correlations, or none thereof, according to the annotations of the two groups of x pairs of genes each, with largest and smallest levels of correlations in this subnetwork or coupling among all X = N(N— 1)12 pairs of genes, respectively. The P value of a given association by annotation is calculated by using combinatorics and assuming hypergeometric probability distribution of the Y pairs of annotations among the X pairs of genes, and of the subset of y -Ξ Y pairs of annotations among the subset of x -Ξ X pairs of genes, P(x;y, Y, X) = (
∑z=y ( z)( x-z X where ( = X/xf^X-x)"1 is the binomial coefficient (17). The most likely association of a subnetwork with a pathway or of a coupling between two subnetworks with a transition between two pathways is that which corresponds to the smallest P value. Independently, we also parallel- and antiparallel-associate each eigenarray with most likely cellular states, or none thereof, assuming hypergeometric distribution of the annotations among the N-genes and the subsets of n _≡ N genes with largest and smallest levels of expression in this eigenarray. The corresponding eigengene might be inferred to represent the corresponding biological process from its pattern of expression.
[00140] For visualization, we set the x correlations among the X pairs of genes largest in amplitude in each subnetwork and coupling equal to ± 1, i.e., correlated or anti correlated, respectively, according to their signs. The remaining correlations are set equal to 0, i.e., decorrelated. We compare the discretized subnetworks and couplings using Boolean functions (6).
[00141] With reference to Fig. 39 as shown in U.S. Published Application No. 2014/0303029, incorporated herein by reference, a higher-order EVD (HOEVD) of the third-order series of the three networks {al5 a2, a3} . The network a3 is the pseudo inverse projection of the network x onto a genome-scale proteins' DNA-binding basis signal of 2,476-genes x 12-samples of development transcription factors [3] (Mathematica Notebook 3 and Data Set 4), computed for the 1,827 genes at the intersection of αχ and the basis signal. The HOEVD is computed for the 868 genes at the intersection of x, d2 and a3. Raster display of dk « ∑m=i £k,m \ am)( m \ + ∑m=i ∑i=m+i ek,im( I <*.)<<½ I + I I)> for a11 *=1,2,3, visualizing each of the three networks as an approximate superposition of only the three most significant HOEVD subnetworks and the three couplings among them, in the subset of 26 genes which constitute the 100 correlations in each subnetwork and coupling that are largest in amplitude among the 435 correlations of 30 traditionally-classified cell cycle-regulated genes. This tensor HOEVD is different from the tensor higher-order SVD [14-16] for the series of symmetric nonnegative matrices a2, a3} . The subnetworks correlate with the genomic pathways that are manifest in the series of networks. The most significant subnetwork correlates with the response to the pheromone. This subnetwork does not contribute to the expression correlations of the cell cycle- projected network a2, where e| x ~ 0. The second and third subnetworks correlate with the two
pathways of antipodal cell cycle expression oscillations, at the cell cycle stage Gi vs. those at G2, and at S vs. M, respectively. These subnetworks do not contribute to the expression correlations of the development-projected network a3, where e|2 ~ ^3,3 ~ 0. The couplings correlate with the transitions among these independent pathways that are manifest in the individual networks only. The coupling between the first and second subnetworks is associated with the transition between the two pathways of response to pheromone and cell cycle expression oscillations at Gi vs. those G2, i.e., the exit from pheromone- induced arrest and entry into cell cycle progression. The coupling between the first and third subnetworks is associated with the transition between the response to pheromone and cell cycle expression oscillations at S vs. those at M, i.e., cell cycle expression oscillations at Gi/S vs. those at M. The coupling between the second and third subnetworks is associated with the transition between the orthogonal cell cycle expression oscillations at Gi vs. those at G2 and at S vs. M, i.e., cell cycle expression oscillations at the two antipodal cell cycle checkpoints of Gi/S vs. G2/M. All these couplings add to the expression correlation of the cell cycle-projected a2, where e|;i2, ei,i3> el,23 > 0; their contributions to the expression correlations of αχ and the development-projected a3 are negligible (see also Fig. 4 of US 2014/0303029).
[00142] In embodiments, a tensor GSVD arranged in two higher-than-second-order tensors of matched column dimensions but independent row dimensions is used in the methods herein. For clarity, a more detailed treatment of the mathematical aspects of this tensor GSVD provided in the attached Appendix A.
[00143] Primary OV tumor and normal DNA copy-number profiles of a set of 249 TCGA patients were selected. Each profile was measured in two replicates by the same set of two DNA microarray platforms. For each chromosome arm or combination of two chromosome arms, the structure of these tumor and normal discovery datasets Ό\ and∑¼, of ^i-tumor and ^-normal probes x L-patients, i.e., arrays x -platforms, is that of two third-order tensors with one-to-one mappings between the column dimensions L and , but different row dimensions K\ and K2, where KU K2≥ LM.
[00144] This tensor GSVD simultaneously separates the paired datasets into weighted sums of L paired "subtensors," i.e., combinations or outer products of three patterns each: Either one tumor-specific pattern of copy-number variation across the tumor probes, i.e., a "tumor arraylet"
Mi a, or the corresponding normal-specific pattern across the normal probes, i.e., the "normal array let" «2ι3, combined with one pattern of copy-number variation across the patients, i.e., an "x- probelet" v T x b and one pattern across the platforms, i.e., a "y-probelet" v j_c, which are identical for both the tumor and normal datasets (see Figs. 3-5),
= Ri x aUi x bVx cVy

Sj(a, b, c) = ui a®vlib ®VyiC, i = l, 2, (1)
where XaUi, X\,VX and XcVy denote tensor-matrix multiplications, which contract the L -arraylet, L-x-probelet, and - -probelet dimensions of the "core tensor" 7ξ i with those of U Vx, and Vy, respectively, and where ® denotes an outer product.
[00145] It was found that unfolding (or matricizing) both tensors ∑¾ into matrices, each preserving the
 of the corresponding tensor, gives two full column-rank matrices A E .kixLM , The column bases vectors Uj were obtained from the GSVD of D i.e., the "row mode GSVD"
A=( ... , Di:lm, ... ) = Oi∑,VT, i=l ,2. (2)
[00146] Similarly, that unfolding both tensors∑¾ into matrices, each preserving the L-x- (or M- y-) column dimension, e.g., by appending the K rows Ό ki:m (or the KjL rows Ό kii-) of the corresponding tensor, gives two full column-rank matrices Dix 6 KiMxL (or Djy 6 IRfeiLxM). We obtain the x- (or y-) row basis vectors VT X (or Vy), from the GSVD of Dix (or Diy), i.e., the x- (or y-) column mode GSVD,
, T k;m, - -■ ) = Uix∑;x VT X,
Diy=(.■■ , ¾/,... ) = Oiy∑iy Vy, i=l,2. (3)
[00147] Note that the x- and -row bases vectors are, in general, non-orthogonal but normalized, and Vx and Vy are invertible. The column bases vectors are normalized and orthogonal, i.e., uncorrelated, such that U Uj = I.
[00148] The generalized singular values are positive, and are arranged in∑ ∑ix, and∑iy in decreasing orders of the corresponding "GSVD angular distances," i.e., decreasing orders of the ratios <¾ζ,/σ¾ζ,, and oiycl 2 c, respectively. We then compute the core tensors ¾■ by
contracting the row-, x-, and -column dimensions of the tensors∑½ with those of the matrices Uj, Vx1, and Vy1, respectively. For real tensors, the "tensor generalized singular values" ¾,az>c tabulated in the core tensors are real but not necessarily positive. Our tensor GSVD construction generalizes the GSVD to higher orders in analogy with the generalization of the singular value decomposition (SVD) by the HOSVD, and is different from other approaches to the decomposition of two tensors.
[00149] It is proven herein that the tensor GSVD exists for two tensors of any order because it is constructed from the GSVDs of the tensors unfolded into full column-rank matrices (Lemma A Example 5). The tensor GSVD has the same uniqueness properties as the GSVD, where the column bases vectors u a and the row bases vectors u T x b and V y C are unique, except in degenerate subspaces, defined by subsets of equal generalized singular values a aix, and oiy, respectively, and up to phase factors of ±1, such that each vector captures both parallel and antiparallel patterns (Lemma B in SI Appendix). The tensor GSVD of two second-order tensors reduces to the GSVD of the corresponding matrices (see Example 5). The tensor GSVD of the tensor Z¾ 6 MiMxi xM, which row mode unfolding gives the identity matrix Di = l E LM LM, and a tensor ¾ of the same column dimensions reduces to the HOSVD of ¾ (Theorem A in Example 5).
[00150] The significance of the subtensor Sj(a, b, c) in the tensor D; is defined proportional to the magnitude of the corresponding tensor generalized singular values
 (Fig- 5), in analogy with the HOSVD,
Pi.abc = Ri,abc/∑a"l ∑b=l ∑c^l ^i,abc · i = 1, . (4)
[00151] The significance of Si(a, b, c) in Di relative to that of <¾(a, b, c) in ¾ is defined by the "tensor GSVD angular distance" &abc as a function of the ratio Ri,ab( %,abc- This is in analogy with, e.g., the row mode GSVD angular distance θα, which defines the significance of the column basis vector u ft in the matrix Ό\ of Eq. (2) relative to that of ii2,a in∑¼ as a function of the ratio ai 2,a,
Qabc = arctan (R\^d i¾,abc) - π/4,
6>a = X( X { alal ) - 7t/4. (5)
[00152] Because the ratios of the positive generalized singular values satisfy ai 2,a ε [0,∞), the row mode GSVD angular distances satisfy θα 6 [-π/4, π/4]. The maximum (or minimum)
angular distance, i.e., θα = π/4, which corresponds to ojJo2,a » 1 (or -π/4, which corresponds to oi, (*2,a « 1), indicates that the row basis vector υ τ α of Eq. (2), which corresponds to the column basis vectors wliQ in D\ and w2,a in∑¼, is exclusive to D\ (or Z) 2). An angular distance of θα = 0, which corresponds to σ;>α σ2ι3 = 1, indicates a row basis vector υτ α which is of equal significance in, i.e., common to both Di and D2.
[00153] Thus, while the ratio ai o2,a indicates the significance of u^a in D\ relative to the significance of w2,a in D2, this relative significance is defined, as previously described, by the angular distance θα, a function of the ratio σ1ια/σ2ια, which is antisymmetric in D\ and Z)2. Note also that while other functions of the ratio σ\ Jai a exist that are antisymmetric in D\ and D2, the angular distance θα, which is a function of the arctangent of the ratio, i.e., arctan( ii£l/ 2i£l), is the natural function to use, because the GSVD is related to the cosine-sine (CS) decomposition, as previously described, and, thus, a^a and σ2,α are related to the sine and the cosine functions of the angle θα, respectively.
[00154] Theorem 1. The tensor GSVD angular distance equals the row mode GSVD angular distance, i.e., ®abc = θα.
[00155] Proof. The unfolding of ¾ of Eq. (1) into A of Eq. (2) unfolds the core tensors ¾■ of Eq. (1) into matrices which preserve the row dimensions, i.e., the L -column bases dimensions of and gives
Dl = UlRl {VT x <g) V
R1 = (∑iVT (V ~T <g) V -T), i=l, 2, (6)
[00156] where ®denotes a Kronecker product. Because 2 , are positive diagonal matrices, it follows that i,ab 2,abc = i, 2,a = (*i, (*2,a- Substituting this in Eq. (5) gives ®abc = θα. Note that the proof holds for tensors of higher-than-third order.
[00157] From this it follows that the tensor GSVD angular distance \ &abc\≤ π/4, and that, therefore, the ratio of the tensor generalized singular values ii ab 2,abc > 0, even though ^ abc and 2,abc are not necessarily positive. It also follows that ®abc = ±π/4 indicate a subtensor exclusive to either Vi or Z¾, respectively, and that ®abc = 0 indicates a subtensor common to both.
[00158] Note that in this embodiment since the generalized singular values are arranged in∑t of Eq. (2) in a decreasing order of the row mode GSVD angular distances θα, the most tumor- exclusive tumor subtensors, i.e., S\(a, b, c) where a maximizes θα of Eq. (5), correspond to a = 1, whereas the most normal-exclusive normal sub-tensors, i.e., <¾(α, b, c) where a minimizes θα, correspond to a = LM.
III. Prediction of OV Survival and/or Response to Therapy such as Platinum-Based Chemotherapy
[00159] In some embodiments, a tensor GSVD, i.e., an exact simultaneous decomposition of datasets, arranged in two higher-than-second-order tensors of matched column dimensions but independent row dimensions is used to create a model for OV.
[00160] To date, the best predictor of OV survival has remained the tumor's stage at diagnosis (Figs. 10 and 11). Additional indicators, such as the residual disease after surgery, the outcome of subsequent therapy, and the neoplasm status, which is the last known status of the disease, are determined during treatment. No diagnostic exists that distinguishes between platinum-based chemotherapy-resistant and -sensitive tumors before the treatment.
[00161] In one aspect, a method for predicting the survival of OV patients and/or predicting an OV patient's response to a therapy such as platinum-based chemotherapy is provided. In embodiments, analysis of changes in genomic features (e.g. copy number alterations, changes in protein expression, and changes in mRNA expression) provides patterns that are correlated with or indicate a prediction for survival and/or prediction to a clinical response to a particular therapy. In embodiments, the therapy is a platinum-based chemotherapy and the methods are used to predict a clinical response to the chemotherapy. As seen in Figs. 6-8, indicators of differential expression (here CNA) were found for several genes and miRNA on the 6p, 12p, 7p, and Xq chromosomes. It will be appreciated that the patterns shown in Figs. 6-8 show mathematical patterns extracted from measured, biological data. Figs. 6-8 show across a region of DNA probes, a weighted sum of the pattern of CNAs for the relevant chromosome. Fig. 6 shows the increase or decrease in CNA for Tnf, Mapkl4, CdkNIA, Rad51APl, Prim2, CdknlB, Sox5, Kras, Asun, Itpr2, miR-877, miR-200c, and miR-141 having at least one segment on the 6p or 12p chromosome. Fig. 7 shows the increase or decrease in CNA for Rpa3 and Pold2 having at least one segment on the 7p chromosome. Fig. 8 shows the increase or decrease for Pabpc5, Bcap31, miR-888, miR224, and miR-452 having at least one segment on the Xq chromosome. It
will be appreciated that deletion of a chromosome that comprises at least a portion of a gene will result in differential expression of that gene. Further, only certain segments of a particular gene may be differentially expressed, e.g. Sox5. However, this may still result in differential expression of the gene. In embodiments, at least some segments comprising at least one of Tnf, Mapkl4, CdkNlA, RadSlAPl, Prim2, CdknlB, Sox5, Kras, Asun, Itprl, RpaS, Poldl, Pabpc5, Bcap31, miR-877, miR-200c, miR-141, miR-888, miR-224, and miR-452 are differentially expressed. In embodiments, the antisense of the microRNA sequence (designated by *) is differentially expressed.
[00162] Using survival analyses of a discovery and, separately, validation set of patients, as well as only the 88% and 95% platinum-based chemotherapy patients in the discovery and validation sets, respectively (Fig. 13), it was found and validated that each of the patterns, across chromosomes 6p+12, 7p, and Xq, is correlated with an OV patient's prognosis and response to platinum-based chemotherapy, is independent of stage, and together with stage makes a better predictor than stage alone.
[00163] It was further found and validated that each of these three tensor GSVDs is independent of each of the additional standard indicators (see Tables 1 and 2, below).
Table 1: Cox univariate proportional hazard models of the discovery and validation sets of patients classified by any one of the tensor GSVDs or the standard OV indicators.
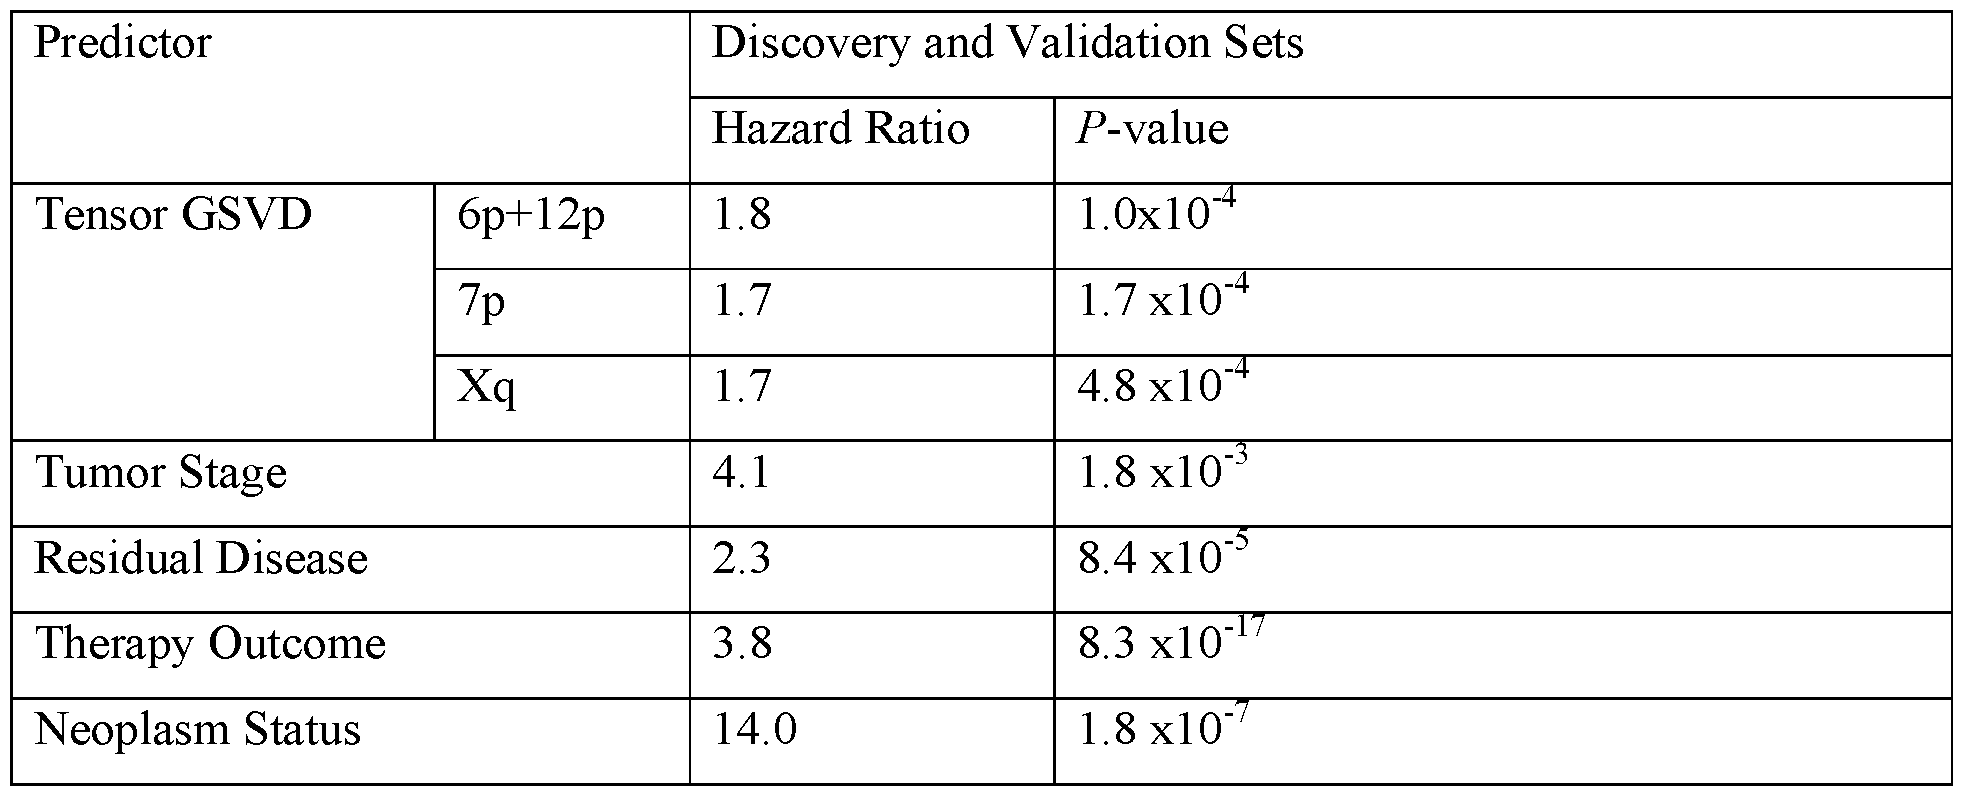
Table 2: Cox bivariate proportional hazard models of the patients in the discovery and validation sets classified by both tensor GSVD and the standard OV indicators.
Chromosome Arm Predictor Discovery and Validation Sets
Hazard Ratio f-value
6p+12p Tensor Stage 1.7 4.4x10"4
Tumor Stage 3.7 3.9 xlO"3
Tensor GSVD 1.6 2.5 xlO"3
Residual Disease 2.2 1.2 xlO"4
Tensor GSVD 1.7 1.2 xlO"3
Therapy Outcome 3.7 1.9 xlO"15
Tensor GSVD 1.6 1.2 xlO"3
Neoplasm Status 13.0 3.9 xlO"7
Vp Tensor Stage 1.7 4.2 xlO"4
Tumor Stage 3.9 2.4 xlO"3
Tensor GSVD 1.6 1.3 xlO"3
Residual Disease 2.2 1.1 xlO"4
Tensor GSVD 1.5 1.6 xlO"2
Therapy Outcome 3.5 2.4 xlO"14
Tensor GSVD 1.7 6.0 xlO"4
Neoplasm Status 13.3 3.0 xl0"7
Xq Tensor Stage 1.6 1.7 xlO"3
Tumor Stage 3.8 3.2 xlO"3
Tensor GSVD 1.9 1.1 xlO"4
Residual Disease 2.2 9.3 xlO"5
Tensor GSVD 1.8 8.5 xlO"4
Therapy Outcome 3.8 1.1 xlO"16
Tensor GSVD 1.7 6.7 xlO"4
Neoplasm Status 14.5 1.3 xlO"7
[00164] For example, survival analyses of the discovery set classified by the 6p+12p tensor GSVD into high and low x-probelet coefficients, and by pathology at diagnosis into tumor stages I-II and III-IV, give the bivariate Cox hazard ratios of 1.5 and 4.0, which are similar to the
corresponding univariate ratios of 1.7 and 4.4, respectively. Similarly, survival analyses of the validation set classified by the 6p+12p tensor GSVD into high and low array let correlation coefficients, and by pathology at diagnosis into tumor stages III and IV, give the bivariate Cox hazard ratios of 1.9 and 1.8, which are the same as the corresponding univariate ratios (Fig. 14). This means that the 6p+12p tensor GSVD and stage are independent predictors of survival. Therefore, combined with any one of the standard indicators, each of the three tensor GSVDs makes a better predictor than the standard indicator alone (Figs. 15 and 16). The Kaplan-Meier (KM) median survival time difference of 61 months among the discovery set of patients classified by both the 6p+12p tensor GSVD and stage, is about 85% and more than two years greater than the 33 month difference between the patients classified by stage alone. The KM median survival difference of 34 months among the validation set of patients classified by both the 6p+12p tensor GSVD and stage, is about 62% and more than one year greater than the 21 month difference between the patients classified by stage alone.
[00165] Of note, while the discovery set of patients reflects the general OV patient population, with approximately 5%, 7%, 76%, and 12% of the patients diagnosed at stages I, II, III, and IV, respectively, the validation set reflects the high-stage OV patient population, with approximately 20% and 80% of the patients diagnosed at stages III and IV, respectively. The 6p+12p, 7p, and Xq tensor GSVDs, therefore, predict survival both in the general as well as in the high-stage OV patient population. Note also that the discovery and validation sets each include mostly, i.e., >95% high-grade, i.e., grades 2 and higher tumors. Tumor grade does not correlate with survival in either the discovery or the validation set of patients.
[00166] It was also found and validated by survival analysis of only the >95% patients with high-grade tumors that these patterns are also independent of the OV tumor's grade. Three groups of significantly different prognoses were observed among the patients classified by a combination of the 6p+12p, 7p, and Xq tensor GSVD classifications, suggesting a possible implementation of the patterns in a pathology laboratory test.
[00167] Survival analyses of only the >95% patients with high-grade tumors in the discovery and, separately, validation set give qualitatively the same and quantitatively similar results to those of the analyses of 100% of the patients in each set, respectively. The 6p+12p, 7p, and Xq tensor GSVDs, therefore, predict survival in the high-grade OV patient population, and are
independent of the OV tumor's grade as well as the molecular distinctions between high- and low-grade OV tumors.
[00168] By using segmentation of the 6p+12p, 7p, and Xq patterns, it was found that the amplifications and deletions identified by these patterns include most known OV-associated CNAs that map to these chromosome arms, as well as several previously unreported, yet frequent focal CNAs. Third, by using gene ontology enrichment analyses of the OV tumor mRNA expression profiles of the patients, it was found that differential mRNA expression between the patients, classified by any one of the three tensor GSVDs, is enriched in ontologies corresponding to one of three hallmarks of cancer: a cell's immortality in 6p+12p, DNA instability in 7p, and cellular immune response suppression in Xq. The differential mRNA expression of genes from these enriched ontologies that are located on any one of the chromosome arms is consistent with the CNAs across that arm. Genes that map to amplifications or deletions on any one pattern, are overexpressed or underexpressed, respectively, in the patients which tumor profiles are classified as highly similar to that pattern. The differential expression of all microRNAs and proteins that map to any one of the chromosome arms is also consistent with the CNAs across that arm.
[00169] As described in Example 2, three groups of significantly different prognoses among the discovery and, separately, validation set of patients, as well as only the platinum-based chemotherapy patients, were observed and classified by a combination of the three, i.e., 6p+12p, 7p, and Xq, tensor GSVD classifications, each of which is binomial (Fig. 18). In group A, a combination of a low 6p+12p x-probelet coefficient or array let correlation, and high 7p and Xq x-probelet coefficients or arraylet correlations is indicative of a patient's significantly longer survival time and better response to platinum-based chemotherapy. In group B, the three combinations where just one of the three binomial classifications differs from that of group A, indicate shorter survival time and worse response to chemotherapy than those of group A. In group C, the four combinations where at least two of the three binomial classifications differ from that of group A, indicate shorter survival time and worse response to chemotherapy than those of group B as well as group A. For example, the KM median survival times of the discovery set of patients classified into groups A, B, and C are 86, 52, and 36 months, such that
the median survival time of group A is more than four years greater than, and more than twice that of group C.
[00170] This suggests a possible implementation of the 6p+12p, 7p, and Xq patterns in a pathology laboratory test, where a patient's survival and response to platinum- based chemotherapy is predicted based upon the combination of the correlations of the OV tumor's DNA copy-number profile with the 6p+12p, 7p, and Xq patterns.
A. Novel Frequent Focal CNAs Indicating OV Survival
[00171] OV tumors exhibit significant CNA variation among them, much more so than, e.g., GBM brain tumors. Very few frequently occurring OV CNAs have been identified to date. In one aspect, CNAs for predicting OV survival are provided.
[00172] It was found by using segmentation, that the three tensor GSVD arraylets include most known OV-associated CNAs that map to the corresponding chromosome arms, and several previously unreported yet frequent CNAs in >23% of the patients. For example, the 6p+12p arraylet includes two segments corresponding to the only known OV focal CNAs that map to 6p+12p, 7p, or Xq (see Example 3). One, a deletion (6pl l .2), overlaps the 3' end unique to isoform a of the DNA primase polypeptide 2-encoding Priml. The other, an amplification (12pl2.1-pl 1.23), contains several genes, including the Kirsten rat sarcoma viral oncogene homolog Kras, one of three human Ras genes, and the 5' ends of isoforms b and d of the SRY (sex determining region Y)-box 5-encoding Sox5, and is significantly (log-rank test f-value <0.05, and KM median survival time difference >12 months) correlated with OV survival.
[00173] It was also found that the three arraylet patterns include novel frequent focal CNAs (segments <125 probes). Among these, four amplifications and two deletions are significantly correlated with OV survival (Fig. 17). The amplifications flank the segment that contains Kras. Two consecutive segments (12pl2.1) contain the 5' ends of isoforms a and e of Sox5, and exons 5 and 6, the first exons that are common to isoforms a, b, d, and e of Sox5. Two other consecutive segments (12pl l.23) contain the inositol 1,4,5-trisphosphate receptor type 2- encoding Itpr2, and the asunder spermatogenesis regulator-encoding Asun. Asun was discovered in a screen of expressed sequence tags on 12pl l-pl2, which DNA amplification correlated with mRNA overexpression in four human testicular seminomas and one ovarian papillary serous adenocarcinoma cell line, exemplifying human germ cell tumors. Asun and its homologs are
essential for nuclear division after DNA replication in the HeLa human cervical cancer cell line, the frog, and the fly. One deletion (7p22.1-p21.3) contains the replication protein A3-encoding RpaS. The other (Xq21.31) contains the cytoplasmic poly(A)-binding protein 5-encoding Pabpc5, and the sequence tag site DXS241 adjacent to translocation breakpoints observed in premature ovarian failure.
B. Differential Expression Patterns
[00174] In embodiments, the present methods provide patterns of differential expression, which may be used to predict or determine an outcome for the patient. In embodiments, the outcome is at least one of a predicted length of survival or a clinical response to therapy. In embodiments, the therapy is administration of an alkylating agent. In embodiments, administration of the alkylating agent comprises a chemotherapy. In embodiments, the chemotherapy is a platinum- based chemotherapy. Differential expression is with reference to genomic features, including, but not limited to genes, proteins encoded by the genes, and mRNA. In embodiments, differential expression is measured by at least one of gene expression, mRNA expression, protein expression, etc. In embodiments, differential expression refers to CNA for a genomic feature.
[00175] In embodiments, the differential expression comprises DNA copy-number loss or gain, mRNA overexpression or underexpression, microRNA overexpression or underexpression, or protein overexpression or underexpression for a genomic feature. In embodiments, differential expression refers to a genomic feature of at least one of the 6p+12p, 7p or Xq chromosomes.
[00176] In embodiments, differential expression of a genomic feature for 6p+12p, includes, but is not limited to differential expression of at least one of Tnf, Mapkl4, CdknlA, Rad51APl, Sox5, CdknlB, Kras, Asun, miR-877, miR-200c, and miR-141. In embodiments, differential expression of a genomic feature for 6p+12p includes one or more of:
copy-number loss, or mRNA or protein underexpression of CdknlA is correlated with a patient's shorter survival time, and resistance to platinum-based chemotherapy;
copy-number loss, or mRNA or protein underexpression of Mapkl4 on 6p is correlated with a patient's shorter survival time, and resistance to platinum-based chemotherapy; copy-number gain, or mRNA or protein overexpression of Kras on 12p is correlated with a patient's shorter survival time, and resistance to platinum-based chemotherapy;
copy-number gain, or mRNA or protein overexpression of Rad51APl on 12p is correlated with a patient's shorter survival time, and resistance to platinum-based chemotherapy;
copy-number loss, or mRNA or protein underexpression of Tnf on 6p is correlated with a patient's shorter survival time, and resistance to platinum-based chemotherapy;
copy-number gain, or mRNA or protein overexpression of Itprl on 12p is correlated with a patient's shorter survival time, and resistance to platinum-based chemotherapy;
copy-number loss, or mircoRNA underexpression of miR-877* on 6p is correlated with a patient's shorter survival time, and resistance to platinum-based chemotherapy;
copy-number gain, or microRNA overexpression, of miR-200c, miR-200c*, miR-141 , or miR-141 * on 12p is correlated with a patient's shorter survival time, and resistance to platinum-based chemotherapy.
[00177] In embodiments, differential expression of a genomic feature for 7p, includes, but is not limited to differential expression of at least one of Rpa3 and Pold2. In embodiments, differential expression of a genomic feature for 7p includes one or more of:
copy-number gain, or mRNA overexpression of Pold2 on 7p is correlated with a longer survival time, and sensitivity to platinum-based chemotherapy;
co-occurring copy-number loss, or mRNA underexpression of RpaS on 7p is correlated with a longer survival time, and sensitivity to platinum-based chemotherapy.
[00178] In embodiments, differential expression of a genomic feature for Xq, includes, but is not limited to differential expression of at least one of Pabpc5, Bcap31, miR-888, miR-224, and miR-452. In embodiments, differential expression of a genomic feature for Xq includes one or more of:
copy-number loss of Pabpc5 is correlated with a longer survival time and/or sensitivity to platinum-based chemotherapy;
gain, or mRNA overexpression of BcapSl is correlated with a longer survival time and/or sensitivity to platinum-based chemotherapy;
gain, or microRNA overexpression of miR-888 or miR-888*, and miR-452 or miR-452 is correlated with a longer survival time and/or sensitivity to platinum-based chemotherapy.
[00179] In embodiments, co-occurring patterns of differential expression are described herein. In embodiments, a co-occurring pattern includes differential expression of one or more genomic features identified above for 6p+12p and 7p. In embodiments, a co-occurring pattern includes differential expression of one or more genomic features identified above for 6p+12p and Xq. In embodiments, a co-occurring pattern includes differential expression of one or more genomic features identified above for 7p and Xq. In embodiments, a co-occurring pattern of differential expression includes one or more of a)-f):
a) co-occurring copy-number loss of Pabpc5, and gain, or mRNA overexpression of Bcap31; or
b) co-occurring copy number loss of Pabpc5, and gain, or mRNA overexpression of Bcap31, and gain, or microRNA overexpression of miR-888, and miR-452; or
c) co-occurring copy number loss of Pabpc5, and gain, or mRNA overexpression of Bcap31, and gain, or microRNA overexpression of miR-888, miR-452, and miR-224; or
d) co-occurring copy-number loss of Pabpc5 and sequence tag site (STS) DXS214, and gain, or mRNA overexpression oiBcap31 or
e) co-occurring copy number loss of Pabpc5, and gain, or mRNA overexpression of Bcap31 and Gabre; or
f) co-occurring copy-number loss from cytogenetic bands 1-14, and gain in cytogenetic bands 16-24;
with at least one of longer survival time and sensitivity to platinum-based chemotherapy.
[00180] In embodiments, a co-occurring pattern comprises the differential expression of (c) and further correlating copy-number loss of sequence tag site DXS214 and gain or mRNA overexpression of Bcap31 and Gabre with at least one of longer survival time and sensitivity of platinum-based chemotherapy.
[00181] In embodiments, a co-occurring pattern of differential expression includes one or more of al)-dl):
al) co-occurring copy-number loss, or mRNA underexpression of Rpa3, and copy-number gain, or mRNA overexpression of Pold2; or
bl) co-occurring copy-number loss, or mRNA underexpression of Rpa3 on 7p and Lig4 on 13q, and copy-number gain, or mRNA overexpression of Pold2; or
cl) co-occurring copy-number loss, or mRNA underexpression of Lig4 on chromosome 13q, and copy-number gain, or mRNA overexpression oiPold2 or
dl) co-occurring copy-number loss from cytogenetic bands 1-7, and gain in cytogenetic bands 11-17;
with at least one of a longer survival time and sensitivity to platinum-based chemotherapy.
[00182] In embodiments, a co-occurring pattern of differential expression includes one or more of a2)-g2):
a2) co-occurring copy-number loss on chromosome 6p and gain on chromosome
12p; or
b2) co-occurring copy-number loss, or mRNA or protein under-expression of CdknlA and Mapkl4 on chromosome 6p, and copy-number gain, or mRNA or protein overexpression oiKras on chromosome 12p; or
c2) co-occurring copy-number loss, or mRNA or protein under-expression of CdknlA and Mapkl 4 on 6p, and copy-number gain, or mRNA or protein overexpression oiKras and Rad51 API on 12p; or
d2) co-occurring copy-number loss, or mRNA or protein under-expression of CdknlA, Mapkl4, and Tnf on chromosome 6p, and copy-number gain, or mRNA or protein overexpression oiKras, Rad51APl, and Itpr2 on chromosome 12p; or
e2) co-occurring copy-number loss, or microRNA under-expression of miR-877* on chromosome 6p, and copy-number gain, or microRNA overexpression, of miR-200c, miR-200c*, miR-141, or miR-141 * on chromosome 12p;
(f2) co-occurring copy-number loss, or mRNA or protein under-expression of CdknlA and Mapkl4 on chromosome 6p, and copy-number gain, or mRNA or protein overexpression of Rad51APl on chromosome 12p;
(g2) co-occuring copy-number loss, or mRNA or protein under-expression of Tnf on chromosome 6p, and copy-number gain, or mRNA or protein overexpression of Itpr2 on chromosome 12p;
with at least one of shorter survival time and resistance to platinum-based chemotherapy.
[00183] In embodiments, a co-occurring pattern of differential expression includes one or more of a2)-g2) and additionally at least one of h2)-m2):
(h2) a gain in copy numbers or mRNA or protein overexpression of Sox5; or (i2) a gain in copy numbers or mRNA or protein overexpression oiAsun; or (j2) a gain in copy numbers or mRNA or protein overexpression oiAbcfl; or (k2) a gain in copy numbers or mRNA or protein overexpression of CdknlB; or (12) an mRNA or protein under-expression or loss in copy numbers of Bapl; or (m2) a reduced abundance of Brcal -associated c,
with reduced abundance of the iJrcai-associated genome surveillance protein complex (BASC);
[00184] In embodiments, a pattern of differential expression includes one or more of:
(1) an increase in copy number of the segment overlapping with the Prim2 gene with at least one of reduced length of patient survival and resistance to platinum-based chemotherapy;
(2) an increase in copy number of the Kras gene with at least one of reduced length of patient survival and resistance to platinum-based chemotherapy;
(3) an increase in copy number of the Sox5 gene with at least one of reduced length of patient survival and resistance to platinum-based chemotherapy;
(4) an increase in copy number of the Itprl gene with at least one of reduced length of patient survival and resistance to platinum-based chemotherapy;
(5) an increase in copy number of the Asun gene with at least one of reduced length of patient survival and resistance to platinum-based chemotherapy;
(6) a decrease in copy number of the RpaS gene with at least one of increased length of patient survival and sensitivity to platinum-based chemotherapy;
(7) a decrease in copy number of the Pabpc5 gene with at least one of increased length of patient survival and sensitivity to platinum-based chemotherapy;
(8) a decrease in copy number of the DXS214 sequence tag site with at least one of increased length of patient survival and sensitivity to platinum-based chemotherapy;
(9) a decrease in copy number of the CdknlA gene with at least one of reduced length of patient survival and resistance to platinum-based chemotherapy;
(10) a decrease in copy number of the Mapkl4 gene with at least one of reduced length of patient survival and resistance to platinum-based chemotherapy;
(11) a decrease in copy number of the Tnf gene with at least one of reduced length of patient survival and resistance to platinum-based chemotherapy;
(12) a decrease in copy number of the miR-877 or miR-877* microRNA with at least one of reduced length of patient survival and resistance to platinum-based chemotherapy;
(13) a decrease in copy number of the Abcfl gene with at least one of reduced length of patient survival and resistance to platinum-based chemotherapy;
(14) an increase in copy number of the Rad51APl gene with at least one of reduced length of patient survival and resistance to platinum-based chemotherapy;
(15) an increase in copy number of the miR-200c or miR-200c* with at least one of reduced length of patient survival and resistance to platinum-based chemotherapy;
(16) an increase in copy number of the miR-141c or miR-141c* with at least one of reduced length of patient survival and resistance to platinum-based chemotherapy;
(17) an increase in copy number of the CdknlB gene with at least one of reduced length of patient survival and resistance to platinum-based chemotherapy;
(18) an increase in copy number of the Pold2 gene with at least one of increased length of patient survival and sensitivity to platinum-based chemotherapy;
(19) an increase in copy number of the BcapSl gene with at least one of increased length of patient survival and sensitivity to platinum-based chemotherapy;
(20) an increase in copy number of the miR-888 with at least one of increased length of patient survival and sensitivity to platinum-based chemotherapy;
(21) an increase in copy number of the miR-224 with at least one of increased length of patient survival and sensitivity to platinum-based chemotherapy;
(22) an increase in copy number of the miR-452 with at least one of increased length of patient survival and sensitivity to platinum-based chemotherapy;
(23) an increase in copy number of the Gabre gene with at least one of increased length of patient survival and sensitivity to platinum-based chemotherapy;
(24) a decrease in copy number of the Lig4 gene with at least one of increased length of patient survival and sensitivity to platinum-based chemotherapy;
(25) mRNA underexpression, mRNA or protein underexpression (or loss in copy numbers) of Bapl with at least one of decreased length of patient survival and resistance to platinum-based chemotherapy;
(26) reduced abundance of BRCA1 -associated BAPl, e.g., reduced abundance of the BRCA1 -associated genome surveillance protein complex (BASC) with at least one of decreased length of patient survival and resistance to platinum-based chemotherapy.
[00185] It will be appreciated that differences in copy number as described above will also apply to differential expression, which includes CNA, mRNA and miRNA expression, and protein expression.
[00186] In embodiments, a co-occurring pattern of any one of the genomic features of (l)-(26) is contemplated. As an illustration, and without limitation, the genomic feature of (1) may be combined with any one of the genomic features of (2)-(26). As a further non-limiting illustration, the genomic feature of (1) may be combined with multiple or all of the genomic features of (2)-(26). Any combination or sub-combination of the genomic features of (l)-(24) are contemplated herein. In specific, but not limiting embodiments, a co-occurring pattern is selected from (l) correlating at least two of (2), (4), (6), (9)-(12), (14)-(16), (18), and (24); (n) correlating at least two of (2), (4), (7), (9)-(12), (14)-(16), (19)-(23); or (iii) correlating at least two of (6)-(7), and (18)-(24). In embodiments, co-occurring patterns of differential expression may include differential expression of genomic features from additional chromosomes such as Lig4 on chromosome 13q.
C. OV Pathogenesis
[00187] It was found, by using gene ontology enrichment analyses of the OV tumor mRNA expression profiles of the patients, that differential mRNA expression between the patients, classified by any one of the three tensor GSVDs, is enriched in ontologies corresponding to one of three hallmarks of cancer: cell immortality in 6p+12p, DNA instability in 7p, and cellular immune response suppression in Xq.
[00188] The differential mRNA expression of genes from these enriched ontologies that are located on any one of the chromosome arms is consistent with the CNAs across that arm (Fig. 19). Genes that map to amplifications or deletions on any one array let pattern, are overexpressed or underexpressed, respectively, in the patients which tumor profiles are classified, by the corresponding tensor GSVD, as highly similar to that pattern, i.e., patients of high x-probelet coefficients or arraylet correlations. The differential expression of all microRNAs and proteins that map to any one of the chromosome arms is also consistent with the CNAs across that arm (Figs. 20 and 21). A coherent picture emerges for each pattern, suggesting roles for the CNAs in OV pathogenesis in addition to personalized diagnosis, prognosis, and treatment.
1. 6p+12p
[00189] In some embodiments, a cell's transformation and immortality are correlated with a patient's shorter survival. The genes, which are significantly (Mann- Whitney -Wilcoxon P- values <0.05) differentially expressed between the 6p+12p tensor GSVD classes, i.e., in the patient group of high 6p+12p x-probelet coefficient or arraylet correlation, relative to the patient group of low coefficient or correlation, are enriched (hypergeometric f-values <10~3) in the ontologies of cellular response to ionizing radiation (GO: 0071479), and major histocompatibility (MHC) protein complex (GO:0042611). Most of the GO:0071479 genes are underexpressed, including the p21 cyclin-dependent kinase inhibitor-encoding CdknlA, and the p38 mitogen- activated protein kinase-encoding Mapkl4, which map to a deletion >45 Mbp on the telomeric part of 6p (6p25.3-p21.1). Also underexpressed is p38, the protein encoded by Mapkl4. All GO:0042611 genes, including the tumor necrosis factor-encoding TNF, are underexpressed, and map to the same deletion. The one microRNA that is significantly differentially expressed between the 6p+12p tensor GSVD classes, and maps to the same deletion, is the splicing - dependent microRNA miR-877*, which is encoded by the 13th intron of the ATP-binding cassette subfamily F member 1 -encoding gene Abcfl . Both miR-877* and Abcfl are consistently underexpressed.
[00190] One of only two GO: 0071479 overexpressed genes is the Rad51 -associated protein 1- encoding Rad51APl, which maps to an amplification >9 Mbp on the telomeric part of 12p (12pl3.33-pl3.31) that is significantly correlated with OV survival. All four microRNAs that are differentially expressed between the 6p+12p tensor GSVD classes, and map to the same
amplification, miR-200c, miR-200c*, miR-141, and miR-141 *, are consistently overexpressed. The second protein that is significantly differentially expressed between the 6p+12p tensor GSVD classes is p27. Consistently, the cyclin-dependent kinase inhibitor CdknlB, which encodes p27, maps to a 4.5 Mbp amplification (12pl3.2-pl2.3) that is significantly correlated with OV survival, and its mRNA is overexpressed. The mRNA encoded by Kras is also overexpressed.
[00191] Note that while the 6p+12p pattern of CNAs is correlated with survival in the discovery and, separately, validation sets, neither the 6p nor the 12p pattern alone are correlated with survival. Indeed, experiments studying the conditions for the transformation of human normal to tumor cells indicate that cells, where both p21 and p38 are inactive, are susceptible to Ras- mediated transformation. However, the activation of Ras alone induces tumor-suppressing cellular senescence via the activities of either p21 or p38. The 6p+12p pattern, therefore, which includes the loss of the p21-encoding CdknlA and the p38-encoding Mapkl4 on 6p, and the gain of Kras on 12p, encodes for cellular conditions that combined but not separately can lead to transformation.
[00192] In addition, p21 and p38 are necessary for p53-mediated cell cycle arrest and apoptosis, respectively, in response to DNA damage. Overexpression of the p21 -encoding CdknlA is correlated with a low malignant potential of an ovarian tumor. Rad51APl overexpression disrupts cell cycle arrest and apoptosis, can lead to cellular resistance to DNA-damaging cancer therapies, such as platinum-based chemotherapy, and may increase DNA instability. Tnf- induced apoptosis is correlated with downregulation of Itprl. Overexpression of miR-200c, and miR-141, both of which putatively target the BrcaAl associated protein-1 oncosuppressor- encoding Bapl, is correlated with OV tumor growth, dedifferentiation, and invasiveness. Overexpression of the Cdkn IB- encoded p27, which can promote cellular migration and even proliferation, is correlated with a poor OV patient's prognosis.
[00193] Taken together, previously unrecognized co-occurring deletion of CdknlA and Mapkl 4 on 6p and amplification of Kras on 12p, which encode for human cell transformation, together with deletion of Tnf on 6p, and amplification of Rad51APl and ITPR2 on 12p, are correlated with a suppression of cell cycle arrest, senescence, and apoptosis, i.e., a tumor cell's immortality, and a patient's shorter survival time. Note that there already exist drugs that interact with
CdknlA, Mapkl4, and Rad51APl, even though these genes were not recognized previously as targets for OV drug therapy.
2. 2l2
[00194] A cell's DNA stability is correlated with a longer survival. The genes that are significantly differentially expressed between the 7p tensor GSVD classes are enriched (hypergeometric f-value <10 10) in the ontology of DNA strand elongation involved in DNA replication (GO: 0006271). Most of these genes are overexpressed, including the DNA polymerase delta subunit 2-encoding Pold2 that is essential for DNA replication and repair, which maps to an amplification >17 Mbp on the centromeric part of 7p (7pl4.1 -pl l .2). Only two genes are underexpressed: RpaS on 7p and the DNA ligase IV-encoding Lig4 on 13q. The interaction of p53 with the i¾?a3-encoded protein mediates suppression of homologous recombination (HR), the preferred cellular mechanism for DNA double-strand break (DSB) repair during replication. Lig4 is essential for DSB repair via the more error-prone nonhomologous end joining pathway. HR defects are thought to facilitate the significant CNA heterogeneity among OV tumors.
[00195] Taken together, previously unrecognized co-occurring deletion and underexpression of RpaS, and amplification and overexpression of Poldl on 7p are correlated with DNA DSB repair via HR during replication, i.e., DNA stability, and a longer survival time.
3. Xq
[00196] Cellular immune response is correlated with a longer survival. The genes that are differentially expressed between the Xq tensor GSVD classes are enriched (hypergeometric P- value <10~6) in the ontology of antigen processing and presentation of peptide antigen (GO: 0048002). Most of these genes are overexpressed, including the B-cell receptor-associated protein 31 -encoding BcapSl, which maps to an amplification >11 Mbp on the telomeric part of Xq (Xq27.3-q28). All three microRNAs that are differentially expressed between the Xq tensor GSVD classes, and map to the same amplification, miR-888, miR-224, and miR-452, together with the gamma-aminobutyric acid (GABA) A receptor epsilon-encoding Gabre, which hosts mir-224 and mir-452 in its introns, are consistently overexpressed. Underexpression of miR-224 was implicated in OV pathogenesis. Pabpc5, which maps to a focal deletion on Xq, is suppressed upon viral infection.
[00197] Taken together, previously unrecognized co-occurring deletion of Pabpc5, and amplification and overexpression of BcapSl on Xq are correlated with a cellular immune response, and a longer survival time.
[00198] In embodiments, methods of predicting survival time and/or predicting a clinical response to a treatment regimen such as chemotherapy involve determining at least one indicator of differential expression selected from one or more of: gain in copy numbers of a segment overlapping the Priml gene is correlated with poor survival and resistance to platinum-based chemotherapy; gain in copy numbers of Kras is correlated with poor survival and resistance to platinum-based chemotherapy; gain in copy numbers of Sox5 is correlated with poor survival and resistance to platinum-based chemotherapy; gain in copy numbers, or mRNA or protein overexpression of Itprl is correlated with poor survival and resistance to platinum-based chemotherapy; gain in copy numbers, or mRNA or protein overexpression of Asun is correlated with poor survival and resistance to platinum-based chemotherapy; loss in copy numbers, or mRNA or protein under-expression of Rpa3 is correlated with a longer survival time, and sensitivity to platinum-based chemotherapy; loss in copy numbers, or mRNA or protein under- expression of Rpa3 is correlated with a longer survival time, and sensitivity to platinum-based chemotherapy; loss in copy numbers, or mRNA or protein under-expression of Pabpc5 is correlated with a longer survival time, and sensitivity to platinum-based chemotherapy; loss in copy numbers of DXS214 is correlated with a longer survival time, and sensitivity to platinum- based chemotherapy; loss in copy numbers, or mRNA or protein under-expression of CdknlA is correlated with poor survival and resistance to platinum-based chemotherapy; loss in copy numbers, or mRNA or protein under-expression of Mapkl4 is correlated with poor survival and resistance to platinum-based chemotherapy; loss in copy numbers, or mRNA or protein under- expression of Tnf is correlated with poor survival and resistance to platinum-based chemotherapy; loss in copy numbers, or microRNA under-expression of miR-877* or miR-877 is correlated with poor survival and resistance to platinum-based chemotherapy; loss in copy numbers, or mRNA or protein under-expression of Abcfl is correlated with poor survival and resistance to platinum-based chemotherapy; gain in copy numbers, or mRNA or protein overexpression of Rad51APl is correlated with poor survival and resistance to platinum-based chemotherapy; gain in copy numbers, or microRNA overexpression of miR-200c or miR-200c*
is correlated with poor survival and resistance to platinum-based chemotherapy; gain in copy numbers, or microRNA overexpression of miR-141 or miR-141 * is correlated with poor survival and resistance to platinum-based chemotherapy; gain in copy numbers, or mRNA or protein overexpression of CdknlB is correlated with poor survival and resistance to platinum-based chemotherapy; gain in copy numbers, or mRNA or protein overexpression of Pold2 is correlated with a longer survival time, and sensitivity to platinum-based chemotherapy; gain in copy numbers, or mRNA or protein overexpression of BcapSl is correlated with a longer survival time, and sensitivity to platinum-based chemotherapy; gain in copy numbers, or microRNA overexpression of miR-888 is correlated with a longer survival time, and sensitivity to platinum- based chemotherapy; gain in copy numbers, or microRNA overexpression of miR-224 is correlated with a longer survival time, and sensitivity to platinum-based chemotherapy; gain in copy numbers, or microRNA overexpression of miR-452 is correlated with a longer survival time, and sensitivity to platinum-based chemotherapy; gain in copy numbers, or mRNA or protein overexpression of GABRE is correlated with a longer survival time, and sensitivity to platinum-based chemotherapy; loss in copy numbers, or mRNA or protein under-expression of Lig4 is correlated with a longer survival time, and sensitivity to platinum-based chemotherapy; or any combination of the above.
[00199] It will be appreciated that the CNA signatures and expression profiles described above may be used to predict response to platinum-based chemotherapy agents for other cancers where platinum-based chemotherapy is used. For example, the methods described herein may be used to predict response to platinum-based chemotherapy agents for advanced, metastatic forms of colon cancer, small cell and non-small cell lung cancer, breast cancer, adrenocortical cancer, anal cancer, endometrial cancer, non-Hodgkin lymphoma, ovarian cancer, testicular cancer, melanoma and head and neck cancers, among others.
IV. Reducing the Proliferation or Viability of Cancer Cells
[00200] Also described herein are methods for reducing the proliferation or viability of a cancer and methods of treating cancer by modulating the expression level of one or more genes, or modulating the activity of one or more proteins encoded by suitable genes, or modulating the expression level of one or more mRNA encoded by suitable genes. Embodiments of suitable genes include, but are limited to CkdnlA, Mapkl4, Rad51APl, Kras, Rpa3, Pold2, Pabpc5, Tnf,
Prim2, Sox5, Asun, Itpr2, and Bcap31. Embodiments of mRNA include, but are not limited to miR-877, miR-200c, miR-141 , miR-888, miR-224, miR-452, or antisense sequences thereof. In some embodiments, it was found that in 6p+12p, deletion of the p21 -encoding CdknlA and p38- encoding Mapkl4 and amplification of Rad51APl and Kras encode for human cell transformation and are correlated with a cell's immortality and a patient's shorter survival time. For 7p, RpaS deletion and Poldl amplification are correlated with DNA stability, and a longer survival time. For Xq, Pabpc5 deletion and BcapSl amplification are correlated with a cellular immune response and a longer survival time. In non-limiting embodiments, the cancer is selected from ovarian serous cystadenocarcinoma, small cell lung cancers, non-small cell lung cancers, testicular cancer, stomach cancers, bladder cancers, colon cancers, breast cancer, adrenocortical cancer, anal cancer, endometrial cancer, non-Hodgkin lymphoma, melanoma, and head and neck cancers.
[00201] For example, inhibitors can be used to reduce the expression of one or more genes described herein, or reduce the activity of one or more gene products (e.g., proteins encoded by the genes) described herein. Exemplary inhibitors include, e.g., RNA effector molecules that target a gene, antibodies that bind to a gene product, a dominant negative mutant of the gene product, etc. Inhibition can be achieved at the mRNA level, e.g., by reducing the mRNA level of a target gene using RNA interference. Inhibition can be also achieved at the protein level, e.g., by using an inhibitor or an antagonist that reduces the activity of a protein.
[00202] As another example, activators can be used to activate the expression of one or more genes described herein, or increase the activity of one or more gene products (e.g., proteins encoded by the genes) described herein. Exemplary activators include, e.g., RNA effector molecules that target a gene, activators that enhance the interaction between RNA polymerase and a promoter, activators that activate or deactivate receptors, etc. Activation can be achieved at the mRNA level, e.g., by increasing the mRNA level of a target gene. Inhibition can be also achieved at the protein level, e.g., by using an agent that increases the activity of a protein.
[00203] In one aspect, the disclosure provides a method for reducing the proliferation or viability of an OV cancer cell comprising: contacting the cell with an inhibitor that (i) downregulates the expression of a gene selected from the group consisting of Rad51APl, Kras, RpaS, and/or Pabpc5, and a combination thereof; or (ii) down-regulates the activity of a protein
selected from RAD51AP1, KRAS, RPA3, or PABPC5, and a combination thereof, and/or contacting the cell with an activator that up-regulates the expression level of a gene selected from the group consisting of CdknlA, Mapkl4, Pold2, and Bcap31, or a combination thereof.
[00204] In another aspect, the disclosure provides a method of treating OV comprising: administering an inhibitor that (i) downregulates the expression of a gene selected from the group consisting of Rad51APl, Kras, Rpa3, or Pabpc5, and a combination thereof; or (ii) down- regulates the activity of a protein selected from RAD51AP1, KRAS, RPA3, or PABPC5, and a combination thereof; and/or administering an activator that up-regulates the expression level of a gene selected from the group consisting of CdknlA, Mapkl4, Pold2, and Bcap31, or a combination thereof.
[00205] Exemplary inhibitors that reduce the expression of one or more genes described herein, or reduce the activity of one or more gene products described herein include, e.g., RNA effector molecules that target a gene, antibodies that bind to a gene product, a dominant negative mutant of the gene product, etc.
[00206] For the treatment of OV, a therapeutically effective amount of an inhibitor is administered, which is an amount that, upon single or multiple dose administration to a subject (such as a human patient), prevents, cures, delays, reduces the severity of, and/or ameliorating at least one symptom of OV, prolongs the survival of the subject beyond that expected in the absence of treatment, or increases the responsiveness or reduces the resistance of a subject to another therapeutic treatment (e.g., increasing the sensitivity or reducing the resistance to a chemotherapeutic drug). In another embodiment, , a therapeutically effective amount of an activator is administered, which is an amount that, upon single or multiple dose administration to a subject (such as a human patient), prevents, cures, delays, reduces the severity of, and/or ameliorating at least one symptom of OV, prolongs the survival of the subject beyond that expected in the absence of treatment, or increases the responsiveness or reduces the resistance of a subject to another therapeutic treatment (e.g., increasing the sensitivity or reducing the resistance to a chemotherapeutic drug).
[00207] The term "treatment" or 'treating" refers to a therapeutic, preventative or prophylactic measures.
[00208] Also described herein are the use of the inhibitors and/or activators described herein for reducing the proliferation or viability of an OV cancer cell, or for treating OV; and the use of the inhibitors described herein in the manufacture of a medicament for reducing the proliferation or viability of an OV cancer cell, or for treating OV.
1. RNA effector molecules
[00209] In certain embodiments, the inhibitor is an RNA effector molecule, such as an antisense RNA, or a double-stranded RNA that mediates RNA interference. In certain other embodiments, the activator is an RNA effector molecule that mediates RNA regulation. RNA effector molecules that are suitable for the subject technology have been disclosed in detail in WO 2011/005786, and is described briefly below.
[00210] RNA effector molecules are ribonucleotide agents that are capable of reducing or preventing the expression of a target gene within a host cell, or ribonucleotide agents capable of forming a molecule that can reduce the expression level of a target gene within a host cell. A portion of a RNA effector molecule, wherein the portion is at least 10, at least 12, at least 15, at least 17, at least 18, at least 19, or at least 20 nucleotide long, is substantially complementary to the target gene. The complementary region may be the coding region, the promoter region, the 3' untranslated region (3'-UTR), and/or the 5'-UTR of the target gene. Preferably, at least 16 contiguous nucleotides of the RNA effector molecule are complementary to the target sequence (e.g., at least 17, at least 18, at least 19, or more contiguous nucleotides of the RNA effector molecule are complementary to the target sequence). The RNA effector molecules interact with RNA transcripts of target genes and mediate their selective degradation or otherwise prevent their translation.
[00211] RNA effector molecules can comprise a single RNA strand or more than one RNA strand. Examples of RNA effector molecules include, e.g., double stranded RNA (dsRNA), microRNA (miRNA), antisense RNA, promoter- directed RNA (pdRNA), Piwi-interacting RNA (piRNA), expressed interfering RNA (eiRNA), short hairpin RNA (shRNA), antagomirs, decoy RNA, DNA, plasmids and aptamers. The RNA effector molecule can be single-stranded or double-stranded. A single-stranded RNA effector molecule can have double-stranded regions and a double-stranded RNA effector can have single-stranded regions. Preferably, the RNA
effector molecules are double-stranded RNA, wherein the antisense strand comprises a sequence that is substantially complementary to the target gene.
[00212] Complementary sequences within a RNA effector molecule, e.g., within a dsRNA (a double-stranded ribonucleic acid) may be fully complementary or substantially complementary. Generally, for a duplex up to 30 base pairs, the dsRNA comprises no more than 5, 4, 3 or 2 mismatched base pairs upon hybridization, while retaining the ability to regulate the expression of its target gene.
[00213] In some embodiments, the RNA effector molecule comprises a single-stranded oligonucleotide that interacts with and directs the cleavage of RNA transcripts of a target gene. For example, single stranded RNA effector molecules comprise a 5' modification including one or more phosphate groups or analogs thereof to protect the effector molecule from nuclease degradation. The RNA effector molecule can be a single-stranded antisense nucleic acid having a nucleotide sequence that is complementary to a "sense" nucleic acid of a target gene, e.g., the coding strand of a double-stranded cDNA molecule or a RNA sequence, e.g., a pre-mRNA, mRNA, miRNA, or pre-miRNA. Accordingly, an antisense nucleic acid can form hydrogen bonds with a sense nucleic acid target.
[00214] Given a coding strand sequence (e.g., the sequence of a sense strand of a cDNA molecule), antisense nucleic acids can be designed according to the rules of Watson-Crick base pairing. The antisense nucleic acid can be complementary to the coding or noncoding region of a RNA, e.g., the region surrounding the translation start site of a pre-mRNA or mRNA, e.g., the 5' UTR. An antisense oligonucleotide can be, for example, about 10 to 25 nucleotides in length (e.g., 10, 11, 12, 13, 14, 15, 16, 17, 18, 19, 20, 21, 22, 23, or 24 nucleotides in length). In some embodiments, the antisense oligonucleotide comprises one or more modified nucleotides, e.g., phosphorothioate derivatives and/or acridine substituted nucleotides, designed to increase its biological stability of the molecule and/or the physical stability of the duplexes formed between the antisense and target nucleic acids. Antisense oligonucleotides can comprise ribonucleotides only, deoxyribonucleotides only (e.g., oligodeoxynucleotides), or both deoxyribonucleotides and ribonucleotides. For example, an antisense agent consisting only of ribonucleotides can hybridize to a complementary RNA and prevent access of the translation machinery to the target RNA transcript, thereby preventing protein synthesis. An antisense molecule including only
deoxyribonucleotides, or deoxyribonucleotides and ribonucleotides, can hybridize to a complementary RNA and the RNA target can be subsequently cleaved by an enzyme, e.g., RNAse H, to prevent translation. The flanking RNA sequences can include 2'-0-methylated nucleotides, and phosphorothioate linkages, and the internal DNA sequence can include phosphorothioate internucleotide linkages. The internal DNA sequence is preferably at least five nucleotides in length when targeting by RNAseH activity is desired.
[00215] In certain embodiments, the RNA effector comprises a double-stranded ribonucleic acid (dsRNA), wherein said dsRNA (a) comprises a sense strand and an antisense strand that are substantially complementary to each other; and (b) wherein said antisense strand comprises a region of complementarity that is substantially complementary to one of the target genes, and wherein said region of complementarity is from 10 to 30 nucleotides in length.
[00216] In some embodiments, RNA effector molecule is a double-stranded oligonucleotide . Typically, the duplex region formed by the two strands is small, about 30 nucleotides or less in length. Such dsRNA is also referred to as siRNA. For example, the siRNA may be from 15 to 30 nucleotides in length, from 10 to 26 nucleotides in length, from 17 to 28 nucleotides in length, from 18 to 25 nucleotides in length, or from 19 to 24 nucleotides in length, etc.
[00217] The duplex region can be of any length that permits specific degradation of a desired target RNA through a RISC pathway, but will typically range from 9 to 36 base pairs in length, e.g., 15 to 30 base pairs in length. For example, the duplex region may be 15 to 30 base pairs, 15 to 26 base pairs, 15 to 23 base pairs, 15 to 22 base pairs, 15 to 21 base pairs, 15 to 20 base pairs, 15 to 19 base pairs, 15 to 18 base pairs, 15 to 17 base pairs, 18 to 30 base pairs, 18 to 26 base pairs, 18 to 23 base pairs, 18 to 22 base pairs, 18 to 21 base pairs, 18 to 20 base pairs, 19 to 30 base pairs, 19 to 26 base pairs, 19 to 23 base pairs, 19 to 22 base pairs, 19 to 21 base pairs, 19 to 20 base pairs, 20 to 30 base pairs, 20 to 26 base pairs, 20 to 25 base pairs, 20 to 24 base pairs, 20 to 23 base pairs, 20 to 22 base pairs, 20 to 21 base pairs, 21 to 30 base pairs, 21 to 26 base pairs, 21 to 25 base pairs, 21 to 24 base pairs, 21 to 23 base pairs, or 21 to 22 base pairs.
[00218] The two strands forming the duplex structure of a dsRNA can be from a single RNA molecule having at least one self-complementary region, or can be formed from two or more separate RNA molecules. Where the duplex region is formed from two strands of a single molecule, the molecule can have a duplex region separated by a single stranded chain of
nucleotides (a "hairpin loop") between the 3 '-end of one strand and the 5 '-end of the respective other strand forming the duplex structure. The hairpin loop can comprise at least one unpaired nucleotide; in some embodiments the hairpin loop can comprise at least 3, at least 4, at least 5, at least 6, at least 7, at least 8, at least 9, at least 10, at least 20, at least 23 or more unpaired nucleotides. Where the two substantially complementary strands of a dsRNA are formed by separate RNA strands, the two strands can be optionally covalently linked. Where the two strands are connected covalently by means other than a hairpin loop, the connecting structure is referred to as a "linker."
[00219] A double-stranded oligonucleotide can include one or more single-stranded nucleotide overhangs, which are one or more unpaired nucleotide that protrudes from the terminus of a duplex structure of a double-stranded oligonucleotide, e.g., a dsRNA. A double-stranded oligonucleotide can comprise an overhang of at least one nucleotide; alternatively the overhang can comprise at least two nucleotides, at least three nucleotides, at least four nucleotides, at least five nucleotides or more. The overhang(s) can be on the sense strand, the antisense strand or any combination thereof. Furthermore, the nucleotide(s) of an overhang can be present on the 5' end, 3' end, or both ends of either an antisense or sense strand of a dsRNA.
[00220] In one embodiment, at least one end of a dsRNA has a single-stranded nucleotide overhang of 1 to 4, generally 1 or 2 nucleotides.
[00221] The overhang can comprise a deoxyribonucleoside or a nucleoside analog. Further, one or more of the internucloside linkages in the overhang can be replaced with a phosphorothioate. In some embodiments, the overhang comprises one or more deoxyribonucleoside or the overhang comprises one or more dT, e.g., the sequence 5'-dTdT-3' or 5'-dTdTdT-3'. In some embodiments, overhang comprises the sequence 5'-dT*dT-3, wherein * is a phosphorothioate internucleoside linkage.
[00222] An RNA effector molecule as described herein can contain one or more mismatches to the target sequence. Preferably, a RNA effector molecule as described herein contains no more than three mismatches. If the antisense strand of the RNA effector molecule contains one or more mismatches to a target sequence, it is preferable that the mismatch(s) is (are) not located in the center of the region of complementarity, but are restricted to be within the last 5 nucleotides from either the 5' or 3' end of the region of complementarity. For example, for a 23 -nucleotide
RNA effector molecule agent RNA, the antisense strand generally does not contain any mismatch within the central 13 nucleotides.
[00223] In some embodiments, the RNA effector molecule is a promoter-directed RNA (pdRNA) which is substantially complementary to a noncoding region of an mRNA transcript of a target gene. In one embodiment, the pdRNA is substantially complementary to the promoter region of a target gene mRNA at a site located upstream from the transcription start site, e.g., more than 100, more than 200, or more than 1,000 bases upstream from the transcription start site. In another embodiment, the pdRNA is substantially complementary to the 3'-UTR of a target gene mRNA transcript. In one embodiment, the pdRNA comprises dsRNA of 18-28 bases optionally having 3 ' di- or tri-nucleotide overhangs on each strand. In another embodiment, the pdRNA comprises a gapmer consisting of a single stranded polynucleotide comprising a DNA sequence which is substantially complementary to the promoter or the 3'-UTR of a target gene mRNA transcript, and flanking the polynucleotide sequences (e.g., comprising the 5 terminal bases at each of the 5' and 3' ends of the gapmer) comprises one or more modified nucleotides, such as 2' MOE, 2'OMe, or Locked Nucleic Acid bases (LNA), which protect the gapmer from cellular nucleases.
[00224] pdRNA can be used to selectively increase, decrease, or otherwise modulate expression of a target gene. Without being limited to theory, it is believed that pdRNAs modulate expression of target genes by binding to endogenous antisense RNA transcripts which overlap with noncoding regions of a target gene mRNA transcript, and recruiting Argonaute proteins (in the case of dsRNA) or host cell nucleases (e.g., RNase H) (in the case of gapmers) to selectively degrade the endogenous antisense RNAs. In some embodiments, the endogenous antisense RNA negatively regulates expression of the target gene and the pdRNA effector molecule activates expression of the target gene. Thus, in some embodiments, pdRNAs can be used to selectively activate the expression of a target gene by inhibiting the negative regulation of target gene expression by endogenous antisense RNA. Methods for identifying antisense transcripts encoded by promoter sequences of target genes and for making and using promoter-directed RNAs are known, see, e.g., WO 2009/046397.
[00225] In some embodiments, the RNA effector molecule comprises an aptamer which binds to a non-nucleic acid ligand, such as a small organic molecule or protein, e.g., a transcription or
translation factor, and subsequently modifies (e.g., inhibits) activity. An aptamer can fold into a specific structure that directs the recognition of a targeted binding site on the non-nucleic acid ligand. Aptamers can contain any of the modifications described herein.
[00226] In some embodiments, the RNA effector molecule comprises an antagomir. Antagomirs are single stranded, double stranded, partially double stranded or hairpin structures that target a microRNA. An antagomir consists essentially of or comprises at least 10 or more contiguous nucleotides substantially complementary to an endogenous miRNA and more particularly a target sequence of an miRNA or pre-miRNA nucleotide sequence. Antagomirs preferably have a nucleotide sequence sufficiently complementary to a miRNA target sequence of about 12 to 25 nucleotides, such as about 15 to 23 nucleotides, to allow the antagomir to hybridize to the target sequence. More preferably, the target sequence differs by no more than 1, 2, or 3 nucleotides from the sequence of the antagomir. In some embodiments, the antagomir includes a non- nucleotide moiety, e.g., a cholesterol moiety, which can be attached, e.g., to the 3' or 5' end of the oligonucleotide agent.
[00227] In some embodiments, antagomirs are stabilized against nucleolytic degradation by the incorporation of a modification, e.g., a nucleotide modification. For example, in some embodiments, antagomirs contain a phosphorothioate comprising at least the first, second, and/or third internucleotide linkages at the 5' or 3' end of the nucleotide sequence. In further embodiments, antagomirs include a 2'-modified nucleotide, e.g., a 2'-deoxy, 2'-deoxy-2'-fluoro, 2'-0-methyl, 2'-0-methoxyethyl (2'-0-MOE), 2'-0-aminopropyl (2'-0-AP), 2 -0- dimethylaminoethyl (2'-0-DMAOE), 2'-0-dimethylaminopropyl (2'-0-DMAP), 2 -0- dimethylaminoethyloxyethyl (2'-0-DMAEOE), or 2'-0-N-methylacetamido (2'-0-NMA). In some embodiments, antagomirs include at least one 2'-0-methyl-modified nucleotide.
[00228] In some embodiments, the RNA effector molecule is a promoter-directed RNA (pdRNA) which is substantially complementary to a noncoding region of an mRNA transcript of a target gene. The pdRNA can be substantially complementary to the promoter region of a target gene mRNA at a site located upstream from the transcription start site, e.g., more than 100, more than 200, or more than 1,000 bases upstream from the transcription start site. Also, the pdRNA can substantially complementary to the 3'-UTR of a target gene mRNA transcript. For example, the pdRNA comprises dsRNA of 18 to 28 bases optionally having 3' di- or tri-nucleotide
overhangs on each strand. The dsRNA is substantially complementary to the promoter region or the 3'-UTR region of a target gene mRNA transcript. In another embodiment, the pdRNA comprises a gapmer consisting of a single stranded polynucleotide comprising a DNA sequence which is substantially complementary to the promoter or the 3'-UTR of a target gene mRNA transcript, and flanking the polynucleotide sequences (e.g., comprising the five terminal bases at each of the 5' and 3' ends of the gapmer) comprising one or more modified nucleotides, such as 2'MOE, 2'OMe, or Locked Nucleic Acid bases (LNA), which protect the gapmer from cellular nucleases.
[00229] Expressed interfering RNA (eiRNA) can be used to selectively increase, decrease, or otherwise modulate expression of a target gene. Typically, eiRNA, the dsRNA is expressed in the first transfected cell from an expression vector. In such a vector, the sense strand and the antisense strand of the dsRNA can be transcribed from the same nucleic acid sequence using e.g., two convergent promoters at either end of the nucleic acid sequence or separate promoters transcribing either a sense or antisense sequence. Alternatively, two plasmids can be cotransfected, with one of the plasmids designed to transcribe one strand of the dsRNA while the other is designed to transcribe the other strand. Methods for making and using eiRNA effector molecules are known in the art. See, e.g., WO 2006/033756; U.S. Patent Pubs. No. 2005/0239728 and No. 2006/0035344.
[00230] In some embodiments, the RNA effector molecule comprises a small single-stranded Piwi- interacting RNA (piRNA effector molecule) which is substantially complementary to a target gene, and which selectively binds to proteins of the Piwi or Aubergine subclasses of Argonaute proteins. A piRNA effector molecule can be about 10 to 50 nucleotides in length, about 25 to 39 nucleotides in length, or about 26 to 31 nucleotides in length. See, e.g., U.S. Patent Application Pub. No. 2009/0062228.
[00231] MicroRNAs are a highly conserved class of small RNA molecules that are transcribed from DNA in the genomes of plants and animals, but are not translated into protein. Pre- microRNAs are processed into miRNAs. Processed microRNAs are single stranded -17 to 25 nucleotide (nt) RNA molecules that become incorporated into the RNA-induced silencing complex (RISC) and have been identified as key regulators of development, cell proliferation, apoptosis and differentiation. They are believed to play a role in regulation of gene expression
by binding to the 3 '-untranslated region of specific mRNAs. MicroRNAs cause post- transcriptional silencing of specific target genes, e.g., by inhibiting translation or initiating degradation of the targeted mRNA. In some embodiments, the miRNA is completely complementary with the target nucleic acid. In other embodiments, the miRNA has a region of noncomplementarity with the target nucleic acid, resulting in a "bulge" at the region of non- complementarity. In some embodiments, the region of noncomplementarity (the bulge) is flanked by regions of sufficient complementarity, e.g., complete complementarity, to allow duplex formation. For example, the regions of complementarity are at least 8 to 10 nucleotides long (e.g., 8, 9, or 10 nucleotides long).
[00232] miRNA can inhibit gene expression by, e.g., repressing translation, such as when the miRNA is not completely complementary to the target nucleic acid, or by causing target RNA degradation, when the miRNA binds its target with perfect or a high degree of complementarity. In further embodiments, the RNA effector molecule can include an oligonucleotide agent which targets an endogenous miRNA or pre-miRNA. For example, the RNA effector can target an endogenous miRNA which negatively regulates expression of a target gene, such that the RNA effector alleviates miRNA-based inhibition of the target gene.
[00233] The miRNA can comprise naturally occurring nucleobases, sugars, and covalent internucleotide (backbone) linkages, or comprise one or more non-naturally-occurring features that confer desirable properties, such as enhanced cellular uptake, enhanced affinity for the endogenous miRNA target, and/or increased stability in the presence of nucleases. In some embodiments, an miRNA designed to bind to a specific endogenous miRNA has substantial complementarity, e.g., at least 70%, 80%, 90%, or 100% complementary, with at least 10, 20, or 25 or more bases of the target miRNA. Exemplary oligonucleiotde agents that target miRNAs and pre-miRNAs are described, for example, in U.S. Patent Pubs. No. 20090317907, No. 20090298174, No. 20090291907, No. 20090291906, No. 20090286969, No. 20090236225, No. 20090221685, No. 20090203893, No. 20070049547, No. 20050261218, No. 20090275729, No. 20090043082, No. 20070287179, No. 20060212950, No. 20060166910, No. 20050227934, No. 20050222067, No. 20050221490, No. 20050221293, No. 20050182005, and No. 20050059005.
[00234] A miRNA or pre-miRNA can be 10 to 200 nucleotides in length, for example from 16 to 80 nucleotides in length. Mature miRNAs can have a length of 16 to 30 nucleotides, such as 21 to 25 nucleotides, particularly 21 , 22, 23, 24, or 25 nucleotides in length. miRNA precursors can have a length of 70 to 100 nucleotides and can have a hairpin conformation. In some embodiments, miRNAs are generated in vivo from pre-miRNAs by the enzymes cDicer and Drosha. miRNAs or pre-miRNAs can be synthesized in vivo by a cell-based system or can be chemically synthesized. miRNAs can comprise modifications which impart one or more desired properties, such as superior stability, hybridization thermodynamics with a target nucleic acid, targeting to a particular tissue or cell-type, and/or cell permeability, e.g., by an endocytosis- dependent or -independent mechanism. Modifications can also increase sequence specificity, and consequently decrease off-site targeting.
[00235] Optionally, an RNA effector may biochemically modified to enhance stability or other beneficial characteristics.
[00236] Oligonucleotides can be modified to prevent rapid degradation of the oligonucleotides by endo- and exo-nucleases and avoid undesirable off-target effects. The nucleic acids featured in the invention can be synthesized and/or modified by methods well established in the art, such as those described in CURRENT PROTOCOLS IN NUCLEIC ACID CHEMISTRY (Beaucage et al, eds., John Wiley & Sons, Inc., NY). Modifications include, for example, (a) end modifications, e.g., 5' end modifications (phosphorylation, conjugation, inverted linkages, etc.), or 3' end modifications (conjugation, DNA nucleotides, inverted linkages, etc.); (b) base modifications, e.g., replacement with stabilizing bases, destabilizing bases, or bases that base pair with an expanded repertoire of partners, removal of bases (abasic nucleotides), or conjugated bases; (c) sugar modifications (e.g., at the 2' position or 4' position) or replacement of the sugar; as well as (d) internucleoside linkage modifications, including modification or replacement of the phosphodiester linkages. Specific examples of oligonucleotide compounds useful in this invention include, but are not limited to RNAs containing modified backbones or no natural internucleoside linkages. RNAs having modified backbones include, among others, those that do not have a phosphorus atom in the backbone. Specific examples of oligonucleotide compounds useful in this invention include, but are not limited to oligonucleotides containing modified or
non-natural internucleoside linkages. Oligonucleotides having modified internucloside linkages include, among others, those that do not have a phosphorus atom in the internucleoside linkage.
[00237] Modified internucleoside linkages include (e.g., RNA backbones) include, for example, phosphorothioates, chiral phosphorothioates, phosphorodithioates, phosphotriesters, aminoalkylphosphotri esters, methyl and other alkyl phosphonates including 3'-alkylene phosphonates and chiral phosphonates, phosphinates, phosphoramidates including 3 '-amino phosphoramidate and aminoalkylphosphoramidates, thionophosphoramidates, thionoalkylphosphonates, thionoalkylphosphotriesters, and boranophosphates having normal 3 '-5' linkages, 2' -5' linked analogs of these, and those) having inverted polarity wherein the adjacent pairs of nucleoside units are linked 3'-5' to 5'-3' or 2'-5' to 5'-2'. Various salts, mixed salts and free acid forms are also included.
[00238] Additionally, both the sugar and the internucleoside linkage may be modified, i.e., the backbone, of the nucleotide units are replaced with novel groups. One such oligomeric compound, an RNA mimetic that has been shown to have excellent hybridization properties, is referred to as a peptide nucleic acid (PNA).
[00239] Modified oligonucleotides can also contain one or more substituted sugar moieties. The RNA effector molecules, e.g., dsRNAs, can include one of the following at the 2' position: H (deoxyribose); OH (ribose); F; 0-, S-, or N-alkyl; 0-, S-, or N-alkenyl; 0-, S- or N-alkynyl; or O-alkyl-O-alkyl, wherein the alkyl, alkenyl and alkynyl can be substituted or unsubstituted Ci to Cio alkyl or C2 to C10 alkenyl and alkynyl. Other modifications include 2'-methoxy (2'-0Ο¾), 2'-aminopropoxy (^-OCHJCHJCHJNHJ) and 2'-fluoro (2*-F).
[00240] The oligonucleotides can also be modified to include one or more locked nucleic acids (LNA). A locked nucleic acid is a nucleotide having a modified ribose moiety in which the ribose moiety comprises an extra bridge connecting the 2' and 4' carbons. This structure effectively "locks" the ribose in the 3'-endo structural conformation. The addition of locked nucleic acids to oligonucleotide molecules has been shown to increase oligonucleotide molecule stability in serum, and to reduce off-target effects. Elmen et al., 33 Nucl. Acids Res. 439-47 (2005); Mook et al, 6 Mol. Cancer Ther. 833-43 (2007); Grunweller et al, 31 Nucl. Acids Res. 3185-93 (2003); U.S. Patents No. 6,268,490; No. 6,670,461 ; No. 6,794,499; No. 6,998,484; No. 7,053,207; No. 7,084,125; and No. 7,399,845.
2. Activator Molecules
[00241] In certain embodiments, the activator is an molecule or agent that is effective to increase expression of one or more genes. In general, the activator is an agent that is effective to increase initiation of transcription binding factors and/or decrease transcription inhibitors. In one embodiment, the activator is an activator protein that modulates expression of the selected gene or genes to be upregulated.
3. Delivery Methods of RNA Effector Molecules and/or Activators
[00242] The discussion below is with reference to delivery of RNA effector molecules. However, it will be understood that the delivery methods described below are applicable to activators. The delivery of RNA effector molecules to cells can be achieved in a number of different ways. Several suitable delivery methods are well known in the art. For example, the skilled person is directed to WO 2011/005786, which discloses exemplary delivery methods can be used in this invention at pages 187-219, the teachings of which are incorporated herein by reference.
[00243] A reagent that facilitates RNA effector molecule uptake may be used. For example, an emulsion, a cationic lipid, a non-cationic lipid, a charged lipid, a liposome, an anionic lipid, a penetration enhancer, a transfection reagent or a modification to the RNA effector molecule for attachment, e.g., a ligand, a targeting moiety, a peptide, a lipophilic group, etc.
[00244] For example, RNA effector molecules can be delivered using a drug delivery system such as a nanoparticle, a dendrimer, a polymer, a liposome, or a cationic delivery system. Positively charged cationic delivery systems facilitate binding of a RNA effector molecule (negatively charged) and also enhance interactions at the negatively charged cell membrane to permit efficient cellular uptake. Cationic lipids, dendrimers, or polymers can either be bound to RNA effector molecules, or induced to form a vesicle, liposome, or micelle that encases the RNA effector molecule. See, e.g., Kim et al, 129 J. Contr. Release 107-16 (2008). Methods for making and using cationic-RNA effector molecule complexes are well within the abilities of those skilled in the art. See e.g., Sorensen et al 327 J. Mol. Biol. 761-66 (2003); Verma et al, 9 Clin. Cancer Res. 1291-1300 (2003); Arnold et al, 25 J. Hypertens. 197-205 (2007).
[00245] The RNA effector molecules described herein can be encapsulated within liposomes or can form complexes thereto, in particular to cationic liposomes. Alternatively, the RNA effector
molecules can be complexed to lipids, in particular to cationic lipids. Suitable fatty acids and esters include but are not limited to arachidonic acid, oleic acid, eicosanoic acid, lauric acid, caprylic acid, capric acid, myristic acid, palmitic acid, stearic acid, linoleic acid, linolenic acid, dicaprate, tricaprate, monoolein, dilaurin, glyceryl 1 -monocaprate, 1-dodecylazacycloheptan- 2-one, an acylcarnitine, an acylcholine, or a CI -20 alkyl ester (e.g., isopropylmyristate IPM), monoglyceride, diglyceride, or acceptable salts thereof.
[00246] The lipid to RNA ratio (mass/mass ratio) (e.g., lipid to dsRNA ratio) can be in ranges of from about 1 : 1 to about 50: 1, from about 1 : 1 to about 25: 1 , from about 3: 1 to about 15: 1 , from about 4: 1 to about 10: 1 , from about 5 : 1 to about 9: 1 , or about 6: 1 to about 9: 1 , inclusive.
[00247] A cationic lipid of the formulation can comprise at least one protonatable group having a pKa of from 4 to 15. The cationic lipid can be, for example, N,N-dioleyl-N,N- dimethylammonium chloride (DODAC), N,N-distearyl-N,N-dimethylammonium bromide (DDAB), N-(I-(2,3- dioleoyloxy)propyl)-N,N,N-tnmethylammonium chloride (DOTAP), N-(I- (2,3- dioleyloxy)propyl)-N,N,N-trimethylammonium chloride (DOTMA), N,N-dimethyl-2,3- dioleyloxy)propylamine (DODMA), 1 ,2-DiLinoleyloxy-N,N-dimethylaminopropane (DLinDMA), l,2-Dilinolenyloxy-N,N-dimethylaminopropane (DLenDMA), 1,2- Dilinoleylcarbamoyloxy-3-dimethylaminopropane (DLin-C-DAP), 1 ,2-Dilinoleyoxy-3- (dimethylamino)acetoxypropane (DLin-DAC), l ,2-Dilinoleyoxy-3-morpholinopropane (DLin- MA), l,2-Dilinoleoyl-3-dimethylaminopropane (DLinDAP), l,2-Dilinoleylthio-3- dimethylaminopropane (DLin-S-DMA), 1 -Linoleoyl-2-linoleyloxy-3-dimethylaminopropane (DLin-2-DMAP), l ,2-Dilinoleyloxy-3-trimethylaminopropane chloride salt (DLin-TMA.Cl), l,2-Dilinoleoyl-3-trimethylaminopropane chloride salt (DLin-TAP.Cl), l,2-Dilinoleyloxy-3-(N- methylpiperazino)propane (DLin-MPZ), or 3-(N,N-Dilinoleylamino)-l,2-propanediol (DLinAP), 3-(N,N-Dioleylamino)-l,2-propanedio (DOAP), l,2-Dilinoleyloxo-3-(2-N,N- dimethylamino)ethoxypropane (DLin-EG-DMA), 2,2-Dilinoleyl-4-dimethylaminomethyl-[l,3]- dioxolane (DLin-K-DMA), 2,2-Dilinoleyl-4-dimethylaminoethyl-[l ,3]-dioxolane, or a mixture thereof. The cationic lipid can comprise from about 20 mol% to about 70 mol%, inclusive, or about 40 mol% to about 60 mol%, inclusive, of the total lipid present in the particle. In one embodiment, cationic lipid can be further conjugated to a ligand.
[00248] A non-cationic lipid can be an anionic lipid or a neutral lipid, such as distearoyl- phosphatidylcholine (DSPC), dioleoylphosphatidylcholine (DOPC), dipalmitoyl- phosphatidylcholine (DPPC), dioleoylphosphatidylglycerol (DOPG), dipalmitoyl- phosphatidylglycerol (DPPG), dioleoyl-phosphatidylethanolamine (DOPE), palmitoyloleoyl- phosphatidylcholine (POPC), palmitoyloleoyl- phosphatidylethanolamine (POPE), dioleoyl- phosphatidylethanolamine 4-(N-maleimidomethyl)-cyclohexane-l- carboxylate (DOPE-mal), dipalmitoyl phosphatidyl ethanolamine (DPPE), dimyristoylphosphoethanolamine (DMPE), distearoyl-phosphatidyl-ethanolamine (DSPE), 16-O-monomethyl PE, 16-O-dimethyl PE, 18-1- trans PE, 1 -stearoyl-2-oleoyl- phosphatidyethanolamine (SOPE), cholesterol, or a mixture thereof. The non-cationic lipid can be from about 5 mol% to about 90 mol%, inclusive, of about 10 mol%, to about 58 mol%, inclusive, if cholesterol is included, of the total lipid present in the particle.
4. Antibodies
[00249] In certain embodiments, the inhibitor is an antibody that binds to a gene product described herein (e.g., a protein encoded by the gene), such as a neutralizing antibody that reduces the activity of the protein.
[00250] The term "antibody" refers to an immunoglobulin or fragment thereof, and encompasses any such polypeptide comprising an antigen-binding fragment of an antibody. The term includes but is not limited to polyclonal, monoclonal, monospecific, polyspecific, humanized, human, single-chain, chimeric, synthetic, recombinant, hybrid, mutated, grafted, and in vitro generated antibodies.
[00251] An antibody may also refer to antigen-binding fragments of an antibody. Examples of antigen-binding fragments include, but are not limited to, Fab fragments (consisting of the VL, VH, CL and CHI domains); Fd fragments (consisting of the VH and CHI domains); Fv fragments (referring to a dimer of one heavy and one light chain variable domain in tight, non-covalent association); dAb fragments (consisting of a VH domain); isolated CDR regions; (Fab')2 fragments, bivalent fragments (comprising two Fab fragments linked by a disulphide bridge at the hinge region), scFv (referring to a fusion of the VL and VH domains, linked together with a short linker), and other antibody fragments that retain antigen-binding function. The part of the antigen that is specifically recognized and bound by the antibody is referred to as the "epitope."
[00252] An antigen-binding fragment of an antibody can be produced by conventional biochemical techniques, such as enzyme cleavage, or recombinant DNA techniques known in the art. These fragments may be produced by proteolytic cleavage of intact antibodies by methods well known in the art, or by inserting stop codons at the desired locations in the vectors using site-directed mutagenesis, such as after CHI to produce Fab fragments or after the hinge region to produce (Fab')2 fragments. For example, Papain digestion of antibodies produces two identical antigen-binding fragments, called "Fab" fragments, each with a single antigen-binding site, and a residual "Fc" fragment. Pepsin treatment of an antibody yields an F(ab')2 fragment that has two antigen-combining sites and is still capable of cross-linking antigen. Single chain antibodies may be produced by joining VL and VH coding regions with a DNA that encodes a peptide linker connecting the VL and VH protein fragments
[00253] An antigen-binding fragment/domain may comprise an antibody light chain variable region (VL) and an antibody heavy chain variable region (VH); however, it does not have to comprise both. Fd fragments, for example, have two VH regions and often retain some antigen- binding function of the intact antigen-binding domain. Examples of antigen-binding fragments of an antibody include (1 ) a Fab fragment, a monovalent fragment having the VL, VH, CL and CHI domains; (2) a F(ab')2 fragment, a bivalent fragment having two Fab fragments linked by a disulfide bridge at the hinge region; (3) a Fd fragment having the two VH and CHI domains; (4) a Fv fragment having the VL and VH domains of a single arm of an antibody, (5) a dAb fragment (Ward et al., (1989) Nature 341 : 544-546), that has a VH domain; (6) an isolated complementarity determining region (CDR), and (7) a single chain Fv (scFv). Although the two domains of the Fv fragment, VL and VH, are coded for by separate genes, they can be joined, using recombinant DNA methods, by a synthetic linker that enables them to be made as a single protein chain in which the VL and VH regions pair to form monovalent molecules (known as single chain Fv (scFv); see e.g., Bird et al. (1988) Science 242:423-426; and Huston et al. (1988) Proc. Natl. Acad. Sci. USA 85 : 5879-5883). These antibody fragments are obtained using conventional techniques known to those with skill in the art, and the fragments are evaluated for function in the same manner as are intact antibodies.
[00254] Antibodies described herein, or an antigen-binding fragment thereof, can be prepared, for example, by recombinant DNA technologies and/or hybridoma technology. For example, a
host cell may be transfected with one or more recombinant expression vectors carrying DNA fragments encoding the immunoglobulin light and heavy chains of the antibody, or an antigen- binding fragment of the antibody, such that the light and heavy chains are expressed in the host cell and, preferably, secreted into the medium in which the host cell is cultured, from which medium the antibody can be recovered. Antibodies derived from murine or other non-human species can be humanized, e.g., by CDR drafting.
[00255] Standard recombinant DNA methodologies may be used to obtain antibody heavy and light chain genes or a nucleic acid encoding the heavy or light chains, incorporate these genes into recombinant expression vectors and introduce the vectors into host cells, such as those described in Sambrook, Fritsch and Maniatis (eds), Molecular Cloning; A Laboratory Manual, Second Edition, Cold Spring Harbor, N. Y.,(1989), Ausubel, F. M. et al. (eds. ) Current Protocols in Molecular Biology, Greene Publishing Associates, (1989) and in U. S. Pat. No. 4,816, 397 by Boss et al.
5 Combination Therapy
[00256] The inhibitors described herein may be used in combination with another therapeutic agent. Further, the methods of treatment described herein may be carried out in combination with another treatment regimen, such as chemotherapy, radiotherapy, surgery, etc.
[00257] Suitable chemotherapeutic drugs include, e.g., alkylating agents, anti-metabolites, anti- mitototics, alkaloids (e.g., plant alkaloids and terpenoids, or vinca alkaloids), podophyllotoxin, taxanes, topoisomerase inhibitors, cytotoxic antibiotics, or a combination thereof. Examples of these chemotherapeutic drugs include platinum-based drugs, bevacizumab, paclitaxel, docetaxel, pegylated liposomal doxorubicin, topotecan, letrozole, tamoxifen citrate, topotecan hydrochloride, and trametinib. Examples of platinum-based drugs include, but are not limited to cisplatin and carboplatin.
[00258] The inhibitors described herein can also be administered in combination with radiotherapy or surgery. For example, an inhibitor can be administered prior to, during or after surgery or radiotherapy. Administration during surgery can be as a bathing solution for the operation site.
[00259] Additionally, the RNA effector molecules described herein may be used in combination with additional RNA effector molecules that target additional genes (such as a growth factor, or
an oncogene) to enhance efficacy. For example, certain oncogenes are known to increase the malignancy of a tumor cell. Some oncogenes, usually involved in early stages of cancer development, increase the chance that a normal cell develops into a tumor cell. Accordingly, one or more oncogenes may be targeted in addition to CdknlA, Mapkl4, Rad51APl, Kras, Rpa3, Pold2, Pabpc5, and Bcap31. Commonly seen oncogenes include growth factors or mitogens (such as Platelet-derived growth factor), receptor tyrosine kinases (such as HER2/neu, also known as ErbB-2), cytoplasmic tyrosine kinases (such as the Src-family, Syk-ZAP-70 family and BTK family of tyrosine kinases), regulatory GTPases (such as Ras), cytoplasmic serine/threonine kinases (such as cyclin dependent kinases) and their regulatory subunits, and transcription factors (such as myc).
6 Administration
[00260] Inhibitors and activators described herein may be formulated into pharmaceutical compositions. The pharmaceutical compositions usually one or more pharmaceutical carrier(s) and/or excipient(s). A thorough discussion of such components is available in Gennaro (2000) Remington: The Science and Practice of Pharmacy (20th edition). Examples of such carriers or additives include water, a pharmaceutical acceptable organic solvent, collagen, polyvinyl alcohol, polyvinylpyrrolidone, a carboxyvinyl polymer, carboxymethylcellulose sodium, polyacrylic sodium, sodium alginate, water-soluble dextran, carboxymethyl starch sodium, pectin, methyl cellulose, ethyl cellulose, xanthan gum, gum Arabic, casein, gelatin, agar, diglycerin, glycerin, propylene glycol, polyethylene glycol, Vaseline, paraffin, stearyl alcohol, stearic acid, human serum albumin (HSA), mannitol, sorbitol, lactose, a pharmaceutically acceptable surfactant and the like. Formulation of the pharmaceutical composition will vary according to the route of administration selected.
[00261] The amounts of an inhibitor and/or activator in a given dosage will vary according to the size of the individual to whom the therapy is being administered as well as the characteristics of the disorder being treated. In exemplary treatments, it may be necessary to administer about 1 mg/day, about 5 mg/day, about 10 mg/day, about 20 mg/day, about 50 mg/day, about 75 mg/day, about 100 mg/day, about 150 mg/day, about 200 mg/day, about 250 mg/day, about 400 mg/day, about 500 mg/day, about 800 mg/day, about 1000 mg/day, about 1600 mg/day or about 2000 mg/day. The doses may also be administered based on weight of the patient, at a dose of 0.01 to
50 mg/kg. The glycoprotein may be administered in a dose range of 0.015 to 30 mg/kg, such as in a dose of about 0.015, about 0.05, about 0.15, about 0.5, about 1.5, about 5, about 15 or about
30 mg/kg.
[00262] The compositions described herein may be administered to a subject orally, topically, transdermally, parenterally, by inhalation spray, vaginally, rectally, or by intracranial injection. The term parenteral as used herein includes subcutaneous injections, intravenous, intramuscular, intracisternal injection, or infusion techniques. Administration by intravenous, intradermal, intramusclar, intramammary, intraperitoneal, intrathecal, retrobulbar, intrapulmonary injection and or surgical implantation at a particular site is contemplated as well.
[00263] Standard dose-response studies, first in animal models and then in clinical testing, can reveal optimal dosages for particular diseases and patient populations.
[00264] To facilitate a better understanding of the subject technology, the following examples of preferred embodiments are given. In no way should the following examples be read to limit, or to define, the scope of the subject technology.
EXAMPLE 1
[00265] According to some embodiments, a generalized singular value decomposition (GSVD) was used to identify a global pattern of tumor-exclusive co-occurring CNAs that is correlated and possibly coordinated with OV survival. This pattern is revealed by GSVD comparison of array comparative genomic hydridization (aCGH) data from patient-matched OV and normal blood samples from The Cancer Genome Atlas (TCGA).
[00266] Figure 3 is a diagram of a tensor generalized singular value decomposition (GSVD) of the patient- and platform-matched DNA copy-number profiles of the 6p+12p chromosome arms, according to some embodiments. For each chromosome arm or combination of two chromosome arms, the structure of the tumor and normal discovery datasets (Dj and ¾) is that of two third- order tensors with one-to-one mappings between the column dimensions but different row dimensions. The patients, platforms, probes, and tissue types, each represent a degree of freedom. The tensor GSVD is depicted in a raster display, with relative copy-number gain, no change, and loss, explicitly showing the first through the 5th, and the 245th through the 249th 6p+12p x-probelets, both 6p+12p -probelets, and the first through the 10th, and the 489th
through the 498th 6p+12p tumor and normal arraylets. This display shows that the significance of a subtensor in the tumor dataset relative to that of the corresponding subtensor in the normal dataset, i.e., the tensor GSVD angular distance, equals the row mode GSVD angular distance, i.e., the significance of the corresponding tumor arraylet in the tumor dataset relative to that of the normal arraylet in the normal dataset. The tensor GSVD angular distances for the 498 pairs of 6p+12p arraylets are depicted in a bar chart display, where the angular distance corresponding to the first pair of arraylets is ~π/4. For the 6p+12p combination of two chromosome arms, it was found that the most significant subtensor in the tumor dataset (which corresponds to the coefficient of largest magnitude in R/) is a combination of (z) the first -probelet, which is approximately invariant across the platforms, (/'/') the first x-probelet, which classifies the discovery set of patients into two groups of high and low coefficients, of significantly and robustly different prognoses, and (/'/'/') the first, most tumor-exclusive tumor arraylet, which classifies the validation set of patients into two groups of high and low correlations of significantly different prognoses consistent with the x-probelet' s classification of the discovery set.
[00267] Figure 4 is a diagram illustrating a GSVD of biological data, according to some embodiments. The tensor GSVD of the patient- and platform-matched DNA copy-number profiles of the 7p chromosome arm is depicted in a raster display. The raster display is depicted with relative copy-number gain, no change, and loss, explicitly showing the first through the 5th, and the 245th through the 249th 7p x-probelets, both 7p -probelets, and the first through the 10th, and the 489th through the 498th 7p tumor and normal arraylets. The display shows that the significance of a subtensor in the tumor dataset relative to that of the corresponding subtensor in the normal dataset, i.e., the tensor GSVD angular distance, equals the row mode GSVD angular distance, i.e., the significance of the corresponding tumor arraylet in the tumor dataset relative to that of the normal arraylet in the normal dataset. The tensor GSVD angular distances for the 498 pairs of 7p arraylets are depicted in a bar chart display (Fig. 9), where the angular distance corresponding to the first pair of arraylets is ~π/4. For the 7p chromosome arm, the most significant subtensor in the tumor dataset is a combination of (z) the first -probelet, which is approximately invariant across the platforms, (z'z) the first x-probelet, which classifies the discovery set of patients into two groups of high and low coefficients, of significantly and
robustly different prognoses, and (/'/'/') the first, most tumor-exclusive tumor arraylet, which classifies the validation set of patients into two groups of high and low correlations of significantly different prognoses consistent with the x-probelet' s classification of the discovery set.
[00268] Figure 5 is a diagram illustrating the tensor GSVD of the patient- and platform-matched DNA copy-number profiles of the Xq chromosome arm, according to some embodiments. The tensor GSVD is depicted in a raster display, with relative copy-number gain, no change, and loss, explicitly showing the first through the 5th, and the 245th through the 249th Xq x-probelets, both Xq -probelets, and the first through the 10th, and the 489th through the 498th Xq tumor and normal arraylets. The tensor GSVD angular distances for the 498 pairs of Xq arraylets are depicted in a bar chart display (Fig. 9), where the angular distance corresponding to the first pair of arraylets is ~π/4.
[00269] The significance of the probelet in the tumor data set relative to its significance in the normal data set is depicted in a bar chart display (Fig. 9). Bar charts of the ten subtensors Sj(a, b, c) that are most significant in the 6p+12p (a) tumor, and (b) normal, 7p (c) tumor, and (d ) normal, and Xq (e) tumor, and ( / ) normal datasets, in terms of the fractions V abc, i.e., the subtensors which correspond to the coefficients of largest magnitudes are shown in Fig. 9. The most significant subtensor in each of the tumor datasets, e.g., is Si(\ , 1 , 1), which is a combination or an outer product of the first, most tumor-exclusive tumor arraylet, and the first x- and -probelets. The most significant subtensor in each of the normal datasets is <¾(498, 249, 1), which is a combination or an outer product of the 498th, most normal-exclusive normal arraylet, the 249th x-probelet and the first -probelet. The tensor generalized Shannon entropy dt of each dataset is also noted.
EXAMPLE 2
[00270] According to embodiments described above, a GSVD has been used to identify a global pattern of tumor-exclusive co-occurring CNAs that is correlated and possibly coordinated with OV survival. This pattern is revealed by GSVD comparison of array comparative genomic hydridization (aCGH) data from discovery and validation patient profiles from The Cancer Genome Atlas (TCGA).
[00271] The discovery set of patients reflects the general primary, high-grade OV patient population, with approximately 5%, 7%, 76%, and 12% of the patients diagnosed at stages I, II, III, and IV, and 218, i.e., ~88%, treated with platinum-based chemotherapy, i.e., cisp latin, carboplatin, or oxaliplatin, and 240 of the 249, i.e., >95% of the tumors at grades 2 and higher.
[00272] We selected primary OV tumor and normal DNA copy-number profiles of a set of 249 TCGA patients. Each profile was measured in two replicates by the same set of two DNA microarray platforms.
[00273] Each profile in the discovery datasets lists log2 of TCGA level 1 background-subtracted intensity in the sample relative to the male Promega DNA reference, with signal to background >2.5 for both the sample and reference in >90% of the 391,190 autosomal probes and >65% of the 10,911 X chromosome probes that match between the two Agilent Human array CGH (aCGH) DNA microarray platforms, G4447A and G4124A. Tumor and normal probes were selected with valid data in >99% of the tumor or normal arrays of each platform, respectively. For each chromosome arm or combination of two chromosome arms, and for each platform, the <0.5% missing data entries in the tumor and normal profiles were estimated by using the SVD, as previously described. Each profile was then centered at its copy-number median, and normalized by its copy-number sMAD.
[00274] For the validation dataset, we selected 131 and 41 stage III-IV OV aCGH profiles measured by the Agilent Human aCGH G4447A and G4124A microarray platforms, respectively, corresponding to 148 primary OV tumors. Of the 148 patients, 140, i.e., ~95%, were treated with platinum-based chemotherapy, and 144, i.e., >95% of the tumors are high- grade, i.e., grades 2 and higher tumors. Each profile lists log2 of TCGA level 1 background- subtracted intensity in the sample relative to the male Promega DNA reference, with signal to background >2.5 for both the sample and reference in >99.5% of the 391,190 autosomal probes and >96.5% of the 10,911 X chromosome probes that match between the platforms. Medians of the profiles of samples from the same patient were then taken.
[00275] Figures 6-8 show tumor-exclusive and platform-consistent DNA copy-number alterations (CNAs) correlated with OV patients' survival, in some embodiments. A plot of the first 6p+12p tumor array let describes a pattern of tumor-exclusive and platform-consistent co- occurring CNAs across the combination of the two chromosome arms 6p+12p (see (a)). The
probes are ordered, and their copy numbers are colored according to each probe's chromosomal band location. Segments (black lines) amplified and deleted include most known OV-associated CNAs that map to 6p+12p (black), including an amplification of Kras and a deletion of Priml. CNAs previously unrecognized in OV include a deletion of the p38-encoding Mapkl4, and p21- encoding CdknlA, and an amplification of Rad51APl, a deletion of Tnf, and focal amplifications of Asun, Itpr2, and the 5' ends of isoforms a and e, and exons 5 and 6 of Sox5. A high 6p+12p arraylet correlation is significantly correlated with a patient's shorter survival time. A plot of the first 6p+12p x-probelet describes the classification of the discovery set of patients into two groups of high and low coefficients (see (b)). A high 6p+12p x-probelet coefficient is significantly and robustly correlated with a patient's shorter survival time. A raster display of the 6p+12p tumor profiles, where medians of the profiles of the same patient measured by the two platforms were taken, with relative gain, no change, and loss of DNA copy numbers is shown in (c). A plot of the first 7p tumor arraylet describes a pattern of CNAs across the chromosome arm 7p (see (d)). CNAs previously unrecognized in OV include a focal deletion of Rpa3 and an amplification of Pold2. A high 7p arraylet correlation is significantly correlated with a patient's longer survival time. A plot of the first 7p x-probelet describes the classification of the discovery set of patients into two groups of high and low coefficients is shown in (e). A high 7p x-probelet coefficient is significantly and robustly correlated with a patient's longer survival time. A raster display of the 7p tumor profiles is shown in (f). A plot of the first Xq tumor arraylet is shown in (g). CNAs previously unrecognized in OV include a focal deletion of Pabpc5 and an amplification of Bcap31. A high Xq arraylet correlation is significantly correlated with a patient's longer survival time. A plot of the first Xq x-probelet describes the classification of the discovery set of patients into two groups of high and low coefficients (see (h)). A high Xq x-probelet coefficient is significantly and robustly correlated with a patient's longer survival time. A raster display of the Xq tumor profiles is shown in (i).
EXAMPLE 3
[00276] Survival analysis was used to identify CNAs that may be related to predictors of OV survival and/or response to therapy (e.g. platinum-based chemotherapy), in some embodiments.
[00277] Kaplan-Meier (KM) curves of the discovery set of 249 patients classified by the standard OV indicators are shown in Fig. 10: (a) tumor stage at diagnosis, the best predictor of OV survival to date, (b) residual disease after surgery, i.e., no (No) or some (Yes) macroscopic disease, (c) outcome of subsequent therapy, i.e., complete remission (CR) or not (No), (d) neoplasm status, i.e., with (W) tumor or without (WO).
[00278] Fig. 11 shows KM curves of survival analysis for the validation set of 148 stage III-IV patients classified by (a) tumor stage at diagnosis, (b) residual disease after surgery, i.e., no (No) or some (Yes) macroscopic disease, (c) outcome of subsequent therapy, i.e., complete remission (CR) or not (No), (d) neoplasm status, i.e., with (W) tumor or without (WO)..
[00279] Figure 12 shows survival analyses of the discovery and validation sets of patients classified by tensor GSVD, or tensor GSVD and tumor stage at diagnosis. KM curves of the discovery set of 249 patients classified by the 6p+12p x-probelet coefficient (see (a), show a median survival time difference of 1 1 months, with the corresponding log-rank test f-value < 10~2. The univariate Cox proportional hazard ratio is 1.7. KM curve (b) shows survival analyses of the 249 patients classified by the 7p x-probelet coefficient. KM curve (c) shows survival analysis of the 249 patients classified by the Xq x-probelet coefficient. KM curve (d) shows survival analysis of the 249 patients classified by both the 6p+12p tensor GSVD and tumor stage at diagnosis, show the bivariate Cox hazard ratios of 1.5 and 4.0, which do not differ significantly from the corresponding univariate hazard ratios of 1.7 and 4.4, respectively. This means that the 6p+12p tensor GSVD is independent of stage, the best predictor of OV survival to date. The 61 months KM median survival time difference is about 85% and more than two years greater than the 33 month difference between the patients classified by stage alone. This means that the tensor GSVD and stage combined make a better predictor than stage alone. KM curve (e) shows survival analysis for the 249 patients classified by both the 7p tensor GSVD and stage. KM curve (f) shows survival analysis for the 249 patients classified by both the Xq tensor GSVD and stage. KM curves of the validation set of 148 stage III-IV patients classified by the 6p+12p arraylet correlation (see (g)), show a median survival time difference of 22 months, with the corresponding log-rank test P- value < 10~2, and the univariate Cox proportional hazard ratio 1.9. This validates the survival analyses of the discovery set of 249 patients. KM curve (h) shows
survival analyses of the 148 patients classified by the 7p arraylet correlation. KM curve (i) shows survival analysis for the 148 patients classified by the Xq arraylet correlation.
[00280] Figure 13 shows survival analyses of the platinum-based chemotherapy patients in the discovery and validation sets classified by tensor GSVD, or tensor GSVD and tumor stage at diagnosis. KM curves of only the 218, i.e., ~88% platinum-based chemotherapy patients in the discovery set, classified by the 6p+12p x-probelet coefficient, show a median survival time difference of 14 months, with the corresponding log-rank test f-value < 10 (see (a)). The univariate Cox proportional hazard ratio is 2.0. KM curve (b) shows survival analyses of the 218 patients classified by the 7p x-probelet coefficient. KM curve (c) shows survival analysis for the 218 patients classified by the Xq x-probelet coefficient. The 218 patients classified by both the 6p+12p tensor GSVD and tumor stage at diagnosis, show the bivariate Cox hazard ratios of 1.8 and 4.1 , which do not differ significantly from the corresponding univariate hazard ratios of 2.0 and 4.4, respectively (see KM curve (d). This means that the 6p+12p tensor GSVD is independent of stage, the best predictor of OV survival to date. KM curve (e) shows survival analysis for the 218 patients classified by both the 7p tensor GSVD and stage. KM curve (ΐ) shows survival analysis for tThe 218 patients classified by both the Xq tensor GSVD and stage. KM curves of only the 140, i.e., -95% platinum-based chemotherapy patients in the validation set, classified by the 6p+12p arraylet correlation, show a median survival time difference of 18 months, with the univariate Cox proportional hazard ratio 1.8 (see (g)). This validates the survival analyses of the 218 chemotherapy patients in the discovery set. KM curve (h) shows survival analyses of the 148 patients classified by the 7p arraylet correlation. KM curve (\) shows survival analysis for tThe 148 patients classified by the Xq arraylet correlation.
[00281] Figure 14 shows survival analyses of the validation set of patients classified by tensor GSVD and tumor stage at diagnosis. KM curves of the validation set of 148 stage III-IV patients classified by both the 6p+12p tensor GSVD and tumor stage at diagnosis, show the bivariate Cox hazard ratios of 1.9 and 1.8, which are the same as the corresponding univariate ratios (see (a)). This means that the 6p+12p tensor GSVD is independent of stage, the best predictor of OV survival to date. The 34 months KM median survival time difference is about 62% and more than one year greater than the 21 month difference between the patients classified by stage alone. This means that the tensor GSVD and stage combined make a better predictor than stage alone.
KM curve (b) shows survival analysis for the 148 patients classified by both the 7p tensor GSVD and stage. KM curve (c) shows survival analysis for the 148 patients classified by both the Xq tensor GSVD and stage.
[00282] Figure 15 shows survival analyses of the discovery set of patients classified by tensor GSVD and standard OV indicators other than stage. KM curves of the discovery set of 249 patients classified by both the (a) 6p+12p, (b) 7p, or (c) Xq tensor GSVD, and residual disease after surgery, the (d ) 6p+12p, (e) 7p, or ( / ) Xq tensor GSVD, and outcome of subsequent therapy, and (g) 6p+12p, (h) 7p, or (z) Xq tensor GSVD, and neoplasm status.
[00283] Figure 16 shows survival analyses of the validation set of patients classified by tensor GSVD and standard OV indicators other than stage. KM curves of the validation set of 148 stage III-IV patients classified by both the (a) 6p+12p, (b) 7p, or (c) Xq tensor GSVD, and residual disease after surgery, the (d) 6p+12p, (e) 7p, or ( ) Xq tensor GSVD, and outcome of subsequent therapy, and (g) 6p+12p, (h) 7p, or (z) Xq tensor GSVD, and neoplasm status.
[00284] Figure 17 shows survival analyses of the discovery and validation sets of patients classified by the novel frequent focal CNAs included in the tensor GSVD arraylets. Six novel frequent focal CNAs that are included in the tensor GSVD arraylets are significantly correlated with OV survival. Two amplified consecutive segments (12pl2.1) contain (a) the 5' ends of isoforms a and e of Sox5, and (b) exons 5 and 6, the first exons that are common to isoforms a, b, d, and e of Sox5. Two other amplified consecutive segments (12pl 1.23) contain (c) Itprl and (d) Asun. One deletion (7p22.1 -p21.3) contains (e) Rpa3. Another deletion (Xq21.31) contains (J) Pabpc5, and the sequence tag site DXS241 adjacent to translocation breakpoints observed in premature ovarian failure.
[00285] Figure 18 shows survival analyses of the discovery and validation sets of patients, as well as only the platinum-based chemotherapy patients in the discovery and validation sets, classified by the 6p+12p, 7p, and Xq tensor GSVD combined. KM curves of the discovery set of 249 patients classified by combination of the 6p+12p, 7p, and Xq x-probelet coefficients, show median survival times of 86, 52, and 36 months for the groups A, B, and C, respectively, with the corresponding log-rank test f-value < 10~3 is shown in (a). KM survival analysis of only the 218, i.e., -88% platinum-based chemotherapy patients in the discovery set, classified by combination of the three tensor GSVDs, gives qualitatively the same and quantitatively similar
results to those of the analyses of 100% of the patients (see (b)). This means that the combination of the three tensor GSVDs predicts survival in the platinum-based chemotherapy patient population. KM curves of the validation set of 148 stage III-IV patients classified by combination of the 6p+12p, 7p, and Xq arraylet correlation coefficients, show median survival times of 72, 57, and 33 months for the groups A, B, and C, respectively, with the corresponding log-rank test P- value < 10~3 (see (c)). This validates the survival analyses of the discovery set of 249 patients. KM survival analysis of only the 140, i.e., -95% platinum- based chemotherapy patients in the validation set, classified by combination of the three tensor GSVDs are shown in (d).
EXAMPLE 4
[00286] To compare the variation in DNA copy numbers with that in gene expression, we used mRNA expression profiles that were available for 394 of the 397 TCGA patients in the discovery and validation sets. Each profile lists TCGA level 3 mRNA expression for 11,457 autosomal and X chromosome genes on the Affymetrix Human Genome U133A Array platform with UCSC coordinates and GO annotations. Medians of the profiles of samples from the same patient were taken. To examine the possible relations between a tensor GSVD class and the OV pathogenesis, we assessed the enrichment of the subsets of genes that are differentially expressed between the tensor GSVD classes in any one of the multiple GO annotations. The f-value of a given enrichment was calculated assuming hypergeometric probability distribution of the annotations among the genes in the global set, and of the subset of annotations among the subset of genes, as previously described (Alter et al, PNAS USA, 2003, 100:3351-3356].
[00287] Figure 19 shows differential mRNA expression between the tensor GSVD classes is consistent with the CNAs. Differential mRNA expression is shown for: (a) Tnf, (b) Mapkl4, and (c) CdknlA, which are deleted in the 6p+12p arraylet, are significantly (Mann-Whitney - Wilcoxon P- value <0.05) underexpressed in the tensor GSVD class of a high 6p+12p x-probelet coefficient, or arraylet correlation relative to the tensor GSVD class of a low 6p+12p x-probelet coefficient, or arraylet correlation, (d) Rad51AP 1 , (e) Itpr2, and (/) Asun, which are amplified in the 6p+12p arraylet, are significantly overexpressed in the tensor GSVD class of a high 6p+12p x-probelet coefficient, or arraylet correlation, (g) Rpa3, which is deleted, and (h) Pold2, which is amplified, in the 7p arraylet, are significantly underexpressed and overexpressed,
respectively, in the tensor GSVD class of a high 7p x-probelet coefficient, or arraylet correlation, (z) Bcap31, which is amplified in the Xq arraylet, is significantly overexpressed in the tensor GSVD class of a high Xq x-probelet coefficient, or arraylet correlation.
[00288] To compare with the variation in microRNA expression, we used microRNA expression profiles that were available for 395 of the 397 patients. Each profile lists TCGA level 3 microRNA expression for 639 autosomal and X chromosome microRNAs on the Agilent Human microRNA Array 8x15K platform with UCSC coordinates. Medians of the profiles of samples from the same patient were taken.
[00289] Figure 20 shows differential microRNA expression between the tensor GSVD classes is consistent with the CNAs. Differential microRNA expression is shown for: (a) mir-877*, which is deleted, and (b) mir-200c, (c) mir-200c*, (d) mir-141 , and (e) mir-141 *, which are amplified in the 6p+12p arraylet, are significantly (Mann-Whitney-Wilcoxon f-value <0.05) underexpressed and overexpressed, respectively, in the tensor GSVD class of a high 6p+12p x- probelet coefficient, or arraylet correlation relative to the tensor GSVD class of a low 6p+12p x- probelet coefficient, or arraylet correlation. ( /) mir-888, (g) mir-224, and (h) mir-452, which are amplified in the Xq arraylet, are significantly overexpressed in the tensor GSVD class of a high Xq x-probelet coefficient, or arraylet correlation.
[00290] To compare with the variation in protein expression, we used protein expression profiles that were available for 282 of the 397 patients. Each profile lists TCGA level 3 protein expression for the 175 antibodies on the MD Anderson Reverse Phase Protein Array (RPPA), which probe for the abundance levels of 136 proteins encoded by autosomal and X chromosome genes.
[00291] Figure 21 shows differential protein expression between the tensor GSVD classes is consistent with the CNAs. Relative protein expression is shown for: (a) MAPK14, which is deleted, and (b) CDKN1B, which is amplified in the 6p+12p arraylet, are significantly (Mann- Whitney-Wilcoxon f-value <0.05) underexpressed and overexpressed, respectively, in the tensor GSVD class of a high 6p+12p x-probelet coefficient, or arraylet correlation relative to the tensor GSVD class of a low 6p+12p x-probelet coefficient, or arraylet correlation.
[00292] As seen in Figures 19-21 , the CNAs are consistent with differential mRNA, microRNA, and protein expression between the tensor GSVD classes. The mRNA and protein encoded by,
e.g., Mapkl4, which is deleted in the 6p+12p arraylet, are both significantly (Mann-Whitney- Wilcoxon f-values <10 5) underexpressed in the tensor GSVD class of a high 6p+12p x-probelet coefficient, or arraylet correlation relative to the tensor GSVD class of a low 6p+12p x-probelet coefficient, or arraylet correlation. The microRNA mir-877* that maps to the same deletion as Mapkl4 is also significantly (Mann- Whitney -Wilcoxon P-value <0.05) underexpressed.
EXAMPLE 5
Discovery Datasets: Pairs of Column-Matched but Row-Independent Tensors
[00293] The discovery set of patients reflects the general primary, high-grade OV patient population, with approximately 5%, 7%, 76%, and 12% of the patients diagnosed at stages I, II, III, and IV, and 218, i.e., ~88%, treated with platinum-based chemotherapy, i.e., cisp latin, carboplatin, or oxaliplatin, and 240 of the 249, i.e., >95% of the tumors at grades 2 and higher.
[00294] Each profile in the discovery datasets lists log2 of TCGA level 1 background-subtracted intensity in the sample relative to the male Promega DNA reference, with signal to background >2.5 for both the sample and reference in >90% of the 391 ,190 autosomal probes and >65% of the 10,911 X chromosome probes that match between the two Agilent Human array CGH (aCGH) DNA microarray platforms, G4447A and G4124A. Tumor and normal probes were selected with valid data in >99% of the tumor or normal arrays of each platform, respectively. For each chromosome arm or combination of two chromosome arms, and for each platform, the <0.5% missing data entries in the tumor and normal profiles were estimated by using the SVD, as previously described. Each profile was then centered at its copy-number median, and normalized by its copy-number sMAD.
Tensor GSVD
[00295] Lemma A. The tensor GSVD exists for any two, e.g., third-order tensors Τ 6 Ki XLxMof the same column dimensions L and M but different row dimensions ¾, where Ki > LM for Ί = 1, 2, if the tensors unfold into full column-rank matrices, Di E MKi XLM, DiX E IRKiMxL, and Diy E MKiLxM, each preserving the Ki-row dimension, L-x-, or - -column dimension, respectively.
[00296] Proof. The tensor GSVD of Eq. (1), of the pair of third-order tensors ¾, is constructed from the GSVDs of Eqs. (2) and (3), of the pairs of full column-rank matrices D Dix, and Diy, where /' = 1, 2. From the existence of the GSVDs of Eqs. (2) and (3) [5, 6], the orthonormal
column bases vectors of U as well as the normalized x- and -row bases vectors of the invertible V or Vy , exist, and, therefore, the tensor GSVD of Eq. (1) also exists. Note that the proof holds for tensors of higher- than-third order.
[00297] Lemma B. The tensor GSVD has the same uniqueness properties as the GSVD.
[00298] Proof. From the uniqueness properties of the GSVDs of Eqs. (2) and (3), the orthonormal column bases vectors u a, and the normalized row bases vectors V b , and Vy C of the tensor GSVD of Eq. (1) are unique, except in degenerate subspaces, defined by subsets of equal generalized singular values σ;, oix, and oiy, respectively, and up to phase factors of ±1. The tensor GSVD, therefore, has the same uniqueness properties as the GSVD. Note that the proof holds for tensors of higher-than-third order.
[00299] For two second-order tensors, the tensor GSVD reduces to the GSVD of the corresponding matrices. Proof. For two second-order tensors, e.g., the matrices Dt 6 R Ki XL, the tensor GSVD of Eq. (1) is
D, = R, Xa U, Xb Vx

[00300] The row- and x-column mode GSVDs of Eqs. (2) and (3) are identical, because unfolding each matrix Z ; while preserving either its Krrov/ dimension, or L-x-column dimension results in D up to permutations of either its columns or rows, respectively,
DI = UI∑I V = DIX, z - 1 , 2. (A2)
[00301] From the uniqueness properties of the tensor GSVD of Eq. (Al), and the GSVDs of Eq. (A2) it follows that ?, =∑;, and that for two second-order tensors, i.e., matrices, the tensor GSVD is equivalent to the GSVD.
[00302] Theorem A. The tensor GSVD of the tensor T>i E M LMXLX1V1 5 which row mode unfolding gives the identity matrix D/ = I E M LMxLM 5 and a tensor Ό2 of the same column dimensions reduces to the HOSVD of Ό2.
[00303] Proof. Consider the GSVD of Eq. (2), of the matrices Di = I and i¾, as computed by using the QR decomposition of the appended Di and i¾, and the SVD of the block of the resulting column- wise orthonormal Q that corresponds to i¾, i.e., Q2 = Un ∑0,V ,

[00304] where R is upper triangular and, therefore, invertible. Since Q is column-wise orthonormal, V is orthonormal, and∑Qz is positive diagonal, it follows that

= R-T R-1 + (l 1 ∑2 Q2V 2
= (v^2Ryl + ( v^R)-l +∑l
(l -∑2 Q2)-l = 2R)( VT R) (A4)
[00305] and that (/ -∑¾2 V R is orthonormal. The GSVD of Eq. (2) factors the matrix D2 into a column- wise or-thonormal UQz, a positive diagonal _∑<¾) 2 and an orthonormal (/
1
-∑Qz z V zR, and is, therefore, reduced to the SVD of Ό2.
[00306] This proof holds for the GSVDs of Eq. (3). This is because the x- and -column unfoldings of the tensor ¾ 6 which row mode unfolding gives the identity matrix = l E LMxLM , gives

[00307] The GSVDs of Eqs. (2) and (3), of any one of the matrices Dj, Djx, or Djy with the corresponding full column-rank matrices i¾, D2x, or D2y, are, therefore, reduced to the SVDs of D2, D2x, or D2y, respectively.
[00308] The tensor GSVD of Eq. (1), where the orthonormal column bases vectors ιι2,α, and the normalized row bases vectors v^b, and Vy c in the factorization of the tensor Z¾ are computed via
the SVDs of the unfolded tensor is, therefore, reduced to the HOSVD of Z¾. Note that the proof holds for tensors of higher-than-third order.
[00309] The "tensor generalized Shannon entropy" of each dataset,
0≤ di = -(2 log LM)_1∑L A^ ∑L B = 1 ∑M=1 P abc log P abc≤ 1 , 1 = 1, 2, (A-6) measures the complexity of each dataset from the distribution of the overall information among the different subtensors. An entropy of zero corresponds to an ordered and redundant dataset in which all the information is captured by a single subtensor. An entropy of one corresponds to a disordered and random dataset in which all subtensors are of equal significance.
V. SEQUENCE LISTING
[00310] Table 3 below describes exemplary sequences for use herein. All sequences are human.
Table 3: Sequences


[00311] The sequences provided in the table above are exemplary and variants which may exist are known to those of skill in the art. For example, some variants of the genes listed above are disclosed in the NCBI Reference Sequence Database (ncbi.nlm.nih.gov).
[00312] Affymetrix microarray probes, which are mapped to a known genomic coordinate, were used to determine differential expression. The UCSC genome browser was used to identify genes and genomic features for the regions identified as having differential expression.
Exemplary sequences were obtained from the UCSC genome browser for the relevant genes and genomic features. It will be appreciated that the relevant genes and genomic features may include variations and alternative specific sequences as known in the art.
[00313] It will be also appreciated by persons skilled in the art that numerous variations and/or modifications may be made to the specific embodiments disclosed herein, without departing from the scope or spirit of the disclosure as broadly described. The present embodiments are, therefore, to be considered in all respects illustrative and not restrictive of the subject technology.
[00314] The foregoing description is provided to enable a person skilled in the art to practice the various configurations described herein. While the subject technology has been particularly described with reference to the various figures and configurations, it should be understood that these are for illustration purposes only and should not be taken as limiting the scope of the subject technology.
[00315] While certain aspects and embodiments of the invention have been described, these have been presented by way of example only, and are not intended to limit the scope of the invention. Indeed, the novel methods and systems described herein may be embodied in a variety of other forms without departing from the spirit thereof. The accompanying claims and their equivalents are intended to cover such forms or modifications as would fall within the scope and spirit of the invention.
[00316] The foregoing description is provided to enable a person skilled in the art to practice the various configurations described herein. While the subject technology has been particularly described with reference to the various figures and configurations, it should be understood that these are for illustration purposes only and should not be taken as limiting the scope of the subject technology.
[00317] There may be many other ways to implement the subject technology. Various functions and elements described herein may be partitioned differently from those shown without departing from the scope of the subject technology. Various modifications to these configurations will be readily apparent to those skilled in the art, and generic principles defined herein may be applied to other configurations. Thus, many changes and modifications may be made to the subject technology, by one having ordinary skill in the art, without departing from the scope of the subject technology.
[00318] A phrase such as "an aspect" does not imply that such aspect is essential to the subject technology or that such aspect applies to all configurations of the subject technology. A disclosure relating to an aspect may apply to all configurations, or one or more configurations. An aspect may provide one or more examples of the disclosure. A phrase such as "an aspect" may refer to one or more aspects and vice versa. A phrase such as "an embodiment" does not imply that such embodiment is essential to the subject technology or that such embodiment applies to all configurations of the subject technology. A disclosure relating to an embodiment may apply to all embodiments, or one or more embodiments. An embodiment may provide one or more examples of the disclosure. A phrase such "an embodiment" may refer to one or more embodiments and vice versa. A phrase such as "a configuration" does not imply that such configuration is essential to the subject technology or that such configuration applies to all configurations of the subject technology. A disclosure relating to a configuration may apply to all configurations, or one or more configurations. A configuration may provide one or more examples of the disclosure. A phrase such as "a configuration" may refer to one or more configurations and vice versa.
[00319] Furthermore, to the extent that the term "include," "have," or the like is used in the description or the claims, such term is intended to be inclusive in a manner similar to the term "comprise" as "comprise" is interpreted when employed as a transitional word in a claim.
[00320] The word "exemplary" is used herein to mean "serving as an example, instance, or illustration." Any embodiment described herein as "exemplary" is not necessarily to be construed as preferred or advantageous over other embodiments.
[00321] The term "about", as used here, refers to +/- 5% of a value.
[00322] A reference to an element in the singular is not intended to mean "one and only one" unless specifically stated, but rather "one or more." The term "some" refers to one or more. All structural and functional equivalents to the elements of the various configurations described throughout this disclosure that are known or later come to be known to those of ordinary skill in the art are expressly incorporated herein by reference and intended to be encompassed by the subject technology. Moreover, nothing disclosed herein is intended to be dedicated to the public regardless of whether such disclosure is explicitly recited in the above description.
[00323] All publications and patents, and NCBI gene ID sequences cited in this disclosure are incorporated by reference in their entirety. To the extent the material incorporated by reference contradicts or is inconsistent with this specification, the specification will supersede any such material. The citation of any references herein is not an admission that such references are prior art to the present invention.
[00324] Those skilled in the art will recognize, or be able to ascertain using no more than routine experimentation, many equivalents to the specific embodiments of the invention described herein. Such equivalents are intended to be encompassed by the following embodiments.
Number and Element Chromosome Name GenBank Accession SEQ ID NO: Organism Type Segment Numbers
1 Gene 6pll.2 PRIM2 NM 000947.4 1 Homo sapiens
NP 000938.2 2 Homo sapiens
NM 001282487.1 3 Homo sapiens
NP 001269416.1 4 Homo sapiens
NM 001282488.1 5 Homo sapiens
NP 001269417.1 6 Homo sapiens
2 Gene 12pl2.l-pll.23 KRAS NM 004985.4 7 Homo sapiens
NP 004976.2 8 Homo sapiens
NM 033360.3 9 Homo sapiens
NP 203524.1 10 Homo sapiens
3 Gene 12pl2.l-pll.23 SOX5 NM 001261414.1 11 Homo sapiens
NP 001248343.1 12 Homo sapiens
NM 001261415.1 13 Homo sapiens
NP 001248344.1 14 Homo sapiens
NM 006940.4 15 Homo sapiens
NP 008871.3 16 Homo sapiens
NM 152989.3 17 Homo sapiens
NP 694534.1 18 Homo sapiens
NM 178010.2 19 Homo sapiens
NP 821078.1 20 Homo sapiens
4 Gene 12pll.23 ITPR2 NM 002223.3 21 Homo sapiens
NP 002214.2 22 Homo sapiens
5 Gene 12pll.23 ASUN NM 018164.2 23 Homo sapiens
NP 060634.2 24 Homo sapiens
6 Gene 7p22.1-p21.3 RPA3 NM 002947.4 25 Homo sapiens
NP 002938.1 26 Homo sapiens
7 Gene Xq21.31 PABPC5 NM 080832.2 27 Homo sapiens
NP 543022.1 28 Homo sapiens
8 Sequence Tag Site Xq21.31 DXS214 29 probe
30 probe
9 Gene 6p25.3-p21.1 CDKN1A NM 000389.4 31 Homo sapiens
NP 000380.1 32 Homo sapiens
NM 001220777.1 33 Homo sapiens
NP 001207706.1 34 Homo sapiens
NM 001220778.1 35 Homo sapiens
NP 001207707.1 36 Homo sapiens
NM 001291549.1 37 Homo sapiens
NP 001278478.1 38 Homo sapiens
NM 078467.2 39 Homo sapiens
NP 510867.1 40 Homo sapiens
10 Gene 6p25.3-p21.1 MAPK14 NM 001315.2 41 Homo sapiens
NP 001306.1 42 Homo sapiens
NM 139012.2 43 Homo sapiens
NP 620581.1 44 Homo sapiens
NM 139013.2 45 Homo sapiens
NP 620582.1 46 Homo sapiens
NM 139014.2 47 Homo sapiens
NP 620583.1 48 Homo sapiens
11 Gene 6p25.3-p21.1 TNF NM 000594.3 49 Homo sapiens
NP 000585.2 50 Homo sapiens
12 microRNA 6p25.3-p21.1 miR-877* NR 030615.1 51 Homo sapiens
13 Gene 6p25.3-p21.1 ABCF1 NM 001025091.1 52 Homo sapiens
NP 001020262.1 53 Homo sapiens
Number and Element Chromosome Name GenBank Accession SEQ ID NO: Organism
Type Segment Numbers
NM 001090.2 54 Homo sapiens
NP 001081.1 55 Homo sapiens
14 Gene 12pl3.33-pl3.31 RAD51AP1 NM 001130862.1 56 Homo sapiens
NP 001124334.1 57 Homo sapiens
NM 006479.4 58 Homo sapiens
NP 006470.1 59 Homo sapiens
15 microRNA 12pl3.33-pl3.31 miR-200c, miR- NR 029779.1 60 Homo sapiens
16 microRNA 12pl3.33-pl3.31 miR-141,miR- NR 029682.1 61 Homo sapiens
17 Gene 12pl3.2-pl2.3 CD N1B NM 004064.4 62 Homo sapiens
NP 004055.1 63 Homo sapiens
18 Gene 7pl4.1-pll.2 POLD2 NM 001127218.2 64 Homo sapiens
NP 001120690.1 65 Homo sapiens
NM 001256879.1 66 Homo sapiens
NP 001243808.1 67 Homo sapiens
NM 006230.3 68 Homo sapiens
NP 006221.2 69 Homo sapiens
19 Gene Xq27.3-q28 BCAP31 NM 001139441.1 70 Homo sapiens
NP 001132913.1 71 Homo sapiens
NM 001139457.2 72 Homo sapiens
NP 001132929.1 73 Homo sapiens
NM 001256447.1 74 Homo sapiens
NP 001243376.1 75 Homo sapiens
NM 005745.7 76 Homo sapiens
NP 005736.3 77 Homo sapiens
20 microRNA Xq27.3-q28 miR-888 NR 030592.1 78 Homo sapiens
21 microRNA Xq27.3-q28 miR-224 NR 029638.1 79 Homo sapiens
22 microRNA Xq27.3-q28 miR-452 NR 029973.1 80 Homo sapiens
23 Gene Xq27.3-q28 GABRE NM 004961.3 81 Homo sapiens
NP 004952.2 82 Homo sapiens
24 Gene BAP1 NM 004656.3 83 Homo sapiens
NP 004647.1 84 Homo sapiens
25 Gene BRCA1 NM 007294.3 85 Homo sapiens
NP 009225.1 86 Homo sapiens
NM 007297.3 87 Homo sapiens
NP 009228.2 88 Homo sapiens
NM 007298.3 89 Homo sapiens
NP 009229.2 90 Homo sapiens
NM 007299.3 91 Homo sapiens
NP 009230.2 92 Homo sapiens
NM 007300.3 93 Homo sapiens
NP 009231.2 94 Homo sapiens
NR 027676.1 95 Homo sapiens
26 Gene LIG4 NM 001098268.1 96 Homo sapiens
NP 001091738.1 97 Homo sapiens
NM 002312.3 98 Homo sapiens
NP 002303.2 99 Homo sapiens
NM 206937.1 100 Homo sapiens
NP 996820.1 101 Homo sapiens
Tensor GSVD of patient- and platform-matched tumor and normal DNA copy-number profiles uncovers chromosome arm-wide patterns of tumor-exclusive platform-consistent alterations encoding for cell transformation and predicting ovarian cancer survival
Preethi Sankaranarayanan1'2*, Theodore E. Schomay1'2* , Katherine A. Aiello1'2, and Orly Alter1'2'3*
1 Scientific Computing and Imaging (SCI) Institute, University of Utah, Salt Lake City, Utah, United States of America
2 Department of Bioengineering, University of Utah, Salt Lake City, Utah, United States of America, and
3 Department of Human Genetics, University of Utah, Salt Lake City, Utah, United States of America
* E-mail: orly@sci.utah.edu
These authors contributed equally to this work.
Abstract
The number of large-scale high-dimensional datasets recording different aspects of a single disease is growing, accompanied by a need for frameworks that can create one coherent model from multiple tensors of matched columns, e.g., patients and platforms, but independent rows, e.g., probes. We define and prove the mathematical properties of a novel tensor generalized singular value decomposition (GSVD), which can simultaneously find the similarities and dissimilarities, i.e., patterns of varying relative significance, between any two such tensors. We demonstrate the tensor GSVD in comparative modeling of patient- and platform-matched but probe-independent ovarian serous cystadenocarcinoma (OV) tumor, mostly high-grade, and normal DNA copy-number profiles, across each chromosome arm, and combination of two arms, separately. The modeling uncovers previously unrecognized patterns of tumor-exclusive platform- consistent co-occurring copy-number alterations (CNAs). We find, first, and validate that each of the patterns across only 7p and Xq, and the combination of 6p+12p, is correlated with a patient's prognosis, is independent of the tumor's stage, the best predictor of OV survival to date, and together with stage makes a better predictor than stage alone. Second, these patterns include most known OV-associated CNAs that map to these chromosome arms, as well as several previously unreported, yet frequent focal CNAs. Third, differential mRNA, microRNA, and protein expression consistently map to the DNA CNAs. A coherent picture emerges for each pattern, suggesting roles for the CNAs in OV pathogenesis and personalized therapy. In 6p+12p, deletion of the p21-encoding CDKNlA and p38-encoding MAPK14 and amplification of RAD51AP1 and KRAS encode for human cell transformation, and are correlated with a cell's immortality, and a patient's shorter survival time. In 7p, RPA3 deletion and P0LD2 amplification are correlated with DNA stability, and a longer survival. In Xq, PABPC5 deletion and BCAP31 amplification are correlated with a cellular immune response, and a longer survival.
Introduction
The growing number of large-scale high-dimensional datasets recording different aspects of a single disease promise to enhance basic understanding of life on the molecular level as well as medical diagnosis, prognosis, and treatment. This is accompanied by a fundamental need for mathematical frameworks that can create one coherent model from multiple datasets arranged in multiple order-matched, column-matched, and row- independent tensors, i.e., tensors of the same number of dimensions each, with one-to-one mappings among the columns across all but one the of corresponding dimensions among the tensors, but
not necessarily among the rows across the one remaining dimension in each tensor. Consider, e.g., the structure of the DNA copy-number datasets in the Cancer Genome Atlas (TCGA) [1, 2] . Profiles of tumor and normal tissues from the same set of patients have the structure of two matrices, i.e., second-order tensors, with a one-to-one mapping between the columns that correspond to the same set of patients, but not necessarily between the rows that correspond to the DNA copy-number probes with valid data in either the tumor or the normal dataset, and may be different. When the tumor and normal profiles are measured in replicates, e.g., by the same set of profiling platforms, then the structure of the tumor and normal datasets is that of two third-order tensors, of matched columns that correspond to the same sets of patients and platforms, and independent rows that correspond to the probes in either the tumor or the normal dataset.
The higher-order generalized singular value decomposition (HO GSVD) is the only simultaneous decomposition to date of more than two such column-matched but row-independent datasets, which is by definition exact, and which mathematical properties allow interpreting its variables and operations in terms of the similar as well as dissimilar, e.g., biomedical reality among the datasets [3, 4] . The HO GSVD generalizes the GSVD [5-12] , which was demonstrated in comparative modeling of, e.g., patient- matched but probe-independent glioblastoma (GBM) brain tumor and normal DNA copy-number profiles from TCGA [13] . The modeling uncovered a previously unrecognized genome- wide pattern of tumor- exclusive copy- number alterations (CNAs). Prior to the modeling, DNA copy- number subtypes of GBM predictive of survival and response to chemotherapy were not conclusively identified [14, 15] , and the best predictor of GBM survival was the patient's age at diagnosis [16, 17] . Survival analyses [18, 19] showed and validated that the pattern is correlated with a GBM patient's prognosis and response to chemotherapy, is independent of age, and together with age makes a better predictor than age alone. Segmentation [20, 21] of the pattern showed that it includes most known GBM-associated changes in chromosome numbers and focal CNAs, as well as several previously unreported, yet frequent CNAs. This suggested that the pattern is not only correlated, but also possibly causally coordinated with the GBM tumor's pathogenesis. Previously unrecognized targets for personalized GBM drug therapy were also suggested, the tousled-like kinase 2 TLK2 and the methyltransferase-like 2A METTL2A [22-24] . The GSVD comparative modeling, therefore, resulted in new insights into the poorly understood relations between a GBM tumor's genome and a patient's survival phenotype.
The GSVD and HO GSVD, however, are limited to datasets arranged in second-order tensors, i.e., matrices. We define, therefore, a novel tensor GSVD, i.e., an exact simultaneous decomposition of two datasets, arranged in two higher-than-second-order tensors of matched column dimensions but independent row dimensions. The tensor GSVD factors or separates the pair of tensors into corresponding pairs of "subtensors," i.e., pairs of outer products or combinations of a paired set of patterns each: patterns, one across each of the matched column dimensions, which are identical for both tensors, combined with one pattern across the independent row dimension of either one of the two tensors. The pairs of subtensors are of varying relative mathematical significance, i.e., the significance of one subtensor in a pair in the corresponding tensor relative to the significance of the second subtensor in the second tensor varies among the pairs of subtensors. We prove that the tensor GSVD extends the GSVD and the tensor higher-order singular value decomposition (HOSVD) [25-28] from a decomposition of either two column- matched matrices or one tensor, respectively, to a decomposition of two order- matched, column-matched, and row-independent tensors [29] . We also show that the mathematical properties of the tensor GSVD allow interpreting the subtensors in terms of the biomedical similarities and dissimilarities between the two corresponding high-dimensional datasets.
We demonstrate the tensor GSVD in comparative modeling of patient- and platform-matched but probe-independent ovarian serous cystadenocarcinoma (OV) tumor and normal DNA copy-number profiles from TCGA. Most of the tumors, i.e., >95%, are high-grade tumors [30] . OV accounts for about 90% of all ovarian cancers. Despite recent large-scale profiling efforts, the best predictor of OV survival to date has remained the tumor's stage at diagnosis, a pathological assessment of the spread of the cancer number-
ing I to IV [31] . About 25% of primary OV tumors are resistant, and most recurrent OV tumors develop resistance to platinum-based chemotherapy, the first-line treatment for more than 30 years now [32] . Even though there exist drugs for platinum-based chemotherapy-resistant OV tumors, no pathology laboratory diagnostic exists that distinguishes between resistant and sensitive tumors before the treatment [33] . OV tumors exhibit significant CNA variation among them, much more so than, e.g., GBM tumors, and very few frequent CNAs typical of OV have been identified so far. We, therefore, model the profiles across each chromosome arm, and each combination of two chromosome arms, separately. The modeling uncovers previously unrecognized chromosome arm-wide patterns of tumor-exclusive and platform-consistent co-occurring CNAs.
By using survival analyses of the discovery and, separately, validation set of patients, as well as only the platinum-based chemotherapy patients in the discovery and validation sets, we find, first, and validate that each of the patterns across only the chromosome arms 7p and Xq, and across only the combination of the two chromosome arms 6p+12p (but not 6p nor 12p separately), is correlated with an OV patient's prognosis and response to platinum-based chemotherapy, is independent of stage, and together with stage makes a better predictor than stage alone. By using survival analyses of only the >95% patients with high-grade tumors, we find and validate that these patterns are also independent of the OV tumor's grade. We observe three groups of significantly different prognoses among the patients classified by a combination of the 6p+12p, 7p, and Xq tensor GSVD classifications, suggesting a possible implementation of the patterns in a pathology laboratory test. Second, by using segmentation of the 6p+12p, 7p, and Xq patterns, we find that the amplifications and deletions identified by these patterns include most known OV-associated CNAs that map to these chromosome arms [34] , as well as several previously unreported, yet frequent focal CNAs [35-38] . Third, by using gene ontology enrichment analyses of the OV tumor mRNA expression profiles of the patients [39, 40] , we find that differential mRNA expression between the patients, classified by any one of the three tensor GSVDs, is enriched in ontologies corresponding to one of three hallmarks of cancer [41] : a cell's immortality in 6p+12p, DNA instability in 7p, and cellular immune response suppression in Xq. The differential mRNA expression of genes from these enriched ontologies that are located on any one of the chromosome arms is consistent with the CNAs across that arm. Genes that map to amplifications or deletions on any one pattern, are overexpressed or underexpressed, respectively, in the patients which tumor profiles are classified as highly similar to that pattern. The differential expression of all microRNAs and proteins that map to any one of the chromosome arms is also consistent with the CNAs across that arm.
Taken together, a coherent picture emerges for each of these previously unrecognized chromosome arm-wide patterns of tumor-exclusive and platform-consistent co-occurring alterations, suggesting roles for the DNA CNAs in OV pathogenesis in addition to personalized diagnosis, prognosis, and treatment. In 6p+12p, loss of the p21-encoding CDKNlA and the p38-encoding MAPK14 on 6p, and gain of KRAS on 12p, combined but not separately, can lead to transformation of human normal to tumor cells [42, 43] . These transformation-encoding CNAs, together with deletion of TNF on 6p, and amplification of RAD51AP1 and ITPR2 on 12p, are correlated with a suppression of cell cycle arrest, senescence, and apoptosis, i.e., a tumor cell's immortality, and a patient's shorter survival time [44-55] . Note that there already exist drugs that interact with CDKNlA, MAPK14, and RAD51AP1, even though these genes were not recognized previously as targets for OV drug therapy [56] . In 7p, RPA3 deletion and POLD2 amplification are correlated with DNA repair during replication, i.e., DNA stability, and a longer survival time [57, 58] . In Xq, PABPC5 deletion and BCAP31 amplification are correlated with a cellular immune response, and a longer survival time [59] .
Mathematical Method: Tensor GSVD
Discovery Datasets are Pairs of Column-Matched but Row-Independent Tensors.
We selected primary OV tumor and normal DNA copy-number profiles of a set of 249 TCGA patients [2] (Sec. 1.1 in SI Appendix, and SI Dataset). Each profile was measured in two replicates by the same set of two DNA microarray platforms. For each chromosome arm or combination of two chromosome arms, the structure of these tumor and normal discovery datasets T>i and T>2 , of .ft^-tumor and _ftT2-normal probes x ^patients, i.e., arrays x -platforms, is that of two third-order tensors with one-to-one mappings between the column dimensions L and M, but different row dimensions K\ and K^, where K\ , K2 > LM.
The Tensor GSVD.
We define, therefore, a novel tensor GSVD that simultaneously separates the paired datasets into weighted sums of LM paired "subtensors," i.e., combinations or outer products of three patterns each: Either one tumor-specific pattern of copy-number variation across the tumor probes, i.e., a "tumor arraylet" u ^a, or the corresponding normal-specific pattern across the normal probes, i.e., the "normal arraylet" «2, a, combined with one pattern of copy-number variation across the patients, i.e., an "i-probelet" wjb and one pattern across the platforms, i.e., a "¾ -probelet" c, which are identical for both the tumor and normal datasets (Fig. 1, and Figs. A and B in SI Appendix),

LM L M
= Ki,abcSi(a, b, c),
a=l 6=1 c=l
Si(a, b, c) = uita <g> <g> v^c, i = l, 2, (1) where x aUi, x bVx and x cVy denote tensor-matrix multiplications, which contract the L -arraylet, L·x- probelet, and -¾ -probelet dimensions of the "core tensor" 7¾ with those of Ui, Vx, and Vy, respectively, and where ® denotes an outer product.
Construction. Suppose that unfolding (or matricizing) both tensors T>i into matrices, each preserving the Ki-row dimension, e.g., by appending the LM columns T>i^im of the corresponding tensor, gives two full column-rank matrices 7¾ € TR,Kt X LM. We obtain the column bases vectors Ui from the GSVD of Di [5-13] , i.e., the "row mode GSVD"
Z¼ = (. . . , Pi,:!m, . . .) = E/i∑iVT, i = l, 2. (2)
Suppose, similarly, that unfolding both tensors T>i into matrices, each preserving the L·x- (or M-y-) column dimension, e.g., by appending the ¾M rows 2?f¾..m (or the KiL rows 2?f¾ .;.) of the corresponding tensor, gives two full column-rank matrices DIX € ^KtM x L ^Qr J^ g -^KtL x M w/e obtain the x- (or y-) row basis vectors Vx (or Vy ), from the GSVD of Dix (or Diy), i.e., the x- (or y-) column mode GSVD,

Diy = (. . . , ¾ , . . .) = Uw wVy T, 2 = 1, 2. (3)
Note that the x- and ¾ -row bases vectors are, in general, non-orthogonal but normalized, and Vx and Vy are invertible. The column bases vectors are normalized and orthogonal, i.e., uncorrelated, such that uTUi = /.
Figure 1. Tensor generalized singular value decomposition (GSVD) of the patient- and platform-matched DNA copy-number profiles of the 6p+12p chromosome arm. For each chromosome arm or combination of two chromosome arms, the structure of the tumor and normal discovery datasets (T>i and 2¾) is that of two third-order tensors with one-to-one mappings between the column dimensions but different row dimensions. The patients, platforms, probes, and tissue types, each represent a degree of freedom. Unfolded into a single matrix, some of the degrees of freedom are lost and much of the information in the datasets might also be lost. We define a tensor GSVD that simultaneously separates the paired datasets into weighted sums of paired subtensors, i.e., combinations or outer products of three patterns each: Either one tumor-specific pattern of copy-number variation across the tumor probes, i.e., a tumor arraylet (a column basis vector of U\), or the corresponding normal-specific arraylet (a column basis vector of L¾), combined with one pattern of variation across the patients, i.e., an i-probelet (a row basis vector of VX T), and one pattern across the platforms, i.e., a j -probelet (a row basis vector of V^), which are identical for both the tumor and normal datasets (Eq. 1). The tensor GSVD is depicted in a raster display, with relative copy-number gain (red), no change (black), and loss (green), explicitly showing the first through the 5th, and the 245th through the 249th 6p+12p i-probelets, both 6p+12p ¾ -probelets, and the first through the 10th, and the 489th through the 498th 6p+12p tumor and normal arraylets. We prove that the significance of a subtensor in the tumor dataset relative to that of the corresponding subtensor in the normal dataset, i.e., the tensor GSVD angular distance, equals the row mode GSVD angular distance, i.e., the significance of the corresponding tumor arraylet in the tumor dataset relative to that of the normal arraylet in the normal dataset. The tensor GSVD angular distances for the 498 pairs of 6p+12p arraylets are depicted in a bar chart display, where the angular distance corresponding to the first pair of arraylets is ~π/4. For the 6p+12p combination of two chromosome arms, we find that the most significant subtensor in the tumor dataset (which corresponds to the coefficient of largest magnitude in IZi) is a combination of (i) the first j -probelet, which is approximately invariant across the platforms, (ii) the first i-probelet, which classifies the discovery set of patients into two groups of high and low coefficients, of significantly and robustly different prognoses, and (in) the first, most tumor-exclusive tumor arraylet, which classifies the validation set of patients into two groups of high and low correlations of significantly different prognoses consistent with the i-probelet's classification of the discovery set.
The generalized singular values are positive, and are arranged in ∑i 5 ∑ix , and ∑iy in decreasing orders of the corresponding "GSVD angular distances," i.e., decreasing orders of the ratios σι<α/σ2,α, cix,b/c'2x,b, and aiyt C/a2y,c, respectively. We then compute the core tensors 7¾ by contracting the row-, X-, and j -column dimensions of the tensors T>i with those of the matrices Ui, V~ x , and ^_ 1 , respectively. For real tensors, the "tensor generalized singular values" 7¾iat,c tabulated in the core tensors are real but not necessarily positive. Our tensor GSVD construction generalizes the GSVD to higher orders in analogy with the generalization of the singular value decomposition (SVD) by the HOSVD [25-28] , and is different from other approaches to the decomposition of two tensors [29] .
Existence, uniqueness and special cases. We prove that our tensor GSVD exists for two tensors of any order because it is constructed from the GSVDs of the tensors unfolded into full column-rank matrices (Lemma A in SI Appendix). The tensor GSVD has the same uniqueness properties as the GSVD, where the column bases vectors u^a and the row bases vectors wjb and wjc are unique, except in degenerate subspaces, defined by subsets of equal generalized singular values aix, and aiy, respectively, and up to phase factors of ±1, such that each vector captures both parallel and antiparallel patterns (Lemma B in SI Appendix). The tensor GSVD of two second-order tensors reduces to the GSVD of the corresponding matrices (Corollary A in SI Appendix). The tensor GSVD of the tensor Ό € ]R,LM x L x M ; which row
mode unfolding gives the identity matrix D\ = I ζ -^LM x LM ^ an(j a Censor p2 Gf the same column dimensions reduces to the HOSVD of 2¾ (Theorem A in SI Appendix).
Interpretation. The significance of the subtensor <¾(α, b, c) in the tensor T>i is defined proportional to the magnitude of the corresponding tensor generalized singular values
 (Fig. C in SI Appendix), in analogy with the HOSVD,
LM L M
a=l 6=1 c=l
The significance of S\ {a, b, c) in V relative to that of ¾(α, b, c) in 2¾ is defined by the "tensor GSVD angular distance" Oabc as a function of the ratio 7? iat,c/7¾,a&c- This is in analogy with, e.g., the row mode GSVD angular distance θα, which defines the significance of the column basis vector u ^a in the matrix D\ of Eq. (2) relative to that of «2,α m■¾ as a function of the ratio σχια/σ2ι(Ι,

θα = arctan(CTli0/CT2i0) - π
Because the ratios of the positive generalized singular values satisfy σχια/σ2ι(Ι the row mode GSVD angular distances satisfy θα€ [— π π The maximum (or minimum) angular distance, i.e., θα = π which corresponds to σχια/σ2ι(Ι >> 1 (or— vr which corresponds to σχια/σ2ι(Ι << 1), indicates that the row basis vector of Eq. (2), which corresponds to the column basis vectors u ^a in D\ and «2i(I in D'2, is exclusive to D\ (or !¾)· An angular distance of θα = 0, which corresponds to σχια/σ2ια = 1, indicates a row basis vector which is of equal significance in, i.e., common to both D and D'2-
Thus, while the ratio σχια/σ2ια indicates the significance of u ^a in D relative to the significance of «2i(I in I¾, this relative significance is defined, as previously described [12, 13], by the angular distance θα, a function of the ratio σχια/σ2ια, which is antisymmetric in D and !¾· Note also that while other functions of the ratio σχια/σ2ια exist that are and 7¾, the angular distance θα, which is a function of the arctangent of the ratio, i.
 is the natural function to use, because the GSVD is related to the cosine-sine (CS) decomposition, as previously described [9], and, thus, σχια and σ2,α are related to the sine and the cosine functions of the angle θα, respectively.
Theorem 1. The tensor GSVD angular distance equals the row mode GSVD angular distance, i.e., Oabc =
Proof. The unfolding of T>i of Eq. (1) into 7¾ of Eq. (2) unfolds the core tensors TZi of Eq. (1) into matrices i¾, which preserve the row dimensions, i.e., the L -column bases dimensions of TZi, and gives
Rt = Y,tVT{V-T ® V~T), * = 1, 2,
where ® denotes a Kronecker product. Because ∑j are positive diagonal matrices, it follows that Tli,abc/Tl2,abc = ¾α/¾α = σι,α/σ2,α· Substituting this in Eq. gives Oabc = θα . Note that the proof holds for tensors of higher-than-third order. □
From this it follows that the tensor GSVD angular distance |θα6ε | < vr and that, therefore, the ratio of not necessarily
 , respectively, and that Oabc = 0 indicates a subtensor common to both.
Note that since the generalized singular values are arranged in∑j of Eq. (2) in a decreasing order of the row mode GSVD angular distances θα, the most tumor-exclusive tumor subtensors, i.e., <Si (a, b, c)
where a maximizes θα of Eq. (5), correspond to a = 1, whereas the most normal-exclusive normal sub- tensors, i.e., S' {a, b, c) where a minimizes θα, correspond to a = LM.
Discovery and Validation of CNAs Predicting OV Survival.
We compute the tensor GSVD of the tumor and normal discovery datasets for each chromosome arm and each combination of two chromosome arms, separately (SI Mathematica Notebook). For each arm or arms we examine the most significant subtensor in the tumor dataset, i.e., <Si (a, b, c), where a, 6, and c maximize Vi,abc of Eq. (4).
We, first, require the subtensor to be tumor-exclusive and platform-consistent: include the tumor arraylet u ^a that is the most exclusive to the tumor dataset, i.e., «ι,ι , as well as a ¾ -probelet Vy C of consistent, i.e., approximately equal copy numbers in both platforms. Second, we require the subtensor to be correlated with an OV patient's prognosis in the discovery set of patients, i.e., include an i-probelet wjb that classifies the discovery set of patients into two groups of high (>0.5 standardized median absolute deviation, i.e., sMAD, from the median) and low coefficients, of significantly (log-rank test P- value <0.05) and robustly (throughout the range of ±0.1 sMAD around the cutoff) different prognoses (Fig. 2). Third, we require the subtensor to be correlated with prognosis in the validation set of patients, i.e., include an arraylet that classifies the validation set of patients into two groups of high and low Spearman's rank correlation coefficients of significantly different prognoses, consistent with the i-probelet's classification of the discovery set of patients (Fig. 3, and Sec. 1.3 in SI Appendix). Note that the validation set includes 148 TCGA patients, mutually exclusive of the discovery set, with primary OV tumor profiles measured by at least one of the two DNA microarray platforms that were used to measure the discovery datasets (S2 Dataset).
We find that each of the tensor GSVDs of only the chromosome arms 7p and Xq, and only the combination of the two chromosome arms 6p+12p (but not 6p nor 12p separately), uncovers a pattern of tumor-exclusive and platform-consistent co-occurring CNAs that is correlated with an OV patient's prognosis in the discovery and, separately, validation set of patients.
Biological Results
Independent Chromosome Arm-Wide Predictors of OV Survival and Response to Platinum-Based Chemotherapy.
To date, the best predictor of OV survival has remained the tumor's stage at diagnosis [31] (Sec. 2.1, and Figs. D and E in SI Appendix). Additional indicators, such as the residual disease after surgery, the outcome of subsequent therapy, and the neoplasm status, which is the last known status of the disease, are determined during treatment. No diagnostic exists that distinguishes between platinum- based chemotherapy-resistant and -sensitive tumors before the treatment [32, 33] .
We find and validate, by using survival analyses of the discovery and, separately, validation set of patients, as well as only the 88% and 95% platinum-based chemotherapy patients in the discovery and validation sets, respectively (Fig. F in SI Appendix), that each of the patterns, across 6p+12, 7p, and Xq, is correlated with an OV patient's prognosis and response to platinum-based chemotherapy, is independent of stage, and together with stage makes a better predictor than stage alone.
We also find and validate that each of these three tensor GSVDs is independent of each of the additional standard indicators (Tables A and B in SI Appendix). For example, survival analyses of the discovery set classified by the 6p+12p tensor GSVD into high and low i-probelet coefficients, and by pathology at diagnosis into tumor stages I-II and III-IV, give the bivariate Cox hazard ratios of 1.5 and 4.0, which are similar to the corresponding univariate ratios of 1.7 and 4.4, respectively [18] . Similarly,
Figure 2. Tumor-exclusive and platform-consistent DNA copy-number alterations (CNAs) correlated with ovarian serous cystadenocarcinoma (OV) patients' survival, (a) Plot of the first 6p+12p tumor arraylet describes a pattern of tumor-exclusive and platform-consistent co-occurring CNAs across the combination of the two chromosome arms 6p+12p. The probes are ordered, and their copy numbers are colored according to each probe's chromosomal band location. Segments (black lines) amplified and deleted include most known OV-associated CNAs that map to 6p+12p (black), including an amplification of KRAS and a deletion of PRIM2. CNAs previously unrecognized in OV (red) include a deletion of the p38-encoding MAPK14, and p21-encoding CDKNlA, and an amplification of RAD51AP1, a deletion of TNF, and focal amplifications of ASUN, ITPR2, and the 5' ends of isoforms a and e, and exons 5 and 6 of SOX5. A high 6p+12p arraylet correlation is significantly correlated with a patient's shorter survival time. ( 6) Plot of the first 6p+12p i-probelet describes the classification of the discovery set of patients into two groups of high (blue) and low (red) coefficients. A high 6p+12p ίΕ-probelet coefficient is significantly and robustly correlated with a patient's shorter survival time, (c) Raster display of the 6p+12p tumor profiles, where medians of the profiles of the same patient measured by the two platforms were taken, with relative gain (red), no change (black), and loss (green) of DNA copy numbers, (d) Plot of the first 7p tumor arraylet describes a pattern of CNAs across the chromosome arm 7p. CNAs previously unrecognized in OV (red) include a focal deletion of RPA3 and an amplification of POLD2. A high 7p arraylet correlation is significantly correlated with a patient's longer survival time. ( e) Plot of the first 7p i-probelet describes the classification of the discovery set of patients into two groups of high (red) and low (blue) coefficients. A high 7p i-probelet coefficient is significantly and robustly correlated with a patient's longer survival time. (/) Raster display of the 7p tumor profiles, (g) Plot of the first Xq tumor arraylet. CNAs previously unrecognized in OV (red) include a focal deletion of PABPC5 and an amplification of BCAP31. A high Xq arraylet correlation is significantly correlated with a patient's longer survival time, (h) Plot of the first Xq i-probelet describes the classification of the discovery set of patients into two groups of high (red) and low (blue) coefficients. A high Xq i-probelet coefficient is significantly and robustly correlated with a patient's longer survival time, ( i ) Raster display of the Xq tumor profiles. survival analyses of the validation set classified by the 6p+12p tensor GSVD into high and low arraylet correlation coefficients, and by pathology at diagnosis into tumor stages III and IV, give the bivariate Cox hazard ratios of 1.9 and 1.8, which are the same as the corresponding univariate ratios (Fig. G in SI Appendix). This means that the 6p+12p tensor GSVD and stage are independent predictors of survival. Therefore, combined with any one of the standard indicators, each of the three tensor GSVDs makes a better predictor than the standard indicator alone (Figs. H and I in SI Appendix). For example, the Kaplan-Meier (KM) median survival time difference of 61 months among the discovery set of patients classified by both the 6p+12p tensor GSVD and stage, is about 85% and more than two years greater than the 33 month difference between the patients classified by stage alone [19] . The KM median survival difference of 34 months among the validation set of patients classified by both the 6p+12p tensor GSVD and stage, is about 62% and more than one year greater than the 21 month difference between the patients classified by stage alone.
Note that while the discovery set of patients reflects the general OV patient population, with approximately 5%, 7%, 76%, and 12% of the patients diagnosed at stages I, II, III, and IV, respectively, the validation set reflects the high-stage OV patient population, with approximately 20% and 80% of the patients diagnosed at stages III and IV, respectively. The 6p+12p, 7p, and Xq tensor GSVDs, therefore, predict survival both in the general as well as in the high-stage OV patient population. Note also that the discovery and validation sets each include mostly, i.e., >95% high-grade, i.e., grades 2 and higher tumors. Tumor grade does not correlate with survival in either the discovery or the validation set of patients.
Figure 3. Survival analyses of the discovery and validation sets of patients classified by tensor GSVD, or tensor GSVD and tumor stage at diagnosis, (a) Kaplan-Meier (KM) curves of the discovery set of 249 patients classified by the 6p+ 12p -probelet coefficient, show a median survival time difference of 11 months, with the corresponding log-rank test P-value < 10- 2. The univariate Cox proportional hazard ratio is 1.7. ( 6) Survival analyses of the 249 patients classified by the 7p -probelet coefficient, ( c) The 249 patients classified by the Xq -probelet coefficient, (d) The 249 patients classified by both the 6p+12p tensor GSVD and tumor stage at diagnosis, show the bivariate Cox hazard ratios of 1.5 and 4.0, which do not differ significantly from the corresponding univariate hazard ratios of 1.7 and 4.4, respectively. This means that the 6p+12p tensor GSVD is independent of stage, the best predictor of OV survival to date. The 61 months KM median survival time difference is about 85% and more than two years greater than the 33 month difference between the patients classified by stage alone. This means that the tensor GSVD and stage combined make a better predictor than stage alone, The 249 patients classified by both the 7p tensor GSVD and stage. (/) The 249 patients classified by both the Xq tensor GSVD and stage, (g) KM curves of the validation set of 148 stage III-IV patients classified by the 6p+12p arraylet correlation, show a median survival time difference of 22 months, with the corresponding log-rank test P-value < 10- 2 , and the univariate Cox proportional hazard ratio 1.9. This validates the survival analyses of the discovery set of 249 patients, (h) Survival analyses of the 148 patients classified by the 7p arraylet correlation, The 148 patients classified by the Xq arraylet correlation.
Survival analyses of only the >95% patients with high-grade tumors in the discovery and, separately, validation set give qualitatively the same and quantitatively similar results to those of the analyses of 100% of the patients in each set, respectively. The 6p+ 12p, 7p, and Xq tensor GSVDs, therefore, predict survival in the high-grade OV patient population, and are independent of the OV tumor's grade as well as the molecular distinctions between high- and low-grade OV tumors [30] .
We observe three groups of significantly different prognoses among the discovery and, separately, validation set of patients, as well as only the platinum-based chemotherapy patients, classified by a combination of the three, i.e., 6p+ 12p, 7p, and Xq, tensor GSVD classifications, each of which is binomial (Fig. 4) . In group A, a combination of a low 6p+ 12p -probelet coefficient or arraylet correlation, and high 7p and Xq -probelet coefficients or arraylet correlations is indicative of a patient's significantly longer survival time and better response to platinum-based chemotherapy. In group B, the three combinations where just one of the three binomial classifications differs from that of group A, indicate shorter survival time and worse response to chemotherapy than those of group A. In group C, the four combinations where at least two of the three binomial classifications differ from that of group A, indicate shorter survival time and worse response to chemotherapy than those of group B as well as group A. For example, the KM median survival times of the discovery set of patients classified into groups A, B, and C are 86, 52, and 36 months, such that the median survival time of group A is more than four years greater than, and more than twice that of group C.
This suggests a possible implementation of the 6p+12p, 7p, and Xq patterns in a pathology laboratory test, where a patient's survival and response to platinum-based chemotherapy is predicted based upon the combination of the correlations of the OV tumor's DNA copy-number profile with the 6p+ 12p, 7p, and Xq patterns.
Figure 4. Survival analyses of the discovery and validation sets of patients, as well as only the platinum-based chemotherapy patients in the discovery and validation sets, classified by the 6p+12p, 7p, and Xq tensor GSVD combined, (a) KM curves of the discovery set of 249 patients classified by combination of the 6p+12p, 7p, and Xq i-probelet coefficients, show median survival times of 86, 52, and 36 months for the groups A, B, and C, respectively, with the corresponding log-rank test P-value < 10-3. (6) KM survival analysis of only the 218, i.e., ~88% platinum-based chemotherapy patients in the discovery set, classified by combination of the three tensor GSVDs, gives qualitatively the same and quantitatively similar results to those of the analyses of 100% of the patients. This means that the combination of the three tensor GSVDs predicts survival in the platinum-based chemotherapy patient population, (c) KM curves of the validation set of 148 stage III-IV patients classified by combination of the 6p+12p, 7p, and Xq arraylet correlation coefficients, show median survival times of 72, 57, and 33 months for the groups A, B, and C, respectively, with the corresponding log-rank test P-value < 10-3. This validates the survival analyses of the discovery set of 249 patients, (d) KM survival analysis of only the 140, i.e., ~95% platinum-based chemotherapy patients in the validation set, classified by combination of the three tensor GSVDs.
Novel Frequent Focal CNAs Indicating Survival.
OV tumors exhibit significant CNA variation among them, much more so than, e.g., GBM brain tumors [2, 13] . Very few frequently occurring OV CNAs have been identified to date.
We find, by using segmentation [20, 21] , that the three tensor GSVD arraylets include most known OV-associated CNAs that map to the corresponding chromosome arms, and several previously unreported yet frequent CNAs in >23% of the patients. For example, the 6p+12p arraylet includes two segments corresponding to the only known OV focal CNAs that map to 6p+12p, 7p, or Xq (Sec. 2.2 in SI Appendix). One, a deletion (6pll.2), overlaps the 3' end unique to isoform a of the DNA primase polypeptide 2- encoding PRIM2 [2] . The other, an amplification (12pl2.l-pll.23), contains several genes, including the Kirsten rat sarcoma viral oncogene homolog KRAS, one of three human Ras genes, and the 5' ends of isoforms b and d of the SRY (sex determining region Y)-box 5-encoding SOX5 [34] , and is significantly (log-rank test P-value <0.05, and KM median survival time difference > 12 months) correlated with OV survival (S3 Dataset).
We also find that the three arraylet patterns include novel frequent focal CNAs (segments <125 probes). Among these, four amplifications and two deletions are significantly correlated with OV survival (Fig. J in SI Appendix). The amplifications flank the segment that contains KRAS. Two consecutive segments (12pl2.1) contain the 5' ends of isoforms a and e of SOX5, and exons 5 and 6, the first exons that are common to isoforms a, b, d, and e of SOX5 [35] . Two other consecutive segments (12pll.23) contain the inositol 1,4,5-trisphosphate receptor type 2-encoding ITPR2, and the asunder spermatogenesis regulator-encoding ASUN. ASUN was discovered in a screen of expressed sequence tags on 12pl l-pl2, which DNA amplification correlated with mRNA overexpression in four human testicular seminomas and one ovarian papillary serous adenocarcinoma cell line, exemplifying human germ cell tumors [36] . ASUN and its homologs are essential for nuclear division after DNA replication in the HeLa human cervical cancer cell line, the frog, and the fly [37] . One deletion (7p22.1-p21.3) contains the replication protein A3-encoding RPA3. The other (Xq21.31) contains the cytoplasmic poly(A)-binding protein 5-encoding PABPC5, and the sequence tag site DXS241 adjacent to translocation breakpoints observed in premature ovarian failure [38] .
Possible Roles in OV Pathogenesis.
We find, by using gene ontology enrichment analyses of the OV tumor mRNA expression profiles of the patients [39, 40] , that differential mRNA expression between the patients, classified by any one of the three tensor GSVDs, is enriched in ontologies corresponding to one of three hallmarks of cancer [41] : cell immortality in 6p+12p, DNA instability in 7p, and cellular immune response suppression in Xq.
The differential mRNA expression of genes from these enriched ontologies that are located on any one of the chromosome arms is consistent with the CNAs across that arm (Fig. K in SI Appendix, and S4 Dataset). Genes that map to amplifications or deletions on any one arraylet pattern, are overexpressed or underexpressed, respectively, in the patients which tumor profiles are classified, by the corresponding tensor GSVD, as highly similar to that pattern, i.e., patients of high i-probelet coefficients or arraylet correlations. The differential expression of all microRNAs and proteins that map to any one of the chromosome arms is also consistent with the CNAs across that arm (Sec. 2.3, and Figs. L and M in SI Appendix, and S5 and S6 Datasets). A coherent picture emerges for each pattern, suggesting roles for the CNAs in OV pathogenesis in addition to personalized diagnosis, prognosis, and treatment.
6p+12p. A cell's transformation and immortality are correlated with a patient's shorter survival. The genes, which are significantly (Mann- Whitney- Wilcoxon P-values <0.05) differentially expressed between the 6p+12p tensor GSVD classes, i.e., in the patient group of high 6p+12p x- probelet coefficient or arraylet correlation, relative to the patient group of low coefficient or correlation, are enriched (hypergeometric P-values <10-3) in the ontologies of cellular response to ionizing radiation (GO:0071479), and major histocompatibility (MHC) protein complex (GO:0042611). Most of the GO:0071479 genes are underexpressed, including the p21 cyclin-dependent kinase inhibitor-encoding CDKNlA, and the p38 mitogen- activated protein kinase-encoding MAPK14, which map to a deletion >45 Mbp on the telomeric part of 6p (6p25.3-p21.1). Also underexpressed is p38, the protein encoded by MAPK14- All GO:0042611 genes, including the tumor necrosis factor-encoding TNF, are underexpressed, and map to the same deletion. The one microRNA that is significantly differentially expressed between the 6p+12p tensor GSVD classes, and maps to the same deletion, is the splicing-dependent microRNA miR-877*, which is encoded by the 13th intron of the ATP- binding cassette subfamily F member 1-encoding gene ABCF1 [44] . Both miR-877* and ABCF1 are consistently underexpressed.
One of only two GO:0071479 overexpressed genes is the RAD51 -associated protein 1-encoding RAD51AP1, which maps to an amplification >9 Mbp on the telomeric part of 12p (12pl3.33-pl3.31) that is significantly correlated with OV survival. All four microRNAs that are differentially expressed between the 6p+12p tensor GSVD classes, and map to the same amplification, miR-200c, miR-200c*, miR-141, and miR-141*, are consistently overexpressed. The second protein that is significantly differentially expressed between the 6p+12p tensor GSVD classes is p27. Consistently, the cyclin-dependent kinase inhibitor CDKN1B, which encodes p27, maps to a 4.5 Mbp amplification (12pl3.2-pl2.3) that is significantly correlated with OV survival, and its mRNA is overexpressed. The mRNA encoded by KRAS is also overexpressed.
Note that while the 6p+12p pattern of CNAs is correlated with survival in the discovery and, separately, validation sets, neither the 6p nor the 12p pattern alone are correlated with survival. Indeed, experiments studying the conditions for the transformation of human normal to tumor cells indicate that cells, where both p21 and p38 are inactive, are susceptible to Ras-mediated transformation [42, 43] . However, the activation of Ras alone induces tumor-suppressing cellular senescence via the activities of either p21 or p38. The 6p+12p pattern, therefore, which includes the loss of the p21-encoding CDKNlA and the p38-encoding MAPK14 on 6p, and the gain of KRAS on 12p, encodes for cellular conditions that combined but not separately can lead to transformation.
In addition, p21 and p38 are necessary for p53- mediated cell cycle arrest [45] and apoptosis [46] , respectively, in response to DNA damage. Overexpression of the p21-encoding CDKNlA is correlated with a low malignant potential of an ovarian tumor [47] . RAD51AP1 overexpression disrupts cell cycle
arrest and apoptosis, can lead to cellular resistance to DNA-damaging cancer therapies, such as platinum- based chemotherapy, and may increase DNA instability [48] . TNF- induced apoptosis is correlated with downregulation of ITPR2 [49] . Overexpression of miR-200c, and miR-141, both of which putatively target the BRCAl associated protein-1 oncosuppressor-encoding BAP1, is correlated with OV tumor growth, dedifferentiation, and invasiveness [50, 51] . Overexpression of the CDKNIB-encoded p27, which can promote cellular migration [52] and even proliferation [53] , is correlated with a poor OV patient's prognosis [54, 55] .
Taken together, previously unrecognized co-occurring deletion of CDKNlA and MAPK14 on 6p and amplification of KRAS on 12p, which encode for human cell transformation, together with deletion of TNF on 6p, and amplification of RAD51AP1 and ITPR2 on 12p, are correlated with a suppression of cell cycle arrest, senescence, and apoptosis, i.e., a tumor cell's immortality, and a patient's shorter survival time. Note that there already exist drugs that interact with CDKNlA, MAPK14, and RAD51AP1, even though these genes were not recognized previously as targets for OV drug therapy [56] .
7p. A cell's DNA stability is correlated with a longer survival. The genes that are significantly differentially expressed between the 7p tensor GSVD classes are enriched (hypergeometric P- value <10-10) in the ontology of DNA strand elongation involved in DNA replication (GO:0006271). Most of these genes are overexpressed, including the DNA polymerase delta subunit 2-encoding POLD2 that is essential for DNA replication and repair, which maps to an amplification >17 Mbp on the centromeric part of 7p (7pl4.1-pll.2). Only two genes are underexpressed: RPA3 on 7p and the DNA ligase IV- encoding LIG4 on 13q. The interaction of p53 with the RPAS-encoded protein mediates suppression of homologous recombination (HR), the preferred cellular mechanism for DNA double-strand break (DSB) repair during replication [57] . LIG4 is essential for DSB repair via the more error-prone nonhomologous end joining pathway [58] . HR defects are thought to facilitate the significant CNA heterogeneity among OV tumors [2] .
Taken together, previously unrecognized co-occurring deletion and underexpression of RPA3, and amplification and overexpression of POLD2 on 7p are correlated with DNA DSB repair via HR during replication, i.e., DNA stability, and a longer survival time.
Xq. Cellular immune response is correlated with a longer survival. The genes that are differentially expressed between the Xq tensor GSVD classes are enriched (hypergeometric P-value <10-6) in the ontology of antigen processing and presentation of peptide antigen (GO:0048002). Most of these genes are overexpressed, including the B-cell receptor-associated protein 31-encoding BCAP31, which maps to an amplification >11 Mbp on the telomeric part of Xq (Xq27.3-q28). All three microRNAs that are differentially expressed between the Xq tensor GSVD classes, and map to the same amplification, miR-888, miR-224, and miR-452, together with the gamma-aminobutyric acid (GABA) A receptor epsilon-encoding GABRE, which hosts mir-224 and mir-452 in its introns, are consistently overexpressed. Underexpression of miR-224 was implicated in OV pathogenesis [50] . PABPC5, which maps to a focal deletion on Xq, is suppressed upon viral infection [59] .
Taken together, previously unrecognized co-occurring deletion of PABPC5, and amplification and overexpression of BCAP31 on Xq are correlated with a cellular immune response, and a longer survival time.
Discussion
We defined a novel tensor GSVD, an exact simultaneous decomposition of two datasets, arranged in two higher-than-second-order tensors of matched column dimensions but independent row dimensions. We showed that the mathematical properties of the tensor GSVD allow interpreting its variables and operations in terms of the similar as well as dissimilar, e.g., biomedical reality between the datasets. We
demonstrated the tensor GSVD in comparative modeling of patient- and platform-matched but probe- independent OV tumor and normal DNA copy-number profiles from TCGA. The modeling resulted in new insights into the poorly understood relations between an OV tumor's genome and a patient's survival phenotype. Three previously unrecognized chromosome arm-wide patterns of tumor-exclusive and platform-consistent co-occurring alterations were uncovered, across 6p+12p, 7p, and Xq, that are correlated with an OV patient's survival and response to platinum-based chemotherapy, and are of possible roles in OV pathogenesis, and of a possible implementation in a pathology laboratory test for personalized OV diagnosis, prognosis, and treatment.
Note that unlike previous analyses of the TCGA OV DNA copy- number data, notably by TCGA [2] , our analyses were not limited to the 22 human autosomal chromosomes, and include the X chromosome. This is because the tensor GSVD, like the GSVD, comparatively - based upon the structure of the data - separates the matched datasets into uncorrelated, i.e., orthogonal patterns across the tumor and normal probes. Patterns of copy-number variation across the tumor probes that occur in the normal human genome, and are common to the tumor and normal datasets, such as the female-specific X chromosome amplification, are orthogonal to, and, therefore, are separated from the patterns that are exclusive to the tumor dataset. For example, the GSVD comparative modeling of patient-matched GBM tumor and normal copy-number profiles separated the prognosis-correlated GBM tumor-exclusive pattern from the female-specific X chromosome amplification as well as from experimental artifacts (or batch effects) due to experimental variations in, e.g., tissue batch, genomic center, hybridization date, and scanner, without a-priori knowledge of these variations.
Unlike recent approaches to the integrative modeling of different types of large-scale molecular biological profiles from the same set of patients, notably clustering [60, 61] , our comparative modeling was not limited to tumor profiles, and included also patient- and platform-matched normal DNA copy-number profiles. This is because the tensor GSVD, like the GSVD, finds not just the similarities but, at the same time also the dissimilarities among the profiles without making any assumptions, except for the structure of the data: two third-order tensors, of matched columns that correspond to the same sets of patients and platforms, and independent rows that correspond to the probes in either the tumor or the normal dataset. The patients, platforms, tumor and normal probes as well as the tissue types, each represent a degree of freedom. Unfolded into two matrices or appended into a single tensor (or even unfolded and appended into a single matrix), some of the degrees of freedom are lost and much of the information in the datasets might also be lost. For example, SVD of the GBM tumor and normal profiles appended into a single matrix, while it is related to the GSVD of the data, would not separate the tumor dataset into patterns across the tumor probes that are orthogonal.
Additional possible applications of the tensor GSVD in personalized medicine include comparative modeling of two patient- and tissue-matched datasets, each corresponding to (i) a set of large-scale molecular biological profiles, e.g., DNA copy numbers, acquired by a high-throughput technology, e.g., DNA microarrays; (ii) a set of biomedical images or signals; or (in) a set of cellular pathological observations, e.g., a tumor's stage. Such tensor GSVD comparative models can uncover variations across the patients and tissues that are common to, possibly causally coordinated between the two aspects of the disease. In clinical settings, such tensor GSVD comparative models can determine an individual patient's medical status in relation to all the other patients in a set, and inform the patient's diagnosis, prognosis and treatment.
Acknowledgements
We thank RA Horn for thoughtful discussions of matrix analysis in general, and the tensor GSVD in particular. We thank DDL Bowtell and MM Janat-Amsbury for useful notes on OV in general, and the molecular distinctions between high- and low-grade OV tumors in particular. We also thank RA Weinberg for helpful comments on the hallmarks of cancer in general, and the transformation of human
normal to tumor cells in particular.
References
1. Cancer Genome Atlas Research Network. Comprehensive genomic characterization defines human glioblastoma genes and core pathways. Nature. 2008;455: 1061-1068.
2. Cancer Genome Atlas Research Network. Integrated genomic analyses of ovarian carcinoma. Nature. 2011;474: 609-615.
3. Ponnapalli SP, Golub GH, Alter O. A novel higher-order generalized singular value decomposition for comparative analysis of multiple genome-scale datasets. Stanford University and Yahoo! Research Workshop on Algorithms for Modern Massive Datasets (MMDS) (Stanford, CA); 2006 June 21-24.
4. Ponnapalli SP, Saunders MA, Van Loan CF, Alter O. A higher-order generalized singular value decomposition for comparison of global mRNA expression from multiple organisms. PLoS One. 2011;6: e28072.
5. Golub GH, Van Loan CF. Matrix Computations. 4th ed. Baltimore, MD: Johns Hopkins University Press; 2012.
6. Horn RA, Johnson CR. Matrix Analysis. 2nd ed. Cambridge, UK: Cambridge University Press;
2012.
7. Van Loan CF. Generalizing the singular value decomposition. SIAM J Numer Anal. 1976;13:
76-83.
8. Paige CC, Saunders MA. Towards a generalized singular value decomposition. SIAM J Numer Anal. 1981;18: 398-405.
9. Van Loan CF. Computing the CS and the generalized singular value decompositions. Numer Math.
1985;46: 479-491.
10. Bai Z, Demmel JW. Computing the generalized singular value decomposition. SIAM J Sci Comput.
1993;14: 1464-1486.
11. Friedland S. A new approach to generalized singular value decomposition. SIAM J Matrix Anal Appl. 2005;27: 434-444.
12. Alter O, Brown PO, Botstein D. Generalized singular value decomposition for comparative analysis of genome-scale expression data sets of two different organisms. Proc Natl Acad Sci USA. 2003;100: 3351-3356.
13. Lee CH, Alpert BO, Sankaranarayanan P, Alter O. GSVD comparison of patient-matched normal and tumor aCGH profiles reveals global copy-number alterations predicting glioblastoma multiforme survival. PLoS One. 2012;7: e30098.
14. Wiltshire RN, Rasheed BK, Friedman HS, Friedman AH, Bigner SH. Comparative genetic patterns of glioblastoma multiforme: potential diagnostic tool for tumor classification. Neuro Oncol. 2000;2: 164-173.
15. Misra A, Pellarin M, Nigro J, Smirnov I, Moore D, Lamborn KR, et al. Array comparative genomic hybridization identifies genetic subgroups in grade 4 human astrocytoma. Clin Cancer Res. 2005;11: 2907-2918.
Curran WJ Jr, Scott CB, Horton J, Nelson JS, Weinstein AS, Fisclibacli AJ, et al. Recursive partitioning analysis of prognostic factors in three Radiation Therapy Oncology Group malignant glioma trials. J Natl Cancer Inst. 1993;85: 704-710.
Gorlia T, van den Bent MJ, Hegi ME, Mirimanoff RO, Weller M, Cairncross JG, et al. Nomograms for predicting survival of patients with newly diagnosed glioblastoma: prognostic factor analysis of EORTC and NCIC trial 26981-22981/CE.3. Lancet Oncol. 2008;9: 29-38.
Cox DR. Regression models and life-tables. J Roy Statist Soc B. 1972;34: 187-220.
Kaplan EL, Meier P. Nonparametric estimation from incomplete observations. J Amer Statist Assn. 1958;53: 457-481.
Kent WJ, Sugnet CW, Furey TS, Roskin KM, Pringle TH, Zahler AM, et al. The human genome browser at UCSC. Genome Res. 2002;12: 996-1006.
Olshen AB, Venkatraman ES, Lucito R, Wigler M. Circular binary segmentation for the analysis of array-based DNA copy number data. Biostatistics. 2004;5: 557-572.
Hopkins AL, Groom CR. The druggable genome. Nat Rev Drug Discov. 2002; 1: 727-730.
Sillje HH, Takahashi K, Tanaka K, Van Houwe G, Nigg EA. Mammalian homologues of the plant Tousled gene code for cell-cycle-regulated kinases with maximal activities linked to ongoing DNA replication. EMBO J. 1999;18: 5691-5702.
Pellegrini M, Cheng JC, Voutila J, Judelson D, Taylor J, Nelson SF, et al. Expression profile of CREB knockdown in myeloid leukemia cells. BMC Cancer. 2008;8: 264.
De Lathauwer L, De Moor B, Vandewalle J. A multilinear singular value decomposition. SIAM J Matrix Anal Appl. 2000;21: 1253-1278.
Omberg L, Golub GH, Alter O. A tensor higher-order singular value decomposition for integrative analysis of DNA microarray data from different studies. Proc Natl Acad Sci USA. 2007; 104: 18371-18376.
Omberg L, Meyerson JR, Kobayashi K, Drury LS, Diffley JFX, Alter O. Global effects of DNA replication and DNA replication origin activity on eukaryotic gene expression. Mol Syst Biol. 2009;5: 312.
Kolda TG, Bader BW. Tensor decompositions and applications. SIAM Rev. 2009;51: 455-500. Vandewalle J, De Lathauwer L, Comon P. The generalized higher order singular value decomposition and the oriented signal-to-signal ratios of pairs of signal tensors and their use in signal processing. In: Proc ECCTD'03 - European Conf on Circuit Theory and Design; 2003. pp. 1-389- 1-392.
Ayhan A, Kurman RJ, Yemelyanova A, Vang R, Logani S, Seidman JD, et al. Defining the cut point between low-grade and high-grade ovarian serous carcinomas: a clinicopathologic and molecular genetic analysis. Am J Surg Pathol. 2009;33: 1220-1224.
Prisco MG, Zannoni GF, De Stefano I, Vellone VG, Tortorella L, Fagotti A, et al. Prognostic role of metastasis tumor antigen 1 in patients with ovarian cancer: a clinical study. Hum Pathol. 2012;43: 282-288.
Harries M, Gore M. Chemotherapy for epithelial ovarian cancer— treatment at first diagnosis. Lancet Oncol. 2002;3: 529-536.
Pujade-Lauraine E, Hilpert F, Weber B, Reuss A, Poveda A, Kristensen G, et al. Bevacizumab combined with chemotherapy for platinum-resistant recurrent ovarian cancer: The AURELIA open- label randomized phase III trial. J Clin Oncol. 2014;32: 1302-1308.
Engler DA, Gupta S, Growdon WB, Drapkin RI, Nitta M, Sergent PA, et al. Genome wide DNA copy number analysis of serous type ovarian carcinomas identifies genetic markers predictive of clinical outcome. PLoS One. 2012;7: e30996.
Ikeda T, Zhang J, Chano T, Mabuchi A, Fukuda A, Kawaguchi H, et al. Identification and characterization of the human long form of Sox5 (L-SOX5) gene. Gene. 2002;298: 59-68.
Bourdon V, Naef F, Rao PH, Reuter V, Mok SC, Bosl GJ, et al. Genomic and expression analysis of the 12pll-pl2 amplicon using EST arrays identifies two novel amplified and overexpressed genes. Cancer Res. 2002;62: 6218-6223.
Lee LA, Lee E, Anderson MA, Vardy L, Tahinci E, Ali SM, et al. Drosophila genome-scale screen for PAN GU kinase substrates identifies Mat89Bb as a cell cycle regulator. Dev Cell. 2005;8: 435-442.
Blanco P, Sargent CA, Boucher CA, Howell G, Ross M, Affara NA. A novel poly(A)-binding protein gene (PABPC5) maps to an X-specific subinterval in the Xq21.3/Ypll.2 homology block of the human sex chromosomes. Genomics. 2001;74: 1-11.
Ashburner M, Ball CA, Blake JA, Botstein D, Butler H, Cherry JM, et al. Gene ontology: tool for the unification of biology. Nat Genet. 2000;25: 25-29.
Eden E, Navon R, Steinfeld I, Lipson D, Yakhini Z. GOrilla: a tool for discovery and visualization of enriched GO terms in ranked gene lists. BMC Bioinformatics. 2009;10: 48.
Hanahan D, Weinberg RA. Hallmarks of cancer: the next generation. Cell. 2011;144: 646-674. Karnoub AE, Weinberg RA. Ras oncogenes: split personalities. Nat Rev Mol Cell Biol. 2008;9: 517-531.
Hahn WC, Counter CM, Lundberg AS, Beijersbergen RL, Brooks MW, Weinberg RA. Creation of human tumour cells with defined genetic elements. Nature. 1999;400: 464-468.
Sibley CR, Seow Y, Saayman S, Dijkstra KK, El Andaloussi, Weinberg MS, et al. The biogenesis and characterization of mammalian microRNAs of mirtron origin. Nucleic Acids Res. 2012;40: 438-448.
Waldman T, Kinzler KW, Vogelstein B. p21 is necessary for the p53-mediated Gi arrest in human cancer cells. Cancer Res. 1995;55: 5187-5190.
Bulavin DV, Saito S, Hollander MC, Sakaguchi K, Anderson CW, Appella E, et al. Phosphorylation of human p53 by p38 kinase coordinates N-terminal phosphorylation and apoptosis in response to UV radiation. EMBO J. 1999; 18: 6845-6854.
Anglesio MS, Arnold JM, George J, Tinker AV, Tothill R, Waddell N, et al. Mutation of ERBB2 provides a novel alternative mechanism for the ubiquitous activation of RAS-MAPK in ovarian serous low malignant potential tumors. Mol Cancer Res. 2008;6: 1678-1690.
Klein HL. The consequences of Rad51 overexpression for normal and tumor cells. DNA Repair. 2008;7: 686-693.
49. Diaz F, Bourguignon LY. Selective down-regulation of IP3 receptor subtypes by caspases and calpain during TNFa-induced apoptosis of human T-lymphoma cells. Cell Calcium. 2000;27: 315- 328.
50. Iorio MV, Visone R, Di Leva G, Donati V, Petrocca F, Casalini P, et al. MicroRNA signatures in human ovarian cancer. Cancer Res. 2007;67: 8699-8707.
51. Yang D, Sun Y, Hu L, Zheng H, Ji P, Pecot CV, et al. Integrated analyses identify a master microRNA regulatory network for the mesenchymal subtype in serous ovarian cancer. Cancer Cell. 2013;23: 186-199.
52. Nagahara H, Vocero-Akbani AM, Snyder EL, Ho A, Latham DC, Lissy NA, et al. Transduction of full-length TAT fusion proteins into mammalian cells: TAT-p27Klpl induces cell migration. Nat Med. 1998;4: 1449-1452.
53. Kwon YH, Jovanovic A, Serfas MS, Tyner AL. The Cdk inhibitor p21 is required for necrosis, but it inhibits apoptosis following toxin-induced liver injury. J Biol Chem. 2003;278: 30348-30355.
54. Chu IM, Hengst L, Slingerland JM. The Cdk inhibitor p27 in human cancer: prognostic potential and relevance to anticancer therapy. Nat Rev Cancer. 2008;8: 253-267.
55. Duncan TJ, Al- Attar A, Rolland P, Harper S, Spendlove I, Durrant LG. Cytoplasmic p27 expression is an independent prognostic factor in ovarian cancer. Int J Gynecol Pathol. 2010;29: 8-18.
56. Ahmed J, Meinel T, Dunkel M, Murgueitio MS, Adams R, Blasse C, et al. CancerResource: a comprehensive database of cancer-relevant proteins and compound interactions supported by experimental knowledge. Nucleic Acids Res. 2011;39: D960-D967.
57. Romanova LY, Willers H, Blagosklonny MV, Powell SN. The interaction of p53 with replication protein A mediates suppression of homologous recombination. Oncogene. 2004;23: 9025-9033.
58. Moynahan ME, Jasin M. Mitotic homologous recombination maintains genomic stability and suppresses tumorigenesis. Nat Rev Mol Cell Biol. 2010;11: 196-207.
59. Kumar GR, Shum L, Glaunsinger BA. Importin a-mediated nuclear import of cytoplasmic poly(A) binding protein occurs as a direct consequence of cytoplasmic mRNA depletion. Mol Cell Biol. 2011;31: 3113-3125.
60. Shen R, Olshen AB, Ladanyi M. Integrative clustering of multiple genomic data types using a joint latent variable model with application to breast and lung cancer subtype analysis. Bioinformatics. 2009;25: 2906-2912.
61. Mo Q, Wang S, Seshan VE, Olshen AB, Schultz N, Sander C, et al. Pattern discovery and cancer gene identification in integrated cancer genomic data. Proc Natl Acad Sci USA. 2013;110: 4245- 4250.
Supporting Information
SI Appendix. A PDF format file, readable by Adobe Acrobat Reader.
(PDF)
SI Mathematica Notebook. Tensor GSVD of patient- and platform-matched tumor and normal genomic profiles. A PDF format file, readable by Adobe Acrobat Reader. The corresponding
Mathematica 9.0.1 code file, executable by Matliematica and readable by Matliematica Player, is available at litt p : / /www . alt erlab. org/O V_prognosis / .
(PDF)
51 Dataset. Discovery Set of Patients. A tab-delimited text format file, readable by both Mathematica and Microsoft Excel, reproducing TCGA annotations of the discovery set of 249 patients. The tumor and normal profiles of the discovery set of patients measured by each of the two DNA microarray platforms, tabulating relative copy- number variation across the 6p+12p, 7p, and Xq tumor and normal probes, are available in tab-delimited text format files at http://www.alterlab.org/OV_prognosis/. (PDF)
52 Dataset. Validation Set of Patients. A tab-delimited text format file reproducing TCGA annotations of the validation set of 148 patients. The tumor profiles of the validation set of patients, tabulating relative copy- number variation across the 6p+12p, 7p, and Xq tumor probes, are available in tab-delimited text format files at http://www.alterlab.org/OV_prognosis/.
(TXT)
53 Dataset. First, Most Tumor-Exclusive Tumor Arraylets. A tab-delimited text format file tabulating the segments of the first, most tumor-exclusive tumor arraylets computed by tensor GSVD of the discovery set of patients across 6p+12p, 7p, or Xq.
(TXT)
54 Dataset. Differential mRNA Expression. A tab-delimited text format file tabulating differential expression of 11,457 autosomal and X chromosome mRNAs in the 6p+12p, 7p, and Xq tensor GSVD classes. The mRNA expression profiles of 394 of the 397 patients in the discovery and validation sets are available in tab-delimited text format files at http://www.alterlab.org/OV_prognosis/.
(TXT)
55 Dataset. Differential microRNA Expression. A tab-delimited text format file tabulating differential expression of 639 autosomal and X chromosome microRNAs in the 6p+12p, 7p, and Xq tensor GSVD classes. The microRNA expression profiles of 395 patients are available in tab-delimited text format files at http://www.alterlab.org/OV_prognosis/.
(TXT)
56 Dataset. Differential Protein Expression. A tab-delimited text format file tabulating differential expression of 175 antibodies that probe for 136 autosomal and X chromosome proteins in the 6p+12p, 7p, and Xq tensor GSVD classes. The protein expression profiles of 282 patients are available in tab-delimited text format files at http://www.alterlab.org/OV_prognosis/.
(TXT)
1. Mathematical Method: Tensor GSVD GSVD, therefore, has the same uniqueness properties as the GSVD. Note that the proof holds for tensors of
1.1. Discovery Datasets are Pairs of Column- higher-than-third order. □ Matched but Row-Independent Tensors. The
discovery set of patients reflects the general primary, Corollary A . For two second-order tensors, the tensor high-grade OV patient population, with approximately GSVD reduces to the GSVD of the corresponding matri5%, 7%, 76%, and 12% of the patients diagnosed at ces.
stages I, II, III, and IV, and 218, i.e., ~88%, treated Proof. For two second-order tensors, e.g., the matrices with platinum-based chemotherapy, i.e., cisplatin, car- Di e K* x L, the tensor GSVD of Eq. (1) is boplatin, or oxaliplatin, and 240 of the 249, i.e., >95%
of the tumors at grades 2 and higher. D,
Each profile in the discovery datasets lists log2 of U,R,V , 1, 2. (Al) TCGA level 1 background-subtracted intensity in the
sample relative to the male Promega DNA reference, The row- and ^-column mode GSVDs of Eqs. (2) and with signal to background >2.5 for both the sample and (3) are identical, because unfolding each matrix 7¾ while reference in >90% of the 391,190 autosomal probes and preserving either its Ki-iaw dimension, or

>65% of the 10,911 X chromosome probes that match dimension results in Di, up to permutations of either its between the two Agilent Human array CGH (aCGH) columns or rows, respectively,
DNA microarray platforms, G4447A and G4124A.
Tumor and normal probes were selected with valid D, D, 1, 2. (A2) data in >99% of the tumor or normal arrays of each
platform, respectively. For each chromosome arm or From the uniqueness properties of the tensor GSVD combination of two chromosome arms, and for each of Eq. (Al), and the GSVDs of Eq. (A2) it follows platform, the <0.5% missing data entries in the tumor that Ri = ∑j, and that for two second-order tensors, and normal profiles were estimated by using the SVD, i.e., matrices, the tensor GSVD is equivalent to the as previously described [12] . Each profile was then GSVD. □ centered at its copy-number median, and normalized by
its copy-number sMAD. Theorem A . The tensor GSVD of the tensor V €
RLM x L x M, which row mode unfolding gives the iden¬
1.2. The Tensor GSVD. tity matrix D\ = I€ ]R,LM x LM ; and a tensor T>2 of the
Existence, uniqueness and special cases. same column dimensions reduces to the HOSVD of V2.
Lemma A . The tensor GSVD exists for any two, e.g., Proof. Consider the GSVD of Eq. (2), of the matrices third-order tensors T>i€ E^ xL xM of the same column D = I and Z¾, as computed by using the QR decompodimensions L and M but different row dimensions Ki} sition of the appended D\ and Z¾, and the SVD of the where Kt > LM for i = 1 , 2, if the tensors unfold into full block of the resulting column-wise orthonormal Q that column-rank matrices, 7¾ e ~RK' X L M , Dix e ~RK'M X L , corresponds to D2 , i.e., Q2 = UQ2∑Q2 VQ2 [5] , and Diy€ ,KT L X M , each preserving the Ki-row dimension, L-x-, or M-y- column dimension, respectively. I Qi R R- R
QR
Proof. The tensor GSVD of Eq. (1), of the pair of D2 D2 Q-2 UQ2
third-order tensors T>i, is constructed from the GSVDs (A3) of Eqs. (2) and (3), of the pairs of full column-rank
matrices 7¾, Dix, and Diy, where i = 1, 2. From the where R is upper triangular and, therefore, invertible. existence of the GSVDs of Eqs. (2) and (3) [5, 6] , the Since Q is column-wise orthonormal, VQ2 is orthonormal, orthonormal column bases vectors of Ui, as well as the and∑Q2 is positive diagonal, it follows that normalized x- and ¾ -row bases vectors of the invertible
Vx or Vy , exist, and, therefore, the tensor GSVD of
Eq. (1) also exists. Note that the proof holds for tensors
of higher-than-third order. □

Lemma B. The tensor GSVD has the same uniqueness (v R) (v R)T,
properties as the GSVD. (j-¾r
Proof. From the uniqueness properties of the GSVDs (A4) of Eqs. (2) and (3), the orthonormal column bases
vectors «iia, and the normalized row bases vectors wjb, and that (/ -∑Q2 ) ' ¾ ? is orthonormal. The GSVD and Vy C of the tensor GSVD of Eq. (1) are unique, of Eq. (2) factors the matrix D2 into a column-wise orexcept in degenerate subspaces, defined by subsets thonormal UQ2 , a positive diagonal∑Q2 (/—∑Q2 ) ~ 2 and of equal generalized singular values aix, and aiy, an orthonormal (/—∑Q2) VQ2 R, and isi therefore, rerespectively, and up to phase factors of ±1. The tensor duced to the SVD of Z¾.2
Note that this proof holds for the GSVDs of Eq. (3). SVDs of D'2 , D'2x , or respectively.
This is because the x- and ¾ -column unfoldings of the The tensor GSVD of Eq. (f), where the orthonormal tensor T>i€ ]R,LM x L x M ; which row mode unfolding gives column bases vectors «2 a, and the normalized row bases the identity matrix D = I e ]RLM x LM ; give vectors v x. ,b' and v in the factorization of the tensor
T>2 are computed via the SVDs of the unfolded tensor is, therefore, reduced to the HOS VD of V2 [25-27] . Note
M that the proof holds for tensors of higher-than-third order. □
M(M - 1) Interpretation. The "tensor generalized Shannon entropy" of each dataset,


The GSVDs of Eqs. (2) and (3), of any one of the matrices captured by a single subtensor. An entropy of one correDi , D x , or D y with the corresponding full column-rank sponds to a disordered and random dataset in which all matrices Z¾, D'ix, or are, therefore, reduced to the subtensors are of equal significance.
Fig. A (on p. A-3). The tensor GSVD of the patient- and platform-matched DNA copy-number profiles of the 7p chromosome arm. The tensor GSVD is depicted in a raster display, with relative copy-number gain (red), no change (black), and loss (green), explicitly showing the first through the 5th, and the 245th through the 249th 7p i-probelets, both 7p ¾ -probelets, and the first through the 10th, and the 489th through the 498th 7p tumor and normal arraylets. We prove that the significance of a subtensor in the tumor dataset relative to that of the corresponding subtensor in the normal dataset, i.e., the tensor GSVD angular distance, equals the row mode GSVD angular distance, i.e., the significance of the corresponding tumor arraylet in the tumor dataset relative to that of the normal arraylet in the normal dataset. The tensor GSVD angular distances for the 498 pairs of 7p arraylets are depicted in a bar chart display, where the angular distance corresponding to the first pair of arraylets is ~π/4. For the 7p chromosome arm, we find that the most significant subtensor in the tumor dataset is a combination of (i) the first j -probelet, which is approximately invariant across the platforms, (ii) the first i-probelet, which classifies the discovery set of patients into two groups of high and low coefficients, of significantly and robustly different prognoses, and (in) the first, most tumor-exclusive tumor arraylet, which classifies the validation set of patients into two groups of high and low correlations of significantly different prognoses consistent with the i-probelet's classification of the discovery set.
Fig. B (on p. A-4). The tensor GSVD of the patient- and platform- matched DNA copy- number profiles of the Xq chromosome arm. The tensor GSVD is depicted in a raster display, with relative copy-number gain (red), no change (black), and loss (green), explicitly showing the first through the 5th, and the 245th through the 249th Xq i-probelets, both Xq ¾ -probelets, and the first through the 10th, and the 489th through the 498th Xq tumor and normal arraylets. The tensor GSVD angular distances for the 498 pairs of Xq arraylets are depicted in a bar chart display, where the angular distance corresponding to the first pair of arraylets is ~π/4.


( a ) ¾ = 0.48 (b) d2 = 0.G4

( c ) ¾ = 0. G 2 (d) d2 = 0.GG

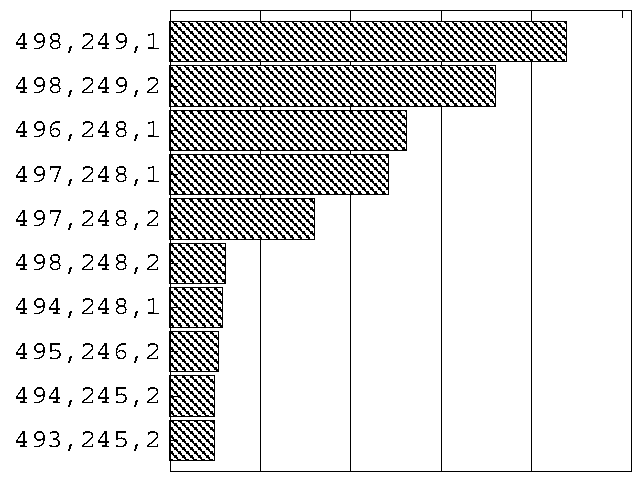
Fig. C. Most significant subtensors in the tumor and normal discovery datasets. Bar charts of
 1.3. Discovery and Validation of CNAs Predictsample relative to the male Promega DNA reference, with ing OV Survival. For the validation dataset, we sesignal to background >2.5 for both the sample and reflected 131 and 41 stage III-IV OV aCGH profiles meaerence in >99.5% of the 391,190 autosomal probes and sured by the Agilent Human aCGH G4447A and G4124A >96.5% of the 10,911 X chromosome probes that match microarray platforms, respectively, corresponding to 148 between the platforms. Medians of the profiles of samples primary OV tumors. Of the 148 patients, 140, i.e., from the same patient were then taken.
~95%, were treated with platinum-based chemotherapy, The arraylet correlation cutoff is the i-probelet
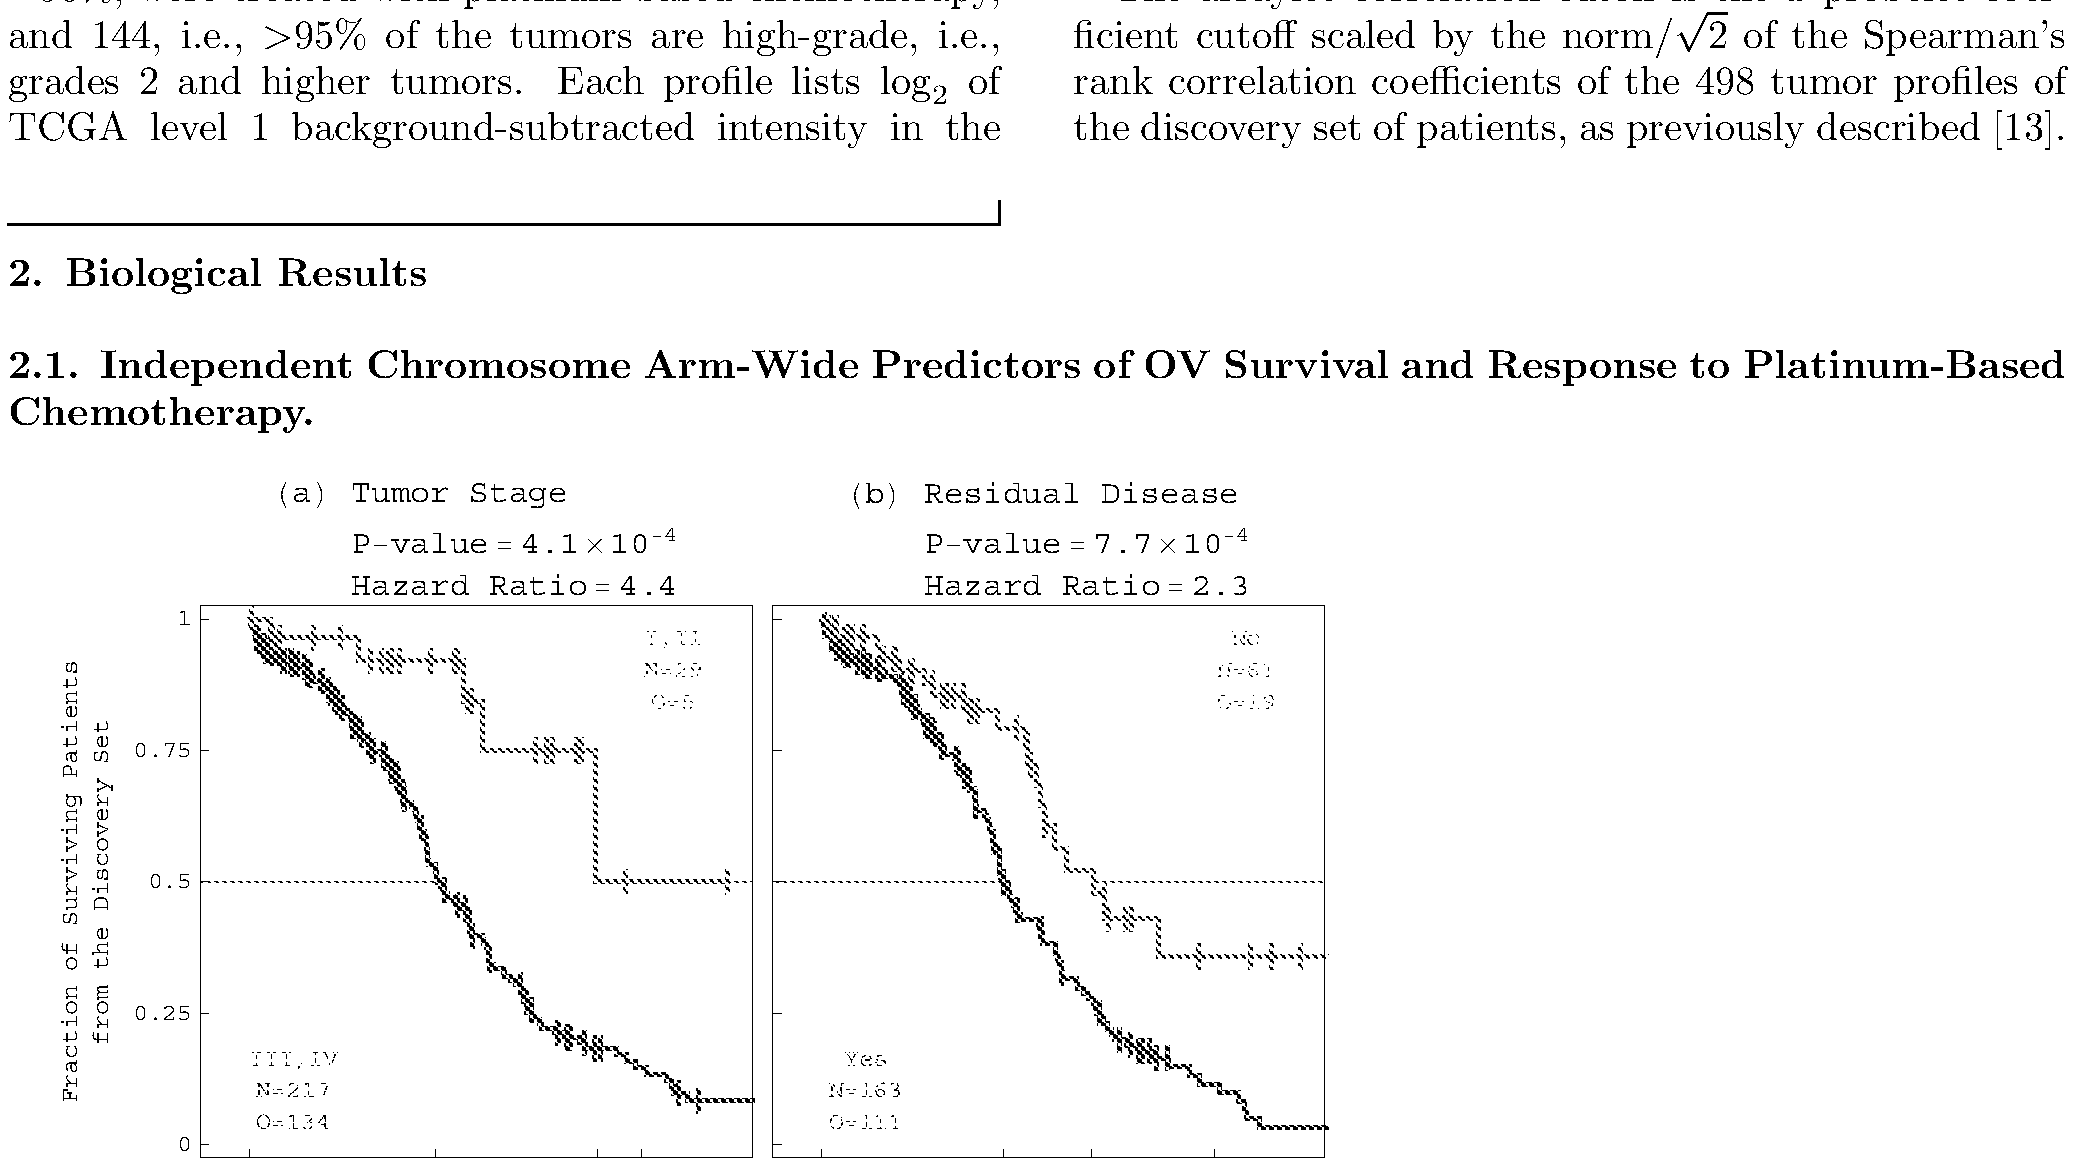
Therapy Outcome Neoplasm Status
Hazard Ratio = 3.8 Hazard Ratio =13

Survival Time (Months) Survival Time (Months)
Fig. D. Survival analyses of the discovery set of patients classified by the standard OV indicators. KM curves of the discovery set of 249 patients classified by (a) tumor stage at diagnosis, the best predictor of OV survival to date, ( ¾) residual disease after surgery, i.e., no (No) or some (Yes) macroscopic disease, (c) outcome of subsequent therapy, i.e., complete remission (CR) or not (No), ( d) neoplasm status, i.e., with (W) tumor or without (WO).
Tumor Stage Residual Disease
P-value = 3.8 x lCT2 P-value = 1.4 x lCT2

Therapy Outcome (d) Neoplasm Status

Survival Time (Months) Survival Time (Months)
Fig. E. Survival analyses of the validation set of patients classified by the standard OV indicators. KM curves of the validation set of 148 stage III-IV patients classified by (a) tumor stage at diagnosis, ( 6) residual disease after surgery, i.e., no (No) or some (Yes) macroscopic disease, (c) outcome of subsequent therapy, i.e., complete remission (CR) or not (No), ( d) neoplasm status, i.e., with (W) tumor or without (WO).
Fig. F (on p. A-8). Survival analyses of the platinum- based chemotherapy patients in the discovery and validation sets classified by tensor GSVD, or tensor GSVD and tumor stage at diagnosis.
(a) Kaplan-Meier (KM) curves of only the 218, i.e., ~88% platinum-based chemotherapy patients in the discovery set, classified by the 6p+12p i-probelet coefficient, show a median survival time difference of 14 months, with the corresponding log-rank test P-value < 10-3. The univariate Cox proportional hazard ratio is 2.0. ( 6) Survival analyses of the 218 patients classified by the 7p i-probelet coefficient, (c) The 218 patients classified by the Xq ίΕ-probelet coefficient, ( d) The 218 patients classified by both the 6p+12p tensor GSVD and tumor stage at diagnosis, show the bivariate Cox hazard ratios of 1.8 and 4.1, which do not differ significantly from the corresponding univariate hazard ratios of 2.0 and 4.4, respectively. This means that the 6p+12p tensor GSVD is independent of stage, the best predictor of OV survival to date, ( e) The 218 patients classified by both the 7p tensor GSVD and stage. (/) The 218 patients classified by both the Xq tensor GSVD and stage, (g) KM curves of only the 140, i.e., ~95% platinum-based chemotherapy patients in the validation set, classified by the 6p+12p arraylet correlation, show a median survival time difference of 18 months, with the univariate Cox proportional hazard ratio 1.8. This validates the survival analyses of the 218 chemotherapy patients in the discovery set. (h) Survival analyses of the 148 patients classified by the 7p arraylet correlation, (i ) The 148 patients classified by the Xq arraylet correlation.


Arraylet (Corr.) Arraylet (Corr. Arraylet (Corr.) P-value = 2.5 x lCT2 P-value = 1.9x10 P-value = 3.3x10 Hazard Ratio =1.8 Hazard Ratio = 1. Hazard Ratio = 2.

Fig. F
6p+12p V Xq
Arraylet/Tumor Stage (b) Arraylet/Tumor Stage Arraylet/Tumor Stage P-value = 5.4 x lCT3 P-value = 1.6x10" P-value = 1.1 x lCT4

Survival Time (Months) Survival Time (Months) Survival Time (Months)
Fig. G. Survival analyses of the validation set of patients classified by tensor GSVD and tumor stage at diagnosis, (a) KM curves of the validation set of 148 stage III-IV patients classified by both the 6p+12p tensor GSVD and tumor stage at diagnosis, show the bivariate Cox hazard ratios of 1.9 and 1.8, which are the same as the corresponding univariate ratios. This means that the 6p+12p tensor GSVD is independent of stage, the best predictor of OV survival to date. The 34 months KM median survival time difference is about 62% and more than one year greater than the 21 month difference between the patients classified by stage alone. This means that the tensor GSVD and stage combined make a better predictor than stage alone. ( ¾) The 148 patients classified by both the 7p tensor GSVD and stage, (c) The 148 patients classified by both the Xq tensor GSVD and stage.
6p+12p V Xq
Probelet/Residual Disease Probelet/Residual Disease Probelet/Residual Disease P-value = 6.6 x lCT4 P-value = 1.1 x lCT3 P-value = 4.0 x lCT4

(d) Probelet/Therapy Outcome (e) Probelet/Therapy Outcome (f) Probelet/Therapy Outcome
P-value = 8.1 lO"1 P-value = 3.9 lO"" P-value = 1.8x10

(g) Probelet/Neoplasm Status (h) Probelet/Neoplasm Status (i) Probelet/Neoplasm Status P-value = 2.2 x lCT8 P-value = 6.1 x 1 CT9 P-value = 2.1 x lCT8

Survival Time (Months) Survival Time (Months) Survival Time (Months)
Fig. H. Survival analyses of the discovery set of patients classified by tensor GSVD and standard OV indicators other than stage. KM curves of the discovery set of 249 patients classified by both the (a) 6p+12p, ( 6) 7p, or (c) Xq tensor GSVD, and residual disease after surgery, the ( d) 6p+12p, (e) 7p, or (/) Xq tensor GSVD, and outcome of subsequent therapy, and (g) 6p+12p, (h) 7p, or (i) Xq tensor GSVD, and neoplasm status.
6p+12p 7p Xq
(a) Arraylet/Residual Disease (b) Arraylet/Residual Disease (c) Arraylet/Residual Disease
P-value = 2.6x10 P-value = 1.2 x lCT3 P-value = 1.3x10

(d) Arraylet/Therapy Outcome (e) Arraylet/Therapy Outcome (f) Arraylet/Therapy Outcome
P-value = 3.8x10 P-value = 3.5x10 P-value = 6.6x10

(h) Arraylet/Neoplasm Status
P-value = 8.0x10 P-value = 7.0 x 10~5 P-value = 1.2x10
Hazard Ratios = 1.8 / 15.6 Hazard Ratios = 1.8/16.6 Hazard Ratios = 1.8 / 16.0

Fig. I. Survival analyses of the validation set of patients classified by tensor GSVD and standard OV indicators other than stage. KM curves of the validation set of 148 stage III-IV patients classified by both the (a) 6p+12p, (6) 7p, or (c) Xq tensor GSVD, and residual disease after surgery, the (d) 6p+12p, ( e) 7p, or (/) Xq tensor GSVD, and outcome of subsequent therapy, and (g) 6p+12p, (h) 7p, or (i) Xq tensor GSVD, and neoplasm status.

Table A. Cox univariate proportional hazard models of the discovery and validation sets of patients classified by any one of the tensor GSVDs or the standard OV indicators.

Table B. Cox bivariate proportional hazard models of the patients in the discovery and validation sets classified by both tensor GSVD and the standard OV indicators.
2.2. Novel Frequent Focal CNAs Indicating Surment's median copy number, and sMAD from the median vival. To interpret the 6p+12p, 7p, and Xq tumor ar- in the corresponding arraylet. If the segment's median is raylets, we mapped the tumor probes onto the National at least one sMAD greater (or lesser) than the arraylet 's Center for Biotechnology Information (NCBI) human median, then the arraylet is assigned a gain (or a loss) in genome sequence build 37, by using the Agilent Techthe segment. Similarly, we calculated the segment's menologies probe annotations posted at the University of dian copy number, and sMAD from the median in each California at Santa Cruz (UCSC) human genome browser tumor profile. If the segment's median is at least one [20] . We segmented each of the arraylets and assigned sMAD greater (or lesser) than the profile's median, then each segment a P- value by using the circular binary segthe patient is assigned a gain (or a loss) in the segment. mentation (CBS) algorithm, as previously described [21] .
To assign a CNA in a segment, we calculated the seg¬
J
(a) 6p+12p Segment 10 (SOX5)

(d) 6p+12p Segment 14 (ASUN) (e) 7p Segment 4 (RPA3 Xq Segment 10 (PABPC5
Hazard Ratio =1.6 Hazard Ratio = 1.4

Survival Time (Months) Survival Time (Months) Survival Time (Months)
Fig. J. Survival analyses of the discovery and validation sets of patients classified by the novel frequent focal CNAs included in the tensor GSVD arraylets. Six novel frequent focal CNAs that are included in the tensor GSVD arraylets are significantly correlated with OV survival. Two amplified consecutive segments (12pl2.1) contain (a) the 5' ends of isoforms a and e of SOX5, and ( 6) exons 5 and 6, the first exons that are common to isoforms a, b, d, and e of SOX5. Two other amplified consecutive segments (12pll.23) contain (c) ITPR2 and (d) ASUN. One deletion (7p22.1-p21.3) contains ( e) RPA3. Another deletion (Xq21.31) contains (/) PABPC5, and the sequence tag site DXS241 adjacent to translocation breakpoints observed in premature ovarian failure.
2.3. Possible Roles in OV Pathogenesis. To comand X chromosome microRNAs on the Agilent Human pare the variation in DNA copy numbers with that in microRNA Array 8xl5K platform with UCSC coordigene expression, we used mRNA expression profiles that nates. Medians of the profiles of samples from the same were available for 394 of the 397 TCGA patients in the patient were taken.
discovery and validation sets. Each profile lists TCGA To compare with the variation in protein expression, level 3 mRNA expression for 11,457 autosomal and X we used protein expression profiles that were available for chromosome genes on the Affymetrix Human Genome 282 of the 397 patients. Each profile lists TCGA level U133A Array platform with UCSC coordinates [20] and 3 protein expression for the 175 antibodies on the MD GO annotations [39] . Medians of the profiles of samAnderson Reverse Phase Protein Array (RPPA), which ples from the same patient were taken. To examine the probe for the abundance levels of 136 proteins encoded possible relations between a tensor GSVD class and the by autosomal and X chromosome genes.
OV pathogenesis, we assessed the enrichment of the subWe find that the CNAs are consistent with differential sets of genes that are differentially expressed between the mRNA, microRNA, and protein expression between the tensor GSVD classes in any one of the multiple GO antensor GSVD classes (Figs. K-M). The mRNA and pronotations [40] . The P-value of a given enrichment was tein encoded by, e.g., M APR 14, which is deleted in the calculated assuming hypergeometric probability distribu6p+12p arraylet, are both significantly (Mann-Whitney- tion of the annotations among the genes in the global Wilcoxon P-values < 10-5) underexpressed in the tensor set, and of the subset of annotations among the subset GSVD class of a high 6p+12p i-probelet coefficient, or of genes, as previously described [12] . arraylet correlation relative to the tensor GSVD class of a
To compare with the variation in microRNA expreslow 6p+12p ίΕ-probelet coefficient, or arraylet correlation. sion, we used microRNA expression profiles that were The microRNA mir-877* that maps to the same deleavailable for 395 of the 397 patients. Each profile lists tion as MAPK14 is also significantly (Mann-Whitney- TCGA level 3 microRNA expression for 639 autosomal Wilcoxon P-value <0.05) underexpressed.
I
Fig. K (on p. A-15). Differential mRNA expression between the tensor GSVD classes is consistent with the CNAs. (a) TNF, ( b) MAPK14, and (c) CDKNlA, which are deleted in the 6p+12p arraylet, are significantly (Mann- Whitney- Wilcoxon P-value <0.05) underexpressed in the tensor GSVD class of a high 6p+12p i-probelet coefficient, or arraylet correlation relative to the tensor GSVD class of a low 6p+12p i-probelet coefficient, or arraylet correlation, (d) RAD51AP1, ( e) ITPR2, and (/) ASUN, which are amplified in the 6p+12p arraylet, are significantly overexpressed in the tensor GSVD class of a high 6p+12p i-probelet coefficient, or arraylet correlation. (g) RPA3, which is deleted, and (h) POLD2, which is amplified, in the 7p arraylet, are significantly underexpressed and overexpressed, respectively, in the tensor GSVD class of a high 7p i-probelet coefficient, or arraylet correlation, (i) BCAP31, which is amplified in the Xq arraylet, is significantly overexpressed in the tensor GSVD class of a high Xq i-probelet coefficient, or arraylet correlation.
Fig. L (on p. A-16). Differential microRNA expression between the tensor GSVD classes is consistent with the CNAs. (a) mir-877*, which is deleted, and ( ¾) mir-200c, (c) mir-200c*, (d) mir-141, and ( e) mir-141*, which are amplified in the 6p+12p arraylet, are significantly (Mann- Whitney- Wilcoxon P-value <0.05) underexpressed and overexpressed, respectively, in the tensor GSVD class of a high 6p+12p i-probelet coefficient, or arraylet correlation relative to the tensor GSVD class of a low 6p+12p i-probelet coefficient, or arraylet correlation. (/) mir-888, (g) mir-224, and (h) mir-452, which are amplified in the Xq arraylet, are significantly overexpressed in the tensor GSVD class of a high Xq i-probelet coefficient, or arraylet correlation.


(a) 6p+12p Probelet (Coeff. (b) 6p+12p Probelet (Coeff. (c) 6p+12p Probelet (Coeff. miR-877* miR-200c miR-200c*
P-value = 2.6 x lCT2 P-value = 3.1x10"" P-value = 6.7 x lCT8

(d) 6p+12p Probelet (Coeff.) (e) 6p+12p Probelet (Coeff.

(f) Xq Probelet (Coeff. (g) Xq Probelet (Coeff. (h) Xq Probelet (Coeff. miR-888 miR-224 miR-452
P-value = 1.2 x 10"2 P-value = 3.5 x 10"4 P-value = 2.1 x 10"3

Fig. L
(a) 6p+12p Probelet (Coeff.) (b) 6p+12p Probelet (Coeff.;
P-value = 4.5 x 1CT6 P-value = 5.4 x 10"4

Fig. M. Differential protein expression between the tensor GSVD classes is consistent with the CNAs. (a) MAPK14, which is deleted, and (6) CDKN1B, which is amplified in the 6p+12p arraylet, are significantly (Mann- Whitney- Wilcoxon P-value <0.05) underexpressed and overexpressed, respectively, in the tensor GSVD class of a high 6p+12p ^-probelet coefficient, or arraylet correlation relative to the tensor GSVD class of a low 6p+12p ίΕ-probelet coefficient, or arraylet correlation.

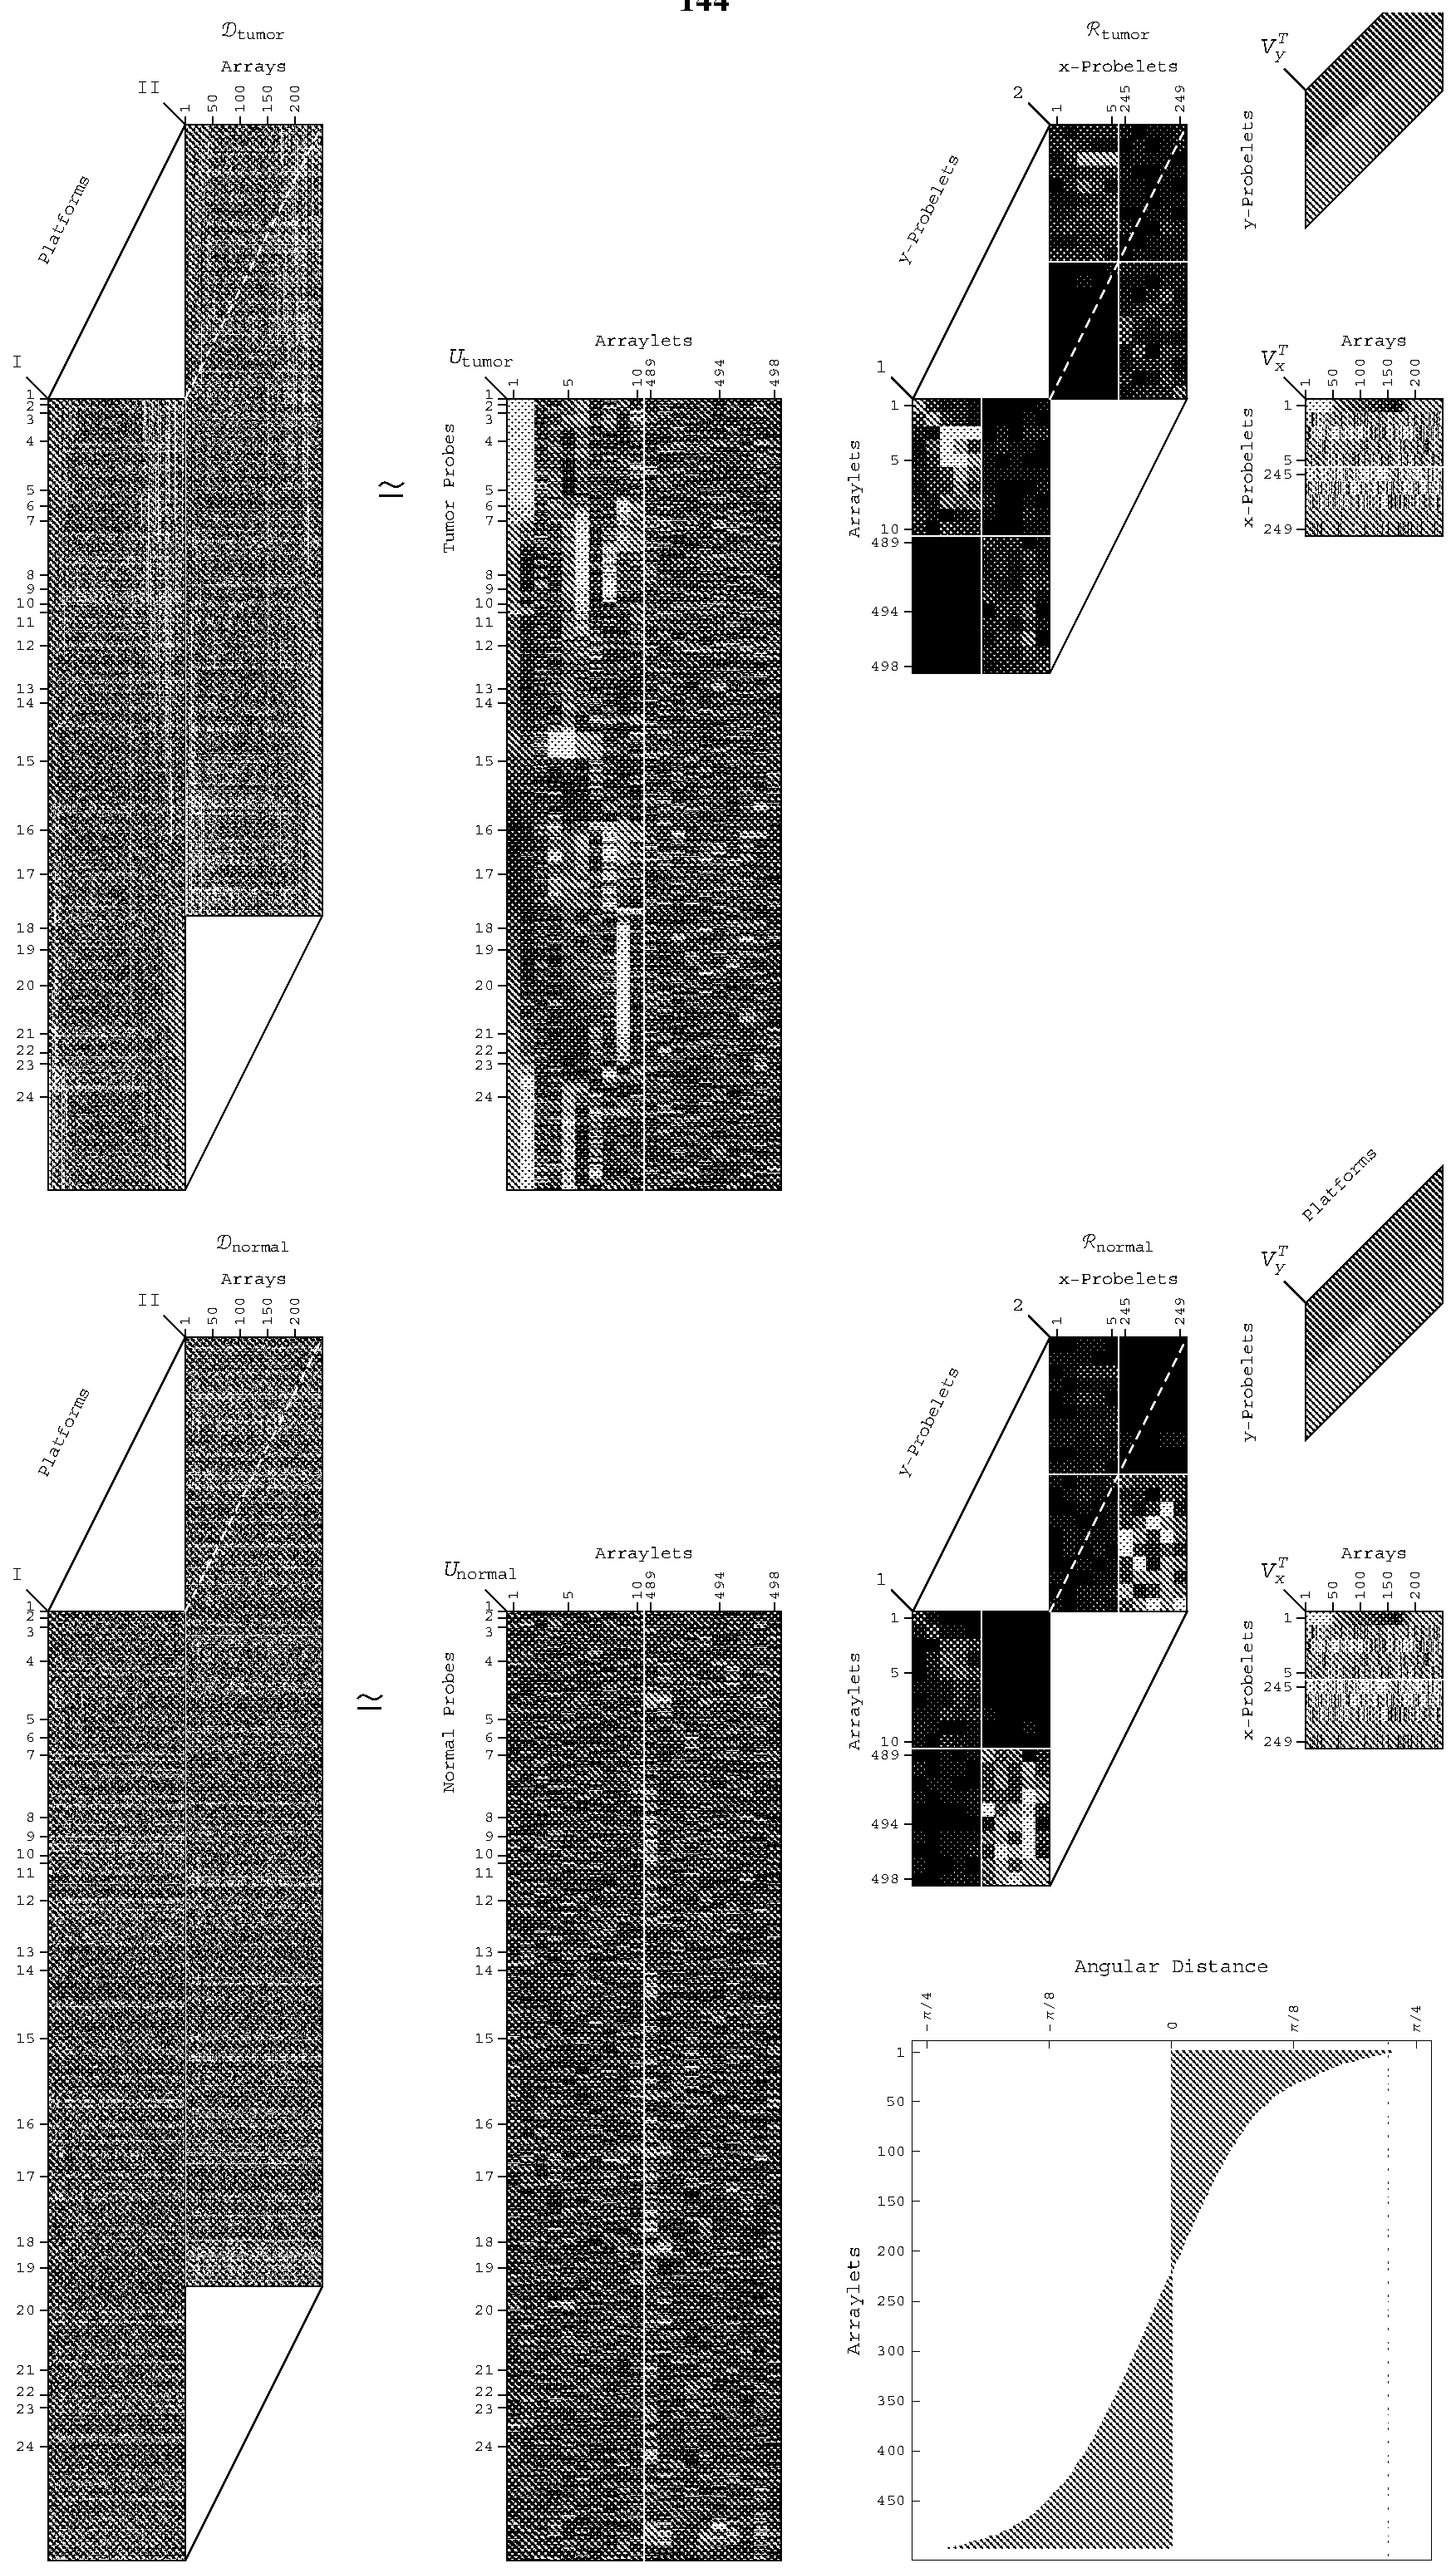
(a) dx = 0.48 (b) d2 = 0.64

0.62 (d) d2 = 0.66
CM
O o O o

( e ) di = 0.61 ; f ) d2 = 0.6


Therapy Outcome Neoplasm Status
P-value = 4.6 x 10"1 P-value = 1.5x10 Hazard Ratio = 3.8 Hazard Ratio =13

0 38 80
Survival Time (Months) Survival Time (Months)
Tumor Stage (b) Residual Disease
P-value = 3.8 x 10"2 P-value = 1.4 x 10"2
Hazard Ratio = 1.8 Hazard Ratio = 2.4

80 80
 6p+12p 7P Xq
Probelet (Coeff.) Probelet (Coeff.) Probelet (Coeff. P-value = 2.4 x lCT4 P-value = 3.1 x lCT2 P-value = 1.6x10"

(d) Probelet/Tumor Stage Probelet/Tumor Stage Probelet/Tumor Stage P-value = 4.8 x 1CT5 P-value = 1.6 x 1CT3 P-value = 9.0 x 1CT4

Arraylet (Corr. Arraylet (Corr.) Arraylet (Corr. P-value = 2.5x10 P-value = 1.9x10" P-value = 3.3x10

0 4 :".,·: 80
Survival Time (Months) Survival Time (Months) Survival Time (Months)
6p+12p V Xq
(a) Arraylet/Tumor Stage Arraylet/Tumor Stage (c) Arraylet/Tumor Stage
P-value = 5.4 x 10"3 P-value = 1.6 x 10"2 P-value = 1.1 x 10"4
Hazard Ratios = 1.8/1.8 Hazard Ratios = 2.1/2.1

0 21 3134 33 80 0 21 1238 33 80 0 19 11 33 (-2 80
Survival Time (Months) Survival Time (Months) Survival Time (Months)
(d) Prob P-va
Haza

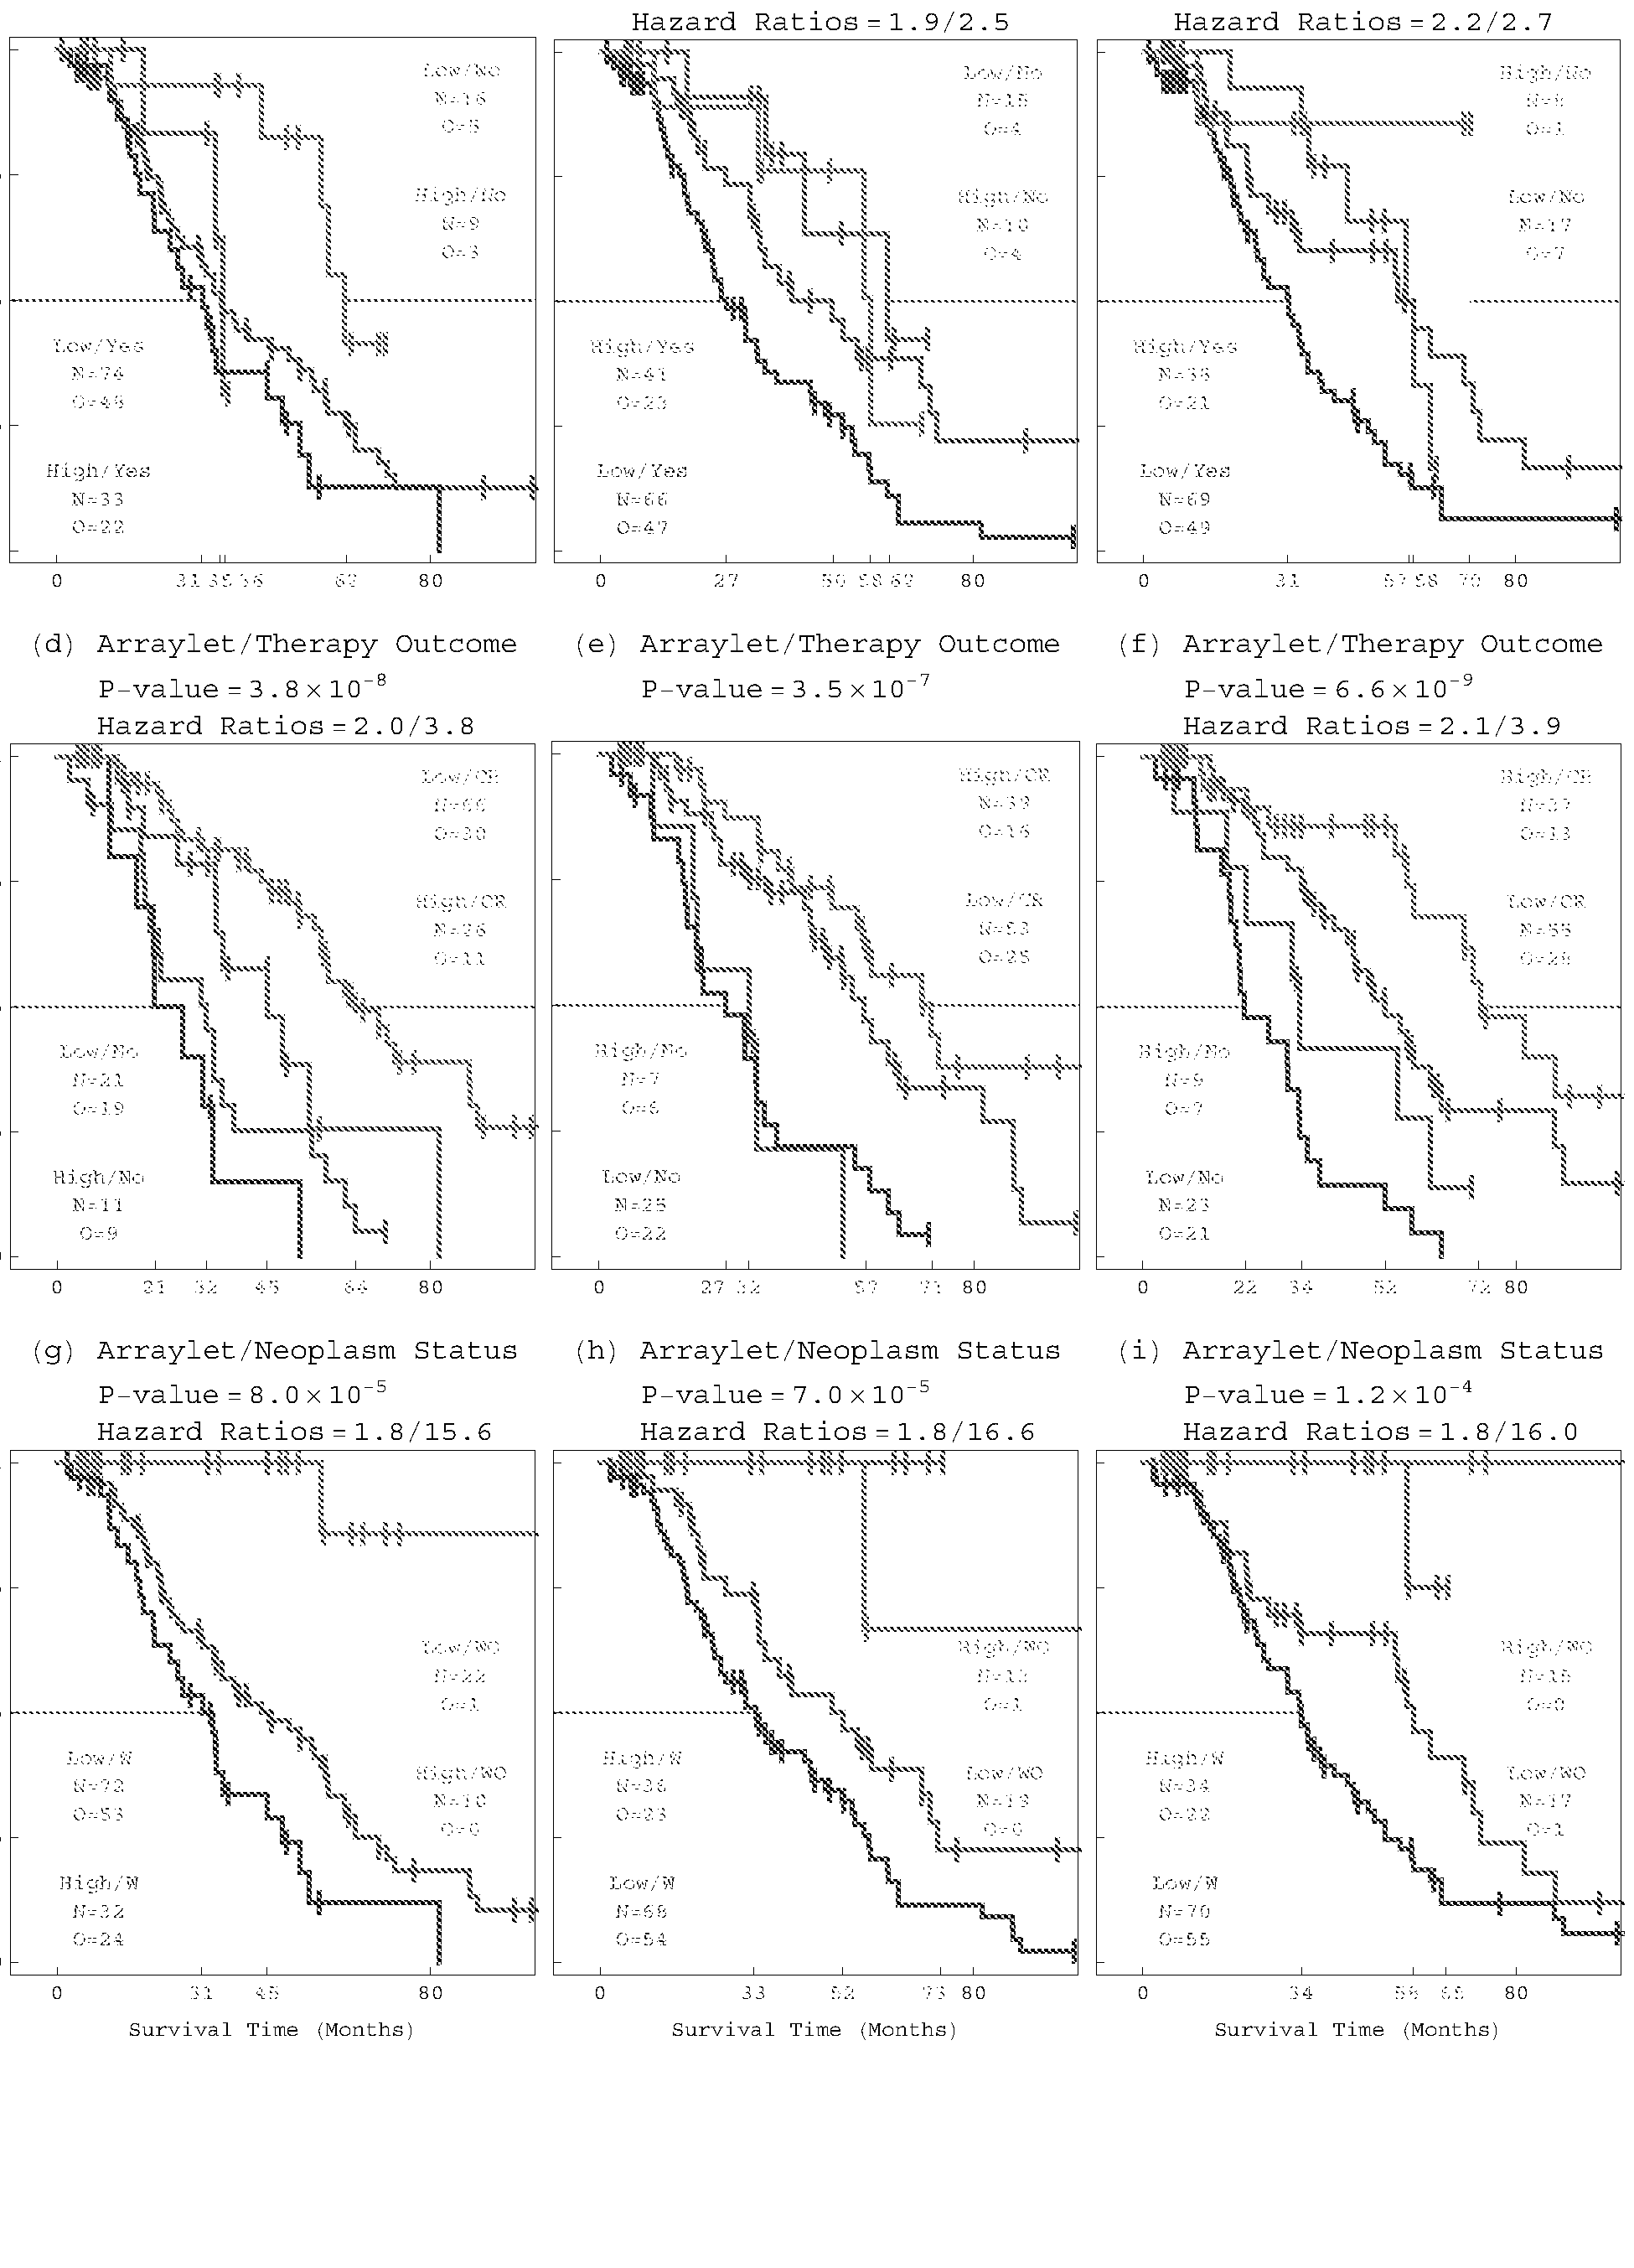
Hazard Ratios - 1.8/15.6 Hazard Ratios = 1.8/16.6 Hazard Ratios = 1.8/16.0
Fraction of Surviving Patients from Fraction of Surviving Patients from the Discovery and Validation Sets the Discovery and Validation Sets


lt9/.Z0/9l0ZSil/I3d 5Ζ589Ϊ/9Ϊ0Ζ OAV
(a) 6p+12p Probelet (Coeff. (b) 6p+12p Probelet (Coeff. (c) 6p+12p Probelet (Coeff.
P-value = 3.1 x lCT3 P-value = 6.2 x 1CT11 P-value = 2.5 x 1CT2

(d) 6p+12p Probelet (Coeff. (e) 6p+12p Probelet (Coeff. (f) 6p+12p Probelet (Coeff.
RAD51AP1 ITPR2 ASU
P-value - 1.9 x 1CT3 P-value = 8.7 x 1CT6 P-value = 1.6 x 1CT6

(g) 7p Probelet (Coeff. (h) 7p Probelet (Coeff. Xq Probelet (Coeff RPA3 POLD2 BCAP31
P-value = 2.0 x 1CT7 P-value = 4.1 x lCT4 P-value = 3.9 x 1CT13

P-value = 6.7 x 10"

High High
(d) 6p+12p Probelet (Coeff. (e) 6p+12p Probelet (Coeff.
miR-141 miR-141*
P-value = 2.0 x 10"8

Xq Probelet (Coeff. (g) Xq Probelet (Coeff. (h) Xq Probelet (Coeff. miR-888 miR-224 miR-452
P-value = 1.2 x 10"2 P-value = 3.5 x 10"4 P-value = 2.1 x 10"3


uoxssacdxg u hold ΘΛΤ^Η Θ^
Claims
1. A method of determining an estimated outcome of, or predicting a clinical response to, chemotherapy for a patient having ovarian serous cystadenocarcinoma (OV), comprising: detecting, in a biological sample from a patient having OV, indicators of differential expression, between cancer cells and normal cells, of at least one of (a) at least two nucleic acid sequences selected from the group consisting of SEQ ID NO: 1, SEQ ID NO: 7, SEQ ID NO: 21, SEQ ID NO: 25, SEQ ID NO: 27, SEQ ID NO: 29 , SEQ ID NO: 31, SEQ ID NO: 41, SEQ ID NO: 47, SEQ ID NO: 56, SEQ ID NO: 64, SEQ ID NO: 70, SEQ ID NO: 81, SEQ ID NO: 96; (b) amino acid sequences encoded by the nucleic acid sequences of (a); or (c) sequences of at least two microRNAs selected from the group consisting of SEQ ID NO: 51, SEQ ID NO: 60, SEQ ID NO: 61, SEQ ID NO: 78, SEQ ID NO: 79, and SEQ ID NO: 80; calculating, by a processor, a weighted sum based on the value of the indicators of differential expression; and estimating, by the processor and based on the weighted sum, a predicted length of survival of the patient or a predicted clinical response to chemotherapy for the patient.
2. The method of claim 1 , further comprising recommending administering a treatment based on the predicted length of survival or the predicted clinical response.
3. The method of claim 1, further comprising recommending a treatment regimen based on the predicted length of survival or the predicted clinical response.
4. The method of claim 1 , wherein differential expression for the nucleic acid sequences is differential copy numbers of nucleic acid sequences in cancer cells relative to normal cells.
5. The method of claim 4, wherein the differential copy number is an increase in copy number in cancer cells relative to normal cells.
6. The method of claim 1 , wherein the amino acid sequences are selected from the group consisting of SEQ ID NO: 8, SEQ ID NO: 22, SEQ ID NO: 26, SEQ ID NO: 28, SEQ ID NO: 32, SEQ ID NO: 42, SEQ ID NO: 50, SEQ ID NO: 57, SEQ ID NO: 65, SEQ ID NO: 71, SEQ ID NO: 82, and SEQ ID NO: 97; wherein the indicator of differential expression is of the amino acid sequences.
7. The method of claim 1 , wherein the predicted length of survival or the predicted clinical response is based on members of each of at least one set of indicators of differential expression selected from sets (a)-(e) below: a. co-occurring copy-number loss of SEQ ID NO: 27 and gain, or mRNA overexpression of SEQ ID NO: 70; or b. co-occurring (i) copy number loss of SEQ ID NO: 27 and (ii) gain, or mRNA overexpression of SEQ ID NO: 70, and (iii) gain, or microRNA overexpression of SEQ ID NO: 78, and SEQ ID NO: 80; or c. co-occurring copy number loss of SEQ ID NO: 27, and gain, or mRNA overexpression of SEQ ID NO: 70, and gain, or microRNA overexpression of SEQ ID NO: 78, SEQ ID NO: 80, SEQ ID NO: 79; or d. co-occurring copy-number loss of SEQ ID NO: 27 SEQ ID NO: 29, and gain, or mRNA overexpression of SEQ ID NO: 70; or e. co-occurring copy number loss of SEQ ID NO: 27, and gain, or mRNA overexpression of SEQ ID NO: 70 and SEQ ID NO: 81..
8. The method of claim 7, wherein the predicted length of survival or the predicted clinical response is based on (c) and further based on (i) copy-number gain or loss of SEQ ID NO: 29, or (n) mRNA overexpression of SEQ ID NO: 70 and SEQ ID NO: 81.
9. The method of claim 1 , wherein the predicted length of survival or the predicted clinical response is based on members of each of at least one set of indicators of differential expression selected from sets (al)-(dl) below:
al) co-occurring copy-number loss, or mRNA underexpression of SEQ ID NO: 25, and copy-number gain, or mRNA overexpression of SEQ ID NO: 64 or bl) co-occurring copy-number loss, or mRNA underexpression of SEQ ID NO: 25 and SEQ ID NO: 96, and copy-number gain, or mRNA overexpression of SEQ ID NO: 64; or cl) co-occurring copy-number loss, or mRNA underexpression of SEQ ID NO: 96on chromosome 13q, and copy-number gain, or mRNA overexpression of SEQ ID NO: 64; dl) co-occurring copy-number loss from SEQ ID NO: 1, SEQ ID NO: 7, SEQ ID NO: 10, SEQ ID NO: 21, SEQ ID NO: 23, SEQ ID NO: 25, SEQ ID NO: 27, and copy number gain in SEQ ID NO: 39, SEQ ID NO: 51, SEQ ID NO: 52, SEQ ID NO: 56, SEQ ID NO: 60, SEQ ID NO: 61, and SEQ ID NO: 62.
10. The method of claim 1, wherein the predicted length of survival or the predicted clinical response is based on members of each of at least one set of indicators of differential expression selected from sets (a2)-(g2) below: a2) co-occurring copy-number loss on chromosome 6p and gain on chromosome 12p; or b2) co-occurring copy-number loss, or mRNA or protein under-expression of SEQ ID NO: 3 land SEQ ID NO: 4, and copy-number gain, or mRNA or protein overexpression of SEQ ID NO: 7; or c2) co-occurring copy-number loss, or mRNA or protein under-expression of SEQ ID NO: 31 and SEQ ID NO: 41, and copy-number gain, or mRNA or protein overexpression SEQ ID NO: 7 and SEQ ID NO: 56; or d2) co-occurring copy-number loss, or mRNA or protein under-expression of SEQ ID NO: 31, SEQ ID NO: 41 and SEQ ID NO: 39, and copy-number gain, or mRNA or protein overexpression of SEQ ID NO: 7, SEQ ID NO: 56, and SEQ ID NO: 21 ; or e2) co-occurring copy-number loss, or microRNA under-expression of SEQ ID NO: 51, and copy-number gain, or microRNA overexpression, of SEQ ID NO: 60, or SEQ ID NO: 61 ;
(f2) co-occurring copy-number loss, or mRNA or protein under-expression of SEQ ID NO: 3 land SEQ ID NO: 41, and copy-number gain, or mRNA or protein overexpression of SEQ ID NO: 56;
(g2) co-occuring copy-number loss, or mRNA or protein under-expression of SEQ ID NO: 39, and copy-number gain, or mRNA or protein overexpression of SEQ ID NO: 21.
11. The method of claim 10, wherein the predicted length of survival or the predicted clinical response is based on members of each of at the least one set of indicators selected from sets (a2)-(g2) and is further based on members of each of at least one set of indicators of differential expression selected from
(h2) a gain in copy numbers or mRNA or protein overexpression of SEQ ID NO: 10; or
(i2) a gain in copy numbers or mRNA or protein overexpression of SEQ ID NO: 23; or
(j2) a gain in copy numbers or mRNA or protein overexpression of SEQ ID NO: 52; or
(k2) a gain in copy numbers or mRNA or protein overexpression of SEQ ID NO: 62; or
(12) an mRNA or protein under-expression or loss in copy numbers of SEQ ID NO: 83; or
(m2) a reduced abundance of Brcal(SEQ ID NO: 85) -associated genome surveillance protein complex (BASC).
12. A method of determining an estimated outcome or predicting a clinical response to chemotherapy for a patient having ovarian serous cystadenocarcinoma (OV), comprising; detecting, in a biological sample from a patient having OV, indicators of differential copy numbers, between cancer cells and normal cells, of at least one of (a) at least two nucleic acid sequences selected from the group consisting of SEQ ID NO: 1, SEQ ID NO: 7, SEQ ID NO: 21, SEQ ID NO: 25, SEQ ID NO: 27, SEQ ID NO: 29 , SEQ ID NO: 31, SEQ ID NO: 41, SEQ ID NO: 47, SEQ ID NO: 56, SEQ ID NO: 64, SEQ ID NO: 70, SEQ ID NO: 81, SEQ ID NO: 96; (b) amino acid sequences encoded by the nucleic acid sequences of (a); or (c) sequences of at
least two microRNAs selected from the group consisting of SEQ ID NO: 51, SEQ ID NO: 60, SEQ ID NO: 61, SEQ ID NO: 78, SEQ ID NO: 79, and SEQ ID NO: 80; and calculating, by a processor, a weighted sum based on the value of the indicators of differential copy numbers; and estimating, by the processor and based on the weighted sum, a predicted length of survival of the patient or a predicted clinical response to chemotherapy for the patient.
13. The method of claim 12, wherein the nucleic acid sequences are selected from SEQ ID NO: 31, SEQ ID NO: 41, SEQ ID NO: 39, SEQ ID NO: 64, SEQ ID NO: 70.
14. The method of claim 12, wherein the nucleic acid sequences are selected from SEQ ID NO: 56, SEQ ID NO: 62, SEQ ID NO: 7, SEQ ID NO: 21, SEQ ID NO: 25, SEQ ID NO: 27.
15. The method of claim 12, wherein copy numbers of the nucleic acid sequences are selected from SEQ ID NO: 56, SEQ ID NO: 62, SEQ ID NO: 7, SEQ ID NO: 21, SEQ ID NO: 25, SEQ ID NO: 27.
16. The method of claim 12, wherein copy numbers of the nucleic acid sequences are selected from SEQ ID NO 31, SEQ ID NO: 41, SEQ ID NO: 39, SEQ ID NO: 64, SEQ ID NO: 70.
17. The method of claim 12, wherein the predicted length of survival or the predicted clinical response is based a combination of (a) a decrease in copy numbers of SEQ ID NO:
3 land SEQ ID NO: 41 in cancer cells relative to the copy numbers of SEQ ID NO: 3 land SEQ ID NO: 41 in normal cells; and (b) an increase in copy numbers of SEQ ID NO: 7 and SEQ ID NO: 56 in cancer cells relative to the copy number of SEQ ID NO 7 and SEQ ID NO 56, reflecting a decreased length of survival relative to a length of survival of patients without this pattern of increased and decreased copy number.
18. The method of claim 12, wherein the predicted length of survival or the predicted clinical response is based a combination of (a) a decrease in SEQ ID NO: 25 copy number relative to the SEQ ID NO: 25 copy number in normal cells; and (b) an increase in SEQ ID NO:
64 copy number relative to the SEQ ID NO: 64 copy number in normal cells; reflecting an increased length of survival relative to the length of survival of patients without this pattern of increased and decreased copy number.
19. The method of claim 12, wherein the combination of (a) a decrease in SEQ ID NO: 27 copy number relative to the SEQ ID NO: 27 copy number in normal cells; and (b) an increase in SEQ ID NO: 70 copy number relative to the SEQ ID NO: 70 copy number in normal cells; reflects an increased length of survival relative to length of survival of patients without this pattern of increased and decreased copy number.
20. The method of claim 12, wherein the estimating further comprises evaluating at least one of tumor stage at diagnosis, residual disease after surgery, therapy outcome, or neoplasm status.
21. A method for treating a patient having ovarian serous cystadenocarcinoma (OV), comprising: administering, in a patient having OV, a treatment based on a predicted length of survival or a predicted clinical response to chemotherapy, wherein the predicted length of survival or the predicted response to chemotherapy is determined by:
(1) detecting, in a biological sample from a patient having OV, indicators of differential expression, between cancer cells and normal cells, of at least one of (a) at least two nucleic acid sequences selected from the group consisting of SEQ ID NO: 1, SEQ ID NO: 7, SEQ ID NO: 21, SEQ ID NO: 25, SEQ ID NO: 27, SEQ ID NO: 29 , SEQ ID NO: 31, SEQ ID NO: 41, SEQ ID NO: 47, SEQ ID NO: 56, SEQ ID NO: 64, SEQ ID NO: 70, SEQ ID NO: 81, SEQ ID NO: 96; (b) amino acid sequences encoded by the nucleic acid sequences of (a); or (c) at least two microRNA sequences selected from the group consisting of SEQ ID NO: 51, SEQ ID NO: 60, SEQ ID NO: 61, SEQ ID NO: 78, SEQ ID NO: 79, and SEQ ID NO: 80;
(2) calculating, by a processor, a weighted sum based on the value of the indicators of differential expression; and
(3) estimating, by the processor and based on the weighted sum, a predicted length of survival of the patient or a predicted clinical response to chemotherapy for the patient.
22. The method of claim 21, wherein the indicator of differential expression for the nucleic acid sequences is differential copy numbers in cancer cells relative to in normal cells.
23. The method of claim 21, wherein the amino acid sequences are of proteins selected from SEQ ID NO: 8, SEQ ID NO: 22, SEQ ID NO: 26, SEQ ID NO: 28, SEQ ID NO: 32, SEQ ID NO: 42, SEQ ID NO: 50, SEQ ID NO: 57, SEQ ID NO: 65, SEQ ID NO: 71, and SEQ ID NO: 82, SEQ ID NO: 97; and wherein the indicator of differential expression indicates differential protein expression in cancer cells relative to normal cells.
24. The method of claim 21, wherein the microRNA sequences are selected from the group consisting of SEQ ID NO: 51, SEQ ID NO: 60, SEQ ID NO: 61, SEQ ID NO: 78, SEQ ID NO: 79, and SEQ ID NO: 80.
25. The method of claim 21, wherein the microRNA sequences are selected from the group consisting of SEQ ID NO: 51, SEQ ID NO: 60, SEQ ID NO: 61, SEQ ID NO: 78, SEQ ID NO: 79, and SEQ ID NO: 80; and wherein the indicator of differential expression is differential microRNA expression in cancer cells relative to normal cells.
Priority Applications (1)
| Application Number | Priority Date | Filing Date | Title |
|---|---|---|---|
| US15/566,294 US20180122507A1 (en) | 2015-04-14 | 2016-04-14 | Genetic alterations in ovarian cancer |
Applications Claiming Priority (4)
| Application Number | Priority Date | Filing Date | Title |
|---|---|---|---|
| US201562147545P | 2015-04-14 | 2015-04-14 | |
| US201562147555P | 2015-04-14 | 2015-04-14 | |
| US62/147,555 | 2015-04-14 | ||
| US62/147,545 | 2015-04-14 |
Publications (1)
| Publication Number | Publication Date |
|---|---|
| WO2016168525A1 true WO2016168525A1 (en) | 2016-10-20 |
Family
ID=57125980
Family Applications (2)
| Application Number | Title | Priority Date | Filing Date |
|---|---|---|---|
| PCT/US2016/027642 Ceased WO2016168526A1 (en) | 2015-04-14 | 2016-04-14 | Advanced tensor decompositions for computational assessment and prediction from data |
| PCT/US2016/027641 Ceased WO2016168525A1 (en) | 2015-04-14 | 2016-04-14 | Genetic alterations in ovarian cancer |
Family Applications Before (1)
| Application Number | Title | Priority Date | Filing Date |
|---|---|---|---|
| PCT/US2016/027642 Ceased WO2016168526A1 (en) | 2015-04-14 | 2016-04-14 | Advanced tensor decompositions for computational assessment and prediction from data |
Country Status (2)
| Country | Link |
|---|---|
| US (2) | US20180301223A1 (en) |
| WO (2) | WO2016168526A1 (en) |
Cited By (4)
| Publication number | Priority date | Publication date | Assignee | Title |
|---|---|---|---|---|
| US10202643B2 (en) | 2011-10-31 | 2019-02-12 | University Of Utah Research Foundation | Genetic alterations in glioma |
| WO2019113432A1 (en) * | 2017-12-08 | 2019-06-13 | University Of Washington | Methods and compositions for detecting and promoting cardiolipin remodeling and cardiomyocyte maturation and related methods of treating mitochondrial dysfunction |
| US10555390B2 (en) | 2018-02-28 | 2020-02-04 | Andrew Schuyler | Integrated programmable effect and functional lighting module |
| EP4430235A4 (en) * | 2021-11-09 | 2025-12-03 | Janssen Biotech Inc | Microfluidic cover encapsulation device and system and method for identifying T-cell receptor ligands |
Families Citing this family (14)
| Publication number | Priority date | Publication date | Assignee | Title |
|---|---|---|---|---|
| CN107518898B (en) * | 2017-08-08 | 2020-04-28 | 北京航空航天大学 | Magnetoencephalogram source positioning device based on sensor array decomposition and beam forming |
| US11100417B2 (en) * | 2018-05-08 | 2021-08-24 | International Business Machines Corporation | Simulating quantum circuits on a computer using hierarchical storage |
| CN110138614B (en) * | 2019-05-20 | 2022-02-11 | 湖南友道信息技术有限公司 | Tensor model-based online network flow anomaly detection method and system |
| CN110149228B (en) * | 2019-05-20 | 2021-11-23 | 湖南友道信息技术有限公司 | Top-k elephant flow prediction method and system based on discretization tensor filling |
| US11107100B2 (en) * | 2019-08-09 | 2021-08-31 | International Business Machines Corporation | Distributing computational workload according to tensor optimization |
| WO2021062366A1 (en) * | 2019-09-27 | 2021-04-01 | The Brigham And Women's Hospital, Inc. | Multimodal fusion for diagnosis, prognosis, and therapeutic response prediction |
| US11651261B2 (en) * | 2019-10-29 | 2023-05-16 | The Boeing Company | Hyperdimensional simultaneous belief fusion using tensors |
| WO2022015532A1 (en) * | 2020-07-13 | 2022-01-20 | University Of Pittsburgh-Of The Commonwealth System Of Higher Education | Compositions and methods for detecting gene fusions of rad51ap1 and dyrk4 and for diagnosing and treating cancer |
| CN114507730B (en) * | 2020-11-16 | 2023-01-20 | 武汉艾米森生命科技有限公司 | Application of reagent for detecting gene methylation in cervical cancer diagnosis and kit |
| CN112632028B (en) * | 2020-12-04 | 2021-08-24 | 中牟县职业中等专业学校 | Industrial production element optimization method based on multi-dimensional matrix outer product database configuration |
| GB2605991A (en) * | 2021-04-21 | 2022-10-26 | Zeta Specialist Lighting Ltd | Traffic control at an intersection |
| US20240070534A1 (en) * | 2022-08-23 | 2024-02-29 | Unitedhealth Group Incorporated | Individualized classification thresholds for machine learning models |
| US20250140409A1 (en) * | 2023-10-27 | 2025-05-01 | Imacular Regeneration Llc | Artificial intelligence and bioinformatics system for age-related macular degeneration |
| CN120994743B (en) * | 2025-07-25 | 2026-04-03 | 杭州师范大学 | A digital asset management method and system based on multi-objective optimization |
Citations (4)
| Publication number | Priority date | Publication date | Assignee | Title |
|---|---|---|---|---|
| WO2009153774A2 (en) * | 2008-06-17 | 2009-12-23 | Rosetta Genomics Ltd. | Compositions and methods for prognosis of ovarian cancer |
| WO2013188860A1 (en) * | 2012-06-15 | 2013-12-19 | String Therapeutics | Methods and compositions for personalized medicine by point-of-care devices for fsh, lh, hcg and bnp |
| US20140249762A1 (en) * | 2011-09-09 | 2014-09-04 | University Of Utah Research Foundation | Genomic tensor analysis for medical assessment and prediction |
| WO2015023551A1 (en) * | 2013-08-13 | 2015-02-19 | Bionumerik Pharmaceuticals, Inc. | Administration of karenitecin for the treatment of advanced ovarian cancer, including chemotherapy-resistant and/or the mucinous adenocarcinoma sub-types |
Family Cites Families (5)
| Publication number | Priority date | Publication date | Assignee | Title |
|---|---|---|---|---|
| US6745173B1 (en) * | 2000-06-14 | 2004-06-01 | International Business Machines Corporation | Generating in and exists queries using tensor representations |
| US6249692B1 (en) * | 2000-08-17 | 2001-06-19 | The Research Foundation Of City University Of New York | Method for diagnosis and management of osteoporosis |
| ATE447217T1 (en) * | 2005-08-11 | 2009-11-15 | Koninkl Philips Electronics Nv | RENDERING A VIEW FROM AN IMAGE DATASET |
| US8099381B2 (en) * | 2008-05-28 | 2012-01-17 | Nec Laboratories America, Inc. | Processing high-dimensional data via EM-style iterative algorithm |
| WO2010035163A1 (en) * | 2008-09-29 | 2010-04-01 | Koninklijke Philips Electronics, N.V. | Method for increasing the robustness of computer-aided diagnosis to image processing uncertainties |
-
2016
- 2016-04-14 WO PCT/US2016/027642 patent/WO2016168526A1/en not_active Ceased
- 2016-04-14 US US15/566,298 patent/US20180301223A1/en not_active Abandoned
- 2016-04-14 US US15/566,294 patent/US20180122507A1/en not_active Abandoned
- 2016-04-14 WO PCT/US2016/027641 patent/WO2016168525A1/en not_active Ceased
Patent Citations (4)
| Publication number | Priority date | Publication date | Assignee | Title |
|---|---|---|---|---|
| WO2009153774A2 (en) * | 2008-06-17 | 2009-12-23 | Rosetta Genomics Ltd. | Compositions and methods for prognosis of ovarian cancer |
| US20140249762A1 (en) * | 2011-09-09 | 2014-09-04 | University Of Utah Research Foundation | Genomic tensor analysis for medical assessment and prediction |
| WO2013188860A1 (en) * | 2012-06-15 | 2013-12-19 | String Therapeutics | Methods and compositions for personalized medicine by point-of-care devices for fsh, lh, hcg and bnp |
| WO2015023551A1 (en) * | 2013-08-13 | 2015-02-19 | Bionumerik Pharmaceuticals, Inc. | Administration of karenitecin for the treatment of advanced ovarian cancer, including chemotherapy-resistant and/or the mucinous adenocarcinoma sub-types |
Non-Patent Citations (2)
| Title |
|---|
| COLLINSON ET AL.: "Predicting Response to Bevacizumab in Ovarian Cancer: A Panel of Potential Biomarkers Informing Treatment Selection", CLINICAL CANCER RESEARCH, vol. 19, no. 18, 15 September 2013 (2013-09-15), pages 5227 - 5239, XP055141203 * |
| SANKARANARAYANAN ET AL.: "Tensor GSVD of Patient- and Platform-Matched Tumor and Normal DNA Copy-Number Profiles Uncovers Chromosome Arm-Wide Patterns of Tumor-Exclusive Platform-Consistent Alterations Encoding for Cell Transformation and Predicting Ovarian Cancer Survival", PLOS ONE, vol. 10, no. 4, 15 April 2015 (2015-04-15), pages 1 - 21., XP055208726 * |
Cited By (6)
| Publication number | Priority date | Publication date | Assignee | Title |
|---|---|---|---|---|
| US10202643B2 (en) | 2011-10-31 | 2019-02-12 | University Of Utah Research Foundation | Genetic alterations in glioma |
| WO2019113432A1 (en) * | 2017-12-08 | 2019-06-13 | University Of Washington | Methods and compositions for detecting and promoting cardiolipin remodeling and cardiomyocyte maturation and related methods of treating mitochondrial dysfunction |
| CN111629738A (en) * | 2017-12-08 | 2020-09-04 | 华盛顿大学 | Methods and compositions for detecting and promoting cardiolipin remodeling and cardiomyocyte maturation and related methods for treating mitochondrial dysfunction |
| US10555390B2 (en) | 2018-02-28 | 2020-02-04 | Andrew Schuyler | Integrated programmable effect and functional lighting module |
| US11166353B2 (en) | 2018-02-28 | 2021-11-02 | W Schonbek Llc | Integrated programmable effect and functional lighting module |
| EP4430235A4 (en) * | 2021-11-09 | 2025-12-03 | Janssen Biotech Inc | Microfluidic cover encapsulation device and system and method for identifying T-cell receptor ligands |
Also Published As
| Publication number | Publication date |
|---|---|
| US20180122507A1 (en) | 2018-05-03 |
| WO2016168526A1 (en) | 2016-10-20 |
| US20180301223A1 (en) | 2018-10-18 |
Similar Documents
| Publication | Publication Date | Title |
|---|---|---|
| WO2016168525A1 (en) | Genetic alterations in ovarian cancer | |
| Zhang et al. | Upregulated miR‐1258 regulates cell cycle and inhibits cell proliferation by directly targeting E2F8 in CRC | |
| Wang et al. | MiR-129-5p suppresses gastric cancer cell invasion and proliferation by inhibiting COL1A1 | |
| Salem et al. | The highly expressed 5’isomiR of hsa-miR-140-3p contributes to the tumor-suppressive effects of miR-140 by reducing breast cancer proliferation and migration | |
| Uhlmann et al. | miR-200bc/429 cluster targets PLCγ1 and differentially regulates proliferation and EGF-driven invasion than miR-200a/141 in breast cancer | |
| Wu et al. | 2′-OMe-phosphorodithioate-modified siRNAs show increased loading into the RISC complex and enhanced anti-tumour activity | |
| Duan et al. | Tumor suppressor miR-24 restrains gastric cancer progression by downregulating RegIV | |
| Arai et al. | Regulation of spindle and kinetochore‐associated protein 1 by antitumor miR‐10a‐5p in renal cell carcinoma | |
| Wang et al. | Human tumor microRNA signatures derived from large‐scale oligonucleotide microarray datasets | |
| He et al. | MiR-30a-5p suppresses cell growth and enhances apoptosis of hepatocellular carcinoma cells via targeting AEG-1 | |
| US20200056177A1 (en) | Long non-coding rna used for anticancer therapy | |
| Wang et al. | MicroRNA-320c inhibits tumorous behaviors of bladder cancer by targeting Cyclin-dependent kinase 6 | |
| Wu et al. | Long non‐coding RNA SNHG6 promotes cell proliferation and migration through sponging miR‐4465 in ovarian clear cell carcinoma | |
| Zhan et al. | MicroRNA-548j functions as a metastasis promoter in human breast cancer by targeting Tensin1 | |
| Liu et al. | Mucin glycosylating enzyme GALNT2 suppresses malignancy in gastric adenocarcinoma by reducing MET phosphorylation | |
| Li et al. | The long noncoding RNA ZFAS1 promotes the progression of glioma by regulating the miR‐150‐5p/PLP2 axis | |
| He et al. | Long noncoding RNA ABHD11‐AS1 promote cells proliferation and invasion of colorectal cancer via regulating the miR‐1254‐WNT11 pathway | |
| Xiao et al. | Therapeutic targeting of noncoding RNAs in hepatocellular carcinoma: Recent progress and future prospects | |
| US20140154303A1 (en) | Treating cancer by inhibiting expression of olfm4, sp5, tob1, arid1a, fbn1 or hat1 | |
| Sui et al. | Retracted: The lncRNA SNHG3 accelerates papillary thyroid carcinoma progression via the miR‐214‐3p/PSMD10 axis | |
| Zhang et al. | LncRNA WDFY3‐AS2 suppresses proliferation and invasion in oesophageal squamous cell carcinoma by regulating miR‐2355‐5p/SOCS2 axis | |
| Wang et al. | A novel long noncoding RNA, LOC440173, promotes the progression of esophageal squamous cell carcinoma by modulating the miR‐30d‐5p/HDAC9 axis and the epithelial–mesenchymal transition | |
| Chen et al. | miR-548d-3p inhibits osteosarcoma by downregulating KRAS | |
| Wang et al. | N4‐Acetylcytidine‐Mediated CD2BP2‐DT Drives YBX1 Phase Separation to Stabilize CDK1 and Promote Breast Cancer Progression | |
| WO2011059752A1 (en) | Methods and compositions for anti-egfr treatment |
Legal Events
| Date | Code | Title | Description |
|---|---|---|---|
| 121 | Ep: the epo has been informed by wipo that ep was designated in this application |
Ref document number: 16780791 Country of ref document: EP Kind code of ref document: A1 |
|
| NENP | Non-entry into the national phase |
Ref country code: DE |
|
| 122 | Ep: pct application non-entry in european phase |
Ref document number: 16780791 Country of ref document: EP Kind code of ref document: A1 |