WO2016127035A1 - Methods of detecting osteoarthritis and predicting progression thereof - Google Patents
Methods of detecting osteoarthritis and predicting progression thereof Download PDFInfo
- Publication number
- WO2016127035A1 WO2016127035A1 PCT/US2016/016736 US2016016736W WO2016127035A1 WO 2016127035 A1 WO2016127035 A1 WO 2016127035A1 US 2016016736 W US2016016736 W US 2016016736W WO 2016127035 A1 WO2016127035 A1 WO 2016127035A1
- Authority
- WO
- WIPO (PCT)
- Prior art keywords
- knee
- pheno
- person
- biomarkers
- biomarker
- Prior art date
- Legal status (The legal status is an assumption and is not a legal conclusion. Google has not performed a legal analysis and makes no representation as to the accuracy of the status listed.)
- Ceased
Links
Classifications
-
- C—CHEMISTRY; METALLURGY
- C12—BIOCHEMISTRY; BEER; SPIRITS; WINE; VINEGAR; MICROBIOLOGY; ENZYMOLOGY; MUTATION OR GENETIC ENGINEERING
- C12Q—MEASURING OR TESTING PROCESSES INVOLVING ENZYMES, NUCLEIC ACIDS OR MICROORGANISMS; COMPOSITIONS OR TEST PAPERS THEREFOR; PROCESSES OF PREPARING SUCH COMPOSITIONS; CONDITION-RESPONSIVE CONTROL IN MICROBIOLOGICAL OR ENZYMOLOGICAL PROCESSES
- C12Q1/00—Measuring or testing processes involving enzymes, nucleic acids or microorganisms; Compositions therefor; Processes of preparing such compositions
- C12Q1/68—Measuring or testing processes involving enzymes, nucleic acids or microorganisms; Compositions therefor; Processes of preparing such compositions involving nucleic acids
- C12Q1/6876—Nucleic acid products used in the analysis of nucleic acids, e.g. primers or probes
- C12Q1/6883—Nucleic acid products used in the analysis of nucleic acids, e.g. primers or probes for diseases caused by alterations of genetic material
-
- G—PHYSICS
- G01—MEASURING; TESTING
- G01N—INVESTIGATING OR ANALYSING MATERIALS BY DETERMINING THEIR CHEMICAL OR PHYSICAL PROPERTIES
- G01N33/00—Investigating or analysing materials by specific methods not covered by groups G01N1/00 - G01N31/00
- G01N33/48—Biological material, e.g. blood, urine; Haemocytometers
- G01N33/50—Chemical analysis of biological material, e.g. blood, urine; Testing involving biospecific ligand binding methods; Immunological testing
- G01N33/68—Chemical analysis of biological material, e.g. blood, urine; Testing involving biospecific ligand binding methods; Immunological testing involving proteins, peptides or amino acids
- G01N33/6893—Chemical analysis of biological material, e.g. blood, urine; Testing involving biospecific ligand binding methods; Immunological testing involving proteins, peptides or amino acids related to diseases not provided for elsewhere
-
- A—HUMAN NECESSITIES
- A61—MEDICAL OR VETERINARY SCIENCE; HYGIENE
- A61P—SPECIFIC THERAPEUTIC ACTIVITY OF CHEMICAL COMPOUNDS OR MEDICINAL PREPARATIONS
- A61P19/00—Drugs for skeletal disorders
- A61P19/02—Drugs for skeletal disorders for joint disorders, e.g. arthritis, arthrosis
-
- G—PHYSICS
- G01—MEASURING; TESTING
- G01N—INVESTIGATING OR ANALYSING MATERIALS BY DETERMINING THEIR CHEMICAL OR PHYSICAL PROPERTIES
- G01N33/00—Investigating or analysing materials by specific methods not covered by groups G01N1/00 - G01N31/00
- G01N33/48—Biological material, e.g. blood, urine; Haemocytometers
- G01N33/50—Chemical analysis of biological material, e.g. blood, urine; Testing involving biospecific ligand binding methods; Immunological testing
- G01N33/68—Chemical analysis of biological material, e.g. blood, urine; Testing involving biospecific ligand binding methods; Immunological testing involving proteins, peptides or amino acids
- G01N33/6803—General methods of protein analysis not limited to specific proteins or families of proteins
- G01N33/6848—Methods of protein analysis involving mass spectrometry
-
- C—CHEMISTRY; METALLURGY
- C12—BIOCHEMISTRY; BEER; SPIRITS; WINE; VINEGAR; MICROBIOLOGY; ENZYMOLOGY; MUTATION OR GENETIC ENGINEERING
- C12Q—MEASURING OR TESTING PROCESSES INVOLVING ENZYMES, NUCLEIC ACIDS OR MICROORGANISMS; COMPOSITIONS OR TEST PAPERS THEREFOR; PROCESSES OF PREPARING SUCH COMPOSITIONS; CONDITION-RESPONSIVE CONTROL IN MICROBIOLOGICAL OR ENZYMOLOGICAL PROCESSES
- C12Q2600/00—Oligonucleotides characterized by their use
- C12Q2600/158—Expression markers
-
- G—PHYSICS
- G01—MEASURING; TESTING
- G01N—INVESTIGATING OR ANALYSING MATERIALS BY DETERMINING THEIR CHEMICAL OR PHYSICAL PROPERTIES
- G01N2800/00—Detection or diagnosis of diseases
- G01N2800/10—Musculoskeletal or connective tissue disorders
- G01N2800/105—Osteoarthritis, e.g. cartilage alteration, hypertrophy of bone
-
- G—PHYSICS
- G01—MEASURING; TESTING
- G01N—INVESTIGATING OR ANALYSING MATERIALS BY DETERMINING THEIR CHEMICAL OR PHYSICAL PROPERTIES
- G01N2800/00—Detection or diagnosis of diseases
- G01N2800/50—Determining the risk of developing a disease
-
- G—PHYSICS
- G01—MEASURING; TESTING
- G01N—INVESTIGATING OR ANALYSING MATERIALS BY DETERMINING THEIR CHEMICAL OR PHYSICAL PROPERTIES
- G01N2800/00—Detection or diagnosis of diseases
- G01N2800/56—Staging of a disease; Further complications associated with the disease
-
- G—PHYSICS
- G01—MEASURING; TESTING
- G01N—INVESTIGATING OR ANALYSING MATERIALS BY DETERMINING THEIR CHEMICAL OR PHYSICAL PROPERTIES
- G01N2800/00—Detection or diagnosis of diseases
- G01N2800/60—Complex ways of combining multiple protein biomarkers for diagnosis
Definitions
- Osteoarthritis is a prevalent chronic disease that represents a large and growing global health burden of large unmet need with respect to diagnostics, prognostics and therapeutics.
- musculoskeletal conditions are the second greatest cause of disability, as measured by years lived with disability (YLDs) worldwide and across most regions of the world; the main contributors are low back pain (83.1 million YLDs), neck pain (33.6 million YLDs) and osteoarthritis (17.1 million YLDs) with osteoarthritis of the knee accounting for 83% of this total.
- YLDs disability
- neck pain 33.6 million YLDs
- osteoarthritis (17.1 million YLDs) with osteoarthritis of the knee accounting for 83% of this total.
- osteoarthritis of the knee affects 251 million individuals, and back and neck pain (likely largely also attributable to osteoarthritis) currently affect 964 million people worldwide.
- osteoarthritis affects an estimated 26.9 million US adults (estimates from 2005, up 28% from the estimated 21 million US adults impacted in 1990). As the US population continues to age and struggle with obesity, the incidence and prevalence of the disease is expected to continue to grow. Consequently, the annual cost of osteoarthritis to the US, estimated to be $89.1 billion in 2001, is anticipated to continue to grow.
- Demographics and baseline characteristics are poor predictors of OA progression including age, sex, body mass index, knee pain, general bone mineral content, and joint space width at baseline.
- OA OA
- knee pain has been reported to have only a 23% sensitivity and 88% specificity for the diagnosis of radiographic OA. Hart et al., Ann Rheum Dis 50(7):467-70 (1991).
- Bedson et al concluded that, "The results of knee x-rays should not be used in isolation when assessing individual patients with knee pain.” Bedson J and Croft PR, BMC Musculoskelet Disord 9: 116 (2008). Our goal was to develop a better means of diagnosing and predicting progression of knee osteoarthritis.
- Methods of diagnosis and predicting progression of osteoarthritis, and in particular knee osteoarthritis are provided herein.
- methods of diagnosing osteoarthritis by measuring biomarkers are provided. The methods include measuring the level of a biomarker in a sample from the subject.
- the biomarker may be at least one biomarker selected from the group consisting of CRAC1 (CRTAC1), A2AP, A1BG, A2GL, AACT, ACTG, AMBP, APOB, APOE, B2MG, C1QC, C1R, C1RL, C4BPA, C4BPB, CD14, CD44, CERU, CFAB, CFAH, CFAI, CILP1, CIS, CNDP1, C02, C04B, C05, C06A3, C08B, C08G, C09, coll3, COMP, CTXla, CTXlb, CTX2, CTXi, CXCL7, ECM1, FA12, FA5, FBLN1, FBLN3, FCGBP, FCN3, FETUA, FINC, GELS, HA, HABP2, haptoglobin, HEMO, HEP2, HGFA, HRG, hyaluronan, IC1, ITIH1, ITIH4, KNGl, LAMA2,
- the levels of the biomarker in the subject are then compared to the levels of the biomarker in a control subject or a reference level of the biomarker.
- the subject can then be diagnosed with osteoarthritis if the expression of any of the biomarkers is altered as compared to the reference level.
- the biomarker may be at least one biomarker selected from the group consisting of A1BG, A2AP, A2GL, AACT, ACTG, AFAM, ANT3, APOB, APOH, B2MG, C1QC, C1R, C1RL, C4BPA, C4BPB, CD14, CD163, CD44, CERU, CFAB, CFAH, CFAI, CIS, C02, C04B, C05, C06A3, C08B, coll3, CRAC1 (CRTAC1), CTX2, CXCL7, DOPO, ECM1, FA5, FA12, FBLN1, FCGBP, FCN3, FETUA, FINC, GELS, HABP2, haptoglobin, HEMO, HEP2, HGFA, HRG, hyaluronan, ITIH4, KLKB l, K
- the level of the biomarker in the sample is compared to a reference level of the biomarker. The comparison is then used to predict the progression of the osteoarthritis. A significant alteration in the level of any of the biomarkers as compared to the reference level is predictive of progression of osteoarthritis or indicative of risk of osteoarthritis progression.
- Figure 1 is a flow chart showing how the biomarkers could be used to assist in diagnosing and predicting the progression of knee osteoarthritis and how this would be translated into a treatment plan.
- Figure 2 is a dot plot showing the coefficients of variation for each of the tested peptides and those colored blue and clustering near the log based line were included for further analysis and those in red were not included in the dataset.
- Methods of diagnosing or predicting progression of osteoarthritis in a subject are provided. The methods all rely on detecting or determining the level of at least one biomarker or combinations of biomarkers in a sample from a subject.
- the subject has knee pain or has already been diagnosed with knee osteoarthritis.
- the subject may also be diagnosed with, or suspected of having osteoarthritis in another joint other than the knee, such as the hip, back, hand, elbow, shoulder, neck or other joint in the subject.
- the subject is a human, but subjects may include other non-human mammals such as domesticated animals.
- the present methods permit the diagnosis and personalization of therapy or a treatment plan, wherein a subject's biomarker profile is predictive of, or indicative of, a diagnosis of osteoarthritis or risk of progression of osteoarthritis.
- the methods disclosed herein related to osteoarthritis can be used in combination with assessment of conventional clinical factors or measures, such as age, sex, body mass index or radiographic parameters; this is analogous to the practice for diagnosis or prognosis of rheumatoid arthritis by measuring rheumatoid factor and/or anti-cyclic citrullinated peptide and considering them in conjunction with morning stiffness, joint swelling and/or radiographic features of joint disease, etc.
- the methods of the present disclosure permit a more accurate evaluation of osteoarthritis both at the level of diagnosis and of prognosis of progression of the disease.
- the method includes determining the levels of the biomarkers provided herein in Table 2a in a sample from a subject diagnosed with or suspected of having osteoarthritis.
- Biomarker levels in some instances may be normalized against the levels of all proteins in the sample, or against a reference or normalization protein(s) in the sample as discussed and exemplified in the Examples.
- the following set of peptides may be used as normalization peptides in the methods provided herein: TSP1, CNDP1, FA5, SHBG, PLF4, C1QC, ADIPO, APOA4, ACTG, CD14, K2C1, CBG, CHLE, FA11 or any combinations thereof.
- the level of the biomarkers is indicative of the prognosis for the progression of osteoarthritis in the subject or may be used for the diagnosis of osteoarthritis and may be used to develop a treatment plan or determine the effectiveness of a particular treatment.
- the methods disclosed herein further comprise measuring the level of at least one normalization peptide from a protein selected from TSP1, CNDP1, FA5, SHBG, PLF4, C1QC, ADIPO, APOA4, ACTG, CD14, K2C1, CBG, CHLE, FA11 or any combination thereof in a sample from a subject and normalizing the level of the biomarker in the sample from the subject and the reference level of the biomarker to the level of the normalization peptide in the sample and the reference prior to comparing the level of the biomarker in the sample to the reference level of the biomarker.
- the normalization peptide comprises at least one of the sequences of Tables 12 or 13.
- the early stages of osteoarthritis are characterized by pain in the affected joint and changes to the cartilage that lines the ends of the bones and cushions the joints.
- the changes may include thinning of the cartilage layer.
- Usually the pain in the early stages is well-managed with rest and topical or non-prescription ingestible anti-inflammatory pharmaceutical agents.
- Moderate osteoarthritis often involves pain with standing as well as when moving and may show bone thickening along joint margins.
- Treatment involves increased use of anti-inflammatory and anti-pain medications including NSAIDS and steroids. Progression to later stages may restrict the ability of the affected subject to move and to work and may require treatment with stronger pain medications such as opioids, injectable corticosteroids, lubrication injections, physical therapy and joint replacement surgery. Identifying patients likely to progress to a more severe form of the disease would aid medical professionals in determining the appropriate treatment options for individuals with osteoarthritis earlier in the disease course, before disability occurs and when the disease is more likely to be favorably impacted by treatment.
- the methods of the present disclosure can also be used to assist in selecting appropriate courses of treatment and to identify patients that would benefit from a particular course of therapy.
- the treatment plan on the left can be pursued which is non-invasive and includes non-pharmacologic therapy. If instead the subject is determined to be likely to have progressive osteoarthritis, then more aggressive treatment options can be pursued including injections or treatment with pharmaceuticals and surgery.
- the levels of the particular biomarkers described herein provide insight into which treatment regimens will be most effective for the subject. This information can be used to generate treatment plans for the subject to prolong an active, pain-free lifestyle and minimize side effects, adverse reactions or therapy related toxicity.
- Treatment plans may be developed as shown in Figure 1 using the predictions of the likelihood of progression of osteoarthritis.
- Methods of monitoring a treatment plan are also provided. The methods may be performed on a recurring basis in order to determine whether a particular treatment plan is effective in reducing and maintaining reduction of at least one symptom of osteoarthritis.
- the methods of the present disclosure may further include administering an anti-inflammatory or anti-pain therapeutic to the subject if the subject is diagnosed with osteoarthritis or predicted to have non-progressive or progressive disease.
- Suitable anti-inflammatory therapeutics are known to those skilled in the art and may include, without limitation, nonsteroidal anti-inflammatory drugs (NSAIDs), disease-modifying osteoarthritis drugs (DMOADs), disease-modifying antirheumatic drugs (DMARDs), corticosteroids, and hyaluronans.
- DMARDs may be used in accordance with the present invention including, but not limited to, traditional DMARDs such as methotrexate, hydroxycholorquine, sulfasalazine, leflunomide, cyclophosphamide and azathioprine; biologies such as anti-IL-1 therapeutics, anti-TNF therapeutics, metalloproteinase inhibitors, p38 inhibitors, abatacept, adalimumab, anakinra, certolizumab pegol, etanercept, infliximab, golimumab and rituximab; and JAK inhibitors such as Tofacitinib.
- traditional DMARDs such as methotrexate, hydroxycholorquine, sulfasalazine, leflunomide, cyclophosphamide and azathioprine
- biologies such as anti-IL-1 therapeutics, anti-TNF therapeutics
- Suitable anti-pain therapeutics include, without limitation, non-opioid analgesics (e.g., acetaminophen), nonsteroidal anti-inflammatory drugs (NSAIDs), opioid analgesics, and co-analgesics and most likely in future, nerve growth factor inhibitors.
- Subjects having stable or non-progressive disease may be treated with topical or ingestible pain or anti-inflammatory medications.
- Subjects identified as having progressive destructive or aggressive disease likely to lead to joint destruction may be referred for injectable lubricant or biologic agent procedures, stronger pain medications such as opioids, bone-acting agents such as calcitonin, bisphosphonat.es and hormonal therapies, physical therapy, arthroscopic surgery, osteotomy, fibulectomy or joint replacement surgery.
- the methods of treating osteoarthritis may include administering a therapeutically effective amount of an antiinflammatory or anti-pain therapeutic to the subject provided that the levels of at least one of the biomarkers listed in Table 2A in a sample from the subject was determined to be modified (increased or decreased) as compared to the reference level as shown in Table 2A or greater than/less than the threshold values reported in Table 2A, 2C or 2D to diagnose osteoarthritis or indicate the subject's disease is likely to progress.
- the age, gender and/or body mass index of the subject are also used in making the prediction of progression or diagnosis.
- diagnostic and prognostic performance of the biomarkers and/or other clinical parameters such as demographics including sex, age, BMI and cohort were assessed utilizing logistic regression to compute p-values and confidence intervals. These statistics were then used to calculate a Benjamini-Hochberg FDR threshold. A biomarker was considered a significant biomarker if the FDR passed 10%. Knee-level analysis required a paired evaluation and the generalized estimating equation method was used to account for the correlation structure and the significance of the biomarker was assessed by a Wald statistic. The statistical analysis used is described in the Examples section. Methods for assessing statistical significance are well known in the art and thus other methods may be used. In some aspects of the invention, a p-value of less than 0.05 constitutes statistical significance.
- the term “subject” and “patient” are used interchangeably and refer to both human and non-human animals.
- the term “non-human animals” as used in the disclosure includes all vertebrates, e.g., mammals and non-mammals, such as non-human primates, sheep, dog, cat, horse, cow, chickens, rodents, guinea pigs, amphibians, reptiles, and the like.
- the subject is a human patient.
- the subject may be a human patient with knee pain or already diagnosed with or suspected of having osteoarthritis.
- the biomarkers of the present disclosure include proteins and genes encoding the proteins.
- the biomarkers analyzed are provided in Table 2B along with an indication of the commonly used abbreviations for each marker.
- Such biomarkers include the entire protein or peptide portions of the protein. As shown in the Examples, peptides from each of these proteins were identified as useful in the methods provided herein.
- the biomarker peptides used in the examples are shown in Table 2A. These biomarkers may be used alone in the methods or in combinations as described below.
- Fragments and genetic variants of biomarkers are also encompassed by the present invention.
- “Fragment” is intended to include a portion of the amino acid sequence and hence a portion of the protein encoded thereby.
- a fragment or a biomarker peptide will generally encode at least 7, 8, 9, 10, 12, 15, 17, 20, 22, 25, 30 or more contiguous amino acids, or up to the total number of amino acids present in a full-length biomarker.
- “Variant” is intended to mean substantially similar sequences. Generally, variants of a particular biomarker of the invention will have at least about 80%, 85%, 90%, 91%, 92%, 93%, 94%, 95%, 96%, 97%, 98%, 99% or more amino acid identity to that biomarker as determined by amino acid alignment programs.
- a “biomarker” is a protein or glycan whose level in a sample is altered compared to that of a normal or healthy sample or is indicative of a condition.
- the biomarkers disclosed herein are proteins or glycans whose levels correlate with osteoarthritis and can be used to predict the progression of the disease as well as diagnose the disease.
- the methods for predicting progression of or diagnosing osteoarthritis in a subject include collecting a patient body sample.
- the sample may or may not include cells.
- the methods described herein may be performed without requiring a tissue sample or biopsy.
- Sample is intended to include any sampling of cells, tissues, or bodily fluids in which a level of a biomarker can be detected. Examples of such samples include, but are not limited to, blood, serum, urine, synovial fluid, saliva, or any other bodily secretion or derivative thereof.
- Blood can include whole blood, plasma (citrate, EDTA, heparin), serum, or any derivative of blood. Samples may be obtained from a patient by a variety of techniques available to those skilled in the art.
- the sample is serum, plasma, urine, or synovial fluid.
- the sample is serum depleted of at least 7 major serum proteins.
- the serum proteins depleted are selected from the group consisting of albumin, IgG, IgA, transferrin, haptoglobin, anti-trypsin, fibrinogen, alpha 2-macroglobulin, IgM, apolipoprotein AI, apolipoprotein All, complement C3, and transthyretin. Any methods available in the art for detecting the level of biomarkers are encompassed herein.
- the level of a biomarker of the invention can be detected using a peptide corresponding to the biomarker.
- Measureasuring an expression level of is intended to mean determining the quantity or presence of a biomarker (i.e., peptide) in a sample for at least one of the biomarkers of Table 2a.
- “measuring an expression level of encompasses instances where a biomarker is determined not to be detectable due to failure to be produced, or due to production below the detection limit of the assay; “measuring an expression level of also encompasses low, normal and high levels of detection. Measuring an expression level also includes instances where a marker is degraded or is more stable in a person with osteoarthritis or with progressive disease and is not limited to production of new peptide or the timing of peptide production.
- biomarkers are known to those of skill in the art and include, but are not limited to, ELISA, immunofluorescence, FACS analysis, Western blot, magnetic immunoassays, mass spectroscopy, gel electrophoresis, antibody-based microarrays and non-antibody-based microarrays or combinations of these methods.
- ELISA immunofluorescence
- FACS analysis Western blot
- magnetic immunoassays magnetic immunoassays
- mass spectroscopy gel electrophoresis
- antibody-based microarrays and non-antibody-based microarrays or combinations of these methods.
- the biomarker is measured using an antibody- based capture method.
- the biomarker is measured using mass spectrometry.
- Luminex bead-based systems are the most established, being used to detect circulating cytokines and growth factors in both mice and humans. This method is based on the use of microparticles that have been pre-coated with specific antibodies. These particles are then mixed with sample and the captured analytes are detected using specific secondary antibodies. This allows for up to 100 different analytes to be measured simultaneously in a single microplate well.
- the advantages of this flow cytometry- based method compared to traditional ELISA assays are in the conservation of patient samples as well as significant savings in terms of cost and labor.
- An alternative, plate-based system is produced by Meso Scale Discovery (MSD).
- This system utilizes its proprietary Multi- Array® and Multi-Spot® microplates with electrodes directly integrated into the plates. This enables the MSD system to have ultra-sensitive detection limits, high specificity, large dynamic range, and low background signal.
- Another plate-based multiplex system is the Searchlight Plus CCD Imaging System produced by Aushon Biosystems. This novel multiplexing technology allows for the measurement of up to 16 different analytes simultaneously in a single microplate well.
- the assay design is similar to a sandwich ELISA where the capture antibodies are pre-spotted into individual wells of a 96-well plate. Samples or standards are added which bind to the specific capture antibodies and are detected using Aushon' s patented SuperSignal ELISA Femto Chemiluminescent Substrate.
- SomaLogic which is a bead-based technology for multiplex quantification of proteins or protein fragments.
- probe refers to any molecule that is capable of selectively binding to a specifically intended target biomolecule, for example, a protein encoded by or corresponding to a biomarker. Probes can be synthesized by one of skill in the art, or derived from appropriate biological preparations. Probes may be specifically designed to be labeled. Examples of molecules that can be utilized as probes include, but are not limited to, RNA, DNA, proteins, antibodies, and organic molecules. Detectable labels include, but are not limited to, any heterologous addition to the probe that can be used to detect the selectively bound probe.
- detectable labels include fluorescent and radiological labels as well as labels that can be detected because they have a specific binding partner (ligand/receptor interaction) such as biotin/avidin or a nucleic acid tag that may act as a barcode to bind and specifically identify a larger nucleic acid.
- ligand/receptor interaction such as biotin/avidin or a nucleic acid tag that may act as a barcode to bind and specifically identify a larger nucleic acid.
- predicting progression or "a prediction of progression” refers to providing a probability-based analysis of risk for osteoarthritis progression in a particular subject.
- the prediction of progression of osteoarthritis is not a guarantee or absolute, only a statistically probable indication of the disease state of the subject.
- prediction of a "diagnosis” or “diagnosing” of osteoarthritis refers to providing a probability-based analysis of an osteoarthritis diagnosis in a particular subject.
- the prediction of a diagnosis of osteoarthritis is not a guarantee or absolute, only a statistically probable indication of the disease state of the subject.
- the level of the biomarker in the sample from the subject is compared to a reference level of the biomarker.
- the reference level may be determined empirically such as illustrated in the Examples, by comparison to the levels found in a set of samples from subjects with known clinical outcomes or known to have or not have osteoarthritis.
- the reference level may be a level of the biomarker found in samples, such as serum samples, which becomes a standard and can be used as a predictor for new samples.
- the level of the biomarker in the sample from the subject may be increased or decreased (i.e., "altered") as compared to the reference level.
- the Examples and Tables provide information regarding how each biomarker is altered to indicate a diagnosis or to predict progression.
- the predictive methods described herein may be combined to provide increased significance of the results, i.e. increased AUCs.
- the levels of multiple markers may be determined in a sample from the subject and the results may have additional statistical or predictive power via the combination.
- the levels may be compared to the reference levels and a diagnosis or a prediction of risk of progression made.
- any combination of 2, 3, 4, 5, 6, 7, 8, 9, 10 or more of the biomarkers may provide a prediction with increased accuracy and thus be beneficial.
- the invention relates to a method of diagnosing osteoarthritis comprising measuring an expression level of at least one biomarker selected from the group consisting of CRAC1 (CRTAC1), A2AP, A1BG, A2GL, AACT, ACTG, AMBP, APOB, APOE, B2MG, C1QC, C1R, C1RL, C4BPA, C4BPB, CD14, CD44, CERU, CFAB, CFAH, CFAI, CILP1, CIS, CNDP1, C02, C04B, C05, C06A3, C08B, C08G, C09, coll3, COMP, CTXla, CTXlb, CTX2, CTXi, CXCL7, ECM1, FA12, FA5, FBLN1, FBLN3, FCGBP, FCN3, FETUA, FINC, GELS, HA, HABP2, haptoglobin, HEMO, HEP2, HGFA, HRG, hyaluron
- the biomarker is a combination of at least two of CRAC1, COMP, C06A3, SHBG, PCOC1, C08G, LUM, ACTG, C05, A2AP, C02, FA5, CERU, KNG1, HPLNl, CD14, CERU, CTXla, CTXlb, VTNC, ZPI and haptoglobin and the diagnosis of osteoarthritis includes the presence of an osteophyte or a bone anabolic response.
- a combination of all the listed biomarkers or only two, three, four, five, six, seven, eight, nine, ten or more may also be used.
- the biomarker is a combination of at least one of CRAC1, CXCL7, C4BPA, COMP, LUM, C05, TIMP1, C4BPA, PCOC1, A2AP, C02, FA5, HRG, C06A3, VTDB, KNG1, HPLN1, CD14, CERU, CTXla, CTXlb, PLF4, TETN, TSP1, PHLD, C4BPB, CFAI, SAMP, C08B, ECM1, TSP4, CILP, APOE, IHA, CTX2, CTXi, hyaluronan and haptoglobin and the diagnosis of osteoarthritis includes the presence of worsening joint space narrowing indicative of cartilage or meniscal abnormality.
- the biomarker is a combination of at least one of CRAC1, SHBG, COMP, C08G, PCOC1, C06A3, LUM, C05, A2AP, C02, FA5, FBLN3, VTDB, KNG1, HPLN1, CD14, CERU, CTXla, CTXlb, CTX2, CTXi, CFAH, TSP4 and haptoglobin and the diagnosis of osteoarthritis includes the progression of the Kellgren-Lawrence (KL) grade where progression is defined by a joint KL grade/score increasing to indicate a higher, i.e.
- KL Kellgren-Lawrence
- the biomarker includes CRAC1, KNG1 and/or haptoglobin for diagnosis of osteoarthritis.
- the biomarkers measured comprise at least two biomarkers selected from the group consisting of CRAC1 (CRTAC1), CXCL7, C08G, ACTG, CD44, CERU, CFAH, CFAI, C06A3, C08G, COMP, FINC, HRG, KNG1, PLF4, PRG4, SAMP, TSP4, and any combination thereof.
- CRAC1 CRT AC 1
- CXCL7 CXCL7
- C08G C08G
- CRAC1 CXCL7
- C08G CRAC1
- CXCL7 C08G
- C08G CRAC1
- CXCL7 C08G
- the biomarkers measured comprise at least two biomarkers selected from the group consisting of CRAC1 (CRTAC1), A2AP, ACTG, APOE, C1QC, C4BPB, CD14, CFAI, C05, C06A3, C08G, coll3, CXCL7, FA5, FCGBP, FINC, GELS, HA, HEMO, KNG1, PCOC1, TENX, VTDB, or any combination thereof.
- CRAC1 CRAC1
- A2AP ACTG
- APOE ACTG
- C1QC C4BPB
- CD14 CD14
- CFAI C05, C06A3, C08G
- the biomarkers measured comprise at least two biomarkers selected from the group consisting of CRAC1 (CRTAC1), A2AP, ACTG, APOE, CIQC, C4BPB, CFAI, C05, C06A3, C08G, CXCL7, FA5, FCGBP, FINC, GELS, PCOCl, TENX, or any combination thereof.
- the biomarkers measured comprise CRAC1 (CRTAC1), A2AP, ACTG, APOE, CIQC, C4BPB, CFAI, C05, C06A3, C08G, CXCL7, FA5, FCGBP, FINC, GELS, PCOCl, and TENX.
- the biomarkers measured comprise at least two biomarkers selected from the group consisting of CD14, coll3, HA, HEMO, KNG1, VTDB or any combination thereof. In some embodiments, the biomarkers measured comprise at least two biomarkers selected from the group consisting of CRAC1 (CRTAC1), COMP, C06A3, C08G, CXCL7, or any combination thereof. In some embodiments, the biomarkers measured comprise CRAC1 (CRTAC1), COMP, C06A3, C08G, and CXCL7.
- the biomarkers measured comprise at least two biomarkers selected from the group consisting of CRAC1 (CRTAC1), CXCL7, C4BPA, COMP, LUM, C05, TIMPl, or any combination thereof.
- the biomarkers measured comprise CRAC1 (CRTAC1) and CXCL7.
- the biomarkers measured further comprise C4BPA and/or COMP.
- the biomarkers measured further comprise LUM, C05, and/or TIMPl.
- the biomarkers measured comprise at least two biomarkers selected from the group consisting of CRAC1 (CRTAC1), SHBG, COMP, C08G, PCOCl, C06A3, LUM, or any combination thereof.
- the biomarkers measured comprise CRAC1 (CRT AC 1) and SHBG.
- the biomarkers measured further comprise COMP and/or C08G.
- the biomarkers measured further comprise PCOCl, C06A3, and/or LUM.
- the biomarkers measured comprise CRAC1 (CRTAC1) and COMP.
- the biomarkers measured further comprise C06A3 and/or SHBG.
- the biomarkers measured comprise at least two biomarkers selected from the group consisting of CRAC1 (CRTAC1), C4BPA, LUM, C05, PCOCl, CXCL7, COMP, or any combination thereof.
- the biomarkers measured comprise CRAC1 (CRTAC1) and CXCL7.
- the biomarkers measured further comprise C4BPA and/or LUM.
- the biomarkers measured further comprise C05, PCOCl, and/or COMP.
- the biomarkers measured comprise at least two biomarkers selected from the group consisting of CRACl (CRTACl), PCOC1, C08G, LUM, COMP, C06A3, C05, ACTG or any combination thereof.
- the biomarkers measured comprise CRACl (CRTACl) and PCOC1.
- the biomarkers measured further comprise COMP and/or C08G.
- the biomarkers measured further comprise LUM, C06A3, and/or C05.
- the biomarkers measured comprise CRACl (CRTACl) and COMP.
- the biomarkers measured further comprise C06A3 and/or PCOC1.
- the biomarkers measured comprise C08G, ACTG, and/or C05.
- the biomarkers measured comprise at least two biomarkers selected from the group consisting of A2AP, C02, COMP, FA5, C05, CRACl (CRTACl), SHBG, or any combination thereof.
- the biomarkers measured comprise A2AP and C02.
- the biomarkers measured further comprise COMP and/or FA5.
- the biomarkers measured further comprise C05, CRACl (CRTACl), and/or SHBG.
- the biomarkers measured comprise at least two biomarkers selected from the group consisting of A2AP, FA5, C02, C05, COMP, SHBG, C06A3, or any combination thereof. In some embodiments, the biomarkers measured comprise A2AP and FA5. In further such embodiments, the biomarkers measured further comprise C05 and/or C02. In still further such embodiments, the biomarkers measured further comprise COMP, SHBG, and/or C06A3. In some embodiments, the biomarkers measured comprise at least two biomarkers selected from the group consisting of A2AP, CRACl (CRTACl), C02, COMP, FA5, C05, or any combination thereof. In some embodiments, the biomarkers measured comprise A2AP and C02.
- the biomarkers measured further comprise COMP and/or CRACl (CRTACl).
- the biomarkers measured comprise A2AP, CRACl (CRTACl), and C02.
- the biomarkers measured further comprise FA5.
- the biomarkers measured further comprise COMP and/or C05.
- the biomarkers measured comprise a peptide sequence listed in Table 2A or 2C.
- the subject is diagnosed with osteoarthritis if the level of at least one biomarker is altered as shown in Table 2A or 2C. Prognosis
- the invention relates to a method of predicting progression of osteoarthritis comprising measuring an expression level of at least one biomarker selected from the group consisting of A1BG, A2AP, A2GL, AACT, ACTG, AFAM, ANT3, APOB, APOH, B2MG, C1QC, C1R, C1RL, C4BPA, C4BPB, CD14, CD163, CD44, CERU, CFAB, CFAH, CFAI, CIS, C02, C04B, C05, C06A3, C08B, coll3, CRAC1 (CRTAC1), CTX2, CXCL7, DOPO, ECM1, FA5, FA12, FBLN1, FCGBP, FCN3, FETUA, FINC, GELS, HABP2, haptoglobin, HEMO, HEP2, HGFA, HRG, hyaluronan, ITIH4, KLKB 1, KNG1, LUM, LYAM1, PGCA,
- the biomarker is a combination of at least two of PLF4, CXCL7, ANT3, AACT, THRB, ITIH4, C08B, PLMN, PRG4, C4BPA, C4BPB, A2AP, LYAM1, C08G, KLKB 1, hyaluronan and haptoglobin and the prediction of osteoarthritis progression includes osteophyte growth or a bone anabolic response.
- a combination of all the listed biomarkers or only two, three, four, five, six, seven, eight, nine, ten or more may also be used.
- the biomarker is a combination of at least two of PGCA, APOH, SAMP, AACT, CFAH, PHLD, TSP1, THRB, HRG, C04B, FCN3, CD44, TSP4, TETN, FINC, ECM1, HEMO, CD163, CERU, TIMP1, A1BG, THBG, A2GL, FBLN1, C05, B2MG, FETUA and haptoglobin and the prediction of osteoarthritis progression includes worsening joint space narrowing.
- a combination of all the listed biomarkers or only two, three, four, five, six, seven, eight, nine, ten or more may also be used.
- the biomarker is a combination of at least one of CFAH, SAMP, TSP1, HEP2, C1R, APOB, FINC, PGCA, AACT, KNG1, A2AP, C06A3, HGFA, C02, PRG4, DOPO, CD44, CERU, VTDB, and haptoglobin and the prediction of osteoarthritis progression includes progression by the Kellgren-Lawrence (KL) grading scale (progression is defined as joint KL score increasing to a higher or worse grade).
- KL Kellgren-Lawrence
- a combination of all the listed biomarkers or only two, three, four, five, six, seven, eight, nine, ten or more may also be used.
- the biomarkers include C08B, haptoglobin and/or PLF4 and the prediction relates to the progression of osteoarthritis.
- the biomarkers measured comprise at least two biomarkers selected from the group consisting of ACTG, ANT3, CD44, CERU, CFAH, CFAI, C08B, CXCL7, C06A3, CRAC1 (CRTAC1), FINC, haptoglobin, HRG, KLKB l, PLF4, PRG4, SAMP, TSP4 and any combination thereof.
- a combination of all the listed biomarkers or only two, three, four, five, six, seven, eight, nine, ten or more may also be used.
- the biomarkers measured comprise at least two biomarkers selected from the group consisting of PLF4, CFAH, and ANT3.
- the biomarkers measured comprise PLF4, CFAH, and ANT3.
- the biomarkers measured comprise at least two biomarkers selected from the group consisting of ANT3, CD14, CD163, CD44, CERU, CFAH, C08B, coll3, CRAC1 (CRTAC1), CTX2, CXCL7, haptoglobin, HEMO, HRG, KLKB l, LYAM1, VTDB, or any combination thereof.
- the biomarkers measured comprise at least two biomarkers selected from the group consisting of ANT3, CFAH, C08B, CRAC1 (CRTAC1), CXCL7, HRG, KLKB l, LYAM1, or any combination thereof.
- the biomarkers measured comprise at least two biomarkers selected from the group consisting of CFAH, C08B, CRAC1 (CRTAC1), HRG, or any combination thereof. In some embodiments, the biomarkers measured comprise CFAH, C08B, CRAC1 (CRTAC1), and HRG. In some embodiments, the biomarkers measured comprise at least two biomarkers selected from the group consisting of ANT3, C08B, CXCL7, KLKB l, LYAM1, or any combination thereof. In some embodiments, the biomarkers measured comprise ANT3, C08B, CXCL7, KLKB l, and LYAM1.
- the biomarkers measured comprise at least two biomarkers selected from CD14, CD163, CD44, CERU, coll3, CTX2, haptoglobin, HEMO, VTDB or any combination thereof. In some embodiments, the biomarkers measured comprise at least two biomarkers selected from the group consisting of ACTG, ANT3, CD44, CERU, CFAH, CFAI, C08B, FINC, HRG, KLKB l, PLF4, PRG4, SAMP, TSP4 or any combination thereof. In some embodiments, the biomarkers measured comprise ACTG, ANT3, CD44, CERU, CFAH, CFAI, C08B, FINC, HRG, KLKB l, PLF4, PRG4, SAMP, and TSP4.
- the biomarkers measured comprise at least two biomarkers selected from the group consisting of ANT3, CERU, CFAH, C08B, FINC, HRG, PLF4, PRG4, SAMP, TSP4 or any combination thereof.
- the biomarkers measured comprise ANT3, CERU, CFAH, C08B, FINC, HRG, PLF4, PRG4, SAMP, and TSP4.
- the biomarkers measured comprise at least two biomarkers selected from the group consisting of ACTG, ANT3, CD44, CFAI, C08B, KLKB 1, PLF4, or any combination thereof.
- the biomarkers measured further comprise ACTG, ANT3, CD44, CFAI, C08B, KLKB 1, and PLF4.
- the biomarkers measured comprise at least two biomarkers selected from the group consisting of PGCA, APOH, SAMP, AACT, CFAH, PHLD, TSP1, THRB, or any combination thereof.
- the biomarkers measured comprise SAMP and AACT.
- the biomarkers measured further comprise PGCA and/or APOH.
- the biomarkers measured further comprise CFAH, PHLD, TSP1, and/or THRB.
- the prognosis includes joint space narrowing.
- the biomarkers measured comprise at least two biomarkers selected from the group consisting of CFAH, SAMP, TSP1, HEP2, C1R, APOB, FINC, HEP2, PGCA, or any combination thereof.
- the biomarkers measured comprise CFAH and SAMP.
- the biomarkers measured further comprise TSP1 and/or APOB.
- the biomarkers measured further comprise HEP2, C1R, FINC, HEP2, and/or PGCA.
- the prediction includes KL grade.
- the biomarkers measured comprise at least two biomarkers selected from the group consisting of PLF4, CXCL7, ANT3, AACT, THRB, ITIH4, C08B, PLMN, or any combination thereof.
- the biomarkers measured comprise PLF4 and AACT.
- the biomarkers measured further comprise CXCL7 and/or ANT3.
- the biomarkers measured further comprise THRB, ITIH4, C08B, and/or PLMN.
- the prediction includes osteophyte growth.
- the biomarkers measured comprise at least two biomarkers selected from the group consisting of TSP1, CFAH, THRB, HRG, APOH, AACT, PHLD, AACT, or any combination thereof.
- the biomarkers measured comprise TSP1 and CFAH.
- the biomarkers measured further comprise THRB and/or APOH.
- the biomarkers measured further comprise HRG, AACT, PHLD, and/or AACT.
- the prediction includes joint space narrowing.
- the biomarkers measured comprise at least two biomarkers selected from the group consisting of CFAH, TSP1, SAMP, APOB, AACT, C1R, or any combination thereof.
- the biomarkers measured comprise CFAH and SAMP.
- the biomarkers measured further comprise TSP1 and/or AACT.
- the biomarkers measured further comprise APOB and/or C1R.
- the prediction includes the KL grade.
- the biomarkers measured comprise at least two biomarkers selected from the group consisting of C08B, PLF4, PRG4, ANT3, C4BPA, CXCL7, C4BPA, or any combination thereof.
- the biomarkers measured comprise C08B and PLF4.
- the biomarkers measured further comprise PRG4 and/or ANT3.
- the biomarkers measured further comprise C4BPA, CXCL7, and/or C4BPA.
- the prediction may include osteophyte growth.
- the biomarkers measured comprise at least two biomarkers selected from the group consisting of C04B, FCN3, C08B, FINC, PGCA, TSP4, TETN, or any combination thereof.
- the biomarkers measured comprise C08B and C04B.
- the biomarkers measured further comprise FINC and/or FCN3.
- the biomarkers measured further comprise PGCA, TSP4, and/or TETN.
- the prognosis may include joint space narrowing.
- the biomarkers measured comprise at least two biomarkers selected from the group consisting of A2AP, KNG1, HGFA, PRG4, AFAM, DOPO, FINC, C08B, or any combination thereof.
- the biomarkers measured comprise KNG1 and HGFA.
- the biomarkers measured further comprise A2AP and/or C08B.
- the biomarkers measured further comprise PRG4, AFAM, DOPO, and/or FINC.
- the prediction includes a KL grade determination.
- the biomarkers measured comprise at least two biomarkers selected from the group consisting of CXCL7, C4BPA, C4BPB, A2AP, ITIH4, PLMN, HRG, or any combination thereof.
- the biomarkers measured comprise CXCL7 and C4BPA.
- the biomarkers measured further comprise C4BPB and/or A2AP.
- the biomarkers measured further comprise ITIH4, PLMN, and/or HRG.
- the prediction includes osteophyte growth.
- the biomarkers measured comprise at least two biomarkers selected from the group consisting of PGCA, C04B, TENX, FCN3, C4BPA, TSP1, C08B, HRG, or any combination thereof.
- the biomarkers measured comprise C04B and PGCA.
- the biomarkers measured further comprise TENX and/or C4BPA.
- the biomarkers measured further comprise FCN3, TSP1, C08B, and/or HRG.
- the prognosis may include joint space narrowing.
- the biomarkers measured comprise at least two biomarkers selected from the group consisting of KNG1, HGFA, A2AP, FA5, TSP1, PGCA, TENX, FINC, or any combination thereof.
- the biomarkers measured comprise KNG1 and HGFA.
- the biomarkers measured further comprise A2AP and/or PGCA.
- the biomarkers measured further comprise FA5, TSP1, TENX, and/or FINC.
- the prediction includes KL grade prediction.
- the biomarkers measured comprise at least two biomarkers selected from the group consisting of C4BPA, C4BPB, CXCL7, LYAM1, A2AP, TSP1, FINC, or any combination thereof.
- the biomarkers measured comprise C4BPA and CXCL7.
- the biomarkers measured further comprise C4BPB and/or LYAM1.
- the biomarkers measured further comprise A2AP, TSP1, and/or FINC.
- the prediction includes osteophyte growth.
- the biomarkers measured comprise a peptide sequence listed in Table 2A, 2C or 2D.
- a prediction of progression of the osteoarthritis in the subject is made if the level of at least one biomarker is altered as compared to the reference level as shown in Table 2A or 2D.
- a diagnosis of osteoarthritis or a prediction of progression of the osteoarthritis in the subject is made if the level of at least one biomarker is greater or less than the threshold values shown in Table 2A or 2C.
- the biomarkers comprise the sequences listed in the Tables included herein. The various embodiments described herein may be combined or used individually.
- POP Progression
- GOGO Generalized Osteoarthritis
- GOGO was a multi-site (7 sites) study with 2728 subjects recruited on the basis of two siblings with hand OA (defined as 3 joint radiographic KL>2 grade distributed bilaterally). Knee, hip and spine radiographs were obtained. A total of 1329 subjects from 4 sites returned for follow-up at a mean 3.8 years (range 1.4 - 6.5 years). Serum (two hour post-prandial) and urine (second morning void or time recorded if other than this) were obtained at each evaluation. The demographics are shown in Table 1 for the patient subsets used for each aspect of biomarker discovery and validation.
- Phenotypes were based on 2 features from knee radiographs (joint space narrowing (JSN) and osteophyte (OST)) evaluated at 2 levels (knee based and person-based). JSN, indicative of cartilage and/or meniscal extrusion loss (cartilage and/or meniscal catabolism), and osteophyte, indicative of bone formation at the margins of the joint (joint tissue anabolism), were graded on a scale 0-3 using a standardized atlas with 0 being normal and 1, 2, and 3 representing increasing severity. Altman RD and Gold GE, Osteoarthritis Cartilage 15 Suppl A:Al-56 (2007).
- the medial and lateral compartments of the knee were graded for JSN (yielding a maximum score of 6 per knee joint); the four margins of the knee were graded for OST (yielding a maximum score of 12 per knee joint).
- Progression was defined as a one unit change over time in these variables at a knee level or person level.
- a Diagnosis of OA was defined as any OA represented by a score of greater than or equal to 1 for these variables at a knee level or person level.
- a half- century old definition of OA the Kellgren Lawrence grade, scored on a 0-4 scale, was also evaluated for a one unit change (defining progression) or any OA (defined as KL >2).
- Kellgren JH and Lawrence JS Ann Rheum Dis 16(4):494-502 (1957). Controls for each phenotype were defined as a knee or person that did not meet the minimal definition.
- Table 1 Patient demographics for sample sets used in experiments.
- NP non- JSN OST Mean Age, Mean BMI,
- Serum MRM 50 /34/38 41/37/54 64+10 82% 27.6 + 6.1 and ELISA 116 / 69 / 61 98 / 72 / 76 (41 - 86) (18.6 - 61.7) (N 124)
- a person-level control as both knees normal; a person level osteoarthritis diagnosis as at least one knee with osteoarthritis; a person level knee osteoarthritis progressor as having at least one knee that has progressive osteoarthritis over time; and a person level non-progressor as having neither knee progressing over time.
- a person-level control as both knees normal; a person level osteoarthritis diagnosis as at least one knee with osteoarthritis; a person level knee osteoarthritis progressor as having at least one knee that has progressive osteoarthritis over time; and a person level non-progressor as having neither knee progressing over time.
- GEE generalized estimating equation
- Predictive models were used to assess discrimination through the AUC.
- Penalized regression is often used for predictive models to constrain the size of coefficients to lessen the effects of overfitting the data.
- Feature selection consisted of selecting the 8 markers with the lowest p-values, which is a simple but effective method for the numbers of peptides in the current data set. Leave-one-out cross-validation was used in which selecting tuning parameters and carrying out feature selection was repeated at each iteration of cross-validation to mimic the process of fitting a model to new data. In sum, all multimarker AUCs have been properly cross-validated.
- the mean and SD values of ELISA results are natural log values for two of the serum markers that had skewed distributions (Hyaluronan and Ceruloplasmin), and all the urine biomarkers. None of the other serum markers were log transformed. Some values are negative because they are natural log transformations of values less than 1. In particular, all of the urine values were normalized prior to the analysis. Two separate ways of normalizing the urine values were tested: 1) by dividing the urine biomarker level by the creatinine value and taking the natural log [urine 1 variation], and 2) by dividing the urine biomarker level by the creatinine level and the cystatin level and taking the natural log [urine 2 variation]. In this case it is possible for some values to be negative because the natural log of a fraction is ⁇ 0.
- QC quality control
- the blue dots represent peptides accepted into the final MRM panel of 146 analytes; the red dots represent the peptides rejected from the final dataset for analysis.
- the CVs blue dots
- the red dots show no correlation to ratio, as their quantification is likely confounded by matrix interferences.
- candidate prognostic and diagnostic biomarkers were identified by three means: through discovery proteomics experiments in synovial fluid and urine by liquid chromatography mass spectrometry (LC/MS); and a discovery proteomics experiment in depleted serum (serum depleted of the 14 most abundant serum proteins.
- LC/MS liquid chromatography mass spectrometry
- depleted serum serum depleted of the 14 most abundant serum proteins.
- MARS H depleted serum is serum after it has been subjected to a column absorption to remove 14 of the most abundant serum proteins such that the abundance of these proteins does not interfere with the measurement and analysis of other serum proteins.
- the 14 depleted proteins include the following: albumin, IgG, IgA, transferrin, haptoglobin, anti-trypsin, fibrinogen, alpha 2-macroglobulin, IgM, apolipoprotein AI, apolipoprotein All, complement C3, and transthyretin.
- albumin IgG
- IgA transferrin
- haptoglobin anti-trypsin
- fibrinogen alpha 2-macroglobulin
- IgM apolipoprotein AI
- apolipoprotein All complement C3, and transthyretin.
- Table 2A Summary of Markers and Corresponding Peptides; lower case marker names in peptide sequence column indicate markers that were detected by ELISA. All markers listed were found to have a statistically significant association (p-value ⁇ 0.05) with osteoarthritis diagnosis,
- FBLN3 Q12805 like extracellular matrix as a negative regulator of chondrocyte protein 1 differentiation
- FCN3 075636 Ficolin-3 May function in innate immunity
- HGFA Q04756 Activates hepatocyte growth factor activator
- Inter-alpha-trypsin Protease inhibitors erine protease
- N-acetylmuramoyl-L- May play a scavenger role by digesting
- PZP P20742 Pregnancy zone protein inhibit all four classes of proteinases
- SAMP P02743 and may scavenge nuclear material component
- Knee_JSN_person_Pheno_P02776_PLF4_IC 0.01106 0.56919 -0.0167 0.52339 LDLQAPLYK (99)
- Knee_JSN_person_Pheno_P05156_CFAI_A 0.01703 0.2518 -0.0191 0.24696
- Knee_KL_person_Pheno_P02747_C 1 QC_V -0.0097 0.88292 0.07314 0.81026
- VAPEEHPVLLTEAPLNPK Knee_OST_person_Pheno_P02747_C 1 QC_ 0.01463 0.89969 0.01413 0.78594 VVTFCGHTSK (20)
- Knee_OST_person_Pheno_P12111_C06A3 0.04953 0.26305 -0.1016 0.28306 _E VQ VFEITENS AK (49)
- Knee_JSN_Pheno_cerulo_urine_urinel 0.5915 0.79293 1.01494 0.92315
- Knee_JSN_Pheno_cerulo_urine_urine2 -8.792 1.27149 -8.0153 1.54441
- Knee_KL_Pheno_lHA_serum 5.63111 0.81308 5.01795 0.7993
- Knee_KL_Pheno_cerulo_urine_urine2 -8.6707 1.29058 -7.9629 1.63572
- Knee KL Pheno P00736 CIR GLTLHLK -1.5768 0.17668 -1.6834 0.23557 (22)
- Knee_KL_Pheno_P00736_C 1 R_GYGFYT -2.4711 0.1838 -2.5691 0.21992 K (23)
- Knee_OST_Pheno_lcerulo_serum 6.75596 0.61035 6.83172 0.67827
- Knee_JSN_person_Pheno_vitd_binding_ser 824.727 563.488 1075.84 606.629 um
- Knee_JSN_person_Pheno_tbg_serum 15.2671 4.85939 16.9759 4.25425
- Knee_KL_person_Pheno_cerulo_urine_urin 0.77872 0.94037 0.68227 0.79315 el Knee_KL_person_Pheno_hemopexin_seru 1563.53 274.345 1474.19 372.59 m
- Knee_OST_person_Pheno_lHA_serum 5.56184 0.86152 5.67931 0.66442
- Tables 3-4 list the results on which the multimarker AUC calculations are based. These Tables list the AUCs achieved in ROC curves for the biomarker alone— AUCBM, and the AUC for the full model achieved for the biomarker with demographics (age, gender, BMI and cohort)— AUC I, and their corresponding p values.
- markers were identified that could identify JSN progression modestly (best single biomarker AUC 0.65; multimarker AUC 0.55) and OST more strongly (best single biomarker AUC 0.67; multimarker AUC 0.61).
- 6 peptides achieved AUC >0.65 for JSN progression (PGCA, APOH, AACT x3 peptides, and PHLD), 2 peptides for OST progression
- AUCBM in the tables below refers to the AUC with the biomarker alone;
- AUCMI in the tables refers to the AUC calculated when the biomarker and the age, gender and
- BM is the AUC for the biomarker alone; full is the AUC for the biomarker plus demographics (age, gender, and BMI).
- BM is the AUC for the biomarker alone; full is the AUC for the biomarker plus demographics (age, gender, and BMI).
- markers were identified that could diagnose quite strongly at a knee level and person level, all definitions of Osteoarthritis including JSN (AUC 0.71 knee level, 0.66 person level), OST (AUC 0.70 knee level and person level) and KL grade (0.77 knee level and 0.74 person level).
- JSN AUC 0.71 knee level, 0.66 person level
- OST AUC 0.70 knee level and person level
- KL grade (0.77 knee level and 0.74 person level.
- 2 peptides achieved AUC >0.65 for a JSN diagnosis (CRT AC 1 (also denoted as CRAC1) and C05), 2 peptides for an OST diagnosis (CRT AC 1 x2 peptides), and 3 peptides for a KL based diagnosis (CRT AC 1 x2 peptides and SHBG).
- CTR AC 1 encoded Cartilage Acidic Protein 1
- Cartilage Acidic Protein 1 aliases include ASPIC and CEP-68
- FDR false discovery rate
- BM is the AUC for the biomarker alone; full is the AUC for the biomarker plus demographics (age, gender, and BMI).
- BM is the AUC for the biomarker alone; full is the AUC for the biomarker plus demographics (age, gender, and BMI).
Landscapes
- Life Sciences & Earth Sciences (AREA)
- Health & Medical Sciences (AREA)
- Engineering & Computer Science (AREA)
- Chemical & Material Sciences (AREA)
- Molecular Biology (AREA)
- Immunology (AREA)
- Proteomics, Peptides & Aminoacids (AREA)
- Physics & Mathematics (AREA)
- Hematology (AREA)
- Biomedical Technology (AREA)
- Urology & Nephrology (AREA)
- Analytical Chemistry (AREA)
- General Health & Medical Sciences (AREA)
- Biotechnology (AREA)
- Microbiology (AREA)
- Pathology (AREA)
- Organic Chemistry (AREA)
- Biochemistry (AREA)
- Bioinformatics & Cheminformatics (AREA)
- Medicinal Chemistry (AREA)
- General Physics & Mathematics (AREA)
- Food Science & Technology (AREA)
- Cell Biology (AREA)
- Biophysics (AREA)
- Bioinformatics & Computational Biology (AREA)
- Zoology (AREA)
- Genetics & Genomics (AREA)
- Wood Science & Technology (AREA)
- Spectroscopy & Molecular Physics (AREA)
- General Engineering & Computer Science (AREA)
- General Chemical & Material Sciences (AREA)
- Veterinary Medicine (AREA)
- Public Health (AREA)
- Animal Behavior & Ethology (AREA)
- Pharmacology & Pharmacy (AREA)
- Nuclear Medicine, Radiotherapy & Molecular Imaging (AREA)
- Chemical Kinetics & Catalysis (AREA)
- Physical Education & Sports Medicine (AREA)
- Rheumatology (AREA)
- Orthopedic Medicine & Surgery (AREA)
Abstract
Provided herein are methods and biomarkers useful for detecting and diagnosing osteoarthritis and predicting the progression of osteoarthritis in subjects. The diagnoses and predictions of prognosis may be used to develop treatment plans for subjects. Also included methods of treating subjects and administering pharmaceuticals based on the diagnosis and prognosis predictions.
Description
METHODS OF DETECTING OSTEOARTHRITIS AND PREDICTING PROGRESSION
THEREOF
CROSS-REFERENCE TO RELATED APPLICATIONS
This patent application claims the benefit of priority of United States Provisional Patent
Application No. 62/112,445 filed February 5, 2015, and United States Provisional Patent Application No. 62/172,394 filed June 8, 2015, both of which are incorporated herein by reference in their entireties.
SEQUENCE LISTING A Sequence Listing accompanies this application and is incorporated herein by reference in its entirety. The Sequence Listing was filed with the application as a text file on February 5, 2016.
INTRODUCTION
Osteoarthritis is a prevalent chronic disease that represents a large and growing global health burden of large unmet need with respect to diagnostics, prognostics and therapeutics. Based on data from the Global Burden of Disease 2010 Study, musculoskeletal conditions are the second greatest cause of disability, as measured by years lived with disability (YLDs) worldwide and across most regions of the world; the main contributors are low back pain (83.1 million YLDs), neck pain (33.6 million YLDs) and osteoarthritis (17.1 million YLDs) with osteoarthritis of the knee accounting for 83% of this total. Globally, osteoarthritis of the knee affects 251 million individuals, and back and neck pain (likely largely also attributable to osteoarthritis) currently affect 964 million people worldwide. In the US, according to the Centers for Disease Control, osteoarthritis affects an estimated 26.9 million US adults (estimates from 2005, up 28% from the estimated 21 million US adults impacted in 1990). As the US population continues to age and struggle with obesity, the incidence and prevalence of the disease is expected to continue to grow. Consequently, the annual cost of osteoarthritis to the US, estimated to be $89.1 billion in 2001, is anticipated to continue to grow.
Demographics and baseline characteristics are poor predictors of OA progression including age, sex, body mass index, knee pain, general bone mineral content, and joint space width at baseline. In a systematic literature review, it was noted that 25-75% of painful knees cannot be diagnosed as OA by x-ray. Bedson J and Croft PR, BMC Musculoskelet Disord 9: 116 (2008). Moreover, knee pain has been reported to have only a 23% sensitivity and 88%
specificity for the diagnosis of radiographic OA. Hart et al., Ann Rheum Dis 50(7):467-70 (1991). Bedson et al concluded that, "The results of knee x-rays should not be used in isolation when assessing individual patients with knee pain." Bedson J and Croft PR, BMC Musculoskelet Disord 9: 116 (2008). Our goal was to develop a better means of diagnosing and predicting progression of knee osteoarthritis.
SUMMARY
Methods of diagnosis and predicting progression of osteoarthritis, and in particular knee osteoarthritis, are provided herein. In one aspect, methods of diagnosing osteoarthritis by measuring biomarkers are provided. The methods include measuring the level of a biomarker in a sample from the subject. The biomarker may be at least one biomarker selected from the group consisting of CRAC1 (CRTAC1), A2AP, A1BG, A2GL, AACT, ACTG, AMBP, APOB, APOE, B2MG, C1QC, C1R, C1RL, C4BPA, C4BPB, CD14, CD44, CERU, CFAB, CFAH, CFAI, CILP1, CIS, CNDP1, C02, C04B, C05, C06A3, C08B, C08G, C09, coll3, COMP, CTXla, CTXlb, CTX2, CTXi, CXCL7, ECM1, FA12, FA5, FBLN1, FBLN3, FCGBP, FCN3, FETUA, FINC, GELS, HA, HABP2, haptoglobin, HEMO, HEP2, HGFA, HRG, hyaluronan, IC1, ITIH1, ITIH4, KNGl, LAMA2, LUM, LYAMl, MASP1, PCOC1, PGCA, PHLD, PLF4, PLMN, PRG4, RET4, SAMP, SHBG, TENX, TETN, THBG, TIMP1, TSP1, TSP4, VTDB, VTNC, ZA2G, ZPI, or any combination thereof. The levels of the biomarker in the subject are then compared to the levels of the biomarker in a control subject or a reference level of the biomarker. The subject can then be diagnosed with osteoarthritis if the expression of any of the biomarkers is altered as compared to the reference level.
In another aspect, methods of predicting progression of osteoarthritis by measuring the expression levels of biomarkers in a sample from a subject are also provided. The biomarker may be at least one biomarker selected from the group consisting of A1BG, A2AP, A2GL, AACT, ACTG, AFAM, ANT3, APOB, APOH, B2MG, C1QC, C1R, C1RL, C4BPA, C4BPB, CD14, CD163, CD44, CERU, CFAB, CFAH, CFAI, CIS, C02, C04B, C05, C06A3, C08B, coll3, CRAC1 (CRTAC1), CTX2, CXCL7, DOPO, ECM1, FA5, FA12, FBLN1, FCGBP, FCN3, FETUA, FINC, GELS, HABP2, haptoglobin, HEMO, HEP2, HGFA, HRG, hyaluronan, ITIH4, KLKB l, KNGl, LUM, LYAMl, PGCA, PHLD, PLF4, PLMN, PRG4, RET4, SAMP, TENX, TETN, THBG, THRB, TIMP1, TSP1, TSP4, VTDB, VTNC, or combinations thereof. The level of the biomarker in the sample is compared to a reference level of the biomarker. The
comparison is then used to predict the progression of the osteoarthritis. A significant alteration in the level of any of the biomarkers as compared to the reference level is predictive of progression of osteoarthritis or indicative of risk of osteoarthritis progression.
BRIEF DESCRIPTION OF THE DRAWINGS
Figure 1 is a flow chart showing how the biomarkers could be used to assist in diagnosing and predicting the progression of knee osteoarthritis and how this would be translated into a treatment plan.
Figure 2 is a dot plot showing the coefficients of variation for each of the tested peptides and those colored blue and clustering near the log based line were included for further analysis and those in red were not included in the dataset.
DETAILED DESCRIPTION
Methods of diagnosing or predicting progression of osteoarthritis in a subject are provided. The methods all rely on detecting or determining the level of at least one biomarker or combinations of biomarkers in a sample from a subject. In some cases, the subject has knee pain or has already been diagnosed with knee osteoarthritis. The subject may also be diagnosed with, or suspected of having osteoarthritis in another joint other than the knee, such as the hip, back, hand, elbow, shoulder, neck or other joint in the subject. Suitably, the subject is a human, but subjects may include other non-human mammals such as domesticated animals.
Thus, the present methods permit the diagnosis and personalization of therapy or a treatment plan, wherein a subject's biomarker profile is predictive of, or indicative of, a diagnosis of osteoarthritis or risk of progression of osteoarthritis. The methods disclosed herein related to osteoarthritis can be used in combination with assessment of conventional clinical factors or measures, such as age, sex, body mass index or radiographic parameters; this is analogous to the practice for diagnosis or prognosis of rheumatoid arthritis by measuring rheumatoid factor and/or anti-cyclic citrullinated peptide and considering them in conjunction with morning stiffness, joint swelling and/or radiographic features of joint disease, etc. In this manner, the methods of the present disclosure permit a more accurate evaluation of osteoarthritis both at the level of diagnosis and of prognosis of progression of the disease.
In some embodiments, the method includes determining the levels of the biomarkers provided herein in Table 2a in a sample from a subject diagnosed with or suspected of having osteoarthritis. Biomarker levels in some instances may be normalized against the levels of all
proteins in the sample, or against a reference or normalization protein(s) in the sample as discussed and exemplified in the Examples. The following set of peptides may be used as normalization peptides in the methods provided herein: TSP1, CNDP1, FA5, SHBG, PLF4, C1QC, ADIPO, APOA4, ACTG, CD14, K2C1, CBG, CHLE, FA11 or any combinations thereof. The level of the biomarkers is indicative of the prognosis for the progression of osteoarthritis in the subject or may be used for the diagnosis of osteoarthritis and may be used to develop a treatment plan or determine the effectiveness of a particular treatment.
In some embodiments, the methods disclosed herein further comprise measuring the level of at least one normalization peptide from a protein selected from TSP1, CNDP1, FA5, SHBG, PLF4, C1QC, ADIPO, APOA4, ACTG, CD14, K2C1, CBG, CHLE, FA11 or any combination thereof in a sample from a subject and normalizing the level of the biomarker in the sample from the subject and the reference level of the biomarker to the level of the normalization peptide in the sample and the reference prior to comparing the level of the biomarker in the sample to the reference level of the biomarker. In some embodiments, the normalization peptide comprises at least one of the sequences of Tables 12 or 13.
The early stages of osteoarthritis are characterized by pain in the affected joint and changes to the cartilage that lines the ends of the bones and cushions the joints. The changes may include thinning of the cartilage layer. Usually the pain in the early stages is well-managed with rest and topical or non-prescription ingestible anti-inflammatory pharmaceutical agents. Moderate osteoarthritis often involves pain with standing as well as when moving and may show bone thickening along joint margins. Treatment involves increased use of anti-inflammatory and anti-pain medications including NSAIDS and steroids. Progression to later stages may restrict the ability of the affected subject to move and to work and may require treatment with stronger pain medications such as opioids, injectable corticosteroids, lubrication injections, physical therapy and joint replacement surgery. Identifying patients likely to progress to a more severe form of the disease would aid medical professionals in determining the appropriate treatment options for individuals with osteoarthritis earlier in the disease course, before disability occurs and when the disease is more likely to be favorably impacted by treatment.
The methods of the present disclosure can also be used to assist in selecting appropriate courses of treatment and to identify patients that would benefit from a particular course of therapy. As shown in Figure 1, if a subject is demonstrated, via evaluation of the biomarkers
provided herein, to be likely to have non-progressive disease then the treatment plan on the left can be pursued which is non-invasive and includes non-pharmacologic therapy. If instead the subject is determined to be likely to have progressive osteoarthritis, then more aggressive treatment options can be pursued including injections or treatment with pharmaceuticals and surgery. Thus, the levels of the particular biomarkers described herein provide insight into which treatment regimens will be most effective for the subject. This information can be used to generate treatment plans for the subject to prolong an active, pain-free lifestyle and minimize side effects, adverse reactions or therapy related toxicity. Methods of developing a treatment plan for a subject with osteoarthritis are also provided herein. Treatment plans may be developed as shown in Figure 1 using the predictions of the likelihood of progression of osteoarthritis. Methods of monitoring a treatment plan are also provided. The methods may be performed on a recurring basis in order to determine whether a particular treatment plan is effective in reducing and maintaining reduction of at least one symptom of osteoarthritis.
In some embodiments, the methods of the present disclosure may further include administering an anti-inflammatory or anti-pain therapeutic to the subject if the subject is diagnosed with osteoarthritis or predicted to have non-progressive or progressive disease. Suitable anti-inflammatory therapeutics are known to those skilled in the art and may include, without limitation, nonsteroidal anti-inflammatory drugs (NSAIDs), disease-modifying osteoarthritis drugs (DMOADs), disease-modifying antirheumatic drugs (DMARDs), corticosteroids, and hyaluronans. Several classes of DMARDs may be used in accordance with the present invention including, but not limited to, traditional DMARDs such as methotrexate, hydroxycholorquine, sulfasalazine, leflunomide, cyclophosphamide and azathioprine; biologies such as anti-IL-1 therapeutics, anti-TNF therapeutics, metalloproteinase inhibitors, p38 inhibitors, abatacept, adalimumab, anakinra, certolizumab pegol, etanercept, infliximab, golimumab and rituximab; and JAK inhibitors such as Tofacitinib. Suitable anti-pain therapeutics include, without limitation, non-opioid analgesics (e.g., acetaminophen), nonsteroidal anti-inflammatory drugs (NSAIDs), opioid analgesics, and co-analgesics and most likely in future, nerve growth factor inhibitors. Subjects having stable or non-progressive disease may be treated with topical or ingestible pain or anti-inflammatory medications. Subjects identified as having progressive destructive or aggressive disease likely to lead to joint destruction may be referred for injectable lubricant or biologic agent procedures, stronger pain
medications such as opioids, bone-acting agents such as calcitonin, bisphosphonat.es and hormonal therapies, physical therapy, arthroscopic surgery, osteotomy, fibulectomy or joint replacement surgery.
Methods of treating osteoarthritis in a subject are provided. The methods of treating osteoarthritis may include administering a therapeutically effective amount of an antiinflammatory or anti-pain therapeutic to the subject provided that the levels of at least one of the biomarkers listed in Table 2A in a sample from the subject was determined to be modified (increased or decreased) as compared to the reference level as shown in Table 2A or greater than/less than the threshold values reported in Table 2A, 2C or 2D to diagnose osteoarthritis or indicate the subject's disease is likely to progress.
In some embodiments, the age, gender and/or body mass index of the subject are also used in making the prediction of progression or diagnosis. In some embodiments described herein, diagnostic and prognostic performance of the biomarkers and/or other clinical parameters such as demographics including sex, age, BMI and cohort were assessed utilizing logistic regression to compute p-values and confidence intervals. These statistics were then used to calculate a Benjamini-Hochberg FDR threshold. A biomarker was considered a significant biomarker if the FDR passed 10%. Knee-level analysis required a paired evaluation and the generalized estimating equation method was used to account for the correlation structure and the significance of the biomarker was assessed by a Wald statistic. The statistical analysis used is described in the Examples section. Methods for assessing statistical significance are well known in the art and thus other methods may be used. In some aspects of the invention, a p-value of less than 0.05 constitutes statistical significance.
As used herein, the term "subject" and "patient" are used interchangeably and refer to both human and non-human animals. The term "non-human animals" as used in the disclosure includes all vertebrates, e.g., mammals and non-mammals, such as non-human primates, sheep, dog, cat, horse, cow, chickens, rodents, guinea pigs, amphibians, reptiles, and the like. Preferably and in some embodiments, the subject is a human patient. The subject may be a human patient with knee pain or already diagnosed with or suspected of having osteoarthritis.
The biomarkers of the present disclosure include proteins and genes encoding the proteins. The biomarkers analyzed are provided in Table 2B along with an indication of the commonly used abbreviations for each marker. Such biomarkers include the entire protein or
peptide portions of the protein. As shown in the Examples, peptides from each of these proteins were identified as useful in the methods provided herein. The biomarker peptides used in the examples are shown in Table 2A. These biomarkers may be used alone in the methods or in combinations as described below.
Fragments and genetic variants of biomarkers are also encompassed by the present invention. "Fragment" is intended to include a portion of the amino acid sequence and hence a portion of the protein encoded thereby. A fragment or a biomarker peptide will generally encode at least 7, 8, 9, 10, 12, 15, 17, 20, 22, 25, 30 or more contiguous amino acids, or up to the total number of amino acids present in a full-length biomarker. "Variant" is intended to mean substantially similar sequences. Generally, variants of a particular biomarker of the invention will have at least about 80%, 85%, 90%, 91%, 92%, 93%, 94%, 95%, 96%, 97%, 98%, 99% or more amino acid identity to that biomarker as determined by amino acid alignment programs.
A "biomarker" is a protein or glycan whose level in a sample is altered compared to that of a normal or healthy sample or is indicative of a condition. The biomarkers disclosed herein are proteins or glycans whose levels correlate with osteoarthritis and can be used to predict the progression of the disease as well as diagnose the disease.
In particular embodiments, the methods for predicting progression of or diagnosing osteoarthritis in a subject include collecting a patient body sample. The sample may or may not include cells. In particular, the methods described herein may be performed without requiring a tissue sample or biopsy. "Sample" is intended to include any sampling of cells, tissues, or bodily fluids in which a level of a biomarker can be detected. Examples of such samples include, but are not limited to, blood, serum, urine, synovial fluid, saliva, or any other bodily secretion or derivative thereof. Blood can include whole blood, plasma (citrate, EDTA, heparin), serum, or any derivative of blood. Samples may be obtained from a patient by a variety of techniques available to those skilled in the art. Methods for collecting various samples are well known in the art. In some embodiments, the sample is serum, plasma, urine, or synovial fluid. In some embodiments, the sample is serum depleted of at least 7 major serum proteins. In some embodiments, the serum proteins depleted are selected from the group consisting of albumin, IgG, IgA, transferrin, haptoglobin, anti-trypsin, fibrinogen, alpha 2-macroglobulin, IgM, apolipoprotein AI, apolipoprotein All, complement C3, and transthyretin.
Any methods available in the art for detecting the level of biomarkers are encompassed herein. The level of a biomarker of the invention can be detected using a peptide corresponding to the biomarker. "Measuring an expression level of is intended to mean determining the quantity or presence of a biomarker (i.e., peptide) in a sample for at least one of the biomarkers of Table 2a. Thus, "measuring an expression level of encompasses instances where a biomarker is determined not to be detectable due to failure to be produced, or due to production below the detection limit of the assay; "measuring an expression level of also encompasses low, normal and high levels of detection. Measuring an expression level also includes instances where a marker is degraded or is more stable in a person with osteoarthritis or with progressive disease and is not limited to production of new peptide or the timing of peptide production.
Methods suitable for "measuring an expression level of biomarkers are known to those of skill in the art and include, but are not limited to, ELISA, immunofluorescence, FACS analysis, Western blot, magnetic immunoassays, mass spectroscopy, gel electrophoresis, antibody-based microarrays and non-antibody-based microarrays or combinations of these methods. In the past, the gold standard for detection of growth factors and cytokines in blood was the use of ELISAs; however, multiplex technology and mass spectroscopy offer attractive alternative approaches for protein-based analyses. The advantages of multiplex technology compared to traditional ELISA assays are conservation of patient sample, and significant savings in cost, time and labor. In some embodiments, the biomarker is measured using an antibody- based capture method. In some embodiments, the biomarker is measured using mass spectrometry.
Several multiplex platforms currently exist. The Luminex bead-based systems are the most established, being used to detect circulating cytokines and growth factors in both mice and humans. This method is based on the use of microparticles that have been pre-coated with specific antibodies. These particles are then mixed with sample and the captured analytes are detected using specific secondary antibodies. This allows for up to 100 different analytes to be measured simultaneously in a single microplate well. The advantages of this flow cytometry- based method compared to traditional ELISA assays are in the conservation of patient samples as well as significant savings in terms of cost and labor. An alternative, plate-based system is produced by Meso Scale Discovery (MSD). This system utilizes its proprietary Multi- Array® and Multi-Spot® microplates with electrodes directly integrated into the plates. This enables the
MSD system to have ultra-sensitive detection limits, high specificity, large dynamic range, and low background signal. Another plate-based multiplex system is the Searchlight Plus CCD Imaging System produced by Aushon Biosystems. This novel multiplexing technology allows for the measurement of up to 16 different analytes simultaneously in a single microplate well. The assay design is similar to a sandwich ELISA where the capture antibodies are pre-spotted into individual wells of a 96-well plate. Samples or standards are added which bind to the specific capture antibodies and are detected using Aushon' s patented SuperSignal ELISA Femto Chemiluminescent Substrate. Still another method is SomaLogic which is a bead-based technology for multiplex quantification of proteins or protein fragments.
The term "probe" refers to any molecule that is capable of selectively binding to a specifically intended target biomolecule, for example, a protein encoded by or corresponding to a biomarker. Probes can be synthesized by one of skill in the art, or derived from appropriate biological preparations. Probes may be specifically designed to be labeled. Examples of molecules that can be utilized as probes include, but are not limited to, RNA, DNA, proteins, antibodies, and organic molecules. Detectable labels include, but are not limited to, any heterologous addition to the probe that can be used to detect the selectively bound probe. Examples of detectable labels include fluorescent and radiological labels as well as labels that can be detected because they have a specific binding partner (ligand/receptor interaction) such as biotin/avidin or a nucleic acid tag that may act as a barcode to bind and specifically identify a larger nucleic acid.
As used herein the term "predicting progression" or "a prediction of progression" refers to providing a probability-based analysis of risk for osteoarthritis progression in a particular subject. The prediction of progression of osteoarthritis is not a guarantee or absolute, only a statistically probable indication of the disease state of the subject. The term prediction of a "diagnosis" or "diagnosing" of osteoarthritis refers to providing a probability-based analysis of an osteoarthritis diagnosis in a particular subject. The prediction of a diagnosis of osteoarthritis is not a guarantee or absolute, only a statistically probable indication of the disease state of the subject.
The level of the biomarker in the sample from the subject is compared to a reference level of the biomarker. The reference level may be determined empirically such as illustrated in the Examples, by comparison to the levels found in a set of samples from subjects with known
clinical outcomes or known to have or not have osteoarthritis. Alternatively, the reference level may be a level of the biomarker found in samples, such as serum samples, which becomes a standard and can be used as a predictor for new samples. The level of the biomarker in the sample from the subject may be increased or decreased (i.e., "altered") as compared to the reference level. The Examples and Tables provide information regarding how each biomarker is altered to indicate a diagnosis or to predict progression.
The predictive methods described herein may be combined to provide increased significance of the results, i.e. increased AUCs. For example, the levels of multiple markers may be determined in a sample from the subject and the results may have additional statistical or predictive power via the combination. The levels may be compared to the reference levels and a diagnosis or a prediction of risk of progression made. Several exemplary combinations are provided below and in the Examples, but any combination of 2, 3, 4, 5, 6, 7, 8, 9, 10 or more of the biomarkers may provide a prediction with increased accuracy and thus be beneficial.
Diagnosis
In some embodiments, the invention relates to a method of diagnosing osteoarthritis comprising measuring an expression level of at least one biomarker selected from the group consisting of CRAC1 (CRTAC1), A2AP, A1BG, A2GL, AACT, ACTG, AMBP, APOB, APOE, B2MG, C1QC, C1R, C1RL, C4BPA, C4BPB, CD14, CD44, CERU, CFAB, CFAH, CFAI, CILP1, CIS, CNDP1, C02, C04B, C05, C06A3, C08B, C08G, C09, coll3, COMP, CTXla, CTXlb, CTX2, CTXi, CXCL7, ECM1, FA12, FA5, FBLN1, FBLN3, FCGBP, FCN3, FETUA, FINC, GELS, HA, HABP2, haptoglobin, HEMO, HEP2, HGFA, HRG, hyaluronan, IC1, ITIH1, ITIH4, KNG1, LAMA2, LUM, LYAM1, MASP1, PCOC1, PGCA, PHLD, PLF4, PLMN, PRG4, RET4, SAMP, SHBG, TENX, TETN, THBG, TIMP1, TSP1, TSP4, VTDB, VTNC, ZA2G, ZPI, or any combination thereof in a sample from a subject; comparing the level of at least one biomarker in the sample to a reference level of the biomarker; and diagnosing the subject with osteoarthritis if the level of at least one biomarker is altered as compared to the reference level. In some embodiments, such methods further comprise developing a treatment plan for the subject if the subject is diagnosed with osteoarthritis.
In some embodiments, the biomarker is a combination of at least two of CRAC1, COMP, C06A3, SHBG, PCOC1, C08G, LUM, ACTG, C05, A2AP, C02, FA5, CERU, KNG1, HPLNl, CD14, CERU, CTXla, CTXlb, VTNC, ZPI and haptoglobin and the diagnosis of
osteoarthritis includes the presence of an osteophyte or a bone anabolic response. A combination of all the listed biomarkers or only two, three, four, five, six, seven, eight, nine, ten or more may also be used. In some embodiments, the biomarker is a combination of at least one of CRAC1, CXCL7, C4BPA, COMP, LUM, C05, TIMP1, C4BPA, PCOC1, A2AP, C02, FA5, HRG, C06A3, VTDB, KNG1, HPLN1, CD14, CERU, CTXla, CTXlb, PLF4, TETN, TSP1, PHLD, C4BPB, CFAI, SAMP, C08B, ECM1, TSP4, CILP, APOE, IHA, CTX2, CTXi, hyaluronan and haptoglobin and the diagnosis of osteoarthritis includes the presence of worsening joint space narrowing indicative of cartilage or meniscal abnormality. A combination of all the listed biomarkers or only two, three, four, five, six, seven, eight, nine, ten or more may also be used. In some embodiments, the biomarker is a combination of at least one of CRAC1, SHBG, COMP, C08G, PCOC1, C06A3, LUM, C05, A2AP, C02, FA5, FBLN3, VTDB, KNG1, HPLN1, CD14, CERU, CTXla, CTXlb, CTX2, CTXi, CFAH, TSP4 and haptoglobin and the diagnosis of osteoarthritis includes the progression of the Kellgren-Lawrence (KL) grade where progression is defined by a joint KL grade/score increasing to indicate a higher, i.e. worse, grade. A combination of all the listed biomarkers or only two, three, four, five, six, seven, eight, nine, ten or more may also be used. In some embodiments, the biomarker includes CRAC1, KNG1 and/or haptoglobin for diagnosis of osteoarthritis.
In some embodiments, the biomarkers measured comprise at least two biomarkers selected from the group consisting of CRAC1 (CRTAC1), CXCL7, C08G, ACTG, CD44, CERU, CFAH, CFAI, C06A3, C08G, COMP, FINC, HRG, KNG1, PLF4, PRG4, SAMP, TSP4, and any combination thereof. A combination of all the listed biomarkers or only two, three, four, five, six, seven, eight, nine, ten or more may also be used. In some embodiments, the biomarkers measured comprise CRAC1 (CRT AC 1) and CXCL7. In some embodiments, the biomarkers measured comprise CXCL7 and C08G. In some embodiments, the biomarkers measured comprise C08G and CRAC1. In still further embodiments, the biomarkers measured comprise CRAC1 (CRTAC1), CXCL7, and C08G.
In some embodiments, the biomarkers measured comprise at least two biomarkers selected from the group consisting of CRAC1 (CRTAC1), A2AP, ACTG, APOE, C1QC, C4BPB, CD14, CFAI, C05, C06A3, C08G, coll3, CXCL7, FA5, FCGBP, FINC, GELS, HA, HEMO, KNG1, PCOC1, TENX, VTDB, or any combination thereof. In some embodiments, the biomarkers measured comprise at least two biomarkers selected from the group consisting of
CRAC1 (CRTAC1), A2AP, ACTG, APOE, CIQC, C4BPB, CFAI, C05, C06A3, C08G, CXCL7, FA5, FCGBP, FINC, GELS, PCOCl, TENX, or any combination thereof. In some embodiments, the biomarkers measured comprise CRAC1 (CRTAC1), A2AP, ACTG, APOE, CIQC, C4BPB, CFAI, C05, C06A3, C08G, CXCL7, FA5, FCGBP, FINC, GELS, PCOCl, and TENX. In some embodiments, the biomarkers measured comprise at least two biomarkers selected from the group consisting of CD14, coll3, HA, HEMO, KNG1, VTDB or any combination thereof. In some embodiments, the biomarkers measured comprise at least two biomarkers selected from the group consisting of CRAC1 (CRTAC1), COMP, C06A3, C08G, CXCL7, or any combination thereof. In some embodiments, the biomarkers measured comprise CRAC1 (CRTAC1), COMP, C06A3, C08G, and CXCL7.
In some embodiments, the biomarkers measured comprise at least two biomarkers selected from the group consisting of CRAC1 (CRTAC1), CXCL7, C4BPA, COMP, LUM, C05, TIMPl, or any combination thereof. In some embodiments, the biomarkers measured comprise CRAC1 (CRTAC1) and CXCL7. In further such embodiments, the biomarkers measured further comprise C4BPA and/or COMP. In still further such embodiments, the biomarkers measured further comprise LUM, C05, and/or TIMPl.
In some embodiments, the biomarkers measured comprise at least two biomarkers selected from the group consisting of CRAC1 (CRTAC1), SHBG, COMP, C08G, PCOCl, C06A3, LUM, or any combination thereof. In some embodiments, the biomarkers measured comprise CRAC1 (CRT AC 1) and SHBG. In further such embodiments, the biomarkers measured further comprise COMP and/or C08G. In still further such embodiments, the biomarkers measured further comprise PCOCl, C06A3, and/or LUM. In some embodiments, the biomarkers measured comprise CRAC1 (CRTAC1) and COMP. In further such embodiments, the biomarkers measured further comprise C06A3 and/or SHBG.
In some embodiments, the biomarkers measured comprise at least two biomarkers selected from the group consisting of CRAC1 (CRTAC1), C4BPA, LUM, C05, PCOCl, CXCL7, COMP, or any combination thereof. In some embodiments, the biomarkers measured comprise CRAC1 (CRTAC1) and CXCL7. In further such embodiments, the biomarkers measured further comprise C4BPA and/or LUM. In still further such embodiments, the biomarkers measured further comprise C05, PCOCl, and/or COMP.
In some embodiments, the biomarkers measured comprise at least two biomarkers selected from the group consisting of CRACl (CRTACl), PCOC1, C08G, LUM, COMP, C06A3, C05, ACTG or any combination thereof. In some embodiments, the biomarkers measured comprise CRACl (CRTACl) and PCOC1. In further such embodiments, the biomarkers measured further comprise COMP and/or C08G. In still further such embodiments, the biomarkers measured further comprise LUM, C06A3, and/or C05. In some embodiments, the biomarkers measured comprise CRACl (CRTACl) and COMP. In further such embodiments, the biomarkers measured further comprise C06A3 and/or PCOC1. In still further such embodiments, the biomarkers measured comprise C08G, ACTG, and/or C05.
In some embodiments, the biomarkers measured comprise at least two biomarkers selected from the group consisting of A2AP, C02, COMP, FA5, C05, CRACl (CRTACl), SHBG, or any combination thereof. In some embodiments, the biomarkers measured comprise A2AP and C02. In further such embodiments, the biomarkers measured further comprise COMP and/or FA5. In still further such embodiments, the biomarkers measured further comprise C05, CRACl (CRTACl), and/or SHBG.
In some embodiments, the biomarkers measured comprise at least two biomarkers selected from the group consisting of A2AP, FA5, C02, C05, COMP, SHBG, C06A3, or any combination thereof. In some embodiments, the biomarkers measured comprise A2AP and FA5. In further such embodiments, the biomarkers measured further comprise C05 and/or C02. In still further such embodiments, the biomarkers measured further comprise COMP, SHBG, and/or C06A3. In some embodiments, the biomarkers measured comprise at least two biomarkers selected from the group consisting of A2AP, CRACl (CRTACl), C02, COMP, FA5, C05, or any combination thereof. In some embodiments, the biomarkers measured comprise A2AP and C02. In further such embodiments, the biomarkers measured further comprise COMP and/or CRACl (CRTACl). In some embodiments, the biomarkers measured comprise A2AP, CRACl (CRTACl), and C02. In further such embodiments, the biomarkers measured further comprise FA5. In still further such embodiments, the biomarkers measured further comprise COMP and/or C05.
In some embodiments, the biomarkers measured comprise a peptide sequence listed in Table 2A or 2C. In some embodiments, the subject is diagnosed with osteoarthritis if the level of at least one biomarker is altered as shown in Table 2A or 2C.
Prognosis
In some embodiments, the invention relates to a method of predicting progression of osteoarthritis comprising measuring an expression level of at least one biomarker selected from the group consisting of A1BG, A2AP, A2GL, AACT, ACTG, AFAM, ANT3, APOB, APOH, B2MG, C1QC, C1R, C1RL, C4BPA, C4BPB, CD14, CD163, CD44, CERU, CFAB, CFAH, CFAI, CIS, C02, C04B, C05, C06A3, C08B, coll3, CRAC1 (CRTAC1), CTX2, CXCL7, DOPO, ECM1, FA5, FA12, FBLN1, FCGBP, FCN3, FETUA, FINC, GELS, HABP2, haptoglobin, HEMO, HEP2, HGFA, HRG, hyaluronan, ITIH4, KLKB 1, KNG1, LUM, LYAM1, PGCA, PHLD, PLF4, PLMN, PRG4, RET4, SAMP, TENX, TETN, THBG, THRB, TIMP1, TSP1, TSP4, VTDB, VTNC, or combinations thereof in a sample from a subject; comparing the level of the biomarker in the sample to a reference level of the biomarker; and predicting the progression of the osteoarthritis, wherein altered levels of any of the biomarkers as compared to the reference level is indicative of progression of the osteoarthritis. In some embodiments, such methods further comprise developing a treatment plan for the subject based on the prediction of progression of the osteoarthritis.
In some embodiments, the biomarker is a combination of at least two of PLF4, CXCL7, ANT3, AACT, THRB, ITIH4, C08B, PLMN, PRG4, C4BPA, C4BPB, A2AP, LYAM1, C08G, KLKB 1, hyaluronan and haptoglobin and the prediction of osteoarthritis progression includes osteophyte growth or a bone anabolic response. A combination of all the listed biomarkers or only two, three, four, five, six, seven, eight, nine, ten or more may also be used. In some embodiments, the biomarker is a combination of at least two of PGCA, APOH, SAMP, AACT, CFAH, PHLD, TSP1, THRB, HRG, C04B, FCN3, CD44, TSP4, TETN, FINC, ECM1, HEMO, CD163, CERU, TIMP1, A1BG, THBG, A2GL, FBLN1, C05, B2MG, FETUA and haptoglobin and the prediction of osteoarthritis progression includes worsening joint space narrowing. A combination of all the listed biomarkers or only two, three, four, five, six, seven, eight, nine, ten or more may also be used. In some embodiments, the biomarker is a combination of at least one of CFAH, SAMP, TSP1, HEP2, C1R, APOB, FINC, PGCA, AACT, KNG1, A2AP, C06A3, HGFA, C02, PRG4, DOPO, CD44, CERU, VTDB, and haptoglobin and the prediction of osteoarthritis progression includes progression by the Kellgren-Lawrence (KL) grading scale (progression is defined as joint KL score increasing to a higher or worse grade). A combination of all the listed biomarkers or only two, three, four, five, six, seven, eight, nine, ten or more may
also be used. In some embodiments, the biomarkers include C08B, haptoglobin and/or PLF4 and the prediction relates to the progression of osteoarthritis.
In some embodiments, the biomarkers measured comprise at least two biomarkers selected from the group consisting of ACTG, ANT3, CD44, CERU, CFAH, CFAI, C08B, CXCL7, C06A3, CRAC1 (CRTAC1), FINC, haptoglobin, HRG, KLKB l, PLF4, PRG4, SAMP, TSP4 and any combination thereof. A combination of all the listed biomarkers or only two, three, four, five, six, seven, eight, nine, ten or more may also be used. In some embodiments, the biomarkers measured comprise at least two biomarkers selected from the group consisting of PLF4, CFAH, and ANT3. In still further embodiments, the biomarkers measured comprise PLF4, CFAH, and ANT3. In some embodiments, the biomarkers measured comprise at least two biomarkers selected from the group consisting of ANT3, CD14, CD163, CD44, CERU, CFAH, C08B, coll3, CRAC1 (CRTAC1), CTX2, CXCL7, haptoglobin, HEMO, HRG, KLKB l, LYAM1, VTDB, or any combination thereof. In some embodiments, the biomarkers measured comprise at least two biomarkers selected from the group consisting of ANT3, CFAH, C08B, CRAC1 (CRTAC1), CXCL7, HRG, KLKB l, LYAM1, or any combination thereof. In some embodiments, the biomarkers measured comprise at least two biomarkers selected from the group consisting of CFAH, C08B, CRAC1 (CRTAC1), HRG, or any combination thereof. In some embodiments, the biomarkers measured comprise CFAH, C08B, CRAC1 (CRTAC1), and HRG. In some embodiments, the biomarkers measured comprise at least two biomarkers selected from the group consisting of ANT3, C08B, CXCL7, KLKB l, LYAM1, or any combination thereof. In some embodiments, the biomarkers measured comprise ANT3, C08B, CXCL7, KLKB l, and LYAM1. In some embodiments, the biomarkers measured comprise at least two biomarkers selected from CD14, CD163, CD44, CERU, coll3, CTX2, haptoglobin, HEMO, VTDB or any combination thereof. In some embodiments, the biomarkers measured comprise at least two biomarkers selected from the group consisting of ACTG, ANT3, CD44, CERU, CFAH, CFAI, C08B, FINC, HRG, KLKB l, PLF4, PRG4, SAMP, TSP4 or any combination thereof. In some embodiments, the biomarkers measured comprise ACTG, ANT3, CD44, CERU, CFAH, CFAI, C08B, FINC, HRG, KLKB l, PLF4, PRG4, SAMP, and TSP4.
In some embodiments, the biomarkers measured comprise at least two biomarkers selected from the group consisting of ANT3, CERU, CFAH, C08B, FINC, HRG, PLF4, PRG4, SAMP, TSP4 or any combination thereof. In some embodiments, the biomarkers measured
comprise ANT3, CERU, CFAH, C08B, FINC, HRG, PLF4, PRG4, SAMP, and TSP4. In some embodiments, the biomarkers measured comprise at least two biomarkers selected from the group consisting of ACTG, ANT3, CD44, CFAI, C08B, KLKB 1, PLF4, or any combination thereof. In some embodiments, the biomarkers measured further comprise ACTG, ANT3, CD44, CFAI, C08B, KLKB 1, and PLF4.
In some embodiments, the biomarkers measured comprise at least two biomarkers selected from the group consisting of PGCA, APOH, SAMP, AACT, CFAH, PHLD, TSP1, THRB, or any combination thereof. In some embodiments, the biomarkers measured comprise SAMP and AACT. In further such embodiments, the biomarkers measured further comprise PGCA and/or APOH. In still further such embodiments, the biomarkers measured further comprise CFAH, PHLD, TSP1, and/or THRB. The prognosis includes joint space narrowing.
In some embodiments, the biomarkers measured comprise at least two biomarkers selected from the group consisting of CFAH, SAMP, TSP1, HEP2, C1R, APOB, FINC, HEP2, PGCA, or any combination thereof. In some embodiments, the biomarkers measured comprise CFAH and SAMP. In further such embodiments, the biomarkers measured further comprise TSP1 and/or APOB. In still further such embodiments, the biomarkers measured further comprise HEP2, C1R, FINC, HEP2, and/or PGCA. The prediction includes KL grade.
In some embodiments, the biomarkers measured comprise at least two biomarkers selected from the group consisting of PLF4, CXCL7, ANT3, AACT, THRB, ITIH4, C08B, PLMN, or any combination thereof. In some embodiments, the biomarkers measured comprise PLF4 and AACT. In further such embodiments, the biomarkers measured further comprise CXCL7 and/or ANT3. In still further such embodiments, the biomarkers measured further comprise THRB, ITIH4, C08B, and/or PLMN. The prediction includes osteophyte growth.
In some embodiments, the biomarkers measured comprise at least two biomarkers selected from the group consisting of TSP1, CFAH, THRB, HRG, APOH, AACT, PHLD, AACT, or any combination thereof. In some embodiments, the biomarkers measured comprise TSP1 and CFAH. In further such embodiments, the biomarkers measured further comprise THRB and/or APOH. In still further such embodiments, the biomarkers measured further comprise HRG, AACT, PHLD, and/or AACT. The prediction includes joint space narrowing.
In some embodiments, the biomarkers measured comprise at least two biomarkers selected from the group consisting of CFAH, TSP1, SAMP, APOB, AACT, C1R, or any
combination thereof. In some embodiments, the biomarkers measured comprise CFAH and SAMP. In further such embodiments, the biomarkers measured further comprise TSP1 and/or AACT. In still further such embodiments, the biomarkers measured further comprise APOB and/or C1R. The prediction includes the KL grade.
In some embodiments, the biomarkers measured comprise at least two biomarkers selected from the group consisting of C08B, PLF4, PRG4, ANT3, C4BPA, CXCL7, C4BPA, or any combination thereof. In some embodiments, the biomarkers measured comprise C08B and PLF4. In further such embodiments, the biomarkers measured further comprise PRG4 and/or ANT3. In still further such embodiments, the biomarkers measured further comprise C4BPA, CXCL7, and/or C4BPA. The prediction may include osteophyte growth.
In some embodiments, the biomarkers measured comprise at least two biomarkers selected from the group consisting of C04B, FCN3, C08B, FINC, PGCA, TSP4, TETN, or any combination thereof. In some embodiments, the biomarkers measured comprise C08B and C04B. In further such embodiments, the biomarkers measured further comprise FINC and/or FCN3. In still further such embodiments, the biomarkers measured further comprise PGCA, TSP4, and/or TETN. The prognosis may include joint space narrowing.
In some embodiments, the biomarkers measured comprise at least two biomarkers selected from the group consisting of A2AP, KNG1, HGFA, PRG4, AFAM, DOPO, FINC, C08B, or any combination thereof. In some embodiments, the biomarkers measured comprise KNG1 and HGFA. In further such embodiments, the biomarkers measured further comprise A2AP and/or C08B. In still further such embodiments, the biomarkers measured further comprise PRG4, AFAM, DOPO, and/or FINC. The prediction includes a KL grade determination.
In some embodiments, the biomarkers measured comprise at least two biomarkers selected from the group consisting of CXCL7, C4BPA, C4BPB, A2AP, ITIH4, PLMN, HRG, or any combination thereof. In some embodiments, the biomarkers measured comprise CXCL7 and C4BPA. In further such embodiments, the biomarkers measured further comprise C4BPB and/or A2AP. In still further such embodiments, the biomarkers measured further comprise ITIH4, PLMN, and/or HRG. The prediction includes osteophyte growth.
In some embodiments, the biomarkers measured comprise at least two biomarkers selected from the group consisting of PGCA, C04B, TENX, FCN3, C4BPA, TSP1, C08B,
HRG, or any combination thereof. In some embodiments, the biomarkers measured comprise C04B and PGCA. In further such embodiments, the biomarkers measured further comprise TENX and/or C4BPA. In still further such embodiments, the biomarkers measured further comprise FCN3, TSP1, C08B, and/or HRG. The prognosis may include joint space narrowing.
In some embodiments, the biomarkers measured comprise at least two biomarkers selected from the group consisting of KNG1, HGFA, A2AP, FA5, TSP1, PGCA, TENX, FINC, or any combination thereof. In some embodiments, the biomarkers measured comprise KNG1 and HGFA. In further such embodiments, the biomarkers measured further comprise A2AP and/or PGCA. In still further such embodiments, the biomarkers measured further comprise FA5, TSP1, TENX, and/or FINC. The prediction includes KL grade prediction.
In some embodiments, the biomarkers measured comprise at least two biomarkers selected from the group consisting of C4BPA, C4BPB, CXCL7, LYAM1, A2AP, TSP1, FINC, or any combination thereof. In some embodiments, the biomarkers measured comprise C4BPA and CXCL7. In further such embodiments, the biomarkers measured further comprise C4BPB and/or LYAM1. In still further such embodiments, the biomarkers measured further comprise A2AP, TSP1, and/or FINC. The prediction includes osteophyte growth.
In some embodiments, the biomarkers measured comprise a peptide sequence listed in Table 2A, 2C or 2D. In some embodiments, a prediction of progression of the osteoarthritis in the subject is made if the level of at least one biomarker is altered as compared to the reference level as shown in Table 2A or 2D. In some embodiments, a diagnosis of osteoarthritis or a prediction of progression of the osteoarthritis in the subject is made if the level of at least one biomarker is greater or less than the threshold values shown in Table 2A or 2C. In some embodiments, the biomarkers comprise the sequences listed in the Tables included herein. The various embodiments described herein may be combined or used individually.
The present disclosure is not limited to the specific details of construction, arrangement of components, or method steps set forth herein. The compositions and methods disclosed herein are capable of being made, practiced, used, carried out and/or formed in various ways that will be apparent to one of skill in the art in light of the disclosure that follows. The phraseology and terminology used herein is for the purpose of description only and should not be regarded as limiting to the scope of the claims. Ordinal indicators, such as first, second, and third, as used in the description and the claims to refer to various structures or method steps, are not meant to be
construed to indicate any specific structures or steps, or any particular order or configuration to such structures or steps. All methods described herein can be performed in any suitable order unless otherwise indicated herein or otherwise clearly contradicted by context. The use of any and all examples, or exemplary language (e.g., "such as") provided herein, is intended merely to facilitate the disclosure and does not imply any limitation on the scope of the disclosure unless otherwise claimed. No language in the specification, and no structures shown in the drawings, should be construed as indicating that any non-claimed element is essential to the practice of the disclosed subject matter. The use herein of the terms "including," "comprising," or "having," and variations thereof, is meant to encompass the elements listed thereafter and equivalents thereof, as well as additional elements. Embodiments recited as "including," "comprising," or "having" certain elements are also contemplated as "consisting essentially of and "consisting of those certain elements.
Recitation of ranges of values herein are merely intended to serve as a shorthand method of referring individually to each separate value falling within the range, unless otherwise indicated herein, and each separate value is incorporated into the specification as if it were individually recited herein. For example, if a concentration range is stated as 1% to 50%, it is intended that values such as 2% to 40%, 10% to 30%, or 1% to 3%, etc., are expressly enumerated in this specification. As another example, if it is stated that the biomarkers measured comprise "at least one (or any other number)" biomarker selected from a particular group it is intended that values such as "at least two," "at least three," "at least four," etc. (up until the maximum allowed by the statement) are expressly enumerated in the specification. These are only examples of what is specifically intended, and all possible combinations of numerical values between and including the lowest value and the highest value enumerated are to be considered to be expressly stated in this disclosure. Use of the word "about" to describe a particular recited amount or range of amounts is meant to indicate that values very near to the recited amount are included in that amount, such as values that could or naturally would be accounted for due to manufacturing tolerances, instrument and human error in forming measurements, and the like. All percentages referring to amounts are by weight unless indicated otherwise.
No admission is made that any reference, including any non-patent or patent document cited in this specification, constitutes prior art. In particular, it will be understood that, unless
otherwise stated, reference to any document herein does not constitute an admission that any of these documents forms part of the common general knowledge in the art in the United States or in any other country. Any discussion of the references states what their authors assert, and the applicant reserves the right to challenge the accuracy and pertinence of any of the documents cited herein. All references cited herein are fully incorporated by reference, unless explicitly indicated otherwise. The present disclosure shall control in the event there are any disparities between any definitions and/or description found in the cited references.
The following examples are meant only to be illustrative and are not meant as limitations on the scope of the invention or of the appended claims.
EXAMPLES
For this project, candidate prognostic and diagnostic biomarkers in non-depleted (normal serum) and depleted serum (serum treated to deplete one or more abundant serum proteins as described more fully below) were evaluated by mass spectrometry. We tested a multiple reaction monitoring (MRM) panel developed on the basis of three discovery proteomics experiments: in synovial fluid, urine and depleted serum. Below we describe the results for a cohort of 124; approximately two-thirds of the subjects were selected on the basis of knee osteoarthritis with either knee OA progression or stability (non-progression) and the remaining one-third of subjects were controls without knee osteoarthritis.
Subjects and Methods
Cohorts: Subjects were selected from two cohorts, the Prediction of Osteoarthritis
Progression (POP) cohort, and the Genetics of Generalized Osteoarthritis (GOGO) cohort. Kraus et al., Ann Rheum Dis 68(11): 1673-9 (2009); Kraus et al., Osteoarthritis Cartilage 15(2): 120-7 (2007). In brief, POP was a single site study at Duke with 159 subjects recruited on the basis of symptomatic radiographic knee OA of at least one knee; a total of 138 subjects (87%) returned for 3-year follow-up. Knee synovial fluid (from both knees when possible), serum (2 hour post-prandial) and urine (second morning void) were obtained at each evaluation. GOGO was a multi-site (7 sites) study with 2728 subjects recruited on the basis of two siblings with hand OA (defined as 3 joint radiographic KL>2 grade distributed bilaterally). Knee, hip and spine radiographs were obtained. A total of 1329 subjects from 4 sites returned for follow-up at a mean 3.8 years (range 1.4 - 6.5 years). Serum (two hour post-prandial) and urine (second morning void or time recorded if other than this) were obtained at each evaluation. The
demographics are shown in Table 1 for the patient subsets used for each aspect of biomarker discovery and validation.
Phenotypes
Phenotypes were based on 2 features from knee radiographs (joint space narrowing (JSN) and osteophyte (OST)) evaluated at 2 levels (knee based and person-based). JSN, indicative of cartilage and/or meniscal extrusion loss (cartilage and/or meniscal catabolism), and osteophyte, indicative of bone formation at the margins of the joint (joint tissue anabolism), were graded on a scale 0-3 using a standardized atlas with 0 being normal and 1, 2, and 3 representing increasing severity. Altman RD and Gold GE, Osteoarthritis Cartilage 15 Suppl A:Al-56 (2007). The medial and lateral compartments of the knee were graded for JSN (yielding a maximum score of 6 per knee joint); the four margins of the knee were graded for OST (yielding a maximum score of 12 per knee joint). Progression was defined as a one unit change over time in these variables at a knee level or person level. A Diagnosis of OA was defined as any OA represented by a score of greater than or equal to 1 for these variables at a knee level or person level. In addition, a half- century old definition of OA, the Kellgren Lawrence grade, scored on a 0-4 scale, was also evaluated for a one unit change (defining progression) or any OA (defined as KL >2). Kellgren JH and Lawrence JS, Ann Rheum Dis 16(4):494-502 (1957). Controls for each phenotype were defined as a knee or person that did not meet the minimal definition.
Table 1. Patient demographics for sample sets used in experiments.
C=control Number for Number for
NP=non- JSN OST Mean Age, Mean BMI,
Gender
progressor Person Person SD (range) SD (range)
P=progressor knee knee
% 2
C/NP/P C/NP/P years
female kg / m
SF Proteomics 1/12/10 3/5/15 67+12 30.4 + 5.8
74%
(N=23) 9/16/21 9/16/21 (43 - 80) (23 - 47)
Urine
14/16/15 16/9/20 62+12 29.3 + 6.6 Proteomics 76%
32 / 36 / 22 37 / 23 / 30 (41 to 81) (18.6-50.0) (N=45)
Urine ELISA 47/32/33 40 / 24 / 48 65 + 10 28.7 + 6.6
59%
(N=118) 109 / 65 / 52 94 / 66 / 66 (41 - 86) (18.6-61.7)
Serum MRM
4/16/20 3/11/26 63 + 12 30.0 + 6.1 Validation 78%
13/38/29 10/30/40 (42 - 80) (20 - 50)
(N=40)
Serum MRM 50 /34/38 41/37/54 64+10 82% 27.6 + 6.1
and ELISA 116 / 69 / 61 98 / 72 / 76 (41 - 86) (18.6 - 61.7) (N=124)
control' NP=non-progressor; P=progressor; SF=synovial fluid; VIRM=multiple reaction monitoring
Statistical Methods
Two classes of methods were used, inferential methods and predictive methods, depending on the structure of the data. For person-level analysis, logistic regression was used to compute p-values and confidence intervals. Covariates included age, sex, BMI, and cohort. The effect of a biomarker was added to a model containing these covariates and a likelihood-ratio test was used to assess the significance of the biomarker after accounting for the covariates. A biomarker was considered significant if it surpassed a Benjamini-Hochberg FDR threshold of 10%. We defined person level phenotypes as follows: a person-level control as both knees normal; a person level osteoarthritis diagnosis as at least one knee with osteoarthritis; a person level knee osteoarthritis progressor as having at least one knee that has progressive osteoarthritis over time; and a person level non-progressor as having neither knee progressing over time. For a knee-level analysis the dependence arising from paired observations must be considered. We used the generalized estimating equation (GEE) method to account for the correlation structure. A biomarker was added to a model containing base covariates and its significance was assessed by a Wald statistic.
We evaluated the capability of the biomarkers described herein to predict or diagnose osteoarthritis based on its separate features consisting of: cartilage and/or meniscal extrusion or loss (reflected in radiographic joint space narrowing), an anabolic repair response (reflected in radiographic osteophyte presence and growth), and the Kellgren-Lawrence grade of disease (reflecting both osteophyte and joint space narrowing).
Predictive models were used to assess discrimination through the AUC. We used feature selection coupled with ridge regression, a form of penalized regression, for all models implemented in the glmnet R package. Penalized regression is often used for predictive models to constrain the size of coefficients to lessen the effects of overfitting the data. Feature selection consisted of selecting the 8 markers with the lowest p-values, which is a simple but effective method for the numbers of peptides in the current data set. Leave-one-out cross-validation was used in which selecting tuning parameters and carrying out feature selection was repeated at each
iteration of cross-validation to mimic the process of fitting a model to new data. In sum, all multimarker AUCs have been properly cross-validated. For knee-level (paired) analysis, the leave-one-out cross-validation scheme was modified to a leave-sample-out scheme so that the test set was independent of the training set. Of note, an AUC 0.80 ~ sensitivity and specificity of 75% (depending on clinical context) and odds ratio 9-10. Qoronfleh et al., Drug Discovery World Winter: 19-28 (2011).
The mean and SD values of ELISA results are natural log values for two of the serum markers that had skewed distributions (Hyaluronan and Ceruloplasmin), and all the urine biomarkers. None of the other serum markers were log transformed. Some values are negative because they are natural log transformations of values less than 1. In particular, all of the urine values were normalized prior to the analysis. Two separate ways of normalizing the urine values were tested: 1) by dividing the urine biomarker level by the creatinine value and taking the natural log [urine 1 variation], and 2) by dividing the urine biomarker level by the creatinine level and the cystatin level and taking the natural log [urine 2 variation]. In this case it is possible for some values to be negative because the natural log of a fraction is < 0.
Of note, for the MRM analyses, the same amount of heavy labeled peptide was spiked into depleted and non-depleted serum; in retrospect, approximately one third this amount would have been more appropriate for non-depleted serum as it would have more closely approximated amounts of the biomarkers targeted for quantification in the non-depleted serum.
Results
1. Technical Validation
To assess analytical variation across all of the targeted analytes, a cost effective strategy for quality control (QC) was adopted a priori for this project. This consisted of creating a representative quality control sample by pooling equal portions of all patient samples within a particular matrix (i.e. synovial fluid, urine or serum). This approach allows for any matrix- specific interferences to be included in the technical variation calculations.
The analytical measurements were made from this QC sample many times throughout the analysis of the cohort samples. This allowed the measurement of the reproducibility of the quantification for the exact species of interest at the concentration levels where they are found in the sample. The closer an absolute signal is to its limit of detection or lower limit of quantification, the lower the expected reproducibility (or greater the expected variability). For
this study we defined the acceptable upper limit of variability of repeated measurements of any analyte within a sample to be 30% relative to the standard deviation. This limit was based on our expectation that any real biological or treatment group dependent variation would achieve this level of variability or higher; this threshold is consistent with a range of coefficients of variation (CVs 20-35%) for proteomics studies deemed acceptable in a recent summary of a workshop held at the National Institutes of Health with representatives from the multiple communities developing and employing targeted mass spectrometry assays. Carr et al., Mol Cell Proteomics 13(3):907-17 (2014). Figure 2 (above) plots CVs for each of the 147 targeted analytes representing 99 proteins (as a ratio of the heavy to light peptides) across all analyses of the QC sample; of note this does not include the 6 Alcohol Dehydrogenase control peptides. The blue dots represent peptides accepted into the final MRM panel of 146 analytes; the red dots represent the peptides rejected from the final dataset for analysis. As expected, the CVs (blue dots) tend to increase at lower ratios because their quantity approaches the lower limit of quantification for these analytes. The red dots show no correlation to ratio, as their quantification is likely confounded by matrix interferences.
2. Proteomics Results
For this project, candidate prognostic and diagnostic biomarkers were identified by three means: through discovery proteomics experiments in synovial fluid and urine by liquid chromatography mass spectrometry (LC/MS); and a discovery proteomics experiment in depleted serum (serum depleted of the 14 most abundant serum proteins. Based on this work, we selected a potential list of 155 peptides corresponding to 110 proteins for MRM assay development. The MRM assay was evaluated in synovial fluid (pooled samples from 3 progressor and 3 non-progressor knee OA patients) and test sera (3 progressor and 3 non- progressor knee OA patient samples for both depleted and non-depleted serum). Of the original 155 peptides, a total of 146 peptides from 99 proteins were detectable in these test samples and selected for final validation in depleted and non-depleted serum of 124 patients by MRM. Additionally, ELISA based analyses were used to evaluate some prognostic and diagnostic biomarker candidates when commercial ELISA kits were available for a biomarker of interest.
As described above, a final total of 146 peptides (99 proteins) were evaluated in this study by mass spectrometry. Below are listed the results from serum proteomic analysis of the non-depleted serum and the MARS H depleted serum. MARS H depleted serum is serum after it
has been subjected to a column absorption to remove 14 of the most abundant serum proteins such that the abundance of these proteins does not interfere with the measurement and analysis of other serum proteins. The 14 depleted proteins include the following: albumin, IgG, IgA, transferrin, haptoglobin, anti-trypsin, fibrinogen, alpha 2-macroglobulin, IgM, apolipoprotein AI, apolipoprotein All, complement C3, and transthyretin. To date, more extensive statistical analyses have been performed on the non-depleted serum because results were stronger than with the depleted serum; in general results are consistent between the two. We also experimented with the use of a normalization peptide (actin) in one case (diagnosis of knee level Osteoarthritis) and it showed a slight improvement in AUCs. Further normalization peptides are reported below. A total of 19 of 97 of the panel of OA proteins were predicted to be involved in the pathogenesis of OA and might have the potential to be 'direct biomarkers' of OA; 1 of these 19 was associated with development of a connective tissue disorder; and 16 of the 19 were linked to the process of post-translational modification, protein degradation and synthesis in OA cartilage. A summary of the markers and corresponding peptides for the proteomic results discussed below is shown in Tables 2A, 2B, 2C and 2D.
Table 2A: Summary of Markers and Corresponding Peptides; lower case marker names in peptide sequence column indicate markers that were detected by ELISA. All markers listed were found to have a statistically significant association (p-value < 0.05) with osteoarthritis diagnosis,
prediction of osteoarthritis progression, or both.

LAIPEGK 15 < >
APOB P04114
WNFYYSPQSSPDK 16
APOE P02649 LQAEAFQAR 17 >
APOH P02749 ATFGCHDGYSLDGPEEIECTK 18 >
B2MG P61769 VEHSDLSFSK 19
C1QC P02747 VVTFCGHTSK 20 <, >
NIGEFCGK 21
C1R P00736 GLTLHLK 22 >
GYGFYTK 23 >
C1RL Q9NZP8 GSEAINAPGDNPAK 24
LSLEIEQLELQR 25 >
C4BPA P04003
GVGWSHPLPQCEIVK 26 > >
C4BPB P20851 SQCLEDHTWAPPFPICK 27 >
CD14 cdl4
CD 163 cdl63
YGFIEGHVVIPR 28 >
CD44 PI 6070
cd44
HYYIAAEEIIWNYAPSGIDIFTK 29 <
cerulo
EYTDASFTNR 30
CERU P00450
DIASGLIGPLIICK 31
G A YPLS IEPIG VR 32
EVGPTNADPVCLAK 33
CFAB P00751 QLNEINYEDHK 34
CFAH P08603 CLPVTAPENGK 35 >
HGNTDSEGIVEVK 36 > >
CFAI P05156
AQLGDLPWQVAIK 37 >
CILP1 075339 IVGPLEVNVR 38
CIS P09871 LLEVPEGR 39 >
CNDP1 Q96KN2 ALEQDLPVNIK 40
S S GQWQTPG ATR 41 <
C02 P06681
DGNDHSLWR 42 >
C04B P0C0L5 LVNGQS HIS LS K 43
GIYGTISR 44 > >
TLLPVSKPEIR 45 > >
C05 P01031 IIHFGTR 46 >
FSYSSGHVHLSSENK 47
SYFPESWLWEVHL VPR 48
E VQ VFEITENS AK 49 >
C06A3 P12111
LLPSFVSSENAFYLS PDIR 50
C08B P07358 GILNEIK 51 > >
C08G P07360 QLYGDTGVLGR 52 > >
C09 P02748 FTPTETNK 53
coll3 coll3
NALWHTGDTES QVR 54 >
COMP P49747 SSTGPGEQLR 55 >
SNPDQADVDHDFVGDAC 56
DSDQDQDGDGHQDSR
CTXla ctxla_ctxlb
CTXlb ctxla_ctxlb
CTX2 ctx2
CTXi ctxi
CXCL7 P02775 NIQSLEVIGK 57 > >
DOPO P09172 VISTLEEPTPQCPT SQGR 58
ECM1 Q16610 FCEAEFSVK 59 >
FA12 P00748 CLEVEGHR 60
SEAYNTFSER 61 >
FA5 P12259
EFNPLVIVGLSK 62 >
FBLN1 P23142 TGYYFDGISR 63
NPCQDPYILTPENR 64 >
FBLN3 Q12805
ADQVCINLR 65 >
FCGBP Q9Y6R7 VTASSPVAVLSGH SCAQK 66
FCN3 075636 TFAHYATFR 67
HTLNQIDEVK 68
FETUA P02765
FSVVYAK 69 >
EYLGAICSCTCF GGQR 70 >
FINC P02751
IGDTWSK 71 >
GELS P06396 GGVASGFK 72 >
HA HA
FCEIGSDDCYVG DGYSYR 73
HABP2 Q14520
GQCLITQSPPYYR 74 >
haptoglobin
Hapto
QGHNSVFLIK 75
HEMO P02790
hemopexin
NFGYTLR 76 >
HEP2 P05546
FTVDRPFLFLIYEHR 77 >
HGFA Q04756 YIPYTLYSVFNPS DHDLVLIR 78
DSPVLIDFFEDTER 79 >
GGEGTGYFVDFSVR 80
HRG P04196 YWNDCEPPDSR 81 >
GEVLPLPEANFPS FPLPHHK 82
SSTTKPPFKPHGSR 83
hyaluronan hyaluronan
IC1 P05155 LVLLN AIYLS AK 84
ΓΓΙΗ1 P19827 VTFQLTYEEVLK 85
ΓΓΙΗ4 Q14624 FKPTLSQQQK 86 >
KLKB 1 P03952 VSEGNHDIALIK 87 >
LDDDLEHQGGH VLDHGHK 88 >
KNG1 P01042
kinno
LAMA2 P24043 TP YNILS S PD Y VG VTK 89
ILGPLSYSK 90 >
LUM P51884 VANEVTLN 91 >
SLEDLQLTHNK 92
LYAM1 P14151 AEIEYLEK 93
MASP1 P48740 TG VITS PDFPNP YPK 94
PCOC1 Q15113 TGGLDLPS PPT GAS LK 95 >
VSLPNYPAIPSD ATLEVQSLR 96 < >
PGCA P16112
EVVLLVATEGR 97
PHLD P80108 FGSSLITVR 98 > >
PLF4 P02776 ICLDLQAPLYK 99 > >
PLMN P00747 HSIFTPETNPR 100 >
ITEVWGIPSPIDTVFTR 101 >
PRG4 Q92954
DQYYNIDVPSR 102 >
RET4 P02753 LIVHNGYCDGR 103 >
SAMP P02743 AYSDLSR 104 > >
SHBG P04278 IALGGLLFP AS NLR 105 <
TENX P22105 TVTVEDLEPGK 106
TETN P05452 TFHEASEDCISR 107 >
NALALFVLPK 108
THBG P05543
AVLHIGEK 109
THRB P00734 NPDSSTTGPWC YTTDPTVR 110 >
TIMP1 P01033 GFQALGDAADIR 111 > >
TSP1 P07996 FVFGTTPEDILR 112 > >
DVDIDSYPDEEL PCSAR 113 >
TSP4 P35443
AVAEPGIQLK 114
vitd_binding
ELPEHTVK 115
VLEPTLK 116
VTDB P02774
LCDNLSTK 117
SCESNSPFPVHPG TAECCTK 118
SLGECCDVEDST TCFNAK 119
VTNC P04004 QPQFISR 120 <
ZA2G P25311 DIVEYYNDSNG SHVLQGR 121
ZPI Q9UK55 VVNPTLL 122 >
Table 2B: Peptide key

C4BPB P20851 Complement pathway
chain
CD44 PI 6070 CD44 HA cell surface binding receptor
ferroxidase activity and iron transport
CERU P00450 Ceruloplasmin
across the cell membrane
CFAB P00751 Complement factor B Complement pathway
CFAH P08603 Complement factor H Complement pathway
CFAI P05156 Complement factor I Complement pathway
Cartilage intermediate
CILP1 075339 Cartilage protein
layer protein 1
CNDP1 Q96KN2 Beta-Ala-His dipeptidase Serum metaloproteinase
C02 P06681 Complement C2 Complement pathway
C04B P0C0L5 Complement C4-B Complement pathway
C05 P01031 Complement C5 Complement pathway
C05A1 P20908 Collagen alpha- 1(V) chain Type V fibular collagen
Complement component
C05A1 P20908 Complement pathway
C6
Complement component
C06 P13671 Complement pathway
C6
C06A3 P12111 Collagen alpha-3(VI) chain Collagen VI, cell binding
Complement component
C08B P07358 Complement pathway
C8 beta chain
Complement component
C08G P07360 Complement pathway
C8 gamma chain
Complement component
C09 P02748 Complement pathway
C9
C09A3 Q14050 Collagen alpha-3(IX) chain Type IX collagen
Cartilage oligomatrix
COMP P49747 Cartilage ECM protein
protein
Collagen alpha- 1 (XXIV)
COOA1 Q17RW2 Fibular collagen XIV
chain
CRACl ECM protein found in cartilage, bone
Q9NQ79 Cartilage acidic protein 1
CRTAC and lung
CSPG2 P13611 Versican core protein ECM protein binds HA
stimulates DNA synthesis, mitosis, glycolysis, cAMP accumulation,
CXCL7 P02775 Platelet basic protein
prostaglandin E2, and synthesis of HA and GAG
Dopamine beta- Conversion of dopamine to
DOPO P09172
hydroxylase noradrenaline
Involved in endochondral bone
Extracellular matrix
ECM1 Q16610 formation as negative regulator of bone protein 1
mineralization
Coagulation factor XIII B Glycoprotein involved in blood
F13B P05160
chain coagulation
Serine proteinase involved in blood
FA12 P00748 Coagulation factor XII
coagulation
FA5 P12259 Coagulation factor V Blood coagulation, Hemostasis
FBLN1 P23142 Fibulin- 1 ECM protein
EGF-containing fibulin- Fibulin-3, ECM protein, May function
FBLN3 Q12805 like extracellular matrix as a negative regulator of chondrocyte protein 1 differentiation
May be involved in the maintenance of
FCGBP Q9Y6R7 IgGFc-binding protein
the mucosal structure
FCN3 075636 Ficolin-3 May function in innate immunity
FETUA P02765 Alpha-2-HS -glycoprotein influences the mineral phase of bone
FINC P02751 Fibronectin ECM multiple roles
FRAS 1 -related
FREM2 Q5SZK8 extracellular matrix protein Cell membrane adhesion protein
2
GELS P06396 Gelsolin Plasma protein
Hyaluronan-binding
HABP2 Q14520 Plasma serine proteinase
protein 2
HEMO P02790 Hemopexin Binds heme and transports it to the liver
Blood coagulation, Chemotaxis,
HEP2 P05546 Heparin cofactor 2
hemostatsis
Hepatocyte growth factor
HGFA Q04756 Activates hepatocyte growth factor activator
Hyaluronan and Link protein, cartilage ECM HA
HPLN1 P10915
proteoglycan link protein 1 binding protein
Angiogenesis, Blood coagulation,
HRG P04196 Histidine-rich glycoprotein
Chemotaxis, Fibrinolysis, Hemostasis
Plasma protease CI
IC1 P05155 SERPINGl inhibits CI of complement inhibitor
Inward rectifier potassium
IRK4 P48050 Potassium channel
channel 4
Inter-alpha-trypsin Protease inhibitors erine protease
ITIH1 P19827
inhibitor heavy chain HI inhibitor, binds HA
Inter-alpha-trypsin
ITIH4 Q14624 Acute phase protein
inhibitor heavy chain H4
Centrosomal protein
KIZ Q2M2Z5 Centrosomal protein
kizuna
KLKB 1 P03952 Plasma kallikrein Serine protease
Protease inhibitor, Thiol protease
KNG1 P01042 Kininogen-1
inhibitor, Vasoactive, Vasodilator
LAMA2 P24043 Laminin subunit alpha-2 Cell ECM binding
LUM P51884 Lumican Cartilage ECM protein
LYAM1 P14151 L-selectin rolling of leukocytes
Mannan-binding lectin
MASP1 P48740 Lectin complement pathway
serine protease 1
Micro tubule-as sociated
MAST3 060307 serine/threonine-protein Cytoplasmic enzyme
kinase 3
Procollagen C-
PCOC1 Q15113 Type 1 collagen fibril formation
endopeptidase enhancer 1
PGBM P98160 Perlecan ECM protein
PGCA P16112 Aggrecan core protein Cartilage ECM HA binding protein
N-acetylmuramoyl-L- May play a scavenger role by digesting
PGRP2 Q96PD5
alanine amidase biologically active peptidoglycan
Pho sphatidylino sitol- hydrolyzes the inositol phosphate
PHLD P80108 glycan-specific
linkage in proteins
phospholipase D
PLF4 P02776 Platelet factor 4 Released during platelet aggregation
Blood coagulation, Fibrinolysis,
PLMN P00747 Plasminogen
Hemostasis. Tissue remodeling
PRG4 Q92954 Proteoglycan 4 Lubricin, cartilage ECM protein
PRELI domain containing
PRLD2 Q8N945 Mitrochondrial
2
PZP P20742 Pregnancy zone protein inhibit all four classes of proteinases
RET4 P02753 Retinol-binding protein 4 Retinol transporter protein
RTN4 Q9NQC3 Reticulon-4 neurogenesis
Runt-related transcription osteoblastic differentiation and skeletal
RUNX2 Q13950
factor 2 morphogenesis
Can interact with DNA and histones
Serum amyloid P-
SAMP P02743 and may scavenge nuclear material component
released from damaged circulating cells
Selenium transport and ECM
SEPP1 P49908 Selenoprotein P
antioxidant
Sex hormone-binding
SHBG P04278 androgen transport protein
globulin
Spectrin alpha chain, non- Ca depended cytoskeletal re¬
SPTA2 Q13813
erythrocytic 1 organization
TENX P22105 Tenascin X Anti-adhesive ECM glycoprotein
TETN P05452 Tetranectin Plasma protein
Thyroxine-binding Major thyroid hormone transport
THBG P05543
globulin protein in serum.
Acute phase, Blood coagulation,
THRB P00734 Prothrombin
Hemostasis
Tissue inhibitor
TIMP1 P01033 MMP inhibitor
metalloproteinase 1
trinucleotide repeat
TNR6C Q9HCJ0 miRNA silencing
containing 6C
TSP1 P07996 Thrombospondin 1 Cell/cell/matrix binding
Mediates cell/cell and cell/matrix
TSP4 P35443 Thrombospondin-4
adhesion
VTDB P02774 Vitamin D-binding protein Vitamin D transporter protein
VTNC P04004 vitronectin Cell/matrix adhesion factor
Stimulates lipid degradation in
ZA2G P25311 Zinc-alpha-2-glycoprotein
adipocytes
Protein Z-dependent
ZPI Q9UK55 Blood coagulation, Hemostasis
protease inhibitor
Table 2C: Diagnostic Data (OA = Osteoarthritis, C=Control)
lgiioslic Data
phenotype (SEQ ID NO: X) 1 OAmean OAsd Cmean Csd
M RM markers; llOI eplelecl Serum: knee
Knee_JSN_Pheno_Q9NQ79_CRAC 1_GVA -5.3467 0.31328 -5.5677 0.29133 SLFAGR (1)
Knee_JSN_Pheno_P02775_CXCL7_NIQSL -1.579 0.26191 -1.8924 0.78391 EVIGK (57)
Knee_JSN_Pheno_P04217_AlBG_IFFHLN 0.01795 0.2559 -0.0399 0.22048 AVALGDGGHYTCR (3)
Knee_JSN_Pheno_P02776_PLF4_ICLDLQ -2.6781 0.31999 -2.9236 0.74256 APLYK (99)
Knee_JSN_Pheno_P05452_TETN_TFHEAS -2.7375 0.23026 -2.824 0.23499 EDCISR (107)
Knee_JSN_Pheno_P01033_TIMPl_GFQAL -5.5478 0.39529 -5.7389 0.421 GDAADIR (111)
Knee_JSN_Pheno_P49747_COMP_NALW -5.2222 0.39632 -5.4563 0.48604 HTGDTESQVR (54)
Knee_JSN_Pheno_P04003_C4BPA_LSLEI -0.6158 0.24333 -0.732 0.21636 EQLELQR (25)
Knee_JSN_Pheno_P07996_TSPl_FVFGTT -3.9111 0.33405 -4.1246 0.70016 PEDILR (112)
Knee_JSN_Pheno_P80108_PHLD_FGSSLI -3.9109 0.31233 -4.0202 0.295 TVR (98)
Knee_JSN_Pheno_P 16112_PGC A_VSLPN -8.5077 0.60466 -8.3027 0.59736 YPAIPSDATLEVQSLR (96)
Knee_JSN_Pheno_P04003_C4BPA_GVGW -0.6333 0.30499 -0.7658 0.27236 SHPLPQCEIVK (26)
Knee_JSN_Pheno_P01031_CO5_GIYGTIS -2.6335 0.19845 -2.727 0.18412 R (44)
Knee_JSN_Pheno_P51884_LUM_ILGPLS Y -2.2931 0.18757 -2.381 0.17292 SK (90)
Knee_JSN_Pheno_P01031_CO5_TLLPVSK -2.6148 0.19708 -2.7026 0.18569 PEIR (45)
Knee_JSN_Pheno_P07360_CO8G_QLYGD -4.6571 0.35419 -4.8008 0.38448 TGVLGR (52)
Knee_JSN_Pheno_P20851_C4BPB_SQCLE -2.4987 0.25857 -2.6078 0.24415
DHTWAPPFPICK (27)
Knee JSN Pheno P01031 C05 IIHFGTR -2.4834 0.2052 -2.5725 0.19137
(46)
Knee_JSN_Pheno_P05156_CFAI_HGNTDS -2.1353 0.23576 -2.2203 0.2542
EGIVEVK (36)
Knee_JSN_Pheno_P02743_SAMP_AYSDL -1.172 0.26186 -1.3063 0.39507
SR (104)
Knee_JSN_Pheno_Q9NQ79_CRACl_SSPY -5.3076 0.32576 -5.4371 0.30832
YALR (2)
Knee_JSN_Pheno_Q15113_PCOC 1_TGGL -5.0009 0.19706 -5.0763 0.17589
DLPS PPTG AS LK (95)
Knee_JSN_Pheno_P12259_FA5_SEAYNTF -4.6902 0.23862 -4.7772 0.27625
SER (61)
Knee_JSN_Pheno_P51884_LUM_VANEVT -1.3903 0.22821 -1.4664 0.22184
LN (91)
Knee_JSN_Pheno_P04278_SHBG_IALGGL -4.7876 0.75918 -4.5138 0.65685
LFPASNLR (105)
Knee_KL_Pheno_Q9NQ79_CRAC 1_GVAS -5.36 0.30055 -5.634 0.28483
LFAGR (1)
Knee_KL_Pheno_Q9NQ79_CRAC 1_SSPY -5.2986 0.30834 -5.5093 0.30855
YALR (2)
Knee_KL_Pheno_P07360_CO8G_QLYGDT -4.6643 0.36247 -4.8469 0.3723
GVLGR (52)
Knee_KL_Pheno_P49747_COMP_NALWH -5.2483 0.40041 -5.5027 0.51099
TGDTESQVR (54)
Knee KL Pheno P07358 C08B GILNEIK -4.337 0.36071 -4.4394 0.33841
(51)
Knee_KL_Pheno_P04004_VTNC_QPQFIS -2.5841 0.32518 -2.4986 0.31075
R (120)
Knee_KL_Pheno_P04278_SHBG_IALGGL -4.7795 0.74084 -4.415 0.62606
LFPASNLR (105)
Knee_KL_Pheno_P02775_CXCL7_NIQSLE -1.6465 0.43393 -1.8899 0.80079
VIGK (57)
Knee_KL_Pheno_Q 15113_PCOC 1_TGGLD -5.0083 0.20352 -5.0934 0.14771
LPS PPTG AS LK (95)
Knee_KL_Pheno_P12111_C06A3_EVQVF -5.7888 0.27059 -5.9159 0.24476
EITENSAK (49)
Knee_KL_Pheno_P51884_LUM_ILGPLS Y -2.3063 0.18911 -2.3918 0.16554
SK (90)
Knee_KL_Pheno_P02743_SAMP_AYSDLS -1.195 0.2826 -1.317 0.41746
R (104)
Knee KL Pheno P01031 C05 IIHFGTR -2.5003 0.21274 -2.5762 0.17348
(46)
Knee_KL_Pheno_P51884_LUM_VANEVT -1.4005 0.22997 -1.4781 0.21611 LN (91)
Knee KL Pheno P01031 C05 GIYGTISR -2.6535 0.21307 -2.7265 0.15017 (44)
Knee_KL_Pheno_P04003_C4BPA_LSLEIE -0.6435 0.25492 -0.7256 0.18876 QLELQR (25)
Knee_OST_Pheno_Q9NQ79_CRAC 1_GVA -5.353 0.30661 -5.5993 0.28726 SLFAGR (1)
Knee_OST_Pheno_Q9NQ79_CRAC 1_SSP -5.2892 0.30785 -5.4886 0.31058 YYALR (2)
Knee_OST_Pheno_P04004_VTNC_QPQFIS -2.5963 0.31787 -2.4944 0.32087 R (120)
Knee_OST_Pheno_P49747_COMP_NALW -5.2442 0.40004 -5.467 0.50102 HTGDTESQVR (54)
Knee_OST_Pheno_P04278_SHBG_IALGG -4.7799 0.74413 -4.4746 0.65493 LLFPASNLR (105)
Knee_OST_Pheno_P12111_C06A3_EVQV -5.7842 0.27689 -5.9018 0.24009 FEITENSAK (49)
Knee_OST_Pheno_Q15113_PCOC 1_TGGL -5.0092 0.20737 -5.078 0.15463 DLPS PPTG AS LK (95)
M R.M markers: non-ck 'pletecl Sci •urn: pei on
Knee_JSN_person_Pheno_P00450_CERU_ 0.65572 0.24983 0.76035 0.27569 H Y YIA AEEirWN Y APS GIDIFTK (29)
Knee_JSN_person_Pheno_P01031_CO5_GI -2.6381 0.20909 -2.7346 0.16563 YGTISR (44)
Knee_JSN_person_Pheno_P01031_CO5_II -2.4887 0.21661 -2.5783 0.17261 HFGTR (46)
Knee_JSN_person_Pheno_P01031_CO5_TL -2.6187 0.20754 -2.7103 0.16802 LPVSKPEIR (45)
Knee_JSN_person_Pheno_P01033_TIMPl_ -5.5604 0.40065 -5.7497 0.42285 GFQALGDAADIR (111)
Knee_JSN_person_Pheno_P02743_SAMP_ -1.1745 0.27542 -1.3229 0.39912 AYSDLSR (104)
Knee_JSN_person_Pheno_P02775_CXCL7_ -1.5899 0.27108 -1.924 0.83168 NIQSLEVIGK (57)
Knee_JSN_person_Pheno_P02776_PLF4_IC -2.6915 0.33412 -2.9413 0.78317 LDLQAPLYK (99)
Knee_JSN_person_Pheno_P04003_C4BPA_ -0.6459 0.33432 -0.7677 0.2194 GVGWSHPLPQCEIVK (26)
Knee_JSN_person_Pheno_P04003_C4BPA_ -0.6165 0.25436 -0.7484 0.18988 LSLEIEQLELQR (25)
Knee_JSN_person_Pheno_P04217_AlBG_I 0.00845 0.27983 -0.0351 0.17265 FFHLNAVALGDGGHYTCR (3)
Knee_JSN_person_Pheno_P04278_SHBG_I -4.7677 0.77275 -4.501 0.62726
ALGGLLFP AS NLR (105)
Knee_JSN_person_Pheno_P07360_CO8G_ -4.6695 0.36108 -4.8047 0.38572 QLYGDTGVLGR (52)
Knee_JSN_person_Pheno_P07996_TSPl_F -3.9283 0.35544 -4.1322 0.73241 VFGTTPEDILR (112)
Knee_JSN_person_Pheno_P12259_FA5_SE -4.6923 0.24286 -4.7873 0.27747 AYNTFSER (61)
Knee_JSN_person_Pheno_P20851_C4BPB_ -2.5112 0.27892 -2.6064 0.21459 SQCLEDHTWAPPFPICK (27)
Knee_JSN_person_Pheno_P49747_COMP_ -5.2389 0.40342 -5.4677 0.49665 NALWHTGDTES QVR (54)
Knee_JSN_person_Pheno_P51884_LUM_IL -2.2943 0.18871 -2.3925 0.16777 GPLSYSK (90)
Knee_JSN_person_Pheno_P51884_LUM_V -1.3877 0.23105 -1.4815 0.21506 ANEVTLN (91)
Knee_JSN_person_Pheno_Q 15113_PCOC 1 -4.9982 0.19726 -5.0915 0.16919 _TGGLDLPS PPT GAS LK (95)
Knee_JSN_person_Pheno_Q9NQ79_CRAC -5.3647 0.31833 -5.5753 0.28924 1_GVASLFAGR (1)
Knee_JSN_person_Pheno_Q9NQ79_CRAC -5.3165 0.32877 -5.4439 0.30529 1_SSPYYALR (2)
Knee_KL_person_Pheno_P01031_CO5_GI -2.6531 0.21059 -2.7391 0.14588 YGTISR (44)
Knee_KL_person_Pheno_P01031_CO5_IIH -2.4986 0.21063 -2.5922 0.1707 FGTR (46)
Knee_KL_person_Pheno_P02743_SAMP_A -1.1947 0.27677 -1.3369 0.44546 YSDLSR (104)
Knee_KL_person_Pheno_P02775_CXCL7_ -1.6407 0.42587 -1.9424 0.85113 NIQSLEVIGK (57)
Knee_KL_person_Pheno_P04278_SHBG_I -4.7405 0.75939 -4.4535 0.59653 ALGGLLFP AS NLR (105)
Knee_KL_person_Pheno_P05156_CFAI_A -2.3816 0.24298 -2.5067 0.27195 QLGDLPWQVAIK (37)
Knee_KL_person_Pheno_P05156_CFAI_H -2.1467 0.24629 -2.247 0.24236 GNTDSEGIVEVK (36)
Knee_KL_person_Pheno_P07360_CO8G_Q -4.6628 0.36307 -4.8793 0.36711 LYGDTGVLGR (52)
Knee_KL_person_Pheno_P12111_C06A3_ -5.7924 0.26658 -5.927 0.25429 E VQ VFEITENS AK (49)
Knee_KL_person_Pheno_P12259_FA5_SE -4.7013 0.24808 -4.8058 0.27986 AYNTFSER (61)
Knee_KL_person_Pheno_P49747_COMP_N -5.2524 0.39475 -5.5326 0.5373 ALWHTGDTES QVR (54)
Knee_KL_person_Pheno_P51884_LUM_IL -2.3066 0.18753 -2.4043 0.16517
GPLSYSK (90)
Knee_KL_person_Pheno_P51884_LUM_V -1.3978 0.22966 -1.497 0.21235 ANEVTLN (91)
Knee_KL_person_Pheno_Q 15113_PCOC 1_ -5.0045 0.20633 -5.116 0.11555 TGGLDLPS PPT GAS LK (95)
Knee_KL_person_Pheno_Q9NQ79_CRACl -5.365 0.30117 -5.6649 0.27366 _GVASLFAGR (1)
Knee_KL_person_Pheno_Q9NQ79_CRACl -5.2981 0.31394 -5.5437 0.28344 _SSPYYALR (2)
Knee_KL_person_Pheno_Q9UK55_ZPI_VV -3.0199 0.13919 -3.0653 0.15335 NPTLL (122)
Knee_OST_person_Pheno_P02775_CXCL7 -1.6482 0.43797 -1.8835 0.8009 _NIQSLEVIGK (57)
Knee_OST_person_Pheno_P04004_VTNC_ -2.5885 0.33293 -2.4911 0.29601 QPQFISR (120)
Knee_OST_person_Pheno_P07360_CO8G_ -4.6736 0.37267 -4.8264 0.36566 QLYGDTGVLGR (52)
Knee_OST_person_Pheno_P12111_C06A3 -5.7868 0.27448 -5.9182 0.2382 _E VQ VFEITENS AK (49)
Knee_OST_person_Pheno_P49747_COMP_ -5.2438 0.39886 -5.5084 0.51353 NALWHTGDTES QVR (54)
Knee_OST_person_Pheno_P63261_ACTG_ -4.1926 0.28264 -4.0727 0.29266 VAPEEHPVLLTEAPLNPK (11)
Knee_OST_person_Pheno_Q 15113_PCOC 1 -5.0081 0.2103 -5.0927 0.13171 _TGGLDLPS PPT GAS LK (95)
Knee_OST_person_Pheno_Q9NQ79_CRAC -5.357 0.3055 -5.6367 0.27386 1_GVASLFAGR (1)
Knee_OST_person_Pheno_Q9NQ79_CRAC -5.2931 0.3177 -5.5175 0.28595 1_SSPYYALR (2)
Knee_OST_person_Pheno_Q9UK55_ZPI_V -3.0144 0.12597 -3.0693 0.1705 VNPTLL (122)
.M K.M nun Kci s. (lepicic CI !M 11 )11. R'i son , a Lll ll
Knee_JSN_person_Pheno_P02776_PLF4_IC 0.01106 0.56919 -0.0167 0.52339 LDLQAPLYK (99)
Knee_JSN_person_Pheno_P06396_GELS_G 0.01656 0.24249 -0.0285 0.2353 GVASGFK (72)
Knee_JSN_person_Pheno_P08697_A2AP_S 0.20908 0.55165 -0.3041 0.41444 PPGVCSR (4)
Knee_JSN_person_Pheno_P08697_A2AP_L -0.1708 0.72306 0.24376 0.29575 CQDLGPGAFR (5)
Knee_JSN_person_Pheno_P04114_APOB_ -0.0027 0.32783 0.01013 0.3457 LAIPEGK (15)
Knee_JSN_person_Pheno_P02649_APOE_L 0.08819 0.4891 -0.1192 0.48267 QAEAFQAR (17)
Knee_JSN_person_Pheno_P02747_C 1 QC_ -0.0366 0.91229 0.08887 0.78024
VVTFCGHTSK (20)
Knee_JSN_person_Pheno_P05156_CFAI_A 0.01703 0.2518 -0.0191 0.24696
QLGDLPWQVAIK (37)
Knee_JSN_person_Pheno_P06681_CO2_SS -0.1684 0.76581 0.25677 0.27432
GQWQTPGATR (41)
Knee_JSN_person_Pheno_P01031_CO5_GI -0.0594 0.43213 0.09809 0.26792
YGTISR (44)
Knee_JSN_person_Pheno_P12111_C06A3_ 0.05255 0.2943 -0.0797 0.23417
E VQ VFEITENS AK (49)
Knee_JSN_person_Pheno_P07360_CO8G_ 0.05261 0.30651 -0.0672 0.31322
QLYGDTGVLGR (52)
Knee_JSN_person_Pheno_Q9NQ79_CRAC 0.08623 0.38824 -0.1257 0.34708
1_SSPYYALR (2)
Knee_JSN_person_Pheno_Q9NQ79_CRAC 0.09636 0.33552 -0.1408 0.33742
1_GVASLFAGR (1)
Knee_JSN_person_Pheno_P12259_FA5_SE -0.0749 0.41656 0.11694 0.26129
AYNTFSER (61)
Knee_JSN_person_Pheno_Q12805_FBLN3_ 0.05341 0.36555 -0.0956 0.29821
ADQVCINLR (65)
Knee_JSN_person_Pheno_PO 1042_KNG 1_ 0.0016 0.76436 0.0537 0.40236
LDDDLEHQGGHVLDHGHK (88)
Knee_JSN_person_Pheno_Q 15113_PCOC 1 0.04065 0.28654 -0.0545 0.28022
_TGGLDLPS PPT GAS LK (95)
Knee_JSN_person_Pheno_P80108_PHLD_F 0.06571 0.6118 -0.1345 0.52321
GSSLITVR (98)
Knee_JSN_person_Pheno_P02743_SAMP_ 0.04589 0.26942 -0.075 0.30542
AYSDLSR (104)
Knee_JSN_person_Pheno_P05452_TETN_T 0.02835 0.28053 -0.0469 0.25301
FHEASEDCISR (107)
Knee_JSN_person_Pheno_P01033_TIMPl_ 0.04351 0.34846 -0.052 0.19604
GFQALGDAADIR (111)
Knee_JSN_person_Pheno_P49747_COMP_ -0.1264 0.55906 0.20054 0.42498
SSTGPGEQLR (55)
Knee_JSN_person_Pheno_P35443_TSP4_D 0.07752 0.49144 -0.1112 0.35704
VDIDSYPDEELPCSAR (113)
Knee_JSN_person_Pheno_Q12805_FBLN3_ 0.06224 0.39736 -0.1043 0.27103
NPCQDPYILTPENR (64)
Knee_KL_person_Pheno_P02776_PLF4_IC 0.01508 0.56529 -0.0374 0.51299
LDLQAPLYK (99)
Knee_KL_person_Pheno_P06396_GELS_G 0.01122 0.24343 -0.0334 0.2305
GVASGFK (72)
Knee_KL_person_Pheno_P23142_FBLNl_ 0.01083 0.28993 -0.0576 0.25805
TGYYFDGISR (63)
Knee_KL_person_Pheno_P08697_A2AP_S 0.15955 0.57776 -0.3861 0.22829
PPGVCSR (4)
Knee_KL_person_Pheno_P08697_A2AP_L -0.1189 0.68515 0.28116 0.2684
CQDLGPGAFR (5)
Knee_KL_person_Pheno_P02649_APOE_L 0.07706 0.46658 -0.1739 0.52368
QAEAFQAR (17)
Knee_KL_person_Pheno_P02747_C 1 QC_V -0.0097 0.88292 0.07314 0.81026
VTFCGHTSK (20)
Knee_KL_person_Pheno_P 16070_CD44_Y 0.01844 0.2285 -0.0494 0.20504
GFIEGHVVIPR (28)
Knee_KL_person_Pheno_P08603_CFAH_C 0.02996 0.26309 -0.0792 0.20569
LPVTAPENGK (35)
Knee_KL_person_Pheno_P06681_CO2_SS -0.1153 0.72103 0.29553 0.25057
GQWQTPGATR (41)
Knee_KL_person_Pheno_P01031_CO5_GI -0.0458 0.42048 0.12717 0.22113
YGTISR (44)
Knee_KL_person_Pheno_P12111_C06A3_ 0.03803 0.28928 -0.0966 0.22546
E VQ VFEITENS AK (49)
Knee_KL_person_Pheno_Q9NQ79_CRACl 0.0889 0.37549 -0.2157 0.32057
_SSPYYALR (2)
Knee_KL_person_Pheno_Q9NQ79_CRACl 0.09367 0.3324 -0.2277 0.30339
_GVASLFAGR (1)
Knee_KL_person_Pheno_P12259_FA5_SE -0.0563 0.40341 0.14727 0.23078
AYNTFSER (61)
Knee_KL_person_Pheno_Q12805_FBLN3_ 0.04385 0.35046 -0.1311 0.30663
ADQVCINLR (65)
Knee_KL_person_Pheno_Q 15113_PCOC 1_ 0.04197 0.27951 -0.0952 0.28438
TGGLDLPS PPT GAS LK (95)
Knee_KL_person_Pheno_P01033_TIMPl_ 0.02734 0.33457 -0.0504 0.17746
GFQALGDAADIR (111)
Knee_KL_person_Pheno_P49747_COMP_S -0.08 0.57743 0.21684 0.31976
STGPGEQLR (55)
Knee_KL_person_Pheno_P35443_TSP4_D 0.06604 0.47366 -0.1577 0.34252
VDIDSYPDEELPCSAR (113)
Knee_KL_person_Pheno_Q12805_FBLN3_ 0.04932 0.37969 -0.1385 0.26628
NPCQDPYILTPENR (64)
Knee_OST_person_Pheno_P06396_GELS_ 0.01502 0.24089 -0.035 0.23657
GGVASGFK (72)
Knee_OST_person_Pheno_P08697_A2AP_ 0.14605 0.57584 -0.2877 0.39295
SPPGVCSR (4)
Knee_OST_person_Pheno_P08697_A2AP_ -0.1351 0.70192 0.26055 0.27125
LCQDLGPGAFR (5)
Knee_OST_person_Pheno_P63261_ACTG_ -3.0367 0.27282 -2.9771 0.25759
VAPEEHPVLLTEAPLNPK (11)
Knee_OST_person_Pheno_P02747_C 1 QC_ 0.01463 0.89969 0.01413 0.78594 VVTFCGHTSK (20)
Knee_OST_person_Pheno_P06681_CO2_SS -0.1157 0.72985 0.2422 0.34386 GQWQTPGATR (41)
Knee_OST_person_Pheno_P01031_CO5_GI -0.0524 0.42324 0.11753 0.24644 YGTISR (44)
Knee_OST_person_Pheno_P12111_C06A3 0.04953 0.26305 -0.1016 0.28306 _E VQ VFEITENS AK (49)
Knee_OST_person_Pheno_Q9NQ79_CRAC 0.08684 0.38283 -0.1715 0.33148 1_SSPYYALR (2)
Knee_OST_person_Pheno_Q9NQ79_CRAC 0.09341 0.33665 -0.1849 0.31822 1_GVASLFAGR (1)
Knee_OST_person_Pheno_P12259_FA5_SE -0.067 0.40428 0.14172 0.25122 AYNTFSER (61)
Knee_OST_person_Pheno_Q12805_FBLN3 0.04391 0.35403 -0.1082 0.31055 _ADQVCINLR (65)
Knee_OST_person_Pheno_Q 15113_PCOC 1 0.03371 0.28161 -0.0608 0.2897 _TGGLDLPS PPT GAS LK (95)
Knee_OST_person_Pheno_P05452_TETN_ 0.01949 0.27559 -0.0453 0.2601 TFHEASEDCISR (107)
Knee_OST_person_Pheno_P49747_COMP_ -0.0702 0.58158 0.15842 0.3793 SSTGPGEQLR (55)
Knee_OST_person_Pheno_P35443_TSP4_D 0.0712 0.47712 -0.1384 0.35618 VDIDSYPDEELPCSAR (113)
Knee_OST_person_Pheno_Q12805_FBLN3 0.046 0.3822 -0.1073 0.28853 _NPCQDPYILTPENR (64)
Γ. Ι . Ι Ι>Λ markei s; knee: i i
Knee_JSN_Pheno_cdl4_serum 2575.92 697.218 2248.74 613.423
Knee_JSN_Pheno_lHA_serum 5.71988 0.85584 5.11415 0.75264
Knee_JSN_Pheno_cerulo_urine_urinel 0.5915 0.79293 1.01494 0.92315
Knee_JSN_Pheno_kinno_serum 294.282 121.894 399.274 235.284
Knee_JSN_Pheno_cerulo_urine_urine2 -8.792 1.27149 -8.0153 1.54441
Knee_JSN_Pheno_hapto_serum 1333.67 757.365 1072.78 642.54
Knee_ JS N_Pheno_ctx 1 a_ctx 1 b_urine2 -15.333 2.20557 - 14.262 2.50326
Knee_ JS N_Pheno_ctx 1 a_ctx 1 b_urine 1 -5.9539 1.36704 -5.2837 1.54433
Knee_JSN_Pheno_vitd_binding_serum 939.199 593.361 1196.78 705.038
Knee_KL_Pheno_kinno_serum 295.263 119.804 441.7 259.637
Knee_KL_Pheno_cd 14_s erum 2546.19 715.028 2169.76 514.811
Knee_KL_Pheno_lHA_serum 5.63111 0.81308 5.01795 0.7993
Knee_KL_Pheno_cerulo_urine_urine2 -8.6707 1.29058 -7.9629 1.63572
Knee_KL_Pheno_ctx 1 a_ctx lb_urine2 -15.234 2.22103 - 14.065 2.56318
Knee_KL_Pheno_ctx 1 a_ctx lb_urine 1 -5.8997 1.38261 -5.1219 1.56123
Knee_KL_Pheno_vitd_binding_serum 960.501 602.213 1263.09 725.301
Knee_OST_Pheno_kinno_serum 287.479 113.997 436.257 249.333
Knee_OS T_Pheno_c erulo_urine_urine2 -8.6634 1.28494 -8.0895 1.61516
Knee_OST_Pheno_lHA_serum 5.61496 0.81508 5.11291 0.83713
Knee_OST_Pheno_ctx 1 a_ctx lb_urine2 -15.23 2.21429 -14.263 2.55727
Knee_OST_Pheno_ctx 1 a_ctx lb_urine 1 -5.9052 1.38361 -5.2423 1.55556
Knee_OST_Pheno_cdl4_serum 2525.14 699.29 2262.88 613.837
Knee_OST_Pheno_ctx2_urine 1 -5.0633 0.67926 -5.3241 0.66827
Knee_OS T_Pheno_vitd_binding_s erum 969.878 616.484 1204.18 702.73 r.1,1 ISA m r ken knee: pe rson
Knee_JSN_person_Pheno_cdl4_serum 2602.29 697.192 2162.75 564.587
Knee_JSN_person_Pheno_cerulo_urine_urin 0.57459 0.78943 1.10486 0.92437 el
Knee_JSN_person_Pheno_cerulo_urine_urin -8.8113 1.25771 -7.8761 1.56237 e2
Knee_JSN_person_Pheno_lHA_serum 5.69895 0.82885 5.06371 0.77171
Knee_JSN_person_Pheno_kinno_serum 294.293 122.788 412.385 243.775
Knee_JSN_person_Pheno_ctx 1 a_ctx lb_urin -15.324 2.21534 -14.121 2.52557 e2
Knee_JSN_person_Pheno_ctxi_urine2 -12.991 1.55032 -12.262 1.85502
Knee_JSN_person_Pheno_ctx 1 a_ctx lb_urin -5.9456 1.37228 -5.1932 1.55878 el
Knee_JSN_person_Pheno_ctxi_urinel -3.613 0.77049 -3.2866 0.82608
Knee_JSN_person_Pheno_vitd_binding_seru 946.698 594.172 1224.92 721.843 m
Knee_KL_p erson_Pheno_kinno_s erum 296.711 124.85 455.818 265.551
Knee_KL_p erson_Pheno_cd 14_s erum 2530.04 710.539 2149.83 508.765
Knee_KL_p erson_Pheno_lH A_s erum 5.61727 0.80017 4.97511 0.83057
Knee_KL_person_Pheno_cerulo_urine_urine -8.6167 1.33156 -7.9782 1.65722 2
Knee_KL_person_Pheno_vitd_binding_seru 981.978 620.479 1258.48 725.875 m
Knee_KL_person_Pheno_ctx 1 a_ctx lb_urine -5.8193 1.4108 -5.1917 1.60826 1
Knee_OST_person_Pheno_kinno_serum 291.557 123.07 452.669 256.211
Knee_OST_person_Pheno_cdl4_serum 2520.46 709.306 2223.94 573.96
Knee_OST_person_Pheno_lHA_serum 5.601 0.79819 5.05754 0.87099
Knee_OST_person_Pheno_ctx 1 a_ctx lb_urin -5.8403 1.42891 -5.2499 1.55116 el
Table 2D: Prognostic Data (P=Progressor, NP= non-Progressor)

Knee_KL_Pheno_P02765_FETUA_FSVV 0.47776 0.1871 0.42755 0.18126 YAK (69)
Knee_KL_Pheno_P00734_THRB_NPDSST -1.2604 0.36827 -1.4032 0.36302 TGPWCYTTDPTVR (110)
Knee KL Pheno P00736 CIR GLTLHLK -1.5768 0.17668 -1.6834 0.23557 (22)
Knee_KL_Pheno_P01011_AACT_NLAVS 0.09174 0.25744 -0.0404 0.25316 QVVHK (9)
Knee_KL_Pheno_P00736_C 1 R_GYGFYT -2.4711 0.1838 -2.5691 0.21992 K (23)
Knee_KL_Pheno_P09871_C 1 S_LLEVPEG -2.3873 0.16142 -2.4663 0.17408 R (39)
Knee KL Pheno P04114 APOB LAIPEG -1.1379 0.23634 -1.2751 0.2705 K (15)
Knee_KL_Pheno_P01011_AACT_ADLSGI 0.0238 0.24725 -0.0937 0.22724 TGAR (8)
Knee KL Pheno P05546 HEP2 NFGYTL -0.3486 0.23541 -0.4828 0.22968 R (76)
Knee_KL_Pheno_P05156_CFAI_HGNTDS -2.0777 0.19407 -2.1776 0.26138 EGIVEVK (36)
Knee_KL_Pheno_P02751_FINC_EYLGAI -1.5794 0.37426 -1.7745 0.50563 CSCTCFGGQR (70)
Knee KL Pheno P02751 FINC IGDTWS -1.9724 0.28416 -2.1392 0.44287 K (71)
Knee_OST_Pheno_P02776_PLF4_ICLDLQ -2.6274 0.32402 -2.8927 0.54107 APLYK (99)
Knee_OST_Pheno_P01011_AACT_EQLSL 0.63078 0.24078 0.5271 0.24313 LDR (10)
Knee_OST_Pheno_P01011_AACT_ADLS -0.0125 0.22315 -0.1117 0.22687 GITGAR (8)
Knee_OST_Pheno_P01008_ANT3_ATEDE 5.43145 0.39014 5.62562 0.4794 GSEQK (14)
Knee_OST_Pheno_P01011_AACT_NLAV 0.04359 0.24761 -0.0522 0.24691 SQVVHK (9)
Knee_OST_Pheno_P02775_CXCL7_NIQS -1.5495 0.28583 -1.7827 0.54969 LEVIGK (57)
Knee_OST_Pheno_Q9NQ79_CRAC 1_SSP -5.2482 0.31894 -5.3319 0.29197 YYALR (2)
Knee_OST_Pheno_Q14624_ITIH4_FKPTL -1.1228 0.21444 -1.2061 0.25212 SQQQK (86)
Knee_OST_Pheno_P00747_PLMN_HSIFT -0.9833 0.22029 -1.0623 0.23109 PETNPR (100)
Knee_OST_Pheno_P07996_TSPl_FVFGT -3.8992 0.3198 -4.0688 0.58725
TPEDILR (112)
Knee_OST_Pheno_P01031_CO5_GIYGTIS -2.6246 0.18727 -2.6943 0.23962
R (44)
Knee_OST_Pheno_P00734_THRB_NPDSS -1.3017 0.35587 -1.4473 0.37127
TTGPWCYTTDPTVR (110)
Knee_OST_Pheno_P04003_C4BPA_GVG -0.6339 0.29939 -0.7455 0.37048
WSHPLPQCEIVK (26)
M K M markers: nonrlcnlctcrl scrum: knee: ncrson
Knee_JSN_person_Pheno_P04196_HRG_Y -2.3884 0.28937 -2.5389 0.3736
WNDCEPPDSR (81)
Knee_JSN_person_Pheno_P08603_CFAH_ -1.8864 0.19324 -2.0163 0.29792
CLPVTAPENGK (35)
Knee_JSN_person_Pheno_P00734_THRB_ -1.2579 0.34881 -1.4555 0.39541
NPDSSTTGPWCYTTDPTVR (110)
Knee_JSN_person_Pheno_P02749_APOH_ 0.21115 0.20133 0.09183 0.30327
ATFGCHDGYSLDGPEEIECTK (18)
Knee_JSN_person_Pheno_P07996_TSPl_F -3.8365 0.27116 -4.0282 0.40996
VFGTTPEDILR (112)
Knee_JSN_person_Pheno_PO 1011_AACT_ -0.0089 0.24667 -0.1122 0.22344
ADLSGITGAR (8)
Knee_KL_person_Pheno_P08603_CFAH_ -1.8612 0.15652 -2.0084 0.27151
CLPVTAPENGK (35)
Knee_KL_person_Pheno_P04003_C4BPA_ -0.5958 0.26047 -0.7189 0.35023
GVGWSHPLPQCEIVK (26)
Knee_KL_person_Pheno_P00734_THRB_ -1.2649 0.35943 -1.4086 0.36133
NPDSSTTGPWCYTTDPTVR (110)
Knee_KL_person_Pheno_P02743_SAMP_ -1.0876 0.27091 -1.2492 0.26573
AYSDLSR (104)
Knee_KL_person_Pheno_P07996_TSPl_F -3.8132 0.25135 -4.0374 0.51953
VFGTTPEDILR (112)
Knee_KL_person_Pheno_P01033_TIMPl_ -5.4698 0.473 -5.666 0.36542
GFQALGDAADIR (111)
Knee_KL_person_Pheno_PO 1011_AACT_ 0.0924 0.26356 -0.0471 0.24199
NLAVSQVVHK (9)
Knee_KL_person_Pheno_PO 1011_AACT_ 0.02557 0.24965 -0.1008 0.21807
ADLSGITGAR (8)
Knee_KL_person_Pheno_P00736_C 1 R_GL -1.5842 0.19482 -1.6865 0.22542
TLHLK (22)
Knee_KL_person_Pheno_P00736_ClR_GY -2.474 0.19643 -2.572 0.20978
GFYTK (23)
Knee_KL_person_Pheno_P04114_APOB_L -1.1494 0.23247 -1.2804 0.26849
AIPEGK (15)
Knee_KL_person_Pheno_PO 1011_AACT_ 0.662 0.25482 0.54442 0.24088
EQLSLLDR (10)

Knee_ JS N_Pheno_ctx 1 a_ctx 1 b_urine 1 -6.0929 1.3862 -5.8491 1.3537
Knee_JSN_Pheno_cdl4_serum 2581.92 660.618 2571.06 730.345
Knee_JSN_Pheno_comp_serum 1624.31 586.104 1666.57 614.388
Knee_ JS N_Pheno_hapto_urine_urine 1 -1.8209 1.93942 -2.104 1.75651
Knee_JSN_Pheno_hapto_urine_urine2 -11.306 2.02314 -11.512 1.87493
Knee_ JS N_Pheno_ctx 1 a_ctx 1 b_urine2 -15.535 2.27897 -15.179 2.15288
Knee_JSN_Pheno_ctx lbeta_urine2 -12.538 1.23799 -12.603 1.30309
Knee_JSN_Pheno_ctx2_urine 1 -5.007 0.89173 -5.1513 0.59994
Knee_ JS N_Pheno_ctx2_urine2 -14.449 1.04709 -14.485 1.13908
Knee_JSN_Pheno_ctxi_urine 1 -3.6442 0.78839 -3.5905 0.75005
Knee_ JS N_Pheno_ctxi_urine2 -13.087 1.59755 -12.921 1.54536
Knee_JSN_Pheno_coll3_serum 23.7345 3.40834 23.5759 3.41947
Knee_JSN_Pheno_cerulo_urine_urine2 -8.767 1.30124 -8.8112 1.25825
Knee_JSN_Pheno_kinno_serum 290.915 142.942 297.069 102.493
Knee_JSN_Pheno_cerulo_urine_urinel 0.67532 0.8622 0.52831 0.73697
Knee_KL_Pheno_lcerulo_serum_serum 6.51632 0.69437 6.87555 0.60683
Knee_KL_Pheno_hapto_serum 1579.83 865.189 1144.89 625.329
Knee_KL_Pheno_cd44_s erum 155.42 35.625 167.649 42.8249
Knee_KL_Pheno_hapto_urine_urine2 -10.901 2.05767 -11.662 1.90504
Knee_KL_Pheno_vitd_binding_serum 905.41 563.381 983.619 618.757
Knee_KL_Pheno_ctx lbeta_urine2 -12.416 1.4272 -12.628 1.20552
Knee_KL_Pheno_ctx2_urine 1 -5.2374 0.91413 -5.0238 0.64339
Knee_KL_Pheno_tbg_serum 16.1841 4.51185 16.4486 4.63061
Knee_KL_Pheno_cd 14_s erum 2661.92 691.486 2499.09 722.077
Knee_KL_Pheno_ctx 1 a_ctx lb_urine2 -14.695 2.6064 -15.428 2.04488
Knee_KL_Pheno_ctxi_urine2 -12.666 1.85633 -13.046 1.42449
Knee_KL_Pheno_cerulo_urine_urine 1 0.73544 0.86068 0.67915 0.82822
Knee_KL_Pheno_hapto_urine_urine 1 -1.7817 1.86541 -2.1445 1.86244
Knee_KL_Pheno_ctx2_urine2 -14.334 1.12639 -14.478 1.10132
Knee_KL_Pheno_cerulo_urine_urine2 -8.3612 1.43515 -8.7819 1.22296
Knee_KL_Pheno_cd 163_serum 890.667 308.31 827.306 270.548
Knee_KL_Pheno_comp_s erum 1805.5 696.916 1603.06 549.065
Knee_KL_Pheno_kinno_serum 306.848 150.277 290.86 106.542
Knee_KL_Pheno_lHA_serum 5.59659 0.86984 5.64353 0.79587
Knee_KL_Pheno_hemopexin_serum 1589.28 253.919 1477.24 372.807
Knee_KL_Pheno_ctx 1 a_ctx lb_urine 1 -5.6508 1.58585 -5.9889 1.29875
Knee_KL_Pheno_coll3_serum 24.4897 3.53911 23.6109 3.59543
Knee_KL_Pheno_ctxi_urine 1 -3.5684 0.91432 -3.5921 0.69628
Knee_KL_Pheno_ctx lbeta_urine 1 -3.2978 0.91008 -3.169 0.85943
Knee_OST_Pheno_lHA_serum 5.47246 0.88898 5.76204 0.70844
Knee_OST_Pheno_hapto_serum 1386.54 779.479 1103.49 611.724
Knee_OST_Pheno_cd 163_serum 794.197 276.997 892.772 285.564
Knee_OST_Pheno_cd44_serum 158.26 37.0897 172.328 44.3459
Knee_OST_Pheno_tbg_serum 15.7036 5.16053 16.9976 4.04741
Knee_OS T_Pheno_c erulo_urine_urine2 -8.8172 1.30041 -8.5072 1.26027
Knee_OST_Pheno_ctx 1 a_ctx lb_urine 1 -6.0859 1.30181 -5.7273 1.44766
Knee_OST_Pheno_ctxi_urine 1 -3.6674 0.79932 -3.5154 0.72453
Knee_OST_Pheno_comp_serum 1565.03 476.409 1736.8 679.457
Knee_OST_Pheno_hemopexin_serum 1546.7 357.536 1481.31 359.671
Knee_OST_Pheno_ctx 1 a_ctx lb_urine2 -15.493 2.15187 -14.962 2.26187
Knee_OST_Pheno_ctxi_urine2 -13.101 1.60025 -12.784 1.49467
Knee_OS T_Pheno_c erulo_urine_urine 1 0.61404 0.8256 0.77457 0.8674
Knee_OS T_Pheno_vitd_binding_s erum 1004.24 643.216 934.067 589.759
Knee_OST_Pheno_cdl4_serum 2535.59 667.835 2514.55 734.427
Knee_OST_Pheno_ctx lbeta_urine2 -12.619 1.34067 -12.536 1.23706
Knee_OST_Pheno_ctx2_urine2 -14.451 1.0706 -14.383 1.10635
Knee_OST_Pheno_kinno_serum 291.233 113.953 283.484 114.836
Knee_OST_Pheno_hapto_urine_urine2 -11.556 2.16059 -11.38 1.86644
Knee_OST_Pheno_ctx2_urine 1 -5.0195 0.72808 -5.1065 0.63031
Knee_OST_Pheno_lcerulo_serum 6.75596 0.61035 6.83172 0.67827
Knee_OST_Pheno_hapto_urine_urinel -2.0969 1.86438 -2.0368 1.86182
Knee_OST_Pheno_coll3_serum 23.707 3.64127 24.2162 3.52646
Knee_OST_Pheno_ctx lbeta_urine 1 -3.177 0.88927 -3.2504 0.90828
: knee: p LTSOH
Knee_JSN_person_Pheno_hapto_serum 1603.35 829.077 996.543 480.362
Knee_JSN_person_Pheno_cd44_serum 152.974 28.6622 171.635 47.738
Knee_JSN_person_Pheno_lcerulo_serum_s 6.55994 0.64513 6.88947 0.63355 erum
Knee_JSN_person_Pheno_vitd_binding_ser 824.727 563.488 1075.84 606.629 um
Knee_JSN_person_Pheno_hemopexin_seru 1529.95 229.779 1415.63 301.975 m
Knee_JSN_person_Pheno_cd 163_serum 814.817 288.557 887.965 320.78
Knee_JSN_person_Pheno_tbg_serum 15.2671 4.85939 16.9759 4.25425
Knee_JSN_person_Pheno_hapto_urine_urin -1.6798 1.87231 -2.2666 1.73415 el
Knee_JSN_person_Pheno_hapto_urine_urin -11.113 1.984 -11.68 1.81184 e2
Knee_JSN_person_Pheno_lHA_serum 5.61905 0.89867 5.78457 0.75377
Knee_JSN_person_Pheno_cdl4_serum 2642.04 662.952 2560.2 739.359
Knee_JSN_person_Pheno_ctx2_urinel -4.9732 0.82227 -5.2162 0.63565
Knee_JSN_person_Pheno_ctx lbeta_urine 1 -3.0907 0.88169 -3.313 0.90923
Knee_JSN_person_Pheno_ctx2_urine2 -14.351 1.11176 -14.602 1.10084
Knee_JSN_person_Pheno_ctxlbeta_urine2 -12.469 1.28896 -12.694 1.26058
Knee_JSN_person_Pheno_cerulo_urine_uri 0.6837 0.90088 0.46547 0.656 nel
Knee_JSN_person_Pheno_cerulo_urine_uri -8.6944 1.39072 -8.9319 1.11398 ne2
Knee_JSN_person_Pheno_ctx 1 a_ctx lb_urin -6.0306 1.43529 -5.8607 1.32367 el
Knee_JSN_person_Pheno_ctxi_urine2 -13.005 1.6566 -12.977 1.4598
Knee_JSN_person_Pheno_comp_serum 1679.54 599.743 1633.04 649.199
Knee_JSN_person_Pheno_ctx 1 a_ctx lb_urin -15.409 2.3739 -15.236 2.07455 e2
Knee_JSN_person_Pheno_ctxi_urinel -3.6268 0.81623 -3.5992 0.73473
Knee_JSN_person_Pheno_coll3_serum 23.6763 3.52326 23.7218 3.58698
Knee_JSN_person_Pheno_kinno_serum 291.262 138.289 297.648 105.434
Knee_KL_p erson_Pheno_hapto_s erum 1600.51 862.418 1130.33 601.341
Knee_KL_person_Pheno_lcerulo_serum_se 6.58129 0.69665 6.87527 0.62344 rum
Knee_KL_person_Pheno_vitd_binding_seru 863.701 542.634 1040.08 651.991 m
Knee_KL_p erson_Pheno_cd44_s erum 157.132 40.4298 167.18 40.7173
Knee_KL_person_Pheno_hapto_urine_urine -10.809 2.00864 -11.637 1.93665 2
Knee_KL_person_Pheno_ctxlbeta_urine2 -12.378 1.37454 -12.639 1.23375
Knee_KL_person_Pheno_tbg_serum 16.0036 4.84965 16.8026 4.64742
Knee_KL_p erson_Pheno_cd 14_s erum 2636.39 682.689 2477.81 723.986
Knee_KL_person_Pheno_hapto_urine_urine -1.6427 1.80641 -2.1936 1.86267 1
Knee_KL_person_Pheno_cd 163_serum 863.405 311.188 828.269 274.802
Knee_KL_person_Pheno_ctxi_urine2 -12.642 1.7623 -12.988 1.4886
Knee_KL_person_Pheno_ctx 1 a_ctx lb_urin -14.701 2.49009 -15.301 2.14653 e2
Knee_KL_person_Pheno_ctx2_urine2 -14.272 1.10587 -14.488 1.16679
Knee_KL_person_Pheno_cerulo_urine_urin -8.3301 1.46313 -8.7435 1.26323 e2
Knee_KL_p erson_Pheno_comp_s erum 1794.71 730.993 1613.72 541.515
Knee_KL_person_Pheno_ctx2_urine 1 -5.1635 0.88338 -5.0676 0.67814
Knee_KL_person_Pheno_cerulo_urine_urin 0.77872 0.94037 0.68227 0.79315 el
Knee_KL_person_Pheno_hemopexin_seru 1563.53 274.345 1474.19 372.59 m
Knee_KL_person_Pheno_ctx lbeta_urine 1 -3.2369 0.88412 -3.2204 0.87136
Knee_KL_person_Pheno_coll3_serum 24.4696 3.42393 23.524 3.72776
Knee_KL_p erson_Pheno_kinno_s erum 300.616 147.734 295.027 115.194
Knee_KL_person_Pheno_ctx 1 a_ctx lb_urin -5.6758 1.5659 -5.8843 1.34559 el
Knee_KL_p erson_Pheno_lH A_s erum 5.66124 0.89792 5.59917 0.76519
Knee_KL_person_Pheno_ctxi_urine 1 -3.5329 0.8692 -3.5709 0.72404
Knee_OST_person_Pheno_hapto_serum 1322.97 762.45 1107.02 566.902
Knee_OST_person_Pheno_ctxi_urinel -3.658 0.80638 -3.393 0.69443
Knee_OST_person_Pheno_hemopexin_seru 1550.32 394.039 1417.66 240.545 m
Knee_OST_person_Pheno_ctx 1 a_ctx lb_uri -6.0124 1.35475 -5.5033 1.53767 nel
Knee_OST_person_Pheno_tbg_serum 16.1968 4.99907 17.3638 4.31623
Knee_OST_person_Pheno_ctxi_urine2 -13.038 1.6066 -12.509 1.54218
Knee_OST_person_Pheno_cerulo_urine_uri -8.754 1.31091 -8.2981 1.39088 ne2
Knee_OST_person_Pheno_ctx 1 a_ctx lb_uri -15.355 2.20092 -14.61 2.43526 ne2
Knee_OST_person_Pheno_comp_serum 1590.05 483.543 1772.73 757.186
Knee_OST_person_Pheno_ctxlbeta_urine2 -12.637 1.33736 -12.307 1.18124
Knee_OST_person_Pheno_cdl4_serum 2592.97 695.535 2380.79 727.765
Knee_OST_person_Pheno_cerulo_urine_uri 0.62306 0.85367 0.83754 0.8564 nel
Knee_OST_person_Pheno_ctx2_urine2 -14.458 1.06195 -14.214 1.25659
Knee_OST_person_Pheno_lHA_serum 5.56184 0.86152 5.67931 0.66442
Knee_OST_person_Pheno_kinno_serum 301.275 116.42 271.699 136.201
Knee_OST_person_Pheno_vitd_binding_ser 1018.49 635.383 918.883 609.159 um
Knee_OST_person_Pheno_coll3_serum 23.8769 3.69506 23.7534 3.49101
Knee_OST_person_Pheno_cd44_serum 161.529 39.9551 167.546 43.4789
Knee_OST_person_Pheno_cd 163_serum 834.289 292.216 837.768 287.367
Knee_OST_person_Pheno_ctx lbeta_urine 1 -3.2442 0.9187 -3.183 0.81553
Knee_OST_person_Pheno_hapto_urine_uri -11.442 2.13675 -11.4 1.75876 ne2
Knee_OST_person_Pheno_hapto_urine_uri -2.0095 1.86826 -2.2442 1.8478 nel
Knee_OST_person_Pheno_lcerulo_serum_s 6.78475 0.6028 6.76521 0.72645 erum
Knee_OST_person_Pheno_ctx2_urinel -5.0812 0.75831 -5.0836 0.7278
2a. Non-depleted Serum Proteomics (analysis using calculated ratios)
2a.l. Progression Analysis
The most significant results are summarized in Tables 3-4 below; these are the results on which the multimarker AUC calculations are based. These Tables list the AUCs achieved in ROC curves for the biomarker alone— AUCBM, and the AUC for the full model achieved for the biomarker with demographics (age, gender, BMI and cohort)— AUC I, and their corresponding p values.
In brief, markers were identified that could identify JSN progression modestly (best single biomarker AUC 0.65; multimarker AUC 0.55) and OST more strongly (best single biomarker AUC 0.67; multimarker AUC 0.61). Considering only the biomarker (peptide) capability and prediction of knee level progression, 6 peptides achieved AUC >0.65 for JSN progression (PGCA, APOH, AACT x3 peptides, and PHLD), 2 peptides for OST progression
(PLF4 and CSCL7), and 6 peptides for KL progression (CFAH, SAMP, HEP2 x2 peptides, C 1R, APOB). The multimarker AUCs for person level progression were somewhat stronger than for knee level progression (Table 3 compared with Table 4) with multimarker AUC 0.67 for OST progression. Considering only the biomarker (peptide) capability and prediction of person level progression, the highest single biomarker AUC was achieved for CXCL7 with AUC 0.70 for prediction of OST. AUCBM in the tables below refers to the AUC with the biomarker alone; AUCMI in the tables refers to the AUC calculated when the biomarker and the age, gender and
BMI of the subject were considered.
Table 3. Top 10 peptides for prediction of knee level Progression from non-depleted serum.
Multimarker AUCs based on top 8 peptides.

ANT3 (14) BM fu„ll BM /0.80fi fu„ll TSP1 (112)
(p=0.012/0.006) (p=0.011/0.027) (104) (p=0.016/0.029)
0.62 BM /0.65fi fu„ll 0.65 BM /0.71 66 0.79
AACT (8) full 0.
AACT (10) BM / fi fu„ll HEP2 (76)
(p=0.008/0.003) (p=0.029/0.044) (p=0.021/0.138)
0.63 BM /0.65fi fu„ll 0.64 BM /0.71 0.65 „
AACT (10) full AACT (8) BM /0.80fi full C1R (22)
(p=0.01/0.002) (p=0.021/0.023) (p=0.022/0.035)
0.63 BM /0.62fi fu„ll THRB 0.63 BM /0.65fi fu„ll 0.65
AACT (9) BM /0.77fi fu„ll APOB (15)
(p=0.031/0.053) (HO) (p=0.01/0.002) (p=0.019/0.073)
0.61 BM /0.63fi fu„ll 0.63 BM /0.71 0.63
AACT (9) full BM /0.76fi
CFAH (35) fu„ll FINC (71)
(p=0.017/0.008) (p=0.015/0.021) (p=0.039/0.74)
0.59 BM /0.62 full 0.66 f„
ITIH4 (86) BM /0.69 fiull 0.66 BM /0.80fi
PHLD (98) fu„ll HEP2 (77)
(p=0.0397/0.040) (p=0.065/0.075) (p=0.061/0.173)
0.59 BM /0.62fi fu„ll 0.59 BM /0.68fi 0.61
C08B (51) fu„ll TSP1 (112) BM /0.77 full PGCA (96)
(p=0.061/0.063) (p=0.040/0.139) (p=0.072/0.439)
0.60 BM /0.62fi fu„ll PLMN 0.64 BM /0.71 full THRB 0.62 BM /0.77fi fu„ll FINC (70)
(p=0.046/0.044) (100) (p=0.068/0.041) (HO) (p=0.044/0.33)
These multimarker AUCs are based on the top 8 peptides and cross-validated as described in the statistical methods. BM is the AUC for the biomarker alone; full is the AUC for the biomarker plus demographics (age, gender, and BMI).
Table 4. Top 8 peptides for prediction of person level Progression from non-depleted serum.
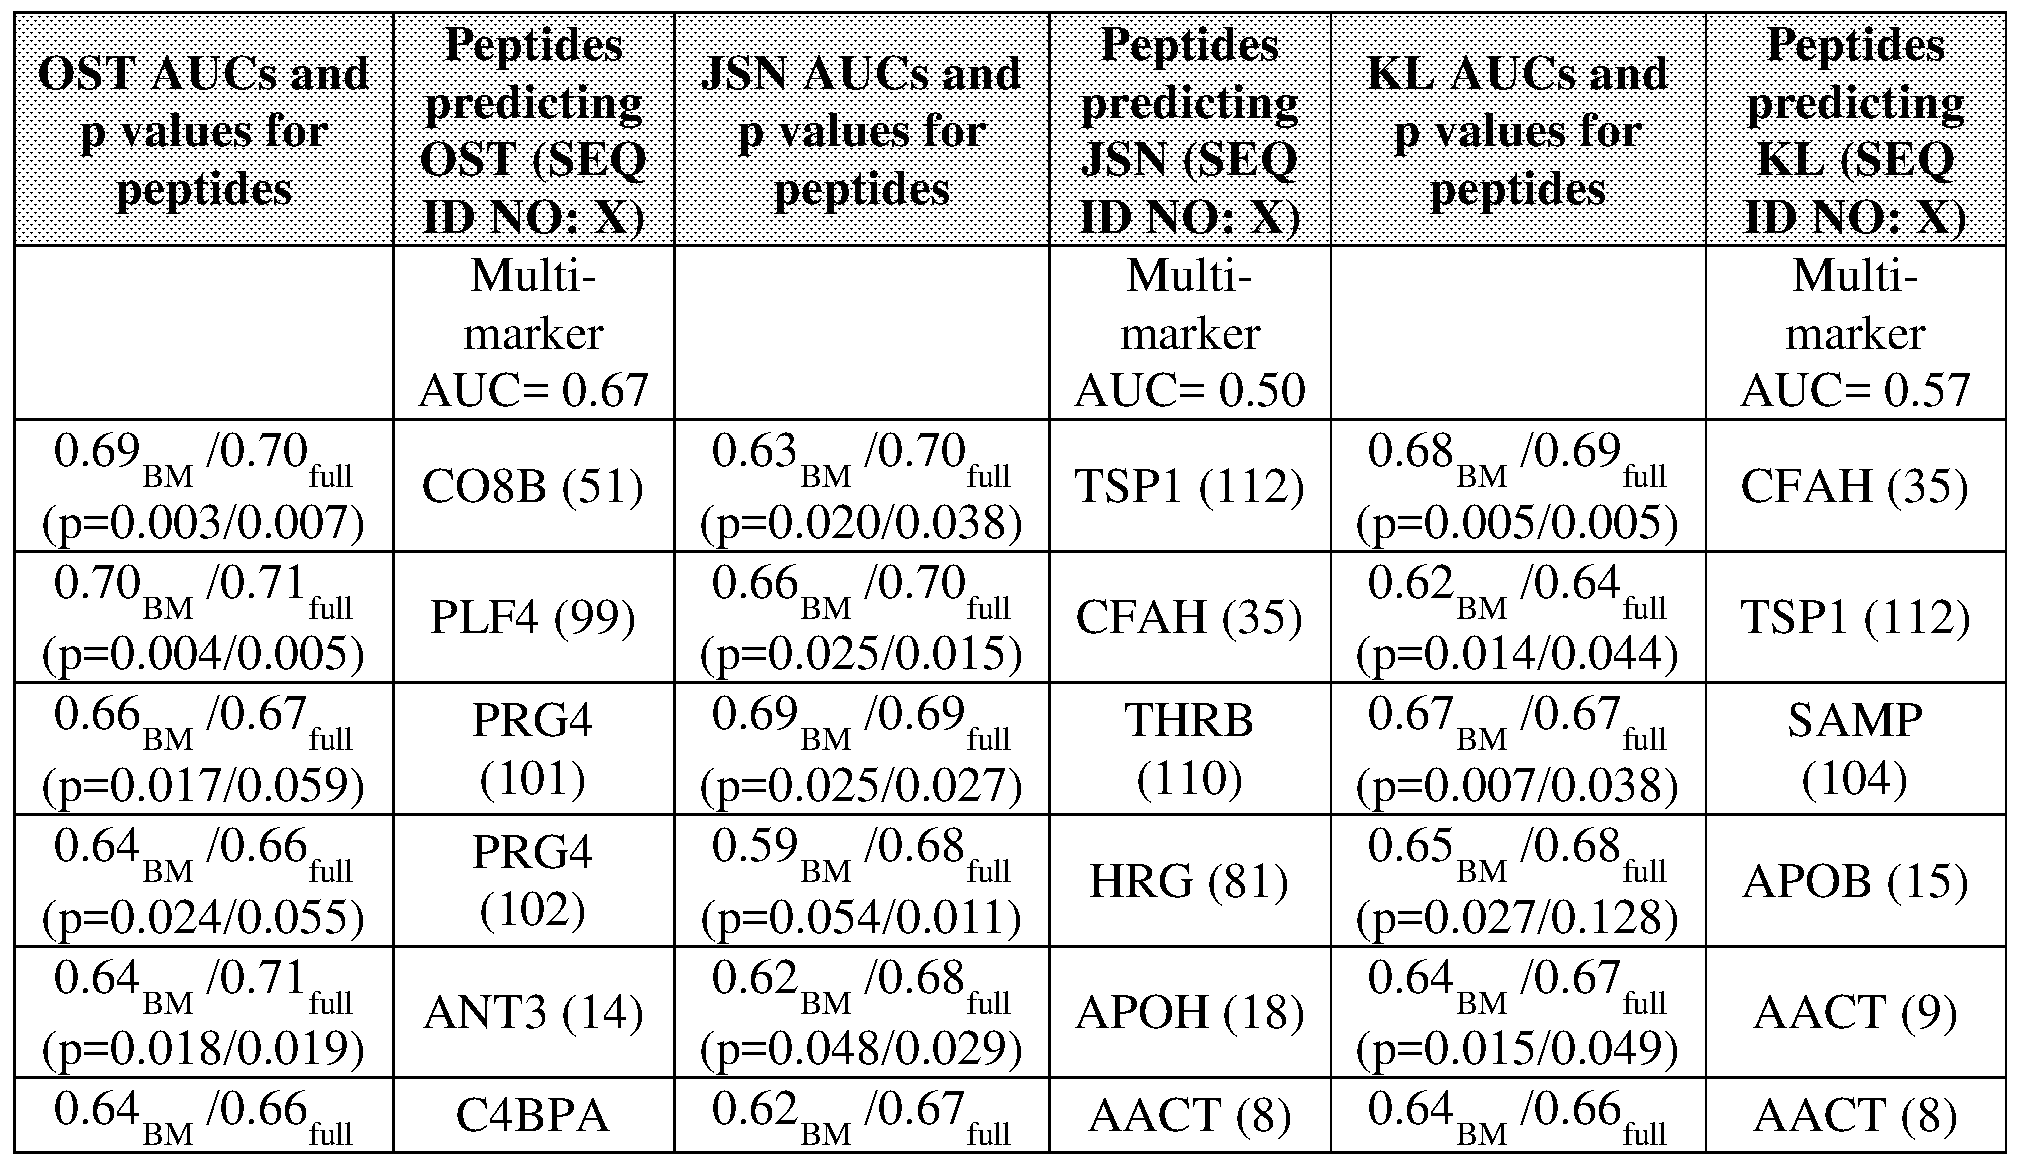
0.71 BM /0.73f fu„ll CXCL7 0.66n BMM /0.67f fu„ll 0.66 /0
PHLD (98) BM .68fi fu„ll C1R (22)
(p=0.006/0.007) (57) (p=0.054/0.080) (p=0.032/0.083)
0.63n BMM /0.66f fu„ll C4BPA 0.60n BMM /0.67f fu„ll 0.66
AACT (9) BM /0.67fi fu„ll C1R (23)
(p=0.051/0.187) (25) (p=0.079/0.059) (p=0.031/0.095)
These multimarker AUCs are based on the top 8 peptides and cross-validated as described in the statistical methods. BM is the AUC for the biomarker alone; full is the AUC for the biomarker plus demographics (age, gender, and BMI).
2a.2. Diagnostic Analysis-
By multimarker cross-validated AUCs, markers were identified that could diagnose quite strongly at a knee level and person level, all definitions of Osteoarthritis including JSN (AUC 0.71 knee level, 0.66 person level), OST (AUC 0.70 knee level and person level) and KL grade (0.77 knee level and 0.74 person level). Considering only the biomarker (peptide) capability and prediction of knee level diagnosis, 2 peptides achieved AUC >0.65 for a JSN diagnosis (CRT AC 1 (also denoted as CRAC1) and C05), 2 peptides for an OST diagnosis (CRT AC 1 x2 peptides), and 3 peptides for a KL based diagnosis (CRT AC 1 x2 peptides and SHBG). Considering only the biomarker (peptide) capability and prediction of person-level diagnosis, 5 peptides achieved AUC >0.65 for a JSN diagnosis (CRTAC 1, C4BPA, LUM, C05 and PCOC l), 1 peptide for an OST diagnosis (CRT AC 1 peptides), and all 8 top peptides for a KL based diagnosis (CRT AC 1 x2 peptides, PCOC l, C08G, LUM, COMP, C06A3 and C05). The highest single biomarker AUCs for diagnosis were achieved for CRT AC 1 (peptide GVASLFAGR) for all definitions of osteoarthritis with AUCs for the biomarker alone ranging from 0.67-0.71 and AUCs ranging form 0.80-0.88 with addition of demographics (age, gender and BMI). One Q9NQ79_CRAC1 (CRT AC 1 encoded) peptide, corresponding to Cartilage Acidic Protein 1 (aliases include ASPIC and CEP-68), an extracellular matrix protein found in cartilage, bone and lung, passed a false discovery rate (FDR) threshold (that accounts for multiple testing) of <0.01 as a diagnostic of osteoarthritis based on OST or KL grade (knee and person level) and for JSN (knee level).
Table 5. Top 8 peptides for prediction of knee level Diagnosis from non-depleted serum.
OS Al ( s and Peptides JSN A t ( s and Peptides KI. AUCs and Peptides p values for diagnosing | p v alues i or | diagnosing | p \ allies gnosing

These multimarker AUCs are based on the top 8 peptides and cross-validated as described in the statistical methods. Data above in bold denote results passing an FDR multiple testing threshold of 0.05 to 0.01. BM is the AUC for the biomarker alone; full is the AUC for the biomarker plus demographics (age, gender, and BMI).
Table 6. Top 8 peptides for prediction of person level Diagnosis from non-depleted serum.
Peptides Peptides Peptides
OS Al C s and JSN U t s and p KL U t s aiid
diagnosing diagnosing diagnosing p values lor values for p v alues for
os i <SI ;Q JSN <SI ;Q KL <SI ;Q peptides peptides peptides
II) NO: X ) I I) NO: X ) I I) NO: X )
Multi- Multi- Multi- marker marker marker
AUC= 0.70 AUC= 0.66 AUC= 0.74
0·74ΒΜ /0·84Μ, 0.67 fi 0-76BM /0-88 FULL
(p=1.86E- CRAC1 (1) BM /0.80 fu„ll CRAC1 (1) (p=8.05E- CRAC1 (1)
(p=0.0002/0.015)
06/5.43E-05) 07/1.42E-05)
0.69 BM /0.82 full 071 /0.85 „
0.66 /0 BPA l.ull
(p=0.00019/0.00 CRAC 1 (2) BM .78fi fu„ll C4
CRAC 1 (2)
(p=0.002/0.014) (25) (p=8.37E- 09) 05/7.31E-05)
0.64 BM /0.78fi fu„ll COMP 0.65 BM /0.76fi fu„ll 0.66
LUM (90) BM /0.81 fu„ll PCOC1
(p=0.002/0.026) (54) (p=0.004/0.038) (p=0.002/0.044) (95)
0.64^ BM /0.77 f.ul..l C06A3 0.67 BM /0.77fi fu„ll 0.65 /0
C05 (44) BM .82fi fu„ll C08G (52)
(p=0.0096/0.099) (49) (p=0.007/0.047) (p=0.003/0.010)
0.61 BM /0.77 full PCOC1 0.66 BM /0.77fi fu„ll PCOC 1 0.65 BM /0.80fi fu„ll LUM (90)
(p=0.017/0.208) (95) (p=0.006/0.101) (95) (p=0.008/0.139)
0.59^ BM /0.77 f.u.l.l 0.60
C08G (52) BM /0.78fi fu„ll CXCL7 0.65 BM /0.81 fu„ll COMP
(p=0.032/0.129) (p=0.001/0.012) (57) (p=0.002/0.015) (54)
0.63 BM /0.77fi fu„ll 0.63 COMP 0.65
ACTG (l l) BM /0.76fi fu„ll BM /0.80fi fu„ll C06A3
(p=0.031/0.180) (p=0.006/0.052) (54) (p=0.011/0.097) (49)
0.63 BM /0.76fi fu„ll 0.64 fiu„ll 0.66
C05 (44) BM /0.78 f C05 (45) BM /0.80fi fu„ll C05 (44)
(p=0.095/0.799) (p=0.0002/0.015) (p=0.030/0.449)
These multimarker AUCs are based on the top 8 peptides and cross-validated as described in the statistical methods. Data above in bold denote results passing an FDR multiple testing threshold of 0.05 to 0.01. BM is the AUC for the biomarker alone; full is the AUC for the biomarker plus demographics (age, gender, and BMI).
2b. Depleted Serum Proteomics (using original ratios)
2b.1. Progression Analysis
Table 7. Top 8 peptides for prediction of knee level Progression from depleted serum.
Multimarker AUCs based on top 8 peptides.

Table 8. Top 8 peptides for prediction of knee level Diagnosis from depleted serum.
Multimarker AUCs based on top 8 peptides.

Table 9. Top 8 peptides for prediction of person level Diagnosis from depleted serum and using actin normalization. Multimarker AUCs based on top 8 peptides.

A total of 18 separate Osteoarthritis-related biomarkers were evaluated in this study:
· Serum: CD44, CD163, collagen 3, COMP, haptoglobin, hemopexin, kininogen, ceruloplasmin, hyaluronan, TBG, Vitamin D, TSG6, CD 14
• Urine: CTXIbeta, CTXIalpha, (CTXlalpha/CTXIbeta), CTX2, ceruloplasmin, haptoglobin
The most significant results are summarized Table 10 below; these are the results for which the biomarker alone or the full model (biomarker, age, gender, BMI and cohort) achieved p<0.05. This Table lists the AUC achieved in ROC curves for the biomarker alone— AUC BM, and the AUC for the full model achieved for the biomarker with demographics (age, gender, BMI and cohort)— AUC MI, and their corresponding p values.
In brief, progression markers for JSN include sHaptoglobin (knee and person level, (s) indicates serum measured), sCD44 (knee and person level), sHemopexin (knee level), and sCeruloplasmin (person level). We did not identify any strong progression markers for OST but we identified several strong markers of progression based upon KL grade change, including sHaptoglobin (knee and person level), sCD44 (knee level), and sCeruloplasmin (knee and person level). Of these, sHaptoglobin is the strongest progression marker.
Some strong diagnostic markers were identified for JSN (knee and person level) including sKininogen, sHyaluronan, sCD14, uCeruloplasmin and uCTXlalpha/CTXlbeta ratio
((u) indicates urine measured). In addition, some strong diagnostic markers were identified for
OST (knee and person level) including sKininogen, sCD14, and uCTXlalpha/CTXlbeta ratio.
Of these sKininogen and sHyaluronan are extremely strong diagnostic markers.
Table 10. Summary of most significant ELISA Results for Osteophyte (OST), Joint Space Narrowing (JSN), and Kellgren Lawrence (KL) grade progression and diagnostic phenotypes at a
knee (black) and person-based level (red).


AUCs not underlined are knee-based results and AUCs underlined are Person-based results. BM is the AUC for the biomarker alone; full is the AUC for the biomarker plus demographics (age, gender, BMI and cohort).
Conclusions
More diagnostic than prognostic biomarkers were discovered. Non-depleted serum worked as well or better than depleted serum, therefore, the validation does not necessarily require serum depletion of the most abundant proteins. By proteomics, our strongest prognostic biomarkers were for OST and included serum C08B and serum PLF4. By proteomics, our strongest diagnostic biomarker was serum CRT AC 1 (encoding Cartilage Acidic Protein 1), which diagnosed all phenotypes of OA and passed a 1% FDR rate.
By ELISA, serum Haptoglobin was the strongest predictor of progression and predicted JSN indicative of cartilage loss. Immunoaffinity depletion of high abundance plasma proteins is frequently employed to enhance detection of lower abundance proteins in both shotgun and targeted proteomic analyses. MARS columns afford highly repeatable and efficient plasma protein depletions and a global enrichment in non-target plasma proteins of 2-4 fold. Tu et al., J Proteome Res 9(10):4982-91 (2010). We have identified serum haptoglobin to be a strong marker of knee osteoarthritis progression but it is ordinarily depleted from blood biospecimens (by both the MARS -7 and MARS- 14 Human protein depletion columns by Agilent) prior to mass spectrometry analysis. Future analyses of non-depleted serum will permit addition of haptoglobin to the panel of analytes surveilled. By ELISA, serum Kininogen and serum
Hyaluronan were the strongest diagnostic markers of knee OA predicting most strongly OST and JSN, respectively.
Normalization
We developed a methodology to select peptides capable of acting as normalization peptides in multiple reaction monitoring (MRM) and mass spectrometry analyses to control for intensity loading and variation of efficiency of Mars- 14 protein depletion of serum or other biospecimen. We identified 14 proteins that could serve as normalization controls that are superior or equivalent to the standard methodology of normalizing to mean signal intensity. Specifically, we identified 4 normalization peptides from 4 proteins that are superior to mean intensity normalization (the standard methodology) and 21 peptides from 14 proteins that are equivalent or slightly better than standard methodology for normalization. Details are provided below. For MRM, these candidates can be run to evaluate and control for potential technical variation related to MARS- 14 depletion. They might also be used in analyses of non-depleted samples to control for variation introduced by sample processing.
Table 11 below lists the proteins that are depleted by the MARS- 14 column. Depletion efficiency varies across samples. This introduces variability in sample results. The standard practice is to normalize signal intensities for each peptide of interest with overall signal intensity of all peptides. Obviously, when the sample depletion has been variable, the data normalization to overall intensity will introduce variability and error in the results.
Table 11. List of blood proteins depleted by MARS- 14.

One method we devised was to normalize based on total mean signal intensity using all except those emanating from any residual amounts of the proteins in the above list of
proteins (that should have been depleted but that are generally depleted with varying efficiencies)— 'targeted mean total intensity' normalization.
Our goal was to find a peptide or protein that could serve as a normalization control, i.e. a "housekeeping protein" that would eliminate the need to normalize to total mean intensity or targeted mean total intensity described above. For a normalization peptide to benefit the analysis, it should produce better signals than normalization in the standard way using mean overall intensity. Therefore, ideally, we would like to find a normalization peptide or protein that is superior to either of these methods. The test of superiority is to compare qq plots for the sample data normalized by the targeted mean total intensity (our refinement of standard practice) vs normalized to the candidate normalization protein or peptide.
Table 12. Normalization peptides (total of 4 peptides) that are superior to normalization by mean

Table 13. Normalization peptides (total of 21) that are slightly better or equivalent to
normalization by mean intensity.
Peptide Superior or
Modil ied Peptide Sequence Teller Primar\ Protein Kquiv alcnt to
( SCO I I) NO: ) Probab Name Standard Method ility oi Normalization
ICLDLQAPLYK (99) 1 PLF4_HUMAN Equivalent
FQSVFTVTR (123) 1 C1QC_HUMAN Equivalent
IFYNQQNHYDGSTGK (124) 1 ADIPO_HUMAN Equivalent
EWVAIESDSVQPVPR (125) 0.96 CNDP1_HUMAN Equivalent
SVVLIPLGAVDDGEHSQNEK
1 CNDP1_HUMAN Slightly Better (126)
LVPFATELHER (127) 0.66 APOA4_HUMAN Slightly Better
VAPEEHPVLLTEAPLNPK (11) 0.84 ACTG_HUMAN Equivalent
FTGS QPFGQG VEH AT ANK
1 TSP1_HUMAN Equivalent (143)
EFNPLVIVGLSK (62) 0.74 FA5_HUMAN Equivalent
VLSIAQAHSPAFSCEQVR (128) 0.94 CD14_HUMAN Equivalent
SrTLFVQEDR (129) 0.99 TSP1_HUMAN Equivalent
AEAESLYQSK (130) 0.99 K2C1_HUMAN Equivalent
NALWHTGNTPGQVR (131) 0.95 TSP1_HUMAN Equivalent
AIHLDLEEYR (132) 1 CNDP1_HUMAN Equivalent
AGTLDLSLTVQGK (133) 0.99 TSP1_HUMAN Slightly Better
EENFYVDETTVVK (134) 0.9 CBG_HUMAN Equivalent
DNNSIITR (135) 0.61 CHLE_HUMAN Equivalent
VVLS S GS GPGLDLPLVLGLPL
1 S HB G_HUM AN Equivalent QLK (136)
DNCQYVYNVDQR (137) 0.99 TSP1_HUMAN Equivalent
LFLGALPGEDSSTSFCLNGLW
0.6 S HB G_HUM AN Equivalent AQGQR (138)
HNEVWHLVGITSWGEGCAQR
0.77 FA11_HUMAN Equivalent (139)
Overall, the following numbers of peptides were identified as normalization controls from 14 proteins: TSP-1 (6), CNDP1 (4), FA5 (2), SHBG (3), and one each for PLF4, ClQc, ADIPO, APOA4, ACTG, CD14, K2C1, CBG, CHLE and FAI L Three additional peptides identified in our human specimen analyses also cover 3 of these proteins, including the following:
• 76969249 515.7786 2 GPDPSSPAFR (SEQ ID NO: 140) TSP1_HUMAN Thrombospondin-1 OS=Homo sapiens GN=THBS 1 PE=1 SV=2;
• 76967646 520.31244 2HITSLEVIK (SEQ ID NO: 141) PLF4_HUMAN
Platelet factor 4 OS=Homo sapiens GN=PF4 PE=1 SV=2;
• 76968171 522.26917 2LDVDQALNR (SEQ ID NO: 142)
SHBG_HUMAN Sex hormone-binding globulin OS=Homo sapiens
GN=SHBG PE=1 SV=2
Additional analyses have identified two other potential normalization peptides in the
Carbonic anhydrase 1 protein:
• C AH 1 _HUM AN (peptide 8856058) GGPFSDSYR (SEQ ID NO: 144)
• Carbonic anhydrase 1 - Homo sapiens (8848161) GGPFSDSYR (SEQ ID NO: 145) MULTIMARKER ANALYSIS I USING SERUM BIOMARKERS AND CLINICAL COVARIATES
Analysis was performed to identify biomarkers that could add value for disease classification over and above clinical parameters. Serum biomarkers previously selected by the literature (E biomarkers) could modestly increase classification of Control vs. Disease (C v D). In contrast, the novel serum biomarkers (M biomarkers) discovered in the study could significantly increase this classification.
C v D (Control v Disease)
Clinical covariates could classify C v D moderately well (AUC, ca. 0.78). Biomarkers previously selected by the literature and measured by ELISA (E biomarkers) could increase classification (AUC, 0.81). In contrast, the novel M biomarkers discovered in the study could significantly increase classification (AUC, 0.97). Adding both E and M biomarkers to clinical covariates increased the AUC to 0.99.
N v P (non-progressor v progressor, person)
Clinical covariates were not significant. Adding E + M biomarkers improved classification to AUC=0.69. POl v P02 (non-progressor v progressor, osteophyte)
For clinical covariates, only gender was significant and classification was AUC=0.65. No E biomarkers were selected by the analysis. Addition of M biomarkers improved classification to AUC=0.72.
PJ1 v PJ2 (non-progressor v progressor, JSN) Clinical covariates were not significant. No M biomarkers were selected by the analysis. Adding E biomarkers improved classification to AUC=0.69.
PK1 v PK2 (non-progressor v progressor, KL)
For clinical covariates, only cohort was significant for classification. No M biomarkers were selected by the analysis. Adding E biomarkers resulted in classification AUC=0.65. General Methods
Biomarker Selection
For each outcome, and each set of biomarkers (class E and class M, separately), biomarker selection was performed using the lasso selection method with the R package "glmnet", and selecting the tuning parameter using the built in 10-fold cross-validation. ROC Analysis
For each outcome, following biomarker selection, the observations were randomly split in half to generate a training and a test set. For the training set, two logistic regression models
were fit: one with clinical parameters only (CP Training), and the other with clinical parameters + biomarkers (CP+B Training). Coefficients from the logistic regression training models were applied to the respective test sets (CP Test and CP+B Test). ROC AUC was calculated for each of the training and test sets. This process was repeated 50 times for C v D and 10 times for all other analyses and the average AUC (+/- sd) was calculated. A summary of the results is shown below in Tables 14-18.
Table 14 - ROC AUC
Clinical CP Training C P+B CP+B T st
Biomarkers CP Test Set
Outcome Training Scl ill
C v D 0.802 (0.049) 0.763 (0.059) 0.946 (0.028) 0.807 (0.075)
C v D M 0.822 (0.043) 0.792 (0.047) 1.00 (0.000) 0.974 (0.020)
C v D E+M 0.844 (0.050) 0.793 (0.056) 1.000 (0.000) 0.990 (0.011)
The numbers are the mean AUC over 10 random splits with standard deviations g
parenthesis.
Table 15 - ROC AUC
Clinical CI' Training CP+B CP+B Test
Biomarkers CP Test Set
Outcome Training Set ill
N v P 0.677 (0.087) 0.441 (0.103) 0.938 (0.074) 0.641 (0.125)
N v P M 0.689 (0.056) 0.504 (0.061) 0.884 (0.033) 0.662 (0.085)
N v P E+M 0.725 (0.127) 0.538 (0.080) 0.930 (0.154) 0.686 (0.070)
The numbers are the mean AUC over 10 random splits with standard deviations g
parenthesis.
Table 16 - ROC AUC

The numbers are the mean AUC over 10 random splits with standard deviations given in parenthesis.
Table 17 - ROC AUC

The numbers are the mean AUC over 10 random splits with standard deviations g parenthesis.
Table 18 - ROC AUC

The numbers are the mean AUC over 10 random splits with standard deviations given in parenthesis.
Additional information
For the C v D analysis, 19 M biomarkers were selected by the lasso method.
Additional analysis was performed to identify the M biomarkers in the selection path and to test the chain of biomarkers in the path. Using lOx repeat halves sampling, it was observed that the first two biomarkers, CRAC l (SEQ ID NO: 1) and A2AP (SEQ ID NO: 4) from depleted samples, gave an AUC of 0.948. R-scripts containing the outputs from the logistic regression analyses contain additional information for the biomarkers used in the models. The relative p- values in each model may be used to select the more significant biomarkers for that model whereby the lower p-values indicate more significant biomarkers in the model.
I. Analysis for C/D outcomes
Y = l if D; Y = 0 if C;
There are totally 126 observations with no missing in Y (89 with Y = 1, 70.6%).
Clinical covariates: gender, age, bmi.
1.1. Analysis using only clinical covariates.
We fit a logistic regression, and found that age and bmi are significant with p-values 0.0027 and 0.0002, respectively. The AUC (i.e. area under the ROC) is 0.7756.
1.2. Analysis using clinical covariates and E markers.
There are 19 E markers and 96 observations with complete E markers (63 with Y = 1,
65.6%). We conducted lasso selection using the R package "glmnet", and selected the tuning parameter using the built-in 10-fold cross-validation. It selects 6 E markers: HA, kinno, vitd_binding, coll3, hemopexin, cdl4. The AUC is 0.9192.
To evaluate the value of added E markers for prediction of C/D outcomes, we randomly split the data into half training and half testing datasets, and did this 50 times. Based on the training data, we fit two logistic regression: (i) using the clinical covariates only; (ii) using the clinical covariates plus the selected 6 E markers. Then, we applied the fitted scores to both training and testing data to compute AUC. The results are summarized in Tables 14-18. The numbers are the mean AUC over 50 random splits with standard deviations given in parenthesis.
1.3. Analysis using clinical covariates and M markers.
There are 238 M makers and 110 observations with complete M markers (77 with Y = 1,
70.0%). We conducted lasso selection using the R package "glmnet", and selected the tuning parameter using the built-in 10-fold cross-validation. It selects 19 M markers: TENX (SEQ ID NO: 106), FCGBP (SEQ ID NO: 66), C4BPB (SEQ ID NO: 27), A2AP (SEQ ID NO: 4), APOE (SEQ ID NO: 17), C1QC (SEQ ID NO: 20), C06A3 (SEQ ID NO: 50), CRAC1 (SEQ ID NO: 1), FA5 (SEQ ID NO: 61) from depleted samples; and GELS (SEQ ID NO: 72), CXCL7 (SEQ ID NO: 57), ACTG (SEQ ID NO: 11), CFAI (SEQ ID NO: 37), C05 (SEQ ID NO: 46), C06A3 (SEQ ID NO: 49), C08G (SEQ ID NO: 52), CRAC1 (SEQ ID NO: 1), FINC (SEQ ID NO: 70), PCOC1 (SEQ ID NO: 95) from nondepleted samples. The AUC is 1.
To evaluate the value of added M markers for prediction of C/D outcomes, we randomly split the data into half training and half testing datasets, and did this 50 times. Based on the training data, we fit two logistic regression: (i) using the clinical covariates only; (ii) using the clinical covariates plus the selected 19 M markers (here we use logistic regression with ridge penalty since some M markers may be highly correlated). Then, we applied the fitted scores to both training and testing data to compute AUC. The results are summarized in Table 14.
1.4. The selection path for M markers and associated AUG
The selected 19 M markers in order are: CRAC1 (SEQ ID NO: 1) (nondepleted), A2AP (SEQ ID NO: 4)(depleted), C08G (SEQ ID NO: 52)(nondepleted), CXCL7 (SEQ ID NO: 57)(nondepleted), C05 (SEQ ID NO: 46)(nondepleted), FCGBP (SEQ ID NO: 66)(depleted), PCOCl (SEQ ID NO: 95)(nondepleted), CFAI (SEQ ID NO: 37)(nondepleted), C06A3 (SEQ ID NO: 50)(depleted), GELS (SEQ ID NO: 72)(nondepleted), C4BPB (SEQ ID NO: 27)(depleted), C06A3 (SEQ ID NO: 49)(nondepleted), ACTG (SEQ ID NO: l l)(nondepleted), CRAC1 (SEQ ID NO: l)(deplated), FINC (SEQ ID NO: 70)(nondepleted), C1QC (SEQ ID NO: 20)(depleted), TENX (SEQ ID NO: 106)(depleted), APOE (SEQ ID NO: 17)(depeleted), FA5 (SEQ ID NO: 61)(depleted).
To evaluate the value of top k (k=l, 2, 19) selected M markers for prediction of C/D outcomes, we randomly split the data into half training and half testing datasets, and did this 10 times. The mean AUCs for testing data are given by: 0.8944272 0.9478328 0.9428793 0.9447368 0.9346749 0.9524768 0.9521672 0.9517028 0.9572755 0.9571207 0.9643963 0.9659443 0.9664087 0.9721362 0.9724458 0.9752322 0.971517 0.976161 0.977709. This suggests that the top 2 selected M markers can already improve the prediction ability sufficiently.
1.5. Analysis using clinical covariates, E and M markers.
There are 84 observations with complete E and M markers (54 with Y = 1, 64.3%). The AUC based on clinical covariates plus the selected 6 E markers and 19 M markers is 1. To evaluate the value of added E and M markers for prediction of C/D outcomes, we randomly split the data into half training and half testing datasets, and did this 50 times. The results are summarized in Table 14.
II. Analysis for N/P outcomes
Y = l if P; Y = 0 if N;
There are totally 89 complete observations with P/N (66 with Y = 1, 74.2%).
Clinical covariates: cohort id, gender, age, bmi.
IL L Analysis using only clinical covariates.
We fit a logistic regression, and found that none of them are significant. The AUC is 0.5975. II.2. Analysis using clinical covariates and E markers.
There are 63 complete observations (47 with Y = 1, 74.6%). We conducted lasso selection using the R package "glmnet", and selected the tuning parameter using the built-in 10-fold cross- validation. It selects 6 E markers: cdl63, hapto, coll3, hemopexin, ctx2, cdl4. The AUC is 0.8484.
To evaluate the value of added E markers for prediction of P/N outcomes, we randomly split the data into half training and half testing datasets, and did this 10 times. Based on the training data, we fit two logistic regression: (i) using the clinical covariates only; (ii) using the clinical covariates plus the selected 6 E markers. Then, we applied the fitted scores to both training and testing data to compute AUC. The results are summarized in Table 15. The numbers are the mean AUC over 10 random splits with standard deviations given in parenthesis.
11.3. Analysis using clinical covariates and M markers.
There are 77 complete observations (59 with Y = 1, 76.6%). We conducted lasso selection using the R package "glmnet", and selected the tuning parameter using the built-in 10-fold cross- validation. It selects 4 M markers: C08B (SEQ ID NO: 51), CFAH (SEQ ID NO: 35), CRAC1 (SEQ ID NO: 1), HRG (SEQ ID NO: 81) from depleted samples. The AUC is 0.8013.
To evaluate the value of added M markers for prediction of P/N outcomes, we randomly split the data into half training and half testing datasets, and did this 10 times. Based on the training data, we fit two logistic regression: (i) using the clinical covariates only; (ii) using the clinical covariates plus the selected 4 M markers. Then, we applied the fitted scores to both training and testing data to compute AUC. The results are summarized in Table 15.
11.4. Analysis using clinical covariates, E and M markers.
There are 54 complete observations (41 with Y = 1, 75.9%). The AUC based on clinical covariates plus the selected 6 E markers and 4 M markers is 0.8949. To evaluate the value of added E and M markers for prediction of P/N outcomes, we randomly split the data into half training and half testing datasets, and did this 10 times. The results are summarized in Table 15. III. Analysis for P/O outcomes
Y = l if P02; Y = 0 if POl;
There are totally 82 complete observations with P01/P02 (54 with Y = 1, 65.85%).
Clinical covariates: cohort id, gender, age, bmi.
III.1. Analysis using only clinical covariates.
We fit a logistic regression, and found that only gender is significant. The AUC is 0.6548.
III.2. Analysis using clinical covariates and E markers.
There are 61 complete observations (41 with Y = 1, 67.2%). We conducted lasso selection using the R package "glmnet", and selected the tuning parameter using the built-in 10-fold cross- validation. None of the E markers are selected.
III.3. Analysis using clinical covariates and M markers.
There are 71 complete observations (47 with Y = 1, 66.2%). We conducted lasso selection using the R package "glmnet", and selected the tuning parameter using the built-in 10-fold cross- validation. It selects 5 M markers: LYAM1 (SEQ ID NO: 93) from depleted samples, KLKB 1 (SEQ ID NO: 87), CXCL7 (SEQ ID NO: 57), C08B (SEQ ID NO: 51), ANT3 (SEQ ID NO: 14) from nondepleted samples. The AUC is 0.8555.
To evaluate the value of added M markers for prediction of P/O outcomes, we randomly split the data into half training and half testing datasets, and did this 10 times. Based on the training data, we fit two logistic regression: (i) using the clinical covariates only; (ii) using the clinical covariates plus the selected 5 M markers. Then, we applied the fitted scores to both training and testing data to compute AUC. The results are summarized in Table 16.
IV. Analysis for P/J outcomes
Y = l if PJ2; Y = 0 if PJl;
There are totally 74 complete observations with PJ1/PJ2 (40 with Y = 1, 54.1%).
Clinical covariates: cohort id, gender, age, bmi.
IV.1. Analysis using only clinical covariates.
We fit a logistic regression, and found that none of them are significant. The AUC is 0.6279. IV.2. Analysis using clinical covariates and E markers.
There are 52 complete observations (27 with Y = 1, 51.9%). We conducted lasso selection using the R package "glmnet", and selected the tuning parameter using the built-in 10-fold cross- validation. It selects 6 E markers: hapto, vitd_binding, cd44, hemopexin, cerulo_serum, ctx2. The AUC is 0.9185.
To evaluate the value of added E markers for prediction of P/N outcomes, we randomly split the data into half training and half testing datasets, and did this 10 times. Based on the training data, we fit two logistic regression: (i) using the clinical covariates only; (ii) using the clinical covariates plus the selected 6 E markers. Then, we applied the fitted scores to both training and testing data to compute AUC. The results are summarized in Table 17.
IV.3. Analysis using clinical covariates and M markers.
There are 66 complete observations (37 with Y = 1, 56.1%). We conducted lasso selection using the R package "glmnet", and selected the tuning parameter using the built-in 10-fold cross- validation. None of the M markers are selected.
V. Analysis for P/K outcomes
Y = l if PK2; Y = 0 if PKl;
There are totally 89 complete observations with PK1/PK2 (31 with Y = 1, 34.8%).
Clinical covariates: cohort id, gender, age, bmi.
V. l. Analysis using only clinical covariates.
We fit a logistic regression, and found that only cohort id is significant. The AUC is 0.7269.
V.2. Analysis using clinical covariates and E markers.
There are 63 complete observations (18 with Y = 1, 28.6%). We conducted lasso selection using the R package "glmnet", and selected the tuning parameter using the built-in 10-fold cross- validation. It selects 1 E marker: hapto. The AUC is 0.7605.
To evaluate the value of added E markers for prediction of P/N outcomes, we randomly split the data into half training and half testing datasets, and did this 10 times. Based on the training data, we fit two logistic regression: (i) using the clinical covariates only; (ii) using the clinical covariates plus the selected 1 E marker. Then, we applied the fitted scores to both training and testing data to compute AUC. The results are summarized in Table 18.
V.3. Analysis using clinical covariates and M markers.
There are 77 complete observations (28 with Y = 1, 36.4%). We conducted lasso selection using the R package "glmnet", and selected the tuning parameter using the built-in 10-fold cross- validation. None of the M markers are selected.
MULTIMARKER ANALYSIS II USING SERUM BIOMARKERS AND CLINICAL COVARIATES
Analysis based on M markers: M141-M257
I. Analysis for C/D outcomes
Y = l if D; Y = 0 if C;
1.0. Selection based on M markers only.
There are totally 118 observations with no missing in Y (83 with Y = 1, 70.3%). We conducted lasso selection using the R package "glmnet", and selected the tuning parameter using
the built-in 10-fold cross-validation. It selects 5 M markers: CXCL7 (SEQ ID NO: 57), C06A3 (SEQ ID NO: 49), C08G (SEQ ID NO: 52), CRAC1 (SEQ ID NO: 1), COMP (SEQ ID NO: 54) from nondepleted samples.
I.l. Analysis using clinical covariates and M markers.
To evaluate the value of added M markers for prediction of C/D outcomes, we randomly split the data into half training and half testing datasets, and did this 50 times. Based on the training data, we fit two logistic regression: (i) using the clinical covariates only; (ii) using the clinical covariates plus the selected 5 M markers (here we use logistic regression with ridge penalty since some M markers may be highly correlated). Then, we applied the fitted scores to both training and testing data to compute AUC. The results are summarized in Table 19 below:
Table 19

1.2. Analysis using clinical covariates, E and M markers.
To evaluate the value of added E and M markers for prediction of C/D outcomes, we randomly split the data into half training and half testing datasets, and did this 50 times. The results are summarized in Table 20 below:
Table 20

II. Analysis for N/P outcomes
Y = l if P; Y = 0 if N;
IIP. Selection based on M markers only.
There are totally 83 observations with no missing in Y (62 with Y = 1, 74.7%). We conducted lasso selection using the R package "glmnet", and selected the tuning parameter using the built-in IP-fold cross-validation. It selects IP M markers: PLF4 (SEQ ID NO: 99), C08B (SEQ ID NO: 51), CERU (SEQ ID NO: 29), CFAH (SEQ ID NO: 35), FINC (SEQ ID NO: 70),
HRG (SEQ ID NO: 81), PRG4 (SEQ ID NO: 101), SAMP (SEQ ID NO: 104), TSP4 (SEQ ID
NO: 113) from nondepleted samples.
IL L Analysis using clinical covariates and M markers.
To evaluate the value of added M markers for prediction of P/N outcomes, we randomly split the data into half training and half testing datasets, and did this 50 times. Based on the training data, we fit two logistic regression: (i) using the clinical covariates only; (ii) using the clinical covariates plus the selected 10 M markers (here we use logistic regression with ridge penalty since some M markers may be highly correlated). Then, we applied the fitted scores to both training and testing data to compute AUC. The results are summarized in Table 21 below:
Table 21

II.2. Analysis using clinical covariates, E and M markers.
To evaluate the value of added E and M markers for prediction of P/N outcomes, we randomly split the data into half training and half testing datasets, and did this 50 times. The results are summarized in Table 22 below:
Table 22

III. Analysis for P/O outcomes
Y = l if P02; Y = 0 if POl;
III.O. Selection based on M markers only.
There are totally 76 complete observations with P01/P02 (50 with Y = 1, 65.8%). We conducted lasso selection using the R package "glmnet", and selected the tuning parameter using the built-in 10-fold cross-validation. It selects 7 M markers: PLF4 (SEQ ID NO: 99), KLKB 1
(SEQ ID NO: 87), C08B (SEQ ID NO: 51), ANT3 (SEQ ID NO: 14), ACTG (SEQ ID NO: 11),
CD44 (SEQ ID NO: 28), CFAI (SEQ ID NO: 37) from nondepleted samples.
III.1. Analysis using clinical covariates and M markers.
To evaluate the value of added M markers for prediction of P01/P02 outcomes, we randomly split the data into half training and half testing datasets, and did this 50 times. Based on the training data, we fit two logistic regression: (i) using the clinical covariates only; (ii) using the clinical covariates plus the selected 7 M markers (here we use logistic regression with ridge penalty since some M markers may be highly correlated). Then, we applied the fitted scores to both training and testing data to compute AUC. The results are summarized in Table 23 below:
Table 23

III.2. Analysis using clinical covariates, E and M markers.
No E markers were selected.
IV. Analysis for P/J outcomes
Y = l if PJ2; Y = 0 if PJl;
IV.0. Selection based on M markers only.
There are totally 70 complete observations with PJ1/PJ2 (50 with Y = 1, 54.3%). We conducted lasso selection using the R package "glmnet", and selected the tuning parameter using the built-in 10-fold cross-validation. No M markers were selected.
V. Analysis for P/K outcomes
Y = l if PK2; Y = 0 if PKl;
IV.0. Selection based on M markers only.
There are totally 83 complete observations with PK1/PK2 (30 with Y = 1, 36.1%). We conducted lasso selection using the R package "glmnet", and selected the tuning parameter using the built-in 10-fold cross-validation. No M markers were selected.
MULTIMARKER ANALYSIS III USING SERUM BIOMARKERS
Methods
We generated further multi-marker models based on the markers we identified.
Inferential methods and predictive methods were used depending on the structure of the data. For a person-level analysis, logistic regression was used to compute p-values and confidence intervals. Covariates included age, sex, BMI, and cohort. The effect of a biomarker was added to
a model containing these covariates and a likelihood-ratio test was used to assess the significance of the biomarker after accounting for the covariates. A biomarker was considered significant if it surpassed a Benjamini-Hochberg FDR threshold of 10%. For a knee-level analysis the dependence arising from paired observations must be considered. We used the generalized estimating equation (GEE) method to account for the correlation structure. A biomarker was added to a model containing base covariates and its significance was assessed by a Wald statistic.
Predictive models were used to assess discrimination through the AUC. We used feature selection coupled with ridge regression, a form of penalized regression, for all models implemented in the glmnet R package. Penalized regression is often used for predictive models to constrain the size of coefficients to lessen the effects of overfitting the data. Feature selection consisted of selecting the top 8 markers with the lowest p-values, which is a simple but effective method for the numbers of peptides in the current data set. Leave-one-out cross-validation was used in which selecting tuning parameters and carrying out feature selection was repeated at each iteration of cross-validation to mimic the process of fitting a model to new data. In sum, all multimarker AUCs have been properly cross-validated. For knee-level (paired) analysis, the leave-one-out cross-validation scheme was modified to a leave-sample-out scheme so that the test set was independent of the training set.
Results
A summary of the results is shown in Tables 24-29.
Depleted Serum— multimarker analyses; Dx=diagnosis (predict knee OA diagnosis);
Px=prognosis (predict knee OA progression).
Table 24

SHBG (105) 0.014916307 0.803569832 knee JSN person Dx depleted AUC=0.80
A2AP (4) 3.31E-07 0.008051178
A2AP (5) 2.81E-05 0.292406073
C02 (41) 8.72E-05 0.162905105
COMP (55) 0.001303611 0.180539523
CRAC1 (1) 0.003128843 0.006690407
FA5 (61) 0.005274008 0.367965374
C05 (44) 0.022968897 0.863307127
CRAC1 (2) 0.024934734 0.051344408 knee JSN Px depleted AUC=0.41
C04B (43) 0.033584489 0.054265435
FCN3 (67) 0.076630893 0.020166429
C08B (51) 0.017661819 0.011132744
FINC (70) 0.040090816 0.045404495
PGCA (97) 0.065006579 0.105883213
TSP4 (113) 0.076843539 0.02082132
FINC (71) 0.051256407 0.091823154
TETN (107) 0.05530156 0.041645638 knee JSN person Px depleted AUC=0.39
PGCA (97) 0.026293441 0.046827678
C04B (43) 0.023475468 0.015862788
TENX (106) 0.039475824 0.033732372
FCN3 (67) 0.18678107 0.107948938
C4BPA (25) 0.064638445 0.030266734
TSP1 (112) 0.13133037 0.18210438
C08B (51) 0.113256944 0.07456324
HRG (79) 0.1438498 0.062444406
Table 25

C02 (41) 5.90E-05 0.002320056
A2AP (5) 8.93E-06 0.062148737
FA5 (61) 0.000470793 0.058126283
COMP (55) 0.001082738 0.12106214
C05 (44) 0.000562536 0.229466647
CRAC1 (1) 0.004460634 0.001449587
CRAC1 (2) 0.033778439 0.009978404 knee KL person Dx depleted AUC=0.89
A2AP (4) 1.50E-07 0.000135815
A2AP (5) 9.64E-05 0.140576823
CRAC1 (1) 0.000106179 6.44E-05
C02 (41) 0.00023168 0.024410373
CRAC1 (2) 0.001782088 0.00062291
COMP (55) 0.006752536 0.186567751
FA5 (61) 0.00570514 0.108817433
C05 (44) 0.019947104 0.406134156 knee KL Px depleted AUC=0.43
A2AP (4) 0.038108974 0.38563753
KNG1 (88) 0.020411121 0.391748644
HGFA (78) 0.037729146 0.03308354
PRG4 (102) 0.128488782 0.333151487
AFAM (12) 0.120643826 0.844521484
DOPO (58) 0.13172217 0.264987362
FINC (71) 0.068344045 0.133741621
C08B (51) 0.062727522 0.03532693 knee KL person Px depleted AUC=0.39
KNG1 (88) 0.052000668 0.315327177
HGFA (78) 0.054701983 0.056927485
A2AP (4) 0.10641075 0.563510596
FA5 (61) 0.140793944 0.673707755
TSP1 (112) 0.148443778 0.390538592
PGCA (97) 0.135584259 0.183730223
TENX (106) 0.149867446 0.055623532
FINC (71) 0.164143337 0.229058614
Table 26
 TSP1 (112) 0.101650546 0.03394991
FINC (71) 0.099794158 0.146642438
Non-Depleted Serum— multimarker analyses; Dx=diagnosis (predict knee OA diagnosis); Px=prognosis (predict knee OA progression)
Table 27

THRB (110) 0.153796326 0.031114401 knee JSN person Px nondepleted AUC=0.45
TSP1 (112) 0.020309869 0.038161024
CFAH (35) 0.025234989 0.015467182
THRB (110) 0.025437875 0.026717885
HRG (81) 0.05431721 0.01105114
APOH (18) 0.048284307 0.028696354
AACT (8) 0.064355392 0.042526395
PHLD (98) 0.054354097 0.079726494
AACT (9) 0.079176188 0.058988993
Table 28

TSP1 (112) 0.016396723 0.029173098
HEP2 (76) 0.021317466 0.138072515
C 1R (22) 0.022324877 0.035342549
APOB (15) 0.019423193 0.073310656
FINC (71) 0.038839588 0.741216237
HEP2 (77) 0.061398201 0.173258732
PGCA (96) 0.071967152 0.438930963
FINC (70) 0.044013606 0.329880745 knee KL person Px nondepleted AUC=0.57
CFAH (35) 0.004647535 0.004744558
TSP1 (112) 0.014072412 0.044301897
SAMP (104) 0.007169693 0.038267836
APOB (15) 0.026721333 0.127645336
AACT (9) 0.014781295 0.049356758
AACT (8) 0.017046792 0.061084614
C 1R (22) 0.031947667 0.082794302
C 1R (23) 0.030621922 0.095021007
Table 29

C08G (52) 0.031580042 0.128396316
ACTG (l l) 0.030554232 0.180275486
C05 (44) 0.095059051 0.79862693 knee OST Px nondepleted AUC=0.61
PLF4 (99) 0.001094118 0.001590437
CXCL7 (57) 0.009976718 0.012612223
ANT3 (14) 0.011884039 0.006241664
AACT (8) 0.00821959 0.002747701
AACT (10) 0.010576976 0.002088226
THRB (110) 0.030760839 0.053273043
AACT (9) 0.016720482 0.0084448
ITIH4 (86) 0.039793857 0.04003038
C08B (51) 0.061264758 0.062748503
PLMN (IOO) 0.046320809 0.044378072 knee OST person Px nondepleted AUC=0.67
C08B (51) 0.00274445 0.007382756
PLF4 (99) 0.003710526 0.005376922
PRG4 (101) 0.016806589 0.059964262
PRG4 (102) 0.024390935 0.054916368
ANT3 (14) 0.017572544 0.019097753
C4BPA (26) 0.029402337 0.122776322
CXCL7 (57) 0.005698 0.006885551
C4BPA (25) 0.051311885 0.186676691
Claims
1. A method of diagnosing osteoarthritis comprising measuring an expression level of at least one biomarker selected from the group consisting of CRAC1 (CRTAC1), CXCL7, C08G, A2AP, A1BG, A2GL, AACT, ACTG, AMBP, APOB, APOE, B2MG, C1QC, CIR, CIRL, C4BPA, C4BPB, CD14, CD44, CERU, CFAB, CFAH, CFAI, CILPl, CIS, CNDP1, C02, C04B, C05, C06A3, C08B, C09, coll3, COMP, CTXla, CTXlb, CTX2, CTXi, ECM1, FA12, FA5, FBLN1, FBLN3, FCGBP, FCN3, FETUA, FINC, GELS, HA, HABP2, haptoglobin, HEMO, HEP2, HGFA, HRG, hyaluronan, ICl, ITIHl, ITIH4, KNG1, LAMA2, LUM, LYAM1, MASP1, PCOC1, PGCA, PHLD, PLF4, PLMN, PRG4, RET4, SAMP, SHBG, TENX, TETN, THBG, TIMP1, TSP1, TSP4, VTDB, VTNC, ZA2G, ZPI, or any combination thereof in a sample from a subject; comparing the level of at least one biomarker in the sample to a reference level of the biomarker; and diagnosing the subject with osteoarthritis if the level of at least one biomarker is altered as compared to the reference level.
2. The method of claim 1, wherein the biomarkers measured comprise at least one
biomarker selected from the group consisting of CRAC1 (CRTAC1), CXCL7, C08G, ACTG, CD44, CERU, CFAH, CFAI, C06A3, C08G, COMP, FINC, HRG, KNG1, PLF4, PRG4, SAMP, TSP4, and any combination thereof.
3. The method of claim 2, wherein the biomarkers measured comprise at least two
biomarkers selected from the group consisting of CRAC1 (CRTAC1), CXCL7, and C08G.
4. The method of claim 3, wherein the biomarkers measured comprise CRAC1 (CRT AC 1), CXCL7, and C08G.
5. The method of claim 3, wherein the subject is diagnosed with osteoarthritis if the levels of the biomarkers measured are increased as compared to the reference level.
6. The method of claim 3, wherein the at least two biomarkers comprise a peptide sequence selected from the group consisting of SEQ ID NO: 1, SEQ ID NO: 2 (CRAC1
(CRTAC1)), SEQ ID NO: 57 (CXCL7), SEQ ID NO: 52 (C08G).
7. The method of any one of the preceding claims, further comprising developing a
treatment plan for the subject if the subject is diagnosed with osteoarthritis.
8. The method of claim 7, further comprising administering an anti-inflammatory or anti- pain therapeutic to the subject if the subject is diagnosed with osteoarthritis.
9. The method of claim 8, wherein the anti-inflammatory or anti-pain therapeutic comprises a nonsteroidal anti-inflammatory drug (NSAID).
10. A method of predicting progression of osteoarthritis comprising measuring an expression level of at least one biomarker selected from the group consisting of CRAC1 (CRT AC 1), A1BG, A2AP, A2GL, AACT, ACTG, AFAM, ANT3, APOB, APOH, B2MG, C1QC, C1R, C1RL, C4BPA, C4BPB, CD14, CD163, CD44, CERU, CFAB, CFAH, CFAI, CIS, C02, C04B, C05, C06A3, C08B, C08G, coll3, CTX2, CXCL7, DOPO, ECM1, FA5, FA12, FBLN1, FCGBP, FCN3, FETUA, FINC, GELS, HABP2, haptoglobin, HEMO, HEP2, HGFA, HRG, hyaluronan, ITIH4, KLKB 1, KNG1, LUM, LYAM1, PGCA, PHLD, PLF4, PLMN, PRG4, RET4, SAMP, TENX, TETN, THBG, THRB, TIMP1, TSP1, TSP4, VTDB, VTNC, or combinations thereof in a sample from a subject;
comparing the level of the biomarker in the sample to a reference level of the biomarker; and predicting the progression of the osteoarthritis, wherein altered levels of any of the biomarkers as compared to the reference level is indicative of progression of disease..
11. The method of claim 10, wherein the biomarkers measured comprise at least one
biomarker selected from the group consisting of ACTG, ANT3, CD44, CERU, CFAH, CFAI, C08B, CXCL7, C06A3, CRAC1 (CRTAC1), FINC, haptoglobin, HRG, KLKB 1, PLF4, PRG4, SAMP, TSP4 and any combination thereof.
12. The method of claim 11, wherein the biomarkers measured comprise at least two
biomarkers selected from the group consisting of PLF4, CFAH, and ANT3.
13. The method of claim 12, wherein the biomarkers measured comprise PLF4, CFAH, and ANT3.
14. The method of claim 12, wherein a prediction of progression of the osteoarthritis in the subject is made if the level of the at least two biomarkers is altered as compared to the reference level as follows: ANT3 levels are decreased, CFAH levels are increased or PLF4 levels are increased.
15. The method of claim 12, wherein the at least two biomarkers comprise a peptide
sequence selected from the group consisting of SEQ ID NO: 14 (ANT3), SEQ ID NO: 35 (CFAH), SEQ ID NO: 99 (PLF4).
16. The method of any one of claims 10-15, further comprising developing a treatment plan for the subject based on the prediction of progression of the osteoarthritis.
17. The method of claim 16, further comprising administering an anti-inflammatory or anti- pain therapeutic to the subject if the subject is diagnosed with osteoarthritis.
18. The method of claim 17, wherein the anti-inflammatory or anti-pain therapeutic
comprises a nonsteroidal anti-inflammatory drug (NSAID).
19. The method of any one of the preceding claims, wherein the biomarker is measured using an antibody-based capture method.
20. The method of any one of the preceding claims, wherein the biomarker is measured using mass spectrometry.
21. The method of any one of the preceding claims, wherein the subject is a human.
22. The method of any one of the preceding claims, wherein the age, gender and body mass index of the subject are also used in making the prediction or diagnosis.
23. The method of any one of the preceding claims, wherein the sample is serum, plasma, urine, or synovial fluid.
24. The method of claim 23, wherein the sample is serum depleted of at least 7 major serum proteins.
25. The method of claim 24, wherein the serum proteins depleted are selected from the group consisting of albumin, IgG, IgA, transferrin, haptoglobin, anti-trypsin, fibrinogen, alpha 2-macroglobulin, IgM, apolipoprotein AI, apolipoprotein All, complement C3, and transthyretin.
26. The method of any one of the preceding claims, further comprising measuring the level of at least one normalization peptide from a protein selected from TSP1, CNDP1, FA5, SHBG, PLF4, C1QC, ADIPO, APOA4, ACTG, CD14, K2C1, CBG, CHLE, FA11, CAH1 or any combination thereof in a sample from a subject and normalizing the level of the biomarker in the sample from the subject and the reference level of the biomarker to the level of the normalization peptide in the sample and the reference prior to comparing the level of the biomarker in the sample to the reference level of the biomarker.
27. The method of claim 26, wherein the normalization peptide is selected from the group consisting of SEQ ID NO: 40, SEQ ID NO: 61, SEQ ID NO: 105, and SEQ ID NO: 112.
Priority Applications (1)
| Application Number | Priority Date | Filing Date | Title |
|---|---|---|---|
| US15/548,821 US11560594B2 (en) | 2015-02-05 | 2016-02-05 | Methods of detecting osteoarthritis and predicting progression thereof |
Applications Claiming Priority (4)
| Application Number | Priority Date | Filing Date | Title |
|---|---|---|---|
| US201562112445P | 2015-02-05 | 2015-02-05 | |
| US62/112,445 | 2015-02-05 | ||
| US201562172394P | 2015-06-08 | 2015-06-08 | |
| US62/172,394 | 2015-06-08 |
Publications (1)
| Publication Number | Publication Date |
|---|---|
| WO2016127035A1 true WO2016127035A1 (en) | 2016-08-11 |
Family
ID=56564733
Family Applications (1)
| Application Number | Title | Priority Date | Filing Date |
|---|---|---|---|
| PCT/US2016/016736 Ceased WO2016127035A1 (en) | 2015-02-05 | 2016-02-05 | Methods of detecting osteoarthritis and predicting progression thereof |
Country Status (2)
| Country | Link |
|---|---|
| US (1) | US11560594B2 (en) |
| WO (1) | WO2016127035A1 (en) |
Cited By (7)
| Publication number | Priority date | Publication date | Assignee | Title |
|---|---|---|---|---|
| CN107655998A (en) * | 2017-11-22 | 2018-02-02 | 南宁科城汇信息科技有限公司 | A kind of iTRAQ marks the application method in osteoarthritis |
| CN107727728A (en) * | 2017-11-22 | 2018-02-23 | 南宁科城汇信息科技有限公司 | A kind of iTRAQ marks the application in osteoarthritis |
| CN107907693A (en) * | 2017-11-22 | 2018-04-13 | 南宁科城汇信息科技有限公司 | A kind of foundation of OA markers |
| CN107918014A (en) * | 2017-11-22 | 2018-04-17 | 南宁科城汇信息科技有限公司 | A kind of osteoarthritis marker confirms |
| WO2018154337A1 (en) * | 2017-02-27 | 2018-08-30 | St George's Hospital Medical School | Biomarkers |
| CN109266736A (en) * | 2018-10-18 | 2019-01-25 | 中国医学科学院北京协和医院 | Molecular markers for early screening of osteoporosis and their applications |
| CN110368525A (en) * | 2019-09-03 | 2019-10-25 | 山东奥精生物科技有限公司 | A kind of oral film and preparation method thereof rebuild for attached gingiva |
Families Citing this family (6)
| Publication number | Priority date | Publication date | Assignee | Title |
|---|---|---|---|---|
| GB201614455D0 (en) * | 2016-08-24 | 2016-10-05 | Univ Oxford Innovation Ltd | Biomarkers |
| EP4264272B1 (en) * | 2020-12-18 | 2024-09-18 | Nightingale Health Oyj | Method for determining whether a subject is at risk of developing a musculoskeletal and/or connective tissue disease |
| CA3229294A1 (en) * | 2021-08-19 | 2023-02-23 | Navidea Biopharmaceuticals, Inc. | Compositions and methods for the treatment of rheumatoid arthritis |
| WO2023115065A2 (en) * | 2021-12-17 | 2023-06-22 | Allen Institute | Molecular signatures for cell typing and monitoring immune health |
| CN115508565B (en) * | 2022-10-20 | 2024-11-15 | 成都医学院第一附属医院 | Use of Cilp1 as a biomarker for renal fibrosis |
| CN122063281B (en) * | 2026-04-20 | 2026-06-30 | 苏州大学 | Biomarker for diagnosing rheumatoid arthritis and application thereof |
Citations (3)
| Publication number | Priority date | Publication date | Assignee | Title |
|---|---|---|---|---|
| US5869471A (en) * | 1992-06-30 | 1999-02-09 | The Proctor & Gamble Company | Methods for the treatment of arthritis using phosphonates and NSAIDS |
| US20110189694A1 (en) * | 2008-10-22 | 2011-08-04 | Biomarker Design Forschungs Gmbh | Methods for detection and diagnosis of a bone or cartilage disorder |
| US20140038841A1 (en) * | 2011-01-31 | 2014-02-06 | L'University de Liege | Biomarkers for osteoarthritis |
Family Cites Families (8)
| Publication number | Priority date | Publication date | Assignee | Title |
|---|---|---|---|---|
| US7840247B2 (en) | 2002-09-16 | 2010-11-23 | Imatx, Inc. | Methods of predicting musculoskeletal disease |
| US20050124071A1 (en) | 2003-09-30 | 2005-06-09 | Kraus Virginia B. | Methods and compositions for diagnosing musculoskeletal, arthritic and joint disorders by biomarker dating |
| WO2006023412A2 (en) * | 2004-08-18 | 2006-03-02 | The Government Of The United States Of America As Represented By The Secretary Of The Department Of Health And Human Services | Biomarkers for osteoarthritis |
| US8224579B2 (en) * | 2005-06-17 | 2012-07-17 | The Brigham And Women's Hospital, Inc. | Method of diagnosing osteoarthritis |
| WO2009078793A1 (en) * | 2007-12-14 | 2009-06-25 | Index Pharmaceuticals Ab | Method for predicting the response to a therapy |
| WO2010085606A1 (en) * | 2009-01-22 | 2010-07-29 | Case Western Reserve University | Protein biomarkers and therapeutic targets for osteoarthritis |
| EP2258863A1 (en) | 2009-05-25 | 2010-12-08 | Universita'Degli Studi di Roma "La Sapienza" | miRNA biomarkers for the diagnosis of duchenne muscular dystrophy progression, for monitoring therapeutic interventions, and as therapeutics |
| WO2011102908A2 (en) | 2010-02-22 | 2011-08-25 | Duke University | Biomarkers of musculoskeletal disease |
-
2016
- 2016-02-05 WO PCT/US2016/016736 patent/WO2016127035A1/en not_active Ceased
- 2016-02-05 US US15/548,821 patent/US11560594B2/en active Active
Patent Citations (3)
| Publication number | Priority date | Publication date | Assignee | Title |
|---|---|---|---|---|
| US5869471A (en) * | 1992-06-30 | 1999-02-09 | The Proctor & Gamble Company | Methods for the treatment of arthritis using phosphonates and NSAIDS |
| US20110189694A1 (en) * | 2008-10-22 | 2011-08-04 | Biomarker Design Forschungs Gmbh | Methods for detection and diagnosis of a bone or cartilage disorder |
| US20140038841A1 (en) * | 2011-01-31 | 2014-02-06 | L'University de Liege | Biomarkers for osteoarthritis |
Non-Patent Citations (1)
| Title |
|---|
| GOBEZIE, R ET AL.: "High Abundance Synovial Fluid Proteome: Distinct Profiles in Health and Osteoarthritis.", ARTHRITIS RESEARCH & THERAPY., vol. 9, 2 April 2007 (2007-04-02), pages 1 - 15 * |
Cited By (11)
| Publication number | Priority date | Publication date | Assignee | Title |
|---|---|---|---|---|
| WO2018154337A1 (en) * | 2017-02-27 | 2018-08-30 | St George's Hospital Medical School | Biomarkers |
| JP2022160535A (en) * | 2017-02-27 | 2022-10-19 | セントジョージズ ホスピタル メディカル スクール | biomarker |
| EP3586144B1 (en) * | 2017-02-27 | 2023-06-07 | St. George's Hospital Medical School | Biomarkers |
| JP7550191B2 (en) | 2017-02-27 | 2024-09-12 | セントジョージズ ホスピタル メディカル スクール | Biomarkers |
| CN107655998A (en) * | 2017-11-22 | 2018-02-02 | 南宁科城汇信息科技有限公司 | A kind of iTRAQ marks the application method in osteoarthritis |
| CN107727728A (en) * | 2017-11-22 | 2018-02-23 | 南宁科城汇信息科技有限公司 | A kind of iTRAQ marks the application in osteoarthritis |
| CN107907693A (en) * | 2017-11-22 | 2018-04-13 | 南宁科城汇信息科技有限公司 | A kind of foundation of OA markers |
| CN107918014A (en) * | 2017-11-22 | 2018-04-17 | 南宁科城汇信息科技有限公司 | A kind of osteoarthritis marker confirms |
| CN109266736A (en) * | 2018-10-18 | 2019-01-25 | 中国医学科学院北京协和医院 | Molecular markers for early screening of osteoporosis and their applications |
| CN110368525A (en) * | 2019-09-03 | 2019-10-25 | 山东奥精生物科技有限公司 | A kind of oral film and preparation method thereof rebuild for attached gingiva |
| CN110368525B (en) * | 2019-09-03 | 2021-11-23 | 山东奥精生物科技有限公司 | Oral cavity film for reconstruction of attached gingiva and preparation method thereof |
Also Published As
| Publication number | Publication date |
|---|---|
| US11560594B2 (en) | 2023-01-24 |
| US20200232034A1 (en) | 2020-07-23 |
Similar Documents
| Publication | Publication Date | Title |
|---|---|---|
| US11560594B2 (en) | Methods of detecting osteoarthritis and predicting progression thereof | |
| Jahn et al. | Peptide fingerprinting of Alzheimer's disease in cerebrospinal fluid: identification and prospective evaluation of new synaptic biomarkers | |
| Kistler et al. | Identification of a unique urinary biomarker profile in patients with autosomal dominant polycystic kidney disease | |
| CA3052349C (en) | Proadm as marker indicating an adverse event | |
| EP3497451B1 (en) | Histones and/or proadm as markers indicating an adverse event | |
| JP2015505370A (en) | Biomarkers for gastric cancer and uses thereof | |
| WO2011144934A1 (en) | Biomarkers | |
| RU2764766C2 (en) | HISTONES AND/OR proADM AS MARKERS TESTIFYING ABOUT ORGAN DYSFUNCTION | |
| WO2012056232A1 (en) | Biomarkers | |
| US12174201B2 (en) | Prognosis and progression biomarkers for chronic kidney disease | |
| US12007391B2 (en) | Means and methods for determining risk of type-1 diabetes by serum protein biomarkers | |
| US20150005192A1 (en) | Biomarkers | |
| JP2010507093A (en) | Biomarker | |
| JP2007082546A (en) | FABP4 as a marker of toxic effects | |
| WO2009138466A2 (en) | Novel polypeptides related to b-type natriuretic peptides and methods of their identification and use | |
| RU2775090C2 (en) | Proadrenomedullin as marker indicating unfavorable event | |
| CA3033102C (en) | Histones and/or proadm as markers indicating organ dysfunction | |
| Deveza et al. | Laboratory tests | |
| HK40006969A (en) | Histones and/or proadm as markers indicating organ dysfunction |
Legal Events
| Date | Code | Title | Description |
|---|---|---|---|
| 121 | Ep: the epo has been informed by wipo that ep was designated in this application |
Ref document number: 16747322 Country of ref document: EP Kind code of ref document: A1 |
|
| NENP | Non-entry into the national phase |
Ref country code: DE |
|
| 122 | Ep: pct application non-entry in european phase |
Ref document number: 16747322 Country of ref document: EP Kind code of ref document: A1 |