WO2016125282A1 - 補正装置、創薬スクリーニングシステム、プログラム、薬品の製造方法、及び薬品 - Google Patents
補正装置、創薬スクリーニングシステム、プログラム、薬品の製造方法、及び薬品 Download PDFInfo
- Publication number
- WO2016125282A1 WO2016125282A1 PCT/JP2015/053227 JP2015053227W WO2016125282A1 WO 2016125282 A1 WO2016125282 A1 WO 2016125282A1 JP 2015053227 W JP2015053227 W JP 2015053227W WO 2016125282 A1 WO2016125282 A1 WO 2016125282A1
- Authority
- WO
- WIPO (PCT)
- Prior art keywords
- cell
- state
- substance
- unit
- addition
- Prior art date
- Legal status (The legal status is an assumption and is not a legal conclusion. Google has not performed a legal analysis and makes no representation as to the accuracy of the status listed.)
- Ceased
Links
Images



Classifications
-
- C—CHEMISTRY; METALLURGY
- C12—BIOCHEMISTRY; BEER; SPIRITS; WINE; VINEGAR; MICROBIOLOGY; ENZYMOLOGY; MUTATION OR GENETIC ENGINEERING
- C12Q—MEASURING OR TESTING PROCESSES INVOLVING ENZYMES, NUCLEIC ACIDS OR MICROORGANISMS; COMPOSITIONS OR TEST PAPERS THEREFOR; PROCESSES OF PREPARING SUCH COMPOSITIONS; CONDITION-RESPONSIVE CONTROL IN MICROBIOLOGICAL OR ENZYMOLOGICAL PROCESSES
- C12Q1/00—Measuring or testing processes involving enzymes, nucleic acids or microorganisms; Compositions therefor; Processes of preparing such compositions
- C12Q1/02—Measuring or testing processes involving enzymes, nucleic acids or microorganisms; Compositions therefor; Processes of preparing such compositions involving viable microorganisms
Definitions
- the present invention relates to a correction device, a drug discovery screening system, a program, a drug manufacturing method, and a drug.
- the present invention has been made in view of the above problems, and an object of the present invention is to provide a correction device, a drug discovery screening system, a program, a drug manufacturing method, and a drug that can improve analysis accuracy.
- an aspect of the present invention includes a first acquisition unit that acquires first state information indicating a state of the first cell before addition of a substance to the first cell; Second state information indicating a state of the second cell before addition of a substance to a cell, information indicating a state of the second cell after addition of a substance to the second cell, and And a correction unit that corrects information indicating a state of the first cell after the substance is added to the first cell based on the first state information.
- one embodiment of the present invention includes the correction device, a substance addition device that adds a substance to the first cell, and a cell observation device that observes the first cell. It is a drug discovery screening system characterized by comprising.
- a first acquisition is performed in which a computer acquires first state information indicating a state of the first cell before a substance is added to the first cell.
- second state information indicating a state of the second cell before the substance is added to the second cell, and a state of the second cell after the substance is added to the second cell.
- 1 aspect of this invention is the 1st acquisition step which acquires the 1st state information which shows the state of the said 1st cell before addition of the substance with respect to a 1st cell is performed, Second state information indicating the state of the second cell before the addition of the substance to the second cell, and information indicating the state of the second cell after the addition of the substance to the second cell; A correction step of correcting information indicating the state of the first cell after the substance is added to the first cell based on the first state information. It is a manufacturing method.
- one embodiment of the present invention is a chemical manufactured by the above-described chemical manufacturing method.
- the analysis accuracy can be improved.
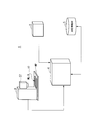
- FIG. 1 is a diagram illustrating an example of a configuration of an analysis system 1 according to the present embodiment.
- the analysis system 1 includes an HTS analysis device 2, an image analysis device 3, a correction device 4, and a correspondence information DB (DataBase) 5.
- the analysis system 1 analyzes cells to be analyzed by the HTS analysis method.
- Cell analysis means adding a substance to the cell and evaluating the response of the cell to the added substance.
- a drug is taken as an example of the substance, but the substance is not limited to a drug and may be another substance.
- the cells to be analyzed are, for example, cells and nerve cells constituting human organs such as hepatocytes, stem cells such as iPS (induced Pluripotent Stem) cells and ES (Embryonic Stem) cells, and other cells. It may be a cell of an animal different from a human or a plant cell.
- the analysis of the first cells performed by the analysis system 1 is an analysis of the first cells seeded in each of a plurality of wells provided in the well plate WP.
- the total number of first cells analyzed is about several thousand to several million.
- a predetermined drug is added to the first cells seeded for each of a plurality of wells provided in the well plate WP, and the first cells to which the predetermined drug is added are cultured for a predetermined period.
- an index indicating the amount of a novel physiologically active compound produced by adding a predetermined drug to the first cell is used for the first cell cultured for a predetermined period. For example, detection is performed on one cell by adding a fluorescent reagent. That is, in the analysis of the first cell, the first cell is detected by detecting the fluorescence intensity emitted from the first cell to which the fluorescent reagent is added.
- the analysis system 1 detects the luminance of each of the plurality of wells provided in the well plate WP after the fluorescent reagent is added to the first cell, using a photomultiplier tube.
- the brightness of the well indicates the brightness averaged in the well.
- the brightness of each well detected by the photomultiplier tube by the analysis system 1 is an index indicating the state of the first cell after a predetermined drug is added to the first cell seeded in each well in this example. . In other words, this index is the response of the first cell by the addition of the drug to the first cell. That is, in the analysis of the first cell, the analysis system 1 presents (outputs and displays) the luminance for each well as an index indicating the response of the first cell.
- the analysis system 1 in the present embodiment improves analysis accuracy in the analysis of the first cell.
- this method for improving the analysis accuracy for example, in drug discovery screening, a user can accurately select a drug (drug) effective against the first cell from a plurality of drugs.
- the method for producing a drug including the method can produce a drug effective for the first cell with high accuracy and at a lower cost.
- a method for improving the analysis accuracy in the analysis of the first cell by the analysis system 1 will be described in detail.
- adding a predetermined drug to a certain cell X will be referred to as “dosing the cell X”.
- the index indicating the state of the first cell after the first cell is administered is referred to as the state of the first cell after the first cell is administered. To do.
- the present invention is not limited to this example.
- a substance such as a protein or a gene in a differentiation process from a stem cell is used. It is applicable to addition or introduction. That is, the present invention can be applied in a field including a step of adding or introducing any substance into cells.
- the analysis system 1 includes an HTS analysis device 2 and a correction device 4 that are communicably connected via a wire.
- the HTS analyzer 2 and the correction device 4 may be connected so as to be able to communicate wirelessly.
- the image analysis device 3 and the correction device 4 are connected so as to be communicable with each other by wire.
- the image analysis device 3 and the correction device 4 may be connected so as to be able to communicate wirelessly.
- the correction device 4 and the correspondence information DB 5 are connected to be communicable with each other through a cable.
- the correction device 4 and the correspondence information DB 5 may be connected so that they can communicate wirelessly.
- the HTS analyzer 2 determines the state (that is, the above-described luminance) of the cell X after being administered to a cell X of a certain cell type (in this example, the first cell or the second cell described later). To detect.
- detection of the state of the cell X after the administration to the cell X by the HTS analyzer 2 will be referred to as analysis by the HTS analyzer 2.
- the HTS analyzer 2 outputs (transmits) the detected information, which indicates the state of the cell X after the administration to the cell X, to the correction device 4.
- the state of the cell X after the administration to the cell X is referred to as the post-dosing state of the cell X, and the state of the cell X after the administration to the cell X is performed. This information will be described as the post-medication state information of the cell X.
- the cell type is classified according to tissue or animal type, and examples thereof include human cervical cancer cells, human kidney cells, mouse fibroblasts, and the like. Moreover, even if the cell type (tissue or animal species) is the same, the cell line is classified according to the difference in origin or gene subtype, for example, HeLa cells, HeLa. S3 cells, QG-U cells and the like. More specifically, for example, when the cell type is cervical cancer cells, cell lines include HeLa cells (derived from black people in their 30s), QG-U cells (derived from Japanese cervical cancer), HeLa. S3 cells (derived from: a sub-strain of HeLa, known to have a very high colony formation rate).
- tissue or animal type examples thereof include human cervical cancer cells, human kidney cells, mouse fibroblasts, and the like.
- the cell line is classified according to the difference in origin or gene subtype, for example, HeLa cells, HeLa. S3 cells, QG-U cells and the like. More specifically, for example, when the cell type is cervical cancer cells, cell
- the cell lines include HEK293 cells (derived from human fetal kidney cells) and HEK293T cells (derived from: derived from HeLa sub-strain. SV40 large T antigen is expressed. Human fetal kidney cells), HeLa. There are S3 cells (derived from: a sub-strain of HeLa, known as a packaging cell line that expresses gag / pol of MoMLV).
- the image analysis device 3 is a microscope including an imaging unit 37, and includes an analysis unit (for example, an image analysis unit 361 described later) that analyzes an image captured by the imaging unit 37.
- the analysis unit may be provided separately from the microscope, and may be a PC (Personal Computer), for example.
- the image analysis device 3 captures an image of the cell X before the analysis by the HTS analysis device 2 (that is, the cell X before the medication is performed) by the imaging unit 37 based on the operation received from the user. .
- An image captured by the imaging unit 37 is, for example, a phase difference image. Below, the case where the image imaged by the imaging part 37 is a phase difference image is demonstrated for convenience of explanation.
- the image analyzer 3 detects the state of the cell X before analysis by the HTS analyzer 2 based on the captured image.
- the image analyzed by the image analyzer 3 is preferably a phase difference image with little damage to cells, but is not limited to this.
- a fluorescence image obtained by adding a fluorescent reagent or a bright field observation image Further, it may be an image obtained by noninvasive observation such as a dark field observation image or differential interference observation image.
- the state of the cell X before the administration to the cell X is the number of living cells among the plurality of cells X in each well and the dead cell among the plurality of cells X in each well. It is represented by the number, information indicating whether the cell X in each well is good or bad, and the number of foreign substances in each well.
- the number of living cells indicates the number of living cells.
- the number of dead cells indicates the number of dead cells.
- the quality of the cell X is represented by, for example, two or more stages from level 1 to level N (N is an integer of 2 or more, for example, 5). In this example, level 1 represents the worst and level N represents the best.
- Whether the quality of the cell X corresponds to the above two or more stages is determined by the presence or absence of seeding failure in each well, the shape of the cell X, the density of the population formed by the cell X, etc. .
- a foreign substance refers to atypical cells, dust in a well, and the like.
- the image analysis apparatus 3 is a method such as pattern matching based on a reference image stored in advance in the storage unit 32 to determine whether or not seeding has failed, the shape of the cell X, the density of a group formed by a plurality of cells X, foreign matter, and the like. Detect by. That is, the image analysis device 3 compares the shape of cells detected from the phase difference image acquired from the imaging unit 37, the degree of cell aggregation, an object other than cells, and the like with the reference image, The shape of the cell X, the density of the cell X, foreign matter, etc. are detected.
- the image analyzer 3 is configured to detect the presence or absence of seeding failure, the shape of the cell X, the density of the cell X, the foreign matter, the amount of the culture medium, the pH, the quality of the culture medium, and the like by a method other than pattern matching. There may be. Further, the image analysis device 3 may detect the shape of the cell, the area of the cell, the luminance of the cell, etc. for each single cell. The image analysis device 3 may detect cell aggregation, cell dispersion, cell density, and the like by measuring the inter-cell distance for each cell population composed of a plurality of cells. It should be noted that the cell aggregation and the cell dispersion state are indicators for determining whether or not the seeding of the cells into the well has failed.
- the image analyzer 3 detects that the state of the cell X before the analysis by the HTS analyzer 2 is performed is detected by the image analyzer 3. Will be described.
- the image analysis apparatus 3 detects the information that indicates the state of the cell X before the analysis by the HTS analysis apparatus 2 (that is, before the medication is performed).
- the captured phase difference image is associated and output (transmitted) to the correction device 4.
- the state of the cell X before administration is referred to as a pre-dose state of the cell X
- information indicating the pre-dose state of the cell X is referred to as pre-dose state information of the cell X.
- pre-dose state information of the cell X when referred to as pre-dose state information of the cell X, the pre-dose state information of the cell X is associated with a phase difference image obtained by imaging the cell X before the cell X is dosed. Explain that it is.
- the imaging unit 37 is a camera including, for example, a CCD (Charge Coupled Device), a CMOS (Complementary Metal Oxide Semiconductor), or the like, which is an imaging device that converts the collected light into an electrical signal.
- CCD Charge Coupled Device
- CMOS Complementary Metal Oxide Semiconductor
- the correction device 4 acquires post-medication state information of the first cell from the HTS analyzer 2. Further, the correction device 4 acquires pre-medication state information of the first cell from the image analysis device 3. The pre-medication state information of the first cell is an example of first state information. In addition, the correction device 4 acquires correspondence information from the correspondence information DB 5.
- the correspondence information is information in which state information before medication of the second cell is associated with state information after medication of the second cell.
- the second cell refers to, for example, a cell that has been analyzed by the image analyzer 3 and the HTS analyzer 2 in the past, and is preferably the same cell type as the cell type of the first cell.
- the second cell is a cell whose cytoma is the same cell type as the first cell type, for example, a cell whose cell population density is substantially the same as or similar to the cell density of the first cell population, A cell in which the density of the cell population is substantially the same or similar to the density of the cell population of the first cell, or a cell in which the inter-cell distance of the cell population is substantially the same or similar to the inter-cell distance of the cell population of the first cell
- the number of cells in the cell population is substantially the same or similar to the number of cells in the first cell population, the presence or absence of foreign matter, etc.
- the correspondence information is information in which states before and after the second cell is administered are associated with each other, and a drug is administered to a cell having the same cell type as the cell type of the second cell. This is information indicating how the response to the drug is given and the pre-medication state of the cell.
- the correspondence information is information in which the state before and after the medication is performed on the second cell having the same cell type as the cell type of the first cell is associated with the cell type and the cell of the second cell. This is information representing a correlation between a response to a drug when a drug is administered to cells of the same species and a pre-dose state of the cell.
- the correction device 4 estimates the post-medication state of the first cell based on the pre-medication state information of the first cell acquired from the image analysis device 3 and the correspondence information acquired from the correspondence information DB 5.
- the correction device 4 calculates a correction coefficient for correcting the post-dose state information of the first cell acquired from the HTS analyzer 2 based on the estimated post-dose state of the first cell.
- the correction device 4 corrects the post-medication state information of the first cell acquired from the HTS analyzer 2 based on the calculated correction coefficient.
- amendment apparatus 4 can correct
- the correction device 4 determines whether or not medication is possible based on the estimated post-medication state of the first cell.
- the correction device 4 determines whether or not the first cell should be dosed by determining whether or not the dose is possible.
- the correction device 4 determines whether or not the pre-dose state of the first cells seeded in the well is not suitable for analysis.
- a state that is not suitable for analysis is an estimated post-dose state of the first cell, a state in which the effect of medication on the first cell is not reflected in the post-dose state of the first cell, or the effect of medication on the first cell. This is a state that is excessively reflected in the state after administration of one cell.
- the correction device 4 determines whether or not the state is not suitable for analysis based on whether or not a predetermined condition is satisfied.
- the predetermined conditions include the following conditions 1) to 4).
- the condition of the medium is judged to be poor
- the correction device 4 determines that the state before the dosing of the first cell seeded in the well satisfies any one of the above conditions 1) to 4), which is not suitable for analysis.
- the condition satisfying the condition 1) occurs, for example, when the number of cells at the time of seeding is insufficient, when the cells are in a bad state and the cells do not adhere, or when the culture after seeding is not successful.
- the state after administration of the first cell is as if the drug added to the first cell had a significant effect even if the drug added to the first cell had no significant effect. It will be detected as a state.
- the post-dose state of the cell may be detected as a state as if the drug had a significant effect. For these reasons, the pre-dose state of the first cell is considered to be unsuitable for analysis when the above condition 1 is satisfied.
- condition satisfying the condition 2) may occur when, for example, the state of the first cell is deteriorated (for example, causing mycoplasma infection) in the stage before the administration.
- the state satisfying condition 1) the post-dose state of the first cell was added to the first cell even when there was no significant effect on the drug added to the first cell. The state is detected as if the drug had a significant effect. Therefore, the pre-dose state of the first cell is considered to be unsuitable for analysis when the above condition 2 is satisfied.
- condition satisfying the condition 3) occurs when, for example, mold is mixed.
- abnormal substances such as mixed mold may cause some reaction with the drug added to the first cells, and may cause a drug effect different from the assumption, that is, noise. . Therefore, the pre-dose state of the first cell is considered to be unsuitable for analysis when the above condition 3 is satisfied.
- the state satisfying the condition 4) occurs, for example, when there is an abnormality in the state of the medium such as pH (not set to satisfy a desired experimental condition).
- an abnormality in the state of the medium may cause some reaction with the drug added to the first cells, and generates a drug effect different from the assumption, that is, noise.
- the pre-dose state of the first cell is considered to be unsuitable for analysis when the above condition 4 is satisfied.
- the correction device 4 when any one of the above conditions 1 to 4 is satisfied, that is, when a predetermined condition is satisfied, the correction device 4 is in a state where the pre-medication state of the first cell is not suitable for analysis. Determine that there is, that is, not to be dosed. On the other hand, when the predetermined condition is not satisfied, the correction device 4 determines that the pre-medication state of the first cell is suitable for analysis, that is, should be administered.
- the correction device 4 displays, for example, the result of determination on whether or not medication is possible on the display unit. Thereby, the user can suppress dosing with respect to the 1st cell in the well which should not be dosed. That is, the correction device 4 can suppress an increase in monetary / time costs related to unnecessary medication.
- the analysis system 1 may erroneously detect the response of the first cell to a predetermined drug. The dosing determination of the correction device 4 can suppress such erroneous detection and, as a result, improve the analysis accuracy.
- the correction device 4 generates correspondence information in advance before the analysis of the first cell is performed by each of the image analysis device 3 and the HTS analysis device 2. More specifically, the correction device 4 acquires pre-medication state information of the second cell that is a cell to be referred to from the image analysis device 3. In addition, the correction device 4 acquires post-medication state information of the second cell from the HTS analyzer 2. The correction device 4 generates correspondence information in which the pre-dose state information of the second cell acquired from the image analysis device 3 and the post-dose state information of the second cell acquired from the HTS analysis device 2 are associated with each other. The correction device 4 stores the generated correspondence information in the correspondence information DB 5.
- the correspondence information DB 4 is a server (database server) that stores the above-described correspondence information.
- the correspondence information stored in the correspondence information DB 5 will be described with reference to FIG.
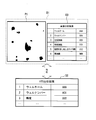
- FIG. 2 is a diagram illustrating an example of information included in the correspondence information.
- the correspondence information includes pre-dose state information D1 of the second cell and post-dose state information D2 of the second cell.
- the pre-dose state information D1 of the second cell indicates that the second cell before the second cell is dosed is compared to the pre-dose state information D3 of the second cell.
- the captured phase difference image P1 is associated.
- the phase difference image P ⁇ b> 1 is a phase difference image captured by the imaging unit 37 of the image analysis device 3.
- the pre-medication state information D3 includes a well name assigned to each well, a well number for identifying each well (for example, well ID), the number of living cells among the cells X in each well, and in each well.
- the cell culture state for example, cell density at the time of seeding, cell aggregation and dust, cell floating state, cell number, And the number of foreign substances in each well.
- the pre-dose state information D3 may include a part or all of cell name, passage information such as culture state information, seeding number, medium information (name, concentration, etc.), container information, etc. Good.
- the post-dose state information D2 includes a well name assigned to each well, a well number for identifying each well, and information indicating luminance for each well when a fluorescent reagent is added to the second cell, for example. . Further, the post-dose state information D2 may include information indicating the light emission state of the cell when another reagent different from the fluorescent reagent is added, instead of the information indicating the well luminance.
- FIG. 3 shows the pre-dose state information of the first cell and the first cell in the analysis of the first cell by the analysis system 1, for example, the analysis of the first cell to which a substance such as a drug used for drug screening is added. It is a figure which shows typically an example of the flow until each post-medication state information is produced
- the first cell is seeded by the user for each of the plurality of wells WL provided in the well plate WP.
- the user is an analyst, a researcher, or the like who analyzes the first cell by the analysis system 1, but may be another person such as an operator.
- the user arranges the well plate WP in which the first cells are seeded in each well in a range that can be imaged by the imaging unit 37 of the image analysis unit 361 and prepares for image analysis.
- the image analysis apparatus 3 captures a phase difference image of the first cell seeded for each of the plurality of wells provided in the well plate WP by the imaging unit 37 based on the received operation from the user.
- the image analysis device 3 performs image analysis based on the phase difference image captured by the imaging unit 37, and generates the pre-medication state information D1 of the first cell shown in FIG. 2 for each well.
- the user arranges the well plate WP arranged in the image analyzer 3 in the HTS analyzer 2 and prepares for HTS analysis.
- the well plate may be transferred manually from the image analysis device 3 to the HTS analysis device 2 or an analysis device in which the image analysis device 3 and the HTS analysis device 2 are integrated is constructed and the well plate WP is automatically transferred.
- a configuration may be adopted in which a transport device is provided to perform automatic transport.
- the HTS analyzer 2 dispenses the first cells seeded for each of the plurality of wells provided in the well plate WP based on the received operation from the user, and the first cells are only given for a predetermined time. Incubate.
- the HTS analyzer 2 adds a fluorescent reagent to the well in which the first cells that have been dosed are seeded.
- the HTS analyzer 2 detects the luminance of each well to which the fluorescent reagent has been added using a photomultiplier tube, and generates post-dose state information D2 of the first cell shown in FIG. 2 for each well.
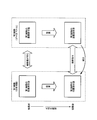
- FIG. 4 is a diagram illustrating the relationship between the four states handled in the analysis of the first cell by the analysis system 1.
- the four states indicate a state before administration of the first cell, a state after administration of the first cell, a state before administration of the second cell, and a state after administration of the second cell.
- the analysis system 1 generates correspondence information (database) by analyzing the second cells in advance before analyzing the first cells.
- the first cell and the second cell have the same cell type. Accordingly, the response of the first cell to the dosing when administered to the first cell (ie the post-dosing state of the first cell) is the second to the dosing when administering to the second cell. There should be a correlation with the cellular response (ie the post-dose state of the second cell).
- this correlation is a correlation obtained by making the pre-dose state of the first cell and the pre-dose state of the second cell substantially the same (that is, aligning the initial conditions in the experiment).
- the analysis system 1 performs analysis of the first cell by the image analysis device 3 and analysis of the first cell by the HTS analysis device 2 in order to obtain this correlation (that is, to make the initial conditions uniform). Further, the analysis system 1 uses this correlation to correct the post-dose state information of the first cell based on the post-dose state information of the second cell.
- FIG. 5 is a diagram illustrating an example of functional configurations of the image analysis device 3 and the correction device 4.
- the image analysis device 3 includes a storage unit 32, an input reception unit 33, a communication unit 34, a control unit 36, and an imaging unit 37.
- the storage unit 32 includes, for example, HDD (Hard Disk Drive), SSD (Solid State Drive), EEPROM (Electrically Erasable Programmable Read-Only Memory), ROM (Read-Only Memory), RAM (Random Access Memory), etc.
- HDD Hard Disk Drive
- SSD Solid State Drive
- EEPROM Electrically Erasable Programmable Read-Only Memory
- ROM Read-Only Memory
- RAM Random Access Memory
- the input receiving unit 33 is, for example, a keyboard, a mouse, a touch pad, or other input device. Note that the input receiving unit 33 may be configured as a touch panel by functioning as a display unit.
- the communication unit 34 includes, for example, a digital input / output port such as USB, an Ethernet (registered trademark) port, and the like.
- the control unit 36 controls the entire image analysis apparatus 3.
- the control unit 36 images a range that can be imaged by the imaging unit 37 by the imaging unit 37 based on an operation from the user received by the input receiving unit 33.
- the user places the well plate WP within the range, and causes the imaging unit 37 to image cells (in this example, the first cell or the second cell) via the input receiving unit 33.
- control unit 36 includes an image analysis unit 361.
- the image analysis unit 361 included in the control unit 36 is realized by, for example, a CPU (not shown) executing various programs stored in the storage unit 32.
- the image analysis unit 361 may be a hardware function unit such as LSI (Large Scale Integration) or ASIC (Application Specific Integrated Circuit).
- the image analysis unit 361 acquires the phase difference image captured by the imaging unit 37.
- the image analysis unit 361 detects the pre-medication state of the cell X based on the acquired phase difference image.
- the image analysis unit 361 reads the reference image stored in advance in the storage unit 32, and based on the read reference image and the acquired phase difference image, the pre-medication of the cell X Detect state.
- the image analysis unit 361 causes the storage unit 32 to store the detected pre-medication state information of the cell X.
- the image analysis unit 361 In response to a request from the correction device 4, the image analysis unit 361 reads the pre-dose state information of the cell X from the storage unit 32, and reads the read pre-dose state information of the cell X via the communication unit 34. Output (send) to.
- the correction device 4 includes a storage unit 42, an input reception unit 43, a communication unit 44, a display unit 45, and a control unit 46.
- the storage unit 42 includes, for example, an HDD, SSD, EEPROM, ROM, RAM, and the like, and stores various information, images, programs, and the like that are processed by the correction device 4.
- the storage unit 42 may be an external storage device connected by a digital input / output port such as a USB instead of the one built in the correction device 4.
- the input receiving unit 43 is, for example, a keyboard, mouse, touch pad, or other input device.
- the input reception part 43 may be comprised as a touch panel by functioning as a display part.
- the communication unit 44 includes, for example, a digital input / output port such as USB, an Ethernet (registered trademark) port, and the like.
- the display unit 45 is a liquid crystal display panel or an organic EL (ElectroLuminescence) display panel.
- the control unit 46 controls the entire correction device 4.
- the control unit 46 includes a pre-substance addition state information acquisition unit 461, a post-substance addition state information acquisition unit 462, a correspondence information acquisition unit 463, a correspondence information generation unit 464, a determination unit 465, and a post-substance addition state estimation unit. 466, a correction coefficient calculation unit 467, a post-substance addition state information correction unit 468, a determination result output unit 469, and a post-substance addition state information output unit 470.
- control unit 46 Part or all of these functional units included in the control unit 46 is realized by, for example, a CPU (not shown) executing various programs stored in the storage unit 42.
- control unit 46 may be hardware functional units such as an LSI or an ASIC.
- the pre-substance state information acquisition unit 461 acquires pre-dose state information of the cell X from the image analysis device 3.
- the post-dose state information acquisition unit 462 acquires post-dose state information of the cell X from the HTS analyzer 2.
- the correspondence information acquisition unit 463 acquires correspondence information from the correspondence information DB 5.
- the correspondence information generation unit 464 includes a pre-dose state information of the second cell acquired by the pre-substance state information acquisition unit 461 from the image analysis unit 361, and a first information acquired by the post-substance addition state information acquisition unit 462 from the HTS analyzer 2. Correspondence information is generated based on the post-medication state information of 2 cells.
- the determination unit 465 determines whether or not medication is possible based on the post-medication state information of the first cell estimated by the post-substance addition state estimation unit 466.
- the post-substance addition state estimation unit 466 includes the pre-dose state information of the first cell acquired by the pre-substance state information acquisition unit 461 from the image analysis unit 361, and the correspondence information acquired by the correspondence information acquisition unit 463 from the correspondence information DB5. Based on this, the post-dose state of the first cell is estimated.
- information indicating the post-dose state of the first cell estimated by the post-dose state estimation unit 466 will be referred to as post-dose state estimation information of the first cell.
- the post-substance addition state estimation unit 466 is an example of an estimation unit.
- the correction coefficient calculation unit 467 calculates the post-dose state information of the first cell acquired by the post-substance addition state information acquisition unit 462. A correction coefficient for correction is calculated.
- the correction coefficient calculation unit 467 is an example of a calculation unit.
- the post-substance addition state information correction unit 468 corrects the post-dose state information of the first cell acquired by the post-substance addition state information acquisition unit 462 based on the correction coefficient calculated by the correction coefficient calculation unit 467.
- the determination result output unit 469 causes the display unit 45 to display information indicating the result of determination on whether or not medication is possible by the determination unit 465.
- the post-substance addition state information output unit 470 causes the display unit 45 to display post-dose state information of the first cell corrected by the post-substance addition state information correction unit 468.
- FIG. 6 is a flowchart illustrating an example of the flow of a medication availability determination process performed by the control unit 46 of the correction device 4.
- step S100 to step S140 is described as processing performed for one well of the well plate WP, but is performed in parallel for a plurality of wells. May be. In that case, the result of the determination of whether or not medication is displayed on the display unit 45 in step S140 is displayed for each well, for example.
- the pre-substance state information acquisition unit 461 sends a request for acquisition of pre-medication state information of the first cell via the communication unit 44 based on the operation from the user received by the input reception unit 43. Send to. Then, the pre-substance state information acquisition unit 461 acquires pre-dose state information of the first cell from the image analysis unit 361 (step S100).
- the correspondence information acquisition unit 463 transmits a request for acquisition of correspondence information to the correspondence information DB 5 via the communication unit 44 based on an operation from the user received by the input reception unit 43. And correspondence information acquisition part 463 acquires correspondence information from correspondence information DB5 (Step S110).
- the post-substance addition state estimation unit 466 generates the first based on the pre-medication state information of the first cell acquired by the pre-substance state information acquisition unit 461 and the correspondence information acquired by the correspondence information acquisition unit 463.
- the post-dosing state of the cell is estimated (step S120).
- the post-dose state estimation process of the first cell by the post-substance addition state estimation unit 466 will be described.
- the post-substance addition state estimation unit 466 extracts pre-dose state information of the second cell that indicates substantially the same state as the pre-dose state information of the first cell from the correspondence information. Substantially the same state indicates that, for example, the pre-dose state information of the first cell and the pre-dose state information of the second cell coincide with each other at a predetermined matching rate or higher.
- the predetermined precision is, for example, 80% or more, but may be another percentage.
- the post-dose state estimation unit 466 displays the post-dose state information of the second cell that is the most frequent out of the post-dose state information of the second cell associated with the extracted pre-dose state information of the second cell.
- the state is estimated as the post-dose state of the first cell.
- the post-dose state estimation unit 466 estimates the post-dose state of the first cell based on other statistics based on the post-dose state information of the second cell associated with the extracted pre-dose state information of the second cell. It may be configured to.
- the determination unit 465 determines whether or not medication is possible based on the post-dose state estimation information of the first cell estimated by the post-substance addition state estimation unit 466 (step S130).
- the determination unit 465 determines whether the post-medication state estimation information of the first cell satisfies a predetermined condition. If the post-dose state estimation information of the first cell satisfies the predetermined condition, the post-substance addition state estimation unit 466 determines that it should not be administered. On the other hand, if the post-dose state estimation information of the first cell does not satisfy the predetermined condition, the post-substance addition state estimation unit 466 determines that it should be administered.
- the determination result output unit 469 causes the display unit 45 to display the result determined by the determination unit 465 (step S140).
- the correction device 4 determines whether or not the first cell should be dosed based on the pre-dose state information of the first cell. .
- the correction device 4 can suppress an increase in monetary / time costs related to unnecessary medication.
- FIG. 7 is a flowchart showing an example of the flow of correction processing of post-medication state information of the first cell performed by the control unit 46 of the correction device 4.
- the control unit 46 repeatedly performs the processing from step S200 to step S230 for each of a plurality of wells provided in the well plate WP based on the operation from the user received by the input receiving unit 43 (step S190).
- the pre-substance state information acquisition unit 461 transmits a pre-dose state information acquisition request for the first cell seeded in the well selected in step S190 to the image analysis unit 361 via the communication unit 44.
- the pre-substance state information acquisition unit 461 makes the request based on the well number described above.
- the pre-substance state information acquisition unit 461 acquires pre-dose state information of the first cells seeded in the well selected in Step S190 from the image analysis unit 361 (Step S200).
- the post-dose state information acquisition unit 462 transmits a request for post-dose state information acquisition of the first cell seeded in the well selected in step S190 to the HTS analyzer 2 via the communication unit 44. .
- the post-substance addition state information acquisition unit 462 makes the request based on the well number described above.
- the pre-substance state information acquisition unit 461 acquires post-dose state information of the first cells seeded in the well selected in Step S190 from the HTS analyzer 2 (Step S210).
- the correspondence information acquisition unit 463 transmits a request for correspondence information acquisition to the correspondence information DB 5 via the communication unit 44. And correspondence information acquisition part 463 acquires correspondence information from correspondence information DB5 (Step S220).
- the post-substance addition state estimation unit 466 performs step S190 based on the pre-medication state information of the first cell acquired by the pre-substance state information acquisition unit 461 and the correspondence information acquired by the correspondence information acquisition unit 463.
- the post-dose state of the first cells seeded in the wells selected in (1) is estimated (step S230).
- the post-dose state estimation unit 466 associates the pre-dose state information of the first cell acquired in step S210 with the post-dose state estimation information of the first cell estimated in step S230.
- this associated information will be referred to as correspondence estimation information.
- the correction coefficient calculation unit 467 acquires post-substance addition state information based on the post-dose state estimation information of the first cell estimated by the post-substance addition state estimation unit 466.
- a correction coefficient for correcting the post-medication state information of the first cell acquired by the unit 462 is calculated (step S240).
- the pre-dose state information of the first cell is referred to as pre-dose state information
- the post-dose state information of the first cell is referred to as post-dose state information
- the post-dose state estimation information of the first cell will be described as post-dose state estimation information.
- the correction coefficient calculation unit 467 excludes the overlapped pre-medication state information (or post-medication state estimation information) from the correspondence estimation information obtained by the iterative processing from step S200 to step S230.
- the correspondence estimation information that remains without being excluded is three correspondence estimation information including post-medication state estimation information X1, post-medication state estimation information X2, and post-medication state estimation information X3, respectively. This is a case where the post-dose state estimation information X1 is the post-dose state estimation information with the highest luminance.
- the correction coefficient calculation unit 467 is based on the luminance of the post-medication state estimation information X1 having the highest luminance.
- the reference may be other post-medication state estimation information.
- the correction coefficient calculation unit 467 calculates the ratio of the respective luminances of the post-medication state estimation information X1 to X3 with respect to the reference luminance. For example, when the luminance of the post-dose state estimation information X2 is 50% of the luminance of the post-drug state estimation information X1, and the luminance of the post-dose state estimation information X3 is 80% of the luminance of the post-dose state estimation information X1, The luminance ratio is calculated as shown below.
- the correction coefficient calculation unit 467 corrects the correction coefficient for the post-medication state information of the first cell that is the same as the pre-medication state indicated by the pre-medication state information associated with the post-medication state estimation information X1.
- the correction coefficient calculation unit 467 sets the correction coefficient for the post-dose state information of the first cell that is the same as the pre-dose state information indicated by the pre-dose state information associated with the post-dose state estimation information X2 to 0.5. .
- the correction coefficient calculation unit 467 sets a correction coefficient for the post-medication state information of the first cell in the pre-medication state and the pre-medication state indicated by the pre-medication state information associated with the post-medication state estimation information X3 to 0.8.
- the correction coefficient calculation unit 467 corrects the influence of the pre-medication state of the first cell for each well on the post-medication state of the first cell based on the post-medication state estimation information included in the correspondence estimation information.
- the control unit 46 has been described as a configuration in which the correction coefficient calculation unit 467 calculates the correction coefficient, but instead, a configuration in which a correction amount is determined using a correction value data table prepared in advance. It may be.
- the post-substance addition state information correction unit 468 repeats step S260 for each of the plurality of wells provided in the well plate WP (step S250).
- the post-substance addition state information correction unit 468 pre-dosing the first cell seeded in the well selected in step S250 from the pre-dosing state information of the first cell acquired by the pre-substance state information acquisition unit 461. Extract status information.
- the post-dose state information correction unit 468 extracts a correction coefficient for the post-dose state information of the first cell, which is the extracted pre-dose state information, from the correction coefficient calculated by the correction coefficient calculation unit 467.
- the post-dose state information correction unit 468 corrects the post-dose state information based on the extracted correction coefficient and the post-dose state information of the first cell seeded in the well selected in step S250 (step S250). S260).
- the post-dose state information correction unit 468 multiplies the post-dose state information of the first cell seeded in the well selected in step S250 by the extracted correction coefficient, thereby obtaining the post-dose state information. Correct.
- the post-substance addition state information correction unit 468 uses another method (for example, other than multiplication) based on the extracted correction coefficient and post-dose state information of the first cell seeded in the well selected in step S250.
- the post-medication state information may be corrected by the following four arithmetic operation methods or calculation methods using weights.
- FIG. 8 is a diagram illustrating the response of the first cells to five drugs A to E having different drug types.
- Graphs DT1 and DT2 are graphs obtained by the analysis system Z in which the correction process by the post-substance addition state information correction unit 468 is not performed.
- graphs obtained by the analysis system 1 are shown in the graph DT3 and the graph DT4.
- the graph DT1 is the result of the first analysis (experiment) for the first cell by the analysis system Z
- the graph DT3 is the result of the first analysis (experiment) for the first cell by the analysis system 1. It explains as being.
- Graph DT2 is the result of the second analysis (experiment) on the first cell by the analysis system Z
- graph DT4 is the result of the second analysis (experiment) on the first cell by the analysis system 1. explain.
- each graph histograms corresponding to the respective drugs A to E are drawn as responses of the first cells to the respective drugs A to E.
- the height of the histogram in each graph represents an average value of post-dose state information of the first cell obtained for each of the plurality of wells provided in the well plate WP.
- the average value is an average value of the luminance of each well, and is an index representing the response of the first cell to each drug after the first cell is dosed.
- error bars associated with the histogram represent the average error range.
- the magnitude relationship between the histogram values in the graph DT1 obtained by the analysis system Z does not match the magnitude relationship between the histogram values in the graph DT2.
- the highest value histogram is a histogram associated with the medicine B
- the next highest value histogram is a histogram associated with the medicine E.
- the highest value histogram is a histogram associated with the medicine A
- the next highest value histogram is a histogram associated with the medicine C.
- the analysis (experiment) result obtained by the analysis system Z varies every time the analysis (experiment) is performed. Further, in the analysis system Z, information on the state of the first cell before the first cell is administered is not considered in the analysis. Therefore, the analysis (experiment) result obtained by the analysis system 1Z has a wide average error range represented by the error bar, and in order to know which drug is the drug with the highest response of the first cell, It is necessary to repeat more experiments. If more experiments are repeated, the monetary and time costs associated with medication increase.
- the magnitude relationship between the histograms in the graph DT3 obtained by the analysis system 1 and the magnitude relationship between the histograms in the graph DT4 coincide.
- the highest value histogram is a histogram associated with the medicine B
- the next highest value histogram is a histogram associated with the medicine E.
- the highest value histogram is a histogram associated with the medicine B
- the next highest value histogram is a histogram associated with the medicine E.
- the range represented by the error bars associated with the histograms shown in the graphs DT3 and DT4 is narrower than the range represented by the error bars associated with the histograms shown in the graphs DT1 and DT2.
- the features appearing in these graphs DT3 and DT4 described in FIG. 8 are the results that appear when the post-dose state information of the first cells is corrected by the analysis system 1 based on the pre-dose state information of the first cells. It is. That is, the analysis system 1 can improve the analysis accuracy by correcting the post-dose state information of the first cell based on the pre-dose state information of the first cell by the correction device 4.
- the post-substance addition state information output unit 470 displays the post-dose state information of the first cell corrected in step S260 on the display unit 45 for each of the plurality of wells included in the well plate WP. It is displayed (step S270).
- the correspondence information generation unit 464 associates the pre-dose state information of the first cell with the post-dose state information of the first cell corrected in step S260 for each of the plurality of wells included in the well plate WP. Correspondence information is generated (step S280).
- the correspondence information generation unit 464 stores the correspondence information generated in step S280 in the correspondence information DB 5 (step S290).
- the correction device 4 of the present embodiment is configured so that the first state information indicating the state of the first cell before the first cell is dosed (addition of a substance) (the first cell pre-dose state information). ), The second state information indicating the state of the second cell before the substance is added to the second cell (pre-dose state information of the second cell), and the substance is added to the second cell.
- the state of the first cell after the addition of the substance to the first cell based on the information indicating the state of the second cell after the second state (post-dose state information of the second cell) and the first state information (Information on the first cell after administration) is corrected.
- the correction device 4 can improve the analysis accuracy.
- the correction device and the program of the present invention can be applied to a drug discovery screening device and a drug discovery screening system.
- the correction device and the program of the present invention are used in the drug manufacturing apparatus and manufacturing process to manufacture the drug. Is possible.
- the drug discovery screening system includes, for example, a drug addition device (an example of a substance addition device) that adds a drug to the first cells and a cell observation device that observes the first cells.
- the drug discovery screening system may include other devices.
- the drug addition device is, for example, a device that adds a drug to the first cell by a pipette or the like, but may be another device that adds a drug to the first cell.
- the cell observation device is, for example, a device that observes the first cell with a microscope or the like, but may be another device that observes the first cell.
- the observation of the first cell by the cell observation device includes, for example, culture of the first cell, imaging of the first cell, and detection / analysis of the state of the first cell from the image obtained by imaging the first cell. Although some or all of them are included, the present invention is not limited to this, and may include other operations on the first cells. In addition, the observation of the first cell by the cell observation device may include other operations on the first cell.
- a program for executing each process of the correction device 4 in the embodiment of the present invention is recorded on a computer-readable recording medium, and the program recorded on the recording medium is read into a computer system and executed.
- the various processes described above may be performed.
- the “computer system” referred to here may include an OS and hardware such as peripheral devices. Further, the “computer system” includes a homepage providing environment (or display environment) if the WWW system is used.
- “Computer-readable recording medium” means a flexible disk, a magneto-optical disk, a ROM, a writable nonvolatile memory such as a flash memory, a portable medium such as a CD-ROM, a hard disk built in a computer system, etc. This is a storage device.
- the “computer-readable recording medium” means a volatile memory (for example, DRAM) in a computer system that becomes a server or a client when a program is transmitted via a network such as the Internet or a communication line such as a telephone line. In this way, it is assumed to include those that hold programs for a certain period of time.
- the program may be transmitted from a computer system storing the program in a storage device or the like to another computer system via a transmission medium or by a transmission wave in the transmission medium.
- the “transmission medium” for transmitting the program refers to a medium having a function of transmitting information, such as a network (communication network) such as the Internet or a communication line (communication line) such as a telephone line.
- the program may be for realizing a part of the functions described above. Furthermore, what can implement
Landscapes
- Chemical & Material Sciences (AREA)
- Organic Chemistry (AREA)
- Life Sciences & Earth Sciences (AREA)
- Zoology (AREA)
- Wood Science & Technology (AREA)
- Proteomics, Peptides & Aminoacids (AREA)
- Health & Medical Sciences (AREA)
- Engineering & Computer Science (AREA)
- Microbiology (AREA)
- Biochemistry (AREA)
- Physics & Mathematics (AREA)
- Molecular Biology (AREA)
- Biotechnology (AREA)
- Biophysics (AREA)
- Analytical Chemistry (AREA)
- Immunology (AREA)
- Bioinformatics & Cheminformatics (AREA)
- General Engineering & Computer Science (AREA)
- General Health & Medical Sciences (AREA)
- Genetics & Genomics (AREA)
- Apparatus Associated With Microorganisms And Enzymes (AREA)
- Measuring Or Testing Involving Enzymes Or Micro-Organisms (AREA)
Abstract
補正装置は、第1細胞に対する物質の添加が行われる前の第1細胞の状態を示す第1状態情報を取得する第1取得部と、第2細胞に物質の添加が行われる前の第2細胞の状態を示す第2状態情報と、第2細胞に物質の添加が行われた後の第2細胞の状態を示す情報と、第1状態情報とに基づいて、第1細胞に物質の添加が行われた後の第1細胞の状態を示す情報を補正する補正部と、を備える。
Description
本発明は、補正装置、創薬スクリーニングシステム、プログラム、薬品の製造方法、及び薬品に関する。
例えば細胞の培養工程において、培養に必要な物質を添加する工程がある。また、例えば培養中の細胞に対して物質を添加し、添加した物質に対する細胞の応答を評価する技術が研究・開発されている。
これに関し、高速に大量の細胞の薬剤に対する応答を評価するHTS(High Throughput Screening)分析法が知られている(特許文献1参照)。
しかしながら、従来の細胞アッセイ、例えばHTS分析法、HCA(High Contents Analysis)分析法等では、評価結果が、添加した物質に対する応答により生じた結果であるのか、細胞に対して物質の添加が行われる前の細胞の状態により生じた結果であるのかを区別することができないことがあり、分析精度の向上が困難であった。
本発明は、上記問題に鑑みてなされたものであり、分析精度を向上させることができる補正装置、創薬スクリーニングシステム、プログラム、薬品の製造方法、及び薬品を提供することを課題とする。
上記問題を解決するために、本発明の一態様は、第1細胞に対する物質の添加が行われる前の前記第1細胞の状態を示す第1状態情報を取得する第1取得部と、第2細胞に物質の添加が行われる前の前記第2細胞の状態を示す第2状態情報と、前記第2細胞に物質の添加が行われた後の前記第2細胞の状態を示す情報と、前記第1状態情報とに基づいて、前記第1細胞に物質の添加が行われた後の前記第1細胞の状態を示す情報を補正する補正部と、を備えることを特徴とする補正装置である。
また、上記問題を解決するために、本発明の一態様は、上記の補正装置と、前記第1細胞に物質を添加する物質添加装置と、前記第1細胞を観察する細胞観察装置と、を備えることを特徴とする創薬スクリーニングシステムである。
また、上記問題を解決するために、本発明の一態様は、コンピューターに、第1細胞に対する物質の添加が行われる前の前記第1細胞の状態を示す第1状態情報を取得する第1取得ステップと、第2細胞に物質の添加が行われる前の前記第2細胞の状態を示す第2状態情報と、前記第2細胞に物質の添加が行われた後の前記第2細胞の状態を示す情報と、前記第1状態情報とに基づいて、前記第1細胞に物質の添加が行われた後の前記第1細胞の状態を示す情報を補正する補正ステップと、を実行させるプログラムである。
また、上記問題を解決するために、本発明の一態様は、第1細胞に対する物質の添加が行われる前の前記第1細胞の状態を示す第1状態情報を取得する第1取得ステップと、第2細胞に物質の添加が行われる前の前記第2細胞の状態を示す第2状態情報と、前記第2細胞に物質の添加が行われた後の前記第2細胞の状態を示す情報と、前記第1状態情報とに基づいて、前記第1細胞に物質の添加が行われた後の前記第1細胞の状態を示す情報を補正する補正ステップと、を有することを特徴とする薬品の製造方法である。
また、上記問題を解決するために、本発明の一態様は、上記に記載の薬品の製造方法により製造された薬品である。
本発明によれば、分析精度を向上させることができる。
<実施形態>
以下、本発明の実施形態について、図面を参照して説明する。図1は、本実施形態に係る分析システム1の構成の一例を示す図である。分析システム1は、HTS分析装置2と、画像分析装置3と、補正装置4と、対応情報DB(DataBase)5を備える。分析システム1は、HTS分析法によって分析対象となる細胞の分析を行う。細胞の分析とは、当該細胞に対して物質を添加し、添加した物質に対する細胞の応答を評価することを示す。なお、以下では、当該物質として、薬剤を例に挙げて説明するが、当該物質は薬剤に限られず、他の物質であってもよい。
以下、本発明の実施形態について、図面を参照して説明する。図1は、本実施形態に係る分析システム1の構成の一例を示す図である。分析システム1は、HTS分析装置2と、画像分析装置3と、補正装置4と、対応情報DB(DataBase)5を備える。分析システム1は、HTS分析法によって分析対象となる細胞の分析を行う。細胞の分析とは、当該細胞に対して物質を添加し、添加した物質に対する細胞の応答を評価することを示す。なお、以下では、当該物質として、薬剤を例に挙げて説明するが、当該物質は薬剤に限られず、他の物質であってもよい。
分析対象となる細胞とは、例えば、肝細胞等のヒトの臓器を構成する細胞や神経細胞、iPS(induced Pluripotent Stem)細胞やES(Embryonic Stem)細胞等の幹細胞等であるが、他の細胞であってもよく、ヒトとは異なる動物の細胞であってもよく、植物の細胞であってもよい。
以下では、説明の便宜上、図1に示したウェルプレートWPが備える複数のウェルWL(1,…,n;nは2以上の整数)毎に播種された1以上の細胞をまとめて第1細胞と称し、分析システム1が第1細胞に対してHTS分析法によって分析を行う場合について説明する。以下では、説明の便宜上、HTS分析法による第1細胞の分析を、単に第1細胞の分析と称して説明する。また、以下では、ウェルと称した場合、ウェルWLのうちのいずれか1つのウェルを示すとする。
分析システム1が行う第1細胞の分析とは、ウェルプレートWPが備える複数のウェル毎に播種された第1細胞に対する分析である。また、分析される第1細胞の総数は、数千~数百万個程度である。第1細胞の分析では、ウェルプレートWPが備える複数のウェル毎に播種された第1細胞に対して所定の薬剤を添加し、所定の薬剤が添加された第1細胞を所定期間培養する。
また、本実施の形態において第1細胞の分析では、第1細胞に対して所定の薬剤が添加されたことにより生成された新規生理活性化合物の量を示す指標を、所定期間培養された当該第1細胞に対して、例えば、蛍光試薬を添加することにより検出する。すなわち、第1細胞の分析では、蛍光試薬が添加された第1細胞が発する蛍光強度によって検出することにより第1細胞を検出する。
分析システム1は、第1細胞の分析において、蛍光試薬が第1細胞に対して添加された後のウェルプレートWPが備える複数のウェル毎の輝度を光電子増倍管によって検出する。ウェルの輝度とは、ウェル内において平均された輝度を示す。この分析システム1が光電子増倍管によって検出するウェル毎の輝度が、この一例において各ウェルに播種された第1細胞に所定の薬剤が添加された後の第1細胞の状態を示す指標である。この指標は、換言すると、第1細胞に対する当該薬剤の添加による第1細胞の応答である。つまり、分析システム1は、第1細胞の分析において、ウェル毎の輝度を第1細胞の応答を示す指標として提示(出力、表示)する。
本実施形態における分析システム1は、このような第1細胞の分析において、分析精度を向上させる。この分析精度を向上させる方法により、例えば、ユーザーは、創薬スクリーニングにおいて、第1細胞に対して有効な薬剤(薬品)を複数の薬剤の中から精度よく選別することができる。その結果、精度が悪いことに起因する実験回数の増大や投薬に係るコストを抑制し、選別された第1細胞に有効な薬剤をより安価により早く製造することができる。すなわち、当該方法を含む薬剤の製造方法は、第1細胞に有効な薬剤を、精度よく、そしてより安価により早く製造することができる。以下では、分析システム1が第1細胞の分析において分析精度を向上させる方法について詳しく説明する。
なお、以下では、説明の便宜上、ある細胞Xに対して所定の薬剤を添加することを、細胞Xに対して投薬を行うと称して説明する。また、以下では、第1細胞に対して投薬が行われた後の第1細胞の状態を示す指標を、第1細胞に対して投薬が行われた後の第1細胞の状態と称して説明する。
このように、本実施形態では、創薬スクリーニングにおける薬剤の添加の例で説明するが、本願発明はこれに限定されるものではなく、例えば、幹細胞からの分化工程におけるタンパクや遺伝子等の物質の添加或いは導入に対しても適用可能である。
すなわち、本願発明は、細胞に対して何らかの物質を添加或いは導入する工程を含む分野で適用可能なものである。
すなわち、本願発明は、細胞に対して何らかの物質を添加或いは導入する工程を含む分野で適用可能なものである。
この一例において、分析システム1は、HTS分析装置2と補正装置4が有線により通信可能に接続されている。なお、HTS分析装置2と補正装置4は、無線により通信可能に接続されていてもよい。また、画像分析装置3と補正装置4は、有線により通信可能に接続されている。なお、画像分析装置3と補正装置4は、無線により通信可能に接続されていてもよい。また、補正装置4と対応情報DB5は、有線により通信可能に接続されている。なお、補正装置4と対応情報DB5は、無線により通信可能に接続されていてもよい。
HTS分析装置2は、ある細胞種の細胞X(この一例において、第1細胞や、後述する第2細胞)に対して投薬が行われた後の細胞Xの状態(すなわち、前述の輝度)を検出する。以下では、説明の便宜上、HTS分析装置2により細胞Xに対して投薬が行われた後の細胞Xの状態を検出することを、HTS分析装置2による分析と称して説明する。HTS分析装置2は、検出した情報であって、細胞Xに対して投薬が行われた後の細胞Xの状態を示す情報を補正装置4に出力(送信)する。以下では、説明の便宜上、細胞Xに対して投薬が行われた後の細胞Xの状態を、細胞Xの投薬後状態と称し、細胞Xに対して投薬が行われた後の細胞Xの状態を示す情報を、細胞Xの投薬後状態情報と称して説明する。
ここで、細胞種とは、組織や動物種によって分類されるものであり、例えば、ヒト子宮頸癌細胞、ヒト腎臓細胞、マウス線維芽細胞等である。また、細胞株とは、細胞種(組織や動物種)が同じであっても、由来や遺伝子亜型の違いによって分類されるものであり、例えば、HeLa細胞、HeLa.S3細胞、QG-U細胞等である。より具体的には、例えば、細胞種が子宮頸癌細胞の場合、細胞株には、HeLa細胞(由来:30代黒人)、QG-U細胞(由来:日本人子宮頸部癌)、HeLa.S3細胞(由来:HeLaの亜株の一つでコロニー形成率が非常に高いことで知られる。)がある。また、細胞種として腎臓細胞の場合、細胞株には、HEK293細胞(由来:ヒト胎児腎細胞)、HEK293T細胞(由来:由来:HeLaの亜株の一つ。SV40 large T antigenを発現しているヒト胎児腎細胞)、HeLa.S3細胞(由来:HeLaの亜株の一つ。MoMLVのgag/polを発現するパッケージング細胞株で知られる)がある。
画像分析装置3は、撮像部37を備える顕微鏡であり、撮像部37で撮像された画像を解析する解析部(例えば、後述する画像解析部361)を備えるものである。なお、解析部は、顕微鏡とは別体に設けられてもよく、例えば、PC(Personal Computer)等であってもよい。画像分析装置3は、ユーザーから受け付けられた操作に基づいて、HTS分析装置2による分析が行われる前の細胞X(すなわち、投薬が行われる前の細胞X)の画像を撮像部37により撮像する。撮像部37により撮像される画像は、例えば、位相差画像である。以下では、説明の便宜上、撮像部37により撮像される画像が位相差画像である場合について説明する。画像分析装置3は、撮像された画像に基づいて、HTS分析装置2による分析が行われる前の細胞Xの状態を検出する。なお、画像分析装置3で分析される画像は、細胞へのダメージが少ない位相差画像が適しているが、これに限られず、例えば、蛍光試薬を添加し取得した蛍光画像や、明視野観察画像、暗視野観察画像、微分干渉観察画像等の非侵襲観察により得られる画像であってもよい。
細胞Xに対して投薬が行われる前の細胞Xの状態は、この一例において、各ウェル内における複数の細胞Xのうちの生細胞数と、各ウェル内における複数の細胞Xのうちの死細胞数と、各ウェル内の細胞Xの良し悪しを示す情報と、各ウェル内の異物数とによって表される。生細胞数とは、生きている細胞の数を示す。死細胞数とは、死んでいる細胞の数を示す。細胞Xの良し悪しは、例えば、レベル1~レベルN(Nは、2以上の整数であり、例えば、5)までの2以上の段階によって表される。この一例において、レベル1が最も悪いことを表し、レベルNが最も良いことを表す。また、細胞Xの良し悪しが当該2以上の段階のいずれに該当するかは、各ウェル内における播種の失敗の有無や、細胞Xの形、細胞Xが形成する集団の疎密等によって決定される。異物とは、異型細胞や、ウェル内のゴミ等を示す。
画像分析装置3は、播種の失敗の有無や、細胞Xの形、複数の細胞Xが形成する集団の疎密、異物等を、記憶部32に予め記憶されたリファレンス画像に基づくパターンマッチング等の手法によって検出する。すなわち、画像分析装置3は、撮像部37から取得した位相差画像から検出した細胞の形や細胞の集まり度合い、細胞以外の物体等をリファレンス画像と比較することにより、播種の失敗の有無や、細胞Xの形、細胞Xの疎密、異物等を検出する。なお、画像分析装置3は、パターンマッチング以外の他の手法によって播種の失敗の有無や、細胞Xの形、細胞Xの疎密、異物、培地の量、pH、培地の良否等を検出する構成であってもよい。また、画像分析装置3は、細胞単体毎に、細胞の形状、細胞の面積、細胞の輝度等を検出してもよい。また、画像分析装置3は、複数の細胞からなる細胞集団毎に、細胞間距離を測定することで細胞の凝集や細胞の分散状態、細胞の密度等を検出してもよい。なお、細胞の凝集や細胞の分散状態は、ウェルへの細胞の播種の失敗の有無の判断指標となる。
以下では、説明の便宜上、HTS分析装置2を用いた例を示し、HTS分析装置2による分析が行われる前の細胞Xの状態を画像分析装置3によって検出することを、画像分析装置3による分析と称して説明する。画像分析装置3は、検出した情報であって、HTS分析装置2による分析が行われる前(すなわち、投薬が行われる前)の細胞Xの状態を示す情報に、撮像部37により当該細胞Xが撮像された位相差画像を対応付けて補正装置4に出力(送信)する。
以下では、説明の便宜上、投薬が行われる前の細胞Xの状態を、細胞Xの投薬前状態と称し、細胞Xの投薬前状態を示す情報を、細胞Xの投薬前状態情報と称して説明する。また、以下では、細胞Xの投薬前状態情報と称した場合、細胞Xの投薬前状態情報には、細胞Xに投薬が行われる前の細胞Xが撮像された位相差画像が対応付けられているとして説明する。
撮像部37は、例えば、集光された光を電気信号に変換する撮像素子であるCCD(Charge Coupled Device)やCMOS(Complementary Metal Oxide Semiconductor)等を備えたカメラである。
補正装置4は、HTS分析装置2から第1細胞の投薬後状態情報を取得する。また、補正装置4は、画像分析装置3から第1細胞の投薬前状態情報を取得する。第1細胞の投薬前状態情報は、第1状態情報の一例である。また、補正装置4は、対応情報DB5から対応情報を取得する。対応情報とは、第2細胞の投薬前状態情報と、第2細胞の投薬後状態情報とが対応付けられた情報である。
第2細胞とは、例えば、過去に画像分析装置3とHTS分析装置2のそれぞれにより分析が行われた細胞を示し、好ましくは第1細胞の細胞種と細胞種が同一の細胞である。第2細胞は、細胞腫が第1細胞の細胞種と同一の細胞であるものの他、例えば、細胞集団の密集度合が第1細胞の細胞集団の密集度合と略同一又は類似している細胞や、細胞集団の密度が第1細胞の細胞集団の密度と略同一又は類似している細胞、細胞集団の細胞間距離が第1細胞の細胞集団の細胞間距離と略同一又は類似している細胞、細胞集団の細胞数が第1細胞の細胞集団の細胞数と略同一又は類似している細胞、異物の存在の有無等が第1細胞の細胞集団における異物の存在の有無と略同一又は類似している細胞等であってもよい。すなわち、対応情報とは、第2細胞に対して投薬が行われた前後の状態が対応付けられた情報であり、第2細胞の細胞種と細胞種が同一の細胞に対して何らかの薬剤を投薬した場合の薬剤に対する応答の出方と、当該細胞の投薬前状態とを表す情報である。好ましくは対応情報とは、第1細胞の細胞種と細胞種が同一の第2細胞に対して投薬が行われた前後の状態が対応付けられた情報であり、第2細胞の細胞種と細胞種が同一の細胞に対して何らかの薬剤を投薬した場合の薬剤に対する応答の出方と、当該細胞の投薬前状態との相関を表す情報である。
補正装置4は、画像分析装置3から取得した第1細胞の投薬前状態情報と、対応情報DB5から取得した対応情報とに基づいて、第1細胞の投薬後状態を推定する。補正装置4は、推定した第1細胞の投薬後状態に基づいて、HTS分析装置2から取得した第1細胞の投薬後状態情報を補正するための補正係数を算出する。補正装置4は、算出した補正係数に基づいて、HTS分析装置2から取得した第1細胞の投薬後状態情報を補正する。これにより、補正装置4は、第1細胞の投薬前状態に起因する第1細胞の投薬後状態情報のばらつき(誤差、ノイズ)を補正することができ、その結果、分析精度を向上させることができる。
また、補正装置4は、推定した前述の第1細胞の投薬後状態に基づいて投薬可否判定を行う。補正装置4は、投薬可否判定により、第1細胞に対して投薬を行うべきか否かを判定する。換言すると、補正装置4は、ウェルに播種された第1細胞の投薬前状態が分析に適さない状態であるか否かを判定する。分析に適さない状態とは、推定された第1細胞の投薬後状態が、第1細胞に対する投薬の影響が第1細胞の投薬後状態に反映されない状態、又は第1細胞に対する投薬の影響が第1細胞の投薬後状態に過剰に反映されてしまう状態である。補正装置4は、例えば、分析に適さない状態であるか否かを、所定条件を満たすか否かによって判定する。所定条件には、以下に示した条件1)~条件4)が含まれる。
条件1)ウェル内の細胞数が所定の閾値未満であること
条件2)ウェル内の細胞に対するパターンマッチング等で、細胞状態が悪いものと認識された細胞数が所定数以上であること
条件3)視野内に異常な物体が発見されること
条件4)培地の状態が悪いと判断されること
条件2)ウェル内の細胞に対するパターンマッチング等で、細胞状態が悪いものと認識された細胞数が所定数以上であること
条件3)視野内に異常な物体が発見されること
条件4)培地の状態が悪いと判断されること
補正装置4は、ウェルに播種された第1細胞の投薬前状態が上記の条件1)~条件4)のうちいずれか1つを満たす場合、分析に適さない状態であると判定する。条件1)を満たす状態は、例えば、播種時の細胞数が足りなかった場合や、細胞の状態が悪くて細胞が接着しなかった場合、播種後の培養が上手くいかなかった場合等に生じる。このような場合、第1細胞の投薬後状態は、第1細胞に添加した薬剤に有意な効果が無かった場合であっても、第1細胞に添加した薬剤に有意な効果があったかのような状態として検出されてしまう。例えば、細胞数を減少させることを目的とする化合物、すなわち対象細胞の活性を阻害するような化合物を薬剤として第1細胞に添加した場合、当該薬剤に有意な効果が無かったとしても、第1細胞の投薬後状態が、当該薬剤に有意な効果があったかのような状態として検出されてしまうことがある。このような理由から、第1細胞の投薬前状態は、上記の条件1を満たしている場合、分析に適さない状態と考えられる。
また、条件2)を満たす状態は、例えば、投薬前の段階で第1細胞の状態が悪くなっている(例えば、マイコプラズマ感染を起こしている)等の場合に生じることがある。このような場合、条件1)を満たす状態と同様に、第1細胞の投薬後状態は、第1細胞に添加した薬剤に有意な効果が無かった場合であっても、第1細胞に添加した薬剤に有意な効果があったかのような状態として検出されてしまう。従って、第1細胞の投薬前状態は、上記の条件2を満たしている場合、分析に適さない状態と考えられる。
また、条件3)を満たす状態は、例えば、カビ等が混入した場合等に生じる。このような場合、混入したカビ等の異常な物体は、第1細胞に対して添加する薬剤と何らかの反応を起こす可能性があり、想定と異なる薬剤効果、すなわちノイズを発生させてしまう場合がある。従って、第1細胞の投薬前状態は、上記の条件3を満たしている場合、分析に適さない状態と考えられる。
また、条件4)を満たす状態は、例えば、pH等の培地の状態に異常がある(所望の実験条件を満たすように整えられていない)場合等に生じる。このような場合、条件3を満たす状態と同様に、培地の状態の異常は、第1細胞に対して添加する薬剤と何らかの反応を起こす可能性があり、想定と異なる薬剤効果、すなわちノイズを発生させてしまう場合がある。従って、第1細胞の投薬前状態は、上記の条件4を満たしている場合、分析に適さない状態と考えられる。
このように上記の条件1~条件4のうちのいずれか1つが満たされた場合、すなわち所定条件が満たされた場合、補正装置4は、第1細胞の投薬前状態が分析に適さない状態である、すなわち投薬すべきではないと判定する。一方、所定条件が満たされない場合、補正装置4は、第1細胞の投薬前状態が分析に適した状態、すなわち投薬すべきであると判定する。
補正装置4は、例えば、当該投薬可否判定の結果を、表示部に表示させる。これにより、ユーザーは、投薬すべきではないウェル内の第1細胞に対して投薬することを抑制することができる。すなわち、補正装置4は、不必要な投薬に係る金銭的・時間的コストの増大を抑制することができる。また、第1細胞の状態が分析に適さない状態のまま第1細胞に投薬を行うと、分析システム1は、第1細胞の所定の薬剤に対する応答を誤って検出してしまう場合がある。補正装置4の投薬可否判定は、このような誤検出を抑制し、その結果、分析精度を向上させることができる。
また、補正装置4は、画像分析装置3とHTS分析装置2のそれぞれにより第1細胞に対する分析が行われるより前に、予め対応情報を生成する。より具体的には、補正装置4は、画像分析装置3から参照する細胞となる第2細胞の投薬前状態情報を取得する。また、補正装置4は、HTS分析装置2から第2細胞の投薬後状態情報を取得する。補正装置4は、画像分析装置3から取得した第2細胞の投薬前状態情報と、HTS分析装置2から取得した第2細胞の投薬後状態情報とを対応付けた対応情報を生成する。補正装置4は、生成した対応情報を、対応情報DB5に記憶させる。
対応情報DB4は、前述した対応情報を記憶するサーバー(データベースサーバー)である。ここで、図2を参照して、対応情報DB5が記憶する対応情報について説明する。図2は、対応情報に含まれる情報の一例を示す図である。図2に示したように対応情報には、第2細胞の投薬前状態情報D1と、第2細胞の投薬後状態情報D2とが含まれる。
また、第2細胞の投薬前状態情報D1は、図2に示したように、第2細胞の投薬前状態情報D3に対して、第2細胞に対して投薬が行われる前の第2細胞が撮像された位相差画像P1が対応付けられている。位相差画像P1は、画像分析装置3の撮像部37により撮像された位相差画像である。
投薬前状態情報D3は、ウェル毎に割り当てられたウェルネームと、各ウェルを識別するウェルナンバー(例えば、ウェルID)と、各ウェル内における細胞Xのうちの生細胞数と、各ウェル内における細胞Xのうちの死細胞数と、各ウェル内の細胞Xの良し悪しを示す情報に加え細胞の培養状態、例えば播種時の細胞密度、細胞の凝集やゴミ、細胞の浮遊状態、細胞数、各ウェル内の異物数とを含む。なお、投薬前状態情報D3には、細胞名、継代等それまでの培養状態情報、播種数、培地情報(名称、濃度等)、容器情報等のうちの一部又は全部が含まれてもよい。
投薬後状態情報D2は、ウェル毎に割り当てられたウェルネームと、各ウェルを識別するウェルナンバーと、第2細胞に対して例えば蛍光試薬を添加した際のウェル毎の輝度を示す情報とを含む。また、投薬後状態情報D2には、ウェルの輝度を示す情報に代えて、蛍光試薬とは異なる他の試薬を添加した際の細胞の発光状態を示す情報を含んでいてもよい。
ここで、図3は、分析システム1による第1細胞の分析、例えば、薬品スクリーニング時に用いる薬品等の物質が添加される第1細胞の分析における第1細胞の投薬前状態情報と第1細胞の投薬後状態情報とがそれぞれ生成されるまでの流れの一例を模式的に示す図である。まず、第1細胞は、ユーザーによってウェルプレートWPが備える複数のウェルWL毎に播種される。ここで、ユーザーとは、分析システム1により第1細胞の分析を行う分析者や研究者等であるが、作業者等の他の身分の者であってもよい。
次に、ユーザーは、第1細胞が各ウェルに播種されたウェルプレートWPを画像解析部361の撮像部37が撮像可能な範囲に配置し、画像分析の準備を行う。次に、画像分析装置3は、受け付けられたユーザーからの操作に基づいて、撮像部37によりウェルプレートWPが備える複数のウェル毎に播種された第1細胞の位相差画像を撮像する。次に、画像分析装置3は、撮像部37が撮像した位相差画像に基づいて画像分析を行い、図2に示した第1細胞の投薬前状態情報D1をウェル毎に生成する。
次に、ユーザーは、画像分析装置3に配置されていたウェルプレートWPをHTS分析装置2に配置し、HTS分析の準備を行う。この画像分析装置3からHTS分析装置2へのウェルプレートの搬送は、手動でも良く、又は画像分析装置3とHTS分析装置2とを一体化した分析装置を構築し、ウェルプレートWPを自動搬送する搬送装置を設け、自動搬送する構成であってもよい。次に、HTS分析装置2は、受け付けられたユーザーからの操作に基づいて、ウェルプレートWPが備える複数のウェル毎に播種された第1細胞に対して投薬を行い、所定時間だけ第1細胞を培養する。次に、HTS分析装置2は、投薬が行われた第1細胞が播種されたウェルに対して、蛍光試薬を添加する。次に、HTS分析装置2は、蛍光試薬が添加された各ウェルの輝度を光電子増倍管によって検出し、図2に示した第1細胞の投薬後状態情報D2をウェル毎に生成する。
ここで、図4は、分析システム1による第1細胞の分析において扱われる4つの状態の関係性を例示する図である。当該4つの状態とは、すなわち、第1細胞の投薬前状態と、第1細胞の投薬後状態と、第2細胞の投薬前状態と、第2細胞の投薬後状態とを示す。
なお、図4において、時間の流れは、図4の上から下(投薬前から投薬後)に流れているものとして説明する。分析システム1は、第1細胞の分析を行う前に、予め第2細胞に対して分析を行うことにより対応情報(データベース)を生成する。
前述したように、第1細胞と第2細胞とは、細胞種が同じである。従って、第1細胞に対して投薬を行った場合の投薬に対する第1細胞の応答(すなわち、第1細胞の投薬後状態)は、第2細胞に対して投薬を行った場合の投薬に対する第2細胞の応答(すなわち、第2細胞の投薬後状態)と相関があるはずである。
ただし、この相関は、第1細胞の投薬前状態と、第2細胞の投薬前状態とを略同じにする(すなわち、実験における初期条件を揃える)ことによって得られる相関である。分析システム1は、この相関を得るため(すなわち、初期条件を揃えるため)、画像分析装置3による第1細胞の分析と、HTS分析装置2による第1細胞の分析を行う。また、分析システム1は、この相関を利用し、第2細胞の投薬後状態情報に基づいて第1細胞の投薬後状態情報の補正を行う。
次に、図5を参照して、画像分析装置3と補正装置4の機能構成について説明する。図5は、画像分析装置3と補正装置4の機能構成の一例を示す図である。
画像分析装置3は、記憶部32と、入力受付部33と、通信部34と、制御部36と、撮像部37を備える。
画像分析装置3は、記憶部32と、入力受付部33と、通信部34と、制御部36と、撮像部37を備える。
記憶部32は、例えば、HDD(Hard Disk Drive)やSSD(Solid State Drive)、EEPROM(Electrically Erasable Programmable Read-Only Memory)、ROM(Read-Only Memory)、RAM(Random Access Memory)などを含み、画像分析装置3が処理する各種情報や画像、プログラム等を格納する。なお、記憶部32は、画像分析装置3に内蔵されるものに代えて、USB等のデジタル入出力ポート等によって接続された外付け型の記憶装置でもよい。
入力受付部33は、例えば、キーボードやマウス、タッチパッド、その他の入力装置である。なお、入力受付部33は、表示部として機能することでタッチパネルとして構成されてもよい。
通信部34は、例えば、USB等のデジタル入出力ポートやイーサネット(登録商標)ポート等を含んで構成される。
通信部34は、例えば、USB等のデジタル入出力ポートやイーサネット(登録商標)ポート等を含んで構成される。
制御部36は、画像分析装置3の全体を制御する。また、制御部36は、入力受付部33により受け付けられたユーザーからの操作に基づいて、撮像部37により撮像部37が撮像可能な範囲を撮像する。ユーザーは、ウェルプレートWPを当該範囲内に配置し、入力受付部33を介して撮像部37に細胞(この一例において、第1細胞や第2細胞)を撮像させる。
また、制御部36は、画像解析部361を備える。制御部36が備える画像解析部361は、例えば、図示しないCPUが、記憶部32に記憶された各種プログラムを実行することで実現される。また、画像解析部361は、LSI(Large Scale Integration)やASIC(Application Specific Integrated Circuit)等のハードウェア機能部であってもよい。
画像解析部361は、撮像部37により撮像された位相差画像を取得する。画像解析部361は、取得した位相差画像に基づいて細胞Xの投薬前状態を検出する。細胞Xの投薬前状態を検出する際、画像解析部361は、記憶部32に予め記憶されたリファレンス画像を読み込み、読み込んだリファレンス画像と、取得した位相差画像とに基づいて細胞Xの投薬前状態を検出する。
画像解析部361は、検出した細胞Xの投薬前状態情報を記憶部32に記憶させる。画像解析部361は、補正装置4からの要求に応じて、細胞Xの投薬前状態情報を記憶部32から読み込み、読み込んだ細胞Xの投薬前状態情報を、通信部34を介して補正装置4に出力(送信)する。
画像解析部361は、検出した細胞Xの投薬前状態情報を記憶部32に記憶させる。画像解析部361は、補正装置4からの要求に応じて、細胞Xの投薬前状態情報を記憶部32から読み込み、読み込んだ細胞Xの投薬前状態情報を、通信部34を介して補正装置4に出力(送信)する。
補正装置4は、記憶部42と、入力受付部43と、通信部44と、表示部45と、制御部46を備える。
記憶部42は、例えば、HDDやSSD、EEPROM、ROM、RAMなどを含み、補正装置4が処理する各種情報や画像、プログラム等を格納する。なお、記憶部42は、補正装置4に内蔵されるものに代えて、USB等のデジタル入出力ポート等によって接続された外付け型の記憶装置でもよい。
記憶部42は、例えば、HDDやSSD、EEPROM、ROM、RAMなどを含み、補正装置4が処理する各種情報や画像、プログラム等を格納する。なお、記憶部42は、補正装置4に内蔵されるものに代えて、USB等のデジタル入出力ポート等によって接続された外付け型の記憶装置でもよい。
入力受付部43は、例えば、キーボードやマウス、タッチパッド、その他の入力装置である。なお、入力受付部43は、表示部として機能することでタッチパネルとして構成されてもよい。
通信部44は、例えば、USB等のデジタル入出力ポートやイーサネット(登録商標)ポート等を含んで構成される。
表示部45は、液晶ディスプレイパネル、あるいは、有機EL(ElectroLuminescence)ディスプレイパネルである。
通信部44は、例えば、USB等のデジタル入出力ポートやイーサネット(登録商標)ポート等を含んで構成される。
表示部45は、液晶ディスプレイパネル、あるいは、有機EL(ElectroLuminescence)ディスプレイパネルである。
制御部46は、補正装置4の全体を制御する。制御部46は、物質添加前状態情報取得部461と、物質添加後状態情報取得部462と、対応情報取得部463と、対応情報生成部464と、判定部465と、物質添加後状態推定部466と、補正係数算出部467と、物質添加後状態情報補正部468と、判定結果出力部469と、物質添加後状態情報出力部470とを備える。
制御部46が備えるこれらの機能部のうちの一部又は全部は、例えば、図示しないCPUが、記憶部42に記憶された各種プログラムを実行することで実現される。また、制御部46が備えるこれらの機能部のうちの一部又は全部は、LSIやASIC等のハードウェア機能部であってもよい。
物質添加前状態情報取得部461は、画像分析装置3から細胞Xの投薬前状態情報を取得する。
物質添加後状態情報取得部462は、HTS分析装置2から細胞Xの投薬後状態情報を取得する。
物質添加後状態情報取得部462は、HTS分析装置2から細胞Xの投薬後状態情報を取得する。
対応情報取得部463は、対応情報DB5から対応情報を取得する。
対応情報生成部464は、物質添加前状態情報取得部461が画像解析部361から取得した第2細胞の投薬前状態情報と、物質添加後状態情報取得部462がHTS分析装置2から取得した第2細胞の投薬後状態情報とに基づいて対応情報を生成する。
対応情報生成部464は、物質添加前状態情報取得部461が画像解析部361から取得した第2細胞の投薬前状態情報と、物質添加後状態情報取得部462がHTS分析装置2から取得した第2細胞の投薬後状態情報とに基づいて対応情報を生成する。
判定部465は、物質添加後状態推定部466が推定した第1細胞の投薬後状態情報に基づいて投薬可否判定を行う。
物質添加後状態推定部466は、物質添加前状態情報取得部461が画像解析部361から取得した第1細胞の投薬前状態情報と、対応情報取得部463が対応情報DB5から取得した対応情報とに基づいて、第1細胞の投薬後状態を推定する。以下では、説明の便宜上、物質添加後状態推定部466が推定した第1細胞の投薬後状態を示す情報を、第1細胞の投薬後状態推定情報と称して説明する。物質添加後状態推定部466は、推定部の一例である。
物質添加後状態推定部466は、物質添加前状態情報取得部461が画像解析部361から取得した第1細胞の投薬前状態情報と、対応情報取得部463が対応情報DB5から取得した対応情報とに基づいて、第1細胞の投薬後状態を推定する。以下では、説明の便宜上、物質添加後状態推定部466が推定した第1細胞の投薬後状態を示す情報を、第1細胞の投薬後状態推定情報と称して説明する。物質添加後状態推定部466は、推定部の一例である。
補正係数算出部467は、物質添加後状態推定部466が推定した第1細胞の投薬後状態推定情報に基づいて、物質添加後状態情報取得部462が取得した第1細胞の投薬後状態情報を補正するための補正係数を算出する。補正係数算出部467は、算出部の一例である。
物質添加後状態情報補正部468は、補正係数算出部467が算出した補正係数に基づいて、物質添加後状態情報取得部462が取得した第1細胞の投薬後状態情報を補正する。
物質添加後状態情報補正部468は、補正係数算出部467が算出した補正係数に基づいて、物質添加後状態情報取得部462が取得した第1細胞の投薬後状態情報を補正する。
判定結果出力部469は、判定部465による投薬可否判定の結果を示す情報を表示部45に表示させる。
物質添加後状態情報出力部470は、物質添加後状態情報補正部468が補正した第1細胞の投薬後状態情報を表示部45に表示させる。
物質添加後状態情報出力部470は、物質添加後状態情報補正部468が補正した第1細胞の投薬後状態情報を表示部45に表示させる。
次に、図6を参照して、補正装置4の制御部46が行う投薬可否判定処理の流れについて説明する。図6は、補正装置4の制御部46が行う投薬可否判定処理の流れの一例を示すフローチャートである。
なお、図6に示したフローチャートにおいて、ステップS100からステップS140までの処理は、ウェルプレートWPのうちの1つのウェルに対して行われる処理として説明するが、複数のウェルに対して並列に行われてもよい。その場合、ステップS140において表示部45に表示される投薬可否判定の結果は、例えば、ウェル毎に表示される。
まず、物質添加前状態情報取得部461は、入力受付部43が受け付けたユーザーからの操作に基づいて、第1細胞の投薬前状態情報取得の要求を、通信部44を介して画像解析部361に送信する。そして、物質添加前状態情報取得部461は、画像解析部361から第1細胞の投薬前状態情報を取得する(ステップS100)。
次に、対応情報取得部463は、入力受付部43が受け付けたユーザーからの操作に基づいて、対応情報取得の要求を、通信部44を介して対応情報DB5に送信する。そして、対応情報取得部463は、対応情報DB5から対応情報を取得する(ステップS110)。
次に、物質添加後状態推定部466は、物質添加前状態情報取得部461が取得した第1細胞の投薬前状態情報と、対応情報取得部463が取得した対応情報とに基づいて、第1細胞の投薬後状態を推定する(ステップS120)。ここで、物質添加後状態推定部466による第1細胞の投薬後状態の推定処理について説明する。
物質添加後状態推定部466は、第1細胞の投薬前状態情報と略同じ状態を示す第2細胞の投薬前状態情報を対応情報から抽出する。略同じ状態とは、例えば、第1細胞の投薬前状態情報と、第2細胞の投薬前状態情報とが、所定適合率以上で一致することを示す。所定適合率とは、例えば、80%以上であるが、他のパーセンテージであってもよい。物質添加後状態推定部466は、抽出した第2細胞の投薬前状態情報に対応付けられた第2細胞の投薬後状態情報のうち、最頻出の第2細胞の投薬後状態情報が示す投薬後状態を、第1細胞の投薬後状態として推定する。なお、物質添加後状態推定部466は、抽出した第2細胞の投薬前状態情報に対応付けられた第2細胞の投薬後状態情報に基づく他の統計量によって第1細胞の投薬後状態を推定する構成であってもよい。
次に、判定部465は、物質添加後状態推定部466が推定した第1細胞の投薬後状態推定情報に基づいて、投薬可否判定を行う(ステップS130)。ここで、判定部465による投薬可否判定処理について説明する。判定部465は、第1細胞の投薬後状態推定情報が所定条件を満たすか否かを判定する。物質添加後状態推定部466は、第1細胞の投薬後状態推定情報が所定条件を満たす場合、投薬するべきではないと判定する。一方、物質添加後状態推定部466は、第1細胞の投薬後状態推定情報が所定条件を満たさない場合、投薬すべきであると判定する。
次に、判定結果出力部469は、判定部465が判定した結果を表示部45に表示させる(ステップS140)。
このように、ステップS100からステップS140までの処理を行うことにより、補正装置4は、第1細胞の投薬前状態情報に基づいて、第1細胞に対して投薬を行うべきか否かを判定する。その結果、補正装置4は、不必要な投薬に係る金銭的・時間的コストの増大を抑制することができる。
このように、ステップS100からステップS140までの処理を行うことにより、補正装置4は、第1細胞の投薬前状態情報に基づいて、第1細胞に対して投薬を行うべきか否かを判定する。その結果、補正装置4は、不必要な投薬に係る金銭的・時間的コストの増大を抑制することができる。
次に、図7を参照して、補正装置4の制御部46が行う第1細胞の投薬後状態情報の補正処理の流れについて説明する。図7は、補正装置4の制御部46が行う第1細胞の投薬後状態情報の補正処理の流れの一例を示すフローチャートである。
まず、制御部46は、入力受付部43が受け付けたユーザーからの操作に基づいて、ウェルプレートWPが備える複数のウェル毎にステップS200からステップS230までの処理を繰り返し行う(ステップS190)。物質添加前状態情報取得部461は、ステップS190において選択されたウェルに播種された第1細胞の投薬前状態情報取得の要求を、通信部44を介して画像解析部361に送信する。物質添加前状態情報取得部461は、当該要求を、前述したウェルナンバーに基づいて行う。そして、物質添加前状態情報取得部461は、画像解析部361からステップS190において選択されたウェルに播種された第1細胞の投薬前状態情報を取得する(ステップS200)。
次に、物質添加後状態情報取得部462は、ステップS190において選択されたウェルに播種された第1細胞の投薬後状態情報取得の要求を、通信部44を介してHTS分析装置2に送信する。物質添加後状態情報取得部462は、当該要求を、前述したウェルナンバーに基づいて行う。そして、物質添加前状態情報取得部461は、HTS分析装置2からステップS190において選択されたウェルに播種された第1細胞の投薬後状態情報を取得する(ステップS210)。
次に、対応情報取得部463は、対応情報取得の要求を、通信部44を介して対応情報DB5に送信する。そして、対応情報取得部463は、対応情報DB5から対応情報を取得する(ステップS220)。
次に、物質添加後状態推定部466は、物質添加前状態情報取得部461が取得した第1細胞の投薬前状態情報と、対応情報取得部463が取得した対応情報とに基づいて、ステップS190において選択されたウェルに播種された第1細胞の投薬後状態を推定する(ステップS230)。そして、物質添加後状態推定部466は、ステップS210において取得された第1細胞の投薬前状態情報と、ステップS230において推定した第1細胞の投薬後状態推定情報とを対応付ける。以下では、説明の便宜上、この対応付けられた情報を、対応推定情報と称して説明する。
ステップS200からステップS230までの繰り返し処理が終了した後、補正係数算出部467は、物質添加後状態推定部466が推定した第1細胞の投薬後状態推定情報に基づいて、物質添加後状態情報取得部462が取得した第1細胞の投薬後状態情報を補正するための補正係数を算出する(ステップS240)。
ここで、補正係数算出部467による補正係数の算出処理について説明する。なお、ステップS240における補正係数の算出処理の説明において、説明の便宜上、第1細胞の投薬前状態情報を投薬前状態情報と称し、第1細胞の投薬後状態情報を投薬後状態情報と称し、第1細胞の投薬後状態推定情報を投薬後状態推定情報と称して説明する。
補正係数算出部467は、ステップS200からステップS230までの繰り返し処理によって得られた対応推定情報から、投薬前状態情報(又は投薬後状態推定情報)が重複しているものを除外する。以下では、この一例において、除外されずに残った対応推定情報が、投薬後状態推定情報X1と、投薬後状態推定情報X2と、投薬後状態推定情報X3とをそれぞれ含む3つの対応推定情報であった場合であり、且つ投薬後状態推定情報X1が最も輝度の高い投薬後状態推定情報であった場合について説明する。
補正係数算出部467は、最も輝度の高い投薬後状態推定情報X1の輝度を基準とする。なお、当該基準は、他の投薬後状態推定情報であってもよい。補正係数算出部467は、基準とした輝度に対する投薬後状態推定情報X1~X3のそれぞれの輝度の比を算出する。例えば、投薬後状態推定情報X2の輝度が投薬後状態推定情報X1の輝度の50%であり、投薬後状態推定情報X3の輝度が投薬後状態推定情報X1の輝度の80%であった場合、輝度の比は、以下に示したように算出される。
投薬後状態推定情報X1の輝度:投薬後状態推定情報X2の輝度:投薬後状態推定情報X3の輝度=1:0.5:0.8
この輝度の比に基づいて、補正係数算出部467は、投薬後状態推定情報X1に対応付けられた投薬前状態情報が示す投薬前状態と状態が同じ第1細胞の投薬後状態情報に対する補正係数を1とする。また、補正係数算出部467は、投薬後状態推定情報X2に対応付けられた投薬前状態情報が示す投薬前状態と状態が同じ第1細胞の投薬後状態情報に対する補正係数を0.5とする。また、補正係数算出部467は、投薬後状態推定情報X3に対応付けられた投薬前状態情報が示す投薬前状態と投薬前状態が同じ第1細胞の投薬後状態情報に対する補正係数を0.8とする。
このように、補正係数算出部467は、対応推定情報に含まれる投薬後状態推定情報に基づいて、ウェル毎の第1細胞の投薬前状態による第1細胞の投薬後状態への影響を補正係数として表す。なお、本実施形態において、制御部46は、補正係数算出部467が補正係数を算出する構成として説明したが、これに代えて、予め用意された補正値データテーブルを用いて補正量を定める構成であってもよい。
次に、物質添加後状態情報補正部468は、ウェルプレートWPが備える複数のウェル毎に、ステップS260を繰り返し行う(ステップS250)。物質添加後状態情報補正部468は、物質添加前状態情報取得部461が取得した第1細胞の投薬前状態情報の中から、ステップS250において選択されたウェルに播種された第1細胞の投薬前状態情報を抽出する。
物質添加後状態情報補正部468は、補正係数算出部467により算出された補正係数から、抽出した投薬前状態情報であった第1細胞の投薬後状態情報に対する補正係数を抽出する。物質添加後状態情報補正部468は、抽出した補正係数と、ステップS250において選択されたウェルに播種された第1細胞の投薬後状態情報とに基づいて、当該投薬後状態情報を補正する(ステップS260)。
例えば、物質添加後状態情報補正部468は、ステップS250において選択されたウェルに播種された第1細胞の投薬後状態情報に対して、抽出した補正係数を乗算することにより、当該投薬後状態情報を補正する。なお、物質添加後状態情報補正部468は、抽出した補正係数と、ステップS250において選択されたウェルに播種された第1細胞の投薬後状態情報とに基づく他の手法(例えば、乗算以外の他の四則演算法や重みを用いた算出法等)によって当該投薬後状態情報を補正する構成であってもよい。
ここで、図8を参照して、物質添加後状態情報補正部468による補正処理が行われる場合と行われない場合とを比較する。図8は、互いに薬剤種が異なる5つの薬剤A~Eに対する第1細胞の応答を例示する図である。グラフDT1とグラフDT2には、物質添加後状態情報補正部468による補正処理を行わない分析システムZにより得られたグラフを示す。
また、グラフDT3とグラフDT4には、分析システム1により得られたグラフを示す。また、以下では、グラフDT1は、分析システムZによる1回目の第1細胞に対する分析(実験)による結果であり、グラフDT3は、分析システム1による1回目の第1細胞に対する分析(実験)による結果であるとして説明する。また、グラフDT2は、分析システムZによる2回目の第1細胞に対する分析(実験)による結果であり、グラフDT4は、分析システム1による2回目の第1細胞に対する分析(実験)による結果であるとして説明する。
各グラフ内には、薬剤A~Eのそれぞれに対する第1細胞の応答として、薬剤A~Eのそれぞれに対応するヒストグラムが描かれている。また、各グラフ内のヒストグラムの高さ(すなわち、各グラフの縦軸)は、ウェルプレートWPが備える複数のウェル毎に得られた第1細胞の投薬後状態情報についての平均値を表す。当該平均値は、すなわち、各ウェルの輝度の平均値であり、第1細胞に対して投薬が行われた後の各薬剤に対する第1細胞の応答を表す指標である。また、当該ヒストグラムに付随する誤差棒は、平均誤差の範囲を表す。
図8に示したように、分析システムZにより得られたグラフDT1におけるヒストグラム間の値の大小関係と、グラフDT2におけるヒストグラム間の値の大小関係とは、一致しない。例えば、グラフDT1において、最も高い値のヒストグラムは、薬剤Bに対応付けられたヒストグラムであり、次に高い値のヒストグラムは、薬剤Eに対応付けられたヒストグラムである。これに対し、グラフDT2において、最も高い値のヒストグラムは、薬剤Aに対応付けられたヒストグラムであり、次に高い値のヒストグラムは、薬剤Cに対応付けられたヒストグラムである。
このようにグラフDT1とグラフDT2を比較して分かる通り、分析システムZにより得られる分析(実験)結果は、分析(実験)を行う毎にばらついてしまう。また、分析システムZでは、第1細胞に対する投薬が行われる前の第1細胞の状態に関する情報が分析において考慮されていない。このため、分析システム1Zにより得られる分析(実験)結果は、誤差棒により表される平均誤差の範囲が広く、第1細胞の応答が最も高い薬剤がどの薬剤であるのかを知るためには、より多くの実験を繰り返す必要がある。より多くの実験を繰り返した場合、投薬に係る金銭的・時間的コストは増大してしまう。
一方、図8に示したように、分析システム1により得られたグラフDT3におけるヒストグラム間の値の大小関係と、グラフDT4におけるヒストグラム間の値の大小関係とは、一致する。例えば、グラフDT3において、最も高い値のヒストグラムは、薬剤Bに対応付けられたヒストグラムであり、次に高い値のヒストグラムは、薬剤Eに対応付けられたヒストグラムである。これに対し、グラフDT4においても、最も高い値のヒストグラムは、薬剤Bに対応付けられたヒストグラムであり、次に高い値のヒストグラムは、薬剤Eに対応付けられたヒストグラムである。また、グラフDT3及びグラフDT4に示したヒストグラムに付随する誤差棒により表される範囲は、グラフDT1及びグラフDT2に示したヒストグラムに付随する誤差棒により表される範囲よりも狭い。
図8において説明したこれらのグラフDT3及びグラフDT4に現れる特徴は、分析システム1により第1細胞の投薬後状態情報が、第1細胞の投薬前状態情報に基づいて補正されたことにより現れた結果である。すなわち、分析システム1は、補正装置4による第1細胞の投薬前状態情報に基づいた第1細胞の投薬後状態情報の補正により、分析精度を向上させることができる。
ステップS260の繰り返し処理を終了した後、物質添加後状態情報出力部470は、ウェルプレートWPが備える複数のウェル毎に、ステップS260において補正された第1細胞の投薬後状態情報を表示部45に表示させる(ステップS270)。次に、対応情報生成部464は、ウェルプレートWPが備える複数のウェル毎に、第1細胞の投薬前状態情報と、ステップS260において補正された第1細胞の投薬後状態情報とを対応付けた対応情報を生成する(ステップS280)。次に、対応情報生成部464は、ステップS280において生成した対応情報を対応情報DB5に記憶させる(ステップS290)。
以上説明したように、本実施形態の補正装置4は、第1細胞に対する投薬(物質の添加)が行われる前の第1細胞の状態を示す第1状態情報(第1細胞の投薬前状態情報)を取得し、第2細胞に物質の添加が行われる前の第2細胞の状態を示す第2状態情報(第2細胞の投薬前状態情報)と、第2細胞に物質の添加が行われた後の第2細胞の状態を示す情報(第2細胞の投薬後状態情報)と、第1状態情報とに基づいて、第1細胞に物質の添加が行われた後の第1細胞の状態を示す情報(第1細胞の投薬後状態情報)を補正する。これにより、補正装置4は、分析精度を向上させることができる。
なお、本願発明の補正装置、及びプログラムは、創薬スクリーニング装置、創薬スクリーニングシステムに適用することができ、薬品の製造装置、製造工程に本願発明の補正装置、プログラムを採用し、薬品を製造することが可能である。創薬スクリーニングシステムには、補正装置4に加えて、例えば、第1細胞に薬剤を添加する薬剤添加装置(物質添加装置の一例)と、第1細胞を観察する細胞観察装置とが含まれる。なお、創薬スクリーニングシステムには、他の装置が含まれてもよい。薬剤添加装置(物質添加装置)は、例えば、ピペット等により第1細胞に対して薬剤を添加する装置であるが、第1細胞に薬剤を添加する他の装置であってもよい。細胞観察装置は、例えば、顕微鏡等により第1細胞を観察する装置であるが、第1細胞を観察する他の装置であってもよい。なお、細胞観察装置による第1細胞の観察とは、例えば、第1細胞の培養と、第1細胞の撮像と、第1細胞が撮像された画像から第1細胞の状態の検出・分析とのうちの一部又は全部を含むが、これに限られず、第1細胞に対する他の作業を含んでもよい。また、細胞観察装置による第1細胞の観察には、第1細胞に対する他の作業が含まれてもよい。
なお、本発明の実施形態における補正装置4の各処理を実行するためのプログラムをコンピューター読み取り可能な記録媒体に記録して、当該記録媒体に記録されたプログラムをコンピューターシステムに読み込ませ、実行することにより、上述した種々の処理を行ってもよい。
なお、ここでいう「コンピューターシステム」とは、OSや周辺機器等のハードウェアを含むものであってもよい。また、「コンピューターシステム」は、WWWシステムを利用している場合であれば、ホームページ提供環境(あるいは表示環境)も含むものとする。また、「コンピューター読み取り可能な記録媒体」とは、フレキシブルディスク、光磁気ディスク、ROM、フラッシュメモリ等の書き込み可能な不揮発性メモリ、CD-ROM等の可搬媒体、コンピューターシステムに内蔵されるハードディスク等の記憶装置のことをいう。
さらに「コンピューター読み取り可能な記録媒体」とは、インターネット等のネットワークや電話回線等の通信回線を介してプログラムが送信された場合のサーバやクライアントとなるコンピューターシステム内部の揮発性メモリ(例えばDRAM)のように、一定時間プログラムを保持しているものも含むものとする。また、上記プログラムは、このプログラムを記憶装置等に格納したコンピューターシステムから、伝送媒体を介して、あるいは、伝送媒体中の伝送波により他のコンピューターシステムに伝送されてもよい。ここで、プログラムを伝送する「伝送媒体」は、インターネット等のネットワーク(通信網)や電話回線等の通信回線(通信線)のように情報を伝送する機能を有する媒体のことをいう。また、上記プログラムは、前述した機能の一部を実現するためのものであってもよい。さらに、前述した機能をコンピューターシステムにすでに記録されているプログラムとの組み合わせで実現できるもの、いわゆる差分ファイル(差分プログラム)であってもよい。
以上、本発明の実施形態について図面を参照して詳述したが、具体的な構成はこの実施形態に限られるものではなく、この発明の要旨を逸脱しない範囲の設計等も含まれる。
1…分析システム、2…HTS分析装置、3…画像分析装置、4…補正装置、5…対応情報DB、32、42…記憶部、33、43…入力受付部、34、44…通信部、36、45…表示部、37…撮像部、46…制御部、361…画像解析部、461…物質添加前状態情報取得部、462…物質添加後状態情報取得部、463…対応情報取得部、464…対応情報生成部、465…判定部、466…物質添加後状態推定部、467…補正係数算出部、468…物質添加後状態情報補正部、469…判定結果出力部、470…物質添加後状態情報出力部
Claims (12)
- 第1細胞に対する物質の添加が行われる前の前記第1細胞の状態を示す第1状態情報を取得する第1取得部と、
第2細胞に物質の添加が行われる前の前記第2細胞の状態を示す第2状態情報と、前記第2細胞に物質の添加が行われた後の前記第2細胞の状態を示す情報と、前記第1状態情報とに基づいて、前記第1細胞に物質の添加が行われた後の前記第1細胞の状態を示す情報を補正する補正部と、
を備えることを特徴とする補正装置。 - 前記第2細胞は、前記第1細胞の細胞種と細胞種が同一である、
ことを特徴とする請求項1に記載の補正装置。 - 前記第2細胞に物質の添加が行われる前の前記第2細胞の状態を示す第2状態情報は、対応情報として、前記第2細胞に物質の添加が行われた後の前記第2細胞の状態を示す情報と対応付けられている、
ことを特徴とする請求項1又は2に記載の補正装置。 - 前記第2細胞に物質の添加が行われる前の前記第2細胞の状態を示す第2状態情報と、前記第2細胞に物質の添加が行われた後の前記第2細胞の状態を示す情報とを取得する第2取得部を備える、
ことを特徴とする請求項1から3のうちいずれか一項に記載の補正装置。 - 前記第1取得部により取得された前記第1状態情報と、前記第2細胞に物質の添加が行われる前の前記第2細胞の状態を示す第2状態情報と、前記第2細胞に物質の添加が行われた後の前記第2細胞の状態を示す情報とに基づいて補正係数を算出する算出部を備え、
前記補正部は、前記算出部が算出した前記補正係数に基づいて、前記第1細胞に物質の添加が行われた後の前記第1細胞の状態を示す情報を補正する、
ことを特徴とする請求項1から4のうちいずれか一項に記載の補正装置。 - 前記第1状態情報と、前記第2状態情報とに基づいて、前記第1細胞に物質の添加が行われた後の前記第1細胞の状態を推定する推定部を備え、
前記算出部は、前記推定部により推定された前記第1細胞に物質の添加が行われた後の前記第1細胞の状態に基づいて前記補正係数を算出する、
請求項5に記載の補正装置。 - 前記第1取得部により取得された前記第1状態情報と、前記第2細胞に物質の添加が行われる前の前記第2細胞の状態を示す第2状態情報と、前記第2細胞に物質の添加が行われた後の前記第2細胞の状態を示す情報とに基づいて、前記第1細胞に物質の添加を行うか否かを判定する判定部と、
前記判定部の判定結果を出力する判定結果出力部と、
を備えることを特徴とする請求項1から6のうちいずれか一項に記載の補正装置。 - 前記補正部により補正された前記第1細胞に物質の添加が行われた後の前記第1細胞の状態を示す情報を出力する状態情報出力部を備える、
ことを特徴とする請求項1から7のうちいずれか一項に記載の補正装置。 - 請求項1から8のうちいずれか一項に記載の補正装置と、
前記第1細胞に物質を添加する物質添加装置と、
前記第1細胞を観察する細胞観察装置と、
を備えることを特徴とする創薬スクリーニングシステム。 - コンピューターに、
第1細胞に対する物質の添加が行われる前の前記第1細胞の状態を示す第1状態情報を取得する第1取得ステップと、
第2細胞に物質の添加が行われる前の前記第2細胞の状態を示す第2状態情報と、前記第2細胞に物質の添加が行われた後の前記第2細胞の状態を示す情報と、前記第1状態情報とに基づいて、前記第1細胞に物質の添加が行われた後の前記第1細胞の状態を示す情報を補正する補正ステップと、
を実行させるプログラム。 - 第1細胞に対する物質の添加が行われる前の前記第1細胞の状態を示す第1状態情報を取得する第1取得ステップと、
第2細胞に物質の添加が行われる前の前記第2細胞の状態を示す第2状態情報と、前記第2細胞に物質の添加が行われた後の前記第2細胞の状態を示す情報と、前記第1状態情報とに基づいて、前記第1細胞に物質の添加が行われた後の前記第1細胞の状態を示す情報を補正する補正ステップと、
を有することを特徴とする薬品の製造方法。 - 請求項11に記載の薬品の製造方法により製造された薬品。
Priority Applications (1)
| Application Number | Priority Date | Filing Date | Title |
|---|---|---|---|
| PCT/JP2015/053227 WO2016125282A1 (ja) | 2015-02-05 | 2015-02-05 | 補正装置、創薬スクリーニングシステム、プログラム、薬品の製造方法、及び薬品 |
Applications Claiming Priority (1)
| Application Number | Priority Date | Filing Date | Title |
|---|---|---|---|
| PCT/JP2015/053227 WO2016125282A1 (ja) | 2015-02-05 | 2015-02-05 | 補正装置、創薬スクリーニングシステム、プログラム、薬品の製造方法、及び薬品 |
Publications (1)
| Publication Number | Publication Date |
|---|---|
| WO2016125282A1 true WO2016125282A1 (ja) | 2016-08-11 |
Family
ID=56563646
Family Applications (1)
| Application Number | Title | Priority Date | Filing Date |
|---|---|---|---|
| PCT/JP2015/053227 Ceased WO2016125282A1 (ja) | 2015-02-05 | 2015-02-05 | 補正装置、創薬スクリーニングシステム、プログラム、薬品の製造方法、及び薬品 |
Country Status (1)
| Country | Link |
|---|---|
| WO (1) | WO2016125282A1 (ja) |
Citations (1)
| Publication number | Priority date | Publication date | Assignee | Title |
|---|---|---|---|---|
| JP2011239778A (ja) * | 2010-04-23 | 2011-12-01 | Nagoya Univ | 化学物質のスクリーニング方法 |
-
2015
- 2015-02-05 WO PCT/JP2015/053227 patent/WO2016125282A1/ja not_active Ceased
Patent Citations (1)
| Publication number | Priority date | Publication date | Assignee | Title |
|---|---|---|---|---|
| JP2011239778A (ja) * | 2010-04-23 | 2011-12-01 | Nagoya Univ | 化学物質のスクリーニング方法 |
Non-Patent Citations (9)
| Title |
|---|
| ATSUKI TAKAHASHI ET AL.: "Construction of morphology profiling and quality control method for hADSC using cell image analysis", ABSTRACTS OF THE ANNUAL MEETING OF THE SOCIETY FOR BIOTECHNOLOGY, vol. 65, 2013, Japan, pages 77 * |
| HIROTO SASAKI ET AL.: "Characterization of prediction models for hBMSCs differentiation", ABSTRACTS OF THE ANNUAL MEETING OF THE SOCIETY FOR BIOTECHNOLOGY, vol. 65, 2013, Japan, pages 77 * |
| HIROTO SASAKI ET AL.: "Image-based cell evaluation method using image-processing for cell -based assay in drug screening", ABSTRACTS OF 134TH ANNUAL MEETING OF PHARMACEUTICAL SOCIETY OF JAPAN , 30AA-PM04S, 2014, Retrieved from the Internet <URL:http://nenkai.pharm.or.jp/134/pc/ipdfview.asp?i=2156> [retrieved on 20150417] * |
| MATSUOKA, F. ET AL.: "Morphology-based prediction of osteogenic differentiation potential of human mesenchymal stem cells", PLOS ONE, vol. 8, no. 2, 2013, pages 1 - 12 * |
| NORIHIRO OKADA ET AL., ABSTRACTS OF THE ANNUAL MEETING OF THE SOCIETY FOR BIOTECHNOLOGY, vol. 65, 2013, Japan, pages 148 * |
| OKADA, N. ET AL.: "Non-invasive quantitative screening using cellular morphology for drug screening", THE JAPANESE TISSUE CULTURE ASSOCIATION DAI 87 KAI TAIKAI SATELLITE SYMPOSIUM YOSHISHU, 2014, pages 63 * |
| RYUJI KATO ET AL.: "Non-label image cytometry using cell morphology for the industrialization of regenerative medicine", ABSTRACTS OF THE ANNUAL MEETING OF THE SOCIETY FOR BIOTECHNOLOGY, JAPAN (HEISEI 22 NENDO), 2010, pages 171 * |
| YOSHIHIDE NAGURA ET AL.: "A prediction of cell differentiation using cell morphology for the industrialization of regenerative medicine", ABSTRACTS OF THE ANNUAL MEETING OF THE SOCIETY FOR BIOTECHNOLOGY, JAPAN (HEISEI 21 NENDO), 2009, pages 151 * |
| YOSHIHIDE NAGURA ET AL.: "Saisei Iryo Jitsuyoka no Tameno Keitai ni yoru Saibo Bunkado no Yosoku", THE SOCIETY OF CHEMICAL ENGINEERS , JAPAN DAI 74 NENKAI YOSHISHU, 2009, pages S108, Retrieved from the Internet <URL:https://www.jstage.jst.go.jp/article/scej/2009/0/2009_0_693/_pdf> [retrieved on 20150417] * |
Similar Documents
| Publication | Publication Date | Title |
|---|---|---|
| Iacucci et al. | Artificial intelligence enabled histological prediction of remission or activity and clinical outcomes in ulcerative colitis | |
| JP7466606B2 (ja) | コンテキストフィーチャを用いた画像解析システム | |
| Topçuoğlu et al. | A framework for effective application of machine learning to microbiome-based classification problems | |
| JP7744340B2 (ja) | ハイスループット薬物スクリーニングのためのシステムおよび方法 | |
| Bray et al. | Advanced assay development guidelines for image-based high content screening and analysis | |
| JP6670757B2 (ja) | 判定装置、解析方法、および解析プログラム | |
| Coleman et al. | Cell phone based colorimetric analysis for point-of-care settings | |
| Gavrielides et al. | Observer performance in the use of digital and optical microscopy for the interpretation of tissue‐based biomarkers | |
| US10937162B2 (en) | Image analysis algorithms using control slides | |
| Harrison et al. | Evaluating the utility of brightfield image data for mechanism of action prediction | |
| EP3124953A1 (en) | Spheroid evaluation method and spheroid evaluation device | |
| WO2022170145A1 (en) | Machine learning for early detection of cellular morphological changes | |
| Fisch et al. | HRMAn 2.0: Next‐generation artificial intelligence–driven analysis for broad host–pathogen interactions | |
| Russell et al. | Segmentation of fluorescence microscopy images for quantitative analysis of cell nuclear architecture | |
| JPWO2017109860A1 (ja) | 画像処理装置 | |
| CN120226057A (zh) | 基于成像的微有机球药物测定 | |
| US11645859B2 (en) | Analysis device, analysis method, analysis program and display device | |
| Zaritsky et al. | Decoupling global biases and local interactions between cell biological variables | |
| CN117457097A (zh) | 用于检测最优候选化合物的计算机装置及其方法 | |
| US11068695B2 (en) | Image processing device, observation device, and program | |
| Baumgartner et al. | A novel network-based approach for discovering dynamic metabolic biomarkers in cardiovascular disease | |
| US20230290503A1 (en) | Method of diagnosing a biological entity, and diagnostic device | |
| WO2016125282A1 (ja) | 補正装置、創薬スクリーニングシステム、プログラム、薬品の製造方法、及び薬品 | |
| Lück et al. | Deep phenotyping platform for microscopic plant-pathogen interactions | |
| Peng et al. | From manual counting to YOLO: Using computer vision to automate large-scale fecundity assays in C. elegans |
Legal Events
| Date | Code | Title | Description |
|---|---|---|---|
| 121 | Ep: the epo has been informed by wipo that ep was designated in this application |
Ref document number: 15881099 Country of ref document: EP Kind code of ref document: A1 |
|
| NENP | Non-entry into the national phase |
Ref country code: DE |
|
| 122 | Ep: pct application non-entry in european phase |
Ref document number: 15881099 Country of ref document: EP Kind code of ref document: A1 |
|
| NENP | Non-entry into the national phase |
Ref country code: JP |