WO2016083376A1 - Interaction parameters for the input set of molecular structures - Google Patents

Interaction parameters for the input set of molecular structures Download PDF

Info

Publication number
WO2016083376A1
WO2016083376A1 PCT/EP2015/077506 EP2015077506W WO2016083376A1 WO 2016083376 A1 WO2016083376 A1 WO 2016083376A1 EP 2015077506 W EP2015077506 W EP 2015077506W WO 2016083376 A1 WO2016083376 A1 WO 2016083376A1
Authority
WO
WIPO (PCT)
Prior art keywords
receptor
ligand
interface
scoring
atom
Prior art date
Legal status (The legal status is an assumption and is not a legal conclusion. Google has not performed a legal analysis and makes no representation as to the accuracy of the status listed.)
Ceased
Application number
PCT/EP2015/077506
Other languages
French (fr)
Inventor
Georgy CHEREMOVSKY
Petr Popov
Georgy Derevyanko
Sergey Grudinin
Current Assignee (The listed assignees may be inaccurate. Google has not performed a legal analysis and makes no representation or warranty as to the accuracy of the list.)
Centre National de la Recherche Scientifique CNRS
Institut National de Recherche en Informatique et en Automatique INRIA
Original Assignee
Centre National de la Recherche Scientifique CNRS
Institut National de Recherche en Informatique et en Automatique INRIA
Priority date (The priority date is an assumption and is not a legal conclusion. Google has not performed a legal analysis and makes no representation as to the accuracy of the date listed.)
Filing date
Publication date
Application filed by Centre National de la Recherche Scientifique CNRS, Institut National de Recherche en Informatique et en Automatique INRIA filed Critical Centre National de la Recherche Scientifique CNRS
Priority to JP2017527917A priority Critical patent/JP2018503171A/en
Priority to CA2968612A priority patent/CA2968612C/en
Priority to CN201580074108.8A priority patent/CN107209813B/en
Priority to US15/529,774 priority patent/US20170323049A1/en
Publication of WO2016083376A1 publication Critical patent/WO2016083376A1/en
Anticipated expiration legal-status Critical
Ceased legal-status Critical Current

Links

Classifications

    • GPHYSICS
    • G16INFORMATION AND COMMUNICATION TECHNOLOGY [ICT] SPECIALLY ADAPTED FOR SPECIFIC APPLICATION FIELDS
    • G16BBIOINFORMATICS, i.e. INFORMATION AND COMMUNICATION TECHNOLOGY [ICT] SPECIALLY ADAPTED FOR GENETIC OR PROTEIN-RELATED DATA PROCESSING IN COMPUTATIONAL MOLECULAR BIOLOGY
    • G16B15/00ICT specially adapted for analysing two-dimensional [2D] or three-dimensional [3D] molecular structures, e.g. structural or functional relations or structure alignment
    • G16B15/30Drug targeting using structural data; Docking or binding prediction
    • GPHYSICS
    • G06COMPUTING OR CALCULATING; COUNTING
    • G06FELECTRIC DIGITAL DATA PROCESSING
    • G06F17/00Digital computing or data processing equipment or methods, specially adapted for specific functions
    • G06F17/10Complex mathematical operations
    • G06F17/16Matrix or vector computation, e.g. matrix-matrix or matrix-vector multiplication, matrix factorization
    • GPHYSICS
    • G16INFORMATION AND COMMUNICATION TECHNOLOGY [ICT] SPECIALLY ADAPTED FOR SPECIFIC APPLICATION FIELDS
    • G16BBIOINFORMATICS, i.e. INFORMATION AND COMMUNICATION TECHNOLOGY [ICT] SPECIALLY ADAPTED FOR GENETIC OR PROTEIN-RELATED DATA PROCESSING IN COMPUTATIONAL MOLECULAR BIOLOGY
    • G16B15/00ICT specially adapted for analysing two-dimensional [2D] or three-dimensional [3D] molecular structures, e.g. structural or functional relations or structure alignment
    • GPHYSICS
    • G16INFORMATION AND COMMUNICATION TECHNOLOGY [ICT] SPECIALLY ADAPTED FOR SPECIFIC APPLICATION FIELDS
    • G16CCOMPUTATIONAL CHEMISTRY; CHEMOINFORMATICS; COMPUTATIONAL MATERIALS SCIENCE
    • G16C20/00Chemoinformatics, i.e. ICT specially adapted for the handling of physicochemical or structural data of chemical particles, elements, compounds or mixtures
    • G16C20/50Molecular design, e.g. of drugs

Definitions

  • the present invention concerns a method for modeling the geometric structure of the interface of Receptor-Ligand complexes, a method for modeling the interaction between a Receptor and a Ligand in Receptor-Ligand complexes, a method for determining a scoring vector w which is a mathematical vector quantifying and/or qualifying the interaction of a geometric structure of the interface of a Receptor-Ligand complex, a method for determining the binding affinity or binding free energy of a position of a Ligand relative to a Receptor in one or more Receptor-Ligand complexes, and a method for ranking the binding affinity or binding free energy of spatial positions of a Ligand relative to a Receptor in one or more Receptor-Ligand complexes.
  • All of these methods comprise one or more steps implemented or assisted by computer.
  • the invention also relates to computer assisted design or representation of molecular structures, and more particularly of molecule interaction.
  • the present invention also relates to any device implementing or helping to implement said methods, i.e. the corresponding software and hardware.
  • the applications of the invention are all those where precise molecular interactions are important or crucial for the performance such as computer-aided drug design, pharmaceutical sciences, medicine, physics, and biology.
  • the invention may present advantages for machine learning applications in computer graphics, computer vision, etc.
  • the average time required to develop a new active molecule, typically a drug, using the standard experimental analysis method Structure-Analysis-Relationship (SAR) is about 10-15 years with a cost of about $1 .2 bin.
  • Structure based drug design (SBDD) reduces drug design period to 7-12 years with a cost of about $1 bin, thus saving both time and money. There are thus huge needs to decrease either the duration to develop a new active molecule, the cost thereof, or even preferably both.
  • the invention provides a way to perform fast, accurate and efficient virtual screening of potential drug molecules, which is the initial step of the drug design pipeline.
  • FF Forcefield-based
  • FF Forcefield-based
  • Major challenges of the Forcefield-based SFs are: 1 ) accounting for the solvent molecules; 2) accounting for entropic effect; 3) and the possibility of decomposing the binding free energy into a linear combination of interaction terms.
  • GOLD::GoldScore and SYBYL::G-Score/D-Score are the forcefield-based SFs evaluated by Cheng et a ⁇ FF scoring functions are also used in DOCK and AutoDock packages. Overall, FF scoring functions have a rather poor performance 1 and there is no rigorous way to adjust weights between different interaction terms.
  • Empirical SFs are constructed as a weighted sum of terms, such as desolvation, electrostatic interactions, hydrogen bonds, hydrophobic interactions, etc.,
  • Empirical scoring functions are much more computationally efficient in comparison with the FF scoring function 2 : Glide, ICM, LUDI, PLP, ChemScore, X-Score, Surflex, SYBYL/F-Score, MedusaScore, AlScore, SFCscore are some examples of the empirical-based scoring functions. Overall, Empirical SFs perform better compared to FF scoring functions 1 but posses the same problem of adjusting the weights between their interaction terms.
  • Z denotes the probability distribution in the reference state.
  • the latter is the thermodynamic equilibrium state of the protein when all interactions between the atoms are set to zero.
  • the score of a protein conformation is then given as a sum of effective potentials between all pairs of atoms.
  • ITScore, PMF, DrugScore, DFIRE, BLEEP, MScore, GOLD/ASP are some knowledge-based scoring functions.
  • GOLD::ASP, DS::PMF, SYBYL::PMF, and DrugScore were evaluated in Cheng et al comparative assessment 1 .
  • Overall, Statistical SFs are the winners in all types of benchmarks and competitions 1 , however they typically have thousands of parameters, which are extremely sensitive to the training sets of molecular structures and parameters of the optimization algorithms.
  • the invention thus aims to solve the above-described problems.
  • the methods of the invention and the associated algorithms are very fast, robust, general, and stable to noise in initial structures, as verified on a number of different benchmarks. Therefore the present invention represents an important improvement for modeling of geometric structure of an interface of Receptor-Ligand complexes, for modeling an interaction between a Receptor and a Ligand in Receptor- Ligand complexes, for determining a scoring vector quantifying and/or qualifying the interaction of a geometric structure of an interface of a Receptor-Ligand complex, for determining the binding affinity or binding free energy of a position of a Ligand relative to a Receptor in one or more Receptor-Ligand complexes, and for ranking the binding affinity or binding free energy of spatial positions of a Ligand relative to a Receptor in one or more Receptor-Ligand complexes.
  • the invention relates to a method for modeling the geometric structure of the interface of Receptor-Ligand complexes, wherein a first chemical molecule defined as Receptor and a second chemical molecule defined as Ligand, wherein said method comprises the following steps wherein at least one of them is implemented or assisted by computer:
  • Receptor-Ligand complexes present an interface comprising different atom types, wherein atom type k is located on the Receptor and atom type I is located on the Ligand interact, k and I varying depending on the atom type;
  • step (e) optionally repeating step (c) for all or other atom types k and I;
  • Ligand complexes as a function of distances ry.
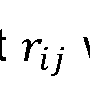
  • the interface is a set of all atom pairs ij at a distance smaller than the cutoff distance r max such that the first atom i in each pair ij belongs to the receptor and the second atom j in each pair ij belongs to the ligand.
  • the interface is a set of atoms determined using the standard linked-cell algorithm. More precisely, using a grid initialized with atoms of the receptor, atoms of the receptor-ligand interface are selected, in linear time, as those wherein distance ry is less than the cutoff distance.
  • Atom types are defined by the classification of all heavy atoms
  • Sybyl atom types can be used, for example 6 .
  • the atom types can be computed by Sybyl, OpenBabel or other widely-used molecular software such as DOCK.
  • manual conversion tables are provided in the literature, for example, in the RPIuto user guide from the CSD System package.
  • Receptors and ligands can be represented as a set of discrete interaction sites located at the centers of the atomic nuclei, thereby forming the interacting interface.
  • All atoms may be divided for example into M atom types according to the properties of corresponding atomic nuclei (element type, charge, hydrophobicity, etc.). Thereby, each atom has the associated position and atom type. Such atoms may also be defined as interaction sites.
  • Atom types were assigned to the atoms for example according to their surrounding and functional groups they consist in. To do so, it can for example be used the fconv library 7 for atom typization, which provides 158 internal atom types. Then, the atom types are clustered into 48 groups by measuring the statistical similarity of pair-distribution functions between different atom types in the training data set. Atom types set used to describe proteins and ligands can be the same, despite the fact that proteins always contain atoms of only some specific types. In one embodiment, the parameterization consists of 48 atom types. More precisely, such atom types are: 17 types for nitrogen, 9 types for oxygen, 8 types for carbon, 4 types for sulfur, 2 types for phosphorus and 8 types for halogens.
  • said geometric structure is defined as a structure vector x comprising as coordinates distances ry as a function of atom types.
  • said structure vector x depends on various atom types in the
  • said modeling of the geometric structure of the interface of Receptor-Ligand complexes takes into account inaccuracies in the determination of distances In one embodiment, inaccuracies in the distance are taken into account in
  • the modeling of the geometric structure of the interface of Receptor-Ligand complexes as a function of distances ry. is defined by the number densities wherein said number densities is defined as:
  • each distance distribution is represented by a Gaussian centered at with the constant variance of and wherein the distance is smaller than a determined
  • said linear scoring function F is defined by equation (1 ):
  • unknown "scoring potentials" functions can be determined from a training set of native complexes.
  • the cutoff distance is set between 1 and 20, preferably between 6 and 12 Angstrom (A).
  • the cutoff distance is 10 Angstrom (A).
  • the value of ⁇ is assumed to be equal for all types of site-site interactions and determined from the cross-validation procedure.
  • additional information is used for more precise parameterization of variance or even instead of the Gaussian approximation in Eq. (4).
  • additional information is for example: individual distance distributions, e.g. Debye-Waller factors, molecular dynamics trajectories, etc.
  • the invention also relates to a method of generating virtual Non-Native Receptor- Ligand complexes, wherein said method comprises the following steps wherein at least one of them is implemented or assisted by computer:
  • Non-Native Receptor-Ligand complexes are generated by moving spatially the Ligand relative to the Receptor or by local deformation along spatial directions from the Native Receptor-Ligand complexes.
  • Non-Native Receptor-Ligand complexes are generated by rolling the Ligand over the surface of the Receptor. For example, this can be performed using the Hex algorithm.
  • Non-Native Receptor-Ligand complexes are generated
  • corresponding decoy is generated by setting axes, for example 6 axes, inside a unit sphere corresponding to its icosahedral tessellation; then by rotating the ligand about these axes such that RMSD is kept constant, and then by setting six translations along the coordinate axes; and translating the ligand by RMSD amount.
  • Small molecules are defined as molecule presenting a molecular weight below 900 Daltons. Small molecules have a size in general of less than 10 -9 m.
  • Non-Native Receptor-Ligand complexes are generated
  • the modes are obtained by the diagonalization of the Hessian 5 matrix H, which is the matrix of second derivatives of, for example, the OPLS potential function with respect to atomic positions, as
  • V is a unitary matrix, composed of the eigenvectors is the diagonal matrix of eigenvalues A.
  • the frequency and shape of a mode is represented by its eigenvalue and eigenvector, respectively.
  • the frequency of a mode is given as the square root of the corresponding 10 eigenvalue,
  • rolling the Ligand over the surface of the Receptor is performed by the Hex protein docking software 8
  • Receptor-Ligand complex is labeled as “native” if the root mean square deviation (RMSD) of the corresponding Ligand is less than a determined value, for 15 example from its native position. Otherwise, the Receptor-Ligand complex is labeled as "non-native” or "decoy”.
  • RMSD root mean square deviation
  • the invention also relates to a method for modeling the interaction between a Receptor and a Ligand in Receptor-Ligand complexes,
  • said method comprises the following steps wherein at least one of them is 20 implemented or assisted by computer:
  • said method comprises:
  • Receptors and Ligands are represented as a set of discrete interaction at the interface of the Receptor-Ligand complex(es), and
  • the interface is a set of all atom pairs at a distance smaller than the cutoff distance r ma x such that the first atom in each pair belongs to the Receptor and the second atom in each pair belongs to the Ligand.
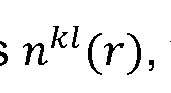
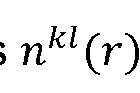
  • F is represented as a function of the distribution of the distances between the atoms of the interface, represented by (3): wherein n kl (r) is the number density of atom-atom at a distance r between two atom types k and I, with atom type k on the Receptor, and atom type I on the Ligand, where m is the total number of different atoms in a Receptor-Ligand complex interface.
  • the invention also relates to a method for determining a scoring vector w which is a mathematical vector quantifying and/or qualifying the interaction of a geometric structure of the interface of a Receptor-Ligand complex, wherein Receptor-Ligand complexes present an interface in interaction, wherein said interaction is in need for quantification and/or qualification, wherein said method comprises the following steps wherein at least one of them is implemented or assisted by computer:
  • Loss is a loss function depending on w, x and b,
  • w is the scoring vector and the vector x is the structure vector defined by
  • b j are the offset parameters, which determine the offset of the hyperplanes from the origin along the scoring vector w.
  • the scoring vector w is a linear combination of the support vectors.
  • the invention uses kernelized version of the Smooth Convex Optimization Problem.
  • said step (a) comprises providing Native Receptor-Ligand complex and Non-native Receptor-Ligand complexes wherein / ' index runs over different protein complexes.
  • said step (b) comprises implementing a method for modeling the geometric structure of the interface of Receptor-Ligand complexes as defined in the present invention.
  • orthogonal polynomial subspaces are Rectangular, Legendre, Laguerre or Fourier orthogonal bases.
  • step (f) comprises using the artificially generated noise applied to the original input data.
  • said noise is represented by the Gaussian distance distribution of the input data having a variance ⁇ where ⁇ is constant and does not depend on the atom type.
  • This noise can be thought as a Gaussian filter applied to the input data if the latter is represented as a 1 D signal.
  • step (f) comprises formulating a convex optimization problem so as to minimize the convex function.
  • step g) (solving the convex optimization problem thereby determining a scoring vector w) comprises implementing at least one solver selected from the group consisting of the coordinate-descent solver, Nesterov descent solver, a stochastic gradient solver, the quasi-Newton family solvers (e.g. BFGS), and any combination thereof.
  • solver selected from the group consisting of the coordinate-descent solver, Nesterov descent solver, a stochastic gradient solver, the quasi-Newton family solvers (e.g. BFGS), and any combination thereof.
  • said method further comprises finding the scoring vector w.
  • the invention also relates to a method for determining the binding affinity or binding free energy of a position of a Ligand relative to a Receptor in one or more Receptor- Ligand complexes, wherein said Receptor-Ligand complex present an interface comprising different atom types, wherein atom type k, located on the Receptor, and atom type I, located on the Ligand, interact, k and I varying depending on the atom type, wherein said method comprises the following steps wherein at least one of them is implemented or assisted by computer:
  • the invention also relates to a method for ranking the binding affinity or binding free energy of spatial positions of a Ligand relative to a Receptor in one or more Receptor- Ligand complexes, wherein said method comprises the following steps wherein at least one of them is implemented or assisted by computer:
  • the best spatial position of a Ligand relative to a Receptor in one or more Receptor-Ligand complexes is determined based on the ranking of said binding affinity or binding free energy.
  • the best binding affinity or free binding energy among several Receptor-Ligand complexes is determined based on the ranking of said binding affinity or binding free energy.
  • Input information for these methods is taken from the experiments (X-Ray crystallography, NMR, binding affinity measurements, etc.).
  • experimental data is always biased towards certain experimental conditions and always contains standard implementation errors of different types.
  • One of the main advantageous distinction of the invention comprises the accounting for experimental error by introducing uncertainties during the training process (as implemented in the statistical kernel).
  • the invention may use the Gaussian kernel, which allows to deal with uncertainties in the experimental data by representing these data as a "dome” centered at the exact experimental measures (for example Eq. (23)).
  • the structure vectors according to the invention built upon the kerneled experimental data are much more robust, meaning that they represent the real, unbiased, data more accurately without statistical bias.
  • the derived scoring function is also robust and steady to the experimental biases, providing better performance compared to the state-of- the-art scoring functions as it is demonstrated in the example below.
  • the invention also relates to a software for modeling the geometric structure of the interface of Receptor-Ligand complexes, wherein the software is embodied in a computer readable media and when executed said software implements the method for modeling the geometric structure of the interface of Receptor-Ligand complexes according to the invention.
  • the invention also relates to a software for generating virtual Non-Native Receptor- Ligand complexes, wherein the software is embodied in a computer readable media and when executed said software implements the method for generating virtual Non-Native Receptor-Ligand complexes according to the invention.
  • the invention also relates to a software for modeling the interaction between a Receptor and a Ligand in Receptor-Ligand complexes, wherein the software is embodied in a computer readable media and when executed said software implements the method for modeling the interaction between a Receptor and a Ligand in Receptor-Ligand complexes according to the invention.
  • the invention also relates to a software for determining a scoring vector w which is a mathematical vector quantifying and/or qualifying the interaction of a geometric structure of the interface of a Receptor-Ligand complex, wherein the software is embodied in a computer readable media and when executed said software implements the method for determining a scoring vector w which is a mathematical vector quantifying and/or qualifying the interaction of a geometric structure of the interface of a Receptor-Ligand complex according to the invention.
  • the invention also relates to a software for determining the binding affinity or binding free energy of a position of a Ligand relative to a Receptor in one or more Receptor- Ligand complexes, wherein the software is embodied in a computer readable media and when executed said software implements the method for determining the binding affinity or binding free energy of a position of a Ligand relative to a Receptor in one or more Receptor-Ligand complexes according to the invention.
  • the invention also relates to a software for ranking the binding affinity or binding free energy of spatial positions of a Ligand relative to a Receptor in one or more Receptor- Ligand complexes, wherein the software is embodied in a computer readable media and when executed said software implements the method for ranking the binding affinity or binding free energy of spatial positions of a Ligand relative to a Receptor in one or more Receptor-Ligand complexes according to the invention.
  • the invention also relates to a hardware comprising at least one software as described in the present description.
  • the invention also relates to a system for generating virtual Non-Native Receptor- Ligand complexes, said system comprising means for generating virtual Non-Native Receptor-Ligand complexes according to the invention.
  • the invention also relates to a system for modeling the geometric structure of the interface of Receptor-Ligand complexes, said system comprising:
  • (c) means for assigning to each selected atoms an atom type among k and I;
  • step (e) optionally means for repeating step (c) for all or other atom types k and I;
  • (f) means for assigning the distances r,j as a function of atom types
  • Receptor-Ligand complexes as a function of distances r,j, preferably said geometric structure is defined as a structure vector x comprising as polynomial coefficients of coordinates distances r,j as a function of atom types computed in an orthogonal polynomial basis.
  • the invention also relates to a system for determining a scoring vector w which is a mathematical vector quantifying and/or qualifying the interaction of a geometric structure of the interface of a Receptor-Ligand complex, said system comprising:
  • Non-Native Receptor-Ligand complexes are generated by moving spatially the Ligand relative to the Receptor or by local deformation along spatial directions from the Native Receptor-Ligand complexes.
  • the invention also relates to a system for modeling the interaction between a Receptor and a Ligand in Receptor-Ligand complexes, wherein said system comprises:
  • (c) means for computing a linear convex scoring function F as a function of all specific structure vectors x or of vector X which is the concatenation of all vectors x thereof , preferably said linear convex scoring function F being also a function of a scoring vector w ;
  • (d) means for projecting said scoring function F in orthogonal polynomial subspaces; thereby modeling the interaction between a Receptor and a Ligand in Receptor-Ligand complexes.
  • the invention also relates to a system for determining a scoring vector w which is a mathematical vector quantifying and/or qualifying the interaction of a geometric structure of the interface of a Receptor-Ligand complex, wherein said system comprises:
  • (c) means for computing a linear convex scoring function F as a function of all specific structure vectors x and scoring vector w;
  • (g) means for solving the convex optimization problem thereby determining a scoring vector w.
  • the invention also relates to a system for determining the binding affinity or binding free energy of a position of a Ligand relative to a Receptor in one or more Receptor- Ligand complexes, wherein said system comprises:
  • (ii) means for assigning to a geometric structure of the interface of Receptor-Ligand complex, a binding affinity or binding free energy by reference to a database, optionally wherein said binding affinity or binding free energy is determined using a scoring vector w as defined in the method for determining a scoring vector w which is a mathematical vector quantifying and/or qualifying the interaction of a geometric structure of the interface of a Receptor-Ligand complex.
  • the invention also relates to a system for ranking the binding affinity or binding free energy of spatial positions of a Ligand relative to a Receptor in one or more Receptor- Ligand complexes, wherein said system comprises:
  • (ii) means for ranking a set of positions of a Ligand relative to a Receptor by providing a strict relationship between the set such that, for any two positions, the first is either ranked higher, lower or equal to the second position if the said binding free energy of the first position is smaller, equal or higher than the energy of the second position, respectively in one or more Receptor-Ligand complexes according to the present invention to determine the top binding poses of a Ligand relative to a Receptor in one or more Receptor-Ligand complexes.
  • the invention also relates to the corresponding software and parameter datasets.
  • the invention also relates to a method for predicting molecule-molecule interactions, for example protein-protein, protein-drug, in particular protein-small molecule interaction, 5 wherein said method comprises implementing at least one method as defined according to the invention.
  • the invention also relates to a method for designing molecules, for example drugs, proteins, peptides, polypeptides, or other small molecules, wherein said method comprises implementing at least one method according to the present invention.
  • the present invention has also applications where precise molecular interactions are crucial for the performance such as computer-aided drug design, pharmaceutical sciences, medicine, physics, and biology. Furthermore, the invention relates also to machine learning applications for example in in computer graphics, computer vision, etc.
  • the invention provides a solution for companies, especially pharmaceutical 15 companies and organisations working in biological and medical research in general.
  • the invention provides a way to perform fast, accurate and efficient virtual screening of potential drug molecules, which is the initial step of the drug design pipeline.
  • the method according to the invention is very fast and general with respect to classes of input molecules.
  • Figure 1 represents a flowchart of main steps of a method according to the present invention, said method comprising the following steps:
  • Figure 2 is a flowchart representing a method which includes generating decoys for protein-small drug interaction, wherein step (6) of figure 1 is further detailed and comprises the following steps for the Ligand (small drug):
  • FIG. 3 is a flowchart representing a method which includes generating decoys for protein-protein interaction, wherein step (6) of figure 1 is further detailed and comprises the following steps:
  • Figure 4 represents two types of orthogonal functions. Left: shifted Legendre polynomials orthogonal on the interval [0; 10]. Right: shifted rectangular functions.
  • Figure 5 represents two classes of structure vectors for a single complex. Native structure vectors are plotted as circles. Nonnative structure vectors are plotted as squares. A) The case where infinitely many hyperplanes can separate the two classes. B) The case where no optimal separating hyperplane exists. Slack variables ⁇ and ⁇ ⁇ for misclassified structure vectors are added, which are the distances to the corresponding margin hyperplanes. The optimal hyperplane, which maximizes the separation between the two classes, is plotted as a dashed line. Two margin hyperplanes are plotted as solid lines.
  • Figure 6 represents a cross-validation procedure to reveal the optimal RMSD and regularisation parameters for the optimization problem for protein-drug interactions.
  • Figure 7 represents predictive performance of the protein-protein scoring potential as a function of the smoothing parameter ⁇ and the regularization parameter C.
  • Figure 8 represents scoring functions trained in two different polynomial bases. Solid lines correspond to the potentials obtained using the rectangular basis functions. Dashed lines correspond to the potentials obtained using the Legendre basis functions. Left: Potential between aliphatic carbons bonded to carbons or hydrogens only. Right: Potential between a guanidine nitrogen with two hydrogens and an oxygen in carboxyl groups.
  • Figure 9 represents a comparison of the success rates of scoring functions when the best-scored binding pose differs from the true one by RMSD ⁇ 1 .0 A (light bars) ⁇ 2.0 A (darker bars) or ⁇ 3.0 A (the darkest bars), respectively. Scoring functions are ranked by success rates when the ligand binding pose is found within RMSD ⁇ 2.0 A.
  • Figure 10 represents a comparison of the success rates of scoring functions for the cases when the native binding pose is included (dark bars) or not-included (light bars) into the assessment.
  • the acceptance cutoff RMSD is 2.0 A. Scoring functions are ranked by the darker bars.
  • Figure 11 represents a comparison of the success rates of scoring functions when a ligand binding pose is found within RMSD ⁇ 2.0 A from the true one if the top one (light bars), the top two (darker bars), or the top three (the darkest bars) best-scored binding poses are considered. Scoring functions are ranked by success rates when the top three binding poses are considered.
  • Figure 13 represents a dependence of the success rate on the ZDOCK benchmark on the number of top predictions in consideration for the three methods.
  • Figure 14 represents a dependence of the success rate on the RosettaDock benchmark on the number of top predictions in consideration for the three methods.
  • the methods were implemented using the C++ programming language and compiled using g++ compiler version 4.6 with optimization levels -03 and the clang compiler.
  • the programs was ran on a 64-bit Linux Fedora operating system with Intel(R) Xeon(R) CPU X5650 @ 2.67GHz and on a 64-bit Mac OS system version 10.9 with Intel(R) Core i7 CPU @ 2.7GHz. Example of such method is described below relative to the generation of protein- protein interaction or protein-drug interaction (the drug being a small molecule).
  • the temperature factor is individual for each monomer, we kept it constant for all the monomers and chose its best value. To do so, we scanned through several values of the temperature factor, namely, 5; 10; 20; 40; 60 (kcal/mol) 1 ' 2 , using the cross-validation procedure as detailed below in the text.
  • the temperature factor jk B T affects the amplitude of the deformation, hence, too large temperatures cause a monomer to deform significantly breaking the covalent bonds.
  • Each training set contained 844 blocks representing different non-homologous protein complex, and each block consists of one native structure and 225 decoys generated with normal modes (Note: if protein complexes occurred too large for the normal mode analysis they were removed from the training set).
  • Normal modes can be also computed in a simpler way using, e.g. the elastic-network, the Gaussian network model, the rotation-translation of blocks method, etc. These methods describe a protein as a set of particles that are interconnected by a network of elastic springs.
  • RMSD corresponded to several temperature factors.
  • the particles can correspond to the atoms of the protein, a subset of the atoms, or to representative points such as the center of mass of a residue or a sidechain.
  • All generated decoys represent near-native protein structures. Indeed, normal mode oscillations were used to locally deform molecules, however, the orientation of molecules with respect to each other is fixed. Since all decoy molecules slightly differ from the native monomers, as verified by their RMSD values (see Table 1 ), the interaction interfaces of all decoy complexes undergo moderate changes and keep at least some part of the native contacts. Putting all together, the training set was based only on local information about the native interfaces and no other information was used.
  • Ligand molecules were considered as rigid bodies and rotated about some axes such that the RMSD distance is kept fixed. To do so, six axes were chosen inside a unit sphere corresponding to its icosahedral tessellation.
  • the weighted RMSD for a pure rotation about axis n by an angle a of a molecule of total mass M with inertia tensor / is: Lemma 2
  • the optimal scoring vector is unique and given by the solution of problem
  • the scoring vector is optimal in the sense that it maximizes the separation between native and nonnative structure vectors and minimizes the number of misclassified vectors.
  • Regularization parameters in (37) tune the importance of either factors.
  • the proof of lemmas (1 ,2) can be found, e.g., in 12 .
  • the formulation of the optimization problem (37) is very similar to the formulation of the soft-margin support vector machine (SVM) problem 11 . Therefore, to solve problem (37), techniques developed for SVM have been used.
  • Example 3 Solving the optimization problem Properties and solutions of quadratic optimization problems similar to the one stated above (37) have been extensively studied in the theory of convex optimization. They can be solved in dual and primal forms. For instance, using the Lagrangian formalism, the optimization problem (37) can be converted into its dual form, and the resulting dual optimization problem is convex:
  • the Lagrange multipliers are found, one can express the solution of the original primal problem (37) (the scoring vector) as a linear combination of the support vectors:
  • the problem formulation according to the invention reduces the amount of RAM required by the solver by N 2 times.
  • the training set has several proteins homologous to the ones from the two widely used docking benchmarks, Rosetta, and Zdock, which were used below to validate the results of the invention. Two protein complexes were defined to be homologous if for each chain in the first complex there is a chain in the second complex with sequence identity more than 60%. We determined the sequence identity using FASTA36 program.
  • PDBBind database 14 provides experimentally measured binding affinity data for the complexes deposited in the Protein Data Bank.
  • the "general set" of release PDBBind 201 1 contains binding data values) and three-dimensional structures of resolution equal to or better than 2.5 A for 6051 protein-ligand complexes. This information was used in order to derive the scoring function for protein-drug interactions.
  • the training database contains protein-protein complexes extracted from the PDB 15 and includes 655 homodimers and 196 heterodimers.
  • Three PDB structures from the original training database were updated: 2Q33 supersedes 1 N98, 2ZOY supersedes 1V7B, and 3KKJ supersedes 1YVV.
  • the training database contains only crystal dimeric structures determined by X-ray crystallography at resolution better than 2.5 A. Each chain of the dimeric structure has at least 10 amino acids, and the number of interacting residue pairs (as defined as having at least 1 heavy atom within 4.5 A) is at least 30.
  • Each protein- protein interface consists only of 20 standard amino acids. No homologous complexes were included in the training database. Two protein complexes were regarded as homologues if the sequence identity between receptor-receptor pairs and between ligand- ligand pairs was > 70%. Finally, Huang and Zou manually inspected the training database and left only those structures that had no artifacts of crystallization.
  • the algorithm of the invention requires as input native and nonnative structure vectors (see, e.g., equation (14)).
  • Native structure vectors can be computed from the native protein-protein contacts in the training database using equation (1 1 ).
  • decoys were generated for each complex. Since the optimization algorithm of the invention is very general and has no special requirements for nonnative protein-protein contacts, nonnative protein-protein were generated by "rolling" a smaller protein (ligand) over the surface of a bigger protein (receptor) using the Hex protein docking software 8 .
  • Hex exhaustive search algorithm initialized with the radial search step of 1 .5 A and expansion order of the shape function equal to 31 . Only the shape complementarity energy function from Hex (i.e., electrostatic contribution was omitted) was used. The top 200 clusters, ranked by Hex surface complementarity function, plus the native protein-protein complex conformation (giving a total of 201 structures) were then used to evaluate the distance distribution functions (23). Then, the structure vectors using Eq. (1 1 ) were computed and labeled according to example 4.
  • PDBBind database provides experimentally measured binding affinity data for the complexes deposited in the Protein Data Bank.
  • the "general set" of release PDBBind 201 1 contains binding data ⁇ K d , Ki & IC50 values) and three-dimensional structures of resolution equal to or better than 2.5 A for 6051 protein-ligand complexes. This information was used in order to derive the scoring function for protein-drug interactions.
  • Ligand molecules were considered as rigid bodies and rotated about some axes such that the RMSD distance is kept fixed. This generation of decoys was performed according to example 5.
  • orthogonal polynomials used for the expansion of the scoring potentials might be non-smooth functions, e.g. rectangular polynomials.
  • the scoring potentials t/ fci (r) could be not differentiate.
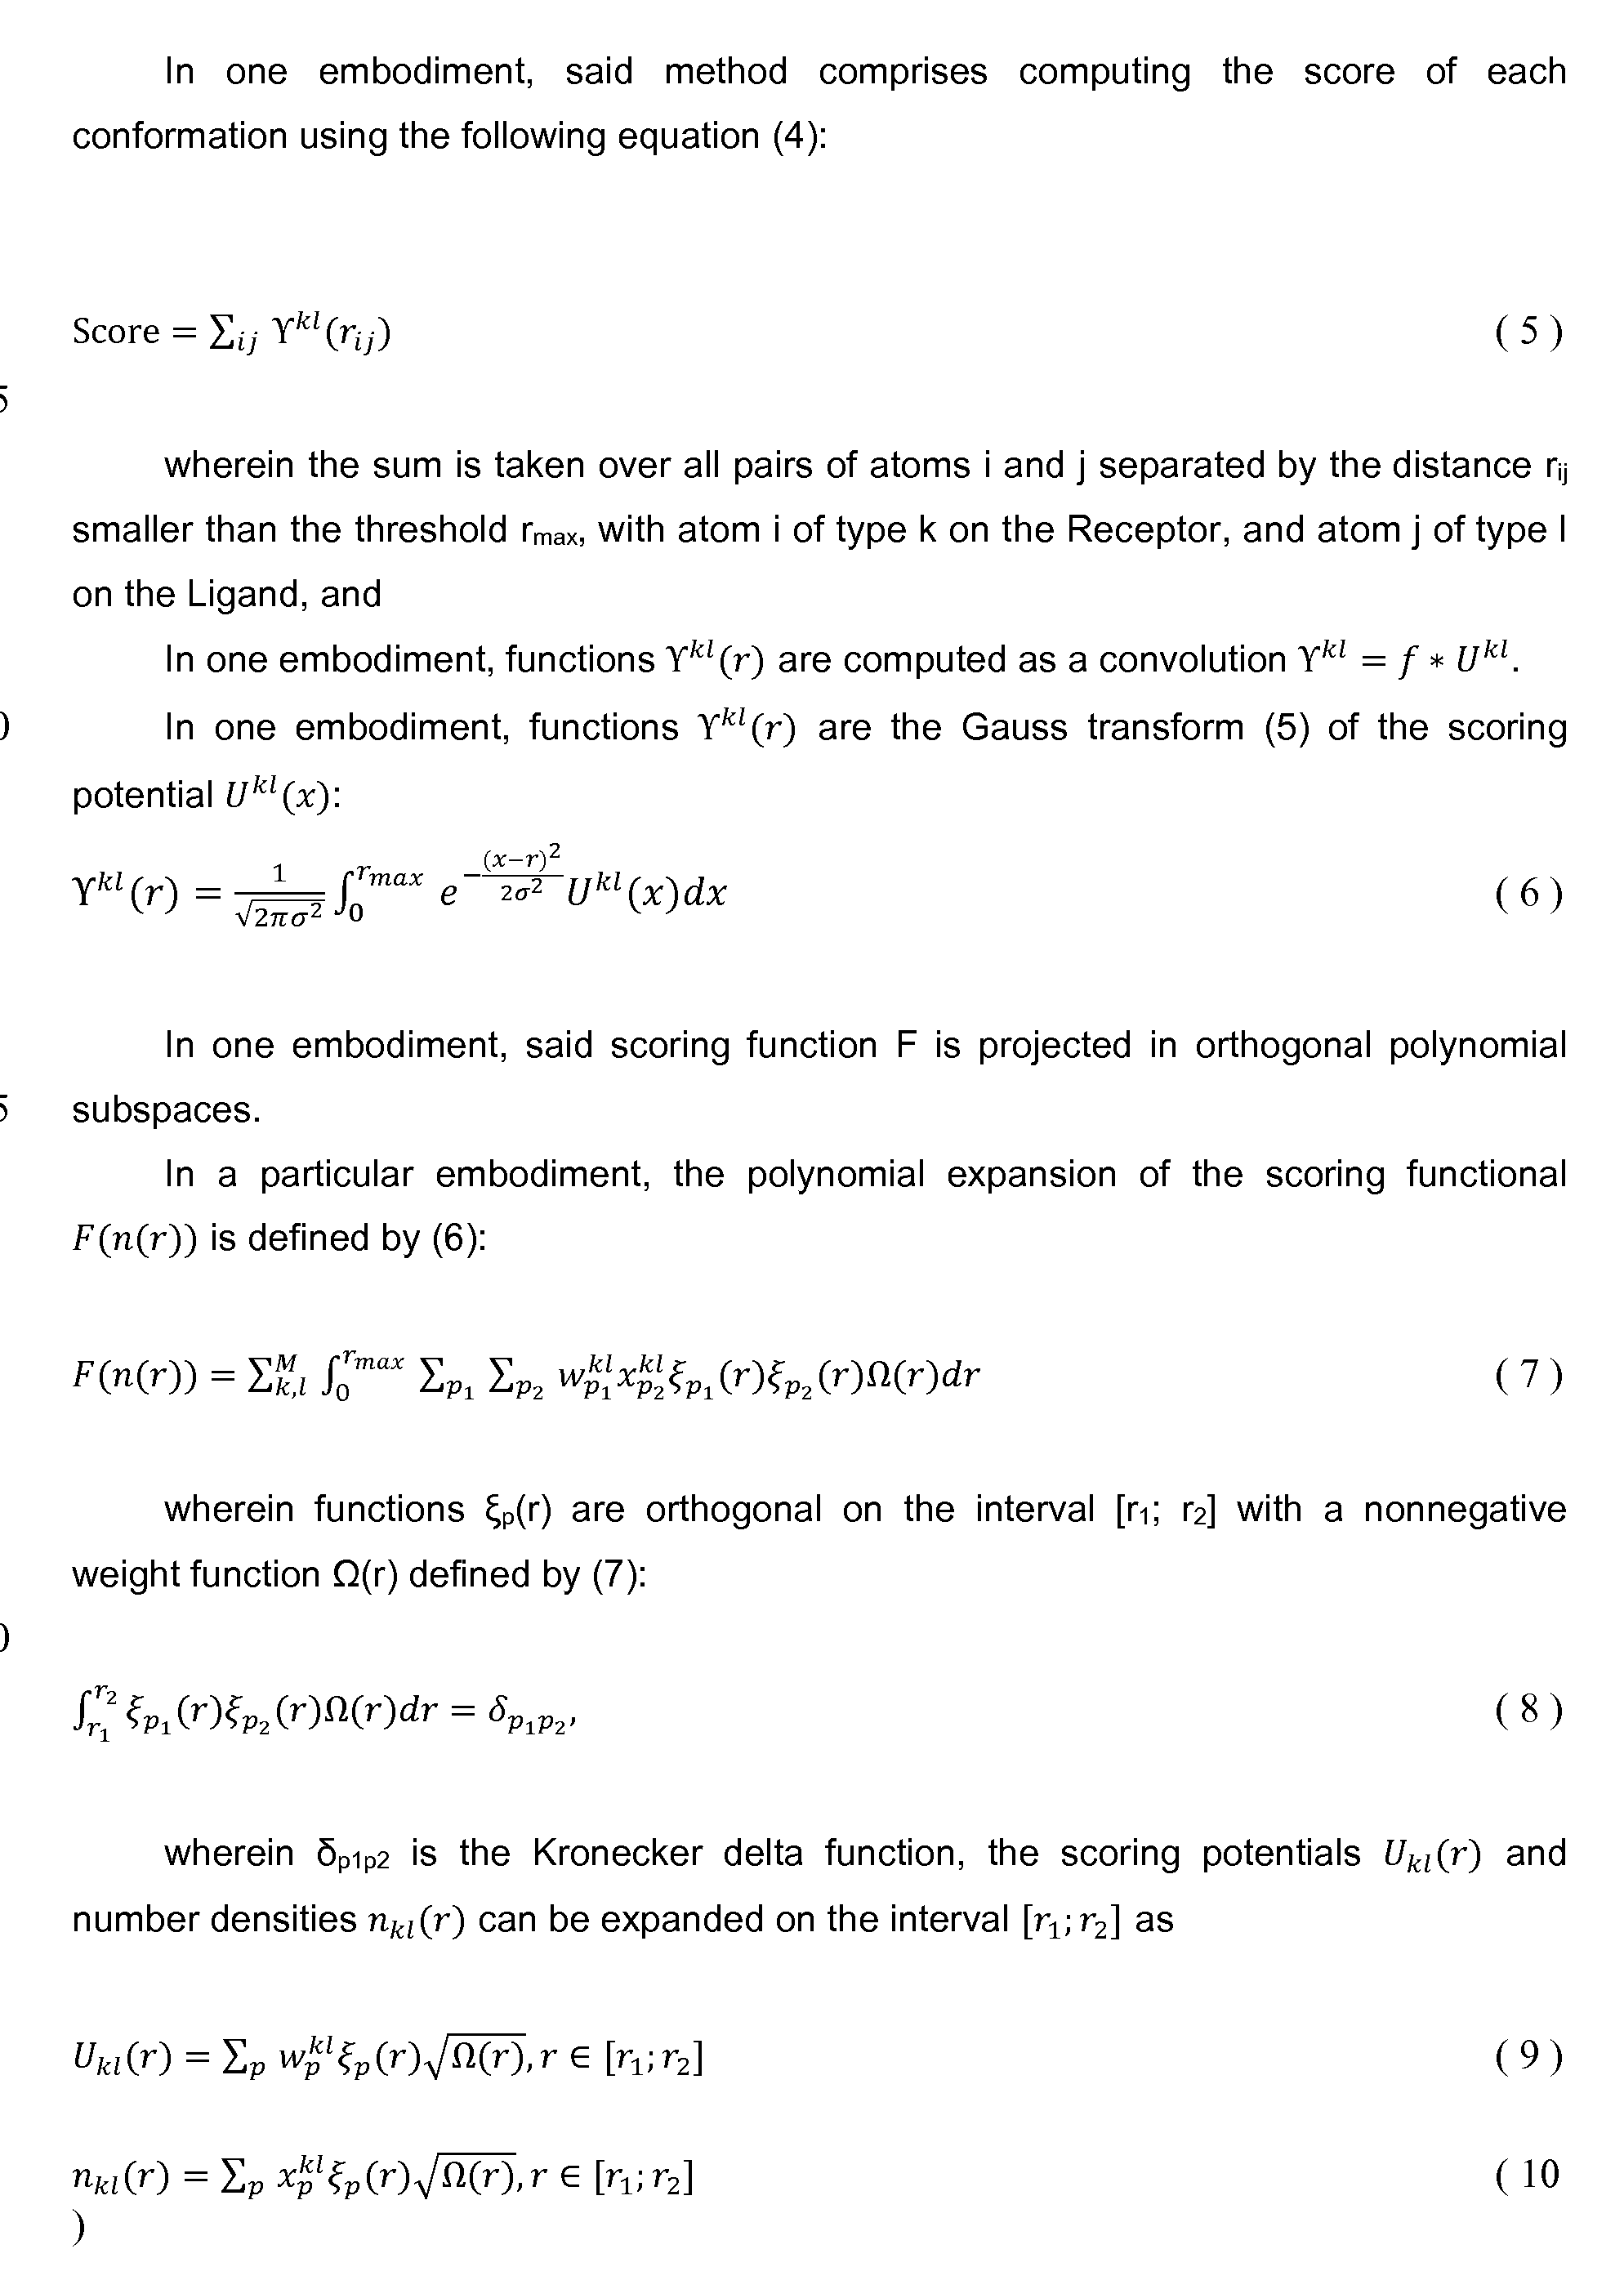
  • functions Y kl (r) (Eq. (4)) are smooth as a convolution of analytic locally integrable functions. This fact allows extending the functionality of functions Y kl (r) from the scoring to the structure optimization using their first or higher-order derivatives.
  • the negative gradient - vY fei (r i; ) equals to the force acting on the atoms in this pair.
  • Eq. (12) If structure optimization is not required, as it happens in scoring of decoys generated by other docking programs, then ranking is performed using Eq. (12). More precisely, for each structure of a protein-protein or a protein-grid complex, one computes the structure vectors x£ l using Eq. (1 1 ). Then, these structure vectors are multiplied with the pre- computed scoring vectors w£ l according to Eq. (12) and a linear approximation of the binding free energy is obtained. Now, structures of the complexes can be ranked according to this free energy approximation. If structure optimization is desired, in practice we use Eqs. (4-5) for the gradient-based structure optimization.
  • the gradient of the scoring function (4) is computed with respect to six rigid-body coordinates of the receptor and the ligand. Then, the structure is iteratively optimized until a certain convergence is achieved. Finally, different structures are ranked according to the scores of the optimized binding poses.
  • the first general method of assessment of a scoring function is to see how well it can predict the true binding pose. More precisely, if the best ranked ligand pose is close enough (within RMSD range of 1.0, 2.0 or 3.0 A) to the known true one, the scoring function is said to guess it correctly within a certain RMSD threshold. Success rate of the scoring function according to the invention in comparison to the others is shown in Figure 9.
  • Figure 10 represents the difference in results, when native conformation is included or excluded from the decoy set. As one can see, the difference is not more than 5% for all the scoring functions, which is not very significant. Therefore, the native pose was included into the decoy sets from the benchmark in order to be able to compare the performance to the results published previously.
  • Figure 1 1 shows success rates in cases when one, two or three best ranked poses are considered. For many scoring functions one can notice a significant increase in the prediction power when several poses are considered in comparison to Figure 9.
  • Another representation of docking power evaluation results that includes success rates of the DSX 16 scoring functions is given in Table 2. Results of DSX cited from 16 and the rest (excluding ConvexPL) - from 1 . The last column corresponds to the success rate of finding the top ranked ligand pose within RMSD ⁇ 2.0 A from the crystallographically determined one, when this true one is excluded from the decoy set.
  • ConvexPL is the scoring function according to the invention.
  • DrugScorePDB :Pair 40.0 73.8 74.3 93.4 68.9
  • DrugScorePDB :Surf 3.6 20.0 32.8 80.3 32.2
  • the second evaluation criterion for a scoring function is how well it can predict the binding affinity of a protein-drug complex.
  • Table 3 shows the correlations between true binding constants (K d ) and the binding scores obtained with the scoring function, which corresponds to Table 2 from 1 .
  • test set is highly diverse - there is a big difference between the highest and the lowest binding affinity of complexes included in the set, as it is evident from Figure 10. Probably this is one of the reasons of such moderate success rates of all the scoring functions, and if one considers only particular family of protein- ligand complexes, better results can be achieved. See 1 and their additional test sets.
  • test protein-ligand complexes in the training sets can be an issue for some functions.
  • success rates were provided when the test set is included to the training set or excluded from it in Table 3 for ConvexPL and X-Score (version with excluded test set is named 1 .3) The best three results are shown by empirical-based X-Score, the knowledge-based DSXCSD::AII and ConvexPL.
  • the last assessment criterion for a scoring function, studied by 1 is the ligand ranking power.
  • Cheng, et al. define the ranking power of a scoring function as the ability to correctly rank the known ligands bound to a common target by their binding affinities when their true binding modes are known.
  • Table 4 shows the success rates of several scoring functions.
  • the best four functions for ranking are X-Score, DSXCSD::AII, DS::PLP2, ConvexPL. Success rates of these top functions are comparable to the success rates in the scoring power assessment. This fact seems interesting, because one could expect that the ligand ranking is an easier problem than scoring. Again, the best results are achieved by the empirical-based function as X-Score and DS::PLP2. Excluding the 195 test complexes from the training set of the function according to the invention leads to the improvement of the success rate by about 1 .6% (ConvexPL test set excluded).
  • Table 4 Success rates in the ligand ranking assessment.
  • Parameters obtained with the invention outperform all academic and industrial scoring functions (35 different in total) as presented on Figures 9, 10 and 1 1 .
  • the present invention also ensures not only a superb predictive power of docking poses, but also a very good correlation between the scores and the binding affinity data
  • Scoring function used in this program includes shape complementarity, statistical pair potentials and electrostatics.
  • ZRANK is the program for reranking the ZDOCK3.0 predictions. In addition to the factors used in ZDOCK3.0, it computes detailed electrostatics, estimates desolvation and uses additional Van-der- Waals potential to re-score the decoys.
  • the benchmark 3.0 has several complexes homologous to certain protein complexes in the training set. Therefore, we trained our potential both excluding homologs from the training set and leaving it unchanged. Table 5 shows results of ZDOCK3.0, ZRANK and our scoring functions on the ZDOCK3.0 benchmark.
  • a hit is a predicted near-native decoy with IRMSD less than 2.5 A.
  • the IRMSD parameter is the RMSD of the interface region between the predicted and native structures after optimal superimposition of the backbone atoms of the interface residues.
  • a residue is considered as the interface residue if any atom of this residue is within 10 A from the other partner.
  • the number of hits when only the top one prediction considered (Topi ) obtained by ZRANK is higher than the one obtained by ConvexPP potentials (15 vs 12 hits).
  • the scoring function according to the invention outperforms ZRANK (32 vs 26 hits). Excluding homologs from the training set results in a slight improvement of the results (Table 5).
  • the IRMSD parameter represents the quality of a pose, which is the RMSD of the backbone atoms of the ligand after the receptors in the native and the decoy conformations have been optimally superimposed.
  • the IRMSD parameter is the RMSD of the interface region between the predicted and native structures after optimal superimposition of the backbone atoms of the interface residues. A residue is considered as the interface residue if any atom of this residue is within 10 A from the other partner.
  • the fnat parameter is the ratio of the number of native residue-residue contacts in the predicted complex to the number of residue-residue contacts in the crystal structure.
  • Figure 13 shows ROC curves (success rate versus the number of top predictions considered).
  • ConvexPP scoring functions outperform ZRANK and ZDOCK if the number of considered predictions is more than eight.
  • Topi prediction rate over ITScore-PP and RosettaDock scoring functions while also outperforming them according to the other criteria (Topi and quality 1 eic).
  • the percentage of the structures for which the first acceptable prediction was ranked within the top predictions was computed for each complex and plotted on Fig. 14.
  • the scoring function of the invention (ConvexPP) outputs the plausible structure (quality >3) for more complexes than ITScore-PP and RosettaDock.
  • the results on the Rosetta unbound benchmark slightly decrease when homologous complexes were removed from the training set.
  • the prediction quality criteria it is the number of predicted high quality structures that changed the most.
  • Topi prediction rate stayed almost the same. This observation means that the number of predicted high-quality structures is amenable to overfitting. Therefore unlike the Topi criterion, it can not serve as a reliable measure of a scoring function predictive power.
  • the LRMSD parameter represents the quality of a pose, which is the RMSD of the backbone atoms of the ligand after the receptors in the native and the decoy conformations have been optimally superimposed.
  • the IRMSD parameter is the RMSD of the interface region between the predicted and native structures after optimal superimposition of the backbone atoms of the interface residues. A residue is considered as the interface residue if any atom of this residue is within 1 0 A from the other partner.
  • the f na t parameter is the ratio of the number of native residue-residue contacts in the predicted complex to the number of residue-residue contacts in the crystal structure.
  • Embodiment 1. A method for modeling the geometric structure of the interface of Receptor-Ligand complexes, wherein a first chemical molecule defined as Receptor and a second chemical molecule defined as Ligand, wherein said method comprises the following steps wherein at least one of them is implemented or assisted by computer:
  • Receptor-Ligand complexes present an interface comprising different atom types, wherein atom type k is located on the Receptor and atom type I is located on the Ligand interact, k and I varying depending on the atom type;
  • step (e) optionally repeating step (c) for all or other atoms types k and I;
  • Embodiment 2. The method of embodiment 1 , wherein said modeling of the geometric structure of the interface of Receptor-Ligand complexes takes into account inaccuracies in the determination of distances ry.
  • Embodiment 3. The method of embodiment 1 , wherein the modeling of the geometric structure of the interface of Receptor-Ligand complexes as a function of distances ry. is defined by the number densities wherein said number densities is defined as:
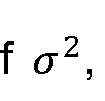
  • each distance distribution is represented by a Gaussian centered at , with the constant variance of ⁇ 2 , and wherein the distance is smaller than a determined
  • Embodiment 4. A method for generating virtual Non-Native Receptor-Ligand complexes, wherein said method comprises the following steps wherein at least one of them is implemented or assisted by computer:
  • Receptor-Ligand complexes present an interface wherein site k of the Receptor and site I of the Ligand interact; (b) generating D Non-Native Receptor-Ligand complexes
  • Non-Native Receptor-Ligand complexes are generated by moving spatially the Ligand relative to the Receptor or by local deformation along spatial directions from the Native Receptor-Ligand complexes.
  • Embodiment 5 The method of embodiment 4, wherein Non-Native Receptor-Ligand complexes are generated by rolling the Ligand over the surface of the Receptor.
  • Embodiment 6. The method of embodiment 4, wherein Non-Native Receptor-Ligand complexes are generated by the following steps:
  • Embodiment 7 The method of embodiment 6, wherein Non-Native Receptor-Ligand complexes pj lonnat t are generated by linear combinations of modes ⁇ v, ⁇ as follows:: where are the coordinate vectors corresponding to the native and
  • n is the random weight for each mode ranging from -1 to 1
  • is the frequency of the mode
  • Embodiment 8 A method for modeling the interaction between a Receptor and a Ligand in Receptor-Ligand complexes, wherein said method comprises the following steps wherein at least one of them is implemented or assisted by computer:
  • a method for determining a scoring vector w which is a mathematical vector quantifying and/or qualifying the interaction of a geometric structure of the interface of a Receptor-Ligand complex, wherein Receptor-Ligand complexes present an interface in interaction, wherein said interaction is in need for quantification and/or qualification, wherein said method comprises the following steps wherein at least one of them is implemented or assisted by computer:
  • Embodiment 10 The method of embodiment 9, wherein said step (a) comprises providing Native Receptor-Ligand complex and Non-native Receptor-Ligand
  • Embodiment 1 1 1 .- The method of embodiment 9, wherein said step (b) comprises implementing a method as defined by any one of embodiments 1 to 3.
  • Embodiment 12.- The method of embodiment 9, wherein in step (e) orthogonal polynomial subspaces are Rectangular, Legendre, Laguerre or Fourier orthogonal bases.
  • Embodiment 13 The method of embodiment 9, wherein step (f) comprises using the artificially generated noise applied to the original input data wherein said noise is represented by the Gaussian distance distribution of the input data having a variance ⁇ where ⁇ is constant and does not depend on the atom type, and can be thought as a Gaussian filter applied to the input data if the latter is represented as a 1 D signal.
  • step (f) comprises formulating a convex optimization problem so as to minimize the convex function.
  • Embodiment 15. The method of any one of embodiments 9 to 14, wherein said method further comprises finding the scoring vector w.
  • Embodiment 16 A method for determining the binding affinity or binding free energy of a position of a Ligand relative to a Receptor in one or more Receptor-Ligand complexes, wherein said Receptor-Ligand complex presents an interface comprising different atom types, wherein atom type k, located on the Receptor, and atom type I, located on the Ligand, interact, k and I varying depending on the atom type, wherein said method comprises the following steps wherein at least one of them is implemented or assisted by computer:
  • Embodiment 17. A method for ranking the binding affinity or binding free energy of spatial positions of a Ligand relative to a Receptor in one or more Receptor-Ligand complexes, wherein said method comprises the following steps wherein at least one of them is implemented or assisted by computer:
  • Embodiment 19 The method of embodiment 17, wherein the best binding affinity or free binding energy among several Receptor-Ligand complexes is determined based on the ranking of said binding affinity or binding free energy.

Landscapes

  • Engineering & Computer Science (AREA)
  • Physics & Mathematics (AREA)
  • Life Sciences & Earth Sciences (AREA)
  • Chemical & Material Sciences (AREA)
  • Bioinformatics & Cheminformatics (AREA)
  • Spectroscopy & Molecular Physics (AREA)
  • Health & Medical Sciences (AREA)
  • Theoretical Computer Science (AREA)
  • Bioinformatics & Computational Biology (AREA)
  • General Health & Medical Sciences (AREA)
  • Crystallography & Structural Chemistry (AREA)
  • Biotechnology (AREA)
  • Evolutionary Biology (AREA)
  • Medical Informatics (AREA)
  • Biophysics (AREA)
  • Medicinal Chemistry (AREA)
  • Pharmacology & Pharmacy (AREA)
  • Computing Systems (AREA)
  • Mathematical Physics (AREA)
  • General Physics & Mathematics (AREA)
  • Computational Mathematics (AREA)
  • Mathematical Optimization (AREA)
  • Mathematical Analysis (AREA)
  • Pure & Applied Mathematics (AREA)
  • Data Mining & Analysis (AREA)
  • Algebra (AREA)
  • Databases & Information Systems (AREA)
  • Software Systems (AREA)
  • General Engineering & Computer Science (AREA)
  • Peptides Or Proteins (AREA)
  • Investigating Or Analysing Biological Materials (AREA)

Abstract

The present invention relates to a method for modeling the geometric structure of the interface of Receptor-Ligand complexes, a method for modeling the interaction between a Receptor and a Ligand in Receptor-Ligand complexes, a method for determining a scoring vector w which is a mathematical vector quantifying and/or qualifying the interaction of a geometric structure of the interface of a Receptor-Ligand complex, a method for determining the binding affinity or binding free energy of a position of a Ligand relative to a Receptor in one or more Receptor-Ligand complexes, and a method for ranking the binding affinity or binding free energy of spatial positions of a Ligand relative to a Receptor in one or more Receptor-Ligand complexes.

Description

INTERACTION PARAMETERS FOR THE INPUT SET OF MOLECULAR STRUCTURES
The present invention concerns a method for modeling the geometric structure of the interface of Receptor-Ligand complexes, a method for modeling the interaction between a Receptor and a Ligand in Receptor-Ligand complexes, a method for determining a scoring vector w which is a mathematical vector quantifying and/or qualifying the interaction of a geometric structure of the interface of a Receptor-Ligand complex, a method for determining the binding affinity or binding free energy of a position of a Ligand relative to a Receptor in one or more Receptor-Ligand complexes, and a method for ranking the binding affinity or binding free energy of spatial positions of a Ligand relative to a Receptor in one or more Receptor-Ligand complexes. All of these methods comprise one or more steps implemented or assisted by computer. The invention also relates to computer assisted design or representation of molecular structures, and more particularly of molecule interaction. The present invention also relates to any device implementing or helping to implement said methods, i.e. the corresponding software and hardware. The applications of the invention are all those where precise molecular interactions are important or crucial for the performance such as computer-aided drug design, pharmaceutical sciences, medicine, physics, and biology. Furthermore, the invention may present advantages for machine learning applications in computer graphics, computer vision, etc.
The average time required to develop a new active molecule, typically a drug, using the standard experimental analysis method Structure-Analysis-Relationship (SAR) is about 10-15 years with a cost of about $1 .2 bin. Structure based drug design (SBDD) reduces drug design period to 7-12 years with a cost of about $1 bin, thus saving both time and money. There are thus huge needs to decrease either the duration to develop a new active molecule, the cost thereof, or even preferably both.
In particular, the invention provides a way to perform fast, accurate and efficient virtual screening of potential drug molecules, which is the initial step of the drug design pipeline.
Given a complex of interacting molecules, it is technically difficult to quantify the interaction between the interacting molecules, ideally corresponding to the experimental values of the binding free energy or the binding affinity. It is thus very difficult to predict the binding affinity of a receptor-ligand complex, and thereby difficult to rank and select the best (minimal) binding free energy or the binding affinity in order to select the best candidate(s) for drug design. There is a need to overcome such technical problems. Despite the vast variety of the methods to obtain the scoring functions (SFs), they can be clustered into three major classes: forcefield-based SFs, empirical SFs and statistical SFs.
- Forcefield-based (FF) SFs present the score as a decomposition of the free energy into individual physics-based interaction terms such as van der Waals, electrostatics, bond stretching, bending, etc. energies. Classical molecular mechanical force fields such as AMBER or CHARMM are widely used for this purpose. Major challenges of the Forcefield-based SFs are: 1 ) accounting for the solvent molecules; 2) accounting for entropic effect; 3) and the possibility of decomposing the binding free energy into a linear combination of interaction terms. GOLD::GoldScore and SYBYL::G-Score/D-Score are the forcefield-based SFs evaluated by Cheng et a\\ FF scoring functions are also used in DOCK and AutoDock packages. Overall, FF scoring functions have a rather poor performance1 and there is no rigorous way to adjust weights between different interaction terms.
- Empirical SFs are constructed as a weighted sum of terms, such as desolvation, electrostatic interactions, hydrogen bonds, hydrophobic interactions, etc.,
Figure imgf000003_0003
Then, coefficients at are tuned to match some experimental data, such as binding affinity, or to attain a minimum of the scoring function on the known native structures. Regression analysis is typically used for these purposes. Empirical scoring functions are much more computationally efficient in comparison with the FF scoring function2: Glide, ICM, LUDI, PLP, ChemScore, X-Score, Surflex, SYBYL/F-Score, MedusaScore, AlScore, SFCscore are some examples of the empirical-based scoring functions. Overall, Empirical SFs perform better compared to FF scoring functions1 but posses the same problem of adjusting the weights between their interaction terms.
- Statistical scoring functions, on the other hand, are based on the observation that the distances between the atoms in experimentally determined structures follow the Boltzmann distribution. More precisely, using ideas from statistical theory of liquids, effective potentials between atoms are extracted using the inverse Boltzmann relation:
where kBT is the Boltzmann constant, denotes the
Figure imgf000003_0001
Figure imgf000003_0002
probability to find two atoms of types / and j at a distance r, and Z denotes the probability distribution in the reference state. The latter is the thermodynamic equilibrium state of the protein when all interactions between the atoms are set to zero. The score of a protein conformation is then given as a sum of effective potentials between all pairs of atoms. Although this concept is old (it originates from the work of Tanaka and Scheraga3, Miyazawa and Jernigan4, and Sippl5), it is still under debates. Particularly, the computation of the reference state is a challenging problem and only recently some attempts to rigorously justify and compute it have been made. ITScore, PMF, DrugScore, DFIRE, BLEEP, MScore, GOLD/ASP are some knowledge-based scoring functions. GOLD::ASP, DS::PMF, SYBYL::PMF, and DrugScore were evaluated in Cheng et al comparative assessment1. Overall, Statistical SFs are the winners in all types of benchmarks and competitions1, however they typically have thousands of parameters, which are extremely sensitive to the training sets of molecular structures and parameters of the optimization algorithms.
Despite these improvements, there is still a need to discover a new way to perform faster, more accurate and more efficient virtual screening of potential drug molecules.
The invention thus aims to solve the above-described problems.
More precisely, the methods of the invention and the associated algorithms are very fast, robust, general, and stable to noise in initial structures, as verified on a number of different benchmarks. Therefore the present invention represents an important improvement for modeling of geometric structure of an interface of Receptor-Ligand complexes, for modeling an interaction between a Receptor and a Ligand in Receptor- Ligand complexes, for determining a scoring vector quantifying and/or qualifying the interaction of a geometric structure of an interface of a Receptor-Ligand complex, for determining the binding affinity or binding free energy of a position of a Ligand relative to a Receptor in one or more Receptor-Ligand complexes, and for ranking the binding affinity or binding free energy of spatial positions of a Ligand relative to a Receptor in one or more Receptor-Ligand complexes.
The invention is described below in more details.
The invention relates to a method for modeling the geometric structure of the interface of Receptor-Ligand complexes, wherein a first chemical molecule defined as Receptor and a second chemical molecule defined as Ligand, wherein said method comprises the following steps wherein at least one of them is implemented or assisted by computer:
(a) providing a set of Receptors and Ligands from at least one computer database, wherein Receptor-Ligand complexes present an interface comprising different atom types, wherein atom type k is located on the Receptor and atom type I is located on the Ligand interact, k and I varying depending on the atom type;
(b) selecting atoms from at the Receptor-Ligand complexes interface of said Receptors and Ligands;
(c) assigning to each selected atoms an atom type among k and I;
(d) providing for Receptor-Ligand complexes the distances r,j between an atom i of a specific atom type k of the Receptor and an atom j of a specific atom type I of the Ligand, wherein i index runs over specific atoms among atom type k, and wherein j index runs over specific atoms among atom type I ;
(e) optionally repeating step (c) for all or other atom types k and I;
(f) assigning the distances ry as a function of atom types; and
(g) providing the modeling of the geometric structure of the interface of Receptor-
Ligand complexes as a function of distances ry.
In one embodiment, the interface is a set of all atom pairs ij at a distance smaller than the cutoff distance rmax such that the first atom i in each pair ij belongs to the receptor and the second atom j in each pair ij belongs to the ligand.
For example the interface is a set of atoms determined using the standard linked-cell algorithm. More precisely, using a grid initialized with atoms of the receptor, atoms of the receptor-ligand interface are selected, in linear time, as those wherein distance ry is less than the cutoff distance.
In one embodiment, Atom types are defined by the classification of all heavy atoms
(that is all atoms excluding hydrogens) according to their element symbol, aromaticity, hybridization, and polarity. Sybyl atom types can be used, for example6. In this case, the atom types can be computed by Sybyl, OpenBabel or other widely-used molecular software such as DOCK. Alternatively, manual conversion tables are provided in the literature, for example, in the RPIuto user guide from the CSD System package.
Receptors and ligands can be represented as a set of discrete interaction sites located at the centers of the atomic nuclei, thereby forming the interacting interface.
All atoms may be divided for example into M atom types according to the properties of corresponding atomic nuclei (element type, charge, hydrophobicity, etc.). Thereby, each atom has the associated position and atom type. Such atoms may also be defined as interaction sites.
These result in total in Mx (M + 1)/2 pairs of atom types.
Atom types were assigned to the atoms for example according to their surrounding and functional groups they consist in. To do so, it can for example be used the fconv library7 for atom typization, which provides 158 internal atom types. Then, the atom types are clustered into 48 groups by measuring the statistical similarity of pair-distribution functions between different atom types in the training data set. Atom types set used to describe proteins and ligands can be the same, despite the fact that proteins always contain atoms of only some specific types. In one embodiment, the parameterization consists of 48 atom types. More precisely, such atom types are: 17 types for nitrogen, 9 types for oxygen, 8 types for carbon, 4 types for sulfur, 2 types for phosphorus and 8 types for halogens.
Preferably, said geometric structure is defined as a structure vector x comprising as coordinates distances ry as a function of atom types.
In one embodiment, said structure vector x depends on various atom types in the
Receptor-Ligand complex and on the distance between various atom types in the Receptor-Ligand complex. This may be obtained according to equation (1 1 ):
Figure imgf000006_0003
In one embodiment, said modeling of the geometric structure of the interface of Receptor-Ligand complexes takes into account inaccuracies in the determination of distances In one embodiment, inaccuracies in the distance are taken into account in
Figure imgf000006_0009
the method of the invention.
In one embodiment, the modeling of the geometric structure of the interface of Receptor-Ligand complexes as a function of distances ry. is defined by the number densities
Figure imgf000006_0007
wherein said number densities is defined as:
Figure imgf000006_0008
Figure imgf000006_0001
wherein each distance distribution is represented by a Gaussian centered at with
Figure imgf000006_0010
the constant variance of
Figure imgf000006_0011
and wherein the distance is smaller than a determined
Figure imgf000006_0004
cutoff distance
Figure imgf000006_0006
In one embodiment, said linear scoring function F is defined by equation (1 ):
Figure imgf000006_0002
wherein unknown "scoring potentials" functions
Figure imgf000006_0005
can be determined from a training set of native complexes.
Advantageously, the cutoff distance is set between 1 and 20, preferably between 6 and 12 Angstrom (A). Advantageously, the cutoff distance is 10 Angstrom (A).
In one embodiment, the value of σ is assumed to be equal for all types of site-site interactions and determined from the cross-validation procedure.
In one embodiment, additional information is used for more precise parameterization of variance or even instead of the Gaussian approximation in Eq. (4). Such additional information is for example: individual distance distributions, e.g. Debye-Waller factors, molecular dynamics trajectories, etc. The invention also relates to a method of generating virtual Non-Native Receptor- Ligand complexes, wherein said method comprises the following steps wherein at least one of them is implemented or assisted by computer:
(a) providing a set of Native Receptor-Ligand complexes
Figure imgf000007_0008
from at least one computer database, wherein Receptor-Ligand complexes present an interface wherein site k of the Receptor and site I of the Ligand interact;
(b) generating D Non-Native Receptor-Ligand complexes
Figure imgf000007_0002
wherein j index runs over generated decoys and D represents the total number of Non- Native Receptor-Ligand complexes generated, wherein Non-Native Receptor-Ligand complexes are generated by moving spatially the Ligand relative to the Receptor or by local deformation along spatial directions from the Native Receptor-Ligand complexes.
In one embodiment, Non-Native Receptor-Ligand complexes
Figure imgf000007_0006
are generated by rolling the Ligand over the surface of the Receptor. For example, this can be performed using the Hex algorithm.
In one embodiment, Non-Native Receptor-Ligand complexes are generated
Figure imgf000007_0007
by the following steps:
- Considering a Ligand as a rigid body,
- Rotating the Ligand about one or more rotational axes, and
- Translating the Ligand along the coordinate axes.
By reference to figure 2, it is preferred for small molecules or chemical drug that corresponding decoy is generated by setting axes, for example 6 axes, inside a unit sphere corresponding to its icosahedral tessellation; then by rotating the ligand about these axes such that RMSD is kept constant, and then by setting six translations along the coordinate axes; and translating the ligand by RMSD amount. Small molecules are defined as molecule presenting a molecular weight below 900 Daltons. Small molecules have a size in general of less than 10-9 m.
In one embodiment, Non-Native Receptor-Ligand complexes are generated
Figure imgf000007_0003
by linear combinations of modes
Figure imgf000007_0004
{ } as follows:
Figure imgf000007_0001
where
Figure imgf000007_0005
are the coordinate vectors corresponding to the native and non-native conformations, respectively, n is the random weight for each mode ranging from -1 to 1 , and
Figure imgf000007_0009
is the frequency of the mode By reference to figure 3, it is preferred for Protein-Protein interaction to contract the Hessian Matrix and compute its eigenvectors U (for example the 10 first eigenvectors) and then generate decoys (for example 15).
In one embodiment, the modes are obtained by the diagonalization of the Hessian 5 matrix H, which is the matrix of second derivatives of, for example, the OPLS potential function with respect to atomic positions, as
Figure imgf000008_0001
Here, V is a unitary matrix, composed of the eigenvectors
Figure imgf000008_0003
is the diagonal matrix of eigenvalues A. The frequency and shape of a mode is represented by its eigenvalue and eigenvector, respectively. The frequency of a mode
Figure imgf000008_0004
is given as the square root of the corresponding 10 eigenvalue,
Figure imgf000008_0002
In one embodiment, rolling the Ligand over the surface of the Receptor is performed by the Hex protein docking software8
In one embodiment, Receptor-Ligand complex is labeled as "native" if the root mean square deviation (RMSD) of the corresponding Ligand is less than a determined value, for 15 example from its native position. Otherwise, the Receptor-Ligand complex is labeled as "non-native" or "decoy".
The invention also relates to a method for modeling the interaction between a Receptor and a Ligand in Receptor-Ligand complexes,
wherein said method comprises the following steps wherein at least one of them is 20 implemented or assisted by computer:
(a) providing a set of Receptors and Ligands from at least one computer database;
(b) assigning to each Receptor-Ligand complex a specific structure vector x which is a mathematical vector representing the specific geometric structure of the interface between a Receptor and a Ligand in a specific Receptor-Ligand complex;
25 (c) computing a linear convex scoring function F as a function of all specific structure vectors x or of vector X which is the concatenation of all vectors x thereof, preferably said linear convex scoring function F being also a function of a scoring vector w;
(d) projecting said scoring function F in orthogonal polynomial subspaces; thereby 30 modeling the interaction between a Receptor and a Ligand in Receptor-Ligand complexes.
According to one embodiment, said method comprises:
(a1 ) providing a set of Receptor-Ligand complex configuration
Figure imgf000008_0005
from at least one computer database, wherein is a native Receptor-Ligand complex 35 configuration and i is an integer assigned to a Receptor-Ligand complex configuration (a2) calculating a scoring functional F for different Receptor-Ligand complexes wherein for each native complex i and its non-native decoy j the following inequality holds:
Figure imgf000009_0001
wherein F is a linear convex function depending on the geometrical interface between the Receptor and the Ligand,
wherein Receptors and Ligands are represented as a set of discrete interaction at the interface of the Receptor-Ligand complex(es), and
wherein the interface is a set of all atom pairs at a distance smaller than the cutoff distance rmax such that the first atom in each pair belongs to the Receptor and the second atom in each pair belongs to the Ligand.
In one embodiment, F is represented as a function of the distribution of the distances between the atoms of the interface, represented by (3):
Figure imgf000009_0002
wherein nkl(r) is the number density of atom-atom at a distance r between two atom types k and I, with atom type k on the Receptor, and atom type I on the Ligand, where m is the total number of different atoms in a Receptor-Ligand complex interface.
The invention also relates to a method for determining a scoring vector w which is a mathematical vector quantifying and/or qualifying the interaction of a geometric structure of the interface of a Receptor-Ligand complex, wherein Receptor-Ligand complexes present an interface in interaction, wherein said interaction is in need for quantification and/or qualification, wherein said method comprises the following steps wherein at least one of them is implemented or assisted by computer:
(a) providing a set of Receptors and Ligands from at least one computer database;
(b) assigning to each geometric structure of an interface of a Receptor-Ligand complex, a specific structure vector x which is a mathematical vector representing the specific geometric structure of the interface;
(c) computing a linear convex scoring function F as a function of all specific structure vectors x and scoring vector w;
(e) projecting said scoring function F in orthogonal polynomial subspaces;
(f) formulating a convex optimization problem;
(g) solving the convex optimization problem thereby determining a scoring vector w.
Figure imgf000010_0001
Figure imgf000011_0001
Minimize
Figure imgf000012_0001
Wherein Loss is a loss function depending on w, x and b,
wherein w is the scoring vector and the vector x is the structure vector defined by
(10-1 1 ).
Wherein bj are the offset parameters, which determine the offset of the hyperplanes from the origin along the scoring vector w.
In one embodiment, the scoring vector w is a linear combination of the support vectors.
In one embodiment, the invention uses kernelized version of the Smooth Convex Optimization Problem.
In one embodiment, said step (a) comprises providing Native Receptor-Ligand complex and Non-native Receptor-Ligand complexes
Figure imgf000012_0002
wherein /' index runs over different protein complexes.
In one embodiment, said step (b) comprises implementing a method for modeling the geometric structure of the interface of Receptor-Ligand complexes as defined in the present invention.
In one embodiment, in step (e) orthogonal polynomial subspaces are Rectangular, Legendre, Laguerre or Fourier orthogonal bases.
In one embodiment, step (f) comprises using the artificially generated noise applied to the original input data.
In one embodiment, said noise is represented by the Gaussian distance distribution of the input data having a variance σ where σ is constant and does not depend on the atom type. This noise can be thought as a Gaussian filter applied to the input data if the latter is represented as a 1 D signal.
In one embodiment, step (f) comprises formulating a convex optimization problem so as to minimize the convex function.
In one embodiment, step g) (solving the convex optimization problem thereby determining a scoring vector w) comprises implementing at least one solver selected from the group consisting of the coordinate-descent solver, Nesterov descent solver, a stochastic gradient solver, the quasi-Newton family solvers (e.g. BFGS), and any combination thereof.
Preferably, said method further comprises finding the scoring vector w. The invention also relates to a method for determining the binding affinity or binding free energy of a position of a Ligand relative to a Receptor in one or more Receptor- Ligand complexes, wherein said Receptor-Ligand complex present an interface comprising different atom types, wherein atom type k, located on the Receptor, and atom type I, located on the Ligand, interact, k and I varying depending on the atom type, wherein said method comprises the following steps wherein at least one of them is implemented or assisted by computer:
(i) modeling the geometric structure of the interface of one or more Receptor-Ligand complexes, said modeling being as defined in the present invention;
(ii) assigning to a geometric structure of the interface of Receptor-Ligand complex, a binding affinity or binding free energy by reference to a database, optionally wherein said binding affinity or binding free energy is determined as a scalar product of the structure vector x with the scoring vector w as defined in the method for determining a scoring vector w as defined in the present invention.
The invention also relates to a method for ranking the binding affinity or binding free energy of spatial positions of a Ligand relative to a Receptor in one or more Receptor- Ligand complexes, wherein said method comprises the following steps wherein at least one of them is implemented or assisted by computer:
(i) implementing the method for determining the binding affinity or binding free energy of a position of a Ligand relative to a Receptor in one or more Receptor-Ligand complexes, to determine the binding affinity or binding free energy of two or more spatial positions of a Ligand relative to a Receptor in one or more Receptor-Ligand complexes,
(ii) ranking spatial positions of a Ligand relative to a Receptor based on said binding affinity or binding free energy by providing a strict relationship between a set of spatial positions such that, for any two positions, the first is either ranked higher, ranked lower or ranked equal to the second position if the binding energy of the first position is smaller, equal or higher than the energy of the second position, respectively. Advantageously, the best spatial position of a Ligand relative to a Receptor in one or more Receptor-Ligand complexes is determined based on the ranking of said binding affinity or binding free energy.
Advantageously, the best binding affinity or free binding energy among several Receptor-Ligand complexes is determined based on the ranking of said binding affinity or binding free energy. In the past years, a number of methods to derive scoring functions of different types and properties have been proposed as it is described above. Input information for these methods (structural data, statistical data) is taken from the experiments (X-Ray crystallography, NMR, binding affinity measurements, etc.). However, experimental data is always biased towards certain experimental conditions and always contains standard implementation errors of different types. One of the main advantageous distinction of the invention comprises the accounting for experimental error by introducing uncertainties during the training process (as implemented in the statistical kernel). Different type of kernels might be used, for example, the invention may use the Gaussian kernel, which allows to deal with uncertainties in the experimental data by representing these data as a "dome" centered at the exact experimental measures (for example Eq. (23)). Thus, the structure vectors according to the invention built upon the kerneled experimental data are much more robust, meaning that they represent the real, unbiased, data more accurately without statistical bias. As a consequence, the derived scoring function is also robust and steady to the experimental biases, providing better performance compared to the state-of- the-art scoring functions as it is demonstrated in the example below.
The invention also relates to a software for modeling the geometric structure of the interface of Receptor-Ligand complexes, wherein the software is embodied in a computer readable media and when executed said software implements the method for modeling the geometric structure of the interface of Receptor-Ligand complexes according to the invention.
The invention also relates to a software for generating virtual Non-Native Receptor- Ligand complexes, wherein the software is embodied in a computer readable media and when executed said software implements the method for generating virtual Non-Native Receptor-Ligand complexes according to the invention.
The invention also relates to a software for modeling the interaction between a Receptor and a Ligand in Receptor-Ligand complexes, wherein the software is embodied in a computer readable media and when executed said software implements the method for modeling the interaction between a Receptor and a Ligand in Receptor-Ligand complexes according to the invention.
The invention also relates to a software for determining a scoring vector w which is a mathematical vector quantifying and/or qualifying the interaction of a geometric structure of the interface of a Receptor-Ligand complex, wherein the software is embodied in a computer readable media and when executed said software implements the method for determining a scoring vector w which is a mathematical vector quantifying and/or qualifying the interaction of a geometric structure of the interface of a Receptor-Ligand complex according to the invention.
The invention also relates to a software for determining the binding affinity or binding free energy of a position of a Ligand relative to a Receptor in one or more Receptor- Ligand complexes, wherein the software is embodied in a computer readable media and when executed said software implements the method for determining the binding affinity or binding free energy of a position of a Ligand relative to a Receptor in one or more Receptor-Ligand complexes according to the invention.
The invention also relates to a software for ranking the binding affinity or binding free energy of spatial positions of a Ligand relative to a Receptor in one or more Receptor- Ligand complexes, wherein the software is embodied in a computer readable media and when executed said software implements the method for ranking the binding affinity or binding free energy of spatial positions of a Ligand relative to a Receptor in one or more Receptor-Ligand complexes according to the invention.
The invention also relates to a hardware comprising at least one software as described in the present description.
The invention also relates to a system for generating virtual Non-Native Receptor- Ligand complexes, said system comprising means for generating virtual Non-Native Receptor-Ligand complexes according to the invention.
The invention also relates to a system for modeling the geometric structure of the interface of Receptor-Ligand complexes, said system comprising:
(a) means for providing a set of Receptors and Ligands from at least one computer database, wherein Receptor-Ligand complexes present an interface comprising different atom types, wherein atom type k is located on the Receptor and atom type I is located on the Ligand, k and I varying depending on the atom type;
(b) means for selecting atoms from at the Receptor-Ligand complexes interface of said Receptors and Ligands;
(c) means for assigning to each selected atoms an atom type among k and I;
(d) means for providing for Receptor-Ligand complexes the distances r,j between an atom i of a specific atom type k of the Receptor and an atom j of a specific atom type I of the Ligand, wherein i index runs over specific atoms among atom type k, and wherein j index runs over specific atoms among atom type I ;
(e) optionally means for repeating step (c) for all or other atom types k and I;
(f) means for assigning the distances r,j as a function of atom types; and
(g) means for providing the modeling of the geometric structure of the interface of
Receptor-Ligand complexes as a function of distances r,j, preferably said geometric structure is defined as a structure vector x comprising as polynomial coefficients of coordinates distances r,j as a function of atom types computed in an orthogonal polynomial basis. The invention also relates to a system for determining a scoring vector w which is a mathematical vector quantifying and/or qualifying the interaction of a geometric structure of the interface of a Receptor-Ligand complex, said system comprising:
(a) means for providing a set of Native Receptor-Ligand complexes Pfat from at least one computer database, wherein Receptor-Ligand complexes present an interface wherein site k of the Receptor and site I of the Ligand interact; and
(b) means for generating D Non-Native Receptor-Ligand complexes pjlonnat t j =
1. . . D wherein j index runs over generated decoys and D represents the total number of Non-Native Receptor-Ligand complexes generated, wherein Non-Native Receptor-Ligand complexes are generated by moving spatially the Ligand relative to the Receptor or by local deformation along spatial directions from the Native Receptor-Ligand complexes.
The invention also relates to a system for modeling the interaction between a Receptor and a Ligand in Receptor-Ligand complexes, wherein said system comprises:
(a) means for providing a set of Receptors and Ligands from at least one computer database;
(b) means for assigning to each Receptor-Ligand complex a specific structure vector x which is a mathematical vector representing the specific geometric structure of the interface between a Receptor and a Ligand in a specific Receptor-Ligand complex;
(c) means for computing a linear convex scoring function F as a function of all specific structure vectors x or of vector X which is the concatenation of all vectors x thereof , preferably said linear convex scoring function F being also a function of a scoring vector w ; and
(d) means for projecting said scoring function F in orthogonal polynomial subspaces; thereby modeling the interaction between a Receptor and a Ligand in Receptor-Ligand complexes.
The invention also relates to a system for determining a scoring vector w which is a mathematical vector quantifying and/or qualifying the interaction of a geometric structure of the interface of a Receptor-Ligand complex, wherein said system comprises:
(a) means for providing a set of Receptors and Ligands from at least one computer database; (b) means for assigning to each geometric structure of an interface of a Receptor- Ligand complex, a specific structure vector x which is a mathematical vector representing the specific geometric structure of the interface;
(c) means for computing a linear convex scoring function F as a function of all specific structure vectors x and scoring vector w;
(e) means for projecting said scoring function F in orthogonal polynomial subspaces;
(f) means for formulating a convex optimization problem; and
(g) means for solving the convex optimization problem thereby determining a scoring vector w.
The invention also relates to a system for determining the binding affinity or binding free energy of a position of a Ligand relative to a Receptor in one or more Receptor- Ligand complexes, wherein said system comprises:
(i) means for modeling the geometric structure of the interface of one or more Receptor-Ligand complexes, said modeling being as defined according to the present invention;
(ii) means for assigning to a geometric structure of the interface of Receptor-Ligand complex, a binding affinity or binding free energy by reference to a database, optionally wherein said binding affinity or binding free energy is determined using a scoring vector w as defined in the method for determining a scoring vector w which is a mathematical vector quantifying and/or qualifying the interaction of a geometric structure of the interface of a Receptor-Ligand complex.
The invention also relates to a system for ranking the binding affinity or binding free energy of spatial positions of a Ligand relative to a Receptor in one or more Receptor- Ligand complexes, wherein said system comprises:
(i) means for implementing the method of determining the binding affinity or binding free energy of a position of a Ligand relative to a Receptor in one or more Receptor- Ligand complexes according to the present invention to determine the binding affinity or binding free energy of two or more spatial positions of a Ligand relative to a Receptor in one or more Receptor-Ligand complexes, and
(ii) means for ranking a set of positions of a Ligand relative to a Receptor by providing a strict relationship between the set such that, for any two positions, the first is either ranked higher, lower or equal to the second position if the said binding free energy of the first position is smaller, equal or higher than the energy of the second position, respectively in one or more Receptor-Ligand complexes according to the present invention to determine the top binding poses of a Ligand relative to a Receptor in one or more Receptor-Ligand complexes. 17
The invention also relates to the corresponding software and parameter datasets.
The invention also relates to a method for predicting molecule-molecule interactions, for example protein-protein, protein-drug, in particular protein-small molecule interaction, 5 wherein said method comprises implementing at least one method as defined according to the invention.
The invention also relates to a method for designing molecules, for example drugs, proteins, peptides, polypeptides, or other small molecules, wherein said method comprises implementing at least one method according to the present invention.
10 The present invention has also applications where precise molecular interactions are crucial for the performance such as computer-aided drug design, pharmaceutical sciences, medicine, physics, and biology. Furthermore, the invention relates also to machine learning applications for example in in computer graphics, computer vision, etc.
Currently, the invention provides a solution for companies, especially pharmaceutical 15 companies and organisations working in biological and medical research in general. In particular, the invention provides a way to perform fast, accurate and efficient virtual screening of potential drug molecules, which is the initial step of the drug design pipeline.
The method according to the invention is very fast and general with respect to classes of input molecules.
20 In the Figures:
Figure 1 represents a flowchart of main steps of a method according to the present invention, said method comprising the following steps:
(1 ) loading of i=1 ... N structures of native complexes,
(2) performing the following steps (3) to (7) for each complex i:
25 (3) assigning to each atom the associated atom type;
(4) find all pairs of ligand-receptor atoms separated by less than ten Angstroms,
(5) computing one native structure vector Xinat;
(6) generating decoys;
(7) constructing near-native conformations: for each conformation find all pairs of ligand- 30 receptor atoms separated by less than ten Angstroms;
then,
(8) computing non-native structure vectors Xijnonnat;
(9) formulating the optimization problem, given native and non-native structure vectors; and
35 (10) solving the optimization problem for scoring vectors w. Figure 2 is a flowchart representing a method which includes generating decoys for protein-small drug interaction, wherein step (6) of figure 1 is further detailed and comprises the following steps for the Ligand (small drug):
(6.1 ) setting six axes inside a unit sphere corresponding to its icosahedral tessellation, and (6.2) rotating the ligand about these axes such that RMSD is kept constant, and setting six translations along the coordinate axes; and translating the ligand by RMSD amount.
Figure 3 is a flowchart representing a method which includes generating decoys for protein-protein interaction, wherein step (6) of figure 1 is further detailed and comprises the following steps:
For the Ligand: (6.1 ) constructing the Hessian matrix and computing its eigenvectors Li, preferably the ten first eigenvectors, and (6.2) then generating decoys
Figure imgf000019_0002
wherein such decoy is defined according to equation (16).
For the receptor: (6.1 a) constructing the Hessian matrix and computing its eigenvectors
Figure imgf000019_0001
preferably the ten first eigenvectors, and (6.2a) then generating decoys wherein such decoy is defined according to equation (16).
Figure 4 represents two types of orthogonal functions. Left: shifted Legendre polynomials orthogonal on the interval [0; 10]. Right: shifted rectangular functions.
Figure 5 represents two classes of structure vectors for a single complex. Native structure vectors are plotted as circles. Nonnative structure vectors are plotted as squares. A) The case where infinitely many hyperplanes can separate the two classes. B) The case where no optimal separating hyperplane exists. Slack variables ξι and ξί for misclassified structure vectors are added, which are the distances to the corresponding margin hyperplanes. The optimal hyperplane, which maximizes the separation between the two classes, is plotted as a dashed line. Two margin hyperplanes are plotted as solid lines.
Figure 6 represents a cross-validation procedure to reveal the optimal RMSD and regularisation parameters for the optimization problem for protein-drug interactions.
Figure 7 represents predictive performance of the protein-protein scoring potential as a function of the smoothing parameter σ and the regularization parameter C. A) Performance obtained if the scoring functions are trained on the whole database and verified on the same database. B) Performance obtained if the scoring functions are trained on 200 protein complexes and verified on the other 650 complexes from the training database. Here, the best performance is obtained with σ = 0...4 A and C = 106 ...107. Figure 8 represents scoring functions trained in two different polynomial bases. Solid lines correspond to the potentials obtained using the rectangular basis functions. Dashed lines correspond to the potentials obtained using the Legendre basis functions. Left: Potential between aliphatic carbons bonded to carbons or hydrogens only. Right: Potential between a guanidine nitrogen with two hydrogens and an oxygen in carboxyl groups.
Figure 9 represents a comparison of the success rates of scoring functions when the best-scored binding pose differs from the true one by RMSD < 1 .0 A (light bars) < 2.0 A (darker bars) or < 3.0 A (the darkest bars), respectively. Scoring functions are ranked by success rates when the ligand binding pose is found within RMSD < 2.0 A.
Figure 10 represents a comparison of the success rates of scoring functions for the cases when the native binding pose is included (dark bars) or not-included (light bars) into the assessment. The acceptance cutoff RMSD is 2.0 A. Scoring functions are ranked by the darker bars.
Figure 11 represents a comparison of the success rates of scoring functions when a ligand binding pose is found within RMSD < 2.0 A from the true one if the top one (light bars), the top two (darker bars), or the top three (the darkest bars) best-scored binding poses are considered. Scoring functions are ranked by success rates when the top three binding poses are considered.
Figure 12 represents a correlation between experimentally measured binding constants (in -logKd units) of 195 benchmark complexes and the predicted ones. Pearson correlation coefficient is Rp = 0:59.
Figure 13 represents a dependence of the success rate on the ZDOCK benchmark on the number of top predictions in consideration for the three methods.
Figure 14 represents a dependence of the success rate on the RosettaDock benchmark on the number of top predictions in consideration for the three methods.
The invention is described below according to specific examples.
The methods were implemented using the C++ programming language and compiled using g++ compiler version 4.6 with optimization levels -03 and the clang compiler. The programs was ran on a 64-bit Linux Fedora operating system with Intel(R) Xeon(R) CPU X5650 @ 2.67GHz and on a 64-bit Mac OS system version 10.9 with Intel(R) Core i7 CPU @ 2.7GHz. Example of such method is described below relative to the generation of protein- protein interaction or protein-drug interaction (the drug being a small molecule).
Figure imgf000021_0001
Although, generally, the temperature factor is individual for each monomer, we kept it constant for all the monomers and chose its best value. To do so, we scanned through several values of the temperature factor, namely, 5; 10; 20; 40; 60 (kcal/mol)1'2, using the cross-validation procedure as detailed below in the text. The temperature factor jkBT affects the amplitude of the deformation, hence, too large temperatures cause a monomer to deform significantly breaking the covalent bonds. To ensure the absence of non- relevant decoy conformations, we measured the RMSD between the native and the decoy structures for each value of
Figure imgf000021_0002
Table 1 lists corresponding values of RMSD. As one can see, indeed, the vast majority of decoys are within 6 Angstrom (A). RMSD with respect to the corresponding native molecule, which means that the normal mode perturbation of the native state (with a given temperature factor) keeps all decoy conformations near-native. At the last step, decoys were combined from two molecules representing one protein complex, resulted in 15 x 15 = 225 decoys. To summarize, five training sets corresponding to different values of the temperature factor were
Figure imgf000021_0003
composed. Each training set contained 844 blocks representing different non-homologous protein complex, and each block consists of one native structure and 225 decoys generated with normal modes (Note: if protein complexes occurred too large for the normal mode analysis they were removed from the training set). Thus, each training set comprised of 844 x (225 + 1 ) = 190744 molecule entries, which we used further to derive the statistical scoring function. Normal modes can be also computed in a simpler way using, e.g. the elastic-network, the Gaussian network model, the rotation-translation of blocks method, etc. These methods describe a protein as a set of particles that are interconnected by a network of elastic springs.
Table 1 . RMSD corresponded to several temperature factors.
Figure imgf000022_0001
Depending on the level of detail of the model, the particles can correspond to the atoms of the protein, a subset of the atoms, or to representative points such as the center of mass of a residue or a sidechain. The normal modes are then found by diagonalization of the Hessian matrix H, which is the matrix of second derivatives of the potential function with respect to atomic positions, as H = V AVT.
All generated decoys represent near-native protein structures. Indeed, normal mode oscillations were used to locally deform molecules, however, the orientation of molecules with respect to each other is fixed. Since all decoy molecules slightly differ from the native monomers, as verified by their RMSD values (see Table 1 ), the interaction interfaces of all decoy complexes undergo moderate changes and keep at least some part of the native contacts. Putting all together, the training set was based only on local information about the native interfaces and no other information was used.
Example 1 .2 Protein-ligand interactions:
Generation of the decoy conformations was carried out in the following way. Ligand molecules were considered as rigid bodies and rotated about some axes such that the RMSD distance is kept fixed. To do so, six axes were chosen inside a unit sphere corresponding to its icosahedral tessellation. The weighted RMSD for a pure rotation about axis n by an angle a of a molecule of total mass M with inertia tensor / is:
Figure imgf000023_0001
Figure imgf000024_0001
Figure imgf000025_0001
Figure imgf000026_0001
Figure imgf000027_0001
Figure imgf000028_0001
Lemma 2 The optimal scoring vector is unique and given by the solution of problem
(37).
Here, the scoring vector is optimal in the sense that it maximizes the separation between native and nonnative structure vectors and minimizes the number of misclassified vectors. Regularization parameters in (37) tune the importance of either factors.
The proof of lemmas (1 ,2) can be found, e.g., in12. Overall, the formulation of the optimization problem (37) is very similar to the formulation of the soft-margin support vector machine (SVM) problem11. Therefore, to solve problem (37), techniques developed for SVM have been used.
Example 3 - Solving the optimization problem Properties and solutions of quadratic optimization problems similar to the one stated above (37) have been extensively studied in the theory of convex optimization. They can be solved in dual and primal forms. For instance, using the Lagrangian formalism, the optimization problem (37) can be converted into its dual form, and the resulting dual optimization problem is convex:
Figure imgf000029_0001
where the maximization is performed with respect to the Lagrange multipliers
Figure imgf000029_0004
This dual problem is similar to the the soft-margin SVM optimization problem11. Vectors are called support vectors. Once the dual problem (38) is solved and
Figure imgf000029_0003
the Lagrange multipliers are found, one can express the solution of the original primal problem (37) (the scoring vector) as a linear combination of the support vectors:
Figure imgf000029_0002
The problem formulation according to the invention reduces the amount of RAM required by the solver by N2 times.
Therefore, this represents an important technical advantage.
Example 4 - Generating protein-protein complexes: Hex protein docking software has been used.
Initialized Hex exhaustive search algorithm with the radial search step of 1 .5 A and expansion order of the shape function equal to 31 has been used. One may use only the shape complementarity energy function from Hex (i.e. electrostatic contribution was omitted). The top 200 clusters, ranked by Hex surface complementarity function, plus the native protein-protein complex conformation (giving in total 201 structures) were then used to evaluate the distance distribution functions (23). Then, the structure vectors using Eq. (30) were computed and labeled as "native" if the root mean square deviation (RMSD) of the corresponding ligand was
Figure imgf000030_0002
from its native position. Otherwise, the structure vector was labeled as "nonnative" or "decoy". On average, about 2.5 native structure vectors (and, correspondingly, about 198.5 nonnative structure vectors) per protein- protein complex were obtained. To each structure vector a regularization parameter
Figure imgf000030_0004
Figure imgf000030_0003
was assigned according to
Figure imgf000030_0001
where Dj is the total number of structure vectors for each protein-protein complex (201 in our case), is the number of native structure vectors for complex j and
Figure imgf000030_0006
is the number 0f nonnative structure vectors for complex j. The same
Figure imgf000030_0005
procedure was respected for each protein-protein complex from the training database. In this example, M = 20 atom-centered interaction sites based on the atom types definitions provided by Huang and Zou13. These atom types were defined by the classification of all heavy atoms in 20 standard amino acids according to their element symbol, aromaticity, hybridization, and polarity. These 20 atom types result in total of M x (M+1 ) = 210 pair potentials. The training set has several proteins homologous to the ones from the two widely used docking benchmarks, Rosetta, and Zdock, which were used below to validate the results of the invention. Two protein complexes were defined to be homologous if for each chain in the first complex there is a chain in the second complex with sequence identity more than 60%. We determined the sequence identity using FASTA36 program.
Example 5 - Generating protein-drug complexes:
PDBBind database14 provides experimentally measured binding affinity data for the complexes deposited in the Protein Data Bank. The "general set" of release PDBBind 201 1 contains binding data
Figure imgf000030_0007
values) and three-dimensional structures of resolution equal to or better than 2.5 A for 6051 protein-ligand complexes. This information was used in order to derive the scoring function for protein-drug interactions.
Example 6 - Training set for protein-protein interactions
To predict protein-protein interactions we used the training database of 851 non- redundant protein-protein complex structures collected by Huang and Zou13. This database contains protein-protein complexes extracted from the PDB15 and includes 655 homodimers and 196 heterodimers. Three PDB structures from the original training database were updated: 2Q33 supersedes 1 N98, 2ZOY supersedes 1V7B, and 3KKJ supersedes 1YVV. The training database contains only crystal dimeric structures determined by X-ray crystallography at resolution better than 2.5 A. Each chain of the dimeric structure has at least 10 amino acids, and the number of interacting residue pairs (as defined as having at least 1 heavy atom within 4.5 A) is at least 30. Each protein- protein interface consists only of 20 standard amino acids. No homologous complexes were included in the training database. Two protein complexes were regarded as homologues if the sequence identity between receptor-receptor pairs and between ligand- ligand pairs was > 70%. Finally, Huang and Zou manually inspected the training database and left only those structures that had no artifacts of crystallization.
The algorithm of the invention requires as input native and nonnative structure vectors (see, e.g., equation (14)). Native structure vectors can be computed from the native protein-protein contacts in the training database using equation (1 1 ). However, for the computation of the nonnative structure vectors for each protein-protein complex from the training database, decoys were generated for each complex. Since the optimization algorithm of the invention is very general and has no special requirements for nonnative protein-protein contacts, nonnative protein-protein were generated by "rolling" a smaller protein (ligand) over the surface of a bigger protein (receptor) using the Hex protein docking software8. To do so, Hex exhaustive search algorithm initialized with the radial search step of 1 .5 A and expansion order of the shape function equal to 31 . Only the shape complementarity energy function from Hex (i.e., electrostatic contribution was omitted) was used. The top 200 clusters, ranked by Hex surface complementarity function, plus the native protein-protein complex conformation (giving a total of 201 structures) were then used to evaluate the distance distribution functions (23). Then, the structure vectors using Eq. (1 1 ) were computed and labeled according to example 4.
For the optimization of protein-protein interactions, we used the following parameters, σ = 0:4 Angstrom (A), C = 105. The maximum expansion order P was set to P = 40. Figure 8 shows two examples of the scoring function Ykl(r) (see Eq. (5)). Example 7 - Training set for protein-drug interactions
PDBBind database provides experimentally measured binding affinity data for the complexes deposited in the Protein Data Bank. The "general set" of release PDBBind 201 1 contains binding data {Kd, Ki & IC50 values) and three-dimensional structures of resolution equal to or better than 2.5 A for 6051 protein-ligand complexes. This information was used in order to derive the scoring function for protein-drug interactions.
Generation of the decoy conformations was carried out in the following way. Ligand molecules were considered as rigid bodies and rotated about some axes such that the RMSD distance is kept fixed. This generation of decoys was performed according to example 5.
For the optimization of protein-drug interactions, the following parameters, were used: σ = 0.4 Angstrom (A), C = 105 and RMSD = 0.6 Angstrom (A). The maximum expansion order P was set to P = 25.
Example 8 - Gradient-based structure optimization
Note that orthogonal polynomials used for the expansion of the scoring potentials (Eq. 8) might be non-smooth functions, e.g. rectangular polynomials. Thus, generally, the scoring potentials t/fci (r) could be not differentiate. However, thanks to the applied Gauss transform, functions Ykl (r) (Eq. (4)) are smooth as a convolution of analytic locally integrable functions. This fact allows extending the functionality of functions Ykl (r) from the scoring to the structure optimization using their first or higher-order derivatives. More accurately, for a given k-l pair of atoms at a distance η,, the negative gradient - vYfei (ri;) equals to the force acting on the atoms in this pair. Thus, the set of derived functions yfei (r) could be used in a force-field manner, optimizing the structure of a particular complex until a local minimum is reached, provided vyfci(ri7-) = 0 for each pair of atoms.
Since special calibration of the potential functions is required to retain the structure integrity of a complex, more relevant application would be a rigid-body optimization, where instead of force minimization over each pair of atoms, one minimizes the net force acting on the complex. Thus, at a local minimum, VYfei = 0 holds. Rigid-body optimization with functions Ykl (r) could be useful in a local rigid-body minimization as a refinement step to process docking predictions. It was shown that such refinement could improve docking predictions dramatically. By contrast to our functions Ykl (r), most of modern statistical pair-wise potentials are not differentiate (ITScore, DOPE, DFIRE, RAPDF, etc.). Thereby, to perform optimization with such potentials one either smooth them a-posterior, which worsen the potential quality, or uses various derivative-free optimization strategies, e.g. Nelder-Mead or Powell methods and their modifications, where the convergence rate is much slower compared to the first- or higher-order optimization strategies.
Example 9 - Cross validation studies
To tune free regularization parameters C and o, and also the value of the RMSD parameter used during decoy generation, we carried out a series of cross-validation computational experiments, where we split the training dataset into two parts following the training on the first part and validation on the second part. Results of the cross-validation for protein-protein interactions are shown in Fig. 7. Here, the best performance is achieved with σ = 0.4 A, and C = 105 ... 106. Results of the cross-validation for protein- drug interactions are shown in Fig. 6. We can see that the optimum parameters belong to the range of C = 104 ... 106 and RMSD = 0.4 ... 1 A. For the production run optimization, we used the following parameters, σ = 0.4 A, C = 105 A and RMSD = 0.6 A.
The width of the Gaussian parameter σ dictates the number of polynomial coefficients sufficient to encode the shape of the potential. More precisely, we let the maximum expansion order P to be P = rmax/a. Using the values of rmax = 10 A and σ = 0.4 A, we concluded that the maximum expansion order is P = 25. Using the Legendre polynomial basis, we have numerically verified that higher expansion orders do not contribute to the quality of the reconstructed potentials, provided that the parameters rmax and σ are kept constant. Example 10 - Ranking of protein-protein and protein-drug structures
If structure optimization is not required, as it happens in scoring of decoys generated by other docking programs, then ranking is performed using Eq. (12). More precisely, for each structure of a protein-protein or a protein-grid complex, one computes the structure vectors x£l using Eq. (1 1 ). Then, these structure vectors are multiplied with the pre- computed scoring vectors w£l according to Eq. (12) and a linear approximation of the binding free energy is obtained. Now, structures of the complexes can be ranked according to this free energy approximation. If structure optimization is desired, in practice we use Eqs. (4-5) for the gradient-based structure optimization. During the optimization, the gradient of the scoring function (4) is computed with respect to six rigid-body coordinates of the receptor and the ligand. Then, the structure is iteratively optimized until a certain convergence is achieved. Finally, different structures are ranked according to the scores of the optimized binding poses.
Here one should note that the binding free energy F and the binding affinity terms are synonymous. Both are connected to the experimentally measured dissociation constant Kd as F = RT logKd / c, where R is the ideal gas constant, T is temperature and the standard reference concentration c = 1 mol / L.
Example 11 - Results for protein-drug interactions
11.1 Docking power
The first general method of assessment of a scoring function is to see how well it can predict the true binding pose. More precisely, if the best ranked ligand pose is close enough (within RMSD range of 1.0, 2.0 or 3.0 A) to the known true one, the scoring function is said to guess it correctly within a certain RMSD threshold. Success rate of the scoring function according to the invention in comparison to the others is shown in Figure 9. Figure 10 represents the difference in results, when native conformation is included or excluded from the decoy set. As one can see, the difference is not more than 5% for all the scoring functions, which is not very significant. Therefore, the native pose was included into the decoy sets from the benchmark in order to be able to compare the performance to the results published previously. In the comparisons above, only the best ranked ligand poses were considered. Practically, during prediction of the binding pose, it is appropriate to submit few poses. Figure 1 1 shows success rates in cases when one, two or three best ranked poses are considered. For many scoring functions one can notice a significant increase in the prediction power when several poses are considered in comparison to Figure 9. Another representation of docking power evaluation results that includes success rates of the DSX16 scoring functions is given in Table 2. Results of DSX cited from16 and the rest (excluding ConvexPL) - from1. The last column corresponds to the success rate of finding the top ranked ligand pose within RMSD < 2.0 A from the crystallographically determined one, when this true one is excluded from the decoy set.
ConvexPL is the scoring function according to the invention.
Table 2: Success rates in docking power assessment.
Crystal structure on < 2.0 A pose on
Top 1 Top 5 Top 1 Top 5 Top 1 pose no
Scoring function
pose poses pose poses cryst. ConvexPL 55.9 80.5 83.1 97.8 75.4
DS::Jain 1 .5 15.4 44.8 79.2 44.8
DS::LigScore2 17.9 49.7 71.6 92.9 69.4
DS::LUDI2 9.7 29.2 57.4 83.6 56.8
DS::PLP1 40.5 75.9 75.4 97.3 68.3
DS::PMF 19.5 44.1 43.7 67.2 39.3
DrugScoreCSD::Pair 50.3 79.5 58.5 94.0 25.7
DrugScoreCSD::PairSurf | 44.6 80.0 54.1 95.6 25.1
DrugScorePDB::Pair 40.0 73.8 74.3 93.4 68.9
DrugScorePDB::PairSurf | 39.5 74.9 74.3 95.1 69.4
DrugScorePDB::Surf 3.6 20.0 32.8 80.3 32.2
DSXPDB: :pairSR 51.8 77.9 84.7 95.6 78.7
DSXCSD: :A|| 52.8 77.9 85.2 96.2 79.2
GOLD::ASP 36.9 71.8 82.5 95.6 77.6
GOLD::ChemScore 17.9 50.8 70.5 86.9 69.4
GOLD::GoldScore 8.2 28.7 68.9 89.6 68.3
GlideScore::SP 18.5 50.3 73.2 93.4 72.7
SYBYL::F-Score 21.5 49.2 64.5 90.7 60.1
X-Score1.2 32.3 64.6 67.2 91.3 63.4
X-Score1.2::HMScore 30.3 57.9 68.3 90.7 62.3
11.2. Scoring power
The second evaluation criterion for a scoring function is how well it can predict the binding affinity of a protein-drug complex. Table 3 shows the correlations between true binding constants (Kd) and the binding scores obtained with the scoring function, which corresponds to Table 2 from1.
The problem of predicting correct binding affinity and the next one, ligand ranking, are far more challenging problems, than ligand docking. There is a correlation between the size of a ligand (the number of heavy atoms - NHA in Table 3) and its binding affinity. For the test set, the value of the Pearson correlation for the function according to the invention ("ConvexPL") is 0.431. Such a simple measure as ligand size provides a better correlation coefficient than some of scoring functions. Even scoring functions that show the best results in docking power do not achieve high correlations between binding scores and true binding affinities. And vice versa, if a function shows good correlation, it could still achieve modest results in docking.
As mentioned above, the test set is highly diverse - there is a big difference between the highest and the lowest binding affinity of complexes included in the set, as it is evident from Figure 10. Probably this is one of the reasons of such moderate success rates of all the scoring functions, and if one considers only particular family of protein- ligand complexes, better results can be achieved. See1 and their additional test sets.
The presence of 195 test protein-ligand complexes in the training sets can be an issue for some functions. To assess it, the success rates were provided when the test set is included to the training set or excluded from it in Table 3 for ConvexPL and X-Score (version with excluded test set is named 1 .3) The best three results are shown by empirical-based X-Score, the knowledge-based DSXCSD::AII and ConvexPL.
Table 3: Correlations between the experimentally measured binding constants and the binding scores
Scoring function Rp Rs
X-Score::HMScore 0.644 0.705
DSXCSD::AII 0.609
ConvexPL 0.591 0.648
ConvexPL (test set excluded) 0.587 0.642
DSXPDB::PairSR 0.571
DrugScoreCSD 0.569 0.627
SYBYL::ChemScore 0.555 0.585
DS::PLP1 0.545 0.588
GOLD::ASP 0.534 0.577 SYBYL::G-Score 0.492 0.536
DS::LUDI3 0.487 0.478
DS::LigScore2 0.464 0.507
GlideScore-XP 0.457 0.435
DS::PMF 0.445 0.448
GOLD::ChemScore 0.441 0.452
NHA 0.431 0.517
SYBYL::D-Score 0.392 0.447
DS::Jain 0.316 0.346
GOLD::GoldScore 0.295 0.322
SYBYL::PMF-Score 0.268 0.273
SYBYL::F-Score 0.216 0.243
11.3 Ranking power
Finally, the last assessment criterion for a scoring function, studied by1 is the ligand ranking power. Let's consider a given protein target and a list of ligand molecules. Cheng, et al. define the ranking power of a scoring function as the ability to correctly rank the known ligands bound to a common target by their binding affinities when their true binding modes are known.
Table 4 shows the success rates of several scoring functions. The best four functions for ranking are X-Score, DSXCSD::AII, DS::PLP2, ConvexPL. Success rates of these top functions are comparable to the success rates in the scoring power assessment. This fact seems interesting, because one could expect that the ligand ranking is an easier problem than scoring. Again, the best results are achieved by the empirical-based function as X-Score and DS::PLP2. Excluding the 195 test complexes from the training set of the function according to the invention leads to the improvement of the success rate by about 1 .6% (ConvexPL test set excluded).
Table 4: Success rates in the ligand ranking assessment.
Scoring function Success rate %
X-Score::HSScore 58.5
DSXCSD::AII 55.4 DS::PLP2 53.8
ConvexPL (test set excluded) 52.3
DSXPDB::PairSR 52.3
DrugScoreCSD 52.3
ConvexPL 50.7
SYBYL::ChemScore 47.7
SYBYL::D-Score 46.2
SYBYL::G-Score 46.2
GOLD::ASP 43.1
DS::LUDI3 43.1
DS::Jain 41.5
DS::PMF 41.5
SYBYL::PMF-Score 38.5
GOLD::ChemScore 36.9
DS::LigScore2 35.4
GlideScore-XP 33.8
NHA 32.3
SYBYL::F-Score 29.2
GOLD::GoldScore 23.1
Parameters obtained with the invention outperform all academic and industrial scoring functions (35 different in total) as presented on Figures 9, 10 and 1 1 .
The present invention also ensures not only a superb predictive power of docking poses, but also a very good correlation between the scores and the binding affinity data
Example 12 - Results for protein-protein interactions
12.1 ZDOCK Benchmark
We tested the ConvexPP scoring function on the protein-protein docking benchmark version 3.0. It consists of 124 crystallographic structures of protein-protein complexes extracted from the PDB database17. These are divided into three groups: rigid, medium and difficult cases. The division criteria is the scale of conformational changes of the proteins upon binding: from minor changes in rigid cases to the major ones in difficult cases. The non-redundancy of the benchmark was set at the level of family-family pairs. The decoys for the scoring were generated using ZDOCK 3.0 with the sampling step equal to 6 degrees. We call this set of docking position ZDOCK benchmark. The docking program ZDOCK 3.0 generates the rigid-body protein-protein docking predictions with the corresponding scores. Scoring function used in this program includes shape complementarity, statistical pair potentials and electrostatics. ZRANK is the program for reranking the ZDOCK3.0 predictions. In addition to the factors used in ZDOCK3.0, it computes detailed electrostatics, estimates desolvation and uses additional Van-der- Waals potential to re-score the decoys. The benchmark 3.0 has several complexes homologous to certain protein complexes in the training set. Therefore, we trained our potential both excluding homologs from the training set and leaving it unchanged. Table 5 shows results of ZDOCK3.0, ZRANK and our scoring functions on the ZDOCK3.0 benchmark.
2000 decoys generated by ZDOCK3.0 were ranked with the original ZDOCK function, ZRANK and the scoring potentials according to the invention. A hit is a predicted near-native decoy with IRMSD less than 2.5 A. The IRMSD parameter is the RMSD of the interface region between the predicted and native structures after optimal superimposition of the backbone atoms of the interface residues. A residue is considered as the interface residue if any atom of this residue is within 10 A from the other partner. The number of hits when only the top one prediction considered (Topi ) obtained by ZRANK is higher than the one obtained by ConvexPP potentials (15 vs 12 hits). Although if top 10 predictions were considered, the scoring function according to the invention outperforms ZRANK (32 vs 26 hits). Excluding homologs from the training set results in a slight improvement of the results (Table 5).
Table 5: ZDock benchmark 3.0 results. Three scoring functions are compared, ZDock, ZRank, and ConvexPP. Proteins homologous to the ones in the training set are shown in bold. Absence of hits among the first 2000 predictions is shown with hyphens. The IRMSD parameter represents the quality of a pose, which is the RMSD of the backbone atoms of the ligand after the receptors in the native and the decoy conformations have been optimally superimposed. The IRMSD parameter is the RMSD of the interface region between the predicted and native structures after optimal superimposition of the backbone atoms of the interface residues. A residue is considered as the interface residue if any atom of this residue is within 10 A from the other partner. The fnat parameter is the ratio of the number of native residue-residue contacts in the predicted complex to the number of residue-residue contacts in the crystal structure.
Figure imgf000040_0001
Figure imgf000041_0001
Figure imgf000042_0001
Figure 13 shows ROC curves (success rate versus the number of top predictions considered). One may see that ConvexPP scoring functions outperform ZRANK and ZDOCK if the number of considered predictions is more than eight.
12.2 - Rosetta Benchmark
Baker, Gray et al generated the Rosetta benchmark using 54 complexes of the protein-protein docking benchmark version 0.018 using a flexible docking protocol, which is a part of the RosettaDock suite19. The first step in the protocol is the random translation and rotation of one of the proteins constituting the complex. Afterwards, the side chain is optimized simultaneously with the rigid body displacement. Finally, the full-atom minimization is done to refine the conformation. For each complex, Baker and Gray generated 1000 decoys following the described protocol. The success rate of RosettaDock was calculated using the same quality criteria as in Critical Assessment of PRediction of Interactions20. The Rosetta benchmark contains 5 complexes homologous to the ones present in the training set. Therefore the scoring function according to the invention was trained using training sets with and without these homologs. Table 6 compares the results of RosettaDock19, ITScore-PP13 and our ConvexPP scoring functions.
Table 6 shows that the potentials according to the invention significantly improve
Topi prediction rate over ITScore-PP and RosettaDock scoring functions while also outperforming them according to the other criteria (Topi and quality 1 eic). The percentage of the structures for which the first acceptable prediction was ranked within the top predictions was computed for each complex and plotted on Fig. 14. According to the plot, the scoring function of the invention (ConvexPP) outputs the plausible structure (quality >3) for more complexes than ITScore-PP and RosettaDock. Unlike the results on the ZDock benchmark, the results on the Rosetta unbound benchmark slightly decrease when homologous complexes were removed from the training set. Among the prediction quality criteria it is the number of predicted high quality structures that changed the most. On the other hand Topi prediction rate stayed almost the same. This observation means that the number of predicted high-quality structures is amenable to overfitting. Therefore unlike the Topi criterion, it can not serve as a reliable measure of a scoring function predictive power.
Table 6: Rosetta unbound benchmark results. Proteins homologous to the ones in the training set are shown in bold. The LRMSD parameter represents the quality of a pose, which is the RMSD of the backbone atoms of the ligand after the receptors in the native and the decoy conformations have been optimally superimposed. The IRMSD parameter is the RMSD of the interface region between the predicted and native structures after optimal superimposition of the backbone atoms of the interface residues. A residue is considered as the interface residue if any atom of this residue is within 1 0 A from the other partner. The fnat parameter is the ratio of the number of native residue-residue contacts in the predicted complex to the number of residue-residue contacts in the crystal structure. To assign the quality for the docking predictions, we use the criterion from Critical Assessment of PRediction of Interactions (CAPRI).
Figure imgf000044_0001
Figure imgf000045_0001
Embodiment 1.- A method for modeling the geometric structure of the interface of Receptor-Ligand complexes, wherein a first chemical molecule defined as Receptor and a second chemical molecule defined as Ligand, wherein said method comprises the following steps wherein at least one of them is implemented or assisted by computer:
(a) providing a set of Receptors and Ligands from at least one computer database, wherein Receptor-Ligand complexes present an interface comprising different atom types, wherein atom type k is located on the Receptor and atom type I is located on the Ligand interact, k and I varying depending on the atom type;
(b) selecting atoms from at the Receptor-Ligand complexes interface of said Receptors and Ligands;
(c) assigning to each selected atoms an atom type among k and I;
(d) providing for Receptor-Ligand complexes the distances between an atom i of a
Figure imgf000046_0006
specific atom type k of the Receptor and an atom j of a specific atom type I of the Ligand, wherein i index runs over specific atoms among atom type k, and wherein j index runs over specific atoms among atom type I ;
(e) optionally repeating step (c) for all or other atoms types k and I;
(f) assigning the distances ry as a function of atom types; and
(g) providing the modeling of the geometric structure of the interface of Receptor- Ligand complexes as a function of distances ry. Embodiment 2.- The method of embodiment 1 , wherein said modeling of the geometric structure of the interface of Receptor-Ligand complexes takes into account inaccuracies in the determination of distances ry.
Embodiment 3.- The method of embodiment 1 , wherein the modeling of the geometric structure of the interface of Receptor-Ligand complexes as a function of distances ry. is defined by the number densities
Figure imgf000046_0005
wherein said number densities is defined as:
Figure imgf000046_0002
Figure imgf000046_0001
wherein each distance distribution is represented by a Gaussian centered at , with the constant variance of σ2, and wherein the distance is smaller than a determined
Figure imgf000046_0003
cutoff distance rmax.
Embodiment 4.- A method for generating virtual Non-Native Receptor-Ligand complexes, wherein said method comprises the following steps wherein at least one of them is implemented or assisted by computer:
(a) providing a set of Native Receptor-Ligand complexes from at least one
Figure imgf000046_0004
computer database, wherein Receptor-Ligand complexes present an interface wherein site k of the Receptor and site I of the Ligand interact; (b) generating D Non-Native Receptor-Ligand complexes
Figure imgf000047_0006
wherein j index runs over generated decoys and D represents the total number of Non- Native Receptor-Ligand complexes generated, wherein Non-Native Receptor-Ligand complexes are generated by moving spatially the Ligand relative to the Receptor or by local deformation along spatial directions from the Native Receptor-Ligand complexes.
Embodiment 5.- The method of embodiment 4, wherein Non-Native Receptor-Ligand complexes are generated by rolling the Ligand over the surface of the Receptor.
Figure imgf000047_0002
Embodiment 6.- The method of embodiment 4, wherein Non-Native Receptor-Ligand complexes
Figure imgf000047_0003
are generated by the following steps:
- Considering a Ligand as a rigid body,
- Rotating the Ligand about one or more rotational axes, and
- Translating the Ligand along the coordinate axes.
Embodiment 7.- The method of embodiment 6, wherein Non-Native Receptor-Ligand complexes pjlonnat t are generated by linear combinations of modes {v,} as follows::
Figure imgf000047_0001
where are the coordinate vectors corresponding to the native and
Figure imgf000047_0004
non-native conformations, respectively, n is the random weight for each mode ranging from -1 to 1 , and ω, is the frequency of the mode
Figure imgf000047_0005
Embodiment 8. A method for modeling the interaction between a Receptor and a Ligand in Receptor-Ligand complexes, wherein said method comprises the following steps wherein at least one of them is implemented or assisted by computer:
(a) providing a set of Receptors and Ligands from at least one computer database;
(b) assigning to each Receptor-Ligand complex a specific structure vector x which is a mathematical vector representing the specific geometric structure of the interface between a Receptor and a Ligand in a specific Receptor-Ligand complex;
(c) computing a linear convex scoring function F as a function of all specific structure vectors x or of vector X which is the concatenation of all vectors x thereof, preferably said linear convex scoring function F being also a function of a scoring vector w; (d) projecting said scoring function F in orthogonal polynomial subspaces; thereby modeling the interaction between a Receptor and a Ligand in Receptor-Ligand complexes. Embodiment 9. A method for determining a scoring vector w which is a mathematical vector quantifying and/or qualifying the interaction of a geometric structure of the interface of a Receptor-Ligand complex, wherein Receptor-Ligand complexes present an interface in interaction, wherein said interaction is in need for quantification and/or qualification, wherein said method comprises the following steps wherein at least one of them is implemented or assisted by computer:
(a) providing a set of Receptors and Ligands from at least one computer database;
(b) assigning to each geometric structure of an interface of a Receptor-Ligand complex, a specific structure vector x which is a mathematical vector representing the specific geometric structure of the interface;
(c) computing a linear convex scoring function F as a function of all specific structure vectors x and scoring vector w;
(e) projecting said scoring function F in orthogonal polynomial subspaces;
(f) formulating a convex optimization problem;
(g) solving the convex optimization problem thereby determining a scoring vector w.
Embodiment 10.- The method of embodiment 9, wherein said step (a) comprises providing Native Receptor-Ligand complex and Non-native Receptor-Ligand
Figure imgf000048_0002
complexes wherein /' index runs over different protein complexes.
Figure imgf000048_0001
Embodiment 1 1 .- The method of embodiment 9, wherein said step (b) comprises implementing a method as defined by any one of embodiments 1 to 3.
Embodiment 12.- The method of embodiment 9, wherein in step (e) orthogonal polynomial subspaces are Rectangular, Legendre, Laguerre or Fourier orthogonal bases.
Embodiment 13.- The method of embodiment 9, wherein step (f) comprises using the artificially generated noise applied to the original input data wherein said noise is represented by the Gaussian distance distribution of the input data having a variance σ where σ is constant and does not depend on the atom type, and can be thought as a Gaussian filter applied to the input data if the latter is represented as a 1 D signal. Embodiment 14.- The method of embodiment 9, wherein step (f) comprises formulating a convex optimization problem so as to minimize the convex function. Embodiment 15.- The method of any one of embodiments 9 to 14, wherein said method further comprises finding the scoring vector w.
Embodiment 16.- A method for determining the binding affinity or binding free energy of a position of a Ligand relative to a Receptor in one or more Receptor-Ligand complexes, wherein said Receptor-Ligand complex presents an interface comprising different atom types, wherein atom type k, located on the Receptor, and atom type I, located on the Ligand, interact, k and I varying depending on the atom type, wherein said method comprises the following steps wherein at least one of them is implemented or assisted by computer:
(i) modeling the geometric structure of the interface of one or more Receptor-Ligand complexes, said modeling being as defined in any one of embodiments 1 to 7
(ii) assigning to a geometric structure of the interface of Receptor-Ligand complex, a binding affinity or binding free energy by reference to a database, optionally wherein said binding affinity or binding free energy is determined as a scalar product of the structure vector x with the scoring vector w as defined in the method of embodiment 9.
Embodiment 17.- A method for ranking the binding affinity or binding free energy of spatial positions of a Ligand relative to a Receptor in one or more Receptor-Ligand complexes, wherein said method comprises the following steps wherein at least one of them is implemented or assisted by computer:
(i) implementing the method of embodiment 16 to determine the binding affinity or binding free energy of two or more spatial positions of a Ligand relative to a Receptor in one or more Receptor-Ligand complexes,
(ii) ranking spatial positions of a Ligand relative to a Receptor based on said binding affinity or binding free energy by providing a strict relationship between a set of spatial positions such that, for any two positions, the first is either ranked higher, lower or equal to the second position if the binding energy of the first position is smaller, equal or higher than the energy of the second position, respectively. Embodiment 18.- The method of embodiment 17, wherein the best spatial position of a Ligand relative to a Receptor in one or more Receptor-Ligand complexes is determined based on the ranking of said binding affinity or binding free energy.
Embodiment 19. The method of embodiment 17, wherein the best binding affinity or free binding energy among several Receptor-Ligand complexes is determined based on the ranking of said binding affinity or binding free energy.
Bibliography:
I . Cheng, T., Li, X., Li, Y., Liu, Z., & Wang, R. 2009, Journal of Chemical Information and Modeling, 49, 1079-1093.
2. Rarey, M., Kramer, B., Lengauer, T., & Kiebe, G. 1996, Journal of Molecular
Biology. 261 , 470-489.
3. Tanaka, S. & Scheraga, H. A. 1976, Macromolecules, 9, 945-950.
4. Miyazawa, S. & Jernigan, R. L. 1985, Macromolecules, 18, 534-552.
5. Sippl, M. J. 1990, Journal of Molecular Biology, 213, 859-883.
6. Clark, M., Cramer, R. D., & Van Opdenbosch, N. 1989, Journal of Computational
Chemistry, 10, 982-1012.
7. Neudert, G. & Klebe, G. 201 1 , Bioinformatics (Oxford, England), 27, 1021 .
8. Ritchie, D. W. & Kemp, G. J. L. 2000, Proteins: Structure, Function, and Bioinformatics, 39, 178-194.
9. OLBoyle, N. M., Banck, M., James, C. A., Morley, C, Vandermeersch, T., &
Hutchison, G. R. 201 1 , Journal of Cheminformatics, 3, 33.
10. Vapnik, V. 1999, The nature of statistical learning theory.
I I . Cortes, C. & Vapnik, V. 1995, Machine Learning, 20, 273-297.
12. Burges, C. J. C. & Crisp, D. J. 2000, in Advances in Neural Information Processing Systems, Vol. 12, 223-229.
13. Huang, S. Y. & Zou, X. 2008, Proteins: Structure, Function, and Bioinformatics, 72, 557-579.
14. Wang, R., Fang, X., Lu, Y., & Wang, S. 2004, Journal of Medicinal Chemistry, 47, 2977-2980.
15. Berman, H. M., Westbrook, J., Feng, Z., Gilliland, G., Bhat, T., Weissig, H.,
Shindyaiov, I. N., & Bourne, P. E. 2000, Nucleic Acids Research, 28, 235-242.
16. Neudert, G. & Klebe, G. 201 1 , Journal of Chemical Information and Modeling, 51 , 2731-45.
17. Hwang, H., Pierce, B., Mintseris, J., Janin, J., & Weng, Z. 2008, Proteins:
Structure, Function, and Bioinformatics, 73, 705-709.
18. Chen, R. & Weng, Z. 2002, Proteins: Structure, Function, and Bioinformatics, 47, 281-294.
19. Gray, J. J., Moughon, S., Wang, C, Schueler-Furman, O., Kuhlman, B., Rohl, C.
A„ & Baker, D. 2003, Journal of Molecular Biology, 331 , 281-300.
20. Mendez, R., Leplae, R., De Maria, L., & Wodak, S. J. 2003, Proteins: Structure,
Function, and Bioinformatics, 52, 51-67.

Claims

1 . A method for determining a scoring vector w which is a mathematical vector quantifying and/or qualifying the interaction of a geometric structure of the interface of a Receptor-Ligand complex, wherein Receptor-Ligand complexes present an interface in interaction, wherein said interaction is in need for quantification and/or qualification, wherein said method comprises the following steps wherein at least one of them is implemented or assisted by computer:
(a) providing a set of Receptors and Ligands from at least one computer database;
(b) assigning to each geometric structure of an interface of a Receptor-Ligand complex, a specific structure vector x which is a mathematical vector representing the specific geometric structure of the interface;
(c) computing a linear convex scoring function F as a function of all specific structure vectors x and scoring vector w;
(e) projecting said scoring function F in orthogonal polynomial subspaces;
(f) formulating a convex optimization problem;
(g) solving the convex optimization problem thereby determining a scoring vector w.
2 - The method of claim 1 , wherein said step (a) comprises providing Native
Receptor-Ligand complex and Non-native Receptor-Ligand complexes
Figure imgf000052_0001
Figure imgf000052_0002
wherein /' index runs over different protein complexes.
3.- The method of claim 1 , wherein in said step (a) Receptor-Ligand complexes present an interface comprising different atom types, wherein atom type k is located on the Receptor and atom type I is located on the Ligand interact, k and I varying depending on the atom type, and wherein said step (b) comprises implementing a method for modeling the geometric structure of the interface of the Receptor-Ligand complexes, wherein a first chemical molecule is defined as the Receptor and a second chemical molecule is defined as the Ligand, comprising:
(b1 ) selecting atoms from the Receptor-Ligand complexes interface of said
Receptors and Ligands;
(b2) assigning to each selected atoms an atom type among k and I;
(b3) providing for Receptor-Ligand complexes the distances r,j between an atom i of a specific atom type k of the Receptor and an atom j of a specific atom type I of the Ligand, wherein i index runs over specific atoms among atom type k, and wherein j index runs over specific atoms among atom type I ; (b4) optionally repeating step (b2) for all or other atoms types k and I;
(b5) assigning the distances r,j as a function of atom types; and
(b6) providing the modeling of the geometric structure of the interface of Receptor- Ligand complexes as a function of distances
Figure imgf000053_0006
4. The method of claim 3, wherein said modeling of the geometric structure of the interface of Receptor-Ligand complexes takes into account inaccuracies in the determination of distances r,j.
5. The method of claim 3, wherein the modeling of the geometric structure of the interface of Receptor-Ligand complexes as a function of distances is defined by the
Figure imgf000053_0004
number densities
Figure imgf000053_0007
wherein said number densities
Figure imgf000053_0002
) is defined as:
Figure imgf000053_0001
wherein each distance distribution is represented by a Gaussian centered at with
Figure imgf000053_0005
the constant variance of
Figure imgf000053_0008
and wherein the distance is smaller than a determined
Figure imgf000053_0003
cutoff distance
Figure imgf000053_0009
6. - The method of claim 1 , wherein in step (e) orthogonal polynomial subspaces are Rectangular, Legendre, Laguerre or Fourier orthogonal bases.
7. - The method of claim 1 , wherein step (f) comprises using the artificially generated noise applied to the original input data wherein said noise is represented by the Gaussian distance distribution of the input data having a variance σ where σ is constant and does not depend on the atom type, and can be thought as a Gaussian filter applied to the input data if the latter is represented as a 1 D signal.
8. - The method of claim 1 , wherein step (f) comprises formulating a convex optimization problem so as to minimize the convex function.
9.- The method of any one of claims 1 to 8, wherein said method further comprises finding the scoring vector w.
PCT/EP2015/077506 2014-11-25 2015-11-24 Interaction parameters for the input set of molecular structures Ceased WO2016083376A1 (en)

Priority Applications (4)

Application Number Priority Date Filing Date Title
JP2017527917A JP2018503171A (en) 2014-11-25 2015-11-24 Interaction parameters for an input set of molecular structures
CA2968612A CA2968612C (en) 2014-11-25 2015-11-24 Interaction parameters for the input set of molecular structures
CN201580074108.8A CN107209813B (en) 2014-11-25 2015-11-24 Interaction parameters for the input set of molecular structures
US15/529,774 US20170323049A1 (en) 2014-11-25 2015-11-24 Interaction parameters for the input set of molecular structures

Applications Claiming Priority (2)

Application Number Priority Date Filing Date Title
EP14306882.3A EP3026588A1 (en) 2014-11-25 2014-11-25 interaction parameters for the input set of molecular structures
EP14306882.3 2014-11-25

Publications (1)

Publication Number Publication Date
WO2016083376A1 true WO2016083376A1 (en) 2016-06-02

Family

ID=52016545

Family Applications (1)

Application Number Title Priority Date Filing Date
PCT/EP2015/077506 Ceased WO2016083376A1 (en) 2014-11-25 2015-11-24 Interaction parameters for the input set of molecular structures

Country Status (6)

Country Link
US (1) US20170323049A1 (en)
EP (1) EP3026588A1 (en)
JP (1) JP2018503171A (en)
CN (1) CN107209813B (en)
CA (1) CA2968612C (en)
WO (1) WO2016083376A1 (en)

Families Citing this family (16)

* Cited by examiner, † Cited by third party
Publication number Priority date Publication date Assignee Title
EP4657446A3 (en) * 2014-11-14 2026-03-04 D.E. Shaw Research, LLC Suppressing interaction between bonded particles
SG11201609625WA (en) * 2015-12-04 2017-07-28 Shenzhen Inst Of Adv Tech Cas Optimization method and system for supervised learning under tensor mode
CN108763852B (en) * 2018-05-09 2021-06-15 深圳晶泰科技有限公司 Automated conformational analysis method of drug-like organic molecules
US12293809B2 (en) * 2019-08-23 2025-05-06 Insilico Medicine Ip Limited Workflow for generating compounds with biological activity against a specific biological target
CN111402964B (en) * 2020-03-19 2023-07-25 西南医科大学 A Molecular Conformation Search Method Based on Hybrid Fireworks Algorithm
CN111613275B (en) * 2020-05-26 2021-03-16 中国海洋大学 A RMSD-based Multi-feature Analysis Method for Pharmacokinetics Results
CN111863141B (en) * 2020-07-08 2022-06-10 深圳晶泰科技有限公司 Molecular force field multi-target fitting algorithm library system and workflow method
US11367006B1 (en) 2020-12-16 2022-06-21 Ro5 Inc. Toxic substructure extraction using clustering and scaffold extraction
CN112685947B (en) * 2021-01-19 2022-12-16 广州科技贸易职业学院 Method and device for optimizing parameters of sheet material resilience model, terminal and storage medium
CN113707229B (en) * 2021-08-13 2023-06-09 湖北工业大学 Sulfur hexafluoride buffer gas selection method based on electronic localization function
CN114520022B (en) * 2022-02-17 2025-06-10 深圳北鲲云计算有限公司 A GPU parallel calculation method, device, system and medium for molecular similarity
CN116994660B (en) * 2022-08-05 2025-12-12 腾讯科技(深圳)有限公司 Methods, apparatus, equipment and storage media for generating complex structures
CN115910212A (en) * 2022-09-30 2023-04-04 湖南工业大学 A method for analyzing cellular communication mediated by ligand-receptor interactions
CN115938469B (en) * 2022-11-04 2025-11-28 深圳大学 Protein-protein docking method and system based on multi-region division
CN117289272B (en) * 2023-09-15 2024-09-03 西安电子科技大学 Regularized synthetic aperture radar imaging method based on non-convex sparse optimization
CN118197444B (en) * 2024-03-28 2025-06-03 中南大学 Reconstruction method, system, equipment and medium of atomic interaction potential function

Citations (4)

* Cited by examiner, † Cited by third party
Publication number Priority date Publication date Assignee Title
WO2002016930A2 (en) * 2000-08-21 2002-02-28 Ribotargets Limited Computer-based modelling of ligand/receptor structures
WO2006099178A2 (en) * 2005-03-11 2006-09-21 Schrodinger, Llc Predictive scoring function for estimating binding affinity
US20090006040A1 (en) * 2007-05-24 2009-01-01 Peter Hrnciar Systems and Methods for Representing Protein Binding Sites and Identifying Molecules with Biological Activity
US20130166261A1 (en) * 2011-12-23 2013-06-27 Zhiqiang Yan Specificity quantification of biomolecular recognition and its application for drug discovery

Family Cites Families (5)

* Cited by examiner, † Cited by third party
Publication number Priority date Publication date Assignee Title
US5642292A (en) * 1992-03-27 1997-06-24 Akiko Itai Methods for searching stable docking models of biopolymer-ligand molecule complex
JP3843260B2 (en) * 2001-01-19 2006-11-08 株式会社インシリコサイエンス Protein three-dimensional structure construction method including inductive adaptation and use thereof
US7801685B2 (en) * 2004-08-19 2010-09-21 Drug Design Methodologies, Llc System and method for improved computer drug design
JP2005018447A (en) * 2003-06-26 2005-01-20 Ryoka Systems Inc Method for searching receptor-ligand stable complex structure
JP5011689B2 (en) * 2005-09-15 2012-08-29 日本電気株式会社 Molecular simulation method and apparatus

Patent Citations (4)

* Cited by examiner, † Cited by third party
Publication number Priority date Publication date Assignee Title
WO2002016930A2 (en) * 2000-08-21 2002-02-28 Ribotargets Limited Computer-based modelling of ligand/receptor structures
WO2006099178A2 (en) * 2005-03-11 2006-09-21 Schrodinger, Llc Predictive scoring function for estimating binding affinity
US20090006040A1 (en) * 2007-05-24 2009-01-01 Peter Hrnciar Systems and Methods for Representing Protein Binding Sites and Identifying Molecules with Biological Activity
US20130166261A1 (en) * 2011-12-23 2013-06-27 Zhiqiang Yan Specificity quantification of biomolecular recognition and its application for drug discovery

Non-Patent Citations (23)

* Cited by examiner, † Cited by third party
Title
BERMAN, H. M.; WESTBROOK, J.; FENG, Z.; GILLILAND, G.; BHAT, T.; WEISSIG, H.; SHINDYALOV, I. N.; BOURNE, P. E., NUCLEIC ACIDS RESEARCH, vol. 28, 2000, pages 235 - 242
BURGES, C. J. C.; CRISP, D. J., ADVANCES IN NEURAL INFORMATION PROCESSING SYSTEMS, vol. 12, 2000, pages 223 - 229
CHEN, R.; WENG, Z., PROTEINS: STRUCTURE, FUNCTION, AND BIOINFORMATICS, vol. 47, 2002, pages 281 - 294
CHENG, T.; LI, X.; LI, Y.; LIU, Z.; WANG, R., JOURNAL OF CHEMICAL INFORMATION AND MODELING, vol. 49, 2009, pages 1079 - 1093
CLARK, M.; CRAMER, R. D.; VAN OPDENBOSCH, N., JOURNAL OF COMPUTATIONAL CHEMISTRY, vol. 10, 1989, pages 982 - 1012
CORTES, C.; VAPNIK, V., MACHINE LEARNING, vol. 20, 1995, pages 273 - 297
GRAY, J. J.; MOUGHON, S.; WANG, C.; SCHUELER-FURMAN, O.; KUHLMAN, B.; ROHL, C. A.; BAKER, D., JOURNAL OF MOLECULAR BIOLOGY, vol. 331, 2003, pages 281 - 300
GRUDININ S. ET AL: "Predicting Binding Poses and Affinities in the CSAR 2013-2014 Docking Exercises Using the Knowledge-Based Convex-PL Potential", JOURNAL OF CHEMICAL INFORMATION AND MODELING, 16 November 2015 (2015-11-16), US, XP055237174, ISSN: 1549-9596, DOI: 10.1021/acs.jcim.5b00339 *
HUANG, S. Y.; ZOU, X., STRUCTURE, FUNCTION, AND BIOINFORMATICS, vol. 72, 2008, pages 557 - 579
HWANG, H.; PIERCE, B.; MINTSERIS, J.; JANIN, J.; WENG, Z., PROTEINS: STRUCTURE, FUNCTION, AND BIOINFORMATICS, vol. 73, 2008, pages 705 - 709
MENDEZ, R.; LEPLAE, R.; DE MARIA, L.; WODAK, S. J., PROTEINS: STRUCTURE, FUNCTION, AND BIOINFORMATICS, vol. 52, 2003, pages 51 - 67
MIYAZAWA, S.; JERNIGAN, R. L., MACROMOLECULES, vol. 18, 1985, pages 534 - 552
NEUDERT, G.; KLEBE, G., BIOINFORMATICS, vol. 27, 2011, pages 1021
NEUDERT, G.; KLEBE, G., JOURNAL OF CHEMICAL INFORMATION AND MODELING, vol. 51, 2011, pages 2731 - 45
OLBOYLE, N. M.; BANCK, M.; JAMES, C. A.; MORLEY, C.; VANDERMEERSCH, T.; HUTCHISON, G. R., JOURNAL OF CHEMINFORMATICS, vol. 3, 2011, pages 33
PASCHALIDIS I. CH. ET AL: "SDU: A Semidefinite Programming-Based Underestimation Method for Stochastic Global Optimization in Protein Docking", IEEE TRANSACTIONS ON AUTOMATIC CONTROL, IEEE SERVICE CENTER, LOS ALAMITOS, CA, US, vol. 51, no. 4, 1 April 2007 (2007-04-01), pages 664 - 676, XP011176933, ISSN: 0018-9286 *
RAREY, M.; KRAMER, B.; LENGAUER, T.; KLEBE, G., JOURNAL OF MOLECULAR BIOLOGY, vol. 261, 1996, pages 470 - 489
RITCHIE, D. W.; KEMP, G. J. L., PROTEINS: STRUCTURE, FUNCTION, AND BIOINFORMATICS, vol. 39, 2000, pages 178 - 194
SHERMAN W. ET AL: "Novel Procedure for Modeling Ligand/Receptor Induced Fit Effects", JOURNAL OF MEDICINAL CHEMISTRY, vol. 49, no. 2, 23 December 2005 (2005-12-23), pages 534 - 553, XP055186996, ISSN: 0022-2623, DOI: 10.1021/jm050540c *
SIPPL, M. J., JOURNAL OF MOLECULAR BIOLOGY, vol. 213, 1990, pages 859 - 883
TANAKA, S.; SCHERAGA, H. A., MACROMOLECULES, vol. 9, 1976, pages 945 - 950
VAPNIK, V., THE NATURE OF STATISTICAL LEARNING THEORY, 1999
WANG, R.; FANG, X.; LU, Y.; WANG, S., JOURNAL OF MEDICINAL CHEMISTRY, vol. 47, 2004, pages 2977 - 2980

Also Published As

Publication number Publication date
EP3026588A1 (en) 2016-06-01
JP2018503171A (en) 2018-02-01
CA2968612C (en) 2023-03-07
CN107209813B (en) 2020-12-22
US20170323049A1 (en) 2017-11-09
CN107209813A (en) 2017-09-26
CA2968612A1 (en) 2016-06-02

Similar Documents

Publication Publication Date Title
CA2968612C (en) Interaction parameters for the input set of molecular structures
Wei et al. A cascade random forests algorithm for predicting protein-protein interaction sites
Venkatraman et al. Flexible protein docking refinement using pose‐dependent normal mode analysis
Dodd et al. Simulation-based methods for model building and refinement in cryoelectron microscopy
US20250014683A1 (en) Systems and methods for polymer sequence prediction
Diao et al. Using pseudo amino acid composition to predict transmembrane regions in protein: cellular automata and Lempel-Ziv complexity
Anishchenko et al. Contact potential for structure prediction of proteins and protein complexes from Potts model
Morehead et al. Deep learning for protein-ligand docking: Are we there yet?
Masters et al. Deep learning model for flexible and efficient protein-ligand docking
Liu et al. Backdiff: a diffusion model for generalized transferable protein backmapping
Dicks et al. Exploiting sequence-dependent rotamer information in global optimization of proteins
US20020072864A1 (en) Computer-based method for macromolecular engineering and design
Postic et al. Representations of protein structure for exploring the conformational space: A speed–accuracy trade-off
Xiao et al. Statistical analysis, investigation, and prediction of the water positions in the binding sites of proteins
Xiang et al. Generating Dynamic Structures Through Physics‐Based Sampling of Predicted Inter‐Residue Geometries
Wang et al. Integrating bonded and nonbonded potentials in the knowledge-based scoring function for protein structure prediction
Vásquez-Pérez et al. A Practical Algorithm to Solve the Near-Congruence Problem for Rigid Molecules and Clusters
US20260112455A1 (en) Systems and methods for discovering compounds using interaction features
Bhattacharya et al. Protein structure refinement by iterative fragment exchange
Khanal Identification of RNA binding proteins and RNA binding residues using effective machine learning techniques
Ji Improving protein structure prediction using amino acid contact & distance prediction
Singh Detection of Cis-Trans Conformation in Protein Structure using Deep Learning Neural Network Techniques
Karroucha et al. Machine learning for RNA-targeting drug design
Tanemura AI Accelerated Collisional Cross Section Prediction for High Throughput Metabolite Identification
Takahashi et al. A Structure-Based Drug Design Framework using Graph Neural Networks and Molecular Dynamics Simulation

Legal Events

Date Code Title Description
121 Ep: the epo has been informed by wipo that ep was designated in this application

Ref document number: 15800795

Country of ref document: EP

Kind code of ref document: A1

ENP Entry into the national phase

Ref document number: 2968612

Country of ref document: CA

ENP Entry into the national phase

Ref document number: 2017527917

Country of ref document: JP

Kind code of ref document: A

WWE Wipo information: entry into national phase

Ref document number: 15529774

Country of ref document: US

NENP Non-entry into the national phase

Ref country code: DE

122 Ep: pct application non-entry in european phase

Ref document number: 15800795

Country of ref document: EP

Kind code of ref document: A1