WO2014097752A1 - 価値可視化装置、価値可視化方法、及びコンピュータ読み取り可能な記録媒体 - Google Patents
価値可視化装置、価値可視化方法、及びコンピュータ読み取り可能な記録媒体 Download PDFInfo
- Publication number
- WO2014097752A1 WO2014097752A1 PCT/JP2013/079485 JP2013079485W WO2014097752A1 WO 2014097752 A1 WO2014097752 A1 WO 2014097752A1 JP 2013079485 W JP2013079485 W JP 2013079485W WO 2014097752 A1 WO2014097752 A1 WO 2014097752A1
- Authority
- WO
- WIPO (PCT)
- Prior art keywords
- index
- value
- data
- organization
- text data
- Prior art date
- Legal status (The legal status is an assumption and is not a legal conclusion. Google has not performed a legal analysis and makes no representation as to the accuracy of the status listed.)
- Ceased
Links
Images



Classifications
-
- G—PHYSICS
- G06—COMPUTING OR CALCULATING; COUNTING
- G06Q—INFORMATION AND COMMUNICATION TECHNOLOGY [ICT] SPECIALLY ADAPTED FOR ADMINISTRATIVE, COMMERCIAL, FINANCIAL, MANAGERIAL OR SUPERVISORY PURPOSES; SYSTEMS OR METHODS SPECIALLY ADAPTED FOR ADMINISTRATIVE, COMMERCIAL, FINANCIAL, MANAGERIAL OR SUPERVISORY PURPOSES, NOT OTHERWISE PROVIDED FOR
- G06Q10/00—Administration; Management
- G06Q10/06—Resources, workflows, human or project management; Enterprise or organisation planning; Enterprise or organisation modelling
Definitions
- the present invention relates to a value visualization device, a value visualization method, and a computer-readable recording medium on which a program for realizing the value is recorded so that a customer can visually grasp the value of an organization such as a company.
- CSR Corporate Social Responsibility
- CSR is attracting attention as an index when a customer selects a company, and also as an index when a customer purchases a product. For this reason, many companies incorporate CSR philosophies and behaviors in their business activities, create CSR reports to report the results to customers and consumers, and publish them on their websites. Yes.
- a value visualization apparatus is an apparatus for visualizing the value of an organization having a hierarchical structure, For each member of the organization, an index acquisition unit that acquires an index representing the activity status of the member; An aggregation processing unit that aggregates the acquired indices of each member for each hierarchy, and generates display data that enables display of the aggregation results for each hierarchy and the indices of each member on the screen; It is characterized by having.
- a value visualization method is a method for visualizing the value of an organization having a hierarchical structure, (A) For each member of the organization, obtaining an index representing the activity status of the member; (B) The index of each member acquired in the step (a) is totaled for each layer, and display data that enables the display of the tabulated result and the index of each member on the screen is generated. Step, It is characterized by having.
- the internal state of an organization such as a company can be visualized, and thereby the customer can easily grasp the value of the organization.
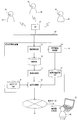
- FIG. 1 is a block diagram showing the configuration of the value visualization apparatus according to Embodiment 1 of the present invention.
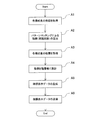
- FIG. 2 is a flowchart showing an operation during index display data generation processing in the value visualization apparatus according to Embodiment 1 of the present invention.
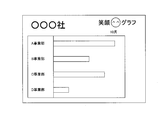
- FIG. 3 is a diagram showing an example when an index is displayed for each business division in the first embodiment of the present invention.
- FIG. 4 is a diagram showing an example when an index is displayed for each department of the company in the first embodiment of the present invention.
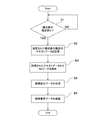
- FIG. 5 is a flowchart showing the operation at the time of the process of generating the history display data in the value visualization apparatus according to Embodiment 1 of the present invention.
- FIG. 6 is a diagram showing an example of the history of member activities displayed in the first embodiment of the present invention.
- FIG. 7 is a diagram showing an example of changes in member indices displayed in the first embodiment of the present invention.
- FIG. 8 is a block diagram showing a configuration of the value visualization apparatus according to Embodiment 2 of the present invention.
- FIG. 9 is a flowchart showing an operation during index display data generation processing in the value visualization apparatus according to Embodiment 2 of the present invention.
- FIG. 10 is a flowchart showing an operation during the process of generating the history display data in the value visualization device according to the second exemplary embodiment of the present invention.
- FIG. 11 is a block diagram illustrating an example of a computer that implements the value visualization apparatus according to Embodiments 1 and 2 of the present invention.
- Embodiment 1 a value visualization device, a value visualization method, and a program according to Embodiment 1 of the present invention will be described with reference to FIGS.
- FIG. 1 is a block diagram showing the configuration of the value visualization apparatus according to Embodiment 1 of the present invention.
- 1 is a device for visualizing the value of an organization having a hierarchical structure.
- organizations having a hierarchical structure include companies, government offices, and various organizations. Taking a company as an example, it is divided into divisions such as divisions, departments, and sections.
- the value visualization device 10 includes an index acquisition unit 11 and a totalization processing unit 12.
- the index acquisition unit 11 acquires an index representing the activity status of each member for each member of the organization.
- the tabulation processing unit 12 tabulates the obtained index of each member 30 for each layer, and displays display data (hereinafter referred to as “index display”) that enables the display of the tabulated result for each layer and the index of each member. Data ”)).
- the generated index display data is sent to the terminal device 51 of the user 50 via the network 40 such as the Internet, the aggregated index is displayed on the screen of the terminal device 51.
- the network 40 such as the Internet
- the value visualization apparatus 10 when used, the activity status of each member of the organization such as a company is acquired as an index, so the status inside the organization is visualized. As a result, the user 50 who is a customer of the company can easily grasp the value of the organization such as the company.
- the value visualization apparatus 10 further includes an index calculation unit 13, a speech recognition processing unit 14, an index database 15, and an NG word in addition to the index acquisition unit 11 and the aggregation processing unit 12 described above.
- a database 16 and a speech recognition result database 17 are provided.
- the index calculation unit 13 acquires the utterance of each member 30 for each member 30 and whether or not a pattern representing a preset laughter is included in the change in the sound level of the acquired utterance And an index is calculated based on the determination result. In addition, the index calculation unit 13 registers the calculated index in the index database 15 for each member 30.
- each member 30 of the organization wears a microphone 31. Then, the speech of the member 30 picked up by the microphone 31 is converted into an analog voice signal and then sent to a transmitter (not shown in FIG. 1), where it is further converted into a digital voice signal. Further, the transmitter transmits a digital audio signal to the access point 21 by wireless communication.
- the access point 21 is connected to the LAN 20 of the target organization, and transmits the digital audio signal transmitted from the transmitter of each member 30 to the value visualization device 10 via the LAN 20.
- the index calculation unit 13 identifies a change in the speech level of the utterance based on the digital speech signal from each member 30, changes in the specified speech level in the set time, and a preset speech level of the laughter It is determined whether or not the latter is included in the former. If the index calculation unit 13 determines that the latter is included in the former, the index calculation unit 13 counts the number of times it is included (that is, the number of portions that match the former in the latter), for example, This number of times is used as an index of the member 30.
- the voice recognition processing unit 14 executes voice recognition processing on the utterance of the member 30 acquired by the index calculation unit 13, specifically, on the transmitted digital voice signal, From the recognition result, text data of the speech of the member 30 is created. Further, the voice recognition processing unit 14 registers the created text data in the voice recognition result database 17 for each member 30.
- the tabulation processing unit 12 specifies the history of the activity of the specified member, Display data (hereinafter referred to as “background display data”) that enables display of the background on the screen is further generated.
- the totalization processing unit 12 accesses the speech recognition result database 17, and the utterance text of the member 30 created by the speech recognition processing unit 14 as the background of the activity of the designated member 30. Identify the data and get it. Then, the aggregation processing unit 12 generates data for displaying the text data of the member 30 on the screen of the terminal device 51 of the user 50 as the history display data.
- the tabulation processing unit 12 can generate the history display data so that the text data excluding the keyword is displayed.
- the keyword designated in advance is registered in the NG word database 16 as “NG word”.
- the NG word includes a word related to confidential matters of the organization. By preventing the NG word from being displayed in this way, leakage of confidential matters is suppressed.
- FIG. 1 is taken into consideration as appropriate.
- a value visualization method is implemented by operating the value visualization apparatus 10. Therefore, the description of the value visualization method in the first embodiment is replaced with the following description of the operation of the value visualization apparatus 10.
- FIG. 2 is a flowchart showing an operation during index display data generation processing in the value visualization apparatus according to Embodiment 1 of the present invention.
- the index calculation unit 13 acquires an utterance for each member 30 (step A1). Specifically, in step A ⁇ b> 1, the index calculation unit 13 receives a utterance digital audio signal transmitted via the access point 21. Further, after step A1, execution of voice recognition processing by the voice recognition processing unit 14 is also executed, although not shown in FIG.
- the index calculation unit 13 performs pattern matching based on the digital audio signal of each member 30, counts the number of smiles, and calculates the obtained value as an index (step A2). In addition, the index calculation unit 13 registers the calculated index in the index database 15 for each member 30.
- step A2 the index calculation unit 13 compares, for each member, the change in the sound level specified by the digital sound signal in the set time with the sound level pattern of the laughter set in advance. Thus, it is determined whether the latter is included in the former. When the latter is included in the former, the index calculation unit 13 counts the number of portions that match the latter in the former, and uses the obtained value as an index.
- the index acquisition unit 11 acquires the calculated index of each member 30 from the index database 15 (step A3).
- the tabulation processing unit 12 tabulates the index of each member 30 acquired in step A3 for each layer (step A4).
- the target organization is a company and is divided into hierarchies such as business divisions, departments, and sections
- the aggregation processing unit 12 aggregates indexes for each business department, each department, and each section.
- the aggregation is executed in units of a period such as a day unit, a week unit, or a month unit.
- the tabulation processing unit 12 generates index display data using the tabulation result for each hierarchy obtained in step A4 and the index of each member 30 (step A5). And when the user 50 calculates
- FIG. 3 is a diagram showing an example when an index is displayed for each business division in the first embodiment of the present invention.
- FIG. 4 is a diagram showing an example when an index is displayed for each department of the company in the first embodiment of the present invention.
- the user 50 can confirm the number of smiles as an index for each business unit and department by switching the screen. Although not shown, the user 50 can also check the number of smiles for each section (not shown) and for each person (not shown).
- the user 50 when an index is displayed for each business unit, the user 50 can know which business unit atmosphere of the company is good. Further, as shown in FIG. 4, when the index is displayed for each department, the user 50 can know which part of the company has a good atmosphere.
- steps A1 to A6 are executed, the internal situation of the organization is visualized, so that the user 50 who is a customer of the company can easily grasp the value of the organization such as the company.
- the aggregation processing unit 12 determines whether or not the user 50 designates the member 30 via the terminal device 51 (step B1). If no designation is made as a result of step B1, the aggregation processing unit 12 enters a standby state.
- step B2 the totalization processing unit 12 identifies the designated member 30 and acquires the text data of the utterance of the identified member from the speech recognition result database 17. (Step B2).
- the totalization processing unit 12 accesses the NG word database 16 to acquire the NG word, and excludes the NG word from the text data acquired in Step B2 (Step B3).
- the aggregation processing unit 12 generates history display data using the text data from which the NG word is excluded (step B4), and transmits this to the terminal device 51 (step B5).
- the utterance history of the designated member is displayed on the screen of the terminal device 51.
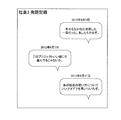
- FIG. 6 is a diagram showing an example of the history of member activities displayed in the first embodiment of the present invention.
- the index acquisition unit 11 acquires the index of the specified member 30 from the index database 15, and then the aggregation processing unit 12
- the transition of the index (smile count) of the designated member 30 is displayed on the screen of the terminal device 51 of the user 50.
- FIG. 7 is a diagram showing an example of changes in member indices displayed in the first embodiment of the present invention.
- the program in the first embodiment may be a program that causes a computer to execute steps A1 to A6 shown in FIG. 2 and steps B1 to B5 shown in FIG.
- a CPU Central Processing Unit
- the value visualization apparatus 10 and the value visualization method according to the first embodiment can be realized.
- a CPU Central Processing Unit
- the computer functions as the index acquisition unit 11, the aggregation processing unit 12, the index calculation unit 13, and the voice recognition processing unit 14, and performs processing.
- a storage device such as a hard disk provided in the computer functions as an index database 15, an NG word database 16, and a speech recognition result database 17.
- Embodiment 2 Next, a value visualization device, a value visualization method, and a program according to Embodiment 2 of the present invention will be described with reference to FIGS.
- FIG. 8 is a block diagram showing a configuration of the value visualization apparatus according to Embodiment 2 of the present invention.
- Each member 30 carries a receiver 32 that receives the infrared rays emitted from the infrared transmitter 33.
- each receiver 32 specifies the time of reception and the identifier of the infrared transmitter 33 that emitted the infrared rays.
- each receiver 32 transmits identification information including the specified time, the specified identifier, and the identifier of the member 30 carrying the receiver 30 to the access point 21.
- the access point 21 transmits the identification information transmitted from the receiver 32 of each member 30 to the value visualization device 60 via the LAN 20.
- the index calculation unit 63 first acquires each piece of identification information transmitted via the access point 21, and specifies the position of each member 30 from each piece of acquired identification information. Specifically, the index calculation unit 63 specifies the infrared transmitter 33 that is the emission source for each transmitted identification information, and includes the identifier of the installation position of the specified infrared transmitter 33 in the same identification information. The position of the member 30 is identified.
- the index calculation unit 63 associates the time and the identifier of the member 30 included in the identification information with the coordinates of the specified position, and stores these in the position information database 64 as position information. Further, the position information stored in the position information database 64 in this way represents the behavior trajectory of each member.
- the index calculation unit 63 calculates an index for each member based on the action trajectory acquired in this way. Specifically, the index calculation unit 63 sets the following indices (1) to (4) for each member based on position information for the set period for each set period (for example, for one day). Is calculated.
- the index (1) is an index indicating the degree of communication within the group, and specifically indicates how much time a certain member was close to the members of the same group.
- the index (2) is an index indicating the degree of communication outside the group, and specifically indicates how much time a certain member was close to the members of a different group.
- the index (3) is an index indicating the movement activity of the member, and indicates how much the member is moving around.
- the index (4) is an index indicating the degree of stay of the member's own seat, and indicates how long the member has stayed in his / her seat.
- index (1) and the index (2) for example, values calculated from the result of the proximity determination between the member to be calculated and another member can be used.
- the index calculation unit 63 performs proximity determination between the calculation target member and another member from the start to the end of the set period.
- the proximity determination for example, the coordinates of the member to be calculated and the coordinates of another member exist within the same area (for example, an area having a radius distance of 3 m or less) in a certain period (for example, 5 minutes).
- a certain period for example, 5 minutes.
- One example is to determine whether or not it was.
- the determination result when it is determined that they are close to each other is referred to as “proximity determination”.
- the index calculation unit 63 determines that the members are close to each other, the identifier of the member to be calculated and another member are registered in the table in which the identifier of the member 30 to which the member belongs is registered for each group. To determine whether both belong to the same group.
- the group setting method is not particularly limited.
- the group is set according to a hierarchy such as a division, department, or section. Specifically, each department belonging to a certain business department may be set as one group, or each section belonging to a certain department may be set as one group.
- the index calculation unit 63 is based on the proximity determination when belonging to the same group, and the number of people approaching, the total number of times of proximity, the total proximity time, or one per set period (for example, one day). The average proximity time of the proximity of the times is obtained, and the obtained value is set as the index (1).
- the index calculation unit 63 based on the proximity determination when the index calculation unit 63 does not belong to the same group, similarly, the number of people approaching per set period (for example, one day), the total number of proximity times, the total proximity time, Alternatively, the average proximity time of one approach is obtained, and the obtained value is used as the index (2). Note that the obtained value may be normalized, and the value after normalization may be used as an index.
- the index (3) for example, the total movement distance of the calculation target members per unit time (the total length of the trajectory), the distance moved continuously at once, the movement speed, or the statistical value of the movement speed (Average value, maximum value, minimum value, etc.) can be used.
- the index calculation unit 63 determines whether or not the member to be calculated is staying at a pre-registered position (the coordinates of the person's seat), and determines that he is staying. Only done if. In addition, when the seats of the members to be calculated are not determined in advance (free address), the index calculation unit 63 calculates the index (4) by determining that the coordinates staying for the longest time are own seats. Can do.
- the index acquisition unit 61 acquires the above-described indexes (1) to (4) as indexes indicating the activity status of each member for each member of the organization.
- the tabulation processing unit 62 tabulates the obtained indices (1) to (4) of each member 30 for each layer, and displays the index using the respective tabulated results of the indices (1) to (4) for each layer. Generate data.
- the totalization processing unit 62 specifies the history of the activity of the designated member and generates the history display data.
- the tabulation processing unit 62 accesses the position information database 64 and acquires position information of the member 30 for a certain period as the activity of the designated member 30. Then, the aggregation processing unit 62 generates history display data based on the acquired position information.
- the history display data includes data for displaying the action locus of the designated member 30 on the screen together with the layout in the office, data for displaying a graph of the movement amount of the designated member 30 for each day or hour, etc. Is mentioned.
- the aggregation processing unit 62 can set a limit on the period of position information that can be acquired from the viewpoint of preventing leakage of trade secrets. Furthermore, when displaying the behavior trajectory of the member on the screen, the tabulation processing unit 62 reduces or abstracts the displayed behavior trajectory, hides the layout in the office, etc. Can also be prevented.
- FIG. 1 is taken into consideration as appropriate.
- the value visualization method is implemented by operating the value visualization device 10. Therefore, the description of the value visualization method in the second embodiment is replaced with the following description of the operation of the value visualization device 60.
- FIG. 9 is a flowchart showing an operation during index display data generation processing in the value visualization apparatus according to Embodiment 2 of the present invention.
- the index calculation unit 63 calculates indexes (1) to (4) for each member based on the generated position information (step C2). Further, the index calculation unit 63 stores the calculated index (1) to index (4) in the index database 65 for each member.
- the index acquisition unit 61 acquires the calculated index (1) to index (4) of each member from the index database 65 (step C3).
- the tally processing unit 62 generates index display data using the tally result obtained in step C4 and the indices (1) to (4) of each member 30 (step C5). ).
- tabulation processing part 62 transmits index display data generated at Step C5 to terminal unit 51 (Step C6).
- the tabulation result for each layer and the indices (1) to (4) of each member 30 are displayed on the screen of the terminal device 51.
- Steps C4 to C6 are the same as steps A4 to A6 shown in FIG. Therefore, for example, if the target organization is a company and is divided into divisions such as divisions, divisions, and sections, in this second embodiment, as in the first embodiment, by division, division.
- the index (1) to index (4) are aggregated and displayed for each section and each section (see FIGS. 3 and 4).
- FIG. 10 is a flowchart showing an operation during the process of generating the history display data in the value visualization device according to the second exemplary embodiment of the present invention.
- the aggregation processing unit 62 determines whether or not the user 50 designates the member 30 via the terminal device 51 (step D1). If no designation is made as a result of step D1, the aggregation processing unit 62 enters a standby state.
- step D2 when the designation is made as a result of step D1, the totalization processing unit 62 identifies the designated member 30, and the position information of the identified member for a certain period (for example, from the position information database 64). 1 day, 1 week, etc.) (step D2).
- the totalization processing unit 62 generates history display data using the position information acquired in step D2 (step D3), and transmits it to the terminal device 51 (step D4). As a result, a behavior trajectory of the designated member (employee) or a graph of the movement amount of the designated member (employee) is displayed on the screen of the terminal device 51.
- steps D1 to D4 are executed, as in the first embodiment, the situation inside the organization is visualized in more detail, and the user 50 can check the situation of the members. It can be confirmed individually, making it easier to understand the value of the organization.
- the behavior trajectory of each member is acquired by the infrared transmitter 33 installed on the ceiling 34 and the receiver 32 carried by the member 30.
- the second embodiment is not limited to this example.
- the second embodiment may be, for example, a mode in which each member carries an RFID transmitter and receivers are arranged at a plurality of locations in the member's room, or at a plurality of locations in the member's room.
- a UWB (Ultra Wide Band) transmitter may be installed and each member may carry a receiver.
- the position of each member can be specified from the radio wave reception intensity at the receiver.
- the value visualization device calculates the index of each member based on the utterance or action trajectory of the member 30, but Embodiments 1 and 2 are limited to this mode. Is not to be done.
- the index may be calculated based on text data created by each member, shooting data obtained by shooting each member, and the like.
- FIG. 11 is a block diagram illustrating an example of a computer that implements the value visualization apparatus according to Embodiments 1 and 2 of the present invention.
- the CPU 111 performs various operations by developing the program (code) in the present embodiment stored in the storage device 113 in the main memory 112 and executing them in a predetermined order.
- the main memory 112 is typically a volatile storage device such as a DRAM (Dynamic Random Access Memory).
- the program in the present embodiment is provided in a state of being stored in a computer-readable recording medium 120. Note that the program in the present embodiment may be distributed on the Internet connected via the communication interface 117.
- the storage device 113 includes a hard disk drive and a semiconductor storage device such as a flash memory.
- the input interface 114 mediates data transmission between the CPU 111 and an input device 118 such as a keyboard and a mouse.
- the display controller 115 is connected to the display device 119 and controls display on the display device 119.
- the data reader / writer 116 mediates data transmission between the CPU 111 and the recording medium 120, and reads a program from the recording medium 120 and writes a processing result in the computer 110 to the recording medium 120.
- the communication interface 117 mediates data transmission between the CPU 111 and another computer.
- the recording medium 120 include general-purpose semiconductor storage devices such as CF (Compact Flash (registered trademark)) and SD (Secure Digital), magnetic storage media such as a flexible disk, or CD- Optical storage media such as ROM (Compact Disk Read Only Memory) are listed.
- CF Compact Flash
- SD Secure Digital
- magnetic storage media such as a flexible disk
- CD- Optical storage media such as ROM (Compact Disk Read Only Memory) are listed.
- the internal state of an organization such as a company can be visualized, and thereby the customer can easily grasp the value of the organization.
- the present invention is useful in the financial field, the investment field, and the like where the value evaluation of a company is required.
- SYMBOLS 10 Value visualization apparatus 11 Index acquisition part 12 Total processing part 13 Index calculation part 14 Voice recognition processing part 15 Index database 16 NG word database 17 Voice recognition result database 20 LAN DESCRIPTION OF SYMBOLS 21 Access point 30 Member 31 Microphone 40 Network 50 User 51 Terminal device 32 Receiver 33 Infrared transmitter 34 Ceiling 60 Value visualization device 61 Index acquisition part 62 Total processing part 63 Index calculation part 64 Location information database 66 Index database 110 Computer 111 CPU 112 Main Memory 113 Storage Device 114 Input Interface 115 Display Controller 116 Data Reader / Writer 117 Communication Interface 118 Input Device 119 Display Device 120 Recording Medium 121 Bus
Landscapes
- Engineering & Computer Science (AREA)
- Business, Economics & Management (AREA)
- Human Resources & Organizations (AREA)
- Strategic Management (AREA)
- Economics (AREA)
- Entrepreneurship & Innovation (AREA)
- Educational Administration (AREA)
- Game Theory and Decision Science (AREA)
- Development Economics (AREA)
- Marketing (AREA)
- Operations Research (AREA)
- Quality & Reliability (AREA)
- Tourism & Hospitality (AREA)
- Physics & Mathematics (AREA)
- General Business, Economics & Management (AREA)
- General Physics & Mathematics (AREA)
- Theoretical Computer Science (AREA)
- Management, Administration, Business Operations System, And Electronic Commerce (AREA)
Abstract
本発明は、企業等の組織の内部の状況を可視化し、それによって、組織の価値を顧客が簡単に把握できるようにすることを目的とする。階層構造を有する組織の価値を可視化するため、価値可視化装置10は、組織の構成員毎に、当該構成員の活動状況を表わす指標を取得する、指標取得部11と、取得された各構成員の指標を階層毎に集計し、階層毎の集計結果と各構成員の指標との画面への表示を可能にする表示データを生成する、集計処理部12と、を備えている。
Description
本発明は、企業等の組織の価値を顧客が視覚によって把握できるようにする、価値可視化装置、価値可視化方法、及びこれらを実現するためのプログラムを記録したコンピュータ読み取り可能な記録媒体に関する。
近年、企業に対しては、その社会的責任(CSR: Corporate Social Responsibility)を果たすことが、多くの場面で求められるようになっている。一般に、企業のCSRとは、最低限の法令遵守、及び社会への利益貢献に加え、市民、地域の顕在的及び潜在的な要請に応え、高次の社会貢献、配慮、情報公開、対話などを自主的に行なうことを意味すると解される。
そして、CSRは、顧客が企業を選択する際の指標として、更には顧客が製品を購入する際の指標としても注目されている。このため、多くの企業では、企業活動において、CSRの理念及び行動を取り入れ、その結果を、顧客及び消費者に報告するべく、CSRレポートを作成し、これを自社のWebサイト等によって公開している。
但し、CSRは、概念的にはあいまいであり、企業によって作成されたCSRレポートだけで、企業の実体を表わすことは困難と考えられる。従って、顧客、特に、一般消費者が、CSRレポートに基づいて企業の実体を把握し、企業を評価することも困難であると考えられる。このため、特許文献1は、企業活動の有効性について、各種数値データに基づいて、客観的、且つ、統一的な評価を行なう装置を開示している。
ところで、企業内部における、社員の活気、目標達成に対する社員の意気込み等といった社内の実体を把握することは、企業を評価する上で極めて重要であると考えられる。しかしながら、特許文献1に開示された装置であっても、このような社内の実体を把握することは困難である。このため、特許文献1に開示された装置を用いた場合であっても、得られる評価内容は不十分と考えられる。
本発明の目的の一例は、上記問題を解消し、企業等の組織の内部の状況を可視化し、それによって、組織の価値を顧客が簡単に把握できるようにし得る、価値可視化装置、価値可視化方法、及びコンピュータ読み取り可能な記録媒体を提供することにある。
上記目的を達成するため、本発明の一側面における価値可視化装置は、階層構造を有する組織の価値を可視化するための装置であって、
前記組織の構成員毎に、当該構成員の活動状況を表わす指標を取得する、指標取得部と、
取得された各構成員の指標を階層毎に集計し、階層毎の集計結果と各構成員の指標との画面への表示を可能にする表示データを生成する、集計処理部と、
を備えていることを特徴とする。
前記組織の構成員毎に、当該構成員の活動状況を表わす指標を取得する、指標取得部と、
取得された各構成員の指標を階層毎に集計し、階層毎の集計結果と各構成員の指標との画面への表示を可能にする表示データを生成する、集計処理部と、
を備えていることを特徴とする。
また、上記目的を達成するため、本発明の一側面における価値可視化方法は、階層構造を有する組織の価値を可視化するための方法であって、
(a)前記組織の構成員毎に、当該構成員の活動状況を表わす指標を取得する、ステップと、
(b)前記(a)のステップで取得された各構成員の指標を階層毎に集計し、階層毎の集計結果と各構成員の指標との画面への表示を可能にする表示データを生成する、ステップと、
を有することを特徴とする。
(a)前記組織の構成員毎に、当該構成員の活動状況を表わす指標を取得する、ステップと、
(b)前記(a)のステップで取得された各構成員の指標を階層毎に集計し、階層毎の集計結果と各構成員の指標との画面への表示を可能にする表示データを生成する、ステップと、
を有することを特徴とする。
更に、上記目的を達成するため、本発明の一側面におけるコンピュータ読み取り可能な記録媒体は、コンピュータによって、階層構造を有する組織の価値を可視化するためのプログラムを記録したコンピュータ読み取り可能な記録媒体であって、
前記コンピュータに、
(a)前記組織の構成員毎に、当該構成員の活動状況を表わす指標を取得する、ステップと、
(b)前記(a)のステップで取得された各構成員の指標を階層毎に集計し、階層毎の集計結果と各構成員の指標との画面への表示を可能にする表示データを生成する、ステップと、
を実行させる、命令を含むプログラムを記録していることを特徴とする。
前記コンピュータに、
(a)前記組織の構成員毎に、当該構成員の活動状況を表わす指標を取得する、ステップと、
(b)前記(a)のステップで取得された各構成員の指標を階層毎に集計し、階層毎の集計結果と各構成員の指標との画面への表示を可能にする表示データを生成する、ステップと、
を実行させる、命令を含むプログラムを記録していることを特徴とする。
以上のように本発明によれば、企業等の組織の内部の状況を可視化し、それによって、組織の価値を顧客が簡単に把握できるようにすることができる。
(実施の形態1)
以下、本発明の実施の形態1における、価値可視化装置、価値可視化方法、及びプログラムについて、図1~図7を参照しながら説明する。
以下、本発明の実施の形態1における、価値可視化装置、価値可視化方法、及びプログラムについて、図1~図7を参照しながら説明する。
[装置構造]
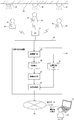
最初に、本実施の形態1における価値可視化装置の構成について図1を用いて説明する。図1は、本発明の実施の形態1における価値可視化装置の構成を示すブロック図である。
最初に、本実施の形態1における価値可視化装置の構成について図1を用いて説明する。図1は、本発明の実施の形態1における価値可視化装置の構成を示すブロック図である。
図1に示す本実施の形態1における価値可視化装置10は、階層構造を有する組織の価値を可視化するための装置である。ここで、階層構造を有する組織としては、企業、官庁、各種団体等が挙げられる。企業を例にとると、事業部、部門、課、といった階層に分かれている。
図1に示すように、価値可視化装置10は、指標取得部11と、集計処理部12とを備えている。このうち、指標取得部11は、組織の構成員毎に各構成員の活動状況を表わす指標を取得する。集計処理部12は、取得された各構成員30の指標を階層毎に集計し、階層毎の集計結果と各構成員の指標との画面への表示を可能にする表示データ(以下「指標表示データ」と表記する。)を生成する。本実施の形態1では、生成された指標表示データは、インターネット等のネットワーク40を介して、ユーザ50の端末装置51に送られるので、端末装置51の画面上に、集計された指標が表示される。
このように、価値可視化装置10を用いれば、企業等の組織の構成員それぞれの活動状況が指標として取得されるので、組織内部の状況が可視化されることになる。この結果、企業の顧客等であるユーザ50は、企業等の組織の価値を簡単に把握することができる。
ここで、本実施の形態1における価値可視化装置10の構成について更に具体的に説明する。図1に示すように、価値可視化装置10は、上述の指標取得部11及び集計処理部12に加えて、更に、指標算出部13と、音声認識処理部14と、指標データベース15と、NGワードデータベース16と、音声認識結果データベース17とを備えている。
指標算出部13は、構成員30毎に、各構成員30の発話を取得し、そして、取得した発話の音声レベルの変化の中に、予め設定された笑い声を表わすパターンが含まれているかどうかを判定し、判定結果に基づいて、指標を算出する。また、指標算出部13は、算出した指標を、構成員30毎に指標データベース15に登録する。
具体的には、本実施の形態1では、組織の各構成員30は、マイク31を装着している。そして、マイク31によって拾われた構成員30の発話は、アナログ音声信号に変換された後、送信機(図1において図示せず)に送られ、そこで更にデジタル音声信号に変換される。また、送信機は、デジタル音声信号を、無線通信によって、アクセスポイント21に送信する。アクセスポイント21は、対象となる組織のLAN20に接続されており、LAN20を経由して、各構成員30の送信機から送信されてきたデジタル音声信号を、価値可視化装置10へと送信する。
その後、指標算出部13は、各構成員30からのデジタル音声信号に基づいて、発話の音声レベルの変化を特定し、特定した音声レベルの設定時間における変化と、予め設定された笑い声の音声レベルのパターンとを対比し、後者が前者に含まれているかどうかを判定する。そして、指標算出部13は、後者が前者に含まれていると判定する場合は、含まれている回数(即ち、後者における前者と一致している部分の数)をカウントし、例えば、得られた回数をこの構成員30の指標とする。
なお、「設定時間」は、例えば1時間等に設定されるが、組織の種類等に応じて適宜選択される。また、指標とされる「回数」は、構成員30が笑っている回数(以下「笑顔回数」とも表記する。)を表わしている。従って、各構成員30の指標の値が大きい程、職場の雰囲気が明るいと考えられ、ユーザ50は、指標に基づいて組織内部の状況を知ることができる。
また、音声認識処理部14は、指標算出部13によって取得された、構成員30の発話に対して、具体的には、送信されてきたデジタル音声信号に対して、音声認識処理を実行し、認識結果から、構成員30の発話のテキストデータを作成する。更に、音声認識処理部14は、作成したテキストデータを、構成員30毎に音声認識結果データベース17に登録する。
更に、本実施の形態1では、集計処理部12は、ユーザ50が端末装置51を介して構成員30の誰かを指定すると、指定された構成員の活動の経緯を特定し、特定した活動の経緯の画面への表示を可能にする表示データ(以下「経緯表示データ」と表記する。)を更に生成する。
具体的には、集計処理部12は、音声認識結果データベース17にアクセスし、指定された構成員30の活動の経緯として、音声認識処理部14によって作成された、この構成員30の発話のテキストデータを特定し、これを取得する。そして、集計処理部12は、経緯表示データとして、この構成員30のテキストデータを、ユーザ50の端末装置51の画面に表示させるデータを生成する。
また、このとき、集計処理部12は、テキストデータ中に、予め指定されたキーワードが含まれる場合は、このキーワードを除いたテキストデータが表示されるように経緯表示データを生成することができる。なお、予め指定されたキーワードは、「NGワード」として、NGワードデータベース16に登録されている。NGワードとしては、組織の機密事項に関する単語が挙げられる。このようにNGワードについては表示されないようにすることで、機密事項の漏洩が抑制される。
[装置動作]
次に、本発明の実施の形態1における価値可視化装置10の動作について図2~図7を用いて説明する。以下の説明においては、適宜図1を参酌する。また、本実施の形態1では、価値可視化装置10を動作させることによって、価値可視化方法が実施される。よって、本実施の形態1における価値可視化方法の説明は、以下の価値可視化装置10の動作説明に代える。
次に、本発明の実施の形態1における価値可視化装置10の動作について図2~図7を用いて説明する。以下の説明においては、適宜図1を参酌する。また、本実施の形態1では、価値可視化装置10を動作させることによって、価値可視化方法が実施される。よって、本実施の形態1における価値可視化方法の説明は、以下の価値可視化装置10の動作説明に代える。
最初に、図2を用いて、指標表示データの生成処理について説明する。図2は、本発明の実施の形態1における価値可視化装置での指標表示データの生成処理時の動作を示すフロー図である。
図2に示すように、まず、指標算出部13が、構成員30毎に、発話を取得する(ステップA1)。具体的には、ステップA1では、指標算出部13は、アクセスポイント21を経由して送信されてくる発話のデジタル音声信号を受信する。また、ステップA1の実行後は、図2においては図示されないが、音声認識処理部14による音声認識処理も実行される。
次に、指標算出部13は、各構成員30のデジタル音声信号に基づいて、パターンマッチングを行なって、笑顔回数をカウントし、得られた値を指標として算出する(ステップA2)。また、指標算出部13は、算出した指標を、構成員30毎に指標データベース15に登録する。
具体的には、ステップA2では、指標算出部13は、構成員毎に、デジタル音声信号で特定される音声レベルの設定時間における変化と、予め設定された笑い声の音声レベルのパターンとを対比して、後者が前者に含まれているかどうかを判定する。そして、後者が前者に含まれている場合は、指標算出部13は、前者における後者と一致している部分の数をカウントし、得られた値を指標とする。
次に、ステップA2によって各構成員30の指標が算出されると、指標取得部11は、指標データベース15から、算出された各構成員30の指標を取得する(ステップA3)。
次に、集計処理部12は、ステップA3で取得された各構成員30の指標を階層毎に集計する(ステップA4)。例えば、対象となる組織が、企業であり、事業部、部門、課といった階層に分かれているとすると、集計処理部12は、事業部別、部門別、課別に、指標を集計する。また、集計は、1日単位、1週間単位、1ヶ月単位等の期間単位で実行されているのが好ましい。
次に、集計処理部12は、ステップA4で得られた階層毎の集計結果と、各構成員30の指標とを用いて、指標表示データを生成する(ステップA5)。そして、ユーザ50が、端末装置51を介して、指標の表示を求めた場合は、集計処理部12は、ステップA5で生成した指標表示データを端末装置51に送信する(ステップA6)。この結果、端末装置51の画面上に、階層毎の集計結果と、各構成員30の指標とが表示される。
ここで、指標の表示の具体例について図3及び図4を用いて説明する。図3は、本発明の実施の形態1において企業の事業部毎に指標を表示した場合の一例を示す図である。図4は、本発明の実施の形態1において企業の部毎に指標を表示した場合の一例を示す図である。
図3及び図4に示すように、本実施の形態1では、ユーザ50は、画面を切り替えることによって、事業部別、部門別に、指標としての笑顔回数を確認することができる。また、図示していないが、ユーザ50は、課別(図示せず)、個人別(図示せず)に、笑顔回数を確認することもできる。
例えば、図3に示すように、事業部別に指標を表示させた場合、ユーザ50は、企業のどの事業部の雰囲気が良いのかを知ることができる。また、図4に示すように、部門別に指標を表示させた場合、ユーザ50は、企業のどの部の雰囲気が良いのかを知ることができる。
以上のように、ステップA1~A6が実行されると、組織内部の状況が可視化されるので、企業の顧客等であるユーザ50は、企業等の組織の価値を簡単に把握することができる。
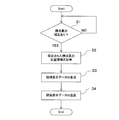
続いて、図5を用いて、経緯表示データの生成処理について説明する。図5は、本発明の実施の形態1における価値可視化装置での経緯表示データの生成処理時の動作を示すフロー図である。
図5に示すように、まず、集計処理部12は、ユーザ50が端末装置51を介して構成員30を指定しているかどうかを判定する(ステップB1)。ステップB1の結果、指定がなされていない場合は、集計処理部12は待機状態となる。
一方、ステップB1の結果、指定がなされている場合は、集計処理部12は、指定された構成員30を特定し、音声認識結果データベース17から、特定した構成員の発話のテキストデータを取得する(ステップB2)。
次に、集計処理部12は、NGワードデータベース16にアクセスしてNGワードを取得し、ステップB2で取得されたテキストデータから、NGワードを除外する(ステップB3)。
その後、集計処理部12は、NGワードが除外されたテキストデータを用いて、経緯表示データを生成し(ステップB4)、これを端末装置51に送信する(ステップB5)。この結果、図6に示すように、指定された構成員(社員)の発話の履歴が、端末装置51の画面に表示されることになる。図6は、本発明の実施の形態1において表示される構成員の活動の経緯の一例を示す図である。
また、本実施の形態1は、ステップB1で構成員が指定された場合に、指標取得部11が、指標データベース15から、指定された構成員30の指標を取得し、その後、集計処理部12が、指定された構成員の指標の変遷を表示する表示データを生成する、態様であっても良い。この態様では、図7に示すように、ユーザ50の端末装置51の画面には、指定された構成員30の指標(笑顔回数)の変遷が表示される。図7は、本発明の実施の形態1において表示される構成員の指標の変遷の一例を示す図である。
以上のように、ステップB1~B5が実行されると、より詳しく組織内部の状況が可視化され、ユーザ50は、構成員の状況を個別に確認でき、よりいっそう組織の価値を簡単に把握することができる。
[プログラム]
また、本実施の形態1におけるプログラムは、コンピュータに、図2に示すステップA1~A6、図5に示すステップB1~B5を実行させるプログラムであれば良い。このプログラムをコンピュータにインストールし、実行することによって、本実施の形態1における価値可視化装置10と価値可視化方法とを実現することができる。この場合、コンピュータのCPU(Central Processing Unit)は、指標取得部11、集計処理部12、指標算出部13、及び音声認識処理部14として機能し、処理を行なう。更に、コンピュータに備えられたハードディスク等の記憶装置は、指標データベース15、NGワードデータベース16、音声認識結果データベース17として機能する。
また、本実施の形態1におけるプログラムは、コンピュータに、図2に示すステップA1~A6、図5に示すステップB1~B5を実行させるプログラムであれば良い。このプログラムをコンピュータにインストールし、実行することによって、本実施の形態1における価値可視化装置10と価値可視化方法とを実現することができる。この場合、コンピュータのCPU(Central Processing Unit)は、指標取得部11、集計処理部12、指標算出部13、及び音声認識処理部14として機能し、処理を行なう。更に、コンピュータに備えられたハードディスク等の記憶装置は、指標データベース15、NGワードデータベース16、音声認識結果データベース17として機能する。
(実施の形態2)
次に、本発明の実施の形態2における、価値可視化装置、価値可視化方法、及びプログラムについて、図8~図10を参照しながら説明する。
次に、本発明の実施の形態2における、価値可視化装置、価値可視化方法、及びプログラムについて、図8~図10を参照しながら説明する。
[装置構造]
最初に、本実施の形態2における価値可視化装置の構成について図8を用いて説明する。図8は、本発明の実施の形態2における価値可視化装置の構成を示すブロック図である。
最初に、本実施の形態2における価値可視化装置の構成について図8を用いて説明する。図8は、本発明の実施の形態2における価値可視化装置の構成を示すブロック図である。
図8に示す本実施の形態2における価値可視化装置60は、構成員毎の行動軌跡から指標を算出する点で、図1に示した実施の形態1における価値可視化装置10と異なっている。以下、実施の形態1との相違点を中心に説明する。
まず、図8に示すように、本実施の形態2では、各構成員の居室の天井34に、複数の赤外線発信機33が取り付けられている。また、図8には3つの赤外線発信機33のみが図示されているが、実際には、多数の赤外線発信機33が、マトリクス状に配置されている。そして、各赤外線発信機33には、別々の識別子が設定されており、各赤外線発信機33は、設定された識別子を示す信号が変調された赤外線を出射する。
各構成員30は、それぞれ、赤外線発信機33から出射された赤外線を受信する受信機32を携帯している。各受信機32は、赤外線を受信すると、受信した時刻と、この赤外線を出射した赤外線発信機33の識別子とを特定する。更に、各受信機32は、特定した時刻と、特定した識別子と、受信機30を携帯している構成員30の識別子と、を含む識別情報をアクセスポイント21に送信する。また、アクセスポイント21は、実施の形態1と同様に、LAN20を経由して、各構成員30の受信機32から送信されてきた識別情報を、価値可視化装置60へと送信する。
図8に示すように、本実施の形態2では、価値可視化装置60は、指標取得部61と、集計処理部62と、指標算出部63と、位置情報データベース64と、指標データベース65とを備えている。
指標算出部63は、まず、アクセスポイント21経由で送信されてきた各識別情報を取得し、取得した各識別情報から各構成員30の位置を特定する。具体的には、指標算出部63は、送信されてきた識別情報毎に、出射元の赤外線発信機33を特定し、特定した赤外線発信機33の設置位置を、同じ識別情報に識別子が含まれている構成員30の位置として特定する。
そして、指標算出部63は、特定された位置の座標に、識別情報に含まれる時刻及び構成員30の識別子を関連付け、これらを位置情報として位置情報データベース64に格納する。また、このようにして位置情報データベース64に格納された位置情報は、各構成員の行動軌跡を表わしている。
また、指標算出部63は、このようにして取得された行動軌跡に基づいて、構成員毎に、指標を算出する。具体的には、指標算出部63は、各構成員について、設定期間(例えば、1日分)毎に、設定期間分の位置情報に基づいて、以下に示す指標(1)~指標(4)を算出する。
指標(1)は、グループ内コミュニケーション度を示す指標であり、具体的には、ある構成員が同一グループの構成員と近接していた時間がどれほどであったかを示している。
指標(2)は、グループ外コミュニケーション度を示す指標であり、具体的には、ある構成員が異なるグループの構成員と近接していた時間がどれほどであったかを示している。
指標(3)は、構成員の移動活発度を示す指標であり、構成員がどれほど動き回っているのかを示している。
指標(4)は、構成員の自席滞在度を示す指標であり、構成員がどれほど自分の席に長く滞在しているのかを示している。
また、上記指標のうち、指標(1)及び指標(2)としては、例えば、算出対象の構成員と別の構成員との近接判定の結果から算出された値を用いることができる。
具体的には、まず、指標算出部63は、設定期間の開始から終了までについて、算出対象の構成員と別の構成員との近接判定を行なう。近接判定としては、例えば、算出対象の構成員の座標と別の構成員の座標とが、一定期間(例えば、5分間)において、同一エリア(例えば、半径距離3m以下のエリア)内に存在していたかどうかを判定することが挙げられる。また、以降において、近接していると判定した場合の判定結果を「近接有判定」と表記する。
続いて、指標算出部63は、近接していると判定する場合は、所属する構成員30の識別子がグループ毎に登録されているテーブルに、算出対象の構成員と別の構成員との識別子を照合して、両者が同一のグループに所属しているかどうかを判定する。
また、グループの設定の仕方は特に限定されず、例えば、対象となる組織が企業である場合は、事業部、部門、課といった階層に応じて設定される。具体的には、ある事業部に所属している各部門がそれぞれ一つのグループに設定されていても良いし、ある部門に所属している各課がそれぞれ一つのグループに設定されていても良い。
次に、指標算出部63は、同一のグループに所属している場合の近接有判定に基づき、設定期間(例えば、一日)あたりの、近接した人数、合計近接回数、合計近接時間、または一回の近接の平均近接時間等を求め、得られた値を指標(1)とする。また、指標算出部63は、同一のグループに所属していない場合の近接有判定に基づき、同様に、設定期間(例えば、一日)あたりの、近接した人数、合計近接回数、合計近接時間、または一回の近接の平均近接時間等を求め、得られた値を指標(2)とする。なお、得られた値に正規化が行なわれ、正規化後の値が指標とされても良い。
また、指標(3)としては、例えば、単位時間あたりの、算出対象の構成員の移動距離の合計(軌跡の全長)、一度に連続して移動した距離、移動速度、または移動速度の統計値(平均値、最大値、最小値等)等を用いることができる。
更に、指標(4)としては、算出対象の構成員が予め登録されている位置(自席の座標)に滞在している場合における、設定期間あたりの、合計滞在時間、滞在回数、滞在時間の統計値(平均値、最大値、最小値等)等を用いることができる。
なお、指標(4)の算出は、指標算出部63が、算出対象の構成員が予め登録されている位置(自席の座標)に滞在しているかどうかを判定し、滞在していると判定した場合にのみ行なわれる。また、算出対象の構成員の席が予め決まっていない(フリーアドレス)場合は、指標算出部63は、最も長い時間滞在している座標を自席と判断して、指標(4)を算出することができる。
また、本実施の形態2では、指標取得部61は、組織の構成員毎に各構成員の活動状況を表わす指標として、上述した指標(1)~(4)を取得する。集計処理部62は、取得された各構成員30の指標(1)~(4)を階層毎に集計し、階層毎の指標(1)~(4)それぞれの集計結果を用いて、指標表示データを生成する。更に、集計処理部62は、ユーザ50が端末装置51を介して構成員30の誰かを指定すると、指定された構成員の活動の経緯を特定し、経緯表示データを生成する。
本実施の形態2では、集計処理部62は、位置情報データベース64にアクセスし、指定された構成員30の活動の経緯として、その構成員30の一定期間の位置情報を取得する。そして、集計処理部62は、取得した位置情報に基づいて、経緯表示データを生成する。経緯表示データとしては、指定された構成員30の行動軌跡をオフィス内のレイアウトと共に画面に表示させるデータ、指定された構成員30の日毎又は時間毎の移動量のグラフを画面に表示させるデータ等が挙げられる。
なお、集計処理部62は、企業秘密の漏洩防止の点から、取得できる位置情報の期間に制限を設定することができる。更に、集計処理部62は、構成員の行動軌跡を画面に表示させる場合においては、表示される行動軌跡の縮小化又は抽象化、オフィス内のレイアウトの非表示化等を行なうことによって、企業秘密の漏洩を防止することもできる。
[装置動作]
次に、本発明の実施の形態2における価値可視化装置10の動作について図9及び図10を用いて説明する。以下の説明においては、適宜図1を参酌する。また、本実施の形態2でも、価値可視化装置10を動作させることによって、価値可視化方法が実施される。よって、本実施の形態2における価値可視化方法の説明は、以下の価値可視化装置60の動作説明に代える。
次に、本発明の実施の形態2における価値可視化装置10の動作について図9及び図10を用いて説明する。以下の説明においては、適宜図1を参酌する。また、本実施の形態2でも、価値可視化装置10を動作させることによって、価値可視化方法が実施される。よって、本実施の形態2における価値可視化方法の説明は、以下の価値可視化装置60の動作説明に代える。
最初に、図9を用いて、指標表示データの生成処理について説明する。図9は、本発明の実施の形態2における価値可視化装置での指標表示データの生成処理時の動作を示すフロー図である。
図9に示すように、まず、指標算出部63は、構成員30毎に、識別情報を取得し、これに基づいて各構成員30の位置情報を生成する(ステップC1)。また、指標算出部63は、生成した各構成員30の位置情報を位置情報データベース64に格納する。
次に、指標算出部63は、生成した位置情報に基づいて、構成員毎に、指標(1)~指標(4)を算出する(ステップC2)。また、指標算出部63は、算出した指標(1)~指標(4)を、構成員毎に、指標データベース65に格納する。
次に、指標取得部61は、指標データベース65から、算出された各構成員の指標(1)~指標(4)を取得する(ステップC3)。
次に、集計処理部62は、ステップC3で取得された各構成員30の指標(1)~指標(4)を階層毎に集計する(ステップC4)。
次に、集計処理部62は、ステップC4で得られた階層毎の集計結果と、各構成員30の指標(1)~指標(4)とを用いて、指標表示データを生成する(ステップC5)。
そして、ユーザ50が、端末装置51を介して、指標の表示を求めた場合は、集計処理部62は、ステップC5で生成した指標表示データを端末装置51に送信する(ステップC6)。この結果、端末装置51の画面上に、階層毎の集計結果と、各構成員30の指標(1)~指標(4)とが表示される。
また、ステップC4~C6は、図2に示したステップA4~A6と同様のステップである。従って、例えば、対象となる組織が、企業であり、事業部、部門、課といった階層に分かれているとすると、本実施の形態2においても、実施の形態1と同様に、事業部別、部門別、課別に、指標(1)~指標(4)の集計及び表示が実行される(図3及び図4参照)。
以上のように、本実施の形態2においても、ステップC1~C6が実行されると、実施の形態1と同様に、組織内部の状況が可視化されるので、企業の顧客等であるユーザ50は、企業等の組織の価値を簡単に把握することができる。
続いて、図10を用いて、経緯表示データの生成処理について説明する。図10は、本発明の実施の形態2における価値可視化装置での経緯表示データの生成処理時の動作を示すフロー図である。
図10に示すように、まず、集計処理部62は、ユーザ50が端末装置51を介して構成員30を指定しているかどうかを判定する(ステップD1)。ステップD1の結果、指定がなされていない場合は、集計処理部62は待機状態となる。
一方、ステップD1の結果、指定がなされている場合は、集計処理部62は、指定された構成員30を特定し、位置情報データベース64から、特定した構成員の位置情報を一定期間分(例えば、1日分、1週間分等)取得する(ステップD2)。
次に、集計処理部62は、ステップD2で取得した位置情報を用いて、経緯表示データを生成し(ステップD3)、これを端末装置51に送信する(ステップD4)。この結果、指定された構成員(社員)の行動軌跡、又は指定された構成員(社員)の移動量のグラフ等が、端末装置51の画面に表示されることになる。
以上のように、本実施の形態2においても、ステップD1~D4が実行されると、実施の形態1と同様に、より詳しく組織内部の状況が可視化され、ユーザ50は、構成員の状況を個別に確認でき、よりいっそう組織の価値を簡単に把握することができる。
また、上述の図8~図10の例では、天井34に設置された赤外線発信機33と、構成員30が携帯する受信機32とによって、各構成員の行動軌跡が取得されているが、本実施の形態2は、この例に限定されるものではない。
本実施の形態2は、例えば、各構成員がRFID発信機を携帯し、構成員の居室の複数箇所に受信機が配置された態様であっても良いし、構成員の居室の複数箇所にUWB(Ultra Wide Band)発信機を設置し、各構成員に受信機を携帯させる態様であっても良い。これらの態様では、受信機における電波の受信強度から、各構成員の位置の特定が可能になる。また、これらの態様では、位置の座標として、3次元座標を取得することも可能となる。
(変形例1)
上述した例では、価値可視化装置(指標算出部)は、構成員30の発話又は行動軌跡に基づいて各構成員の指標を算出しているが、実施の形態1及び2は、この態様に限定されるものではない。例えば、指標は、各構成員が作成したテキストデータ、各構成員を撮影して得られた撮影データ等に基づいて算出されていても良い。
上述した例では、価値可視化装置(指標算出部)は、構成員30の発話又は行動軌跡に基づいて各構成員の指標を算出しているが、実施の形態1及び2は、この態様に限定されるものではない。例えば、指標は、各構成員が作成したテキストデータ、各構成員を撮影して得られた撮影データ等に基づいて算出されていても良い。
(変形例2)
上述した例では、価値可視化装置の内部で、指標自体の算出が行なわれているが、実施の形態1及び2は、この態様に限定されず、指標取得部11が別のところで算出された指標を外部から取得してくる態様であっても良い。
上述した例では、価値可視化装置の内部で、指標自体の算出が行なわれているが、実施の形態1及び2は、この態様に限定されず、指標取得部11が別のところで算出された指標を外部から取得してくる態様であっても良い。
(コンピュータ)
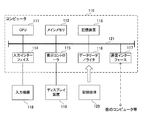
ここで、実施の形態1及び2におけるプログラムを実行することによって、価値可視化装置を実現するコンピュータについて図11を用いて説明する。図11は、本発明の実施の形態1及び2における価値可視化装置を実現するコンピュータの一例を示すブロック図である。
ここで、実施の形態1及び2におけるプログラムを実行することによって、価値可視化装置を実現するコンピュータについて図11を用いて説明する。図11は、本発明の実施の形態1及び2における価値可視化装置を実現するコンピュータの一例を示すブロック図である。
図11に示すように、コンピュータ110は、CPU111と、メインメモリ112と、記憶装置113と、入力インターフェイス114と、表示コントローラ115と、データリーダ/ライタ116と、通信インターフェイス117とを備える。これらの各部は、バス121を介して、互いにデータ通信可能に接続される。
CPU111は、記憶装置113に格納された、本実施の形態におけるプログラム(コード)をメインメモリ112に展開し、これらを所定順序で実行することにより、各種の演算を実施する。メインメモリ112は、典型的には、DRAM(Dynamic Random Access Memory)等の揮発性の記憶装置である。また、本実施の形態におけるプログラムは、コンピュータ読み取り可能な記録媒体120に格納された状態で提供される。なお、本実施の形態におけるプログラムは、通信インターフェイス117を介して接続されたインターネット上で流通するものであっても良い。
また、記憶装置113の具体例としては、ハードディスクドライブの他、フラッシュメモリ等の半導体記憶装置が挙げられる。入力インターフェイス114は、CPU111と、キーボード及びマウスといった入力機器118との間のデータ伝送を仲介する。表示コントローラ115は、ディスプレイ装置119と接続され、ディスプレイ装置119での表示を制御する。
データリーダ/ライタ116は、CPU111と記録媒体120との間のデータ伝送を仲介し、記録媒体120からのプログラムの読み出し、及びコンピュータ110における処理結果の記録媒体120への書き込みを実行する。通信インターフェイス117は、CPU111と、他のコンピュータとの間のデータ伝送を仲介する。
また、記録媒体120の具体例としては、CF(Compact Flash(登録商標))及びSD(Secure Digital)等の汎用的な半導体記憶デバイス、フレキシブルディスク(Flexible Disk)等の磁気記憶媒体、又はCD-ROM(Compact Disk Read Only Memory)などの光学記憶媒体が挙げられる。
以上、実施の形態を参照して本願発明を説明したが、本願発明は上記実施の形態に限定されるものではない。本願発明の構成や詳細には、本願発明のスコープ内で当業者が理解し得る様々な変更をすることができる。
この出願は、2012年12月19日に出願された日本出願特願2012-276407を基礎とする優先権を主張し、その開示の全てをここに取り込む。
以上のように、本発明によれば、企業等の組織の内部の状況を可視化し、それによって、組織の価値を顧客が簡単に把握できるようすることができる。本発明は、本発明は、企業の価値評価が求められる金融分野及び投資分野等において有用である。
10 価値可視化装置
11 指標取得部
12 集計処理部
13 指標算出部
14 音声認識処理部
15 指標データベース
16 NGワードデータベース
17 音声認識結果データベース
20 LAN
21 アクセスポイント
30 構成員
31 マイク
40 ネットワーク
50 ユーザ
51 端末装置
32 受信機
33 赤外線発信機
34 天井
60 価値可視化装置
61 指標取得部
62 集計処理部
63 指標算出部
64 位置情報データベース
66 指標データベース
110 コンピュータ
111 CPU
112 メインメモリ
113 記憶装置
114 入力インターフェイス
115 表示コントローラ
116 データリーダ/ライタ
117 通信インターフェイス
118 入力機器
119 ディスプレイ装置
120 記録媒体
121 バス
11 指標取得部
12 集計処理部
13 指標算出部
14 音声認識処理部
15 指標データベース
16 NGワードデータベース
17 音声認識結果データベース
20 LAN
21 アクセスポイント
30 構成員
31 マイク
40 ネットワーク
50 ユーザ
51 端末装置
32 受信機
33 赤外線発信機
34 天井
60 価値可視化装置
61 指標取得部
62 集計処理部
63 指標算出部
64 位置情報データベース
66 指標データベース
110 コンピュータ
111 CPU
112 メインメモリ
113 記憶装置
114 入力インターフェイス
115 表示コントローラ
116 データリーダ/ライタ
117 通信インターフェイス
118 入力機器
119 ディスプレイ装置
120 記録媒体
121 バス
Claims (18)
- 階層構造を有する組織の価値を可視化するための装置であって、
前記組織の構成員毎に、当該構成員の活動状況を表わす指標を取得する、指標取得部と、
取得された各構成員の指標を階層毎に集計し、階層毎の集計結果と各構成員の指標との画面への表示を可能にする表示データを生成する、集計処理部と、
を備えていることを特徴とする価値可視化装置。 - 前記集計処理部が、前記組織の構成員のうちの誰かが指定された場合に、指定された構成員の活動の経緯を特定し、特定した活動の経緯の画面への表示を可能にする第2の表示データを更に生成する、
請求項1に記載の価値可視化装置。 - 前記構成員毎に、発話、行動軌跡、当該構成員が作成したテキストデータ、当該構成員を撮影して得られた撮影データ、のうち少なくとも1つを取得し、取得した情報に基づいて、前記指標を算出する、指標算出部を更に備えている、
請求項2に記載の価値可視化装置。 - 前記指標算出部が、前記構成員の発話を取得し、そして、取得した発話の音声レベルの変化の中に、予め設定された笑い声を表わすパターンが含まれているかどうかを判定し、判定結果に基づいて、前記指標を算出する、
請求項3に記載の価値可視化装置。 - 前記指標算出部によって取得された、前記構成員の発話に対して音声認識処理を実行して、前記構成員の発話のテキストデータを作成する、音声認識処理部を更に備え、
前記集計処理部が、指定された構成員の活動の経緯として、前記音声認識処理部によって作成された当該構成員の発話のテキストデータを特定し、前記第2の表示データとして、特定した当該構成員の発話のテキストデータを表示させるデータを生成する、
請求項4に記載の価値可視化装置。 - 前記集計処理部が、前記テキストデータ中に、予め指定されたキーワードが含まれる場合に、前記キーワードを除いた前記テキストデータが表示されるように前記第2の表示データを生成する、
請求項5に記載の価値可視化装置。 - 階層構造を有する組織の価値を可視化するための方法であって、
(a)前記組織の構成員毎に、当該構成員の活動状況を表わす指標を取得する、ステップと、
(b)前記(a)のステップで取得された各構成員の指標を階層毎に集計し、階層毎の集計結果と各構成員の指標との画面への表示を可能にする表示データを生成する、ステップと、
を有することを特徴とする価値可視化方法。 - (c)前記組織の構成員のうちの誰かが指定された場合に、指定された構成員の活動の経緯を特定し、特定した活動の経緯の画面への表示を可能にする第2の表示データを更に生成する、ステップを更に有する、
請求項7に記載の価値可視化方法。 - (d)前記構成員毎に、発話、行動軌跡、当該構成員が作成したテキストデータ、当該構成員を撮影して得られた撮影データ、のうち少なくとも1つを取得し、取得した情報に基づいて、前記指標を算出する、ステップを更に有する、
請求項8に記載の価値可視化方法。 - 前記(d)のステップにおいて、前記構成員の発話を取得し、そして、取得した発話の音声レベルの変化の中に、予め設定された笑い声を表わすパターンが含まれているかどうかを判定し、判定結果に基づいて、前記指標を算出する、
請求項9に記載の価値可視化方法。 - (e)前記(d)のステップで取得された、前記構成員の発話に対して音声認識処理を実行して、前記構成員の発話のテキストデータを作成する、ステップを更に有し、
前記(c)のステップにおいて、指定された構成員の活動の経緯として、前記(e)のステップで作成された当該構成員の発話のテキストデータを特定し、前記第2の表示データとして、特定した当該構成員の発話のテキストデータを表示させるデータを生成する、
請求項10に記載の価値可視化方法。 - 前記(e)のステップにおいて、前記テキストデータ中に、予め指定されたキーワードが含まれる場合に、前記キーワードを除いた前記テキストデータが表示されるように前記第2の表示データを生成する、
請求項11に記載の価値可視化方法。 - コンピュータによって、階層構造を有する組織の価値を可視化するためのプログラムを記録したコンピュータ読み取り可能な記録媒体であって、
前記コンピュータに、
(a)前記組織の構成員毎に、当該構成員の活動状況を表わす指標を取得する、ステップと、
(b)前記(a)のステップで取得された各構成員の指標を階層毎に集計し、階層毎の集計結果と各構成員の指標との画面への表示を可能にする表示データを生成する、ステップと、
を実行させる、命令を含むプログラムを記録している、コンピュータ読み取り可能な記録媒体。 - (c)前記組織の構成員のうちの誰かが指定された場合に、指定された構成員の活動の経緯を特定し、特定した活動の経緯の画面への表示を可能にする第2の表示データを更に生成する、ステップを、前記コンピュータに更に実行させる、
請求項13に記載のコンピュータ読み取り可能な記録媒体。 - (d)前記構成員毎に、発話、行動軌跡、当該構成員が作成したテキストデータ、当該構成員を撮影して得られた撮影データ、のうち少なくとも1つを取得し、取得した情報に基づいて、前記指標を算出する、ステップを、前記コンピュータに更に実行させる、
請求項14に記載のコンピュータ読み取り可能な記録媒体。 - 前記(d)のステップにおいて、前記構成員の発話を取得し、そして、取得した発話の音声レベルの変化の中に、予め設定された笑い声を表わすパターンが含まれているかどうかを判定し、判定結果に基づいて、前記指標を算出する、
請求項15に記載のコンピュータ読み取り可能な記録媒体。 - (e)前記(d)のステップで取得された、前記構成員の発話に対して音声認識処理を実行して、前記構成員の発話のテキストデータを作成する、ステップを、前記コンピュータに更に実行させ、
前記(c)のステップにおいて、指定された構成員の活動の経緯として、前記(e)のステップで作成された当該構成員の発話のテキストデータを特定し、前記第2の表示データとして、特定した当該構成員の発話のテキストデータを表示させるデータを生成する、
請求項16に記載のコンピュータ読み取り可能な記録媒体。 - 前記(e)のステップにおいて、前記テキストデータ中に、予め指定されたキーワードが含まれる場合に、前記キーワードを除いた前記テキストデータが表示されるように前記第2の表示データを生成する、
請求項17に記載のコンピュータ読み取り可能な記録媒体。
Applications Claiming Priority (2)
| Application Number | Priority Date | Filing Date | Title |
|---|---|---|---|
| JP2012276407 | 2012-12-19 | ||
| JP2012-276407 | 2012-12-19 |
Publications (1)
| Publication Number | Publication Date |
|---|---|
| WO2014097752A1 true WO2014097752A1 (ja) | 2014-06-26 |
Family
ID=50978098
Family Applications (1)
| Application Number | Title | Priority Date | Filing Date |
|---|---|---|---|
| PCT/JP2013/079485 Ceased WO2014097752A1 (ja) | 2012-12-19 | 2013-10-31 | 価値可視化装置、価値可視化方法、及びコンピュータ読み取り可能な記録媒体 |
Country Status (1)
| Country | Link |
|---|---|
| WO (1) | WO2014097752A1 (ja) |
Cited By (2)
| Publication number | Priority date | Publication date | Assignee | Title |
|---|---|---|---|---|
| JPWO2022024356A1 (ja) * | 2020-07-31 | 2022-02-03 | ||
| WO2023007661A1 (ja) * | 2021-07-29 | 2023-02-02 | 株式会社I’mbesideyou | 組織属性解析システムおよび組織属性解析装置 |
Citations (6)
| Publication number | Priority date | Publication date | Assignee | Title |
|---|---|---|---|---|
| JP2005277462A (ja) * | 2004-03-22 | 2005-10-06 | Fujitsu Ltd | 会議支援システム、議事録生成方法、およびコンピュータプログラム |
| JP2006178203A (ja) * | 2004-12-22 | 2006-07-06 | Nec Corp | 音声情報加工システム、音声情報加工方法及び音声情報加工プログラム |
| JP2006260102A (ja) * | 2005-03-16 | 2006-09-28 | Fuji Xerox Co Ltd | 対話行動評価装置および方法 |
| JP2009015755A (ja) * | 2007-07-09 | 2009-01-22 | Mazda Motor Corp | 職場活性化システム、方法、及びプログラム |
| JP2011243077A (ja) * | 2010-05-20 | 2011-12-01 | Hitachi Ltd | 電子メールを使用した組織内コミュニケーション活性化システム装置及び方法 |
| JP2012155374A (ja) * | 2011-01-21 | 2012-08-16 | Sony Corp | 情報処理装置、情報処理方法、プログラムおよび情報処理システム |
-
2013
- 2013-10-31 WO PCT/JP2013/079485 patent/WO2014097752A1/ja not_active Ceased
Patent Citations (6)
| Publication number | Priority date | Publication date | Assignee | Title |
|---|---|---|---|---|
| JP2005277462A (ja) * | 2004-03-22 | 2005-10-06 | Fujitsu Ltd | 会議支援システム、議事録生成方法、およびコンピュータプログラム |
| JP2006178203A (ja) * | 2004-12-22 | 2006-07-06 | Nec Corp | 音声情報加工システム、音声情報加工方法及び音声情報加工プログラム |
| JP2006260102A (ja) * | 2005-03-16 | 2006-09-28 | Fuji Xerox Co Ltd | 対話行動評価装置および方法 |
| JP2009015755A (ja) * | 2007-07-09 | 2009-01-22 | Mazda Motor Corp | 職場活性化システム、方法、及びプログラム |
| JP2011243077A (ja) * | 2010-05-20 | 2011-12-01 | Hitachi Ltd | 電子メールを使用した組織内コミュニケーション活性化システム装置及び方法 |
| JP2012155374A (ja) * | 2011-01-21 | 2012-08-16 | Sony Corp | 情報処理装置、情報処理方法、プログラムおよび情報処理システム |
Cited By (5)
| Publication number | Priority date | Publication date | Assignee | Title |
|---|---|---|---|---|
| JPWO2022024356A1 (ja) * | 2020-07-31 | 2022-02-03 | ||
| WO2022024356A1 (ja) * | 2020-07-31 | 2022-02-03 | 株式会社I’mbesideyou | 組織属性解析システム |
| WO2023007661A1 (ja) * | 2021-07-29 | 2023-02-02 | 株式会社I’mbesideyou | 組織属性解析システムおよび組織属性解析装置 |
| JPWO2023007661A1 (ja) * | 2021-07-29 | 2023-02-02 | ||
| JP2023055761A (ja) * | 2021-07-29 | 2023-04-18 | 株式会社I’mbesideyou | 組織属性解析システムおよび組織属性解析装置 |
Similar Documents
| Publication | Publication Date | Title |
|---|---|---|
| US11818136B2 (en) | System and method for intelligent agents for decision support in network identity graph based identity management artificial intelligence systems | |
| US20240160765A1 (en) | Applying Multi-Faceted Trust Scores for Decision Making Using a Decision Table and Predetermined Action Triggering | |
| US12430620B2 (en) | Systems and methods for performing and tracking asset inspections | |
| Qu et al. | Working from home vs working from office in terms of job performance during the COVID‐19 pandemic crisis: evidence from China | |
| CN114127743B (zh) | 稀疏和弱标记数据集的匿名数据整合和贝叶斯调查测量的概率建模 | |
| CA3020551C (en) | Network server arrangement for processing non-parametric, multi-dimensional, spatial and temporal human behavior or technical observations measured pervasively, and related method for the same | |
| US20190290796A1 (en) | Sterilization process management | |
| US20170032255A1 (en) | Injury risk factor identification, prediction, and mitigation | |
| WO2022026713A2 (en) | Compliance with use of personal data | |
| US20170372242A1 (en) | System to monitor and process noise level exposure data | |
| EP2633483A1 (en) | Enterprise resource planning oriented context-aware environment | |
| US11462319B2 (en) | Sterilization process management | |
| WO2014028303A1 (en) | Contextual task management and notifications | |
| JP2025003451A (ja) | 訪問予測 | |
| WO2022197606A2 (en) | Alert actioning and machine learning feedback | |
| Onubi | Mediating effect of ecospirituality on the relationship between green training and voluntary workplace green behaviour in construction projects in Nigeria | |
| WO2014097752A1 (ja) | 価値可視化装置、価値可視化方法、及びコンピュータ読み取り可能な記録媒体 | |
| KR102403276B1 (ko) | 광고 캠페인에 관한 정보를 제공하기 위한 방법, 시스템 및 비일시성의 컴퓨터 판독 가능한 기록 매체 | |
| CN117057537A (zh) | 任务调度方法、装置、设备及存储介质 | |
| Arvind Mallik | Understanding factors responsible for framework to design sustainable net zero policies—an empirical analysis on Indian small and medium enterprises (SMEs) | |
| KR102134254B1 (ko) | 기밀 유출 추정 방법 및 전자 장치 | |
| US10282703B1 (en) | Enterprise risk management | |
| WO2021033621A1 (ja) | 情報処理装置、情報処理方法、およびプログラム | |
| CN119886753B (zh) | 一种智能工牌的多维度信息采集处理方法及装置 | |
| Frounfelker et al. | Designing a Digital Platform for Seasonal Influenza: Concept Mapping with Infectious Disease Experts |
Legal Events
| Date | Code | Title | Description |
|---|---|---|---|
| 121 | Ep: the epo has been informed by wipo that ep was designated in this application |
Ref document number: 13865879 Country of ref document: EP Kind code of ref document: A1 |
|
| NENP | Non-entry into the national phase |
Ref country code: DE |
|
| 122 | Ep: pct application non-entry in european phase |
Ref document number: 13865879 Country of ref document: EP Kind code of ref document: A1 |
|
| NENP | Non-entry into the national phase |
Ref country code: JP |