WO2014046284A1 - 二次代謝系遺伝子を含む遺伝子クラスタの予測方法、予測プログラム及び予測装置 - Google Patents
二次代謝系遺伝子を含む遺伝子クラスタの予測方法、予測プログラム及び予測装置 Download PDFInfo
- Publication number
- WO2014046284A1 WO2014046284A1 PCT/JP2013/075702 JP2013075702W WO2014046284A1 WO 2014046284 A1 WO2014046284 A1 WO 2014046284A1 JP 2013075702 W JP2013075702 W JP 2013075702W WO 2014046284 A1 WO2014046284 A1 WO 2014046284A1
- Authority
- WO
- WIPO (PCT)
- Prior art keywords
- gene cluster
- gene
- genes
- region
- reference value
- Prior art date
- Legal status (The legal status is an assumption and is not a legal conclusion. Google has not performed a legal analysis and makes no representation as to the accuracy of the status listed.)
- Ceased
Links
Images




Classifications
-
- G—PHYSICS
- G16—INFORMATION AND COMMUNICATION TECHNOLOGY [ICT] SPECIALLY ADAPTED FOR SPECIFIC APPLICATION FIELDS
- G16B—BIOINFORMATICS, i.e. INFORMATION AND COMMUNICATION TECHNOLOGY [ICT] SPECIALLY ADAPTED FOR GENETIC OR PROTEIN-RELATED DATA PROCESSING IN COMPUTATIONAL MOLECULAR BIOLOGY
- G16B30/00—ICT specially adapted for sequence analysis involving nucleotides or amino acids
- G16B30/10—Sequence alignment; Homology search
-
- G—PHYSICS
- G16—INFORMATION AND COMMUNICATION TECHNOLOGY [ICT] SPECIALLY ADAPTED FOR SPECIFIC APPLICATION FIELDS
- G16B—BIOINFORMATICS, i.e. INFORMATION AND COMMUNICATION TECHNOLOGY [ICT] SPECIALLY ADAPTED FOR GENETIC OR PROTEIN-RELATED DATA PROCESSING IN COMPUTATIONAL MOLECULAR BIOLOGY
- G16B10/00—ICT specially adapted for evolutionary bioinformatics, e.g. phylogenetic tree construction or analysis
-
- G—PHYSICS
- G16—INFORMATION AND COMMUNICATION TECHNOLOGY [ICT] SPECIALLY ADAPTED FOR SPECIFIC APPLICATION FIELDS
- G16B—BIOINFORMATICS, i.e. INFORMATION AND COMMUNICATION TECHNOLOGY [ICT] SPECIALLY ADAPTED FOR GENETIC OR PROTEIN-RELATED DATA PROCESSING IN COMPUTATIONAL MOLECULAR BIOLOGY
- G16B20/00—ICT specially adapted for functional genomics or proteomics, e.g. genotype-phenotype associations
-
- G—PHYSICS
- G16—INFORMATION AND COMMUNICATION TECHNOLOGY [ICT] SPECIALLY ADAPTED FOR SPECIFIC APPLICATION FIELDS
- G16B—BIOINFORMATICS, i.e. INFORMATION AND COMMUNICATION TECHNOLOGY [ICT] SPECIALLY ADAPTED FOR GENETIC OR PROTEIN-RELATED DATA PROCESSING IN COMPUTATIONAL MOLECULAR BIOLOGY
- G16B20/00—ICT specially adapted for functional genomics or proteomics, e.g. genotype-phenotype associations
- G16B20/20—Allele or variant detection, e.g. single nucleotide polymorphism [SNP] detection
-
- G—PHYSICS
- G16—INFORMATION AND COMMUNICATION TECHNOLOGY [ICT] SPECIALLY ADAPTED FOR SPECIFIC APPLICATION FIELDS
- G16B—BIOINFORMATICS, i.e. INFORMATION AND COMMUNICATION TECHNOLOGY [ICT] SPECIALLY ADAPTED FOR GENETIC OR PROTEIN-RELATED DATA PROCESSING IN COMPUTATIONAL MOLECULAR BIOLOGY
- G16B40/00—ICT specially adapted for biostatistics; ICT specially adapted for bioinformatics-related machine learning or data mining, e.g. knowledge discovery or pattern finding
Definitions
- the present invention relates to a method, a prediction program, and a prediction apparatus for predicting a gene cluster including a secondary metabolic gene among gene clusters composed of a plurality of genes.
- Secondary metabolites are highly likely to have physiological activity and are extremely useful as lead compounds for pharmaceuticals. Secondary metabolites are diverse and have been discovered from various species such as actinomycetes, fungi, plants, etc., but the conditions for expression are often special and unknown, and many secondary properties with useful properties Metabolites are thought to be sleeping without being discovered. Even if it is discovered, it is a problem in use that it is difficult to produce a stable and sufficient amount.
- secondary metabolic genes genes involved in the discovery of useful unknown secondary metabolites and the biosynthesis of secondary metabolites (secondary metabolic genes) can be identified.
- secondary metabolic genes have been difficult to identify with high accuracy using current comparative genomic analysis methods. This is because secondary metabolic genes often contradict evolutionary phylogenetic trees of the genus / species and there are many unknown genes whose functions have not been elucidated at all.
- core genes such as polyketide synthase gene (PKS gene) and nonribosomal peptide synthetase gene (NRPS gene) It was a method of predicting as a cluster including genes associated therewith.
- core genes such as polyketide synthase gene (PKS gene) and nonribosomal peptide synthetase gene (NRPS gene)
- PKS gene polyketide synthase gene
- NRPS gene nonribosomal peptide synthetase gene
- SMURF described in Non-Patent Document 1
- antiSMASH described in Non-Patent Document 2
- CLUSEAN described in Non-Patent Document 3
- ClustScan described in Non-Patent Document 4.
- clusters detected by these methods are limited to secondary metabolic gene clusters having a core gene, and are only a part of the entire cluster including secondary metabolic genes. In other words, with these methods, it was impossible to predict a secondary metabolic gene cluster that does not include the core gene that is expected to account for more than half of the total.
- CLUSEAN A computer-based framework for the automated analysis of bacterial secondary metabolite biosynthetic gene clusters.JOURNAL OF BIOTECHNOLOGY. 140, Starcevic Antonio; Zucko Jurica; Simunkovic Jurica; et al.
- ClustScan an integrated program package for the semi-automatic annotation of modular biosynthetic gene clusters and in sil 6821 2008)
- the present invention provides a method, a prediction program, and a prediction apparatus capable of predicting a gene cluster including a secondary metabolic gene with high accuracy without depending on information on the core gene in view of the above-described actual situation. With the goal.
- the present invention that has achieved the above-described object includes the following.
- the gene cluster is a gene cluster including a secondary metabolic gene (1)
- the synteny-like region includes at least two ortholog genes, and the distance between adjacent ortholog genes is a region within a predetermined distance in each of the genomic base sequence information and the other genomic base sequence information.
- the synteny-like region includes at least one pair of genomic base sequence information used for comparison and third genomic base sequence information different from the pair of genomic base sequence information.
- the prediction method according to (1) wherein a synteny region / non-synteny region is determined in advance, and the synteny region is defined as a synteny-like region.
- the number of homologous genes included in the identified gene cluster and / or the number of all genes included in the identified gene cluster are compared with a predetermined reference value, and the homologous gene Performing the above-described process for determining whether the gene cluster is a gene cluster including a secondary metabolic system gene for a gene cluster in which the number of genes is greater than or equal to a reference value and / or a gene cluster in which the number of all genes is less than the reference value (1)
- the prediction method according to (1) The prediction method according to (1).
- the number of all genes included in the specified gene cluster is compared with a predetermined reference value, or the length of the specified gene cluster is compared with a predetermined reference value. Then, for a gene cluster whose total number or length is less than the reference value, a step is performed to determine whether the gene cluster is a gene cluster including a secondary metabolic gene, and the gene cluster includes a secondary metabolic gene. In the step of determining whether it is a cluster, the gene cluster is corrected by adding a gene adjacent to the gene cluster so that the number of genes included in the determination target gene cluster is equal to the number of the reference values.
- a prediction method according to (1) characterized in that a synteny-like region is identified for a modified gene cluster composed of a reference number of genes. .
- the step of specifying the gene cluster After the step of specifying the gene cluster, the number of all genes included in the specified gene cluster is compared with a predetermined reference value, or the length of the specified gene cluster is compared with a predetermined reference value. Then, for a gene cluster whose total number or length is less than the reference value, a step is performed to determine whether the gene cluster is a gene cluster including a secondary metabolic gene, and the gene cluster includes a secondary metabolic gene. In the step of determining whether it is a cluster, a predetermined number of genes or a region of a predetermined length is added to the determination target gene cluster to correct the gene cluster, and the corrected gene cluster is a synteny-like region. (1) The prediction method according to (1).
- the gene cluster is specified by tracing back from the cell showing the maximum score (1 ) The prediction method described.
- the sequence of other genes is stored by substituting 0 for the score of the cell included in the specified gene cluster and tracing back the Smith-Waterman matrix.
- the region according to claim 12, wherein the region in which the gene sequence is stored is identified again by the Smith-Waterman algorithm for the identified region, and the region is identified as a gene cluster.
- the number of all genes included in the specified gene cluster is compared with a predetermined reference value, or the length of the specified gene cluster is compared with a predetermined reference value. And adding a predetermined number of genes or a region of a predetermined length to the gene cluster to expand the gene cluster to be the reference value, For each gene constituting the expanded gene cluster, a positive score is obtained if there is a homology with the genes constituting the gene cluster to be compared in other genomic nucleotide sequence information, and a minus is obtained if there is no homology.
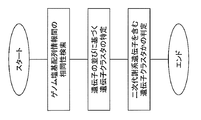
- FIG. 5 is a flowchart relating to a method for predicting gene clusters including secondary metabolic genes according to the present invention.
- the prediction method which concerns on this invention it is a conceptual diagram of the matrix produced in Smith-Waterman algorithm at the time of specifying a gene cluster.
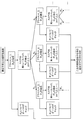
- the prediction method which concerns on this invention it is a flowchart which shows the process until it identifies a gene cluster, performs an ortholog check to the identified gene cluster, and finally identifies the gene cluster containing a secondary metabolic system gene.
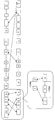
- It is a schematic diagram for demonstrating the step which performs an ortholog check by applying the prediction method which concerns on this invention.
- the method for predicting a gene cluster including a secondary metabolic gene specifies a gene cluster based on a sequence of genes in the compared genome by using the result of homology search for genes contained in at least a pair of genomes. And a step of determining whether the identified gene cluster is a gene cluster including a secondary metabolic gene (FIG. 1).
- secondary metabolic genes mean genes involved in the biosynthesis of secondary metabolites.
- Secondary metabolites are metabolites that are not directly involved in the life activity of an organism.
- a metabolite will be comprised from a primary metabolite and a secondary metabolite.
- the secondary metabolite can be said to be a metabolite excluding the primary metabolite.
- the primary metabolite is a substance that directly participates in the life activity of an organism, and means, for example, sugar, amino acid, lipid, and nucleic acid.
- secondary metabolites may be defined as substances other than sugars, amino acids, lipids and nucleic acids among metabolites. Examples of secondary metabolites include antibiotics, alkaloids, terpenoids, flavonoids, polyketides, phenols, glycosides, and special amino acids that do not constitute proteins.
- genes involved in biosynthesis of secondary metabolites include genes encoding enzymes involved in secondary metabolite assimilation or catabolism, and proteins involved in translocation / accumulation of secondary metabolites. And a gene encoding a protein involved in regulation of the expression of these genes.
- secondary metabolic genes include genes involved in biosynthesis of polyketides, non-ribosomal peptides, alkaloids, terpenoids, flavonoids, and other compounds not belonging to primary metabolism. It should be noted that the gene cluster predicted by the prediction method according to the present invention does not necessarily include these specifically exemplified secondary metabolic genes, but may also include other secondary metabolic genes.
- a gene cluster is a group of a plurality of genes included in a predetermined continuous region, and a group of a plurality of genes whose arrangement is preserved between a plurality of genomes (for example, between a pair of genomes).
- the continuous region means a region included in the whole genome or a part of the genome composed of nucleic acids such as chromosomes and mitochondria. That is, the gene cluster means a group of a plurality of genes whose arrangement is preserved in a continuous region included in the whole genome or a part of the genome.
- Genome base sequence information is text data in which four types of nucleotides consisting of adenine, guanine, cytosine, and thymine are expressed as A, G, C, and G, respectively. Genome base sequence information is expressed in the direction from the 5 ′ end to the 3 ′ end.
- one or both of the pair of genome base sequence information may use data acquired from a database storing various genome base sequence information or the like, or unknown or publicly known by applying DNA sequencing technology Data obtained from other organisms may be used.
- DNA sequencing technology for example, all methods described in Chapter 11 of Molecular-Cloning, A-Laboratory-Manual, Fourth-Edition (Cold-Spring-Harbor-Laboratoty-Press) can be applied.
- the prediction method according to the present invention is not limited to biological species at all, and gene clusters including secondary metabolic genes can be predicted.
- the biological species include plants, bacteria, actinomycetes, fungi, filamentous fungi, mushrooms and the like.
- the genome base sequence information may be data in which the species of origin is not clarified.
- a base sequence can be determined for DNA directly extracted from an environment such as soil, sludge, lake water, and seawater without culturing, so-called environmental DNA, and this can be used as genome base sequence information. That is, in the prediction method according to the present invention, a gene cluster including secondary metabolic genes existing in environmental DNA can be predicted.
- a gene cluster from at least a pair of genomic base sequence information, first, based on the genomic base sequence information, the arrangement of a plurality of genes existing in the pair of genomic base sequence information is compared, and the gene sequence is stored. Identify the region.
- the amino acid sequence is used as a query sequence (query sequence), and the homology is searched using the amino acid sequence related to the gene included in the other genome base sequence information as a database sequence.
- query sequence amino acid sequence related to the gene included in the other genome base sequence information
- homology search conventionally known homology analysis software such as Blastp, FASTA and Clustal can be used.
- homology search is similarly performed by replacing the genome base sequence information as the query sequence and the genome base sequence information as the database sequence.
- genes having high sequence similarity can be mutually identified between a pair of genome base sequence information.
- a threshold can be set for a value indicating sequence similarity, and a combination of genes exceeding the threshold can be specified as a homologous gene.
- combinations that satisfy a predetermined standard can be specified as orthologous genes.
- an ortholog gene is defined as a gene having homology formed by differentiation of a single gene having a common origin.
- examples of the value indicating sequence similarity include values such as E value (e-value), bits value (bits), and amino acid identity (Identities) in Blast search. Therefore, a combination of genes can be specified as a homologous gene by setting a threshold value for one or more of these values. For example, specifically, a homology search between a query sequence and a database sequence, and a homology search performed by exchanging the query sequence and the database sequence (these are collectively referred to as a “set of homology searches”)
- the threshold value can be set to, for example, 1.0e-20, preferably 1.0e-15, particularly preferably 1.0e-10. Then, in a set of homology searches, a combination of genes each having an E value equal to or less than a threshold value can be specified as a homologous gene in both genome base sequence information.
- a standard is set so that a combination that matches the above-mentioned definition of the ortholog gene can be selected.
- a standard is set so that a combination that matches the above-mentioned definition of the ortholog gene can be selected.
- the method for specifying a combination of ortholog genes from a combination of homologous genes specified by a set of homology searches is not limited to the above-described method.
- the arrangement of the genes in the pair of genome base sequence information is compared, and the region where the gene sequence is stored is specified.
- a plurality of genes existing in the genomic base sequence information are regarded as character strings by considering the genes as characters, and character string search and character Algorithms that compare the similarity of columns can be applied.
- Examples of algorithms that can be used in this process include a Smith-Waterman algorithm, a Needleman-Wunsch algorithm, and a k-tuple method that are character string search algorithms.
- a matrix (two-dimensional) of (J + 1) ⁇ (I + 1) is created (FIG. 2).
- a score calculated according to the following procedure is entered in each cell of the matrix. That is, for each cell, when x i and y j are homologous
- a set of coordinates of cells having high homology with x i and y j is R 0 .
- gap and mismatch are penalty scores, which are set in the range of about -0.4 to -0.1, but preferably both are -0.2.
- R 0 is in a region where gene sequences are stored and is a set of coordinates of highly homologous gene pairs.
- this R 0 is a gene cluster, that is, a group of a plurality of genes whose arrangement is preserved in a pair of genome base sequence information.
- the prediction method according to the present invention it is possible to determine whether the gene cluster R 0 specified as described above is a gene cluster including a secondary metabolic gene, as will be described in detail later.
- the prediction method according to the present invention is not limited to the gene cluster R 0 identified as described above, and further different gene clusters R ′ 0 are identified by the following procedure, and two of these gene clusters R ′ 0 are identified. It can also be determined whether the gene cluster includes a secondary metabolic gene (FIG. 3).
- 0 is assigned to all the cells indicated by the coordinates included in the set obtained by the previous operation (initially R 0 ). That is,
- the synteny-like region in the identified gene cluster can be evaluated using the number and distance of orthologous genes included in the gene cluster.
- the gene cluster or R 0, R '0, R ''0 ... gene clusters shown in shown in R 0, a combination of a homologous gene, for example, two or more, and preferably contains three or more
- the total number of genes is, for example, within 50, preferably within 40, and more preferably within 35.
- an ortholog check is performed on a gene cluster that satisfies the above-described conditions (for example, condition * 2).
- the gene cluster is corrected so that the number of genes included in the gene cluster becomes the total number of genes under the above conditions (for example, 35 genes in the case of condition * 2) (FIG. 4).
- genes existing in the vicinity of the gene cluster are added to the gene cluster specified in the above step so that, for example, a total of 35 genes are obtained. For example, by adding the same number of genes from both ends of the gene cluster specified in the above step, it can be corrected to a gene cluster consisting of a total of 35 genes, for example.
- the number of genes to be expanded is an odd number, there is no particular limitation, but one more or less genes may be added to the 3 ′ end of the gene cluster.
- the total number of genes is set to 35 genes, for example, errors at the boundaries of the gene clusters identified in the above process can be taken into account, and the distribution of orthologous gene pairs in the nearby region is also averaged. Can be evaluated.
- the number of genes is partially omitted for simplicity.
- the synteny-like region means a region containing a plurality of orthologous genes, and the distance between adjacent orthologous genes (which may contain other genes in between) is not more than a reference value.
- the reference value can be, for example, 10 to 30 kb, 10 to 20 bk, or 10 kb.
- the regions 1 to A and 2 to a are synteny-like regions. It can be. Similarly, all the combinations of orthologous genes contained in X and Y are confirmed to be synteny-like regions. There may be a plurality of synteny-like regions.
- the synteny-like regions identified in X and Y are represented by X and Y subsets xSB and ySB, respectively.
- the gene cluster consisting of x i and the gene cluster consisting of y j It is determined that the gene cluster is included.
- the predetermined ratio is not particularly limited, but may be 30%, 25%, or 20%. For example, when the predetermined ratio is 25% (condition * 3)
- the method for predicting a gene cluster including a secondary metabolic gene is not limited to a method using a synteny-like region specified according to the above procedure, and a synteny-like region specified by another method may be used.
- a method for specifying a synteny-like region for example, a method of predetermining a synteny region and a non-synteny region using genomic base sequence information and annotation information of different species can be mentioned.
- a gene cluster containing secondary metabolic genes can be predicted in the same manner as described above. That is, even if the method for specifying the synteny-like region from the synteny region is used as described above, the method similar to the determination of the synteny-like region can be applied as described with reference to FIG. That is, orthologous genes for genes predicted on two types of genomes are determined in advance, the synteny region defined as described above is specified, and regions other than the synteny region in the genomic nucleotide sequence information are defined as non-synteny regions. Define.
- R 0 gene cluster or R 0 shown by a, R '0, R'' 0 ... gene clusters shown in extend the cluster length by the same method as described above (e.g., 35 genes)
- the synteny region is less than 25% of the total, it can be predicted as a gene cluster including secondary metabolic genes.
- This method may be able to predict a gene cluster containing a secondary metabolic gene with higher accuracy than the method of identifying a synteny-like region after detecting a gene cluster as described above.
- a gene cluster containing a secondary metabolic gene with higher accuracy than the method of identifying a synteny-like region after detecting a gene cluster as described above.
- closely related species such as A. flavus and A. oryzae
- there is no second gene cluster that is highly homologous to the same gene cluster in other strains of A.usflavus or A.oryzae so it is considered that the aflatoxin biosynthesis cluster present in A. flavus is not detected. .
- a synteny region is defined as a region of a gene that exists in common among relatively related species such as the genus Aspergillus.
- the gene cluster to be evaluated is limited based on the number of genes included in the gene cluster as described above.
- the gene cluster to be evaluated may be limited based on the length of the gene cluster. That is, the length of a gene cluster can be compared with a predetermined reference value, and an ortholog check can be performed for a gene cluster having a length shorter than the reference value.
- the reference value is not particularly limited, but for example, 125 kb (equivalent to about 50 genes), preferably 100 kb (equivalent to about 40 genes), more preferably 87.5 kb (about 35 genes). Equivalent).
- the number of genes included in the gene cluster is set to a predetermined number (for example, 35) before the ortholog check is performed.
- the gene cluster was corrected.
- the gene cluster is corrected by adding a predetermined number of genes or a predetermined length region to the gene cluster, and the corrected gene cluster An ortholog check may be performed for.
- Examples of the method for correcting gene clusters include a method for correcting the boundaries of gene clusters, as will be described below. That is, it is a method of correcting the boundaries of gene clusters indicated by the identified R 0 , R ′ 0 , R ′′ 0 .
- To correct the boundaries of a gene cluster is to determine whether the gene cluster specified by the method described in the section ⁇ Specify gene cluster> described above includes a gene that exists outside the gene cluster. It is synonymous.
- the number of genes included in the gene cluster is 15 as described above.
- the gene cluster is expanded to ⁇ 65 genes, more preferably 35 genes (not limited to 35 genes).
- a positive score is given when a gene with high homology exists in the gene cluster to be compared, and a negative score is obtained when there is no gene with high homology.
- the scores given to the genes are summed in order from the genes located at the center of the expanded gene cluster, and the total score value is given to each gene.
- the gene having the maximum score given to each gene included in the expanded gene cluster is identified, and the identified gene is set as the boundary of the gene cluster. This process may leave the genes that are the boundaries of the gene clusters unmodified and remain in the original gene clusters.
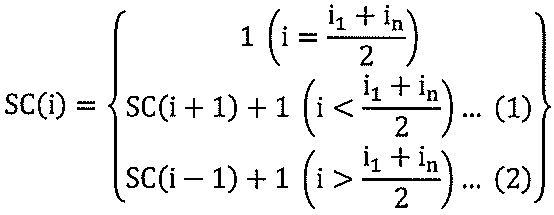
- a one-dimensional array SC composed of n (X) elements was prepared.
- Each element of this array can contain, for example, a score calculated according to the following formula: When x i is homologous to at least one of y c , y c-1 ,... y d-1 , y d
- the element numbers of the elements having the maximum scores in the respective ranges (1) and (2) are set as i start and i stop .
- the same operation is performed on the set Y.
- the i start and i stop specified in this way are used as the boundaries of the gene cluster. That is, the gene clusters whose boundaries are corrected are
- negative values are, for example, ⁇ 0.1, ⁇ 0.2, ⁇ 0.3 , -0.4, -0.5, or -1.
- the method for predicting a gene cluster including a secondary metabolic gene according to the present invention described above includes an input means such as a mouse and a keyboard, a central processing means (CPU), a storage means including a volatile and / or nonvolatile memory. And a computer having output means such as a display. At this time, the computer is preferably connected to a storage device such as an external database or an external computer system via a communication network such as the Internet or an intranet. That is, the prediction method according to the present invention can be provided as a prediction program capable of predicting a gene cluster including a secondary metabolic system gene using the computer device having the above configuration. In other words, the computer on which this prediction program is installed serves as a prediction device for gene clusters including secondary metabolic genes.
- a pair of genome base sequence information may be input from an external storage means or computer system to the computer via the communication network, or via a DNA sequencer and an interface. May be connected and input to the computer.
- a pair of genome base sequence information may be read into a computer using a storage medium such as a DVD or CD.
- the central processing unit can execute the homology search for the pair of genome base sequence information, and the result of the homology search can be stored in the storage device.
- the above-described ⁇ identification of gene cluster> procedure and ⁇ determination of gene cluster including secondary metabolic gene> are realized by software implementing a character string search algorithm such as the Smith-Waterman algorithm. be able to.
- Example 1 In this example, eight types of genome data sets were used. Among them, Aspergillus oryzae data used was equivalent to that registered in GenBank (AP007150-AP007177). Aspergillus flavus data was downloaded from GenBank in genbank format. (genbank accession EQ963472 to EQ963493). Data on Aspergillus fumigatas, Aspergillus nidulans, Aspergillus terreus, Magnaporthe grisea, Fusarium graminearum and Chaetomium globosum were downloaded from BROAD INSTITUTE and used.
- homologous genes are those whose E value (E-value) is 1.0e-10 or less in the homology search.
- E-value E value
- the conservation of the gene sequence was verified by the Smith-Waterman algorithm, and gene clusters R 0 , R ′ 0 , R ′′ 0 .
- the number of combinations of homologous genes contained in the identified gene cluster was set to 3 or more, and the total number of genes was set to less than 35.
- the synteny-like region is a region containing a plurality of orthologous genes, and the distance between adjacent orthologous genes (which may contain other genes between them) is 10 bk or less, 20 kb or less, or 30 kb. The following areas were defined.
- the number of genes (number of elements in the subset) included in the synteny-like region (X and Y subsets xSB and ySB) is less than 25% (less than 8) of 35 genes.
- the original gene cluster was predicted as a gene cluster containing secondary metabolic genes.
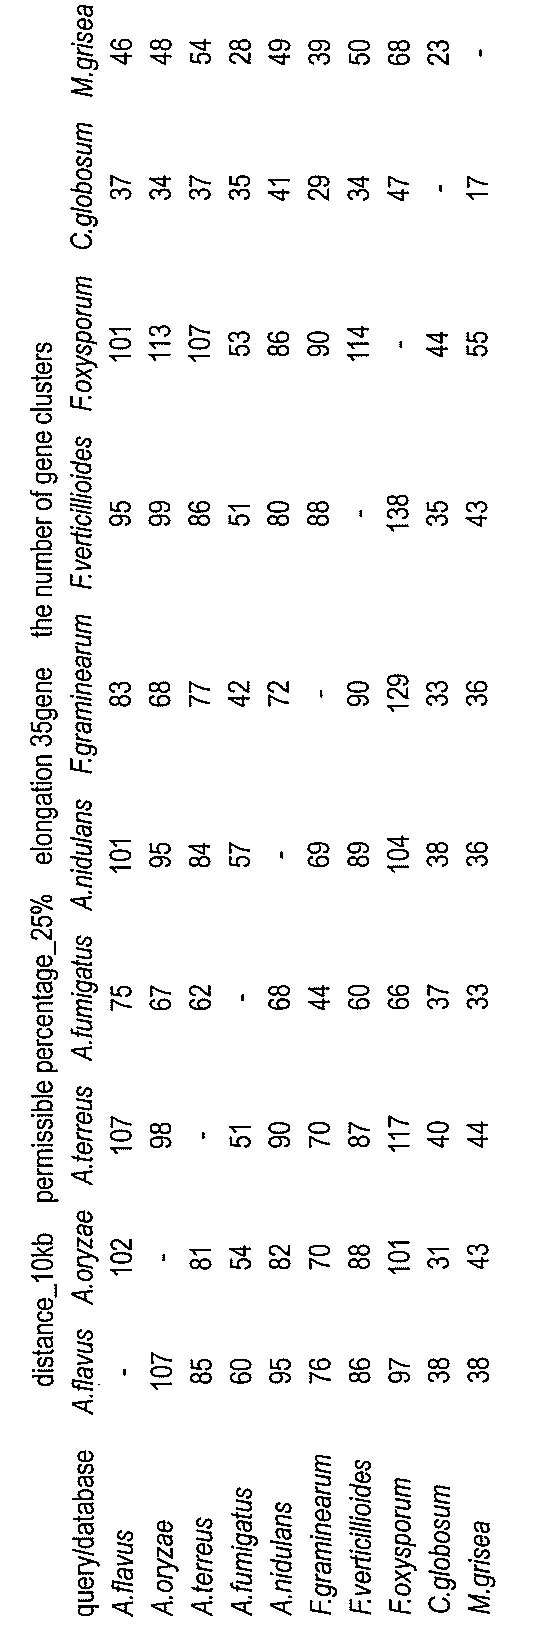
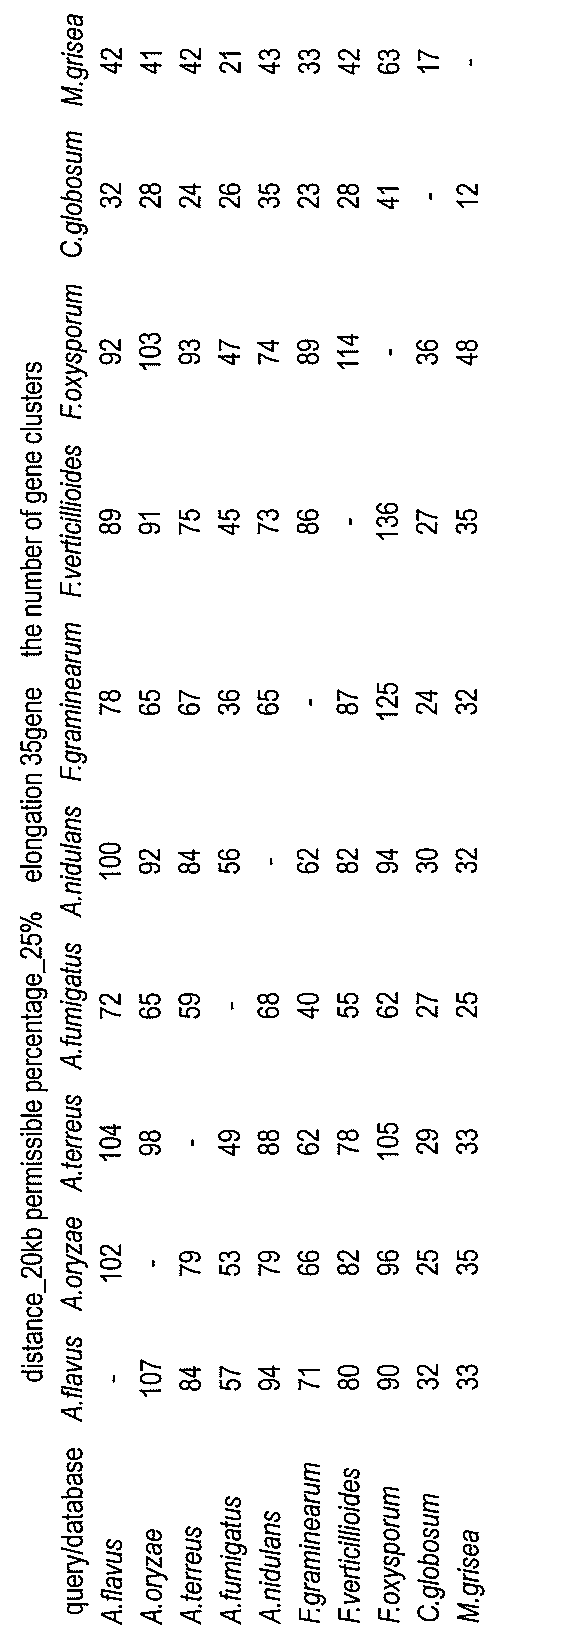
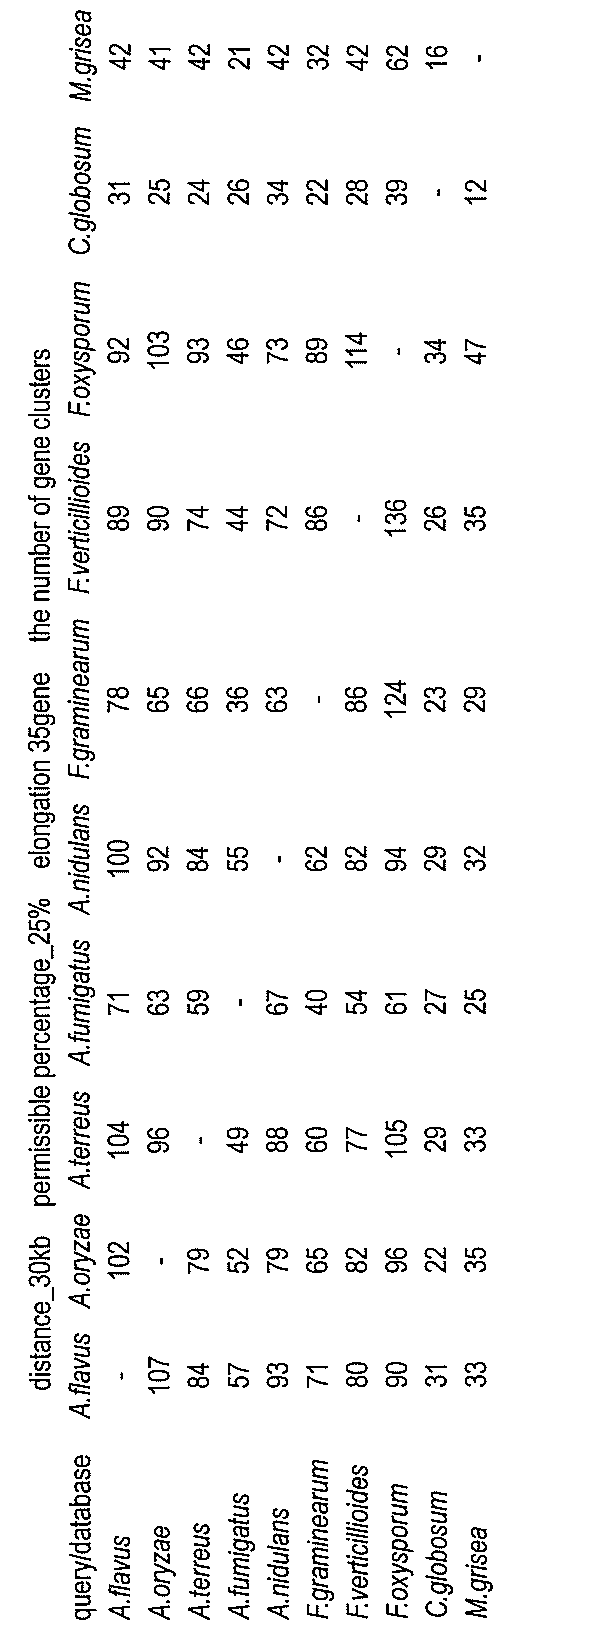
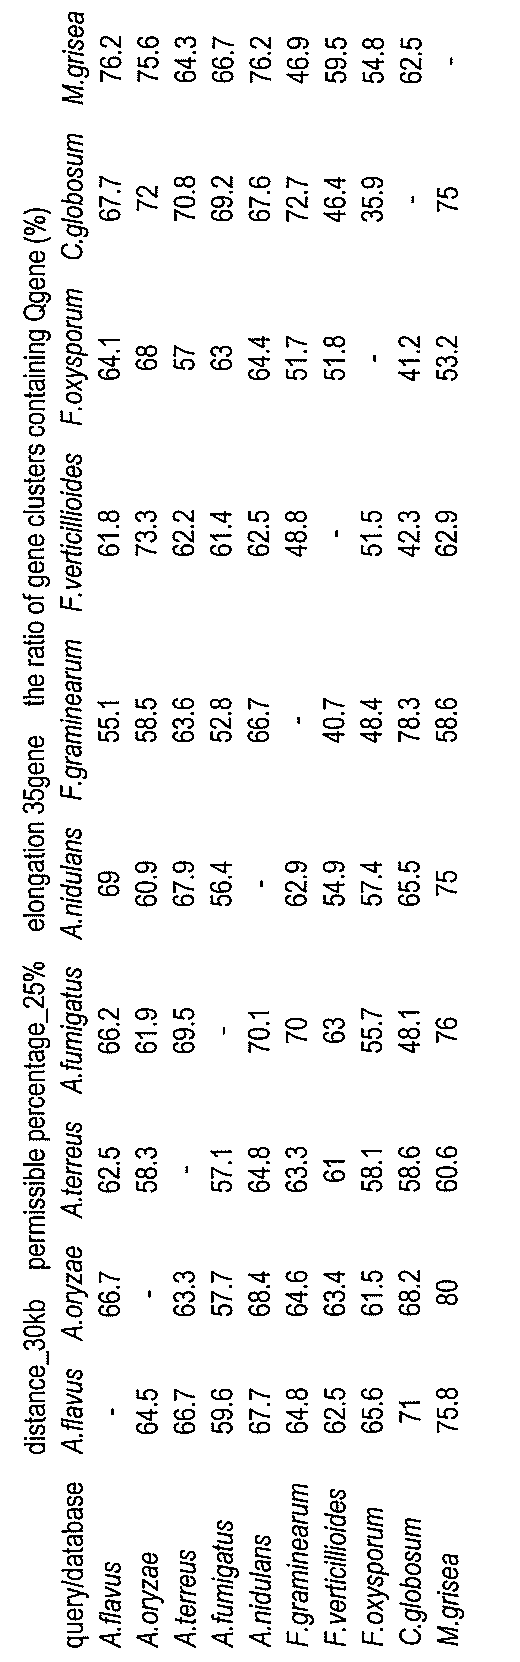
- the number of gene clusters containing secondary metabolic genes predicted using 10 genome base sequences of filamentous fungi that have been subjected to genome analysis such as A. flavus and A. oryzae is shown. It was shown in 1.
- Table 1-1 shows the results when the distance between adjacent orthologous genes in the synteny-like region is defined as 10 bk or less, and Table 1-2 shows the results when the distance is 20 kb or less.
- -3 shows the result when the distance is 30 kb or less. From this result, it was clarified that if the distance between the orthologue genes adjacent to the synteny-like region is defined as 10 to 30 bk or less, the result does not vary greatly.
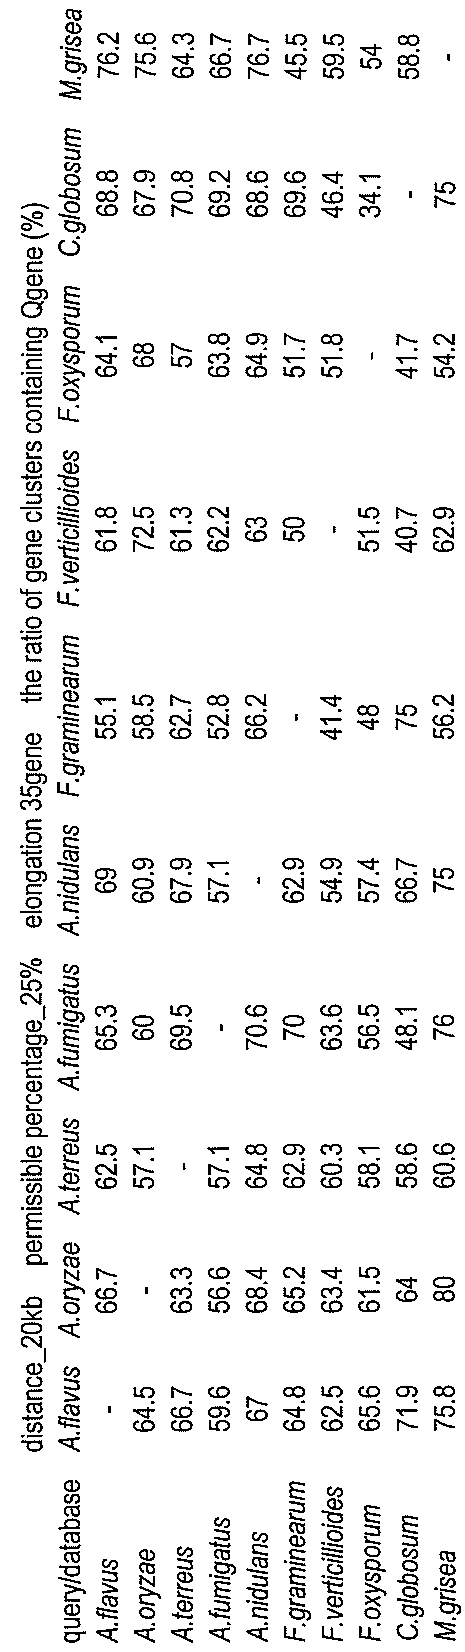
- Table 2 shows the result of calculating the ratio of those predicted to be gene clusters containing secondary metabolic genes in this example and containing the Q gene.
- the Q gene is a gene classification that is considered as a secondary metabolic system in the functional classification of the COG (Cluster of Orthologous Group).
- Example 2 In this example, in the same manner as in Example 1, the gene sequence conservation was verified by the Smith-Waterman algorithm, and gene clusters R 0 , R ′ 0 , R ′′ 0 .
- +1 is given to each gene included in the gene cluster expanded to 35 genes when there is a homologous gene, If not, -0.3 is given, and the total score is calculated from the center of the expanded gene cluster, and the gene taking the maximum of the total value is used as the boundary of the gene cluster.
- gene clusters including secondary metabolic genes were predicted.
- Table 3 shows a part of the gene cluster including the secondary metabolic genes predicted in this example. Further, similarly to Example 1, Table 4 shows gene clusters including secondary metabolic genes predicted without correcting the boundaries of the gene clusters.
- the error column indicates how much the predicted gene cluster is in the upstream direction (5 ′ side) and downstream direction (3 ′ side) with respect to the actual gene cluster of the secondary metabolic system gene. The number of genes is shown whether it is wrong.
Landscapes
- Life Sciences & Earth Sciences (AREA)
- Physics & Mathematics (AREA)
- Health & Medical Sciences (AREA)
- Engineering & Computer Science (AREA)
- Bioinformatics & Cheminformatics (AREA)
- Medical Informatics (AREA)
- General Health & Medical Sciences (AREA)
- Biophysics (AREA)
- Bioinformatics & Computational Biology (AREA)
- Biotechnology (AREA)
- Evolutionary Biology (AREA)
- Spectroscopy & Molecular Physics (AREA)
- Theoretical Computer Science (AREA)
- Proteomics, Peptides & Aminoacids (AREA)
- Analytical Chemistry (AREA)
- Chemical & Material Sciences (AREA)
- Genetics & Genomics (AREA)
- Molecular Biology (AREA)
- Physiology (AREA)
- Animal Behavior & Ethology (AREA)
- Artificial Intelligence (AREA)
- Bioethics (AREA)
- Computer Vision & Pattern Recognition (AREA)
- Data Mining & Analysis (AREA)
- Databases & Information Systems (AREA)
- Epidemiology (AREA)
- Evolutionary Computation (AREA)
- Public Health (AREA)
- Software Systems (AREA)
- Measuring Or Testing Involving Enzymes Or Micro-Organisms (AREA)
- Management, Administration, Business Operations System, And Electronic Commerce (AREA)
Description
拡張した遺伝子クラスタを構成する各遺伝子について、他のゲノム塩基配列情報における比較対象の遺伝子クラスタを構成する遺伝子との間で相同性がある場合にはプラスのスコア、相同性がない場合にはマイナスのスコアを与え、
遺伝子クラスタの中心に位置する遺伝子から端に向かって順にスコアの合計値を算出し、スコアの合計値が極大値となる遺伝子を遺伝子クラスタの境界として特定し、
境界として特定された遺伝子により挟み込まれる領域を遺伝子クラスタとすることを特徴とする(1)記載の予測方法。
本方法においては、先ず、遺伝子クラスタを特定する。ここで、遺伝子クラスタとは、所定の連続した領域に含まれる複数の遺伝子からなる群であって、複数のゲノム間(例えば、一対のゲノム間)で並びが保存された複数の遺伝子の群を意味する。連続した領域とは、染色体、ミトコンドリアといった核酸から構成されるゲノム全体或いはゲノムの一部に含まれる領域を意味する。すなわち、遺伝子クラスタとは、ゲノム全体或いはゲノムの一部に含まれる連続した領域において、並びが保存された複数の遺伝子の群を意味する。






以上のようにして特定された、R0で示す遺伝子クラスタ又はR0、R'0、R''0…で示す遺伝子クラスタ群について、二次代謝系遺伝子を含む遺伝子クラスタであるかを判定する(図3における「オーソログチェック」)。

in:ゲノム中での遺伝子の位置
次に、上述の条件(例えば条件※2)を満たす遺伝子クラスタについてオーソログチェックを行う。オーソログチェックを実施する前に、遺伝子クラスタに含まれる遺伝子の数が上記条件における全体の遺伝子数(例えば条件※2の場合には35遺伝子)となるように遺伝子クラスタを修正する(図4)。具体的には、上記工程で特定された遺伝子クラスタに対して、例えば合計35遺伝子になるように、遺伝子クラスタの近傍に存在する遺伝子を追加する。例えば、上記工程で特定された遺伝子クラスタの両端から、同じ数の遺伝子を加えることで例えば合計35遺伝子からなる遺伝子クラスタに修正することができる。なお、拡充する遺伝子の数が奇数である場合、特に限定されないが、遺伝子クラスタの3'末端に1つ多い数又は少ない数の遺伝子を加えればよい。このように、合計の遺伝子の数を例えば35遺伝子とすることで、上記工程で特定された遺伝子クラスタの境界における誤差を考慮することができ、近傍の領域におけるオーソロガス遺伝子ペアの分布も平均化して評価することができる。なお、図4は、簡単のために遺伝子数を一部省略している。






以上で説明した本発明に係る二次代謝系遺伝子を含む遺伝子クラスタの予測方法は、マウスやキーボード等の入力手段、中央演算処理手段(CPU)、揮発性及び/又は不揮発性メモリを含む記憶手段及びディスプレイ等の出力手段を備えるコンピュータにて実行することができる。このとき、コンピュータは、外部のデータベース等の記憶装置や外部のコンピュータシステム等に対してインターネットやイントラネット等の通信回線網を介して接続されていることが好ましい。すなわち、本発明に係る予測方法は、上記構成のコンピュータ装置を用いて二次代謝系遺伝子を含む遺伝子クラスタを予測することができる予測プログラムとして提供することができる。また、この予測プログラムをインストールしたコンピュータは、言い換えると、二次代謝系遺伝子を含む遺伝子クラスタの予測装置となる。
本実施例では、8種類のゲノムのデータセットを使用した。このうち、Aspergillus oryzaeのデータはGenBankに登録したもの(AP007150-AP007177)と同等のものを使用した。Aspergillus flavusのデータはGenBankよりgenbank形式のファイルをダウンロードして使用した。(genbank accession EQ963472~EQ963493)。Aspergillus fumigatas、Aspergillus nidulans、Aspergillus terreus、Magnaporthe grisea、Fusarium graminearum及びChaetomium globosumのデータはBROAD INSTITUTE よりダウンロードして使用した。

本実施例では、実施例1と同様にして、Smith-Watermanアルゴリズムにより遺伝子の並びの保存性を検証し、遺伝子クラスタR0、R'0、R''0…を特定した。また、本実施例では、特定した遺伝子クラスタの境界を修正する工程として、35遺伝子となるように拡張した遺伝子クラスタに含まれる各遺伝子について、相同遺伝子がある場合には+1を与え、相同遺伝子がない場合には-0.3を与え、拡張した遺伝子クラスタの中心からスコアの合計値を算出し、合計値の極大値を取る遺伝子を遺伝子クラスタの境界とした以外は、実施例1と同様にして、二次代謝系遺伝子を含む遺伝子クラスタを予測した。


Claims (45)
- 少なくとも一対のゲノム塩基配列情報に含まれる遺伝子に関して相互に相同性検索し、これらゲノム塩基配列情報間で相同遺伝子の組み合わせ、相同遺伝子の組み合わせのなかでオーソログ遺伝子の組み合わせを同定する工程と、
上記相同性検索の結果に基づいて他のゲノム塩基配列情報との間で遺伝子の並びが保存されている領域を遺伝子クラスタとして特定する工程と、
上記工程で特定された遺伝子クラスタのうち、上記相同性検索の結果のうちオーソログ遺伝子の存在に基づいてシンテニー様領域を特定し、当該シンテニー様領域が占める割合に基づいて、当該遺伝子クラスタが二次代謝系遺伝子を含む遺伝子クラスタであるか判定する工程と
を含む二次代謝系遺伝子を含む遺伝子クラスタの予測方法。 - 上記シンテニー様領域に含まれる遺伝子数が上記遺伝子クラスタ全体に含まれる遺伝子数に対して、所定の割合以下である場合に当該遺伝子クラスタが二次代謝系遺伝子を含む遺伝子クラスタであると判定することを特徴とする請求項1記載の予測方法。
- 上記所定の割合を25%とすることを特徴とする請求項2記載の予測方法。
- 上記シンテニー様領域は、少なくとも2以上のオーソログ遺伝子を含み、隣接するオーソログ遺伝子の距離が上記ゲノム塩基配列情報及び上記他のゲノム塩基配列情報のそれぞれにおいて所定の距離以内にある領域とすることを特徴とする請求項1記載の予測方法。
- 上記所定の距離は、10~30kbとすることを特徴とする請求項4記載の予測方法。
- 上記シンテニー様領域は、比較に用いる少なくとも一対のゲノム塩基配列情報のうちの1種のゲノム塩基配列情報と、これら一対のゲノム塩基配列情報とは異なる第3のゲノム塩基配列情報とを用いてシンテニー領域/非シンテニー領域をあらかじめ決定し、このシンテニー領域をシンテニー様領域とすることを特徴とする請求項1記載の予測方法。
- 上記遺伝子クラスタを特定する工程の後、特定した遺伝子クラスタに含まれる相同遺伝子の数及び/又は特定した遺伝子クラスタに含まれる全遺伝子の数を予め定めた基準値を比較し、相同遺伝子の数が基準値以上である遺伝子クラスタ、及び/又は全遺伝子の数が基準値未満の遺伝子クラスタについて、当該遺伝子クラスタが二次代謝系遺伝子を含む遺伝子クラスタであるか判定する上記工程を行うことを特徴とする請求項1記載の予測方法。
- 相同遺伝子の数に関する上記基準値を3個とし、全遺伝子の数に関する上記基準値を35個とすることを特徴とする請求項7記載の予測方法。
- 上記遺伝子クラスタを特定する工程の後、特定した遺伝子クラスタに含まれる全遺伝子の数を予め定めた基準値を比較するか、特定した遺伝子クラスタの長さを予め定めた基準値と比較し、全遺伝子の数又は長さが基準値未満の遺伝子クラスタについて、遺伝子クラスタが二次代謝系遺伝子を含む遺伝子クラスタであるか判定する工程を行い、
遺伝子クラスタが二次代謝系遺伝子を含む遺伝子クラスタであるか判定する工程では、判定対象の遺伝子クラスタに含まれる遺伝子の数が上記基準値の個数となるように、当該遺伝子クラスタに隣接する遺伝子を追加して当該遺伝子クラスタを修正し、当該基準値の個数の遺伝子からなる修正された遺伝子クラスタについてシンテニー様領域を特定することを特徴とする請求項1記載の予測方法。 - 全遺伝子の数に関する上記基準値を35個とすることを特徴とする請求項9記載の予測方法。
- 上記遺伝子クラスタを特定する工程の後、特定した遺伝子クラスタに含まれる全遺伝子の数を予め定めた基準値を比較するか、特定した遺伝子クラスタの長さを予め定めた基準値と比較し、全遺伝子の数又は長さが基準値未満の遺伝子クラスタについて、遺伝子クラスタが二次代謝系遺伝子を含む遺伝子クラスタであるか判定する工程を行い、
遺伝子クラスタが二次代謝系遺伝子を含む遺伝子クラスタであるか判定する工程では、判定対象の遺伝子クラスタに対して、所定の数の遺伝子又は所定の長さの領域を追加して当該遺伝子クラスタを修正し、修正された遺伝子クラスタについてシンテニー様領域を特定することを特徴とする請求項1記載の予測方法。 - 上記遺伝子クラスタを特定する工程では、Smith-Watermanアルゴリズムで作成されるSmith-Watermanマトリックスにおいて、最大のスコアを示すセルからトレースバックすることで遺伝子クラスタを特定することを特徴とする請求項1記載の予測方法。
- 上記遺伝子クラスタを特定する工程では、上記特定された遺伝子クラスタに含まれるセルのスコアに0を代入し、このSmith-Watermanマトリックスについてトレースバックすることで他の遺伝子の並びが保存されている領域を特定し、特定された領域について再度Smith-Watermanアルゴリズムにて遺伝子の並びが保存された領域を特定し、これを遺伝子クラスタとして特定することを特徴とする請求項12記載の予測方法。
- 上記遺伝子クラスタを特定する工程の後、特定した遺伝子クラスタに含まれる全遺伝子の数を予め定めた基準値を比較するか、特定した遺伝子クラスタの長さを予め定めた基準値と比較し、遺伝子クラスタに対して所定の数の遺伝子又は所定の長さの領域を追加して当該遺伝子クラスタが当該基準値となるように拡張し、
拡張した遺伝子クラスタを構成する各遺伝子について、他のゲノム塩基配列情報における比較対象の遺伝子クラスタを構成する遺伝子との間で相同性がある場合にはプラスのスコア、相同性がない場合にはマイナスのスコアを与え、
遺伝子クラスタの中心に位置する遺伝子から端に向かって順にスコアの合計値を算出し、スコアの合計値が極大値となる遺伝子を遺伝子クラスタの境界として特定し、
境界として特定された遺伝子により挟み込まれる領域を遺伝子クラスタとすることを特徴とする請求項1記載の予測方法。 - 全遺伝子の数を予め定めた上記基準値を15~65個とすることを特徴とする請求項14記載の予測方法。
- 入力手段、中央演算処理手段及び記憶手段を備えるコンピュータに対して、
上記中央演算処理手段が少なくとも一対のゲノム塩基配列情報に含まれる遺伝子に関して相互に相同性検索し、これらゲノム塩基配列情報間で相同遺伝子の組み合わせ、相同遺伝子の組み合わせのなかでオーソログ遺伝子の組み合わせを同定する工程と、
上記中央演算処理手段が上記相同性検索の結果に基づいて他のゲノム塩基配列情報との間で遺伝子の並びが保存されている領域を遺伝子クラスタとして特定する工程と、
上記中央演算処理手段が上記工程で特定された遺伝子クラスタのうち、上記相同性検索の結果のうちオーソログ遺伝子の存在に基づいてシンテニー様領域を特定し、当該シンテニー様領域が占める割合に基づいて、当該遺伝子クラスタが二次代謝系遺伝子を含む遺伝子クラスタであるか判定する工程と
を実行させる、二次代謝系遺伝子を含む遺伝子クラスタの予測プログラム。 - 上記中央演算処理手段は、上記シンテニー様領域に含まれる遺伝子数が上記遺伝子クラスタ全体に含まれる遺伝子数に対して、所定の割合以下である場合に当該遺伝子クラスタが二次代謝系遺伝子を含む遺伝子クラスタであると判定することを特徴とする請求項16記載の予測プログラム。
- 上記所定の割合を25%とすることを特徴とする請求項17記載の予測プログラム。
- 上記シンテニー様領域は、少なくとも2以上のオーソログ遺伝子を含み、隣接するオーソログ遺伝子の距離が上記ゲノム塩基配列情報及び上記他のゲノム塩基配列情報のそれぞれにおいて所定の距離以内にある領域とすることを特徴とする請求項16記載の予測プログラム。
- 上記所定の距離は、10~30kbとすることを特徴とする請求項19記載の予測プログラム。
- 上記シンテニー様領域は、比較に用いる少なくとも一対のゲノム塩基配列情報のうちの1種のゲノム塩基配列情報と、これら一対のゲノム塩基配列情報とは異なる第3のゲノム塩基配列情報とを用いてシンテニー領域/非シンテニー領域をあらかじめ決定し、このシンテニー領域をシンテニー様領域とすることを特徴とする請求項16記載の予測プログラム。
- 上記遺伝子クラスタを特定する工程の後、上記中央演算処理手段は、特定した遺伝子クラスタに含まれる相同遺伝子の数及び/又は特定した遺伝子クラスタに含まれる全遺伝子の数を予め定めた基準値を比較し、相同遺伝子の数が基準値以上である遺伝子クラスタ、及び/又は全遺伝子の数が基準値未満の遺伝子クラスタについて、当該遺伝子クラスタが二次代謝系遺伝子を含む遺伝子クラスタであるか判定する上記工程を行うことを特徴とする請求項16記載の予測プログラム。
- 相同遺伝子の数に関する上記基準値を3個とし、全遺伝子の数に関する上記基準値を35個とすることを特徴とする請求項22記載の予測プログラム。
- 上記遺伝子クラスタを特定する工程の後、上記中央演算処理手段は、特定した遺伝子クラスタに含まれる全遺伝子の数を予め定めた基準値を比較するか、特定した遺伝子クラスタの長さを予め定めた基準値と比較し、全遺伝子の数又は長さが基準値未満の遺伝子クラスタについて、遺伝子クラスタが二次代謝系遺伝子を含む遺伝子クラスタであるか判定する工程を行い、
遺伝子クラスタが二次代謝系遺伝子を含む遺伝子クラスタであるか判定する工程では、判定対象の遺伝子クラスタに含まれる遺伝子の数が上記基準値の個数となるように、当該遺伝子クラスタに隣接する遺伝子を追加して当該遺伝子クラスタを修正し、当該基準値の個数の遺伝子からなる修正された遺伝子クラスタについてシンテニー様領域を特定することを特徴とする請求項16記載の予測プログラム。 - 全遺伝子の数に関する上記基準値を35個とすることを特徴とする請求項24記載の予測プログラム。
- 上記遺伝子クラスタを特定する工程の後、上記中央演算処理手段は、特定した遺伝子クラスタに含まれる全遺伝子の数を予め定めた基準値を比較するか、特定した遺伝子クラスタの長さを予め定めた基準値と比較し、全遺伝子の数又は長さが基準値未満の遺伝子クラスタについて、遺伝子クラスタが二次代謝系遺伝子を含む遺伝子クラスタであるか判定する工程を行い、
遺伝子クラスタが二次代謝系遺伝子を含む遺伝子クラスタであるか判定する工程では、判定対象の遺伝子クラスタに対して、所定の数の遺伝子又は所定の長さの領域を追加して当該遺伝子クラスタを修正し、修正された遺伝子クラスタについてシンテニー様領域を特定することを特徴とする請求項16記載の予測プログラム。 - 上記遺伝子クラスタを特定する工程では、Smith-Watermanアルゴリズムで作成されるSmith-Watermanマトリックスにおいて、最大のスコアを示すセルからトレースバックすることで遺伝子クラスタを特定することを特徴とする請求項16記載の予測プログラム。
- 上記遺伝子クラスタを特定する工程では、上記特定された遺伝子クラスタに含まれるセルのスコアに0を代入し、このSmith-Watermanマトリックスについてトレースバックすることで他の遺伝子の並びが保存されている領域を特定し、特定された領域について再度Smith-Watermanアルゴリズムにて遺伝子の並びが保存された領域を特定し、これを遺伝子クラスタとして特定することを特徴とする請求項27記載の予測プログラム。
- 上記遺伝子クラスタを特定する工程の後、上記中央演算処理手段は、特定した遺伝子クラスタに含まれる全遺伝子の数を予め定めた基準値を比較するか、特定した遺伝子クラスタの長さを予め定めた基準値と比較し、遺伝子クラスタに対して所定の数の遺伝子又は所定の長さの領域を追加して当該遺伝子クラスタが当該基準値となるように拡張し、
拡張した遺伝子クラスタを構成する各遺伝子について、他のゲノム塩基配列情報における比較対象の遺伝子クラスタを構成する遺伝子との間で相同性がある場合にはプラスのスコア、相同性がない場合にはマイナスのスコアを与え、
遺伝子クラスタの中心に位置する遺伝子から端に向かって順にスコアの合計値を算出し、スコアの合計値が極大値となる遺伝子を遺伝子クラスタの境界として特定し、
境界として特定された遺伝子により挟み込まれる領域を遺伝子クラスタとすることを特徴とする請求項16記載の予測プログラム。 - 全遺伝子の数を予め定めた上記基準値を15~65個とすることを特徴とする請求項29記載の予測プログラム。
- 入力手段、中央演算処理手段及び記憶手段を備え、
上記中央演算処理手段が少なくとも一対のゲノム塩基配列情報に含まれる遺伝子に関して相互に相同性検索し、これらゲノム塩基配列情報間で相同遺伝子の組み合わせ、相同遺伝子の組み合わせのなかでオーソログ遺伝子の組み合わせを同定する相同性検索手段と、
上記中央演算処理手段が上記相同性検索手段の結果に基づいて他のゲノム塩基配列情報との間で遺伝子の並びが保存されている領域を遺伝子クラスタとして特定する遺伝子クラスタ特定手段と、
上記中央演算処理手段が上記遺伝子クラスタ特定手段で特定された遺伝子クラスタのうち、上記相同性検索手段の結果のうちオーソログ遺伝子の存在に基づいてシンテニー様領域を特定し、当該シンテニー様領域が占める割合に基づいて、当該遺伝子クラスタが二次代謝系遺伝子を含む遺伝子クラスタであるか判定する判定手段と
から構成される、二次代謝系遺伝子を含む遺伝子クラスタの予測装置。 - 上記中央演算処理手段は、上記シンテニー様領域に含まれる遺伝子数が上記遺伝子クラスタ全体に含まれる遺伝子数に対して、所定の割合以下である場合に当該遺伝子クラスタが二次代謝系遺伝子を含む遺伝子クラスタであると判定することを特徴とする請求項31記載の予測装置。
- 上記所定の割合を25%とすることを特徴とする請求項32記載の予測装置。
- 上記シンテニー様領域は、少なくとも2以上のオーソログ遺伝子を含み、隣接するオーソログ遺伝子の距離が上記ゲノム塩基配列情報及び上記他のゲノム塩基配列情報のそれぞれにおいて所定の距離以内にある領域とすることを特徴とする請求項31記載の予測装置。
- 上記所定の距離は、10~30kbとすることを特徴とする請求項34記載の予測装置。
- 上記シンテニー様領域は、比較に用いる少なくとも一対のゲノム塩基配列情報のうちの1種のゲノム塩基配列情報と、これら一対のゲノム塩基配列情報とは異なる第3のゲノム塩基配列情報とを用いてシンテニー領域/非シンテニー領域をあらかじめ決定し、このシンテニー領域をシンテニー様領域とすることを特徴とする請求項31記載の予測装置。
- 上記遺伝子クラスタ特定手段による処理の後、上記中央演算処理手段は、特定した遺伝子クラスタに含まれる相同遺伝子の数及び/又は特定した遺伝子クラスタに含まれる全遺伝子の数を予め定めた基準値を比較し、相同遺伝子の数が基準値以上である遺伝子クラスタ、及び/又は全遺伝子の数が基準値未満の遺伝子クラスタについて、当該遺伝子クラスタが二次代謝系遺伝子を含む遺伝子クラスタであるか判定する上記判定手段の処理を行うことを特徴とする請求項31記載の予測装置。
- 相同遺伝子の数に関する上記基準値を3個とし、全遺伝子の数に関する上記基準値を35個とすることを特徴とする請求項37記載の予測装置。
- 上記遺伝子クラスタ特定手段による処理の後、上記中央演算処理手段は、特定した遺伝子クラスタに含まれる全遺伝子の数を予め定めた基準値を比較するか、特定した遺伝子クラスタの長さを予め定めた基準値と比較し、全遺伝子の数又は長さが基準値未満の遺伝子クラスタについて、遺伝子クラスタが二次代謝系遺伝子を含む遺伝子クラスタであるか判定する上記判定手段の処理を行い、
遺伝子クラスタが二次代謝系遺伝子を含む遺伝子クラスタであるか判定する上記判定手段は、判定対象の遺伝子クラスタに含まれる遺伝子の数が上記基準値の個数となるように、当該遺伝子クラスタに隣接する遺伝子を追加して当該遺伝子クラスタを修正し、当該基準値の個数の遺伝子からなる修正された遺伝子クラスタについてシンテニー様領域を特定することを特徴とする請求項31記載の予測装置。 - 全遺伝子の数に関する上記基準値を35個とすることを特徴とする請求項39記載の予測装置。
- 上記遺伝子クラスタ特定手段による処理の後、上記中央演算処理手段は、特定した遺伝子クラスタに含まれる全遺伝子の数を予め定めた基準値を比較するか、特定した遺伝子クラスタの長さを予め定めた基準値と比較し、全遺伝子の数又は長さが基準値未満の遺伝子クラスタについて、遺伝子クラスタが二次代謝系遺伝子を含む遺伝子クラスタであるか判定する上記判定手段の処理を行い、
遺伝子クラスタが二次代謝系遺伝子を含む遺伝子クラスタであるか判定する上記判定手段では、判定対象の遺伝子クラスタに対して、所定の数の遺伝子又は所定の長さの領域を追加して当該遺伝子クラスタを修正し、修正された遺伝子クラスタについてシンテニー様領域を特定することを特徴とする請求項31記載の予測装置。 - 上記遺伝子クラスタ特定手段では、Smith-Watermanアルゴリズムで作成されるSmith-Watermanマトリックスにおいて、最大のスコアを示すセルからトレースバックすることで遺伝子クラスタを特定することを特徴とする請求項31記載の予測装置。
- 上記遺伝子クラスタ特定手段では、上記特定された遺伝子クラスタに含まれるセルのスコアに0を代入し、このSmith-Watermanマトリックスについてトレースバックすることで他の遺伝子の並びが保存されている領域を特定し、特定された領域について再度Smith-Watermanアルゴリズムにて遺伝子の並びが保存された領域を特定し、これを遺伝子クラスタとして特定することを特徴とする請求項42記載の予測装置。
- 上記遺伝子クラスタを特定する工程の後、上記中央演算処理手段は、特定した遺伝子クラスタに含まれる全遺伝子の数を予め定めた基準値を比較するか、特定した遺伝子クラスタの長さを予め定めた基準値と比較し、遺伝子クラスタに対して所定の数の遺伝子又は所定の長さの領域を追加して当該遺伝子クラスタが当該基準値となるように拡張し、
拡張した遺伝子クラスタを構成する各遺伝子について、他のゲノム塩基配列情報における比較対象の遺伝子クラスタを構成する遺伝子との間で相同性がある場合にはプラスのスコア、相同性がない場合にはマイナスのスコアを与え、
遺伝子クラスタの中心に位置する遺伝子から端に向かって順にスコアの合計値を算出し、スコアの合計値が極大値となる遺伝子を遺伝子クラスタの境界として特定し、
境界として特定された遺伝子により挟み込まれる領域を遺伝子クラスタとすることを特徴とる請求項31記載の予測装置。 - 全遺伝子の数を予め定めた上記基準値を15~65個とすることを特徴とする請求項44記載の予測装置。
Priority Applications (2)
| Application Number | Priority Date | Filing Date | Title |
|---|---|---|---|
| JP2014536957A JP5946149B2 (ja) | 2012-09-24 | 2013-09-24 | 二次代謝系遺伝子を含む遺伝子クラスタの予測方法、予測プログラム及び予測装置 |
| US14/427,349 US20150310168A1 (en) | 2012-09-24 | 2013-09-24 | Method for predicting gene cluster including secondary metabolism-related genes, prediction program, and prediction device |
Applications Claiming Priority (2)
| Application Number | Priority Date | Filing Date | Title |
|---|---|---|---|
| JP2012-210044 | 2012-09-24 | ||
| JP2012210044 | 2012-09-24 |
Publications (1)
| Publication Number | Publication Date |
|---|---|
| WO2014046284A1 true WO2014046284A1 (ja) | 2014-03-27 |
Family
ID=50341583
Family Applications (1)
| Application Number | Title | Priority Date | Filing Date |
|---|---|---|---|
| PCT/JP2013/075702 Ceased WO2014046284A1 (ja) | 2012-09-24 | 2013-09-24 | 二次代謝系遺伝子を含む遺伝子クラスタの予測方法、予測プログラム及び予測装置 |
Country Status (3)
| Country | Link |
|---|---|
| US (1) | US20150310168A1 (ja) |
| JP (1) | JP5946149B2 (ja) |
| WO (1) | WO2014046284A1 (ja) |
Cited By (1)
| Publication number | Priority date | Publication date | Assignee | Title |
|---|---|---|---|---|
| CN118522347A (zh) * | 2024-07-23 | 2024-08-20 | 江西师范大学 | 基于同源性分析和区域加权的线粒体基因组重排量化方法 |
Families Citing this family (7)
| Publication number | Priority date | Publication date | Assignee | Title |
|---|---|---|---|---|
| US10118945B2 (en) * | 2015-10-30 | 2018-11-06 | University Of Kansas | Dereplication strain of Aspergillus nidulans |
| US10612032B2 (en) | 2016-03-24 | 2020-04-07 | The Board Of Trustees Of The Leland Stanford Junior University | Inducible production-phase promoters for coordinated heterologous expression in yeast |
| CA3042726A1 (en) | 2016-11-16 | 2018-05-24 | The Board Of Trustees Of The Leland Stanford Junior University | Systems and methods for identifying and expressing gene clusters |
| WO2019055816A1 (en) * | 2017-09-14 | 2019-03-21 | Lifemine Therapeutics, Inc. | HUMAN THERAPEUTIC TARGETS AND MODULATORS THEREFOR |
| CN111508561B (zh) * | 2019-07-04 | 2024-02-06 | 北京希望组生物科技有限公司 | 同源序列和同源序列中串联重复序列的检测方法、计算机可读介质和应用 |
| WO2021158989A1 (en) * | 2020-02-07 | 2021-08-12 | Lodo Therapeutics Corporation | Methods and apparatus for efficient and accurate assembly of long-read genomic sequences |
| WO2023091950A1 (en) * | 2021-11-16 | 2023-05-25 | Lifemine Therapeutics, Inc. | Methods and systems for discovery of non-embedded target genes |
Citations (2)
| Publication number | Priority date | Publication date | Assignee | Title |
|---|---|---|---|---|
| JP2005514959A (ja) * | 2002-01-24 | 2005-05-26 | エコピア バイオサイエンシーズ インク | 微生物から二次代謝産物を同定するための方法、システム及び情報リポジトリ |
| WO2012039484A1 (ja) * | 2010-09-22 | 2012-03-29 | 独立行政法人産業技術総合研究所 | 遺伝子クラスタ及び遺伝子の探索、同定法およびそのための装置 |
-
2013
- 2013-09-24 JP JP2014536957A patent/JP5946149B2/ja not_active Expired - Fee Related
- 2013-09-24 WO PCT/JP2013/075702 patent/WO2014046284A1/ja not_active Ceased
- 2013-09-24 US US14/427,349 patent/US20150310168A1/en not_active Abandoned
Patent Citations (2)
| Publication number | Priority date | Publication date | Assignee | Title |
|---|---|---|---|---|
| JP2005514959A (ja) * | 2002-01-24 | 2005-05-26 | エコピア バイオサイエンシーズ インク | 微生物から二次代謝産物を同定するための方法、システム及び情報リポジトリ |
| WO2012039484A1 (ja) * | 2010-09-22 | 2012-03-29 | 独立行政法人産業技術総合研究所 | 遺伝子クラスタ及び遺伝子の探索、同定法およびそのための装置 |
Non-Patent Citations (6)
| Title |
|---|
| D'ALENCON, E.: "Extensive synteny conservation of holocentric chromosomes in Lepidoptera despite high rates of local genome rearrangements", PROCEEDINGS OF THE NATIONAL ACADEMY OF SCIENCES OF THE UNITED STATES OF AMERICA, vol. 107, no. 17, 27 April 2010 (2010-04-27), pages 7680 - 7685 * |
| HARUO IKEDA: "New System for the Production of Secondary Metabolites by a Versatile Host Genetically Optimized", KAGAKU TO SEIBUTSU, vol. 44, no. 6, 2006, pages 391 - 398 * |
| ITARU TAKEDA: "4Fp18 Prediction of secondary metabolite gene cluster using comparative genomics", ABSTRACTS OF THE ANNUAL MEETING OF THE SOCIETY FOR BIOTECHNOLOGY, 25 September 2012 (2012-09-25), JAPAN, pages 217 * |
| ITARU TAKEDA: "Hikaku Genome o Mochiita Niji Taishakei Idenshi Cluster no Yosoku", SOCIETY OF GENOME MICROBIOLOGY, 10 March 2012 (2012-03-10), pages 71 * |
| MEDEMA, M.H.: "antiSMASH: rapid identification, annotation and analysis of secondary metabolite biosynthesis gene clusters in bacterial and fungal genome sequences", NUCLEIC ACIDS RESEARCH, vol. 39, July 2011 (2011-07-01), pages W339 - 346 * |
| WEBER, T.: "CLUSEAN: a computer-based framework for the automated analysis of bacterial secondary metabolite biosynthetic gene clusters", JOURNAL OF BIOTECHNOLOGY, vol. 140, 10 March 2009 (2009-03-10), pages 13 - 17 * |
Cited By (1)
| Publication number | Priority date | Publication date | Assignee | Title |
|---|---|---|---|---|
| CN118522347A (zh) * | 2024-07-23 | 2024-08-20 | 江西师范大学 | 基于同源性分析和区域加权的线粒体基因组重排量化方法 |
Also Published As
| Publication number | Publication date |
|---|---|
| JPWO2014046284A1 (ja) | 2016-08-18 |
| JP5946149B2 (ja) | 2016-07-05 |
| US20150310168A1 (en) | 2015-10-29 |
Similar Documents
| Publication | Publication Date | Title |
|---|---|---|
| JP5946149B2 (ja) | 二次代謝系遺伝子を含む遺伝子クラスタの予測方法、予測プログラム及び予測装置 | |
| Liu et al. | SMARTdenovo: a de novo assembler using long noisy reads | |
| Zhu et al. | Phylogenomics of 10,575 genomes reveals evolutionary proximity between domains Bacteria and Archaea | |
| Angly et al. | The GAAS metagenomic tool and its estimations of viral and microbial average genome size in four major biomes | |
| Wheeler | A resource for improved predictions of Trypanosoma and Leishmania protein three-dimensional structure | |
| Auch et al. | Genome BLAST distance phylogenies inferred from whole plastid and whole mitochondrion genome sequences | |
| Sharma et al. | Gene loss rather than gene gain is associated with a host jump from monocots to dicots in the smut fungus Melanopsichium pennsylvanicum | |
| Spang et al. | Complex archaea that bridge the gap between prokaryotes and eukaryotes | |
| Stobbe et al. | E-probe Diagnostic Nucleic acid Analysis (EDNA): a theoretical approach for handling of next generation sequencing data for diagnostics | |
| Galardini et al. | Evolution of intra-specific regulatory networks in a multipartite bacterial genome | |
| Camiolo et al. | The relation of codon bias to tissue-specific gene expression in Arabidopsis thaliana | |
| Cerón-Romero et al. | PhyloToL: a taxon/gene-rich phylogenomic pipeline to explore genome evolution of diverse eukaryotes | |
| Pi et al. | A genomics based discovery of secondary metabolite biosynthetic gene clusters in Aspergillus ustus | |
| Fourie et al. | Evidence for inter-specific recombination among the mitochondrial genomes of Fusarium species in the Gibberella fujikuroi complex | |
| Zhang et al. | Genome wide analysis of the transition to pathogenic lifestyles in Magnaporthales fungi | |
| Panthee et al. | Utilization of hybrid assembly approach to determine the genome of an opportunistic pathogenic fungus, Candida albicans TIMM 1768 | |
| Cope et al. | Gene expression of functionally-related genes coevolves across fungal species: detecting coevolution of gene expression using phylogenetic comparative methods | |
| WO2021158989A1 (en) | Methods and apparatus for efficient and accurate assembly of long-read genomic sequences | |
| Umemura et al. | Fine de novo sequencing of a fungal genome using only SOLiD short read data: verification on Aspergillus oryzae RIB40 | |
| Renzi et al. | Yeast metagenomics: analytical challenges in the analysis of the eukaryotic microbiome | |
| O’Meara et al. | DeORFanizing Candida albicans genes using coexpression | |
| Li et al. | A nearest neighbor approach for automated transporter prediction and categorization from protein sequences | |
| O’Meara et al. | CryptoCEN: A Co-Expression Network for Cryptococcus neoformans reveals novel proteins involved in DNA damage repair | |
| CN114245922A (zh) | 单一生物单元的序列信息的新型处理方法 | |
| Atias et al. | Large-scale analysis of Arabidopsis transcription reveals a basal co-regulation network |
Legal Events
| Date | Code | Title | Description |
|---|---|---|---|
| 121 | Ep: the epo has been informed by wipo that ep was designated in this application |
Ref document number: 13838136 Country of ref document: EP Kind code of ref document: A1 |
|
| ENP | Entry into the national phase |
Ref document number: 2014536957 Country of ref document: JP Kind code of ref document: A |
|
| NENP | Non-entry into the national phase |
Ref country code: DE |
|
| WWE | Wipo information: entry into national phase |
Ref document number: 14427349 Country of ref document: US |
|
| 122 | Ep: pct application non-entry in european phase |
Ref document number: 13838136 Country of ref document: EP Kind code of ref document: A1 |