WO2014032695A1 - Enzyme kinetics - Google Patents
Enzyme kinetics Download PDFInfo
- Publication number
- WO2014032695A1 WO2014032695A1 PCT/EP2012/066650 EP2012066650W WO2014032695A1 WO 2014032695 A1 WO2014032695 A1 WO 2014032695A1 EP 2012066650 W EP2012066650 W EP 2012066650W WO 2014032695 A1 WO2014032695 A1 WO 2014032695A1
- Authority
- WO
- WIPO (PCT)
- Prior art keywords
- enzymatic
- data
- calibration
- enzyme
- way
- Prior art date
- Legal status (The legal status is an assumption and is not a legal conclusion. Google has not performed a legal analysis and makes no representation as to the accuracy of the status listed.)
- Ceased
Links
Images





Classifications
-
- C—CHEMISTRY; METALLURGY
- C12—BIOCHEMISTRY; BEER; SPIRITS; WINE; VINEGAR; MICROBIOLOGY; ENZYMOLOGY; MUTATION OR GENETIC ENGINEERING
- C12Q—MEASURING OR TESTING PROCESSES INVOLVING ENZYMES, NUCLEIC ACIDS OR MICROORGANISMS; COMPOSITIONS OR TEST PAPERS THEREFOR; PROCESSES OF PREPARING SUCH COMPOSITIONS; CONDITION-RESPONSIVE CONTROL IN MICROBIOLOGICAL OR ENZYMOLOGICAL PROCESSES
- C12Q1/00—Measuring or testing processes involving enzymes, nucleic acids or microorganisms; Compositions therefor; Processes of preparing such compositions
-
- G—PHYSICS
- G16—INFORMATION AND COMMUNICATION TECHNOLOGY [ICT] SPECIALLY ADAPTED FOR SPECIFIC APPLICATION FIELDS
- G16C—COMPUTATIONAL CHEMISTRY; CHEMOINFORMATICS; COMPUTATIONAL MATERIALS SCIENCE
- G16C20/00—Chemoinformatics, i.e. ICT specially adapted for the handling of physicochemical or structural data of chemical particles, elements, compounds or mixtures
- G16C20/10—Analysis or design of chemical reactions, syntheses or processes
-
- G—PHYSICS
- G16—INFORMATION AND COMMUNICATION TECHNOLOGY [ICT] SPECIALLY ADAPTED FOR SPECIFIC APPLICATION FIELDS
- G16C—COMPUTATIONAL CHEMISTRY; CHEMOINFORMATICS; COMPUTATIONAL MATERIALS SCIENCE
- G16C20/00—Chemoinformatics, i.e. ICT specially adapted for the handling of physicochemical or structural data of chemical particles, elements, compounds or mixtures
- G16C20/70—Machine learning, data mining or chemometrics
Definitions
- the present invention relates to the monitoring of enzyme kinetics, particularly to a determination of enzymatic activity and more particularly to an optical spectroscopy based method of monitoring enzyme kinetics, such as the determination of enzymatic activity.
- chemometric modelling is employed to initially established links between time dependent evolution of infrared spectral fingerprints of each of the substrate and the product and the enzymatic activity.
- PLS Partial Least Squares
- PCA Principle Component Analysis
- other multivariate analysis based models are established either using available standards for both substrate and product to quantify those time resolved during the enzymatic reaction and therefore observe the kinetics of the reaction or deuterated water is used to prevent high water backgrounds and therefore enable quantification of products and substrates using common peak integration methods.
- deuterated water is prohibitively expensive for high throughput analysis applications.
- Enzymes are manufactured and optimized for cost-efficient use in industry around the world. Once being available an enzyme is characterized in order to determine, for example, under which conditions it catalyzes a specific reaction at the highest rate; its shelf-life; or its stability. Therefore its enzyme activity is screened at different physical and/or biological conditions, such as under different pHs; temperatures; pressures; enzyme amounts etc., to find optima using a specific assay whose procedure depends on the nature of the enzyme and its catalytic reaction.
- fluorescent, colorimetric, spectrophotometric, HPLC or methods applying antibodies are developed using specific chemical markers to monitor the enzymatic reaction. Those markers are often toxic and expensive and the methods are furthermore cumbersome and time consuming; automation is difficult and varies from enzyme to enzyme.
- standards concerning the substrate and products may be employed to build external calibration models using multivariate tools like PCA, but often no standards are available (e.g. for enzymes which continuously break down biopolymers; reducing sugar assay).
- PCA multivariate tools like PCA can identify the change in spectra during the enzymatic reaction only if the major variance in the evolution profile is due to the enzymatic reaction itself. Indeed, if there is an enzymatic reaction with several substrate and/or products, each having its individual spectral fingerprint, PCA is very often unable to resolve the time-resolved behaviours of the single species in the same way from evolution profile to evolution profile. Sometimes new PCA Components might show up only due to the spectroscopic interaction between those different species.
- a method of determining an indication of enzymatic kinetics of a monitored enzymatic reaction comprising: establishing in a data processor a calibration correlating enzymatic kinetics with temporal evolution data, such as spectral fingerprint evolution data, by applying to data representative of temporal evolution profiles of one or both of a substrate and a product of an enzymatic reaction for different known enzymatic activities a chemometric multi-way model (which by accepted definition is any model greater than two-way), suitably Parafac; Parafac2, N-PLS, Tucker, Paralind or other canonical polyadic decompositional models; acquiring into the data processor corresponding temporal evolution data for a monitored enzymatic reaction and applying to that data the calibration to determine thereby a quantitative and/or qualitative indication of enzymatic kinetics of the monitored enzymatic reaction.
- temporal evolution data such as spectral fingerprint evolution data
- the calibration may be established based on temporal variations in amounts of substrate and product together, both of which measurements may be combined using known multiple linear regression techniques, for example. This measurement of both product and substrate together provides an advantage that an internal replicate measurement may be readily obtained.
- spectral fingerprint data may be used as the temporal evolution data.
- This spectral fingerprint data may be acquired in the infrared, particularly mid-IR, spectral region and may be Fourier Transform Infra Red (‘FTIR’) spectral data. This permits the reaction to be monitored in situ without influencing the kinetics and is thus well suited for automation or process control.
- FTIR Fourier Transform Infra Red
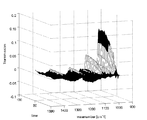
- Fig.1 illustrates a temporal evolution profile: 0U Pectin Lyase
- Fig.2 illustrates a temporal evolution profile: 7.6U
- Fig.3 illustrates a temporal evolution profile: 15.2U
- Fig.4 illustrates a temporal evolution profile: 45.6U
- Fig.5 illustrates a temporal evolution profile: 76U Pectin Lyase
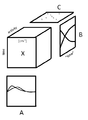
- Fig.6 illustrates schematically a Parafac decomposition
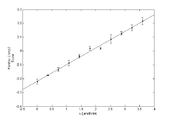
- Fig.7 illustrates a Parafac calibration for Pectin Lyase (substrate)
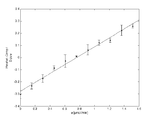
- Fig.8 illustrates a Parafac calibration for Pectin Lyase (product)
- Fig.9 illustrates a temporal evolution profile for Glucose Oxidase
- Fig. 10 illustrates a Parafac calibration for Glucose Oxidase
- Fig. 11 illustrate
- Substrate and the Product may each represent one or more compounds, at least one of which has a distinguishable spectral fingerprint that evolves with time during the enzymatic reaction.
- the change in the spectral fingerprint of one or both the Substrate and the Product can therefore be related to the kinetics of the enzymatic reaction being monitored.
- This spectral evolution with time is here referred to as an ‘temporal evolution profile’ which represents the kinetic behaviour of the reaction under certain conditions, such as activity, temperature, pH value).
- the temporal evolution profiles of this enzymatic reaction are represented in the transmission surf plots illustrated in Figs. 1 to 5 for different enzymatic activities (amounts) 0u, 7.6u, 15.2u, 45.6u and 76u respectively. It will be appreciated that absorption or reflectance spectra may also be employed without departing from the invention as claimed.
- a plurality (here 18) temporal evolution profiles are recorded for each of the different used Pectin Lyase activities (amounts) on the substrate Pectin (1%).
- Such pre-treatment may for example comprise SNV (Standard Normal Variate); MSC (Multiplicitive Signal Correction) or first derivative de-trending.
- the spectral data represented by the Figs. 1 to 5 is processed using a chemometric multi-way model, in the present embodiment Parafac, to generate a calibration which correlates enzymatic activity with temporal spectral fingerprint evolution data.
- Each evolution profile is represented by a data matrix where the vectors are spectra at consecutive time points. Since all evolution profiles are recorded at the same consecutive time points those matrices can be stacked behind each other to form a multi-way data tensor, X, having a cubic data structure which is defined by its three dimensions, namely wavenumber, time and activity.
- This matrix contains the true spectral fingerprints of the enzymatic system.
- spectra representing both the substrate and the product are illustrated by way of example;
- This matrix contains the kinetic (i.e. time resolved) behaviour of substrate and product
- This matrix contains the information about how abundant the change in spectra in B is considering the pure spectra from A. Those values of that matrix therefore correlate with the used enzyme amount activity (having opposite slopes for substrate and product)
- C represents the multi-way scores (which by accepted definition is at least three-way scores) which according to this exemplary embodiment of the present invention may be correlated with the added enzyme activity. This may be expressed as: where E is an error matrix (residuals)
- a particular advantage with the method according to the present invention is that Parafac (or, more generally, the particular multi-way model selected) is not supervised with information concerning the added enzyme activities. This means that the analysis doesn’t know about the added activities and therefore finds the scores unsupervised. After the analysis the scores are scattered against the known added activities. In other embodiments it can also be done supervised (using N-PLS for example). However for intelligent instrumentation one most likely would do that in a later stage (using N-PLS or combining the scores from both results in multiple linear regression as mentioned before.
- spectra were obtained using a FOSS FT2 instrument (FOSS ANALYTICAL, Hiller ⁇ d, Denmark).
- the instrument has a FTIR (Fourier Transform Infrared Spectroscopy) interferometer that scans the full infrared spectrum, is equipped with an automatic flow-through system apparatus and works semi-automated. Samples may be flowed into a measurement region of the flow-through system, where flow is halted and one or more FTIR spectra are obtained before the sample is flowed out of the measurement region to waste; to be returned to a main sample stream or to be re-cycled.
- the optical system is hermetically sealed and humidity controlled.
- the three different enzymatic systems (or classes) that have been investigated are 1) Glucose Oxidase 2) Pectin Lyase 3) Celluclast 1.5L (Reducing Sugar). Enzyme and Substrate solutions were prepared as described below.
- Pectin Lyase measurements have been carried out using 1% (w/v) apple pectin in 100 mM sodium phosphate buffer pH 7 and Pectin Lyase from Aspergillus nidulans , which was in-house fermented by Center for Bioengineering, DTU, Lyngby, Denmark.
- Glucose Oxidase was assessed using 100 mM ⁇ / ⁇ -D-Glucose in 50 mM potassium phosphat buffer pH 6,9. The substrate was equilibrated over night to avoid mutarotation effects during the assay. A lyophilized solid enzyme preparation of Glucose Oxidase ( Aspergillus niger ) which is commercially available from Sigma Aldrich was used.
- the reducing sugar assay was carried out using 1% (w/v) Carboxylmethylcellulose (low viscosity) in 50 mM acetate buffer pH 5 and a liquid multi component enzyme preparation called Celluclast1.5L which is commercially available from Novozymes, Denmark.
- Enzymes solutions were prepared as described in the following:
- the actual calibration equation may be obtained from a correlation of the multi-way scores (C) with the known activities. This correlation is illustrated in Fig.7 and Fig. 8 for the present pectin lyase example where Fig.7 shows a calibration obtained for the pectin polymer substrate and Fig. 8 shows a calibration obtained for the products.
- Table 1 No. of Spectra in each evolution profile 15 Acquisition time per spectrum 16,6 seconds Total time for an evolution profile 4,2 min Parafac Components 2 Parafac Core consistency 93 Calibration performance, R 2 0,998 and 0,995 Spectral Pretreatment SNV+Multiway Center (Mode 1) Spectral Range for calibration 991cm -1 to 1480cm -1 (Pin:18-145) Detection limit (3*standard deviation) 0.18U Enzyme Monocomponent pectin lyase
- Fig.9 Exemplary temporal evolution profiles for this enzymatic reaction are illustrated in Fig.9 for a single enzymatic activity. In common with the first example and as can be seen, certain bands grow while others diminish with time. Mid-IR spectral data at different known activities was collected using FTIR and a calibration established essentially as described in relation to the first example. The correlation of multi-way scores (C), that are here also determined using Parafac, with known activities is illustrated in Fig. 10 for the glucose oxidase example.
- C multi-way scores
- Table 2 No. of Spectra in each evolution profile 40 Acquisition time per spectrum 31 seconds Total time for an evolution profile 20,7 min Parafac Components 3 Parafac Core consistency 75 Calibration performance, R 2 0,96 Spectral Pretreatment SNV+Multiway Center (Mode 1) Spectral Range for calibration 1094cm -1 to 1558cm -1 (Pin:45-165) Detection limit (3*standard deviation) 5,53U Enzyme Glucose Oxidase from Aspergillus niger
- Celluclast 1.5L is a liquid commercial enzyme preparation available from Novozymes. It contains various enzyme activities, mostly cellulases, which cleave different glycosidic bonds. Typical enzyme activities are represented by endocellulases, exocellulases, ⁇ -Glucosidases. The mixture of those various enzyme activities is designed to break down biopolymers as cellulose in an efficient manner to provide readily available monosaccharides for e.g. bio-ethanol production. Whenever a glycosidic bond is broken a new poly-, oligo- or monosaccharide is formed with a reducing end. Among other features the formed carbohydrate molecule is in equilibrium with its open form and features, among other intra- and intermolecular spectroscopic properties, a CO double bond which is highly significant in IR spectroscopy.
- the method according to the present invention gives opportunity to monitor the overall activity of multi-component enzyme preparations such as Celluclast 1.5L.
- multi-component enzyme preparations such as Celluclast 1.5L.
- filter paper units have been used to describe the efficiency of a combination of enzymes, namely endocellulases, exocellulases, beta-Glucosidases.
- the filter paper is used to monitor how efficient Celluclast 1.5L can degrade biomasses on cellulose basis.
- This ‘filter paper scale’ is employed to give an indication of the overall performance of the enzymatic cocktail since a colorimetric approach would usually measure only a specific product or substrate and therefore quantify only one specific activity.
- Table 3 No. of Spectra in each evolution profile 15 Acquisition time per spectrum 16,6 seconds Total time for an evolution profile 4,2 min Parafac Components 2 Parafac Core consistency 100 Calibration performance, R 2 0,99 and 0,98 Spectral Pretreatment SNV+Multiway Center (Mode 1) Spectral Range for calibration 991cm -1 to 1558cm -1 (Pin:18-165) Detection limit (3*standard deviation) 0,07575U Enzyme Cellulast 1.5L
- spectral fingerprints of both Substrate and Product that exist in the mid-IR spectral region and which may suitably be detected using FTIR. It will be clear to the skilled person that spectral fingerprints may exist in other spectral regions and/or be detected using other appropriate methodologies so that the invention should not be interpreted as being limited to the mid-IR spectral region and/or the FTIR detection methodology. Furthermore it will be appreciated by the skilled person that using other methodologies, for example Fluorescence Excitation Emission Spectroscopy (FEES), the multi-linearity of the data set could lead to dimensions of the data set which is greater than three. Where FEES is used four dimensions are possible with each excitation energy employed providing a complete emission spectrum. Thus at each time point and for each enzymatic activity each excitation energy will produce a different emission spectrum.
- FEES Fluorescence Excitation Emission Spectroscopy
Landscapes
- Chemical & Material Sciences (AREA)
- Life Sciences & Earth Sciences (AREA)
- Engineering & Computer Science (AREA)
- Organic Chemistry (AREA)
- Proteomics, Peptides & Aminoacids (AREA)
- Analytical Chemistry (AREA)
- Zoology (AREA)
- Wood Science & Technology (AREA)
- Bioinformatics & Cheminformatics (AREA)
- Health & Medical Sciences (AREA)
- Biotechnology (AREA)
- Crystallography & Structural Chemistry (AREA)
- Physics & Mathematics (AREA)
- Theoretical Computer Science (AREA)
- Computing Systems (AREA)
- Immunology (AREA)
- Microbiology (AREA)
- Molecular Biology (AREA)
- Bioinformatics & Computational Biology (AREA)
- Biophysics (AREA)
- Chemical Kinetics & Catalysis (AREA)
- Biochemistry (AREA)
- General Engineering & Computer Science (AREA)
- General Health & Medical Sciences (AREA)
- Genetics & Genomics (AREA)
- Apparatus Associated With Microorganisms And Enzymes (AREA)
- Measuring Or Testing Involving Enzymes Or Micro-Organisms (AREA)
- Investigating Or Analysing Materials By Optical Means (AREA)
Description
The present invention relates to the monitoring of enzyme kinetics, particularly to a determination of enzymatic activity and more particularly to an optical spectroscopy based method of monitoring enzyme kinetics, such as the determination of enzymatic activity.
In the present document the term “enzymatic activity” shall be taken to mean the amount of enzyme being used. Its unit is 1U which defines the amount which catalyses conversion of 1 µmol substrate per minute at a constant temperature and pH value and may be expressed as: 1U = 1 µmol/min (1)
In enzyme kinetics, the reaction rate is measured and the effects of varying the conditions of the reaction investigated. Studying an enzyme's kinetics can reveal the catalytic mechanism of this enzyme, its role in metabolism, how enzymatic activity is controlled, how a drug or an agonist might inhibit the enzyme, or can be employed to monitor on-line and non-destructively, product formation processes using enzymes or in the screening of enzyme activity in matrices such as milk, blood and fruit juices, for example. Typically optical spectroscopy is employed to generate an evolution profile which represents the time resolved spectra of an enzymatic reaction and thus shapes a “landscape” in relation to enzymatic activity. The dimension of time represents the kinetic behaviour, being linked to spectral features which are characteristic of the substrate and the product being monitored (their respective “spectral fingerprints”)
It is known, from for example Kumar S, Barth A. (Following Enzyme Activity with Infrared Spectroscopy. Sensors 2010;10(4):2626-2637 ); Karmali K, Karmali A, Teixeira A, Curto MJM. (The use of Fourier transform infrared spectroscopy to assay for urease from Pseudomonas aeruginosa and Canavalia ensiformis Analytical Biochemistry 2004;331(1):115-121) and Karmali K, Karmali A, Teixeira A, Curto MJM. (Assay for glucose oxidase from Aspergillus niger and Penicillium amagasakiense by Fourier transform infrared spectroscopy. Analytical Biochemistry 2004;333(2):320-327), to employ infrared spectroscopy methods in the determination of enzymatic activity.
In these known methods chemometric modelling is employed to initially established links between time dependent evolution of infrared spectral fingerprints of each of the substrate and the product and the enzymatic activity. In order to establish such links either Partial Least Squares (PLS), Principle Component Analysis (PCA) or other multivariate analysis based models are established either using available standards for both substrate and product to quantify those time resolved during the enzymatic reaction and therefore observe the kinetics of the reaction or deuterated water is used to prevent high water backgrounds and therefore enable quantification of products and substrates using common peak integration methods. However, the use of deuterated water is prohibitively expensive for high throughput analysis applications.
Many industrial processes are today being refurbished to be environmentally clean and sustainable. For more than a decade they were merely designed and optimized for cost efficient production using classical methods which apply harsh chemicals accumulating and emitting substantial amounts of waste to our environment. Furthermore those classical designed processes are not selective, giving rise to side-streams, i.e. bi-products of the main process, of low quality and may operate at rather extreme reaction conditions. Processes can be redesigned highly inspired by nature considering that enzymes can bio-catalyze the formation of many industrial products. An advantage of using enzymes is that they are proteins and work at mild reaction conditions in, for example, aqueous or organic media to accommodate the bioconversion. In 2002 a concept has been proposed and published by Michael Braungart called “Cradle to Cradle” (McDonough, W. & Braungart, M. Cradle to Cradle : remaking the way we make things, Edn. 1st.; North Point Press, New York; 2002).which generally states the idea of redesigning industrial processes expanding our understanding of sustainability. Claiming the possibility of utilizing the, terrestrial spoken, infinite amount of renewable energy from the sun “Cradle to Cradle” processes are not necessarily optimized for energy consumption, but rather for being intrinsic, meaning that all industrial used resources should be perfectly recycled to avoid a negative environmental footprint. The major message is: “Waste is Food.”
Related to that discussion the use of enzymes has begun to rapidly increase in industry. Not only because of being environmentally sustainable, but also to provide possibilities for utilizing products which cannot be produced in a traditional chemical way, e.g. the mild extraction of valuable biopolymer chains from biomasses (→ food ingredients) prior to biofuel fermentation.
Enzymes are manufactured and optimized for cost-efficient use in industry around the world. Once being available an enzyme is characterized in order to determine, for example, under which conditions it catalyzes a specific reaction at the highest rate; its shelf-life; or its stability. Therefore its enzyme activity is screened at different physical and/or biological conditions, such as under different pHs; temperatures; pressures; enzyme amounts etc., to find optima using a specific assay whose procedure depends on the nature of the enzyme and its catalytic reaction. Usually fluorescent, colorimetric, spectrophotometric, HPLC or methods applying antibodies are developed using specific chemical markers to monitor the enzymatic reaction. Those markers are often toxic and expensive and the methods are furthermore cumbersome and time consuming; automation is difficult and varies from enzyme to enzyme.
If no markers are available or are not used then standards concerning the substrate and products may be employed to build external calibration models using multivariate tools like PCA, but often no standards are available (e.g. for enzymes which continuously break down biopolymers; reducing sugar assay).
Moreover, it is known that multivariate tools like PCA can identify the change in spectra during the enzymatic reaction only if the major variance in the evolution profile is due to the enzymatic reaction itself. Indeed, if there is an enzymatic reaction with several substrate and/or products, each having its individual spectral fingerprint, PCA is very often unable to resolve the time-resolved behaviours of the single species in the same way from evolution profile to evolution profile. Sometimes new PCA Components might show up only due to the spectroscopic interaction between those different species.
The use of such tools is therefore not the solution to extract the enzymatic kinetics since variance from evolution profile to evolution profile might change. Additionally, other effects which change spectra over time can interfere and therefore bias an observation of PCA scores time-resolved to extract kinetics.
It is an aim of the present invention to at least alleviate one or more of the aforementioned problems.
To this end, according to a first aspect of the present invention there is provided a method of determining an indication of enzymatic kinetics of a monitored enzymatic reaction comprising: establishing in a data processor a calibration correlating enzymatic kinetics with temporal evolution data, such as spectral fingerprint evolution data, by applying to data representative of temporal evolution profiles of one or both of a substrate and a product of an enzymatic reaction for different known enzymatic activities a chemometric multi-way model (which by accepted definition is any model greater than two-way), suitably Parafac; Parafac2, N-PLS, Tucker, Paralind or other canonical polyadic decompositional models; acquiring into the data processor corresponding temporal evolution data for a monitored enzymatic reaction and applying to that data the calibration to determine thereby a quantitative and/or qualitative indication of enzymatic kinetics of the monitored enzymatic reaction.
In this manner a calibration may be established without employing known standards and monitoring may be performed in substantially real-time during the enzymatic reaction.
In one embodiment the calibration may be established based on temporal variations in amounts of substrate and product together, both of which measurements may be combined using known multiple linear regression techniques, for example. This measurement of both product and substrate together provides an advantage that an internal replicate measurement may be readily obtained.
Usefully, spectral fingerprint data may be used as the temporal evolution data. This spectral fingerprint data may be acquired in the infrared, particularly mid-IR, spectral region and may be Fourier Transform Infra Red (‘FTIR’) spectral data. This permits the reaction to be monitored in situ without influencing the kinetics and is thus well suited for automation or process control.
Moreover, by using FTIR spectroscopy, numerous molecular/intermolecular vibration bands of the enzymatic reaction including all its side phenomena can be observed from the spectra fingerprints. Hence, the obtained “big picture” enables the possibility to apply this method universally and directly to all kinds of enzymatic classes without any need of using (bio-)chemical standards.
Since the proposed method calibrates enzyme kinetics, particulary activity, against the spectral evolution it is therefore a method to observe the overall activity since all available wavelengths and therefore all ongoing processes may be considered unlike in traditional univariate approaches.
The method according to the present invention for the determination of an indication of enzymatic kinetics will now be described in greater detail with respect to different classes of enzymatic reactions and with reference to the drawings of the accompanying figures, of which:
Fig.1 illustrates a temporal evolution profile: 0U Pectin Lyase Fig.2 illustrates a temporal evolution profile: 7.6U Pectin Lyase Fig.3 illustrates a temporal evolution profile: 15.2U Pectin Lyase Fig.4 illustrates a temporal evolution profile: 45.6U Pectin Lyase Fig.5 illustrates a temporal evolution profile: 76U Pectin Lyase Fig.6 illustrates schematically a Parafac decomposition Fig.7 illustrates a Parafac calibration for Pectin Lyase (substrate) Fig.8 illustrates a Parafac calibration for Pectin Lyase (product) Fig.9 illustrates a temporal evolution profile for Glucose Oxidase Fig. 10 illustrates a Parafac calibration for Glucose Oxidase Fig. 11 illustrates change in calibration performance with time Fig.12 illustrates a Parafac calibration for Cellulast 1.5L
Generally an enzyme catalyzes a reaction according to: Substrate  Product (2)
where the enzyme, Substrate and the Product may each represent one or more compounds, at least one of which has a distinguishable spectral fingerprint that evolves with time during the enzymatic reaction.
The change in the spectral fingerprint of one or both the Substrate and the Product can therefore be related to the kinetics of the enzymatic reaction being monitored. This spectral evolution with time is here referred to as an ‘temporal evolution profile’ which represents the kinetic behaviour of the reaction under certain conditions, such as activity, temperature, pH value).
Consider a first enzymatic reaction involving the lyases enzyme class; as an example pectin lyase is employed to break the glycosidic bonds inside the pectin polymer (Substrate A) to release two segments under the formation of a double bond (Products A and B). In concordance with equation (2) above this may be expressed as: Substrate A  Product A + Product B (3)
Thus: 
The temporal evolution profiles of this enzymatic reaction are represented in the transmission surf plots illustrated in Figs. 1 to 5 for different enzymatic activities (amounts) 0u, 7.6u, 15.2u, 45.6u and 76u respectively. It will be appreciated that absorption or reflectance spectra may also be employed without departing from the invention as claimed. In each of these Figs. 1 to 5 a plurality (here 18) temporal evolution profiles are recorded for each of the different used Pectin Lyase activities (amounts) on the substrate Pectin (1%). The mid-IR transmission spectra are presented as difference spectra (spectrum at time=0 is subtracted from all spectra). As will be appreciated by those skilled in the art, if present, systematic artefacts may be removed using known spectral data pre-treatment. Such pre-treatment may for example comprise SNV (Standard Normal Variate); MSC (Multiplicitive Signal Correction) or first derivative de-trending.
It can be seen from these Figs. 1 to 5 that the temporal spectral evolution depends on the added enzyme amount (activity). Certain bands grow due to the depletion of substrate and others vanish due to product formation (it is the other way around if we look at absorbance). It can also be seen that that behaviour over time is not linear since substrate depletion leads to a reduction in reaction rate over time.
According to the method of the present invention the spectral data represented by the Figs. 1 to 5 is processed using a chemometric multi-way model, in the present embodiment Parafac, to generate a calibration which correlates enzymatic activity with temporal spectral fingerprint evolution data.
To build a calibration for different enzyme activities several evolution profiles need to be acquired to obtain information about how fast the spectra change (kinetics) in dependence of the added enzyme amount (activity). Each evolution profile is represented by a data matrix where the vectors are spectra at consecutive time points. Since all evolution profiles are recorded at the same consecutive time points those matrices can be stacked behind each other to form a multi-way data tensor, X, having a cubic data structure which is defined by its three dimensions, namely wavenumber, time and activity.
Normally, and in the present embodiment, all data is multi-way centered and the cubic data structure is thereafter decomposed. Assuming that during the monitored reaction different Products are formed or different Substrates are used up then decomposition is expected in different subspaces (Components) which represent the kinetics of those different reactions. Furthermore different other phenomena also showing up in the evolution would also add other components. Decomposition is made here into three matrices A, B and C using the Parafac algorithm as illustrated in Fig. 6. The matrices contain information as follows:
A – This matrix contains the true spectral fingerprints of the enzymatic system. Here spectra representing both the substrate and the product are illustrated by way of example;
B – This matrix contains the kinetic (i.e. time resolved) behaviour of substrate and product; and
C – This matrix contains the information about how abundant the change in spectra in B is considering the pure spectra from A. Those values of that matrix therefore correlate with the used enzyme amount activity (having opposite slopes for substrate and product)
C represents the multi-way scores (which by accepted definition is at least three-way scores) which according to this exemplary embodiment of the present invention may be correlated with the added enzyme activity. This may be expressed as: 
where E is an error matrix (residuals)
A particular advantage with the method according to the present invention is that Parafac (or, more generally, the particular multi-way model selected) is not supervised with information concerning the added enzyme activities. This means that the analysis doesn’t know about the added activities and therefore finds the scores unsupervised. After the analysis the scores are scattered against the known added activities. In other embodiments it can also be done supervised (using N-PLS for example). However for intelligent instrumentation one most likely would do that in a later stage (using N-PLS or combining the scores from both results in multiple linear regression as mentioned before.
The following is an exemplary description of the application of the method according to the present invention in the monitoring of the activities of three different types of enzyme.
All spectra were obtained using a FOSS FT2 instrument (FOSS ANALYTICAL, Hillerød, Denmark). The instrument has a FTIR (Fourier Transform Infrared Spectroscopy) interferometer that scans the full infrared spectrum, is equipped with an automatic flow-through system apparatus and works semi-automated. Samples may be flowed into a measurement region of the flow-through system, where flow is halted and one or more FTIR spectra are obtained before the sample is flowed out of the measurement region to waste; to be returned to a main sample stream or to be re-cycled. The optical system is hermetically sealed and humidity controlled.
The three different enzymatic systems (or classes) that have been investigated are 1) Glucose Oxidase 2) Pectin Lyase 3) Celluclast 1.5L (Reducing Sugar). Enzyme and Substrate solutions were prepared as described below.
The Pectin Lyase measurements have been carried out using 1% (w/v) apple pectin in 100 mM sodium phosphate buffer pH 7 and Pectin Lyase from Aspergillus nidulans, which was in-house fermented by Center for Bioengineering, DTU, Lyngby, Denmark.
Glucose Oxidase was assessed using 100 mM α/β-D-Glucose in 50 mM potassium phosphat buffer pH 6,9. The substrate was equilibrated over night to avoid mutarotation effects during the assay. A lyophilized solid enzyme preparation of Glucose Oxidase (Aspergillus niger) which is commercially available from Sigma Aldrich was used.
The reducing sugar assay was carried out using 1% (w/v) Carboxylmethylcellulose (low viscosity) in 50 mM acetate buffer pH 5 and a liquid multi component enzyme preparation called Celluclast1.5L which is commercially available from Novozymes, Denmark.
Enzymes solutions were prepared as described in the following:
- Mono-component Pectin Lyase enzyme preparation in-house fermented in Center for Bioengineering, DTU, Lyngby, Denmark.
- Lyophilized solid enzyme preparation of Glucose Oxidase from Aspergillus niger commercially available from Sigma Aldrich, Saint Louis, United States of America
- Multi Component Enzyme preparation Celluclast 1.5L commercially available from Novozymes, Bagsvaerd, Denmark.
To obtain enzyme activity calibrations, by way of non limiting example only, several steps were performed.
- Evolution profiles of control mixtures were acquired. One control contained only the substrate and no enzyme. Buffer was added instead of enzyme solution. The second control contained only enzyme and no substrate. Instead of substrate solution only buffer was added. The evolution profiles of both controls were supposed to show no significant change in time. That step assures that the observed spectral evolution in spectra is due to enzyme activity and not due to altering circumstances like temperature, precipitation, denaturation, mutarotation etc.
- Various evolution profiles were acquired using equal substrate concentrations and different amounts of enzyme (activities). Measurements were carried out in random order to prevent from systematic biases. Depending on the nature of the enzymatic reaction, measurements have been carried out in flow-back mode where the reaction mixture was continuously lead back to the reaction container to ensure access of gases as oxygen which is necessary for the reaction of e.g. Glucose Oxidase. Other enzymatic reactions have been pumped into the reaction container only once using a flow system for continuous measurements. In this case the reaction mixture is delayed inside the reaction container during the whole acquisition period. Three replicates were measured for each calibration point.
- After acquisition of the calibration data it was exported to an appropriate numerical processing environment such as Matlab(TM) (The MathWorks Inc., Natick, MA, United States of America) where acquired data was pre-treated to remove systematic artifacts. Parafac analysis was performed for example by utilizing a commercially available multivariate analysis tool such as PLS Toolbox 6.0.1 (EigenVector Research Inc., Wenatchee, WA, United States of America)
- The obtained scores from the Parafac decomposition were scattered against the added enzyme amounts. The exact activities were determined by traditional colorimetric assays.
The actual calibration equation may be obtained from a correlation of the multi-way scores (C) with the known activities. This correlation is illustrated in Fig.7 and Fig. 8 for the present pectin lyase example where Fig.7 shows a calibration obtained for the pectin polymer substrate and Fig. 8 shows a calibration obtained for the products.
The calibration details are provided in Table 1 below: Table 1
| No. of Spectra in each evolution profile | 15 |
| Acquisition time per | 16,6 seconds |
| Total time for an | 4,2 |
| Parafac Components | |
| 2 | |
| Parafac Core consistency | 93 |
| Calibration performance, R2 | 0,998 and 0,995 |
| Spectral Pretreatment | SNV+Multiway Center (Mode 1) |
| Spectral Range for calibration | 991cm-1 to 1480cm-1 (Pin:18-145) |
| Detection limit (3*standard deviation) | 0.18U |
| Enzyme | Monocomponent pectin lyase |
Calibration equations are obtained from a “least squares type” straight line fit of the experimental data points as illustrated, by way of example only, in Fig. 7 and Fig. 8 and yield C= -0.17268U + 0.312869 for the substrate (Fig.7); and C= 0.119861U - 0.21747 for the products (Fig.8).
For a new, unknown system Parafac (or the particular multi-way model selected to generate the calibration equation (4) as discussed above) is applied to the spectral data acquired for that system in a suitably configured data processor and a score (C) is obtained for that system. The data processor then is operated to apply the appropriate calibration equation (for example selected from those given above) to the score (C) and from this to determine an activity, U, for the new system.
Consider now a second enzymatic reaction involving the oxido reductases enzyme class; as an example glucose oxidase (GOx) is employed in the conversion of β-D-Glucose (Substrate A) to a δ-D-Gluconolacton (Product A) using Oxygen (Substrate B). During the reaction hydrogen peroxide is also formed as a product (Product B). In concordance with equation (2) above this may be expressed as:
Substrate A + Substrate B  Product A + Product B (5)
Exemplary temporal evolution profiles for this enzymatic reaction are illustrated in Fig.9 for a single enzymatic activity. In common with the first example and as can be seen, certain bands grow while others diminish with time. Mid-IR spectral data at different known activities was collected using FTIR and a calibration established essentially as described in relation to the first example. The correlation of multi-way scores (C), that are here also determined using Parafac, with known activities is illustrated in Fig. 10 for the glucose oxidase example.
The calibration details are provided in Table 2 below: Table 2
| No. of Spectra in each | 40 |
| Acquisition time per spectrum | 31 seconds |
| Total time for an | 20,7 min |
| Parafac Components | 3 |
| Parafac Core consistency | 75 |
| Calibration performance, | 0,96 |
| Spectral Pretreatment | SNV+Multiway Center (Mode 1) |
| Spectral Range for calibration | 1094cm-1 to 1558cm-1 (Pin:45-165) |
| Detection limit (3*standard deviation) | 5,53U |
| Enzyme | Glucose Oxidase from Aspergillus niger |
Calibration equations are obtained from a straight line fit of the experimental data points as illustrated by way of example in Fig. 10 C= -0.00241U + 0.112562
Taking this example of Glucose Oxidase, performance of the calibration was compared by using different amounts of spectra in the temporal evolution profiles. That means the dimension of time was reduced stepwise and different Parafac models were calculated. The Parafac scores were then scattered against the known added activities and the correlation of the resulting calibration was scattered against its Regression coefficient R2. The result is illustrated in Fig. 11 and as can be seen an expansion of evolution time increases calibration performance. However, in the present embodiment after acquisition of about twenty spectra (approximately ten minutes) the calibration performance R2 lies around 0,9 and after acquisition of about sixty spectra (approximately thirty minutes) does not increase significantly anymore. The number of spectra required to provide an adequate calibration performance for the intended application can readily be determined empirically in this manner.
Consider now a third enzymatic reaction involving Celluclast. Celluclast 1.5L is a liquid commercial enzyme preparation available from Novozymes. It contains various enzyme activities, mostly cellulases, which cleave different glycosidic bonds. Typical enzyme activities are represented by endocellulases, exocellulases, β-Glucosidases. The mixture of those various enzyme activities is designed to break down biopolymers as cellulose in an efficient manner to provide readily available monosaccharides for e.g. bio-ethanol production. Whenever a glycosidic bond is broken a new poly-, oligo- or monosaccharide is formed with a reducing end. Among other features the formed carbohydrate molecule is in equilibrium with its open form and features, among other intra- and intermolecular spectroscopic properties, a CO double bond which is highly significant in IR spectroscopy.
As can be appreciated the method according to the present invention gives opportunity to monitor the overall activity of multi-component enzyme preparations such as Celluclast 1.5L. Up to now filter paper units have been used to describe the efficiency of a combination of enzymes, namely endocellulases, exocellulases, beta-Glucosidases. The filter paper is used to monitor how efficient Celluclast 1.5L can degrade biomasses on cellulose basis.
This ‘filter paper scale’ is employed to give an indication of the overall performance of the enzymatic cocktail since a colorimetric approach would usually measure only a specific product or substrate and therefore quantify only one specific activity.
Many different biomasses are digested using Cellulases and other biopolymer breaking enzymes in this manner. To monitor the activity of those enzymes traditionally a special and very cumbersome reducing sugar assay is necessary (for example as described by Mullings, R. & Parish, J.H. New Reducing Sugar Assay for the Study of Cellulases. Enzyme and Microbial Technology 6, 491-496 (1984)).
The correlation of multi-way scores (C), that are here also determined using Parafac, with known activities is illustrated in Fig. 12 for the Cellulast 1.5L example.
The calibration details are provided in Table 3 below: Table 3
| No. of Spectra in each evolution profile | 15 |
| Acquisition time per | 16,6 seconds |
| Total time for an | 4,2 |
| Parafac Components | |
| 2 | |
| | 100 |
| Calibration performance, | 0,99 and 0,98 |
| Spectral Pretreatment | SNV+Multiway Center (Mode 1) |
| Spectral Range for calibration | 991cm-1 to 1558cm-1 (Pin:18-165) |
| Detection limit (3*standard deviation) | 0,07575U |
| Enzyme | Cellulast 1.5L |
Calibration equations are obtained from a straight line fit of the experimental data points as illustrated by way of example in Fig. 12 C= 0.112562U - 0.27704
In the foregoing reference has been made to the spectral fingerprints of both Substrate and Product that exist in the mid-IR spectral region and which may suitably be detected using FTIR. It will be clear to the skilled person that spectral fingerprints may exist in other spectral regions and/or be detected using other appropriate methodologies so that the invention should not be interpreted as being limited to the mid-IR spectral region and/or the FTIR detection methodology. Furthermore it will be appreciated by the skilled person that using other methodologies, for example Fluorescence Excitation Emission Spectroscopy (FEES), the multi-linearity of the data set could lead to dimensions of the data set which is greater than three. Where FEES is used four dimensions are possible with each excitation energy employed providing a complete emission spectrum. Thus at each time point and for each enzymatic activity each excitation energy will produce a different emission spectrum.
Acknowledgement:
The work leading to this invention has received funding from the European Union Seventh Framework Programme (FP7/2007-2013) under grant agreement n° 238084.
Claims (6)
- A method of determining an indication of enzymatic kinetics of a monitored enzymatic reaction comprising: originating temporal evolution data of one or both of a substrate and a product of an enzymatic reaction for different known enzymatic activities; establishing in a data processor a calibration correlating enzymatic kinetics with temporal evolution data by applying a chemometric multi-way model to data representative of the originated temporal evolution data; originating corresponding temporal evolution data for a monitored enzymatic reaction of unknown kinetics; providing to the data processor data representing the provided temporal evolution data and applying to that data the calibration to determine thereby in the data processor a quantitative and/or qualitative indication of enzymatic kinetics of the monitored enzymatic reaction.
- A method as claimed in claim 1 wherein the temporal evolution data comprise optical spectral fingerprints.
- A method as claimed in Claim 2 wherein the optical spectral fingerprints are infrared spectral fingerprints.
- A method as claimed in Claim 2 wherein the optical spectral fingerprints are Fluorescence Excitation Emission spectral fingerprints.
- A method as claimed in Claim 1 wherein the chemometric multi-way model is applied to generate in the data processor a multi-way score; wherein the data processor is adapted to correlate the multi-way score with enzymatic activity to establish the calibration equation which links the multi-way score with activity; and wherein the data processor is further adapted to apply the so established calibration to a multi-way score determined for the monitored enzymatic reaction in order to obtain the quantitative and/or qualitative indication of the enzymatic activity of the monitored reaction.
- A method as claimed in Claim 5 wherein the data processor is adapted to apply Parafac modelling to establish the multi-way score.
Priority Applications (1)
| Application Number | Priority Date | Filing Date | Title |
|---|---|---|---|
| PCT/EP2012/066650 WO2014032695A1 (en) | 2012-08-28 | 2012-08-28 | Enzyme kinetics |
Applications Claiming Priority (1)
| Application Number | Priority Date | Filing Date | Title |
|---|---|---|---|
| PCT/EP2012/066650 WO2014032695A1 (en) | 2012-08-28 | 2012-08-28 | Enzyme kinetics |
Publications (1)
| Publication Number | Publication Date |
|---|---|
| WO2014032695A1 true WO2014032695A1 (en) | 2014-03-06 |
Family
ID=46799211
Family Applications (1)
| Application Number | Title | Priority Date | Filing Date |
|---|---|---|---|
| PCT/EP2012/066650 Ceased WO2014032695A1 (en) | 2012-08-28 | 2012-08-28 | Enzyme kinetics |
Country Status (1)
| Country | Link |
|---|---|
| WO (1) | WO2014032695A1 (en) |
Cited By (1)
| Publication number | Priority date | Publication date | Assignee | Title |
|---|---|---|---|---|
| CN115032121A (en) * | 2022-06-30 | 2022-09-09 | 重庆医药高等专科学校 | Rapid and simple pectinase activity detection method |
-
2012
- 2012-08-28 WO PCT/EP2012/066650 patent/WO2014032695A1/en not_active Ceased
Non-Patent Citations (9)
| Title |
|---|
| BRO R ET AL: "Enzymatic browning of vegetables. Calibration and analysis of variance by multiway methods", CHEMOMETRICS AND INTELLIGENT LABORATORY SYSTEMS, ELSEVIER SCIENCE PUBLISHERS B.V. AMSTERDAM, NL, vol. 34, no. 1, 1 August 1996 (1996-08-01), pages 85 - 102, XP004037932, ISSN: 0169-7439, DOI: 10.1016/0169-7439(96)00019-6 * |
| HANNE HEIMDAL ET AL: "Prediction of Polyphenol Oxidase Activity in Model Solutions Containing Various Combinations of Chlorogenic Acid, (-)-Epicatechin, O 2 , CO 2 , Temperature, and pH by Multiway Data Analysis", JOURNAL OF AGRICULTURAL AND FOOD CHEMISTRY, vol. 45, no. 7, 1 July 1997 (1997-07-01), pages 2399 - 2406, XP055043693, ISSN: 0021-8561, DOI: 10.1021/jf960975w * |
| KARMALI K; KARMALI A; TEIXEIRA A; CURTO MJM.: "Assay for glucose oxidase from Aspergillus niger and Penicillium amagasakiense by Fourier transform infrared spectroscopy", ANALYTICAL BIOCHEMISTRY, vol. 333, no. 2, 2004, pages 320 - 327, XP004573021, DOI: doi:10.1016/j.ab.2004.06.025 |
| KARMALI K; KARMALI A; TEIXEIRA A; CURTO MJM.: "The use of Fourier transform infrared spectroscopy to assay for urease from Pseudomonas aeruginosa and Canavalia ensiformis", ANALYTICAL BIOCHEMISTRY, vol. 331, no. 1, 2004, pages 115 - 121, XP004520202, DOI: doi:10.1016/j.ab.2004.04.020 |
| KUMAR S; BARTH A.: "Following Enzyme Activity with Infrared Spectroscopy", SENSORS, vol. 10, no. 4, 2010, pages 2626 - 2637, XP002686907 * |
| KUMAR S; BARTH A.: "Following Enzyme Activity with Infrared Spectroscopy", SENSORS, vol. 10, no. 4, 2010, pages 2626 - 2637, XP002686907, DOI: doi:10.3390/s100402626 |
| LEGER M N ET AL: "Methods for systematic investigation of measurement error covariance matrices", CHEMOMETRICS AND INTELLIGENT LABORATORY SYSTEMS, ELSEVIER SCIENCE PUBLISHERS B.V. AMSTERDAM, NL, vol. 77, no. 1-2, 28 May 2005 (2005-05-28), pages 181 - 205, XP027775044, ISSN: 0169-7439, [retrieved on 20050528] * |
| MCDONOUGH, W.; BRAUNGART, M.: "Cradle to Cradle : remaking the way we make things", 2002, NORTH POINT PRESS |
| MUÑOZ DE LA PEÑA A ET AL: "Four-way calibration applied to the simultaneous determination of folic acid and methotrexate in urine samples", ANALYTICAL AND BIOANALYTICAL CHEMISTRY, SPRINGER, BERLIN, DE, vol. 385, no. 7, 10 May 2006 (2006-05-10), pages 1289 - 1297, XP019420237, ISSN: 1618-2650, DOI: 10.1007/S00216-006-0408-3 * |
Cited By (1)
| Publication number | Priority date | Publication date | Assignee | Title |
|---|---|---|---|---|
| CN115032121A (en) * | 2022-06-30 | 2022-09-09 | 重庆医药高等专科学校 | Rapid and simple pectinase activity detection method |
Similar Documents
| Publication | Publication Date | Title |
|---|---|---|
| Baltierra-Trejo et al. | Inconsistencies and ambiguities in calculating enzyme activity: The case of laccase | |
| Wu et al. | Monitoring of fermentation process parameters of Chinese rice wine using attenuated total reflectance mid-infrared spectroscopy | |
| Ji et al. | Raman spectroscopy provides a rapid, non‐invasive method for quantitation of starch in live, unicellular microalgae | |
| Wu et al. | Measurement of fermentation parameters of Chinese rice wine using Raman spectroscopy combined with linear and non-linear regression methods | |
| EP2454590B1 (en) | A method of analyzing cellulose decay in cellulosic material hydrolysis | |
| Haack et al. | On-line cell mass monitoring of Saccharomyces cerevisiae cultivations by multi-wavelength fluorescence | |
| Gray et al. | Real‐time monitoring of high‐gravity corn mash fermentation using in situ raman spectroscopy | |
| Visnupriyan et al. | Near infrared spectroscopy combined with chemometrics as tool to monitor starch hydrolysis | |
| Makela et al. | Nonchromatographic cyclodextrin assays: evaluation of sensitivity, specificity, and conversion mixture applications | |
| Cozzolino | State-of-the-art advantages and drawbacks on the application of vibrational spectroscopy to monitor alcoholic fermentation (beer and wine) | |
| Morel et al. | Application of multi-wavelength fluorometry for on-line monitoring of an anaerobic digestion process | |
| Pinto et al. | Fast spectroscopic monitoring of inhibitors in the 2G ethanol process | |
| Baum et al. | Rapid near infrared spectroscopy for prediction of enzymatic hydrolysis of corn bran after various pretreatments | |
| Ortiz et al. | Microplate assay for endo-polygalacturonase activity determination based on ruthenium red method | |
| CN102297846A (en) | Method for rapidly determining content of hyaluronic acid in fermentation liquor | |
| ES2718984T3 (en) | Procedure for estimating the biodegradation of a substrate in a methanizer | |
| Schindler et al. | Automated multivariate calibration in sequential injection-Fourier transform infrared spectroscopy for sugar analysis | |
| Semeraro et al. | A simple strategy based on ATR-FTIR difference spectroscopy to monitor substrate intake and metabolite release by growing bacteria | |
| Dock et al. | Multivariate data analysis of dynamic amperometric biosensor responses from binary analyte mixtures—application of sensitivity correction algorithms | |
| WO2014032695A1 (en) | Enzyme kinetics | |
| Sibono et al. | Optimization and kinetic analysis of untreated brewers’ spent grain saccharification process via enzymatic hydrolysis | |
| Wu et al. | Application of FT-NIR spectroscopy and FT-IR spectroscopy to Chinese rice wine for rapid determination of fermentation process parameters | |
| Arnosti et al. | Dynamics of extracellular enzyme activities in seawater under changed atmospheric pCO2: a mesocosm investigation | |
| Trollope et al. | Screening a random mutagenesis library of a fungal β-fructofuranosidase using FT-MIR ATR spectroscopy and multivariate analysis | |
| Whitford et al. | Analytical technology and PAT |
Legal Events
| Date | Code | Title | Description |
|---|---|---|---|
| 121 | Ep: the epo has been informed by wipo that ep was designated in this application |
Ref document number: 12755821 Country of ref document: EP Kind code of ref document: A1 |
|
| NENP | Non-entry into the national phase |
Ref country code: DE |
|
| 122 | Ep: pct application non-entry in european phase |
Ref document number: 12755821 Country of ref document: EP Kind code of ref document: A1 |