WO2014020747A1 - 物理量推定システム及び物理量推定方法 - Google Patents
物理量推定システム及び物理量推定方法 Download PDFInfo
- Publication number
- WO2014020747A1 WO2014020747A1 PCT/JP2012/069735 JP2012069735W WO2014020747A1 WO 2014020747 A1 WO2014020747 A1 WO 2014020747A1 JP 2012069735 W JP2012069735 W JP 2012069735W WO 2014020747 A1 WO2014020747 A1 WO 2014020747A1
- Authority
- WO
- WIPO (PCT)
- Prior art keywords
- physical quantity
- scenario
- simulation
- type
- cluster
- Prior art date
- Legal status (The legal status is an assumption and is not a legal conclusion. Google has not performed a legal analysis and makes no representation as to the accuracy of the status listed.)
- Ceased
Links
Images

















Classifications
-
- G—PHYSICS
- G06—COMPUTING OR CALCULATING; COUNTING
- G06F—ELECTRIC DIGITAL DATA PROCESSING
- G06F30/00—Computer-aided design [CAD]
- G06F30/20—Design optimisation, verification or simulation
-
- G—PHYSICS
- G06—COMPUTING OR CALCULATING; COUNTING
- G06F—ELECTRIC DIGITAL DATA PROCESSING
- G06F2111/00—Details relating to CAD techniques
- G06F2111/02—CAD in a network environment, e.g. collaborative CAD or distributed simulation
Definitions
- the present invention relates to a technique for estimating a physical quantity using simulation, and more particularly, to a technique for estimating an arbitrary physical quantity by simulation using various data with position information and time information acquired by a plurality of types of sensors.
- Real-time simulation technology in which, when data actually measured by a sensor is given as an initial condition, a current physical quantity (or an arbitrary time) is estimated and output by performing a predetermined calculation.
- Patent Document 1 Japanese Patent Laid-Open No. 2010-54460
- N is obtained by performing data interpolation based on the wind direction and wind speed data included in the atmospheric analysis data obtained by correcting the weather forecast value of the first estimated value with the observed value.
- the wave forecast data at the time is estimated, this is set in the wave estimation program as an initial condition value for the wave forecast at the time of N + ⁇ , and the wave at the time of N + ⁇ is predicted. It is repeatedly executed at predetermined time intervals ( ⁇ ), and the global weather forecast data that predicts global weather changes and the wind data of local weather data are set in the wave estimation program to perform the wave prediction. In this way, it is possible to quickly calculate high-accuracy wave forecast data for every point with no error expansion in the wave state change forecast data over time.
- Patent Document 1 JP 2010-54460 A
- Sensors that measure various physical quantities for the purpose of disaster prevention or commercial use and provide data including the measured physical quantities are installed in human living areas (or surrounding areas). Some examples are seismometers, rain gauges, anemometers, anemometers, water level meters such as rivers, wattmeters at homes or offices, and traffic sensors installed on roads. . However, due to various factors such as the cost of installing and maintaining the sensor, the failure of the communication path through which the sensor itself or data from the sensor passes, and the communication speed in the communication path, etc. It is assumed that quantity data cannot be obtained. Thus, it is conceivable to estimate a physical quantity at a point or time that cannot be actually acquired by the sensor by simulation. However, since it usually takes a lot of time to execute such a simulation, a simulation is performed using real-time data actually acquired from a sensor as an initial condition. It is difficult to estimate the physical quantity.
- the present invention provides a value input as a simulation condition, and a physical quantity at one or more positions calculated as a result of a predetermined simulation based on the input value.
- a scenario holding unit that holds a plurality of scenarios including the measured physical quantity and a physical quantity included in the plurality of scenarios by a predetermined calculation based on the position where the physical quantity is measured;
- a scenario synthesis unit for estimating a physical quantity; and a synthesis scenario holding unit for holding the estimated physical quantity.
- the simulation result executed in advance can be used to achieve high speed and high reliability.
- a physical quantity can be estimated.
- scenario DB of the 1st Embodiment of this invention It is explanatory drawing of the important spot management table contained in scenario DB of the 1st Embodiment of this invention. It is a flowchart of the scenario synthetic
- FIG. 1 is a functional block diagram showing the configuration of the computer system according to the first embodiment of this invention.
- the computer system includes a physical quantity estimation system 100, a scenario example input system 110, a sensor 120, a current status input system 130, and an application system 140.
- the scenario example input system 110 is connected to the physical quantity estimation system 100 via the network 150A, the sensor 120 and the current status input system 130 via the network 150B, and the application system 140 via the network 150C.
- the physical quantity estimation system 100 is a computer that estimates physical quantities based on data acquired from the sensor 120 and the current status input system 130, and includes a simulation condition generation unit 101, a simulator 102, a scenario management unit 103, a scenario database (DB) 104, an input A reception unit 105, a scenario synthesis unit 106, a synthesis scenario DB 107, and a scenario distribution unit 108 are included. Details of these units and the hardware configuration of the physical quantity estimation system 100 will be described later.
- the “simulator” is a module having a function of deductively calculating other physical quantities when a physical condition is input. That is, what is generally called a simulator corresponds to the simulator of this embodiment, but even if it is not generally called a simulator, it is applicable to the simulator of this embodiment as long as it has the above functions. To do.
- the physical quantity estimation system 100 of the present embodiment may include a plurality of different types of simulators 102 (for example, an earthquake simulator and an inundation simulator).
- the “scenario” is a record of a physical phenomenon that can actually occur, and may include information on the probability that the physical phenomenon will occur.
- the scenario is a set of conditions input to the simulation and the result (that is, physical quantity) of the simulation.
- the result that is, physical quantity
- the input epicenter and the magnitude of the earthquake and the calculated time at each time A set of values of the magnitude of shaking at each point is one scenario.
- a set of inundation depth values at each point is one scenario.
- the scenario example input system 110 is used by a developer, administrator, user, or the like (hereinafter also simply referred to as a user) of the physical quantity estimation system 100 to input an example scenario, and is connected to the network 150A. Realized by computer.
- the scenario example input system 110 may be a Web browser that operates on the computer.
- the scenario example input here is, for example, information defining relationships between a plurality of simulations, and details thereof will be described later.
- the sensor 120 measures a physical quantity at a predetermined timing (for example, periodically or in response to a request from the physical quantity estimation system 100), and data including the measured physical quantity (that is, the measured physical quantity itself or calculated based on it). Is transmitted to the physical quantity estimation system 100 via the network 150B.
- a sensor 120 is illustrated in FIG. 1 of the present embodiment, a plurality of types of sensors 120 are actually installed at each point.
- Each sensor 120 is, for example, a seismometer, a rain gauge, a water level meter installed in a river, a power meter (for example, a so-called smart meter) installed in each home or office, or a traffic sensor installed on a road. It is.
- the data transmitted from each sensor 120 includes at least information on the time at which the physical quantity was measured, in addition to the measured physical quantity (for example, water level or electric energy).
- the physical quantity estimation system 100 holds information (coordinate values and the like) on the position where each sensor is installed.
- the sensor 120 is not fixedly installed at a predetermined position, but may be movable. In that case, the position information of the sensor 120 is also included in the data transmitted from the sensor 120.
- An example of a movable sensor is an in-vehicle terminal (probe terminal installed in a so-called probe car) that is installed in a traveling automobile and transmits position information of the automobile at a predetermined timing. The traffic volume on the road can be measured based on the information.
- the physical quantity estimation system 100 holds the position information transmitted from the sensor 120 and specifies the position of the sensor 120 based on the position information.
- the current status input system 130 is used by a user or the like of the physical quantity estimation system 100 to input information used for physical quantity estimation by the physical quantity estimation system 100, and is realized by a computer connected to the network 150B.
- the current status input system 130 may be a Web browser that operates on the computer.
- the user or the like may input information indicating the degree of shaking experienced by the user using the current status input system 130.
- the current status input system 130 transmits the input information to the physical quantity estimation system 100.
- the physical quantity estimation system 100 may handle the information received from the current status input system 130 in the same manner as the data transmitted from the seismometer among the plurality of sensors 120.
- the accuracy is considered to be lower than the seismometer system.
- the accuracy when a user or the like inputs another physical quantity is generally lower than the accuracy of a sensor that measures the physical quantity. That is, the physical quantity estimation system 100 can handle information from the current status input system 130 as information from the sensor 120 with low accuracy.
- a physical quantity that is difficult to detect by the sensor 120 or a physical quantity at a point where the sensor 120 is not installed can be manually input.
- the application system 140 executes an arbitrary process based on the physical quantity estimated by the physical quantity estimation system 100. For example, when the physical quantity estimation system 100 estimates the seismic intensity at an arbitrary time, the application system 140 may transmit an earthquake warning, a tsunami warning, evacuation information, or the like based on the seismic intensity. When the physical quantity estimation system 100 estimates the flooding depth due to flooding at an arbitrary time, the application system 140 may search for a route that passes only through a road that is not flooded.
- the application system 140 is realized, for example, by a system including a computer connected to the network 150C.
- the networks 150A, 150B and 150C may be anything as long as they enable communication between systems connected to them.
- the networks 150A, 150B, and 150C may be public networks such as the so-called Internet or telephone network, may be dedicated networks for the physical quantity estimation system 100, or may be a combination thereof.
- Good. 1 shows three networks 150A, 150B and 150C, these may be realized by one network.
- the network 150 is referred to in the following description, it is one of the networks 150A, 150B, and 150C, or one network that realizes the networks 150A, 150B, and 150C.
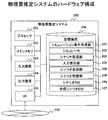
- FIG. 2 is a block diagram illustrating a hardware configuration of the physical quantity estimation system 100 according to the first embodiment of this invention.
- the physical quantity estimation system 100 of this embodiment is a computer having a processor 201, a main memory 202, an input device 203, an output device 204, an interface (I / F) 205, and a storage device 206 that are connected to each other.
- the processor 201 executes a program stored in the main memory 202.
- the main memory 202 is, for example, a semiconductor memory, and stores a program executed by the processor 201 and data referred to by the processor 201. Specifically, at least a part of the program and data stored in the storage device 206 is copied to the main memory 202 as necessary.
- the input device 203 receives input from a user of the physical quantity estimation system 100 or the like.
- the input device 203 may include, for example, a keyboard and a mouse.
- the output device 204 is an image display device such as a liquid crystal display device.
- the I / F 205 is an interface that is connected to the network 150 and communicates with the scenario example input system 110, the sensor 120, the current status input system 130, and the application system 140.
- the physical quantity estimation system 100 includes a plurality of I / Fs 205 connected to the respective networks.
- the storage device 206 is a non-volatile storage device such as a hard disk device (HDD) or a flash memory.
- the storage device 206 of this embodiment stores at least a simulation condition generation unit 101, a simulator 102, a scenario management unit 103, an input reception unit 105, a scenario synthesis unit 106, a scenario distribution unit 108, a scenario DB 104, and a synthesis scenario DB 107.
- the storage device 206 stores at least a simulation condition generation unit 101, a simulator 102, a scenario management unit 103, an input reception unit 105, a scenario synthesis unit 106, a scenario distribution unit 108, a scenario DB 104, and a synthesis scenario DB 107.
- the scenario DB 104 and the combined scenario DB 107 hold a scenario generated by the scenario management unit 103 and a scenario combined by the scenario combining unit 106, as will be described later.
- the simulation condition generation unit 101, the simulator 102, the scenario management unit 103, the input reception unit 105, the scenario synthesis unit 106, and the scenario distribution unit 108 are programs executed by the processor 201. In the following description, the processing executed by these units is actually executed by the processor 201. Although only one simulator 102 is shown in FIG. 2, the physical quantity estimation system 100 of this embodiment holds a plurality of different types of simulators 102 (for example, an earthquake simulator program and an inundation simulator program).
- the input system 110, the current status input system 130, and the application system 140 can be realized by a computer having the same hardware as the physical quantity estimation system 100, and therefore, their hardware configurations are not shown.
- a storage device (not shown) or main memory (not shown) of the scenario example input system 110 stores a program (for example, a web browser, not shown) for realizing the scenario example input system, and stores the program in the scenario example input system 110.
- a program for example, a web browser, not shown
- a processor not shown
- a processor (not shown) of the current status input system 130 executes a program (for example, a web browser, not shown) for realizing the current status input system stored in a storage device (not shown) or the like of the current status input system 130.
- a program for example, a web browser, not shown
- An application program (not shown) stored in a storage device (not shown) or the like of the application system 140 is executed by a processor (not shown) of the application system 140.
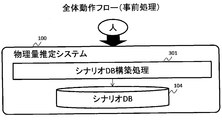
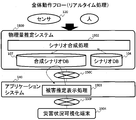
- the physical quantity estimation system 100 executes pre-processing (FIG. 3A) and real-time processing (FIG. 3B).
- pre-processing based on the physical quantity acquired by the physical quantity estimation system 100 from the sensor 120 or the like, a physical quantity at an arbitrary time point in the present or the future is estimated, and a scenario (synthesis scenario) including the estimation result is distributed to the application system 140. It is processing.
- the pre-processing corresponds to preparation for executing the real-time processing, and needs to be executed at least once before the real-time processing is executed for the first time after the physical quantity estimation system 100 is introduced.
- FIG. 3A is a flowchart of pre-processing executed by the physical quantity estimation system 100 according to the first embodiment of this invention.
- the physical quantity estimation system 100 executes scenario DB construction processing (step 301). As a result, a large number of scenarios assumed in advance are created and stored in the scenario DB 104. Details of the scenario DB construction process will be described later with reference to FIG.
- FIG. 3B is a flowchart of real-time processing executed by the physical quantity estimation system 100 according to the first embodiment of this invention.
- the physical quantity estimation system 100 executes scenario synthesis processing with reference to the scenario DB 104 (step 302). As a result, a new scenario is synthesized based on the data measured in real time and the scenario created in advance, and the result is stored in the synthesis scenario DB 107. Details of the scenario synthesis process will be described later with reference to FIG.
- the application system 140 can execute various applications with reference to the synthesis scenario DB 107.
- the application system 140 may execute guidance information generation processing with reference to the synthesis scenario DB 107 (step 303), and transmit the generated guidance information to the mobile terminal 304 via the network 150D. Details of the guidance information generation process will be described later with reference to FIG.
- the mobile terminal 304 is a terminal device such as a mobile phone possessed by the user of the application system 140.
- the network 150D is, for example, a mobile phone network or a wireless local area network (LAN), but any network communication is possible as long as communication between the application system 140 and the mobile terminal 304 is possible. Also good.
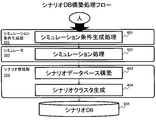
- FIG. 4 is a flowchart of scenario DB construction processing executed by the physical quantity estimation system 100 according to the first embodiment of this invention. This process is executed in step 301 in FIG. 3A.
- the simulation condition generation unit 101 executes a simulation condition generation process (step 401). Details of the simulation condition generation processing will be described later with reference to FIG.
- the simulator 102 executes a simulation process according to the simulation conditions generated in step 401 (step 402). Details of the simulation process will be described later with reference to FIG.
- the scenario management unit 103 constructs the scenario DB 104 using the simulation result obtained in step 402 (step 403). Further, the scenario management unit 103 refers to the scenario stored in the scenario DB 104, generates a scenario cluster, and stores the result in the scenario DB 104 (step 404). Details of these processes will be described later with reference to FIGS.
- FIG. 5 is a flowchart of simulation condition generation processing executed by the physical quantity estimation system 100 according to the first embodiment of this invention. This process is executed by the simulation condition generation unit 101 in step 401 of FIG.
- the simulation condition generating unit 101 executes a simulation condition receiving process (step 501). Specifically, the simulation condition generation unit 101 receives an input of simulation conditions from a user or the like of the physical quantity estimation system 100 via the scenario example input system 110.
- a user or the like can input, as a simulation condition, an event that can be considered to actually occur based on experience or academic knowledge. For example, the user may input the epicenter of the earthquake that may occur and the magnitude of the earthquake as simulation conditions for the earthquake simulator.
- the user can calculate the location where the river embankment may break and the flow rate of water flowing out from it, or the rainfall at a certain point. You may input as simulation conditions.
- the user or the like can input information that associates a plurality of types of simulations, more specifically, information that defines a method for generating simulation conditions for another simulator based on the result of simulation by one simulator.
- the simulators 102 is the above-described earthquake simulator and the other one is a fire simulator that simulates the range of fire spread when a fire point is input
- the user or the like Information that associates with the probability may be input.
- the simulator 102 further includes an electric power simulator that simulates the amount of electric power used by each home, office, etc.
- the user or the like can obtain information that associates the magnitude of the earthquake shake with the occurrence probability of a power outage, and the occurrence of a fire and a power outage. You may input the information linked
- one of the simulators 102 is a flood simulator or a tsunami simulator that estimates the inundation depth due to a tsunami
- another one is a power simulator that estimates the amount of power measured by a smart meter
- Information relating to the probability of failure of the smart meter may be input. Such an example will be described in the second embodiment of the present invention.
- the simulation condition generation unit 101 executes boundary condition extraction processing (step 502).
- the boundary condition is a specific numerical value input to the simulator 102 as a simulation condition.
- the simulation condition generation unit 101 extracts boundary conditions from the simulation conditions input in step 501. For example, when a specific numerical value that can be input to the simulator 102 is input as a simulation condition in step 501, the simulation condition generation unit 101 may extract the input numerical value as a boundary condition as it is. When a simulation condition including ambiguity is input in step 501, a specific numerical value is extracted from the simulation condition.
- the simulation condition generation unit 101 may extract only one boundary condition from one input simulation condition, but usually extracts a plurality of boundary conditions from one simulation condition. For example, when a specific numerical value that can be input to the simulator 102 is input as a simulation condition, the simulation condition generation unit 101 adds a plurality of numerical values obtained by changing the numerical value little by little in addition to the input numerical value. It may be extracted as a boundary condition. When a simulation condition including ambiguity is input, a plurality of numerical values included in the simulation condition (or close to the simulation condition) may be extracted as a plurality of boundary conditions.
- the simulation condition generating unit 101 selects the epicenter.
- a plurality of combinations of coordinate values of a plurality of points within the included range and a plurality of numerical values including a numerical value indicating the magnitude of the input earthquake may be extracted as a plurality of boundary conditions.
- the simulation condition generation unit 101 includes a plurality of simulation condition generation units 101 within the range (or within a predetermined range including the range).
- the simulation condition generation unit 101 identifies the center of the input simulation condition, and sets the extracted boundary condition to a weight that becomes smaller as the distance from the center of the simulation condition becomes smaller. It may be given.
- the simulation condition generation unit 101 may extract a boundary condition according to the probability. For example, when the probability distribution of the epicenter and the probability distribution of the numerical value indicating the magnitude of the earthquake are input, the simulation condition generation unit 101 calculates the coordinates of the epicenter and the numerical value indicating the magnitude of the earthquake according to the probability distribution. A plurality of combinations may be extracted as a plurality of boundary conditions. At this time, the simulation condition generation unit 101 may assign a weight according to the probability distribution (for example, a weight that decreases as the distance from the center of the distribution decreases) to the extracted boundary condition.
- a weight according to the probability distribution for example, a weight that decreases as the distance from the center of the distribution decreases
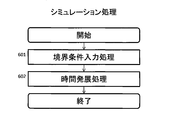
- FIG. 6 is a flowchart of a simulation process executed by the physical quantity estimation system 100 according to the first embodiment of this invention. This process is executed by the simulator 102 in step 402 of FIG.
- the simulator 102 executes boundary condition input processing (step 601). Specifically, the simulator 102 inputs the boundary condition extracted in step 502.
- the simulator 102 executes time development processing (step 602). Specifically, the simulator 102 calculates a physical quantity at each point at each time by executing a simulation based on the boundary condition input in step 601.
- step 502 When a plurality of boundary conditions are extracted in step 502, the simulator 102 executes step 601 and step 602 for each boundary condition.
- step 501 when a method for generating simulation conditions for another simulator is defined based on the simulation result, after the completion of step 602, the simulation condition generation unit 101 uses the result to execute the step. 502 is executed, and the simulator 102 executes Step 601 and Step 602 again using the boundary condition obtained thereby.
- FIG. 7 is an explanatory diagram of an inundation simulation that is an example of a simulation process executed by the physical quantity estimation system 100 according to the first embodiment of this invention.
- a simulation target space that is, an area where river flooding occurs
- a simulation target space that is, an area where river flooding occurs
- a simulation target space that is, an area where river flooding occurs
- each grid is a square with a side length of d.
- the flood simulation processing result 710 includes a grid ID 711, a time 712, a water depth 713, and a flow velocity 714.
- Grid ID 711 is an identifier of each grid and corresponds to the coordinates of each grid.
- the inundation depth and water flow speed (specifically, for example, the x-direction component and the y-direction component of the flow velocity) of the grid identified by the grid ID 711 at the time indicated by the time 712 are calculated as the water depth 713 and the flow velocity 714, respectively. .
- Such a processing result 710 and the boundary condition of the corresponding simulation may be stored as a scenario in the scenario DB 104.
- the scenario management unit 103 calculates a desired scenario based on the processing result 710, and the scenario is stored in the scenario DB 104. (See FIG. 8 and the like).
- the water depth and flow velocity are calculated as physical quantities as described above, but in other simulations, other physical quantities (for example, the magnitude of shaking of each grid at each time in the earthquake simulator) are calculated, and simulation processing is performed. As a result.
- the “point” and “position” described in the present embodiment may be a point specified by coordinates such as latitude and longitude and its position, but are specified by a grid ID as shown in FIG. It may be a grid (that is, a range of a predetermined size) and its position, or may be a feature and its position specified by a feature ID (see FIG. 11B) described later.
- FIG. 8 is a flowchart of scenario DB construction processing executed by the physical quantity estimation system 100 according to the first embodiment of this invention. This process is executed by the scenario management unit 103 in step 403 of FIG.
- the scenario management unit 103 executes a simulation result receiving process (step 801).
- the result of the simulation process (for example, the process result 710 shown in FIG. 7) is accepted.
- the scenario management unit 103 executes scenario calculation processing (step 802). Then, the scenario management unit 103 executes DB storage processing in order to store the calculated scenario in the scenario DB 104 (step 803).
- FIGS. 9A to 9C An example of the scenario calculated in step 802 and stored in step 803 will be described with reference to FIGS. 9A to 9C.
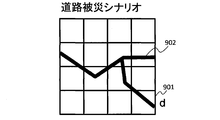
- a road disaster scenario constructed based on the processing result 710 in FIG. 7 will be described.
- FIG. 9A is an explanatory diagram of a scenario created by the physical quantity estimation system 100 according to the first embodiment of this invention.
- the plurality of grids 901 shown in FIG. 9A are equivalent to the grid 701 shown in FIG.
- a road 902 that exists in the space to be simulated is further illustrated.
- the scenario management unit 103 calculates the water depth for each road 902 and each time by executing a scenario calculation process (step 802) using a simulation result.
- FIG. 9B is an explanatory diagram of the scenario management table 910 included in the scenario DB 104 according to the first embodiment of this invention.
- the scenario management table 910 includes a scenario ID 911 and flood condition data 912.
- the scenario ID 911 is identification information (ID) of each scenario.
- the inundation condition data 912 corresponds to the simulation conditions (or boundary conditions) of the simulation process that is the basis of the scenario. For example, inundation such as river embankment broke down or rainfall has become extremely large It is the data regarding the initial condition.
- the initial condition of the simulation that is the basis of the scenario is registered instead of the flood condition data 912.
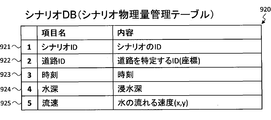
- FIG. 9C is an explanatory diagram of the scenario physical quantity management table 920 included in the scenario DB 104 according to the first embodiment of this invention.
- the scenario physical quantity management table 920 includes a scenario ID 921, a road ID 922, a time 923, a water depth 924, and a flow velocity 925.
- Scenario ID 921 is identification information of each scenario, and corresponds to scenario ID 911 in FIG. 9B.
- the road ID 922 is identification information of each road 902 in the simulation target space, and may include coordinate values of each road 902.
- the inundation depth and the water flow speed (specifically, for example, the x-direction component and the y-direction component of the flow velocity) of the road identified by the road ID 922 at the time indicated by the time 923 are stored as the water depth 924 and the flow velocity 925, respectively. .
- the scenario management unit 103 calculates information registered in the scenario physical quantity management table 920 based on the processing result 710 in FIG. 7 in step 802 in FIG. Specifically, such information is calculated as follows, for example.
- the physical quantity estimation system 100 holds map information (not shown) including at least information on the position of the road.
- the scenario management unit 103 identifies the correspondence between each grid 901 (that is, the grid 701 in FIG. 7) and each road 902 based on the map information, that is, in which grid each road 902 is located. Then, based on the identified water depth 713 and flow velocity 714 of the grid 901, the scenario management unit 103 calculates the water depth 924 and the flow velocity 925 of the road 902 corresponding to the grid.
- the scenario physical quantity management table 920 shown in FIG. 9C shows the water depth and flow velocity at one time for one road in one scenario.
- step 802 the water depth and flow velocity at each time of each road in the simulation target area are calculated for one scenario, and a plurality of scenario physical quantity management tables 920 including the respective values are stored in the scenario DB 104.
- the road ID 922 and the water depth 924 on the road identified by the road ID 922 are stored in the scenario physical quantity management table 920.
- the application system 140 uses information indicating whether or not each road is flooded in order to execute the guidance information generation process 303.
- Such processing of the application system 140 and the scenario physical quantity management table 920 suitable for the processing are examples, and the scenario management unit 103 can also generate the scenario physical quantity management table 920 suitable for other processes.
- the scenario physical quantity management table 920 may include a grid ID instead of the road ID 922.
- the scenario physical quantity management table 920 may include an arbitrary feature ID instead of the road ID 922. Good.
- FIG. 10 is a flowchart of scenario cluster generation processing executed by the physical quantity estimation system 100 according to the first embodiment of this invention. This process is executed by the scenario management unit 103 in step 404 of FIG.
- the scenario management unit 103 first executes a scenario feature amount calculation process (step 1001), and then performs clustering based on the obtained scenario feature amount (step 1002).
- the scenario feature quantity calculation process (step 1001) is a process for extracting a quantity (feature quantity) representing a scenario feature from the scenario data. By performing clustering based on the extracted feature amount, the amount of clustering calculation can be reduced.
- one scenario (that is, a scenario identified by one scenario ID) has a physical quantity at each time at each point (in the example of FIG. 9C, water depth and flow velocity at each time on each road). Including. That is, each scenario can be expressed by a multivariate vector including the physical quantity at each time at each point as an element.
- the scenario management unit 103 can reduce the number of dimensions of a vector representing a scenario by a known method such as principal component analysis or independent component analysis.
- the scenario management unit 103 may select a physical quantity at a specific point considered to have a large contribution to the clustering result as a feature quantity.
- the physical quantity for example, water depth
- the physical quantity at another certain point second point
- the scenario management unit 103 may calculate a feature amount that includes the physical quantity at the second point and does not include the physical quantity at the first point.
- the scenario management unit 103 executes the clustering of step 1002 without executing step 1001 (that is, by using the vector representing each scenario as a feature amount as it is). May be.
- Clustering can be performed by a known method such as a k-means method, a method based on a mixed Gaussian distribution, or hierarchical clustering using the feature amount extracted in step 1001.
- a known method such as a k-means method, a method based on a mixed Gaussian distribution, or hierarchical clustering using the feature amount extracted in step 1001.
- clustering a plurality of scenarios are classified into a plurality of scenario clusters so that each scenario cluster includes two or more scenarios that are relatively similar to each other.
- the scenario management unit 103 executes cluster statistic calculation processing (step 1003). Specifically, the scenario management unit 103 calculates statistics such as an average value, a variance value, and an expected value of physical quantities (for example, each time at each point) of scenarios included in each scenario cluster.
- the scenario management unit 103 executes an important spot extraction process (step 1004).
- the important spot is a point (or a combination of a point and a time) having a particularly large value variation in the scenario cluster.
- the feature quantities of these scenarios are relatively similar to each other. That is, the physical quantities at each point in time in these two or more scenarios are often similar to each other.
- the physical quantity at a specific point may vary greatly between scenarios in one cluster.
- the scenario management unit 103 extracts a point (or a combination of a point and a time) having a large variation in physical quantity as described above as an important spot.
- the breakpoints and inundation areas of the dike in the scenarios included in one scenario cluster are considered to be similar.
- the scenario cluster is not flooded at all, and at a relatively low altitude, it is flooded in all scenarios.
- some scenarios included in the scenario cluster are flooded and the remaining scenarios are not flooded.
- a large variation in physical quantity (for example, inundation depth) at a certain point in the cluster means that the physical quantity calculated at that point may vary greatly depending on slight differences in simulation conditions. This means that it is necessary to perform more accurate estimation than other points in order to accurately estimate the physical quantity of. For this reason, a point with a large variation in simulation results (a point at a moderate elevation in the above example) is extracted as an important spot that requires precise estimation.
- the scenario management unit 103 uses, as an important spot, a point and time at which an index (for example, a variance value) indicating a variation in a physical quantity of a scenario in a scenario cluster satisfies a predetermined condition (for example, exceeds a predetermined value). It may be extracted.
- an index for example, a variance value
- a predetermined condition for example, exceeds a predetermined value.
- the physical quantity variation at a certain point may be large regardless of the time, but the physical quantity at a specific point only at a specific time may be large. In the latter case, the specific point and the specific point Are combined as important spots.
- a case where a combination of a point and a time is extracted as an important spot will be described as an example. However, when only a point is extracted (in other words, a combination of a certain point and a range of all times is extracted as an important spot) The following explanation can also be applied to.
- the scenario management unit 103 stores the result of the scenario cluster generation processing in the scenario DB 104.
- FIG. 11A is an explanatory diagram of the scenario clustering table 1100 included in the scenario DB 104 according to the first embodiment of this invention.
- the scenario clustering table 1100 includes a scenario ID 1101 and a scenario cluster ID 1102.
- the scenario ID 1101 is identification information for each scenario, and corresponds to the scenario ID 911 in FIG. 9B.
- the scenario cluster ID 1102 is identification information of a scenario cluster to which each scenario belongs, and this corresponds to the result of clustering (step 1002).
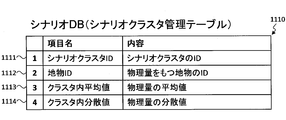
- FIG. 11B is an explanatory diagram of the scenario cluster management table 1110 included in the scenario DB 104 according to the first embodiment of this invention.
- the scenario cluster management table 1110 includes a scenario cluster ID 1111, a feature ID 1112, an in-cluster average value 1113, and an in-cluster variance value 1114.
- Scenario cluster ID 1111 is identification information of each scenario cluster, and corresponds to scenario cluster ID 1102 in FIG. 11A.
- the feature ID 1112 is feature identification information associated with a physical quantity in a scenario belonging to each scenario cluster. For example, when a physical quantity such as water depth is associated with a road as in the example of FIG. 9C, the feature ID 1112 is a road ID. In addition, when a physical quantity is associated with a grid in the scenario (see, for example, FIG. 7), the feature ID 1112 is a grid ID. Alternatively, the feature ID 1112 may be building identification information or the like.
- the intra-cluster average value 1113 and the intra-cluster variance value 1114 are an average value and a variance value of physical quantities associated with each feature of the scenario belonging to each scenario cluster. These are values calculated by the cluster statistic calculation process (step 1003).
- FIG. 11B illustrates a typical form of the scenario cluster management table 1110. Actually, for example, there may be various variations as shown in FIG. 11C.
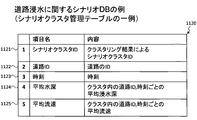
- FIG. 11C is an explanatory diagram of a specific example of the scenario cluster management table 1110 included in the scenario DB 104 according to the first embodiment of this invention.
- the scenario cluster management table 1120 shown in FIG. 11C is a specific example of the scenario cluster management table 1110 related to the scenario cluster obtained by clustering the scenarios shown in FIGS. 9A to 9C.
- the scenario cluster ID table 1121, the road ID 1122, and the time 1123 Mean water depth 1124 and mean flow velocity 1125.
- Scenario cluster ID 1121 is identification information of each scenario cluster, and corresponds to scenario cluster ID 1111 in FIG. 11B.
- the road ID 1122 is identification information of each road 902 and corresponds to the feature ID 1112 in FIG. 11B.
- Time 1123 is the time associated with the physical quantity included in each scenario, and corresponds to time 923 in FIG. 9C.
- the average water depth 1124 and the average flow velocity 1125 are average values in the scenario cluster of the water depth and flow velocity associated with each road 902 and correspond to the intra-cluster average value 1113 in FIG. 11B. These values are calculated from the water depth 924 and the flow velocity 925 in FIG. 9C.
- the scenario cluster management table 1120 may further include dispersion values of water depth and flow velocity.
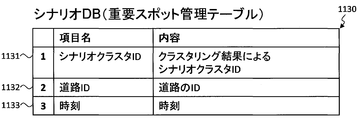
- FIG. 11D is an explanatory diagram of the important spot management table 1130 included in the scenario DB 104 according to the first embodiment of this invention.
- the important spot management table 1130 includes a scenario cluster ID 1131, a road ID 1132, and a time 1133.
- Scenario cluster ID 1131 is identification information of each scenario cluster, and corresponds to scenario cluster ID 1102 in FIG. 11A.
- the road ID 1132 and the time 1133 are information for identifying a set of points and times extracted as important spots. For example, when a variance value in a scenario cluster of a physical quantity at a certain time (for example, water depth or flow velocity) on a certain road is larger than a predetermined value, the set of the road and time is extracted as an important spot. When a plurality of important spots are extracted, a plurality of sets of road IDs and times for identifying the plurality of important spots are registered in the important spot management table 1130.
- FIG. 12 is a flowchart of the scenario synthesis process executed by the physical quantity estimation system 100 according to the first embodiment of this invention. This process is executed in step 302 of FIG. 3B.
- the input receiving unit 105 of the physical quantity estimation system 100 executes an actual physical quantity input process (step 1201). Details of the actual physical quantity input processing will be described later with reference to FIG.
- the scenario composition unit 106 of the physical quantity estimation system 100 executes scenario composition processing (step 1202). Details of the scenario synthesis process in step 1202 will be described later with reference to FIG.
- the combined scenario is stored in the combined scenario DB 107.
- the application system 140 executes guidance information generation processing (step 1203). Details of the guidance information generation process will be described later with reference to FIG.
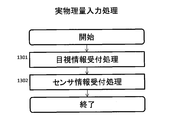
- FIG. 13 is a flowchart of actual physical quantity input processing executed by the physical quantity estimation system 100 according to the first embodiment of this invention. This process is executed in step 1201 of FIG.
- the input reception unit 105 executes visual information reception processing (step 1301) and sensor information reception processing (step 1302).
- the input receiving unit 105 may execute either step 1301 or 1302 first.
- the visual information receiving process is a process in which the input receiving unit 105 receives data input by the user or the like via the current status input system 130 via the network 150B and the I / F 205.
- An example of input data is shown in FIG. 14A.
- the sensor information reception process is a process in which the input reception unit 105 receives data transmitted from the sensor 120 via the network 150B and the I / F 205.
- An example of data transmitted from the sensor 120 is shown in FIG. 14B.
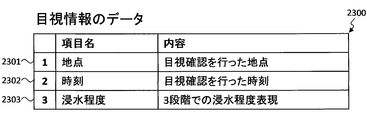
- FIG. 14A is an explanatory diagram of data that the physical quantity estimation system 100 according to the first embodiment of this invention accepts from the current status input system 130.
- the visual information data 1400 received by the input receiving unit 105 of the physical quantity estimation system 100 from the current status input system 130 includes, for example, a point 1401, a time 1402, and a flooding degree 1403.
- the point 1401 is a point where a user or the like has observed a physical quantity by visual observation (or experience), and may be a coordinate value or the like, but may be information such as a town name and an address. When a town name and an address are input, the physical quantity estimation system 100 can convert it into coordinate values (or coordinate value ranges) with reference to map information (not shown).
- Time 1402 is the time when the physical quantity is observed by the user or the like visually (or experience).
- the inundation degree 1403 is information indicating the degree of inundation (that is, the inundation depth) due to river flooding or the like observed by a user or the like by visual observation (or experience).
- the inundation degree 1403 may be a specific numerical value such as “50 centimeters”, for example. However, since the accuracy of visual observation by a user or the like is considered to be low, for example, “no submersion”, “underfloor inundation” or It may be information indicating any one of the three stages of “flooding on the floor”.
- the above data 1400 is an example, and the input receiving unit 105 relates to an arbitrary physical quantity that is observed by visual observation (or experience) of a user or the like and transmitted from the current status input system 130, such as information indicating the degree of earthquake shaking. Can accept data.
- the visual information data 1400 may include the seismic intensity experienced by the user or the like instead of the degree of flooding 1403.
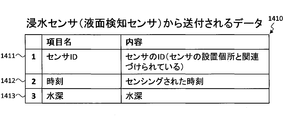
- FIG. 14B is an explanatory diagram of data received from the sensor 120 by the physical quantity estimation system 100 according to the first embodiment of this invention.
- FIG. 14B shows data 1410 sent from a water immersion sensor (that is, a liquid level detection sensor) as an example of data received from the sensor 120 by the input receiving unit 105 of the physical quantity estimation system 100.
- the data 1410 includes a sensor ID 1411, a time 1412, and a water depth 1413.
- the sensor ID 1411 is identification information of the sensor 120 that transmitted the data 1410. Since the physical quantity estimation system 100 holds information (coordinate values and the like) for specifying the position where each sensor 120 is installed, it is possible to specify a point where sensing has been performed based on the sensor ID 1411.
- Time 1412 is the time when sensing by the sensor 120 was performed.
- the water depth 1413 is a water depth sensed by the sensor 120.
- the above-mentioned data 1410 is an example, and the input receiving unit 105 can receive data related to an arbitrary physical quantity transmitted from the sensor 120 such as a seismic intensity. For example, if seismic intensity is transmitted, data 1410 includes seismic intensity instead of water depth 1413.
- FIG. 15 is a flowchart of the scenario synthesis process executed by the physical quantity estimation system 100 according to the first embodiment of this invention. This process is executed in step 1202 of FIG.
- the scenario composition unit 106 of the physical quantity estimation system 100 executes a current scenario feature quantity calculation process (step 1501). Specifically, the scenario composition unit 106 calculates the feature quantity of the physical quantity (that is, the physical quantity actually measured by the sensor 120 and the physical quantity entered by the user or the like) input in the actual physical quantity input process (step 1201). .
- the scenario composition unit 106 may perform the same process as step 1001 in FIG. 10 for the physical quantity input in the actual physical quantity input process.
- the scenario composition unit 106 executes scenario cluster determination processing (step 1502). Specifically, the scenario composition unit 106 calculates the similarity between the feature quantity extracted in step 1501 and the scenario cluster feature quantity stored in the scenario DB 104, and selects the scenario cluster with the highest similarity. .
- the feature value of the scenario cluster is obtained by averaging the representative values of the feature values of the scenario included in the scenario cluster, for example, each element of the feature value extracted in step 1001 of FIG. 10 within the scenario cluster. It may be a vector including values as elements.
- the scenario composition unit 106 calculates the feature quantity of the scenario cluster based on the physical quantity of each scenario at the point and time corresponding to the point and time at which the physical quantity input in the actual physical quantity input process (step 1201) is observed. In step 1502, the similarity between the scenario cluster feature quantity and the current scenario feature quantity may be calculated.
- both the feature quantity extracted in step 1501 and the scenario cluster feature quantity are vectors, the closeness of the distance between these vectors can be treated as a high degree of similarity.
- a definition of distance known in the field of multivariate analysis such as Mahalanobis distance may be used.
- the scenario composition unit 106 executes an important spot information estimation process (step 1503).
- This process is a process of estimating the physical quantity of the important spot based on the physical quantities of all scenarios included in the cluster selected in Step 1502 and the physical quantities input in the actual physical quantity input process (Step 1201).
- the scenario composition unit 106 inputs the physical quantities of the important spots of all scenarios included in the scenario cluster selected in step 1502 in step 1201 corresponding to the physical quantities, the location and time of the important spot.
- the expected value of the physical quantity at the important spot is calculated by performing a weighting operation (specifically, for example, a weighted average) based on the similarity between the physical quantity and the physical quantity.
- the similarity may be the reciprocal of the distance (difference) between the physical quantity of the scenario at the important spot and the physical quantity input in Step 1201 corresponding thereto.
- the distance between the physical quantity of an important spot in a certain scenario (referred to as scenario A here) and the physical quantity input in step 1201 is the distance between the physical quantity of the important spot in all scenarios and the physical quantity input in step 1201.
- the value divided by the total value may be calculated as the weight of the physical quantity of the important spot in scenario A.
- the scenario composition unit 106 calculates the same weight for the physical quantity of the important spot of all scenarios in the scenario cluster, and calculates the average value of the physical quantity weighted thereby as the expected value of the physical quantity of the important spot of the scenario cluster. be able to.
- the scenario composition unit 106 executes physical quantity estimation processing (step 1504). Specifically, the scenario composition unit 106, for points and times other than the important spots (hereinafter also referred to as non-important spots), the representative value of the selected scenario cluster at each point and time, Estimated as physical quantities at points and times, and for important spots, the expected value calculated by the weighting calculation in step 1503 is estimated as physical quantities at the points and times of the important spots, and a scenario including those estimated physical quantities is newly created. To generate.
- the scenario generated in this way is described as a combined scenario because it includes a physical quantity obtained by combining a plurality of scenarios by weighting calculation or the like as described above.
- the scenario composition unit 106 stores the generated composition scenario in the composition scenario DB 107.
- the representative value of the selected scenario cluster at a point and time other than the important spot is a value representative of physical quantities of a plurality of scenarios included in the selected scenario cluster at that point and time.
- it may be any one physical quantity among the plurality of scenarios, or may be a statistical quantity of physical quantities of the plurality of scenarios.
- the representative value may be an average value of physical quantities of all scenarios in the selected scenario cluster, or similar to the feature quantity extracted in step 1501 among all scenarios in the selected scenario cluster.
- the physical quantity of the scenario with the highest degree may be used, or the physical quantities of a plurality of scenarios whose similarity to the feature quantity extracted in step 1501 is a predetermined value or more among all scenarios in the selected scenario cluster. It may be an average value. Moreover, you may use values other than an average value (for example, median value etc.) as a statistic.
- the average value of physical quantities of all scenarios in the selected scenario cluster can be paraphrased as a result of performing weighted averaging by assigning the same weight to the physical quantities of all scenarios in the scenario cluster.
- the physical quantity of the scenario having the highest degree of similarity with the feature quantity extracted in step 1501 means that the physical quantity of the scenario having the highest degree of similarity with the feature quantity extracted in step 1501 is given a weight other than 0, and other physical quantities In other words, it can be paraphrased as a result of weighting averaging with 0 weighted.
- the average value of the physical quantities of a plurality of scenarios whose similarity to the feature quantity extracted in step 1501 is a predetermined value or more is a plurality of scenarios whose similarity to the feature quantity extracted in step 1501 is a predetermined value or more.
- it can be paraphrased as a result of performing weighted averaging by assigning the same physical weight other than 0 to the physical quantity and assigning 0 weight to the other physical quantities.
- the estimation of the physical quantity in the non-important spot can also be obtained by the weighting calculation, but the method of determining the weight value is different from that in the important spot.
- the scenario composition unit 106 may perform time decimation or scenario decimation in order to further reduce the amount of calculation for estimating a physical quantity at an unimportant spot.
- the scenario composition unit 106 calculates representative values at some times (for example, some times thinned out at predetermined intervals).
- the physical quantities calculated at other times are estimated by complementing the calculated representative values.
- the scenario synthesis unit 106 selects a part of a plurality of scenarios included in the scenario cluster regardless of the similarity as described above, and averages the physical quantities in the unimportant spots of the selected scenario.
- the value may be calculated as a representative value. Time decimation and scenario decimation may be combined.
- the estimation result is large no matter which scenario physical quantity is selected as the representative value or the average value is calculated as the representative value. does not change.
- the physical quantity in the important spot varies greatly within the scenario cluster, and therefore the physical quantity is estimated by weighted averaging based on the physical quantity input in step 1201 (that is, the physical quantity actually measured in real time). This makes it possible to perform highly accurate physical quantity estimation that matches the actually measured physical quantity.
- FIG. 16 is an explanatory diagram of a concept of scenario synthesis processing executed by the physical quantity estimation system 100 according to the first embodiment of this invention.
- the scenario composition unit 106 calculates the physical quantity feature quantities acquired from these sensors 1602 as the current scenario feature quantities (step 1501).
- the scenario composition unit 106 selects a scenario cluster having a feature quantity having the highest similarity with the current scenario feature quantity (step 1502).
- the scenario composition unit 106 calculates an expected value by a weighted average of the physical quantities of all scenarios 1610 in the selected scenario cluster based on the physical quantities acquired from the sensor 1602 ( Step 1503).
- the scenario composition unit 106 selects the physical quantity of the scenario most similar to the current scenario (or the average value without weighting of the physical quantities of all scenarios 1610 in the selected scenario cluster). As the expected value of the physical quantity.
- the scenario synthesis unit 106 generates a synthesis scenario 1620 by synthesizing the expected values (that is, estimated physical quantities) of the physical quantities of the important spot and other points and times, and stores them in the synthesis scenario DB 107. (Step 1504).
- the scenario distribution unit 108 of the physical quantity estimation system 100 sends the synthesis scenario (for example, the above synthesis scenario 1620) stored in the synthesis scenario DB 107 to the application system 140 as necessary (for example, in response to a request from the application system 140). To deliver.
- the synthesis scenario for example, the above synthesis scenario 1620
- the application system 140 as necessary (for example, in response to a request from the application system 140).
- FIG. 17 is a flowchart of guidance information generation processing executed by the application system 140 according to the first embodiment of this invention.
- FIG. 17 shows an application that guides a user for evacuation or the like when a river or the like is flooded (or is expected to be flooded in the future) as an example of an application provided by the application system 140.
- the application system 140 has the same road network data (not shown) as that of a known navigation system and the like, and a route search function based thereon.
- the application system 140 executes a route cost calculation process (step 1701).
- the application system 140 refers to the combined scenario (for example, the combined scenario 1620 in FIG. 16) distributed from the scenario distribution unit 108. Since the synthesis scenario 1620 illustrated in FIG. 16 includes the result of the flood simulation, the inundation depth value of each road is included as the estimated physical quantity. Therefore, for example, the application system 140 determines that a road whose inundation depth value is greater than 0 (or greater than a predetermined value) as an inaccessible road and prevents the road from being selected by the route search. Change network data.
- the application system 140 may set information prohibiting traffic, such as traffic closure, on a road determined to be impassable.
- the application system 140 may change the cost of a road that has been determined to be inaccessible to a value that is sufficiently large so that the road is not selected as a route search result.
- the application system 140 refers to the road network data changed as described above, and calculates the cost of a route from the current location of the user to a predetermined evacuation site, for example.
- the application system 140 executes route search processing based on the route cost calculated in step 1701, and outputs the result (step 1702). For example, the application system 140 may transmit the result of the route search process to the mobile terminal 304 held by the user via the network 150D.
- the guidance information generation process as described above is an example, and the application system 140 can execute various processes by using the synthesis scenario.
- the physical quantity estimation system 100 executes a simulation for estimating a physical quantity based on various conditions, and holds a combination of each simulation condition and a simulation result based on the simulation as a scenario. Then, a large number of scenarios obtained in this way are clustered, and points and times with large variations in physical quantities in each cluster are specified as important spots. Then, when the physical quantity estimation system 100 acquires real-time data including a physical quantity observed by a sensor or the like, the physical quantity estimation system 100 identifies a cluster similar to the feature quantity of the acquired real-time data, and based on the real-time data, the physical quantity at an important spot of the cluster.
- a combined scenario is generated that includes the estimated physical quantity at the important spot and a representative value (for example, an average value) of the physical quantity of the cluster at a point and time other than the important spot.
- the physical quantity included in this synthesis scenario is the estimated physical quantity at each point at each time in the present and future based on the physical quantity acquired from the sensor 120 or the like up to now.
- the physical quantity estimation system 100 can only execute cluster identification and physical spot estimation at important spots without using real-time data acquired from the sensor 120 or the like. Can be executed before real-time data is acquired. As a result, the amount of calculation to be executed after acquisition of real-time data can be reduced, so that a physical quantity can be estimated at high speed and evacuation information or the like can be provided quickly based on the physical quantity. In addition, for an important spot with a large variation in physical quantity in the cluster, a more likely estimation result can be obtained by performing estimation based on the physical quantity acquired from the sensor 120 or the like.
- FIG. 18 is a functional block diagram showing the configuration of the computer system according to the second embodiment of this invention.
- the computer system includes a physical quantity estimation system 1800, a simulator 1810, a scenario example input system 110, a sensor 120, a current status input system 130, and an application system 140.
- the simulator 1810 is via the network 150E
- the scenario example input system 110 is via the network 150A
- the sensor 120 and the current status input system 130 are via the network 150B
- the application system 140 is via the network 150C. Connected to.
- configurations other than the physical quantity estimation system 1800, the simulator 1810, and the network 150E have the same functions as the configurations denoted by the same reference numerals in FIG.
- the physical quantity estimation system 1800 is the same as the physical quantity estimation system 100 of the first embodiment except that the physical quantity estimation system 1800 does not have the simulator 102 but has a simulator communication unit 1801 and a simulator list 1802. Since the configuration of the physical quantity estimation system 1800 other than that described above has the same function as the configuration denoted by the same reference numeral in FIG.
- the simulator communication unit 1801 has a function of executing communication with the simulator 1810. Details thereof will be described later with reference to FIG.
- the simulator list 1802 includes information for specifying a simulator that executes a desired simulation.
- the simulator list 1802 may be, for example, a list of information (for example, the address of the simulator 1810) that identifies the simulator 1810 that can execute the simulation based on the boundary condition generated by the simulation condition generation unit. .
- the simulator 1810 has the same function as the simulator 102 of the first embodiment. However, although the simulator 102 of the first embodiment is realized by the processor 201 of the physical quantity estimation system 100 executing a program stored in the storage device 206 of the physical quantity estimation system 100, the simulator 1810 of the present embodiment is It is realized by a computer other than the physical quantity estimation system 100.
- the computer system of the present embodiment may include a plurality of simulators 1810 that execute different types of simulations.
- the network 150E may be anything as long as it enables communication between the simulator 1810 and the physical quantity estimation system 1800.
- the network 150E may be the same type as any of the networks 150A, 150B, and 150C. 1 shows three networks 150A, 150B, 150C, and 150E, these may be realized by one network. In the following description, when the network 150 is referred to, it is one of the networks 150A, 150B, 150C, and 150E, or one network that realizes the networks 150A, 150B, 150C, and 150E.
- the hardware configuration of the physical quantity estimation system 1800 is the same as that of the physical quantity estimation system 100 of the first embodiment shown in FIG.
- the storage device 206 of the physical quantity estimation system 1800 does not store the simulator 102 but stores a program for realizing the simulator communication unit 1801 and a simulator list 1802.
- the processing executed by the simulator communication unit 1801 is actually executed by the processor 201.
- the physical quantity estimation system 1800 executes pre-processing (FIG. 19A) and real-time processing (FIG. 19B). These processes are executed for the same purpose as the pre-process (FIG. 3A) and the real-time process (FIG. 3B) of the first embodiment.
- FIG. 19A is a flowchart of pre-processing executed by the physical quantity estimation system 1800 according to the second embodiment of this invention.
- the physical quantity estimation system 1800 executes scenario DB construction processing (step 1901). As a result, the scenario DB 104 is constructed. Details of the scenario DB construction process will be described later with reference to FIG.
- FIG. 19B is a flowchart of real-time processing executed by the physical quantity estimation system 1800 according to the second embodiment of this invention.
- the physical quantity estimation system 1800 executes scenario synthesis processing with reference to the scenario DB 104 (step 1902), and stores the result in the synthesis scenario DB 107.
- the scenario composition process of this embodiment is the same as that of the first embodiment.
- the application system 140 can execute various applications with reference to the synthesis scenario DB 107.
- the application system 140 may execute damage estimation display processing with reference to the combined scenario DB 107 (step 1903), and transmit the generated guidance information to the damage status visualization terminal 1904 via the network 150F. Details of the damage estimation display processing will be described later with reference to FIG.
- the damage status visualization terminal 1904 is a terminal device such as a personal computer possessed by the user of the application system 140.
- the network 150F may be any network as long as it enables communication between the application system 140 and the mobile terminal 304.
- FIG. 20 is a flowchart of scenario DB construction processing executed by the physical quantity estimation system 1800 according to the second embodiment of this invention. This process is executed in step 1901 of FIG. 19A.
- the simulation condition generation unit 101 executes a simulation condition generation process (step 401). Since this processing is the same as that executed by the simulation condition generation unit 101 of the first embodiment (see FIG. 5), description thereof is omitted here.
- the simulator communication unit 1801 executes necessary simulator selection processing (step 2001) and simulation execution request processing (step 2002).
- the necessary simulator selection process is a process for selecting the simulator 1810 for executing the simulation based on the boundary condition generated in step 401.
- the simulator communication unit 1801 refers to the simulator list 1802 and selects a simulator 1810 that matches the generated boundary condition.
- the simulation execution request process (step 2002) is a process for requesting the selected simulator 1810 to execute the simulation process.
- the simulator communication unit 1801 transmits a simulation processing execution request including the boundary condition generated in step 401 to the simulator 1810 selected in step 2001 and receives the simulation processing result from the simulator 1810.
- the simulator 1810 executes a simulation process according to the boundary condition generated in step 401 and transmitted from the simulator communication unit 1801 (step 402). Similar to the simulator 102 of the first embodiment, the simulator 1810 of this embodiment can execute various simulations. Therefore, the simulator communication unit 1801 may receive a simulation processing result as shown in FIG. 7, but in this embodiment, another simulation processing result (specifically, a tsunami simulator that is one of the simulators 1810). An example of the result of the tsunami simulation process will be described later (see FIG. 21).
- the scenario management unit 103 constructs the scenario DB 104 using the simulation result obtained in step 402 (step 403). Further, the scenario management unit 103 refers to the scenario stored in the scenario DB 104, generates a scenario cluster, and stores the result in the scenario DB 104 (step 404). Since these processes are the same as those executed by the scenario management unit 103 of the first embodiment (see FIGS. 8 and 10), description thereof is omitted here. Accordingly, scenarios such as those shown in FIGS. 9B, 9C, and 11A to 11D may be stored in the scenario DB by these processes. In this embodiment, another scenario example will be described later (FIGS. 22A to 22C). (See FIG. 22D).
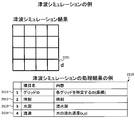
- FIG. 21 is an explanatory diagram of a tsunami simulation that is an example of a simulation process executed by the simulator 1810 according to the second embodiment of this invention.
- the grid 2101 shown in FIG. 21 is the same as the grid 701 shown in FIG.
- the grid ID 2111, time 2112, water depth 2113, and flow velocity 2114 included in the tsunami simulation processing result 2110 in FIG. 21 are the grid ID 711, time 712, water depth 713, and flow velocity 714 included in the flood simulation processing result 710 in FIG. It is the same. For this reason, description about these is abbreviate
- the water depth 2113 and the flow velocity 2114 in FIG. 21 are not due to flooding of rivers or the like, but are the inundation depth due to the tsunami and the water flow speed.
- scenario DB construction processing step 403 and scenario cluster generation processing (step 404) executed by the scenario management unit 103 of this embodiment is the same as that executed by the scenario management unit 103 of the first embodiment. is there. Details of the scenario DB construction process (step 403) and the scenario cluster generation process (step 404) are as shown in FIGS. 8 and 10, respectively.
- the physical quantity estimation system 1800 of this embodiment constructs a scenario DB 104 similar to that shown in FIGS. 9A to 9C, generates scenario clusters similar to those shown in FIGS. 11A to 11D, and extracts important spots. You can also However, in this embodiment, as an example different from the road damage scenario of the first embodiment, an earthquake tsunami scenario constructed based on the processing result 2110 of FIG. 21 will be described with reference to FIGS. 22A to 22D. explain.
- FIG. 22A is an explanatory diagram of a scenario created by the physical quantity estimation system 1800 according to the second embodiment of this invention.
- a plurality of grids 2201 shown in FIG. 22A are equivalent to the grid 2101 shown in FIG.
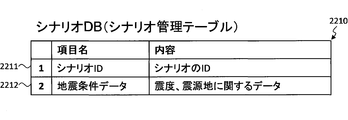
- FIG. 22B is an explanatory diagram of the scenario management table 2210 included in the scenario DB 104 according to the second embodiment of this invention.
- the scenario management table 2210 includes a scenario ID 2211 and earthquake condition data 2212.
- the scenario ID 2211 is identification information (ID) of each scenario.
- the earthquake condition data 2212 corresponds to the simulation conditions (or boundary conditions) of the simulation process that is the basis for constructing the scenario. For example, the initial stage of the earthquake (and the resulting tsunami) such as the epicenter and the magnitude of the earthquake. It is data about conditions. In the case of a scenario based on a simulation other than a tsunami simulation, the initial condition of the simulation that is the basis of the scenario is registered instead of the earthquake condition data 2212.
- FIG. 22C is an explanatory diagram of the water depth management table 2220 included in the scenario DB 104 according to the second embodiment of this invention.
- the water depth management table 2220 includes a scenario ID 2221, a grid ID 2222, a time 2223, a water depth 2224, and a flow velocity 2225.
- Scenario ID 2221 is identification information of each scenario, and corresponds to scenario ID 2211 in FIG. 22B.
- Grid ID 2222 is identification information of each grid 2201 in the simulation target space, and corresponds to the grid ID 2111 in FIG.
- the inundation depth and the water flow speed (specifically, for example, the x-direction component and the y-direction component of the flow velocity) of the grid identified by the grid ID 2222 at the time indicated by the time 2223 are stored as the water depth 2224 and the flow velocity 2225, respectively. .
- step 403 of FIG. 20 (more specifically, step 802 of FIG. 8 included in step 403), the scenario management unit 103 stores information registered in the water depth management table 2220 based on the processing result 2110 of FIG. Calculate.
- the water depth management table 2220 shown in FIG. 22C shows the water depth and flow velocity at one time for one grid in one scenario.
- step 802 the water depth and flow velocity at each time of each grid in the simulation target area are calculated for one scenario, and a plurality of water depth management tables 2220 including the respective values are stored in the scenario DB 104.
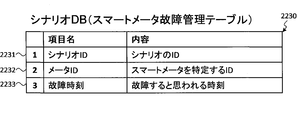
- FIG. 22D is an explanatory diagram of the smart meter failure management table 2230 included in the scenario DB 104 according to the second embodiment of this invention.
- the simulator communication unit 1801 of this embodiment may pass the simulation processing result acquired from one (or a plurality of) simulators 1810 to the simulation condition generation unit 101 as well as the scenario management unit 103.
- the simulation condition generation unit 101 includes the information, Based on the simulation processing result passed from the simulator communication unit 1801, a new boundary condition is generated and input to the simulator communication unit 1801.
- An example of information defining a method for generating another simulation condition based on the result of the simulation is the inundation depth of each point due to river inundation or tsunami, and a kind of sensor 120 installed at that point. This is a relationship with the failure occurrence probability of the meter. If the facility where the smart meter is installed is inundated, the smart meter will be damaged due to the power supply to the smart meter being stopped, the smart meter being submerged and the operation being stopped, or the smart meter being washed away. Increases the probability that will not be able to transmit data. In general, the probability of failure of the smart meter increases as the water immersion depth increases.
- the simulation condition generation unit 101 inputs the boundary condition generated based on the above relationship to the simulator communication unit 1801.
- the simulator communication unit 1801 transmits a simulation execution request including the input boundary condition to an appropriately selected simulator 1810 (for example, a power simulator), and receives a simulation processing result.
- the simulation processing result received in this way may include, for example, information on the time when a smart meter failure occurs at each point.
- FIG. 22D shows an example of a smart meter failure management table 2230 that is generated based on the simulation processing result as described above.
- the smart meter failure management table 2230 includes a scenario ID 2231, a meter ID 2232, and a failure time 2233.
- Scenario ID 2231 is identification information of each scenario, and corresponds to scenario ID 2211 in FIG. 22B.
- Meter ID 2232 is identification information of each smart meter.
- the failure time 2233 is a time when each smart meter is considered to be failed, and is a value obtained as a result of the simulation executed by the simulator 1810 based on the boundary condition generated by the simulation condition generation unit 101.
- the boundary condition input to the tsunami simulator For each scenario generated in this way, at least the boundary condition input to the tsunami simulator, the simulation result by the tsunami simulator based on the boundary condition, and the boundary condition generated based on the simulation result are input. It includes a set of simulation results by the power simulator, and may further include boundary conditions of the power simulator.
- the scenario management unit 103 of the present embodiment executes the scenario cluster generation process shown in FIG. 10 for the scenarios shown in FIGS. 22A to 22D.
- the scenario feature amount including the failure time 2233 in the smart meter failure management table 2230 is calculated (step 1001), clustering based on the feature amount is performed (step 1002), and the statistics of the generated scenario cluster are calculated. (Step 1003), an important spot of the scenario cluster is extracted (Step 1004).
- the procedure of the scenario synthesis process (step 1902) of this embodiment is the same as the scenario synthesis process (step 302) of the first embodiment. Therefore, the input receiving unit 105 and the scenario composition unit 106 of this embodiment sequentially execute the actual physical quantity input process (step 1201) and the scenario composition process (step 1202) shown in FIG. Details of the actual physical quantity input process and the scenario composition process are as shown in FIGS. 13 and 15, respectively. Accordingly, the physical quantity estimation system 1800 of the present embodiment can also execute the same processing as that illustrated in FIGS. 14A, 14B, and 16. However, in the present embodiment, an example of processing for synthesizing a scenario using data obtained from a smart meter will be described as an example different from the above. For this reason, as data input in step 1201 of the present embodiment, examples different from the first embodiment are shown in FIGS. 23A to 23C.
- FIG. 23A is an explanatory diagram of data that the physical quantity estimation system 1800 according to the second embodiment of this invention accepts from the current status input system 130.
- the visual information data 2300 received by the input receiving unit 105 of the physical quantity estimation system 1800 from the current status input system 130 includes, for example, a point 2301, a time 2302, and a flooding degree 2303.
- the visual information data 2300 is the same as the visual information data 1400 shown in FIG.
- FIG. 23B is an explanatory diagram of data received from the sensor 120 by the physical quantity estimation system 1800 according to the second embodiment of this invention.
- FIG. 23B shows data 2310 sent from the water immersion sensor (that is, the liquid level detection sensor) as an example of data received from the sensor 120 by the input receiving unit 105 of the physical quantity estimation system 1800.
- the data 2310 includes a sensor ID 2311, a time 2312, and a water depth 2313. This data 2310 is the same as the data 1410 sent from the inundation sensor shown in FIG.
- FIG. 23C is an explanatory diagram of data that the physical quantity estimation system 1800 according to the second embodiment of this invention accepts from another type of sensor 120.
- FIG. 23C shows data 2320 sent from the smart meter as an example of data received from the sensor 120 by the input receiving unit 105 of the physical quantity estimation system 1800.
- Data 2320 includes meter ID 2321, time 2322, and power consumption 2323.
- the meter ID 2321 is identification information of the sensor 120 (that is, the smart meter) that transmitted the data 2320. Since the physical quantity estimation system 1800 holds information (coordinate values and the like) for specifying the position where each smart meter is installed, it is possible to specify the point where sensing was performed based on the meter ID 2321.
- Time 2322 is the time when sensing by the smart meter was performed.
- the power consumption 2323 is a power consumption (for example, watts / hour) sensed by a smart meter (that is, a facility where the smart meter is installed).
- a smart meter that is, a facility where the smart meter is installed.
- the physical quantity estimation system 1800 may determine that the smart meter has failed when the time during which the data 2320 cannot be received from a certain smart meter exceeds a predetermined length.
- the scenario composition unit 106 calculates the current scenario feature amount including the determination result of the smart meter failure based on the data 2320 (step 1501), and the present scenario feature amount and the scenario cluster generated in step 1002 The scenario cluster most similar to the current scenario feature quantity is selected based on the feature quantity. Further, the scenario synthesis unit 106 executes important spot information estimation processing for the important spots of the selected scenario cluster by the same method as in the first embodiment (step 1503), and the result is selected in step 1502. A synthetic scenario including a representative value of the scenario cluster is generated (step 1504), and the generated synthetic scenario is stored in the synthetic scenario DB 107.
- FIG. 24 is a flowchart of damaged area information generation processing executed by the application system 140 according to the second embodiment of this invention.
- FIG. 24 shows an application displaying an area damaged by a tsunami (or an area expected to be damaged in the future) as an example of an application provided by the application system 140.
- the application system 140 executes a water depth visualization process (step 2401).
- the application system 140 refers to the inundation depth at each time point (grid) of the composite scenario distributed from the scenario distribution unit 108, and the inundation depth is output to the output device 204 (for example, the application system 140).
- This is a process of outputting from the image display device.
- the inundation depth may be displayed by a numerical value, or may be displayed by a symbol, a figure, a color, or the like on a map.
- the damaged area information generation process as described above is an example, and the application system 140 may execute various processes (for example, the guidance information generation process similar to the first embodiment) using the synthesis scenario. it can.
- the physical quantity estimation system 1800 does not include the simulator 102
- the physical quantity estimation similar to that of the first embodiment is performed using the external simulator 1810. It can be carried out.
- the physical quantity estimation system 1800 of the present embodiment can detect from the sensor 120 or the like (for example, a smart meter).
- the acquired real-time data can be used for estimation of physical quantities different from the original purpose (for example, estimation of inundation depth).
- the event may affect data acquired by a plurality of types of sensors 120 in the area.
- the water level meter titanium level meter
- the various sensors 120 are used for specific purposes, such as tsunami detection, power supply control or billing, and the data acquired by each sensor 120 is Beyond the original purpose of these sensors 120, they could not be used to estimate physical quantities related to events that occurred in the area where they were installed.
- a tsunami simulator that executes a tsunami simulation
- a smart meter a value measured by the smart meter
- a value measured by the smart meter are input as conditions.
- the measurement result of the smart meter could not be used for estimating the inundation depth by the tsunami simulation.
- real-time data acquired from the sensor 120 or the like can be used for estimation of a physical quantity different from the original purpose.
- the essential difference between the first embodiment and the second embodiment of the present invention is only whether or not the simulator is inside the physical quantity estimation system. For this reason, using the sensor for purposes other than the original purpose as described above can also be realized by the physical quantity estimation system 100 of the first embodiment.
- scenario clustering and important spot identification are performed.
- a mode in which clustering or the like is omitted may be considered.
- the physical quantity estimation system 100 (or 1800) does not perform clustering (in other words, It is also possible to estimate physical quantities (assuming all scenarios belong to one scenario cluster).
- the physical quantity estimation system 100 may execute identification of important spots, but without executing this, the scenario may be synthesized for all points and times by weighting calculation based on similarity. .
- Information such as a program, a table, and a file that realize each function of the above embodiment is a storage device such as a nonvolatile semiconductor memory, a hard disk drive, an SSD (Solid State Drive), or an IC card, an SD card, a DVD, or the like. It can be stored on a computer readable non-transitory data storage medium.
- a storage device such as a nonvolatile semiconductor memory, a hard disk drive, an SSD (Solid State Drive), or an IC card, an SD card, a DVD, or the like. It can be stored on a computer readable non-transitory data storage medium.
- the present invention is not limited to the above-described embodiment, and includes various modifications.
- the above-described embodiment has been described in detail for easy understanding of the present invention, and is not necessarily limited to one having all the configurations described.
- a part of the configuration of an embodiment can be replaced with the configuration of another embodiment, and the configuration of another embodiment can be added to the configuration of an embodiment.
Landscapes
- Engineering & Computer Science (AREA)
- Physics & Mathematics (AREA)
- Theoretical Computer Science (AREA)
- Computer Hardware Design (AREA)
- Evolutionary Computation (AREA)
- Geometry (AREA)
- General Engineering & Computer Science (AREA)
- General Physics & Mathematics (AREA)
- Management, Administration, Business Operations System, And Electronic Commerce (AREA)
- Alarm Systems (AREA)
Abstract
設置されているセンサから十分な量のデータを取得できない場合であっても、高速に、信頼性の高い物理量の推定を行うために、本発明は、シミュレーションの条件として入力された値と、前記入力された値に基づく所定のシミュレーションの結果として算出された、一つ以上の位置における物理量と、を含むシナリオを複数保持するシナリオ保持部と、計測された物理量及び前記物理量が計測された位置に基づく所定の計算によって前記複数のシナリオに含まれる物理量を合成することによって、前記一つ以上の位置における物理量を推定するシナリオ合成部と、前記推定された物理量を保持する合成シナリオ保持部と、を有する。
Description
本発明はシミュレーションを利用して物理量を推定する技術に関し、特に、複数種類のセンサによって取得された、位置情報及び時刻情報を伴う種々のデータを利用したシミュレーションによって任意の物理量を推定する技術に関する。
センサが実際に計測したデータを初期条件として与えられると、所定の計算を行うことによって、現在の(又は任意の時刻の)物理量を推定して出力する、リアルタイムシミュレーション技術が知られている。
例えば、特開2010-54460号公報(特許文献1)には、「第一推定値の気象予報値を観測値で修正した大気解析データに含まれる風向及び風速データを基にデータ補間してN時の波浪予報データを推算すると、これをN+α時の波浪予測のための初期条件値として波浪推算プログラムに設定し、N+α時の波浪を予測する。本処理は大気解析データが更新される所定時間間隔(α)ごとに繰り返し実行される。また、地球規模での気象変化を予測計算した全球気象予報データや局地気象データの風データを波浪推算プログラムに設定して波浪予測を行う。これにより、時間経過に伴う波浪状態の変化予報データに誤差拡大がない高精度な波浪予報データをあらゆる地点について迅速に算出することができる」と記載されている。
特許文献1:特開2010-54460号公報
防災又は商業利用等を目的として種々の物理量を計測し、計測した物理量を含むデータを提供するセンサが、人間の生活域(又はその周辺の地域)に設置される。その例をいくつか挙げるとすれば、地震計、雨量計、風速計、風向計、河川等の水位計、各家庭又は事業所の電力計、及び、道路に設置された交通量センサ等である。しかし、センサを設置・維持するコスト、災害によるセンサ自体又はセンサからのデータが経由する通信経路の障害、及び、当該通信経路における通信速度、等の種々の要因のため、目的に応じた十分な量のデータを得られないことが想定される。そこで、センサが実際に取得できない地点又は時刻における物理量を、シミュレーションによって推定することが考えられる。しかし、通常、そのようなシミュレーションの実行には多くの時間を要するため、実際にセンサから取得したリアルタイムデータを初期条件として使用したシミュレーションによって、現在の(又は未来の所望の時点における)所望の地点の物理量を推定することは難しい。
上記の課題を解決するために、本発明は、シミュレーションの条件として入力された値と、前記入力された値に基づく所定のシミュレーションの結果として算出された、一つ以上の位置における物理量と、を含むシナリオを複数保持するシナリオ保持部と、計測された物理量及び前記物理量が計測された位置に基づく所定の計算によって前記複数のシナリオに含まれる物理量を合成することによって、前記一つ以上の位置における物理量を推定するシナリオ合成部と、前記推定された物理量を保持する合成シナリオ保持部と、を有する。
本発明の一実施形態によれば、設置されているセンサから十分な量のデータを取得できない場合であっても、事前に実行されたシミュレーション結果を利用することによって、高速に、信頼性の高い物理量の推定を行うことができる。
以下、添付図面に基づいて、本発明の実施形態を説明する。
<第1の実施形態>
図1は、本発明の第1の実施形態の計算機システムの構成を示す機能ブロック図である。
図1は、本発明の第1の実施形態の計算機システムの構成を示す機能ブロック図である。
本実施形態の計算機システムは、物理量推定システム100、シナリオ例入力システム110、センサ120、現況入力システム130及びアプリケーションシステム140によって構成される。シナリオ例入力システム110はネットワーク150Aを介して、センサ120及び現況入力システム130はネットワーク150Bを介して、アプリケーションシステム140はネットワーク150Cを介して、それぞれ物理量推定システム100に接続される。
物理量推定システム100は、センサ120及び現況入力システム130から取得したデータに基づいて物理量を推定する計算機であり、シミュレーション条件生成部101、シミュレータ102、シナリオ管理部103、シナリオデータベース(DB)104、入力受付部105、シナリオ合成部106、合成シナリオDB107及びシナリオ配信部108を有する。これらの各部の詳細及び物理量推定システム100のハードウェア構成については後述する。
なお、本実施形態において、「シミュレータ」とは、物理的な条件が入力されると、演繹的に他の物理量を計算する機能を有するモジュールである。すなわち、一般的にシミュレータと呼ばれるものは本実施形態のシミュレータに該当するが、一般的にシミュレータと呼ばれないものであっても、上記の機能を有するものであれば本実施形態のシミュレータに該当する。本実施形態の物理量推定システム100は、種類の異なる複数のシミュレータ102(例えば、地震シミュレータ及び氾濫シミュレータ等)を有してもよい。
また、本実施形態において、「シナリオ」とは、実際に起こりうる物理的な現象の記録であり、その物理的な現象が発生する確率の情報を含んでもよい。具体的には、シナリオは、シミュレーションに入力される条件と、そのシミュレーションの結果(すなわち物理量)との集合である。例えば、震源地と地震の規模とがシミュレーションの条件として入力されると各地点の揺れの大きさを計算する地震シミュレータの場合、入力された震源地及び地震の規模と、計算された各時刻における各地点の揺れの大きさの値と、の集合が一つのシナリオである。あるいは、堤防の決壊地点とそこから流出する水量とがシミュレーションの条件として入力されると各地点の浸水深を計算する氾濫シミュレータの場合、入力された決壊地点及び水量と、計算された各時刻における各地点の浸水深の値と、の集合が一つのシナリオである。
シナリオ例入力システム110は、物理量推定システム100の開発者、管理者又はユーザ等(以下、単にユーザ等とも記載する)がシナリオ例を入力するために使用するものであり、ネットワーク150Aに接続された計算機によって実現される。例えば、シナリオ例入力システム110は、当該計算機上で動作するWebブラウザであってもよい。なお、ここで入力されるシナリオ例とは、例えば、複数のシミュレーションの間の関係を定義する情報であり、その詳細については後述する。
センサ120は、所定のタイミングで(例えば定期的に、又は物理量推定システム100等からの要求に応じて)物理量を計測し、計測した物理量を含むデータ(すなわち計測した物理量そのもの又はそれに基づいて計算された値)を、ネットワーク150Bを介して物理量推定システム100に送信する。本実施形態の図1には一つのセンサ120のみを図示しているが、実際には複数の種類の複数のセンサ120が各地点に設置される。各センサ120は、例えば、地震計、雨量計、河川に設置された水位計、各家庭又は事業所に設置された電力計(例えばいわゆるスマートメータ)、又は、道路に設置された交通量センサ等である。各センサ120から送信されるデータは、計測した物理量(例えば水位又は電力量等)に加えて、少なくともその物理量が計測された時刻の情報を含む。物理量推定システム100は、各センサが設置された位置の情報(座標値等)を保持している。
なお、センサ120は、所定の位置に固定的に設置されたものではなく、移動可能なものであってもよい。その場合には、センサ120から送信されるデータに、センサ120の位置情報も含まれる。移動可能なセンサの一例は、走行する自動車に設置され、所定のタイミングでその自動車の位置情報を送信する車載端末(いわゆるプローブカーに設置されるプローブ端末)であり、このような車載端末からの情報に基づいて道路の交通量を計測することができる。このような場合、物理量推定システム100は、センサ120から送信された位置情報を保持し、それに基づいてセンサ120の位置を特定する。
現況入力システム130は、物理量推定システム100のユーザ等が、物理量推定システム100による物理量の推定に利用される情報を入力するために使用するものであり、ネットワーク150Bに接続された計算機によって実現される。例えば、現況入力システム130は、当該計算機上で動作するWebブラウザであってもよい。例えば、地震が発生したときに、ユーザ等は、現況入力システム130を使用して、自身が体感した揺れの程度を示す情報を入力してもよい。現況入力システム130は、入力された情報を物理量推定システム100に送信する。
この場合、物理量推定システム100は、現況入力システム130から受信した情報を、複数のセンサ120のうち地震計から送信されたデータと同様に扱ってもよい。ただし、ユーザ等が体感震度を入力した場合、その精度は地震計の制度より低いと考えられる。ユーザ等が他の物理量を入力する場合の精度も、一般に、その物理量を計測するセンサの精度より低い。すなわち、物理量推定システム100は、現況入力システム130からの情報を、精度の低いセンサ120からの情報として扱うことができる。
現況入力システム130を用いることによって、センサ120では感知困難な物理量、又は、センサ120が設置されていない地点における物理量を人手によって入力することができる。
アプリケーションシステム140は、物理量推定システム100によって推定された物理量に基づく任意の処理を実行する。例えば、物理量推定システム100が任意の時刻における震度を推定した場合、アプリケーションシステム140は、その震度に基づく地震警報、津波警報又は避難情報等を送信してもよい。物理量推定システム100が任意の時刻における洪水による浸水深を推定した場合、アプリケーションシステム140は、浸水していない道路のみを経由する経路を探索してもよい。アプリケーションシステム140は、例えば、ネットワーク150Cに接続された計算機を含むシステムによって実現される。
ネットワーク150A、150B及び150Cは、それらに接続されたシステム間の通信を可能にするものであれば、どのようなものであってもよい。例えば、ネットワーク150A、150B及び150Cは、いわゆるインターネット又は電話網のような公衆ネットワークであってもよいし、物理量推定システム100のための専用ネットワークであってもよいし、それらの組み合わせであってもよい。また、図1には三つのネットワーク150A、150B及び150Cを示したが、これらが一つのネットワークによって実現されてもよい。以下の説明においてネットワーク150が参照された場合、それは、ネットワーク150A、150B及び150Cのいずれか、又は、ネットワーク150A、150B及び150Cを実現する一つのネットワークである。
図2は、本発明の第1の実施形態の物理量推定システム100のハードウェア構成を示すブロック図である。
本実施形態の物理量推定システム100は、相互に接続されたプロセッサ201、メインメモリ202、入力装置203、出力装置204、インターフェース(I/F)205及び記憶装置206を有する計算機である。
プロセッサ201は、メインメモリ202に格納されたプログラムを実行する。
メインメモリ202は、例えば半導体メモリであり、プロセッサ201によって実行されるプログラム及びプロセッサ201によって参照されるデータを格納する。具体的には、記憶装置206に格納されたプログラム及びデータの少なくとも一部が、必要に応じてメインメモリ202にコピーされる。
入力装置203は、物理量推定システム100のユーザ等からの入力を受ける。入力装置203は、例えばキーボード及びマウス等を含んでもよい。
出力装置204は、例えば液晶表示装置のような画像表示装置である。
I/F205は、ネットワーク150に接続され、シナリオ例入力システム110、センサ120、現況入力システム130及びアプリケーションシステム140と通信するインターフェースである。ネットワーク150A、150B及び150Cが独立している場合、物理量推定システム100は、それぞれのネットワークに接続される複数のI/F205を有する。
記憶装置206は、例えばハードディスク装置(HDD)又はフラッシュメモリのような不揮発性の記憶装置である。本実施形態の記憶装置206には、少なくとも、シミュレーション条件生成部101、シミュレータ102、シナリオ管理部103、入力受付部105、シナリオ合成部106、シナリオ配信部108、シナリオDB104及び合成シナリオDB107が格納される。
シナリオDB104及び合成シナリオDB107は、後述するように、それぞれシナリオ管理部103によって生成されたシナリオ及びシナリオ合成部106によって合成されたシナリオを保持する。
シミュレーション条件生成部101、シミュレータ102、シナリオ管理部103、入力受付部105、シナリオ合成部106及びシナリオ配信部108は、プロセッサ201によって実行されるプログラムである。以下の説明においてこれらの各部が実行する処理は、実際にはプロセッサ201によって実行される。なお、図2には一つのシミュレータ102のみを示しているが、本実施形態の物理量推定システム100は互いに種類の異なる複数のシミュレータ102(例えば、地震シミュレータプログラム及び氾濫シミュレータプログラム等)を保持する。
シナリオ例入力システム110、現況入力システム130及びアプリケーションシステム140は、物理量推定システム100と同様のハードウェアを有する計算機によって実現できるため、それらのハードウェア構成については図示を省略する。
シナリオ例入力システム110の記憶装置(図示省略)又はメインメモリ(図示省略)にはシナリオ例入力システムを実現するためのプログラム(例えばWebブラウザ、図示省略)が格納され、それをシナリオ例入力システム110のプロセッサ(図示省略)が実行する。
同様に、現況入力システム130の記憶装置(図示省略)等に格納された現況入力システムを実現するためのプログラム(例えばWebブラウザ、図示省略)を現況入力システム130のプロセッサ(図示省略)が実行する。アプリケーションシステム140の記憶装置(図示省略)等に格納されたアプリケーションプログラム(図示省略)をアプリケーションシステム140のプロセッサ(図示省略)が実行する。
次に、物理量推定システム100が実行する処理について説明する。
物理量推定システム100は、事前処理(図3A)及びリアルタイム処理(図3B)を実行する。リアルタイム処理は、物理量推定システム100がセンサ120等から取得した物理量に基づいて、現在又は未来の任意の時点の物理量を推定し、その推定結果を含むシナリオ(合成シナリオ)をアプリケーションシステム140に配信する処理である。事前処理は、リアルタイム処理を実行するための準備に相当し、物理量推定システム100を導入してから最初にリアルタイム処理を実行する前に少なくとも1回実行する必要がある。
図3Aは、本発明の第1の実施形態の物理量推定システム100が実行する事前処理のフローチャートである。
物理量推定システム100は、シナリオDB構築処理を実行する(ステップ301)。これによって事前に想定されるシナリオが多数作成され、シナリオDB104に蓄積される。シナリオDB構築処理の詳細については図4等を参照して後述する。
図3Bは、本発明の第1の実施形態の物理量推定システム100が実行するリアルタイム処理のフローチャートである。
物理量推定システム100は、シナリオDB104を参照してシナリオ合成処理を実行する(ステップ302)。これによって、リアルタイムに計測されたデータと、事前に作成されたシナリオとに基づいて新たなシナリオが合成され、その結果が合成シナリオDB107に格納される。シナリオ合成処理の詳細については図15等を参照して後述する。
アプリケーションシステム140は、合成シナリオDB107を参照して種々のアプリケーションを実行することができる。例えば、アプリケーションシステム140は、合成シナリオDB107を参照して誘導情報生成処理を実行し(ステップ303)、生成した誘導情報を、ネットワーク150Dを介して移動体端末304に送信してもよい。誘導情報生成処理の詳細については図17を参照して後述する。
ここで、移動体端末304は、アプリケーションシステム140のユーザが所持する携帯電話機等の端末装置である。ネットワーク150Dは、例えば携帯電話網又は無線LAN(Local Area Network)等であるが、アプリケーションシステム140と移動体端末304との間の通信を可能にするものであれば、どのようなものであってもよい。
ここで、事前処理(図3A)の詳細について説明する。
図4は、本発明の第1の実施形態の物理量推定システム100が実行するシナリオDB構築処理のフローチャートである。この処理は、図3Aのステップ301において実行される。
最初に、シミュレーション条件生成部101がシミュレーション条件生成処理を実行する(ステップ401)。シミュレーション条件生成処理の詳細については図5を参照して後述する。
次に、シミュレータ102が、ステップ401において生成されたシミュレーション条件に従ってシミュレーション処理を実行する(ステップ402)。シミュレーション処理の詳細については図6等を参照して後述する。
次に、シナリオ管理部103が、ステップ402において得られたシミュレーション結果を用いてシナリオDB104を構築する(ステップ403)。さらに、シナリオ管理部103は、シナリオDB104に格納されたシナリオを参照して、シナリオクラスタを生成し、その結果をシナリオDB104に格納する(ステップ404)。これらの処理の詳細については図8及び図10等を参照して後述する。
図5は、本発明の第1の実施形態の物理量推定システム100が実行するシミュレーション条件生成処理のフローチャートである。この処理は、図4のステップ401においてシミュレーション条件生成部101によって実行される。
最初に、シミュレーション条件生成部101は、シミュレート条件受付処理を実行する(ステップ501)。具体的には、シミュレーション条件生成部101は、シナリオ例入力システム110を介して、物理量推定システム100のユーザ等からシミュレート条件の入力を受け付ける。ユーザ等は、経験又は学術的な知見等に基づいて、実際に起こりうると考えられる事象をシミュレート条件として入力することができる。例えば、ユーザは、地震シミュレータに関するシミュレート条件として、発生する可能性がある地震の震源地及びその地震の規模をシミュレート条件として入力してもよい。あるいは、ユーザは、河川の氾濫時の浸水深を推定する氾濫シミュレータに関するシミュレート条件として、河川の堤防が決壊する可能性がある位置及びそこから流出する水の流量、又はある地点の降雨量をシミュレート条件として入力してもよい。
さらに、ユーザ等は、複数の種類のシミュレーションを関連付ける情報、より詳細には、あるシミュレータによるシミュレーションの結果に基づいて別のシミュレータのシミュレート条件を生成する方法を定義する情報を入力することができる。例えば、シミュレータ102の一つが上記の地震シミュレータであり、別の一つが、出火地点を入力されると延焼の範囲をシミュレートする火災シミュレータである場合、ユーザ等は、地震の揺れの大きさと出火の確率とを関連付ける情報を入力してもよい。シミュレータ102がさらに各家庭及び事業所等の使用電力量をシミュレートする電力シミュレータを含む場合、ユーザ等は、地震の揺れの大きさと停電の発生確率とを関連付ける情報、及び、火災の発生と停電の発生確率とを関連付ける情報を入力してもよい。
あるいは、シミュレータ102の一つが氾濫シミュレータ又は津波による浸水深を推定する津波シミュレータであり、別の一つがスマートメータによって計測される電力量を推定する電力シミュレータである場合、ユーザ等は、浸水深とスマートメータの故障の発生確率とを関連付ける情報を入力してもよい。このような例については本発明の第2の実施形態において説明する。
次に、シミュレーション条件生成部101は、境界条件抽出処理を実行する(ステップ502)。ここで、境界条件とは、シミュレータ102にシミュレート条件として入力される具体的な数値である。シミュレーション条件生成部101は、ステップ501において入力されたシミュレート条件から境界条件を抽出する。例えば、シミュレータ102に入力可能な具体的な数値がステップ501においてシミュレート条件として入力された場合、シミュレーション条件生成部101は、入力された数値をそのまま境界条件として抽出してもよい。ステップ501において曖昧さを含むシミュレート条件が入力された場合、そのシミュレート条件から具体的な数値を抽出する。
ここで、シミュレーション条件生成部101は、入力された一つのシミュレート条件から一つの境界条件のみを抽出してもよいが、通常は、一つのシミュレート条件から複数の境界条件を抽出する。例えば、シミュレータ102に入力可能な具体的な数値がシミュレート条件として入力された場合、シミュレーション条件生成部101は、入力された数値に加えて、その数値を少しずつ変更した複数の数値を複数の境界条件として抽出してもよい。曖昧さを含むシミュレート条件が入力された場合、そのシミュレート条件に含まれる(又はそのシミュレート条件に近い)複数の数値を複数の境界条件として抽出してもよい。
例えば、地震シミュレータに関するシミュレート条件として、一つの震源地の座標値と、その震源地において発生する地震の規模を示す一つの数値が入力された場合、シミュレーション条件生成部101は、その震源地を含む範囲内の複数の地点の座標値と、入力された地震の規模を示す数値を含む複数の数値と、の複数の組み合わせを複数の境界条件として抽出してもよい。あるいは、震源地のおおよその範囲と、地震のおおよその規模とがシミュレート条件として入力された場合、シミュレーション条件生成部101は、その範囲内の(又はその範囲を含む所定の範囲内の)複数の地点の座標値と、入力された規模の範囲内の(又はその範囲を含む所定の範囲内の)地震の規模を示す複数の数値と、の複数の組み合わせを複数の境界条件として抽出してもよい。このとき、シミュレーション条件生成部101は、入力されたシミュレート条件の中心を特定し、抽出された境界条件の当該シミュレート条件の中心から遠いほど小さくなるような重みを、抽出された境界条件に付与してもよい。
あるいは、確率的なシミュレート条件が入力された場合、シミュレーション条件生成部101は、その確率に従って境界条件を抽出してもよい。例えば震源地の確率分布と地震の規模を示す数値の確率分布とが入力された場合、シミュレーション条件生成部101は、それらの確率分布に従って、震源地の座標値と地震の規模を示す数値との複数の組み合わせを複数の境界条件として抽出してもよい。このとき、シミュレーション条件生成部101は、確率分布に応じた重み(例えば、分布の中心から遠いほど小さくなるような重み)を、抽出された境界条件に付与してもよい。
以上でシミュレーション条件生成処理が終了する。
図6は、本発明の第1の実施形態の物理量推定システム100が実行するシミュレーション処理のフローチャートである。この処理は、図4のステップ402においてシミュレータ102によって実行される。
最初に、シミュレータ102は、境界条件入力処理を実行する(ステップ601)。具体的には、シミュレータ102は、ステップ502において抽出された境界条件を入力する。
次に、シミュレータ102は、時間発展処理を実行する(ステップ602)。具体的には、シミュレータ102は、ステップ601において入力された境界条件に基づいて、シミュレーションを実行することによって、各時刻における各地点の物理量を計算する。
ステップ502において複数の境界条件が抽出された場合、シミュレータ102は、それぞれの境界条件についてステップ601及びステップ602を実行する。
また、ステップ501において、シミュレーションの結果に基づいて別のシミュレータのシミュレート条件を生成する方法が定義された場合には、ステップ602が終了した後、その結果を用いてシミュレーション条件生成部101がステップ502を実行し、それによって得られた境界条件を用いてシミュレータ102が再びステップ601及びステップ602を実行する。
抽出されたすべての境界条件についてステップ601及びステップ602が実行されると、シミュレーション処理が終了する。
図7は、本発明の第1の実施形態の物理量推定システム100が実行するシミュレーション処理の一例である氾濫シミュレーションの説明図である。
氾濫シミュレーションにおいて、シミュレーション対象の空間(すなわち河川の氾濫が発生する地域)が、所定の大きさの複数の格子(グリッド)701に分割され、各グリッドの各時刻における水深及び流速が計算される。図7の例では各グリッドは1辺の長さがdの正方形である。
氾濫シミュレーションの処理結果710は、グリッドID711、時刻712、水深713及び流速714を含む。グリッドID711は各グリッドの識別子であり、各グリッドの座標に対応する。グリッドID711によって識別されるグリッドの、時刻712が示す時刻における浸水深及び水の流れる速度(具体的には例えば流速のx方向成分及びy方向成分)が、それぞれ水深713及び流速714として計算される。
このような処理結果710及びそれに対応するシミュレーションの境界条件がシナリオとしてシナリオDB104に格納されてもよいが、シナリオ管理部103が処理結果710に基づいて所望のシナリオを算定し、そのシナリオをシナリオDB104に格納してもよい(図8等参照)。なお、氾濫シミュレーションでは上記のように水深及び流速が物理量として計算されるが、他のシミュレーションでは他の物理量(例えば地震シミュレータでは各グリッドの各時刻における揺れの大きさ等)が計算され、シミュレーション処理結果として取得される。
なお、本実施形態において記載される「地点」及び「位置」は、緯度及び経度等の座標によって特定される点及びその位置であってもよいが、図7に示すようなグリッドIDによって特定されるグリッド(すなわち所定の大きさの範囲)及びその位置であってもよいし、後述する地物ID(図11B参照)によって特定される地物及びその位置であってもよい。
図8は、本発明の第1の実施形態の物理量推定システム100が実行するシナリオDB構築処理のフローチャートである。この処理は、図4のステップ403においてシナリオ管理部103によって実行される。
最初に、シナリオ管理部103は、シミュレーション結果受付処理を実行する(ステップ801)。これによって、シミュレーション処理の結果(例えば図7に示す処理結果710等)が受け付けられる。
次に、シナリオ管理部103は、シナリオ算定処理を実行する(ステップ802)。そして、シナリオ管理部103は、算定されたシナリオをシナリオDB104に格納するために、DB格納処理を実行する(ステップ803)。
以上でシナリオDB構築処理が終了する。
上記のステップ802において算定され、ステップ803において格納されるシナリオの一例を、図9A~図9Cを参照して説明する。ここでは、シナリオの一例として、図7の処理結果710に基づいて構築される道路被災シナリオを説明する。
図9Aは、本発明の第1の実施形態の物理量推定システム100によって作成されるシナリオの説明図である。
図9Aに示す複数のグリッド901は、図7に示すグリッド701と同等である。図9Aでは、さらに、シミュレーション対象の空間に存在する道路902が図示される。シナリオ管理部103は、シミュレーション結果を用いたシナリオ算定処理(ステップ802)を実行することによって、道路902ごと及び時刻ごとの水深を計算する。
図9Bは、本発明の第1の実施形態のシナリオDB104に含まれるシナリオ管理テーブル910の説明図である。
シナリオ管理テーブル910は、シナリオID911及び氾濫条件データ912を含む。シナリオID911は、各シナリオの識別情報(ID)である。氾濫条件データ912は、シナリオを構築する元になったシミュレーション処理のシミュレート条件(又は境界条件)に相当し、例えば、河川の堤防が決壊した、降雨量が極端に大きくなった、などの氾濫の初期条件に関するデータである。氾濫シミュレーション以外のシミュレーションに基づくシナリオの場合は、その元になったシミュレーションの初期条件が氾濫条件データ912の代わりに登録される。
図9Cは、本発明の第1の実施形態のシナリオDB104に含まれるシナリオ物理量管理テーブル920の説明図である。
シナリオ物理量管理テーブル920は、シナリオID921、道路ID922、時刻923、水深924及び流速925を含む。
シナリオID921は、各シナリオの識別情報であり、図9BのシナリオID911に対応する。
道路ID922は、シミュレーション対象の空間内の各道路902の識別情報であり、各道路902の座標値を含んでもよい。
道路ID922によって識別される道路の、時刻923が示す時刻における浸水深及び水の流れる速度(具体的には例えば流速のx方向成分及びy方向成分)が、それぞれ水深924及び流速925として格納される。
シナリオ管理部103は、図8のステップ802において、図7の処理結果710に基づいて、シナリオ物理量管理テーブル920に登録される情報を算定する。これらの情報は、具体的には例えば次のように算定される。物理量推定システム100は、少なくとも道路の位置に関する情報を含む地図情報(図示省略)を保持する。シナリオ管理部103は、地図情報に基づいて、各グリッド901(すなわち図7のグリッド701)と各道路902との対応関係、すなわち、各道路902がどのグリッド内にあるかを特定する。そして、シナリオ管理部103は、特定されたグリッド901の水深713及び流速714に基づいて、そのグリッドに対応する道路902の水深924及び流速925を算定する。
図9Cに示すシナリオ物理量管理テーブル920は、一つのシナリオの、一つの道路に関する、一つの時刻における水深及び流速を示す。ステップ802では、一つのシナリオについて、シミュレーション対象の地域内の各道路の各時刻における水深及び流速が算定され、それぞれの値を含む複数のシナリオ物理量管理テーブル920がシナリオDB104に格納される。
上記のように、図9Cの例では、道路ID922及びそれによって識別される道路における水深924等がシナリオ物理量管理テーブル920に格納される。これは、後述するように、アプリケーションシステム140が誘導情報生成処理303を実行するために各道路が浸水しているか否かを示す情報を利用するからである。このようなアプリケーションシステム140の処理及びそれに適するシナリオ物理量管理テーブル920は一例であり、シナリオ管理部103は、他の処理に適するシナリオ物理量管理テーブル920を生成することもできる。例えば、アプリケーションシステム140が各グリッドにおける物理量を利用した処理を実行する場合には、シナリオ物理量管理テーブル920は道路ID922の代わりにグリッドIDを含んでもよい。アプリケーションシステム140が道路以外の任意の地物(例えば河川又は建物等)における物理量を利用した処理を実行する場合には、シナリオ物理量管理テーブル920は道路ID922の代わりに任意の地物IDを含んでもよい。
図10は、本発明の第1の実施形態の物理量推定システム100が実行するシナリオクラスタ生成処理のフローチャートである。この処理は、図4のステップ404においてシナリオ管理部103によって実行される。
シナリオ管理部103は、最初に、シナリオ特徴量算定処理を実行し(ステップ1001)、続いて、得られたシナリオの特徴量に基づいてクラスタリングを実行する(ステップ1002)。
シナリオ特徴量算定処理(ステップ1001)は、シナリオのデータからシナリオの特徴を表す量(特徴量)を抽出する処理である。抽出された特徴量に基づいてクラスタリングを行うことによって、クラスタリングの計算量を削減することができる。
図9Cに例示するように、一つのシナリオ(すなわち一つのシナリオIDによって識別されるシナリオ)は、各地点の各時刻における物理量(図9Cの例では、各道路の各時刻における水深及び流速)を含む。すなわち、各シナリオは、各地点の各時刻における物理量を要素として含む多変量ベクトルによって表現することができる。シナリオ管理部103は、主成分分析又は独立成分分析といった公知の方法によって、シナリオを表現するベクトルの次元数を削減することができる。
あるいは、シナリオ管理部103は、クラスタリングの結果への寄与が大きいと考えられる特定の地点の物理量を特徴量として選択してもよい。例えば、クラスタリング対象の複数のシナリオのいずれにおいても、ある地点(第1地点)の物理量(例えば水深)はほとんど同じであるが、別のある地点(第2地点)の物理量はシナリオごとに大きく異なる場合には、第2地点の物理量はクラスタリングの結果に大きく寄与するが、第1地点の物理量の寄与は比較的小さいと考えられる。このような場合、シナリオ管理部103は、第2地点の物理量を含み、第1地点の物理量を含まない特徴量を算定してもよい。
このように、シナリオの特徴量を抽出し、その特徴量に基づいてクラスタリングを行うことによって、クラスタリングの結果への寄与が小さい物理量をクラスタリングの計算から除外することができ、これによって計算量を削減できる。ただし、計算量を削減する必要がない場合には、シナリオ管理部103はステップ1001を実行せずに(すなわち各シナリオを表現するベクトルをそのまま特徴量として使用することによって)ステップ1002のクラスタリングを実行してもよい。
クラスタリング(ステップ1002)は、ステップ1001において抽出された特徴量を用いて、k-means法、混合ガウス分布に基づく方法、階層クラスタリングなど、公知の方法によって実行することができる。クラスタリングによって、各シナリオクラスタに一つの又は互いに比較的類似する二つ以上のシナリオが含まれるように、複数のシナリオが複数のシナリオクラスタに分類される。
次に、シナリオ管理部103は、クラスタ統計量算出処理を実行する(ステップ1003)。具体的には、シナリオ管理部103は、各シナリオクラスタに含まれるシナリオの(例えば各地点の各時刻の)物理量の平均値、分散値及び期待値といった統計量を算出する。
次に、シナリオ管理部103は、重要スポット抽出処理を実行する(ステップ1004)。ここで、重要スポットとは、シナリオクラスタ内で特に値のばらつきが大きい地点(又は地点及び時刻の組)である。上記のように、クラスタリングによって二つ以上のシナリオが一つのシナリオクラスタに分類された場合、それらのシナリオの特徴量は互いに比較的類似している。すなわち、それらの二つ以上のシナリオの各地点の各時刻における物理量は互いに類似していることが多い。しかし、特定の地点の(又は、特定の地点の特定の時刻における)物理量は、一つのクラスタ内のシナリオ間でばらつきが大きい場合がある。シナリオ管理部103は、上記のような物理量のばらつきの大きい地点(又は地点及び時刻の組み合わせ)を、重要スポットとして抽出する。
例えば氾濫シミュレーションの場合、一つのシナリオクラスタに含まれるシナリオにおける堤防の決壊地点及び浸水域等はおおむね類似すると考えられる。しかし、シミュレーション対象の地域のうち、比較的標高の高い地点では、シナリオクラスタ内のいずれのシナリオでも全く浸水せず、比較的標高の低い地点ではすべてのシナリオで浸水し、中程度の標高の地点に関しては、シナリオクラスタに含まれる一部のシナリオでは浸水し、残りのシナリオでは浸水しない、という場合がある。
クラスタ内でのある地点の物理量(例えば浸水深)のばらつきが大きいことは、シミュレーション条件のわずかな相違に応じて、その地点で計算される物理量が大きく異なる可能性があること、すなわち、その地点の物理量を精度よく推定するためには、他の地点より精密な推定を行う必要があることを意味する。このため、シミュレーション結果のばらつきの大きい地点(上記の例では中程度の標高の地点)が、精密な推定を必要とする重要スポットとして抽出される。
具体的には、シナリオ管理部103は、シナリオクラスタ内のシナリオの物理量のばらつきを示す指標(例えば分散値)が所定の条件を満たす(例えば所定の値を超える)地点及び時刻を、重要スポットとして抽出してもよい。後述するシナリオ合成処理において、重要スポットの物理量は、実際にセンサ120等によって計測されたデータを用いてより精密に推定される。
シナリオクラスタにおいて、ある地点の物理量のばらつきが時刻にかかわらず大きい場合もあるが、特定地点の特定の時刻の物理量のみのばらつきが大きい場合もあり、後者の場合には、当該特定の地点及び特定の時刻の組み合わせが重要スポットとして抽出される。以下、重要スポットとして地点及び時刻の組み合わせが抽出された場合を例として説明するが、地点のみが抽出された場合(言い換えるとある地点と全時刻の範囲との組み合わせが重要スポットとして抽出された場合)にも以下の説明を適用することができる。
以上でシナリオクラスタ生成処理が終了する。シナリオ管理部103は、図11A~図11Dを参照して後述するように、シナリオクラスタ生成処理の結果をシナリオDB104に格納する。
図11Aは、本発明の第1の実施形態のシナリオDB104に含まれるシナリオクラスタリングテーブル1100の説明図である。
シナリオクラスタリングテーブル1100は、シナリオID1101及びシナリオクラスタID1102を含む。シナリオID1101は、各シナリオの識別情報であり、図9BのシナリオID911等に対応する。シナリオクラスタID1102は、各シナリオが属するシナリオクラスタの識別情報であり、これがクラスタリング(ステップ1002)の結果に相当する。
図11Bは、本発明の第1の実施形態のシナリオDB104に含まれるシナリオクラスタ管理テーブル1110の説明図である。
シナリオクラスタ管理テーブル1110は、シナリオクラスタID1111、地物ID1112、クラスタ内平均値1113及びクラスタ内分散値1114を含む。
シナリオクラスタID1111は、各シナリオクラスタの識別情報であり、図11AのシナリオクラスタID1102に対応する。
地物ID1112は、各シナリオクラスタに属するシナリオにおいて、物理量と対応付けられる地物の識別情報である。例えば、図9Cの例のように水深等の物理量が道路に対応付けられる場合、地物ID1112は道路IDである。また、シナリオにおいて物理量がグリッドに対応付けられる場合(例えば図7参照)には、地物ID1112はグリッドIDである。あるいは、地物ID1112は、建物の識別情報等であってもよい。
クラスタ内平均値1113及びクラスタ内分散値1114は、それぞれ、各シナリオクラスタに属するシナリオの各地物に対応付けられた物理量の平均値及び分散値である。これらは、クラスタ統計量算出処理(ステップ1003)によって算出された値である。
なお、図11Bは、シナリオクラスタ管理テーブル1110の代表的な形態を例示したものであり、実際には例えば図11Cに示すように種々のバリエーションがあり得る。
図11Cは、本発明の第1の実施形態のシナリオDB104に含まれるシナリオクラスタ管理テーブル1110の具体例の説明図である。
図11Cに示すシナリオクラスタ管理テーブル1120は、図9A~図9Cに示すシナリオをクラスタリングすることによって得られたシナリオクラスタに関するシナリオクラスタ管理テーブル1110の具体例であり、シナリオクラスタID1121、道路ID1122、時刻1123、平均水深1124及び平均流速1125を含む。
シナリオクラスタID1121は、各シナリオクラスタの識別情報であり、図11BのシナリオクラスタID1111に対応する。
道路ID1122は、各道路902の識別情報であり、図11Bの地物ID1112に対応する。
時刻1123は、各シナリオに含まれる物理量に関連付けられる時刻であり、図9Cの時刻923に対応する。
平均水深1124及び平均流速1125は、各道路902に関連付けられる各時刻の水深及び流速のシナリオクラスタ内の平均値であり、図11Bのクラスタ内平均値1113に対応する。これらの値は、図9Cの水深924及び流速925から算出される。
シナリオクラスタ管理テーブル1120は、さらに、水深及び流速の分散値を含んでもよい。
図11Dは、本発明の第1の実施形態のシナリオDB104に含まれる重要スポット管理テーブル1130の説明図である。
重要スポット管理テーブル1130は、シナリオクラスタID1131、道路ID1132及び時刻1133を含む。
シナリオクラスタID1131は、各シナリオクラスタの識別情報であり、図11AのシナリオクラスタID1102に対応する。
道路ID1132及び時刻1133は、重要スポットとして抽出された地点及び時刻の組を識別する情報である。例えば、ある道路におけるある時刻の物理量(例えば水深又は流速)のシナリオクラスタ内の分散値が所定の値より大きい場合、その道路及び時刻の組が重要スポットとして抽出される。複数の重要スポットが抽出された場合には、複数の重要スポットを識別する道路ID及び時刻の複数の組が重要スポット管理テーブル1130に登録される。
以上で事前処理(図3A)が終了する。続いて、リアルタイム処理(図3B)の詳細について説明する。
図12は、本発明の第1の実施形態の物理量推定システム100が実行するシナリオ合成処理のフローチャートである。この処理は、図3Bのステップ302において実行される。
最初に、物理量推定システム100の入力受付部105が実物理量入力処理を実行する(ステップ1201)。実物理量入力処理の詳細については図13等を参照して後述する。
次に、物理量推定システム100のシナリオ合成部106がシナリオ合成処理を実行する(ステップ1202)。ステップ1202のシナリオ合成処理の詳細については図15等を参照して後述する。合成されたシナリオは合成シナリオDB107に格納される。
次に、アプリケーションシステム140が誘導情報生成処理を実行する(ステップ1203)。誘導情報生成処理の詳細については図17を参照して後述する。
図13は、本発明の第1の実施形態の物理量推定システム100が実行する実物理量入力処理のフローチャートである。この処理は、図12のステップ1201において実行される。
入力受付部105は、目視情報受付処理(ステップ1301)及びセンサ情報受付処理(ステップ1302)を実行する。入力受付部105は、ステップ1301及び1302のどちらを先に実行してもよい。
目視情報受付処理は、ユーザ等が現況入力システム130を介して入力したデータを、入力受付部105が、ネットワーク150B及びI/F205を介して受け付ける処理である。入力されるデータの例を図14Aに示す。
センサ情報受付処理は、センサ120から送信されたデータを、入力受付部105が、ネットワーク150B及びI/F205を介して受け付ける処理である。センサ120から送信されるデータの例を図14Bに示す。
図14Aは、本発明の第1の実施形態の物理量推定システム100が現況入力システム130から受け付けるデータの説明図である。
物理量推定システム100の入力受付部105が現況入力システム130から受け付ける目視情報のデータ1400は、例えば、地点1401、時刻1402及び浸水程度1403を含む。
地点1401は、ユーザ等が目視(又は体感)によって物理量を観測した地点であり、座標値等であってもよいが、町名及び番地のような情報であってもよい。町名及び番地が入力された場合、物理量推定システム100が地図情報(図示省略)を参照してそれを座標値(又は座標値の範囲)に変換することができる。
時刻1402は、ユーザ等が目視(又は体感)によって物理量を観測した時刻である。
浸水程度1403は、ユーザ等が目視(又は体感)によって観測した、河川の氾濫等による浸水の程度(すなわち浸水深)を示す情報である。浸水程度1403は、例えば「50センチメートル」のような具体的な数値であってもよいが、ユーザ等の目視による観測の精度は低いと考えられるため、例えば「浸水なし」「床下浸水」又は「床上浸水」の3段階のいずれかを示す情報であってもよい。
上記のデータ1400は一例であり、入力受付部105は、例えば地震の揺れの程度を示す情報等、ユーザ等の目視(又は体感)によって観測され、現況入力システム130から送信された任意の物理量に関するデータを受け付けることができる。例えば地震の場合、目視情報のデータ1400は、浸水程度1403の代わりに、ユーザ等が体感した震度を含んでもよい。
図14Bは、本発明の第1の実施形態の物理量推定システム100がセンサ120から受け付けるデータの説明図である。
図14Bには、物理量推定システム100の入力受付部105がセンサ120から受け付けるデータの一例として、浸水センサ(すなわち液面検知センサ)から送付されるデータ1410を示す。データ1410は、センサID1411、時刻1412及び水深1413を含む。
センサID1411は、データ1410を送信したセンサ120の識別情報である。物理量推定システム100は各センサ120が設置された位置を特定する情報(座標値等)を保持しているため、センサID1411に基づいてセンシングが行われた地点を特定することができる。
時刻1412は、センサ120によるセンシングが行われた時刻である。
水深1413は、センサ120によってセンシングされた水深である。
上記のデータ1410は一例であり、入力受付部105は、例えば震度等、センサ120から送信された任意の物理量に関するデータを受け付けることができる。例えば震度が送信される場合、データ1410は、水深1413の代わりに震度を含む。
図15は、本発明の第1の実施形態の物理量推定システム100が実行するシナリオ合成処理のフローチャートである。この処理は、図12のステップ1202において実行される。
最初に、物理量推定システム100のシナリオ合成部106は、現況シナリオ特徴量算定処理を実行する(ステップ1501)。具体的には、シナリオ合成部106は、実物理量入力処理(ステップ1201)において入力された物理量(すなわち実際にセンサ120によって計測された物理量及びユーザ等によって入力された物理量)の特徴量を計算する。例えば、シナリオ合成部106は、実物理量入力処理において入力された物理量を対象として、図10のステップ1001と同様の処理を行ってもよい。
次に、シナリオ合成部106は、シナリオクラスタ判定処理を実行する(ステップ1502)。具体的には、シナリオ合成部106は、ステップ1501において抽出された特徴量と、シナリオDB104に格納されたシナリオクラスタの特徴量との類似度を計算し、最も類似度の高いシナリオクラスタを選択する。ここで、シナリオクラスタの特徴量は、シナリオクラスタに含まれるシナリオの特徴量の代表値、例えば、図10のステップ1001において抽出された特徴量の各要素をシナリオクラスタ内で平均することによって得られる値を要素として含むベクトルであってもよい。
なお、一般に、センサ120又は現況入力システム130による物理量の観測が行われる地点及び時刻の組み合わせの数は、シミュレーションによって物理量が計算される地点及び時刻の組み合わせの数よりずっと少ない。このため、シナリオ合成部106は、実物理量入力処理(ステップ1201)において入力された物理量が観測された地点及び時刻に対応する地点及び時刻の各シナリオの物理量に基づいてシナリオクラスタの特徴量を計算し、ステップ1502においてそのシナリオクラスタの特徴量と現況シナリオ特徴量との類似度を計算してもよい。
ステップ1501において抽出された特徴量及びシナリオクラスタの特徴量はいずれもベクトルであるため、それらのベクトル間の距離の近さを類似度の高さとして扱うことができる。なお、ここで用いる距離としては、マハラノビス距離など、多変量解析の分野で知られている距離の定義を用いてもよい。
次に、シナリオ合成部106は、重要スポット情報推定処理を実行する(ステップ1503)。この処理は、重要スポットの物理量を、ステップ1502において選択されたクラスタに含まれる全シナリオの物理量と、実物理量入力処理(ステップ1201)において入力された物理量と、に基づいて推定する処理である。具体的には、シナリオ合成部106は、ステップ1502において選択されたシナリオクラスタに含まれる全シナリオの重要スポットの物理量について、それらの物理量と、重要スポットの地点及び時刻に対応するステップ1201において入力された物理量と、の類似度に基づく重み付け演算(具体的には例えば重み付け平均)を行うことによって、重要スポットにおける物理量の期待値を計算する。
ここで、類似度は、重要スポットにおけるシナリオの物理量とそれに対応するステップ1201において入力された物理量との距離(差)の逆数であってもよい。例えば、あるシナリオ(ここではシナリオAと記載する)の重要スポットの物理量とステップ1201において入力された物理量との距離を、全シナリオの重要スポットの物理量とステップ1201において入力された物理量との距離の合計値で除算した値を、シナリオAの重要スポットの物理量の重みとして計算してもよい。シナリオ合成部106は、同様の重みをシナリオクラスタ内の全シナリオの重要スポットの物理量について計算し、それによって重み付けされた物理量の平均値を、当該シナリオクラスタの重要スポットの物理量の期待値として計算することができる。
次に、シナリオ合成部106は、物理量推定処理を実行する(ステップ1504)。具体的には、シナリオ合成部106は、重要スポット以外の地点及び時刻(以下、非重要スポットとも記載する)については、それぞれの地点及び時刻における、選択されたシナリオクラスタの代表値を、それぞれの地点及び時刻における物理量として推定し、重要スポットについては、ステップ1503における重み付け演算によって計算された期待値を、当該重要スポットの地点及び時刻における物理量として推定し、それらの推定した物理量を含むシナリオを新たに生成する。このようにして生成されたシナリオは、上記のように、重み付け演算等によって複数のシナリオを合成することによって得られた物理量を含むため、合成シナリオと記載される。シナリオ合成部106は、生成した合成シナリオを合成シナリオDB107に格納する。
ここで、重要スポット以外の地点及び時刻における、選択されたシナリオクラスタの代表値とは、その地点及び時刻における、選択されたシナリオクラスタに含まれる複数のシナリオの物理量を代表する値であり、具体的にはそれらの複数のシナリオのうちいずれか一つの物理量であってもよいし、複数のシナリオの物理量の統計量であってもよい。例えば、代表値は、選択されたシナリオクラスタ内の全シナリオの物理量の平均値であってもよいし、選択されたシナリオクラスタ内の全シナリオのうち、ステップ1501において抽出された特徴量との類似度が最も高いシナリオの物理量であってもよいし、選択されたシナリオクラスタ内の全シナリオのうち、ステップ1501において抽出された特徴量との類似度が所定の値以上の複数のシナリオの物理量の平均値であってもよい。また、統計量として、平均値以外の値(例えば中央値等)を使用してもよい。
なお、上記の選択されたシナリオクラスタ内の全シナリオの物理量の平均値とは、シナリオクラスタ内の全シナリオの物理量に同一の重みを付けて重み付け平均を行った結果と言い換えることもできる。ステップ1501において抽出された特徴量との類似度が最も高いシナリオの物理量とは、ステップ1501において抽出された特徴量との類似度が最も高いシナリオの物理量に0以外の重みを付け、他の物理量に0の重みを付けて重み付け平均を行った結果と言い換えることもできる。ステップ1501において抽出された特徴量との類似度が所定の値以上の複数のシナリオの物理量の平均値とは、ステップ1501において抽出された特徴量との類似度が所定の値以上の複数のシナリオの物理量に0以外の同一の重みを付け、他の物理量に0の重みを付けて重み付け平均を行った結果と言い換えることもできる。このように、非重要スポットにおける物理量の推定も、重み付け演算によって求めることができるが、重みの値を決定する方法が重要スポットにおけるものとは異なる。
シナリオ合成部106は、非重要スポットにおける物理量を推定する計算量をさらに削減するため、時刻の間引き又はシナリオの間引きを行ってもよい。前者を実行する場合、シナリオ合成部106は、非重要スポットのすべての時刻における代表値を計算する代わりに、一部の時刻(例えば所定の間隔で間引きされた一部の時刻)の代表値を計算し、その他の時刻の物理量は、計算された代表値の値を補完することによって推定する。後者を実行する場合、シナリオ合成部106は、上記のような類似度によらずに、シナリオクラスタに含まれる複数のシナリオの一部を選択し、選択されたシナリオの非重要スポットにおける物理量の平均値を代表値として計算してもよい。時刻の間引き及びシナリオの間引きを組み合わせてもよい。
重要スポット以外の地点及び時刻における物理量のシナリオクラスタ内でのばらつきは小さいため、どのシナリオの物理量を代表値として選択しても、あるいは平均値を代表値として計算しても、推定の結果は大きく変わらない。これに対して、重要スポットにおける物理量のシナリオクラスタ内でのばらつきは大きいため、ステップ1201において入力された物理量(すなわちリアルタイムで実測された物理量)に基づく重み付け平均によって物理量が推定される。これによって、実測された物理量に整合する高精度の物理量推定を行うことができる。
図16は、本発明の第1の実施形態の物理量推定システム100が実行するシナリオ合成処理の概念の説明図である。
例えば、道路1601にいくつかのセンサ1602が設置されている場合に、シナリオ合成部106は、それらのセンサ1602から取得された物理量の特徴量を現況シナリオ特徴量として計算する(ステップ1501)。
そして、シナリオ合成部106は、現況シナリオ特徴量との類似度が最も高い特徴量を有するシナリオクラスタを選択する(ステップ1502)。
続いて、シナリオ合成部106は、そのシナリオクラスタの重要スポットについては、センサ1602から取得された物理量に基づく、選択されたシナリオクラスタ内の全シナリオ1610の物理量の重み付け平均によって期待値を計算する(ステップ1503)。
一方、重要スポット以外の地点及び時刻については、シナリオ合成部106は、現況シナリオに最も類似するシナリオの物理量(又は、選択されたシナリオクラスタ内の全シナリオ1610の物理量の、重み付けをしない平均値)を物理量の期待値として取得する。
そして、シナリオ合成部106は、重要スポット及びそれ以外の地点及び時刻のそれぞれの物理量の期待値(すなわち推定された物理量)を合成することによって合成シナリオ1620を生成し、それを合成シナリオDB107に格納する(ステップ1504)。
物理量推定システム100のシナリオ配信部108は、必要に応じて(例えばアプリケーションシステム140からの要求に応じて)、合成シナリオDB107に格納された合成シナリオ(例えば上記の合成シナリオ1620)をアプリケーションシステム140に配信する。
図17は、本発明の第1の実施形態のアプリケーションシステム140が実行する誘導情報生成処理のフローチャートである。
図17には、アプリケーションシステム140が提供するアプリケーションの一例として、河川等が氾濫した(又はこれから氾濫すると予想される)時に、避難等のためにユーザを誘導するアプリケーションを示す。このため、図17に示す例において、アプリケーションシステム140は、公知のナビゲーションシステム等が有するものと同様の道路ネットワークデータ(図示省略)及びそれに基づく経路探索機能を有する。
最初に、アプリケーションシステム140は、経路コスト算定処理を実行する(ステップ1701)。このとき、アプリケーションシステム140は、シナリオ配信部108から配信された合成シナリオ(例えば図16の合成シナリオ1620)を参照する。図16に例示する合成シナリオ1620は、氾濫シミュレーションの結果を含むため、推定された物理量として各道路の浸水深の値を含む。そこで、アプリケーションシステム140は、例えば、浸水深の値が0より大きい(又は所定の値より大きい)道路を、通行不可能な道路と判定して、その道路が経路探索によって選択されないように、道路ネットワークデータを変更する。
例えば、アプリケーションシステム140は、通行不可能と判定された道路に、通行止め等の、通行を禁止する情報を設定してもよい。あるいは、アプリケーションシステム140は、通行不可能と判定された道路のコストを、その道路が経路探索結果として選択されない程度に十分に大きい値に変更してもよい。
そして、アプリケーションシステム140は、上記のように変更された道路ネットワークデータを参照して、例えば、ユーザの現在地から所定の避難場所までの経路のコストを計算する。
次に、アプリケーションシステム140は、ステップ1701において計算された経路コストに基づいて、経路探索処理を実行し、その結果を出力する(ステップ1702)。例えば、アプリケーションシステム140は、経路探索処理の結果を、ネットワーク150Dを介して、ユーザが保持する移動体端末304に送信してもよい。
以上で誘導情報生成処理が終了する。なお、上記のような誘導情報生成処理は一例であり、アプリケーションシステム140は、合成シナリオを利用して種々の処理を実行することができる。
以上のように、本発明の第1の実施形態の物理量推定システム100は、種々の条件に基づいて物理量を推定するシミュレーションを実行し、各シミュレーション条件とそれに基づくシミュレーション結果との組をシナリオとして保持し、そのようにして得られた多数のシナリオをクラスタリングし、各クラスタ内の物理量のばらつきの大きい地点及び時刻を重要スポットとして特定しておく。そして、物理量推定システム100は、センサ等によって観測された物理量を含むリアルタイムデータを取得すると、取得したリアルタイムデータの特徴量と類似するクラスタを特定し、そのクラスタの重要スポットにおける物理量をリアルタイムデータに基づいて推定し、重要スポットにおける推定された物理量と、重要スポット以外の地点及び時刻におけるそのクラスタの物理量の代表値(例えば平均値)と、からなる合成シナリオを生成する。この合成シナリオに含まれる物理量が、現在までにセンサ120等から取得された物理量に基づく現在及び未来の各時刻における各地点の推定された物理量である。
上記の処理のうち、物理量推定システム100がセンサ120等から取得したリアルタイムデータを用いなければ実行できないのは、クラスタの特定及び重要スポットにおける物理量の推定のみであり、シミュレーションの実行から重要スポットの特定までは、リアルタイムデータを取得する前に実行しておくことができる。これによって、リアルタイムデータの取得後に実行すべき計算の量を削減することができるため、高速に物理量を推定し、その物理量に基づいて、迅速に避難情報等を提供することができる。また、クラスタ内の物理量のばらつきが大きい重要スポットについては、センサ120等から取得された物理量に基づく推定を行うことによって、より尤もらしい推定結果を得ることができる。
<第2の実施形態>
図18は、本発明の第2の実施形態の計算機システムの構成を示す機能ブロック図である。
図18は、本発明の第2の実施形態の計算機システムの構成を示す機能ブロック図である。
本実施形態の計算機システムは、物理量推定システム1800、シミュレータ1810、シナリオ例入力システム110、センサ120、現況入力システム130及びアプリケーションシステム140によって構成される。シミュレータ1810はネットワーク150Eを介して、シナリオ例入力システム110はネットワーク150Aを介して、センサ120及び現況入力システム130はネットワーク150Bを介して、アプリケーションシステム140はネットワーク150Cを介して、それぞれ物理量推定システム100に接続される。
本実施形態の計算機システムのうち、物理量推定システム1800、シミュレータ1810及びネットワーク150E以外の構成は、図1において同一の符号を付された構成と同一の機能を有するため、それらの説明は省略する。
物理量推定システム1800は、シミュレータ102を有さず、シミュレータ通信部1801及びシミュレータリスト1802を有する点を除いて、第1の実施形態の物理量推定システム100と同一である。上記以外の物理量推定システム1800の構成は、図1において同一の符号を付された構成と同一の機能を有するため、それらの説明は省略する。
シミュレータ通信部1801は、シミュレータ1810との通信を実行する機能を有する。その詳細については、図20を参照して後述する。
シミュレータリスト1802は、所望のシミュレーションを実行するシミュレータを特定する情報を含む。具体的には、シミュレータリスト1802は、例えば、シミュレーション条件生成部によって生成された境界条件に基づくシミュレーションを実行できるシミュレータ1810を特定する情報(例えばそのシミュレータ1810のアドレス)等のリストであってもよい。
シミュレータ1810は、第1の実施形態のシミュレータ102と同様の機能を有する。ただし、第1の実施形態のシミュレータ102は、物理量推定システム100のプロセッサ201が物理量推定システム100の記憶装置206に格納されたプログラムを実行することによって実現さたが、本実施形態のシミュレータ1810は、物理量推定システム100以外の計算機によって実現される。本実施形態の計算機システムは、それぞれが異なる種類のシミュレーションを実行する複数のシミュレータ1810を有してもよい。
ネットワーク150Eは、シミュレータ1810と物理量推定システム1800との間の通信を可能にするものであれば、どのようなものであってもよい。例えば、ネットワーク150Eは、ネットワーク150A、150B及び150Cのいずれかと同種のものであってもよい。また、図1には三つのネットワーク150A、150B、150C及び150Eを示したが、これらが一つのネットワークによって実現されてもよい。以下の説明においてネットワーク150が参照された場合、それは、ネットワーク150A、150B、150C及び150Eのいずれか、又は、ネットワーク150A、150B、150C及び150Eを実現する一つのネットワークである。
物理量推定システム1800のハードウェア構成は、図2に示した第1の実施形態の物理量推定システム100と同様であるため、図示を省略する。ただし、物理量推定システム1800の記憶装置206には、シミュレータ102が格納されず、シミュレータ通信部1801を実現するプログラム及びシミュレータリスト1802が格納される。以下の説明においてシミュレータ通信部1801が実行する処理は、実際にはプロセッサ201によって実行される。
次に、本実施形態の物理量推定システム1800が実行する処理について説明する。
物理量推定システム1800は、事前処理(図19A)及びリアルタイム処理(図19B)を実行する。これらの処理は、第1の実施形態の事前処理(図3A)及びリアルタイム処理(図3B)と同様の目的で実行される。
図19Aは、本発明の第2の実施形態の物理量推定システム1800が実行する事前処理のフローチャートである。
物理量推定システム1800は、シナリオDB構築処理を実行する(ステップ1901)。これによってシナリオDB104が構築される。シナリオDB構築処理の詳細については図20等を参照して後述する。
図19Bは、本発明の第2の実施形態の物理量推定システム1800が実行するリアルタイム処理のフローチャートである。
物理量推定システム1800は、シナリオDB104を参照してシナリオ合成処理を実行し(ステップ1902)、その結果を合成シナリオDB107に格納する。本実施形態のシナリオ合成処理は、第1の実施形態と同様である。
アプリケーションシステム140は、合成シナリオDB107を参照して種々のアプリケーションを実行することができる。例えば、アプリケーションシステム140は、合成シナリオDB107を参照して被害推定表示処理を実行し(ステップ1903)、生成した誘導情報を、ネットワーク150Fを介して被害状況可視化端末1904に送信してもよい。被害推定表示処理の詳細については図24を参照して後述する。
ここで、被害状況可視化端末1904は、アプリケーションシステム140のユーザが所持するパーソナルコンピュータ等の端末装置である。ネットワーク150Fは、アプリケーションシステム140と移動体端末304との間の通信を可能にするものであれば、どのようなものであってもよい。
ここで、事前処理(図19A)の詳細について説明する。
図20は、本発明の第2の実施形態の物理量推定システム1800が実行するシナリオDB構築処理のフローチャートである。この処理は、図19Aのステップ1901において実行される。
最初に、シミュレーション条件生成部101がシミュレーション条件生成処理を実行する(ステップ401)。この処理は、第1の実施形態のシミュレーション条件生成部101が実行するものと同様であるため(図5参照)、ここでは説明を省略する。
次に、シミュレータ通信部1801が、必要シミュレータ選択処理(ステップ2001)及びシミュレーション実行依頼処理(ステップ2002)を実行する。
必要シミュレータ選択処理(ステップ2001)は、ステップ401において生成された境界条件に基づくシミュレーションを実行するシミュレータ1810を選択する処理である。具体的には、シミュレータ通信部1801は、シミュレータリスト1802を参照して、生成された境界条件に適合するシミュレータ1810を選択する。
シミュレーション実行依頼処理(ステップ2002)は、選択されたシミュレータ1810にシミュレーション処理の実行を依頼する処理である。具体的には、シミュレータ通信部1801は、ステップ2001において選択されたシミュレータ1810に、ステップ401において生成された境界条件を含むシミュレーション処理実行依頼を送信し、そのシミュレータ1810からシミュレーション処理結果を受信する。
シミュレータ1810は、ステップ401において生成され、シミュレータ通信部1801から送信された境界条件に従ってシミュレーション処理を実行する(ステップ402)。第1の実施形態のシミュレータ102と同様に、本実施形態のシミュレータ1810は種々のシミュレーションを実行することができる。したがって、シミュレータ通信部1801は、図7に示すようなシミュレーション処理結果を受信してもよいが、本実施形態では別のシミュレーション処理結果(具体的には、シミュレータ1810の一つである津波シミュレータによる津波シミュレーション処理の結果)の例について後述する(図21参照)。
次に、シナリオ管理部103が、ステップ402において得られたシミュレーション結果を用いてシナリオDB104を構築する(ステップ403)。さらに、シナリオ管理部103は、シナリオDB104に格納されたシナリオを参照して、シナリオクラスタを生成し、その結果をシナリオDB104に格納する(ステップ404)。これらの処理は、第1の実施形態のシナリオ管理部103が実行するものと同様であるため(図8及び図10参照)、ここでは説明を省略する。したがって、これらの処理によって、シナリオDBに図9B、図9C及び図11A~図11Dに示すようなシナリオが格納されてもよいが、本実施形態では別のシナリオの例について後述する(図22A~図22D参照)。
図21は、本発明の第2の実施形態のシミュレータ1810が実行するシミュレーション処理の一例である津波シミュレーションの説明図である。
図21に示すグリッド2101は、図7に示すグリッド701と同様である。図21の津波シミュレーションの処理結果2110に含まれるグリッドID2111、時刻2112、水深2113及び流速2114は、それぞれ、図7の氾濫シミュレーションの処理結果710に含まれるグリッドID711、時刻712、水深713及び流速714と同様である。このため、これらについての説明は省略する。ただし、図21の水深2113及び流速2114は、河川等の氾濫によるものではなく、津波による浸水深及び水の流れる速度である。
本実施形態のシナリオ管理部103が実行するシナリオDB構築処理(ステップ403)及びシナリオクラスタ生成処理(ステップ404)の手順は、第1の実施形態のシナリオ管理部103によって実行されるものと同様である。シナリオDB構築処理(ステップ403)及びシナリオクラスタ生成処理(ステップ404)の詳細は、それぞれ図8及び図10に示した通りである。これによって、本実施形態の物理量推定システム1800は、図9A~図9Cに示すものと同様のシナリオDB104を構築し、図11A~図11Dに示すものと同様のシナリオクラスタの生成及び重要スポットの抽出をすることもできる。ただし、本実施形態では、第1の実施形態の道路被災シナリオとは別の例として、図21の処理結果2110に基づいて構築される震災津波シナリオについて、図22A~図22Dを参照して説明する。
図22Aは、本発明の第2の実施形態の物理量推定システム1800によって作成されるシナリオの説明図である。図22Aに示す複数のグリッド2201は、図21に示すグリッド2101と同等である。
図22Bは、本発明の第2の実施形態のシナリオDB104に含まれるシナリオ管理テーブル2210の説明図である。
シナリオ管理テーブル2210は、シナリオID2211及び地震条件データ2212を含む。シナリオID2211は、各シナリオの識別情報(ID)である。地震条件データ2212は、シナリオを構築する元になったシミュレーション処理のシミュレート条件(又は境界条件)に相当し、例えば、震源地及び地震の規模などの、地震(及びそれに起因する津波)の初期条件に関するデータである。津波シミュレーション以外のシミュレーションに基づくシナリオの場合は、その元になったシミュレーションの初期条件が地震条件データ2212の代わりに登録される。
図22Cは、本発明の第2の実施形態のシナリオDB104に含まれる水深管理テーブル2220の説明図である。
水深管理テーブル2220は、シナリオID2221、グリッドID2222、時刻2223、水深2224及び流速2225を含む。
シナリオID2221は、各シナリオの識別情報であり、図22BのシナリオID2211に対応する。
グリッドID2222は、シミュレーション対象の空間内の各グリッド2201の識別情報であり、図21のグリッドID2111に対応する。
グリッドID2222によって識別されるグリッドの、時刻2223が示す時刻における浸水深及び水の流れる速度(具体的には例えば流速のx方向成分及びy方向成分)が、それぞれ水深2224及び流速2225として格納される。
シナリオ管理部103は、図20のステップ403(より詳細には、ステップ403に含まれる図8のステップ802)において、図21の処理結果2110に基づいて、水深管理テーブル2220に登録される情報を算定する。
図22Cに示す水深管理テーブル2220は、一つのシナリオの、一つのグリッドに関する、一つの時刻における水深及び流速を示す。ステップ802では、一つのシナリオについて、シミュレーション対象の地域内の各グリッドの各時刻における水深及び流速が算定され、それぞれの値を含む複数の水深管理テーブル2220がシナリオDB104に格納される。
図22Dは、本発明の第2の実施形態のシナリオDB104に含まれるスマートメータ故障管理テーブル2230の説明図である。
本実施形態のシミュレータ通信部1801は、一つ(又は複数)のシミュレータ1810から取得したシミュレーション処理結果を、シナリオ管理部103だけでなく、シミュレーション条件生成部101に渡してもよい。あるシミュレータ1810によるシミュレーションの結果に基づいて別のシミュレータ1810のシミュレート条件を生成する方法を定義する情報がシミュレーション条件生成部101に入力されている場合、シミュレーション条件生成部101は、その情報と、シミュレータ通信部1801から渡されたシミュレーション処理結果と、に基づいて、新たな境界条件を生成し、それをシミュレータ通信部1801に入力する。
シミュレーションの結果に基づいて別のシミュレート条件を生成する方法を定義する情報の一例は、河川の氾濫又は津波等による各地点の浸水深と、その地点に設置されたセンサ120の一種であるスマートメータの故障発生確率との関係である。スマートメータが設置された施設等が浸水した場合、スマートメータへの電力の供給が停止する、スマートメータに浸水して動作が停止する、又はスマートメータが流失する、といった故障のためにそのスマートメータがデータを送信できなくなる確率が上昇する。一般に、浸水深が深くなるほど、スマートメータの故障発生確率は高くなる。
例えば、シミュレーション条件生成部101は、上記のような関係に基づいて生成した境界条件をシミュレータ通信部1801に入力する。シミュレータ通信部1801は、入力された境界条件を含むシミュレーション実行依頼を、適切に選択されたシミュレータ1810(例えば電力シミュレータ)に送信し、シミュレーション処理結果を受信する。このようにして受信したシミュレーション処理結果は、例えば、各地点においてスマートメータの故障が発生する時刻の情報を含んでもよい。
図22Dには、上記のようなシミュレーション処理結果に基づいて生成されるスマートメータ故障管理テーブル2230の例を示す。この例において、スマートメータ故障管理テーブル2230は、シナリオID2231、メータID2232及び故障時刻2233を含む。
シナリオID2231は、各シナリオの識別情報であり、図22BのシナリオID2211に対応する。
メータID2232は、各スマートメータの識別情報である。
故障時刻2233は、各スマートメータが故障すると思われる時刻であり、シミュレーション条件生成部101によって生成された境界条件に基づいてシミュレータ1810が実行したシミュレーションの処理結果として得られた値である。
このようにして生成された各シナリオは、少なくとも、津波シミュレータに入力された境界条件と、その境界条件に基づく津波シミュレータによるシミュレーション結果と、そのシミュレーション結果に基づいて生成された境界条件が入力された電力シミュレータによるシミュレーション結果と、の組を含み、さらに、電力シミュレータの境界条件を含んでもよい。
本実施形態のシナリオ管理部103は、図22A~図22Dに示すシナリオを対象として、図10に示すシナリオクラスタ生成処理を実行する。これによって、スマートメータ故障管理テーブル2230における故障時刻2233を含むシナリオ特徴量が計算され(ステップ1001)、その特徴量に基づくクラスタリングが行われ(ステップ1002)、生成されたシナリオクラスタの統計量が算出され(ステップ1003)、シナリオクラスタの重要スポットが抽出される(ステップ1004)。
本実施形態のシナリオ合成処理(ステップ1902)の手順は、第1の実施形態のシナリオ合成処理(ステップ302)と同様である。したがって、本実施形態の入力受付部105及びシナリオ合成部106は、図12に示す実物理量入力処理(ステップ1201)及びシナリオ合成処理(ステップ1202)を順次実行する。実物理量入力処理及びシナリオ合成処理の詳細は、それぞれ図13及び図15に示した通りである。これによって、本実施形態の物理量推定システム1800は、図14A、図14B及び図16に例示したものと同じ処理を実行することもできる。ただし、本実施形態では、上記のものとは別の例として、スマートメータから得られるデータも利用してシナリオを合成する処理の例を説明する。このため、本実施形態のステップ1201において入力されるデータとして、第1の実施形態と異なる例を図23A~図23Cに示す。
図23Aは、本発明の第2の実施形態の物理量推定システム1800が現況入力システム130から受け付けるデータの説明図である。
物理量推定システム1800の入力受付部105が現況入力システム130から受け付ける目視情報のデータ2300は、例えば、地点2301、時刻2302及び浸水程度2303を含む。この目視情報のデータ2300は、図14Aに示した目視情報のデータ1400と同様であるため、説明を省略する。
図23Bは、本発明の第2の実施形態の物理量推定システム1800がセンサ120から受け付けるデータの説明図である。
図23Bには、物理量推定システム1800の入力受付部105がセンサ120から受け付けるデータの一例として、浸水センサ(すなわち液面検知センサ)から送付されるデータ2310を示す。データ2310は、センサID2311、時刻2312及び水深2313を含む。このデータ2310は、図14Bに示した浸水センサから送付されるデータ1410と同様であるため、説明を省略する。
図23Cは、本発明の第2の実施形態の物理量推定システム1800が別の種類のセンサ120から受け付けるデータの説明図である。
図23Cには、物理量推定システム1800の入力受付部105がセンサ120から受け付けるデータの一例として、スマートメータから送付されるデータ2320を示す。データ2320は、メータID2321、時刻2322及び消費電力2323を含む。
メータID2321は、データ2320を送信したセンサ120(すなわちスマートメータ)の識別情報である。物理量推定システム1800は各スマートメータが設置された位置を特定する情報(座標値等)を保持しているため、メータID2321に基づいてセンシングが行われた地点を特定することができる。
時刻2322は、スマートメータによるセンシングが行われた時刻である。
消費電力2323は、スマートメータによってセンシングされた(すなわちスマートメータが設置された施設等の)消費電力量(例えばワット/時間)である。河川の氾濫又は津波等によって、スマートメータが設置された施設等が浸水した場合、スマートメータの故障のためにデータ2320を送信できなくなる確率が上昇する。物理量推定システム1800は、例えば、あるスマートメータからデータ2320を受信できない時間が所定の長さを超えた場合、そのスマートメータが故障したと判定してもよい。
本実施形態のシナリオ合成部106は、データ2320に基づくスマートメータの故障の判定結果を含む現況シナリオ特徴量を計算し(ステップ1501)、その現況シナリオ特徴量と、ステップ1002で生成されたシナリオクラスタの特徴量とに基づいて、現況シナリオ特徴量に最も類似するシナリオクラスタを選択する。さらに、シナリオ合成部106は、選択したシナリオクラスタの重要スポットについて、第1の実施形態と同様の方法によって重要スポット情報推定処理を実行し(ステップ1503)、その結果と、ステップ1502において選択されたシナリオクラスタの代表値とを含む合成シナリオを生成し(ステップ1504)、生成した合成シナリオを合成シナリオDB107に格納する。
図24は、本発明の第2の実施形態のアプリケーションシステム140が実行する被害地域情報生成処理のフローチャートである。
図24には、アプリケーションシステム140が提供するアプリケーションの一例として、津波による被害を受けた地域(又はこれから被害を受けると予想される地域)を表示するアプリケーションを示す。
具体的には、アプリケーションシステム140は、水深可視化処理を実行する(ステップ2401)。この処理は、アプリケーションシステム140が、シナリオ配信部108から配信された合成シナリオの、各地点(グリッド)の、各時刻の浸水深を参照し、その浸水深をアプリケーションシステム140の出力装置204(例えば画像表示装置)から出力する処理である。例えば、浸水深は、数値によって表示されてもよいし、地図上の記号、図形又は色彩等によって表示されてもよい。
以上で被害地域情報生成処理が終了する。なお、上記のような被害地域情報生成処理は一例であり、アプリケーションシステム140は、合成シナリオを利用して種々の処理(例えば第1の実施形態と同様の誘導情報生成処理)を実行することができる。
以上の本発明の第2の実施形態によれば、物理量推定システム1800がシミュレータ102を有しない場合であっても、外部のシミュレータ1810を利用して、第1の実施形態と同様の物理量推定を行うことができる。
また、あるシミュレータによるシミュレーションの結果と、別のシミュレータによるシミュレーションの入力条件とを関連付ける情報をあらかじめ設定しておくことによって、本実施形態の物理量推定システム1800は、センサ120等(例えばスマートメータ)から取得されたリアルタイムデータを、本来の目的とは異なる物理量の推定(例えば浸水深の推定)に利用することができる。
より詳細には、ある地域においてある事象が発生した場合に、その事象が当該地域内の複数の種類のセンサ120が取得するデータに影響を与える場合がある。例えば、ある地域において津波が発生し、それが原因で停電した場合、水位計(潮位計)は高い水位を計測し、スマートメータによって計測される電力量はゼロになる(又はスマートメータが故障することによってデータの送信が途絶える)。このように、複数種類のセンサが一つの事象に関連するデータを取得する場合がある。しかし、各種のセンサ120は、例えば、津波の検知、電力供給の制御又は課金、等の、それぞれに固有の目的のために使用されるものであり、それぞれのセンサ120が取得したデータを、それぞれのセンサ120の本来の目的を超えて、それらが設置された地域に発生した事象に関連する物理量を推定するために利用することはできなかった。
例えば、上記のように、水位計と、水位計が計測した値を条件として入力されると津波シミュレーションを実行する津波シミュレータと、スマートメータと、スマートメータが計測した値が条件として入力されると電力に関するシミュレーションを実行する電力シミュレータと、が用意されている場合に、スマートメータの計測結果を、津波シミュレーションによる浸水深の推定に利用することはできなかった。しかし、本実施形態によれば、上記のように、センサ120等から取得されたリアルタイムデータを、本来の目的とは異なる物理量の推定に利用することが可能になる。
これによって、十分な数のセンサ120が設置されていない場合であっても、物理量の推定の精度を向上させることができる。例えば、水位計は、河川及び港湾等には設置されていても、人の居住地域に設置されていることは少ない。一方、スマートメータ(電力計)は、人の居住地域に豊富に存在することが期待できる。スマートメータの計測値を津波による浸水深の推定に利用することによって、水位計の乏しい居住地域における津波による浸水深の推定の精度を向上させることができる。
なお、本発明の第1の実施形態と第2の実施形態の本質的な相違点は、シミュレータが物理量推定システムの内部にあるか否かだけである。このため、上記のようにセンサを本来の目的以外の目的に使用することは、第1の実施形態の物理量推定システム100によっても実現することができる。
上記の第1及び第2の実施形態ではシナリオのクラスタリング及び重要スポットの特定が行われるが、これらの実施形態の変形例として、クラスタリング等を省略する形態も考えられる。例えば、物理量を推定しようとする対象地域が比較的狭く、発生が予想される事象も限定されているような場合には、物理量推定システム100(又は1800)は、クラスタリングを行わずに(言い換えるとすべてのシナリオを一つのシナリオクラスタに属するものとみなして)物理量の推定を行うこともできる。このとき、物理量推定システム100は、重要スポットの特定を実行してもよいが、これを実行せずに、すべての地点及び時刻について、類似度に基づく重み付け演算によるシナリオの合成を行ってもよい。
上記の実施形態の各機能を実現するプログラム、テーブル、ファイル等の情報は、不揮発性半導体メモリ、ハードディスクドライブ、SSD(Solid State Drive)等の記憶デバイス、または、ICカード、SDカード、DVD等の計算機読み取り可能な非一時的データ記憶媒体に格納することができる。
本発明は上記した実施形態に限定されるものではなく、様々な変形例が含まれる。例えば、上記した実施形態は本発明を分かりやすく説明するために詳細に説明したものであり、必ずしも説明した全ての構成を備えるものに限定されるものではない。また、ある実施形態の構成の一部を他の実施形態の構成に置き換えることが可能であり、また、ある実施形態の構成に他の実施形態の構成を加えることも可能である。また、各実施形態の構成の一部について、他の構成の追加・削除・置換をすることが可能である。
Claims (13)
- シミュレーションの条件として入力された値と、前記入力された値に基づく所定のシミュレーションの結果として算出された、一つ以上の位置における物理量と、を含むシナリオを複数保持するシナリオ保持部と、
計測された物理量及び前記物理量が計測された位置に基づく所定の計算によって前記複数のシナリオに含まれる物理量を合成することによって、前記一つ以上の位置における物理量を推定するシナリオ合成部と、
前記推定された物理量を保持する合成シナリオ保持部と、を有することを特徴とする物理量推定システム。 - 請求項1に記載の物理量推定システムであって、
前記シナリオ合成部は、前記計測された物理量及び前記物理量が計測された位置に基づく所定の計算として、前記計測された物理量と、前記複数のシナリオに含まれる、前記物理量が計測された位置における物理量との類似度に従って定めた重みを、前記複数のシナリオに含まれる物理量に付けた重み付け演算を実行することを特徴とする物理量推定システム。 - 請求項2に記載の物理量推定システムであって、
前記複数のシナリオを、前記各シナリオに含まれる物理量に基づくクラスタリングによって、各々が複数のシナリオを含む複数のシナリオクラスタに分類し、前記各シナリオクラスタに含まれる複数のシナリオの前記各位置における物理量の統計量を算出し、前記各シナリオクラスタに含まれる複数のシナリオの前記各位置における物理量のばらつきが所定の値より大きい場合、前記各位置を重要スポットとして特定し、前記各シナリオが属する前記シナリオクラスタを特定する情報、及び、前記各シナリオクラスタの前記重要スポットを特定する情報を前記シナリオ保持部に格納するシナリオ管理部をさらに有し、
前記シナリオ合成部は、
前記各シナリオクラスタについて算出された前記統計量と、前記計測された物理量とを比較することによって、前記計測された物理量と最も類似するシナリオクラスタを特定し、
前記特定されたシナリオクラスタの前記重要スポットにおける物理量を、前記重み付け演算によって推定し、
前記特定されたシナリオクラスタの前記重要スポット以外の位置における物理量を、前記重要スポットにおいて使用されるものとは異なる重みを付けた重み付け演算によって推定することを特徴とする物理量推定システム。 - 請求項3に記載の物理量推定システムであって、
第1の種類の前記シミュレーションの結果に含まれる前記一つ以上の位置における第1の種類の前記物理量に基づいて、第2の種類の前記シミュレーションの条件として入力される値を生成するシミュレーション条件生成部をさらに有し、
前記各シナリオは、少なくとも、前記第1の種類のシミュレーションの条件、前記第1の種類のシミュレーションの結果として得られる前記第1の種類の物理量、及び、前記第2の種類のシミュレーションの結果として得られる第2の種類の物理量を含み、
前記シナリオ合成部は、前記各シナリオクラスタについて算出された前記統計量と、第1の種類のセンサによって計測された前記第1の種類の物理量と、第2の種類のセンサによって計測された前記第2の種類の物理量と、を比較することによって、前記計測された物理量と最も類似するシナリオクラスタを特定することを特徴とする物理量推定システム。 - 請求項4に記載の物理量推定システムであって、
入力された前記第1の種類の物理量に基づいて、一つ以上の位置における前記第1の種類の物理量を算出する第1の種類のシミュレータ部と、入力された前記第2の種類の物理量に基づいて、一つ以上の位置における前記第2の種類の物理量を算出する第2の種類のシミュレータ部と、をさらに有することを特徴とする物理量推定システム。 - 請求項3に記載の物理量推定システムであって、
一つの前記シミュレーション条件を入力されると、各々が、前記入力されたシミュレーション条件に含まれる値を含む範囲内の複数の値の各々を含む、複数のシミュレーション条件を生成するシミュレーション条件生成部をさらに有することを特徴とする物理量推定システム。 - 請求項3に記載の物理量推定システムであって、
前記各シナリオクラスタについて算出された前記統計量は、前記各シナリオクラスタ内の前記複数のクラスタの各位置における前記物理量に同一の重みを付けて計算された平均値を含み、
前記シナリオ合成部は、
前記特定されたシナリオクラスタに含まれる前記複数のシナリオの前記重要スポットにおける物理量に、前記計測された物理量との類似度が高いほど大きい重みを付けて計算した平均値を、前記特定されたシナリオクラスタの前記重要スポットにおける物理量として推定し、
前記特定されたシナリオクラスタの前記重要スポット以外の位置について算出された前記統計量に含まれる平均値を、前記特定されたシナリオクラスタの前記重要スポット以外の位置における物理量として推定することを特徴とする物理量推定システム。 - 請求項3に記載の物理量推定システムであって、
前記シナリオ合成部は、
前記特定されたシナリオクラスタに含まれる前記複数のシナリオの前記重要スポットにおける物理量に、前記計測された物理量との類似度が高いほど大きい重みを付けて計算した平均値を、前記特定されたシナリオクラスタの前記重要スポットにおける物理量として推定し、
前記特定されたシナリオクラスタに含まれる前記複数のシナリオの前記重要スポット以外の位置における物理量のうち、前記計測された物理量との類似度が最も高いものの重みとして0より大きい値を付け、それ以外の物理量の重みとして0を付けて計算した平均値を、前記特定されたシナリオクラスタの前記重要スポット以外の位置における物理量として推定することを特徴とする物理量推定システム。 - 物理量推定システムが実行する物理量推定方法であって、
前記物理量推定システムは、プロセッサと、前記プロセッサに接続されるインターフェースと、前記プロセッサに接続される記憶装置と、を有し、
前記記憶装置は、シミュレーションの条件として入力された値と、前記入力された値に基づく所定のシミュレーションの結果として算出された、一つ以上の位置における物理量と、を含むシナリオを複数保持し、
前記物理量推定方法は、
前記インターフェースが、計測された物理量の入力を受ける第1手順と、
前記プロセッサが、前記計測された物理量及び前記物理量が計測された位置に基づく所定の計算によって前記複数のシナリオに含まれる物理量を合成することによって、前記一つ以上の位置における物理量を推定し、前記推定された物理量を前記記憶装置に格納する第2手順と、を含むことを特徴とする物理量推定方法。 - 請求項9に記載の物理量推定方法であって、
前記第2手順は、前記プロセッサが、前記計測された物理量と、前記複数のシナリオに含まれる、前記物理量が計測された位置における物理量との類似度に従って定めた重みを、前記複数のシナリオに含まれる物理量に付けた重み付け演算を実行する手順を含むことを特徴とする物理量推定方法。 - 請求項10に記載の物理量推定方法であって、
前記プロセッサが、前記複数のシナリオを、前記各シナリオに含まれる物理量に基づくクラスタリングによって、各々が複数のシナリオを含む複数のシナリオクラスタに分類し、前記各シナリオクラスタに含まれる複数のシナリオの前記各位置における物理量の統計量を算出し、前記各シナリオクラスタに含まれる複数のシナリオの前記各位置における物理量のばらつきが所定の値より大きい場合、前記各位置を重要スポットとして特定し、前記各シナリオが属する前記シナリオクラスタを特定する情報、及び、前記各シナリオクラスタの前記重要スポットを特定する情報を前記記憶装置に格納する第3手順をさらに含み、
前記第2手順は、
前記プロセッサが、前記各シナリオクラスタについて算出された前記統計量と、前記計測された物理量とを比較することによって、前記計測された物理量と最も類似するシナリオクラスタを特定する第4手順と、
前記プロセッサが、前記特定されたシナリオクラスタの前記重要スポットにおける物理量を、前記重み付け演算によって推定する第5手順と、
前記プロセッサが、前記特定されたシナリオクラスタの前記重要スポット以外の位置における物理量を、前記重要スポットにおいて使用されるものとは異なる重みを付けた重み付け演算によって推定する第6手順と、を含むことを特徴とする物理量推定方法。 - 請求項11に記載の物理量推定方法であって、
前記プロセッサが、第1の種類の前記シミュレーションの結果に含まれる前記一つ以上の位置における第1の種類の前記物理量に基づいて、第2の種類の前記シミュレーションの条件として入力される値を生成する第7手順をさらに含み、
前記各シナリオは、少なくとも、前記第1の種類のシミュレーションの条件、前記第1の種類のシミュレーションの結果として得られる前記第1の種類の物理量、及び、前記第2の種類のシミュレーションの結果として得られる第2の種類の物理量を含み、
前記第4手順は、前記各シナリオクラスタについて算出された前記統計量と、第1の種類のセンサによって計測された前記第1の種類の物理量と、第2の種類のセンサによって計測された前記第2の種類の物理量と、を比較する手順を含むことを特徴とする物理量推定方法。 - 請求項12に記載の物理量推定方法であって、
前記プロセッサが、入力された前記第1の種類の物理量に基づいて、一つ以上の位置における前記第1の種類の物理量を算出し、入力された前記第2の種類の物理量に基づいて、一つ以上の位置における前記第2の種類の物理量を算出する第8手順をさらに含むことを特徴とする物理量推定方法。
Priority Applications (2)
| Application Number | Priority Date | Filing Date | Title |
|---|---|---|---|
| PCT/JP2012/069735 WO2014020747A1 (ja) | 2012-08-02 | 2012-08-02 | 物理量推定システム及び物理量推定方法 |
| JP2014527916A JP5864753B2 (ja) | 2012-08-02 | 2012-08-02 | 物理量推定システム及び物理量推定方法 |
Applications Claiming Priority (1)
| Application Number | Priority Date | Filing Date | Title |
|---|---|---|---|
| PCT/JP2012/069735 WO2014020747A1 (ja) | 2012-08-02 | 2012-08-02 | 物理量推定システム及び物理量推定方法 |
Publications (1)
| Publication Number | Publication Date |
|---|---|
| WO2014020747A1 true WO2014020747A1 (ja) | 2014-02-06 |
Family
ID=50027475
Family Applications (1)
| Application Number | Title | Priority Date | Filing Date |
|---|---|---|---|
| PCT/JP2012/069735 Ceased WO2014020747A1 (ja) | 2012-08-02 | 2012-08-02 | 物理量推定システム及び物理量推定方法 |
Country Status (2)
| Country | Link |
|---|---|
| JP (1) | JP5864753B2 (ja) |
| WO (1) | WO2014020747A1 (ja) |
Cited By (3)
| Publication number | Priority date | Publication date | Assignee | Title |
|---|---|---|---|---|
| JP2016170115A (ja) * | 2015-03-13 | 2016-09-23 | 国立大学法人東北大学 | 津波浸水予測システム、制御装置、津波浸水予測の提供方法及びプログラム |
| JP2018116021A (ja) * | 2017-01-20 | 2018-07-26 | 株式会社Nttファシリティーズ | 耐震補強設計支援装置、耐震補強設計手法、及びプログラム |
| CN116324795A (zh) * | 2020-10-02 | 2023-06-23 | 渊慧科技有限公司 | 使用网格表示和图形神经网络模拟物理环境 |
Citations (3)
| Publication number | Priority date | Publication date | Assignee | Title |
|---|---|---|---|---|
| JP2002207002A (ja) * | 2001-01-10 | 2002-07-26 | Hitachi Eng Co Ltd | 大気環境シミュレーションシステム |
| JP2004197554A (ja) * | 2002-12-03 | 2004-07-15 | Foundation Of River & Basin Integrated Communications Japan | リアルタイム動的氾濫シミュレーションシステム |
| JP2005196752A (ja) * | 2003-12-10 | 2005-07-21 | Hiroshi Sato | 社会、経済、市場における現象の可視化手段、モデル化手段、シミュレーション手段、及び分析手段。並びに社会を自律的に理解する機械或いは計算機の実現手段 |
-
2012
- 2012-08-02 WO PCT/JP2012/069735 patent/WO2014020747A1/ja not_active Ceased
- 2012-08-02 JP JP2014527916A patent/JP5864753B2/ja not_active Expired - Fee Related
Patent Citations (3)
| Publication number | Priority date | Publication date | Assignee | Title |
|---|---|---|---|---|
| JP2002207002A (ja) * | 2001-01-10 | 2002-07-26 | Hitachi Eng Co Ltd | 大気環境シミュレーションシステム |
| JP2004197554A (ja) * | 2002-12-03 | 2004-07-15 | Foundation Of River & Basin Integrated Communications Japan | リアルタイム動的氾濫シミュレーションシステム |
| JP2005196752A (ja) * | 2003-12-10 | 2005-07-21 | Hiroshi Sato | 社会、経済、市場における現象の可視化手段、モデル化手段、シミュレーション手段、及び分析手段。並びに社会を自律的に理解する機械或いは計算機の実現手段 |
Cited By (3)
| Publication number | Priority date | Publication date | Assignee | Title |
|---|---|---|---|---|
| JP2016170115A (ja) * | 2015-03-13 | 2016-09-23 | 国立大学法人東北大学 | 津波浸水予測システム、制御装置、津波浸水予測の提供方法及びプログラム |
| JP2018116021A (ja) * | 2017-01-20 | 2018-07-26 | 株式会社Nttファシリティーズ | 耐震補強設計支援装置、耐震補強設計手法、及びプログラム |
| CN116324795A (zh) * | 2020-10-02 | 2023-06-23 | 渊慧科技有限公司 | 使用网格表示和图形神经网络模拟物理环境 |
Also Published As
| Publication number | Publication date |
|---|---|
| JP5864753B2 (ja) | 2016-02-17 |
| JPWO2014020747A1 (ja) | 2016-07-11 |
Similar Documents
| Publication | Publication Date | Title |
|---|---|---|
| US12585971B2 (en) | Systems and methods for automatic environmental planning and decision support using artificial intelligence and data fusion techniques on distributed sensor network data | |
| Liu et al. | A planning-oriented resilience assessment framework for transmission systems under typhoon disasters | |
| Chaudhuri et al. | Temporal accuracy in urban growth forecasting: A study using the SLEUTH model | |
| Lu et al. | Vulnerability analysis of transportation network under scenarios of sea level rise | |
| Snow et al. | A high‐resolution national‐scale hydrologic forecast system from a global ensemble land surface model | |
| CN109997164B (zh) | 提供基于到达间隔时间的测量和预测即将发生的自然灾难性事件的测量系统及其方法 | |
| CN118708945B (zh) | 一种用于水文数据的自动监测方法及系统 | |
| KR20150124396A (ko) | 크라우드소싱을 이용한 위치 결정, 매핑 및 데이터 관리 시스템 및 방법 | |
| JP2012510607A (ja) | 地震損害予測及び回避システム並びにその方法 | |
| He et al. | Ensemble rainfall forecasting with numerical weather prediction and radar‐based nowcasting models | |
| KR20160102805A (ko) | 해양 기상 분석 장치 및 방법 | |
| EP4403963A1 (en) | Systems and methods for estimating floods | |
| CN114741822A (zh) | 一种自然灾害下配电网停电概率预测方法、系统及装置 | |
| Achite et al. | Hybrid interpolation approach for estimating the spatial variation of annual precipitation in the Macta basin, Algeria: M. Achite et al. | |
| JP5864753B2 (ja) | 物理量推定システム及び物理量推定方法 | |
| US12462267B2 (en) | Prediction system and prediction method | |
| JP7636183B2 (ja) | 情報処理装置、水資源管理方法、情報処理方法、及びプログラム | |
| CN117687125A (zh) | 构建覆冰格点数据集的方法、处理器、装置及存储介质 | |
| CN120746057B (zh) | 一种灾害下城市道路网络鲁棒性评估方法、装置、设备及存储介质 | |
| CN116796649A (zh) | 一种基于机器学习的spei粗分辨率数据空间降尺度方法及装置 | |
| JP2014235121A (ja) | 模擬降雨データ生成装置、生成方法およびプログラム | |
| Puttinaovarat et al. | Application programming interface for flood forecasting from geospatial big data and crowdsourcing data | |
| Fakhri et al. | Uncertainty assessment of downscaled rainfall: impact of climate change on the probability of flood | |
| Savage et al. | The impact of scale on probabilistic flood inundation maps using a 2D hydraulic model with uncertain boundary conditions | |
| Khokhlov et al. | Data security and quality evaluation framework: Implementation empirical study on android devices |
Legal Events
| Date | Code | Title | Description |
|---|---|---|---|
| 121 | Ep: the epo has been informed by wipo that ep was designated in this application |
Ref document number: 12882268 Country of ref document: EP Kind code of ref document: A1 |
|
| ENP | Entry into the national phase |
Ref document number: 2014527916 Country of ref document: JP Kind code of ref document: A |
|
| NENP | Non-entry into the national phase |
Ref country code: DE |
|
| 122 | Ep: pct application non-entry in european phase |
Ref document number: 12882268 Country of ref document: EP Kind code of ref document: A1 |