WO2013144651A2 - A method for the investigation of differences in analytical data and an apparatus adapted to perform such a method - Google Patents
A method for the investigation of differences in analytical data and an apparatus adapted to perform such a method Download PDFInfo
- Publication number
- WO2013144651A2 WO2013144651A2 PCT/GB2013/050840 GB2013050840W WO2013144651A2 WO 2013144651 A2 WO2013144651 A2 WO 2013144651A2 GB 2013050840 W GB2013050840 W GB 2013050840W WO 2013144651 A2 WO2013144651 A2 WO 2013144651A2
- Authority
- WO
- WIPO (PCT)
- Prior art keywords
- data
- bins
- probability distribution
- posterior probability
- count rate
- Prior art date
- Legal status (The legal status is an assumption and is not a legal conclusion. Google has not performed a legal analysis and makes no representation as to the accuracy of the status listed.)
- Ceased
Links
Classifications
-
- G—PHYSICS
- G01—MEASURING; TESTING
- G01N—INVESTIGATING OR ANALYSING MATERIALS BY DETERMINING THEIR CHEMICAL OR PHYSICAL PROPERTIES
- G01N33/00—Investigating or analysing materials by specific methods not covered by groups G01N1/00 - G01N31/00
- G01N33/0004—Gaseous mixtures, e.g. polluted air
-
- H—ELECTRICITY
- H01—ELECTRIC ELEMENTS
- H01J—ELECTRIC DISCHARGE TUBES OR DISCHARGE LAMPS
- H01J49/00—Particle spectrometers or separator tubes
- H01J49/0027—Methods for using particle spectrometers
- H01J49/0036—Step by step routines describing the handling of the data generated during a measurement
-
- G—PHYSICS
- G01—MEASURING; TESTING
- G01N—INVESTIGATING OR ANALYSING MATERIALS BY DETERMINING THEIR CHEMICAL OR PHYSICAL PROPERTIES
- G01N30/00—Investigating or analysing materials by separation into components using adsorption, absorption or similar phenomena or using ion-exchange, e.g. chromatography or field flow fractionation
Definitions
- the present invention relates to method of investigating differences in data produced by at least one analytical instrument and apparatus adapted to perform the method. More particularly, but not exclusively, the present invention relates to the identification of differences in data sets using a data model for the data sets wherein the model ties the data in one bin in one data set to the data in the corresponding bin of the other data set.
- the user of analytical instruments may wish to identify changes within two or more samples in various different applications. These applications may include, for example, reaction monitoring over time, quality control monitoring, patient diagnosis, and petrochemical investigative analysis.
- concentration or expression level of one or more components, molecules or analytes in a first sample is quantitated relative to the intensity, concentration or expression level of one or more components, molecules or analytes in a second sample.
- the method and apparatus according to the present invention seeks to overcome the problems of the prior art.
- the present invention provides a method of investigating differences in data produced by at least one analytical instrument comprising providing a first data set from a first sample in a plurality of data bins; providing a second data set from a second sample in a plurality of data bins; providing a data model of said data sets in which the data in a plurality of data bins from the first data set is linked to the data in the corresponding bins of the second data set, each linked pair having an associated switch parameter linking the two together; and, exploring the posterior probability distribution for the data model as a function of the switch parameters to produce a posterior probability distribution map.
- the method according to the invention has the advantage of a considerable increase in speed and accuracy of processing the data.
- a further advantage of the method according to the invention is that not only are differences in the quantity of components within a sample identified, but components only present in one sample can also be identified.
- At least one of the first and second data sets is a raw data set.
- each data bin represents a region of mass to charge ratio against mobility cell drift time.
- the data held by each bin preferably relates to ion arrival count rate.
- the switch parameter for each pair of linked data bins relates to the difference in the ion arrival count rate between the linked bins.
- the data model models the ion arrival count rate for each bin as a product of a normalised count rate for that bin multiplied by a count rate scale factor for the data set to which the bin belongs, the switch parameter for each pair of linked bins relating to the difference in normalised ion count rate between the two bins.
- the step of exploring the posterior probability distribution further comprises exploring the posterior probability distribution as a function of the count rate scale factors of the data sets.
- the switch parameter for each pair of linked data bins is a boolean parameter with one value corresponding to the same ion arrival count rate between the two linked bins and the other value corresponding to a different ion arrival count rate between the two bins.
- the data model further includes a parameter relating to the gain factor of the analytical instrument and the step of exploring the posterior probability distribution further comprises exploring the posterior probability distribution as a function of gain factor.
- the data model associates at least one shift correction with each bin, the step of exploring the posterior probability distribution further comprising exploring the posterior probability distribution as a function of the at least one shift correction.
- the at least one shift correction is at least one of drift time, retention time, mass, precursor ion mass and product ion mass.
- multiple data sets are provided from at least one of the first and second data samples.
- the method further comprises the step of identifying differences in data between the multiple data sets from the same sample to produce an estimate of variation in data produced by the at least one analytical instrument.
- the posterior probability distribution is explored by a Monte Carlo algorithm.
- the Monte Carlo algorithm may be a Markov Chain algorithm.
- the Monte Carlo algorithm further comprises at least one sampling technique from the list comprising Gibbs sampling and Slice sampling.
- the Monte Carlo algorithm further comprises at least one sampling technique from the list comprising Metropolis Hastings sampling and Nested sampling.
- the method further comprises the step of analysing at least a portion of the explored region of the posterior probability distribution map to produce a result for at least one of the parameters of the data model.
- the method further comprises the step of analysing at least a portion of the posterior probability distribution map to produce a map indicative of the differences between the data produced by the at least one analytical instrument from the first sample and the second sample.
- the method further comprises the step of further investigating the map indicative of the differences between the data produced by the at least one analytical instrument from the first sample and the second sample to determine differences in composition between the first and second samples.
- the first data set and the second data set includes data produced by hydrogen deuterium exchange.
- a computer program element comprising computer readable code means for causing a processor to implement the method of any of claims 1-21.
- the computer program element is embodied on a computer readable medium.
- a computer readable medium having a program stored thereon, wherein the program is adapted to make a computer execute a procedure to implement the method of any of claims 1-21.
- Figure 1 shows raw data produced by an analytical instrument.
- Shown in figure 1 is raw data produced by an analytical instrument, in this case a mass spectrometer.
- the data may be viewed as a data set comprising a plurality of bins which in this embodiment are arranged in a rectangular array.
- the x axis of the array is mass to charge ratio (m/z).
- the y axis is mobility cell drift time.
- Each bin therefore represents a small area of mass to charge ratio and mobility cell drift time.
- Contained within each bin is a count of the number of ion arrivals within a predetermined time (the ion arrival count rate).
- a detector response is recorded for each bin which may be taken to be proportional to the count.
- the production of such data sets from analytical instruments is known and will not be discussed in further detail.
- the purpose of the method according to the invention is to is to compare two similar data sets to obtain a bin by bin probability map that gives the probability that the counts ascribed to corresponding bins arise from the same Poisson source.
- a first data set from a first sample is provided.
- the first data set (image) is arranged in a plurality of data bins as described above.
- a second data set from a second sample is provided.
- the second data set (image) is also arranged in a plurality of bins as described above.
- the data model comprises two data arrays of bins corresponding to the bins of the two data sets.
- ⁇ - ⁇ is exponentially distributed with unit mean, with an identically distributed rate ⁇ 2 , in the second image.
- Scaling by the count rate scale factor ⁇ 1 (or ⁇ 2 in the second image) allows patterns of rates ⁇ 1 and p 2 to be established independent of the scale factors required to achieve agreement with the data.
- the basic scheme is to explore the parameters of the data model by constructing an ergodic Markov chain whose stationary distribution is the joint probability distribution of data and model parameters.
- the chain is constructed using transitions for each parameter which leaves this desired distribution invariant.
- the chain will be ergodic if, for each transition, the probability distribution is greater than zero. This ensures that there is a non-zero probability of accessing any state, after iterating over each parameter starting from any initial state.
- p. be a switch state linking a bin in one data set to a corresponding bin in the other data set.
- Pr(/3 ⁇ 4 false
- ⁇ , c3 ⁇ 4) 1 - r and r is a random number drawn from (0, 1).
- a posterior probability map Once such a posterior probability map has been determined it can be analysed to produce a variety of results. By sampling appropriate states in the map one can derive an average value of the switch state for one or more bins. For bins where the average value is close to false this indicates likelihood of a significant difference in data from the two samples in that bin, so indicating a difference in composition of the two samples. For bins where the average value of the switch state is close to false this suggests no difference in composition.
- the posterior probability distribution is explored as a function of the switch state ⁇ .
- the posterior probability distribution can be explored as a function of further variables.
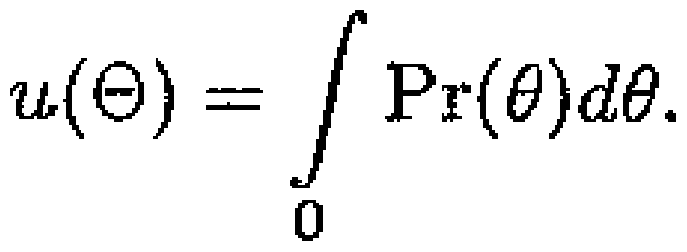
- the posterior probability distribution map as a function of ⁇ one can analyse it by sampling appropriate states to determine the likely values of ⁇ for the two data sets.
- a further suitable variable is the gain factor.
- the response of the detector x of the analytical instrument may be proportional to the ion arrival count n rather than identical to it and one may be uncertain about the constant of proportionality or gain factor Y.
- the factor can be included in the above analysis by scaling down ⁇ and S by Y so that the prior on ⁇ becomes
- each image may be shifted and re-sampled onto a common drift time axis, from where the likelihood can be re-computed and explored with slice sampling.
- the first and last points on the drift time axis are not shifted so that the total number of counts is conserved when data are resampled. For safety the extremities are placed away from the interior values by a large margin.
- the common axis may be shifted to relax the image shifts against their combined prior probability.
- a Gaussian prior with a standard deviation of one or two bins typically reflects the drift time variability adequately.
- Slice sampling may again be employed to generate transitions.
- subscripts c,a and r indicate members of the control group, analyte group and entire group respectively.
- the probability ratios for the switch states ⁇ and scale factors ⁇ are easily modified as in the above to accommodate the control and analyte groupings.
- the first data set and second data set can include data produced by hydrogen deuterium exchange.
- the method and apparatus of the invention may be used to monitor samples in a batch control process, wherein samples may be compared to a predetermined standard, to ascertain whether, and by how much, and in what components, the sample deviates from the standard. This is of use in, for example, the assessment of petroleum and biofuel samples, which must adhere to strict standards.
- the method and apparatus of the invention may further be used in a sequential process. Rather than comparing a sample against a fixed standard, the samples may be compared against an earlier sample. This is of use in, for example, monitoring drug metabolism over time, or the degradation of petroleum over time. Also for the relative comparison of materials in the chemical industry such as polymers and formulated blends such as paints, coatings, sealants, cosmetics and agrochemicals.
- the method and apparatus of invention are used to detect and characterise composition changes resulting from varying reaction conditions, errors in formulation make-up, degradation and ageing of materials as a result of environmental conditions and/or mechanical use.
Landscapes
- Chemical & Material Sciences (AREA)
- Analytical Chemistry (AREA)
- Life Sciences & Earth Sciences (AREA)
- Health & Medical Sciences (AREA)
- Immunology (AREA)
- Biochemistry (AREA)
- General Health & Medical Sciences (AREA)
- General Physics & Mathematics (AREA)
- Physics & Mathematics (AREA)
- Pathology (AREA)
- Engineering & Computer Science (AREA)
- Combustion & Propulsion (AREA)
- Food Science & Technology (AREA)
- Medicinal Chemistry (AREA)
- Analysing Materials By The Use Of Radiation (AREA)
- Other Investigation Or Analysis Of Materials By Electrical Means (AREA)
Description




Claims
Priority Applications (2)
| Application Number | Priority Date | Filing Date | Title |
|---|---|---|---|
| US14/388,911 US20150120212A1 (en) | 2012-03-30 | 2013-03-28 | Method for the investigation of differences in analytical data and an apparatus adapted to perform such a method |
| GB1414865.4A GB2514942B (en) | 2012-03-30 | 2013-03-28 | A method for the investigation of differences in analytical data and an apparatus adapted to perform such a method |
Applications Claiming Priority (2)
| Application Number | Priority Date | Filing Date | Title |
|---|---|---|---|
| GB201205720A GB201205720D0 (en) | 2012-03-30 | 2012-03-30 | A method for the investigation of differences in analytical data and an apparatus adapted to perform such a method |
| GB1205720.4 | 2012-03-30 |
Publications (2)
| Publication Number | Publication Date |
|---|---|
| WO2013144651A2 true WO2013144651A2 (en) | 2013-10-03 |
| WO2013144651A3 WO2013144651A3 (en) | 2014-02-27 |
Family
ID=46160059
Family Applications (1)
| Application Number | Title | Priority Date | Filing Date |
|---|---|---|---|
| PCT/GB2013/050840 Ceased WO2013144651A2 (en) | 2012-03-30 | 2013-03-28 | A method for the investigation of differences in analytical data and an apparatus adapted to perform such a method |
Country Status (3)
| Country | Link |
|---|---|
| US (1) | US20150120212A1 (en) |
| GB (2) | GB201205720D0 (en) |
| WO (1) | WO2013144651A2 (en) |
Citations (1)
| Publication number | Priority date | Publication date | Assignee | Title |
|---|---|---|---|---|
| US8012764B2 (en) | 2004-04-30 | 2011-09-06 | Micromass Uk Limited | Mass spectrometer |
Family Cites Families (5)
| Publication number | Priority date | Publication date | Assignee | Title |
|---|---|---|---|---|
| GB2308917B (en) * | 1996-01-05 | 2000-04-12 | Maxent Solutions Ltd | Reducing interferences in elemental mass spectrometers |
| CA2501003C (en) * | 2004-04-23 | 2009-05-19 | F. Hoffmann-La Roche Ag | Sample analysis to provide characterization data |
| FR2920235B1 (en) * | 2007-08-22 | 2009-12-25 | Commissariat Energie Atomique | METHOD FOR ESTIMATING MOLECULE CONCENTRATIONS IN A SAMPLE STATE AND APPARATUS |
| GB201019337D0 (en) * | 2010-11-16 | 2010-12-29 | Micromass Ltd | Controlling hydrogen-deuterium exchange on a spectrum by spectrum basis |
| FR2979705B1 (en) * | 2011-09-05 | 2014-05-09 | Commissariat Energie Atomique | METHOD AND DEVICE FOR ESTIMATING A MOLECULAR MASS PARAMETER IN A SAMPLE |
-
2012
- 2012-03-30 GB GB201205720A patent/GB201205720D0/en not_active Ceased
-
2013
- 2013-03-28 GB GB1414865.4A patent/GB2514942B/en active Active
- 2013-03-28 WO PCT/GB2013/050840 patent/WO2013144651A2/en not_active Ceased
- 2013-03-28 US US14/388,911 patent/US20150120212A1/en not_active Abandoned
Patent Citations (1)
| Publication number | Priority date | Publication date | Assignee | Title |
|---|---|---|---|---|
| US8012764B2 (en) | 2004-04-30 | 2011-09-06 | Micromass Uk Limited | Mass spectrometer |
Also Published As
| Publication number | Publication date |
|---|---|
| WO2013144651A3 (en) | 2014-02-27 |
| GB201205720D0 (en) | 2012-05-16 |
| GB201414865D0 (en) | 2014-10-08 |
| GB2514942A (en) | 2014-12-10 |
| US20150120212A1 (en) | 2015-04-30 |
| GB2514942B (en) | 2018-07-18 |
Similar Documents
| Publication | Publication Date | Title |
|---|---|---|
| Aguilan et al. | Guide for protein fold change and p-value calculation for non-experts in proteomics | |
| CA2641025C (en) | Overlap density (od) heatmaps and consensus data displays | |
| Karpievitch et al. | Normalization and missing value imputation for label-free LC-MS analysis | |
| US20250182855A1 (en) | Methods and systems for visualizing and evaluating data | |
| EP3584795A2 (en) | 3d mass spectrometry predictive classification | |
| US6334099B1 (en) | Methods for normalization of experimental data | |
| La Ferlita et al. | RNAdetector: a free user-friendly stand-alone and cloud-based system for RNA-Seq data analysis | |
| JP5945365B2 (en) | Method for identifying substances from NMR spectra | |
| CA2934161A1 (en) | Method and system for preparing synthetic multicomponent biotechnological and chemical process samples | |
| Smirnov et al. | Mass difference maps and their application for the recalibration of mass spectrometric data in nontargeted metabolomics | |
| Szymańska et al. | Increasing conclusiveness of clinical breath analysis by improved baseline correction of multi capillary column–ion mobility spectrometry (MCC-IMS) data | |
| CN107664655B (en) | Method and apparatus for characterizing analytes | |
| US9292742B2 (en) | 2D and 3D ion intensity image generating apparatus, method, and computer readable storage medium | |
| EP3724654B1 (en) | Method for analyzing small molecule components of a complex mixture, and associated apparatus and computer program product | |
| CN102906851A (en) | Method, computer program, and system to analyze mass spectra | |
| US20150120212A1 (en) | Method for the investigation of differences in analytical data and an apparatus adapted to perform such a method | |
| Kumar | Application of Akaike information criterion assisted probabilistic latent semantic analysis on non-trilinear total synchronous fluorescence spectroscopic data sets: Automatizing fluorescence based multicomponent mixture analysis | |
| Jin et al. | Robust discriminant analysis and its application to identify protein coding regions of rice genes | |
| EP2646811B1 (en) | Method for automatic peak finding in calorimetric data | |
| JP5866287B2 (en) | Apparatus and related methods for small molecule component analysis in complex mixtures | |
| EP4361624B1 (en) | Method for estimating content ratio of components contained in sample, composition estimating device, and program | |
| Kirchner et al. | Non-linear classification for on-the-fly fractional mass filtering and targeted precursor fragmentation in mass spectrometry experiments | |
| JP4835695B2 (en) | Chromatograph mass spectrometer | |
| Chung et al. | Non-parametric Bayesian approach to post-translational modification refinement of predictions from tandem mass spectrometry | |
| JP2013506843A5 (en) |
Legal Events
| Date | Code | Title | Description |
|---|---|---|---|
| 121 | Ep: the epo has been informed by wipo that ep was designated in this application |
Ref document number: 13716822 Country of ref document: EP Kind code of ref document: A2 |
|
| ENP | Entry into the national phase |
Ref document number: 1414865 Country of ref document: GB Kind code of ref document: A Free format text: PCT FILING DATE = 20130328 |
|
| WWE | Wipo information: entry into national phase |
Ref document number: 1414865.4 Country of ref document: GB |
|
| WWE | Wipo information: entry into national phase |
Ref document number: 14388911 Country of ref document: US |
|
| 122 | Ep: pct application non-entry in european phase |
Ref document number: 13716822 Country of ref document: EP Kind code of ref document: A2 |