WO2013090613A1 - Compositions and methods for functional quality control for human blood-based gene expression products - Google Patents
Compositions and methods for functional quality control for human blood-based gene expression products Download PDFInfo
- Publication number
- WO2013090613A1 WO2013090613A1 PCT/US2012/069561 US2012069561W WO2013090613A1 WO 2013090613 A1 WO2013090613 A1 WO 2013090613A1 US 2012069561 W US2012069561 W US 2012069561W WO 2013090613 A1 WO2013090613 A1 WO 2013090613A1
- Authority
- WO
- WIPO (PCT)
- Prior art keywords
- rna
- sample
- fwd
- rvs
- avg
- Prior art date
- Legal status (The legal status is an assumption and is not a legal conclusion. Google has not performed a legal analysis and makes no representation as to the accuracy of the status listed.)
- Ceased
Links
Classifications
-
- C—CHEMISTRY; METALLURGY
- C12—BIOCHEMISTRY; BEER; SPIRITS; WINE; VINEGAR; MICROBIOLOGY; ENZYMOLOGY; MUTATION OR GENETIC ENGINEERING
- C12Q—MEASURING OR TESTING PROCESSES INVOLVING ENZYMES, NUCLEIC ACIDS OR MICROORGANISMS; COMPOSITIONS OR TEST PAPERS THEREFOR; PROCESSES OF PREPARING SUCH COMPOSITIONS; CONDITION-RESPONSIVE CONTROL IN MICROBIOLOGICAL OR ENZYMOLOGICAL PROCESSES
- C12Q1/00—Measuring or testing processes involving enzymes, nucleic acids or microorganisms; Compositions therefor; Processes of preparing such compositions
- C12Q1/68—Measuring or testing processes involving enzymes, nucleic acids or microorganisms; Compositions therefor; Processes of preparing such compositions involving nucleic acids
- C12Q1/6844—Nucleic acid amplification reactions
- C12Q1/6851—Quantitative amplification
-
- G—PHYSICS
- G16—INFORMATION AND COMMUNICATION TECHNOLOGY [ICT] SPECIALLY ADAPTED FOR SPECIFIC APPLICATION FIELDS
- G16B—BIOINFORMATICS, i.e. INFORMATION AND COMMUNICATION TECHNOLOGY [ICT] SPECIALLY ADAPTED FOR GENETIC OR PROTEIN-RELATED DATA PROCESSING IN COMPUTATIONAL MOLECULAR BIOLOGY
- G16B40/00—ICT specially adapted for biostatistics; ICT specially adapted for bioinformatics-related machine learning or data mining, e.g. knowledge discovery or pattern finding
- G16B40/20—Supervised data analysis
-
- C—CHEMISTRY; METALLURGY
- C12—BIOCHEMISTRY; BEER; SPIRITS; WINE; VINEGAR; MICROBIOLOGY; ENZYMOLOGY; MUTATION OR GENETIC ENGINEERING
- C12Q—MEASURING OR TESTING PROCESSES INVOLVING ENZYMES, NUCLEIC ACIDS OR MICROORGANISMS; COMPOSITIONS OR TEST PAPERS THEREFOR; PROCESSES OF PREPARING SUCH COMPOSITIONS; CONDITION-RESPONSIVE CONTROL IN MICROBIOLOGICAL OR ENZYMOLOGICAL PROCESSES
- C12Q1/00—Measuring or testing processes involving enzymes, nucleic acids or microorganisms; Compositions therefor; Processes of preparing such compositions
- C12Q1/68—Measuring or testing processes involving enzymes, nucleic acids or microorganisms; Compositions therefor; Processes of preparing such compositions involving nucleic acids
- C12Q1/6876—Nucleic acid products used in the analysis of nucleic acids, e.g. primers or probes
-
- G—PHYSICS
- G16—INFORMATION AND COMMUNICATION TECHNOLOGY [ICT] SPECIALLY ADAPTED FOR SPECIFIC APPLICATION FIELDS
- G16B—BIOINFORMATICS, i.e. INFORMATION AND COMMUNICATION TECHNOLOGY [ICT] SPECIALLY ADAPTED FOR GENETIC OR PROTEIN-RELATED DATA PROCESSING IN COMPUTATIONAL MOLECULAR BIOLOGY
- G16B25/00—ICT specially adapted for hybridisation; ICT specially adapted for gene or protein expression
-
- G—PHYSICS
- G16—INFORMATION AND COMMUNICATION TECHNOLOGY [ICT] SPECIALLY ADAPTED FOR SPECIFIC APPLICATION FIELDS
- G16B—BIOINFORMATICS, i.e. INFORMATION AND COMMUNICATION TECHNOLOGY [ICT] SPECIALLY ADAPTED FOR GENETIC OR PROTEIN-RELATED DATA PROCESSING IN COMPUTATIONAL MOLECULAR BIOLOGY
- G16B25/00—ICT specially adapted for hybridisation; ICT specially adapted for gene or protein expression
- G16B25/10—Gene or protein expression profiling; Expression-ratio estimation or normalisation
-
- G—PHYSICS
- G16—INFORMATION AND COMMUNICATION TECHNOLOGY [ICT] SPECIALLY ADAPTED FOR SPECIFIC APPLICATION FIELDS
- G16B—BIOINFORMATICS, i.e. INFORMATION AND COMMUNICATION TECHNOLOGY [ICT] SPECIALLY ADAPTED FOR GENETIC OR PROTEIN-RELATED DATA PROCESSING IN COMPUTATIONAL MOLECULAR BIOLOGY
- G16B40/00—ICT specially adapted for biostatistics; ICT specially adapted for bioinformatics-related machine learning or data mining, e.g. knowledge discovery or pattern finding
-
- C—CHEMISTRY; METALLURGY
- C12—BIOCHEMISTRY; BEER; SPIRITS; WINE; VINEGAR; MICROBIOLOGY; ENZYMOLOGY; MUTATION OR GENETIC ENGINEERING
- C12Q—MEASURING OR TESTING PROCESSES INVOLVING ENZYMES, NUCLEIC ACIDS OR MICROORGANISMS; COMPOSITIONS OR TEST PAPERS THEREFOR; PROCESSES OF PREPARING SUCH COMPOSITIONS; CONDITION-RESPONSIVE CONTROL IN MICROBIOLOGICAL OR ENZYMOLOGICAL PROCESSES
- C12Q2600/00—Oligonucleotides characterized by their use
- C12Q2600/166—Oligonucleotides used as internal standards, controls or normalisation probes
Definitions
- This invention relates the fields of molecular biology and quality control maintenance of samples stored in biorepositories. More specifically, the methods of the invention provide a high-throughput, automatable process for assessing and characterizing the integrity of RNA samples utilized in large-scale gene expression studies or biorepositories, significantly limiting sample replicate variability and technical error.
- RNA integrity prior to gene expression analysis on platforms such as microarrays and real-time quantitative PCR proves to be a critical step, requiring a highly sensitive and standardized RNA quality control method [1].
- RNA Integrity Number RIN
- a method for reproducibly assessing the integrity of an RNA sample in a high through put manner is provided.
- the method for quantitatively evaluating the extent of RNA degradation in a RNA sample obtained from a tissue or blood specimen entails identifying a candidate gene set specific to said tissue or blood specimen, and determining an arbitrary expression score for each gene present in said set, and sorting said genes into at least two tiers based on said expression score.
- a plurality of amplification plots and Cx profiles from the set of candidate genes encoding RNAs exposed to differential degradation conditions are then generated, thereby providing a series of differentially weighted Cx profiles correlating to the degradation state of said RNA, said scores corresponding to intact and incrementally degraded RNAs.
- the test sample is subjected to qPCR, and an amplification plot and a Cx, score generated. The Cx score of the sample is then correlated with those previously determined, thereby providing the degree of degradation of said sample.
- sample or “biological sample” as used herein is used in its broadest sense.
- a sample is derived from a specimen from any source that contains or may contain a molecule of interest (e.g., RNA), including any specimen that is collected from or is associated with a biological or environmental source, or which comprises or contains biological material, whether in whole or in part, and whether living or dead.
- RNA molecule of interest
- Samples or biological samples may be plant or animal, including human, fluid (e.g., blood or blood fractions, urine, saliva, sputum, cerebral spinal fluid, pleural fluid, milk, lymph, or semen), swabs (e.g., buccal or cervical swabs), solid (e.g., stool), microbial cultures (e.g., plate or liquid cultures of bacteria, fungi, parasites, protozoans, or viruses), or cells or tissue (e.g., fresh or paraffin-embedded tissue sections, hair follicles, mouse tail snips, leaves, or parts of human, animal, plant, microbial, viral, or other cells, tissues, organs or whole organisms, including subcellular fractions or cell extracts), as well as liquid and solid food and feed products and ingredients such as dairy items, vegetables, meat and meat by-products, agricultural materials, and waste.
- fluid e.g., blood or blood fractions, urine, saliva, sputum, cerebral spinal fluid, pleural fluid
- Biological samples may be obtained from all of the various families of domestic plants or animals, as well as wild animals or plants.
- the sample comprises or consists of one or more whole cells from a specimen, such as from a fixed or paraffin-embedded formalin-fixed (“FFPE") section, or cells, such as human, animal, plant, or microbial cells grown in culture (e.g., human, animal, or plant cells obtained by fluorescent-activated cell sorting ("FACS”), or replica-plated bacteria or yeast).
- FFPE paraffin-embedded formalin-fixed
- FACS fluorescent-activated cell sorting
- Environmental samples include environmental material such as surface matter, soil, water, air, or industrial samples, as well as samples obtained from food and dairy processing instruments, apparatus, equipment, utensils, disposable and non-disposable items. These examples are not to be construed as limiting the sample types applicable to the present invention.
- the candidate genes are isolated from a tissue selected from the group consisting of breast tissue, colon tissue, lung tissue, kidney tissue, ovarian tissue, liver tissue, muscle tissue, brain tissue, and stomach tissue.
- RNA quality as a function of the magnitude of deviation from an expected Ct value. This approach enables the researcher to properly weigh or exclude subpar samples from subsequent analysis.
- processors and devices that carry out any of the methods described herein.
- such systems or devices employ a computer processor employing a computer memory and/or computer readable medium.
- processor and “central processing unit” or “CPU” are used interchangeably and refer to a device that is able to read a program from a computer memory (e.g., ROM or other computer memory) and perform a set of steps according to the program.
- Devices include, but are not limited to desktop computers, hand-held computers (including pads, phones, and other similar devices), and scientific instruments (e.g., thermocyclers, detection devices, mass spectrometers, etc.).
- the systems and devices employ software configured to carry out the data analysis approaches described herein.
- the systems and devices further employ one or more databases or are in communication with such databases that are housed on a separate device or data storage system (e.g., cloud).
- RNA degradation in a sample comprising; a) identifying a candidate gene set and determining an arbitrary expression score for each gene present in said set, said gene set being specifically expressed in said tissue or said blood specimen and sorting said genes into at least two tiers based on said expression score; b) generating a plurality of amplification plots and Cx profiles from a set of candidate genes encoding RNAs exposed to differential degradation conditions thereby providing a series of differentially weighted Cx profiles correlating to the degradation state of said RNA, said scores corresponding to intact and incrementally degraded RNAs; and c) subjecting RNA in said sample to quantitative amplification, thereby generating an amplification plot and a Cx score; said Cx score being correlated with those determined in step b) said score providing the degree of degradation of said sample.
- the sample can be of any type including environmental samples, samples obtained from a human, tissue samples, fluid samples, whole blood,
- the method is coupled with screening or diagnostic techniques for assessing any desired genotype or phenotype, including disease status and progression, general health status, and response to diet, therapeutics, or other stimuli.
- the method further comprises the step of d) analyzing a gene expression profile employing the sample.
- the method further comprises the step of e) assessing disease status or progression using the gene expression profile.
- the method further comprises the step of d) discarding the sample without conducting a gene expression profile analysis if the degree of degradation is unsuitable (e.g., is of a degree in which a screening or diagnostic test will lack the required or desired level of sensitivity or specificity).
- a system or device comprises a computer processor that generates the plurality of amplification plots and Cx profiles.
- Such systems can include any component useful, necessary, or sufficient for processing the sample, detecting the sample, analyzing the data, and/or using the data.
- Such components include, but are not limited to thermocyclers, sample processing components (e.g., that purify or isolate RNA from cells or tissues or other sample types), detection components (e.g., that mass, optical signals, heat, pH changes, radioactivity, or other detectable signals), and the like.
- Figure 1 Mechanisms of messenger RNA degradation by RNases.
- (a) 5' to 3 ' exonuclease activity removes the 7-methyl guanosine cap and degrades RNA in a 5' to 3' direction
- (b) 3' to 5' exonuclease activity removes the poly-A tail and degrades RNA in a 3' to 5' direction
- Figure 2 Typical qPCR amplification plot, ARn vs. Cycle.
- a measure of accumulating PCR products the magnitude of fluorescence (ARn) is plotted against the PCR amplification cycle number (Cycle).
- the threshold line, in red, is set at the middle of the linear phase of the plot, defining the C T value for a given qPCR reaction.
- Figure 3 Visualizing 28S and 18S ribosomal subunits on gels and electropherograms.
- the image on the left represents a typical electropherogram: the right peak depicts the 28S ribosomal subunit and the left peak depicts the 18S ribosomal subunit.
- the image on the right is a corresponding gel image, the top band depicting the 28S subunit and the bottom band depicting the 18S subunit. Image taken from uschel 2000 [25].
- FIG. 4 GeneNote and BioGPS expression data.A representative gene expression data plot generated for numerous experimental tissue vectors. The example shown below represents the GAPDH gene. Image taken from the GeneCards® website (www dot genecards dot org).
- ProbeFinder Roche UPL ProbeFinder assay design.
- ProbeFinder software designs UPL assays based on an input target gene; below is one possible assay design for the CD27 gene.
- ProbeFinder outputs forward and reverse primer sequences flanking the UPL probe of choice, shown in the 'Detailed view' as green and purple text, respectively. Image taken from the ProbeFinder website (www dot roche-applied-science dot com backslash sis backslash rtpcr backslash upl).
- Figure 6 Comparison of ideal and poor amplification plots.
- Figure on left an ideal, tight amplification plot for the CAPN2 5' assay; limited expression variability exists between different subjects.
- Figure on right a dispersed amplification plot for the TRPM2 3' assay; demonstrates great variability between different subjects.
- Sample quality control is central to applied, and clinical genomic analyses. Most sample processing is decentralized, which leads to differential results between laboratories. Thus, in accordance with the present invention, an efficient protocol for QC of each unique sample has been developed and standardized. While QC of RNA from whole blood samples is exemplified herein, the methods described can be applied to a variety of sample sources. The research to develop such a technology is best developed in a biorepository setting where thousands of samples are processed every month. The Rutgers University Cell and DNA Repository currently employs a QC protocol for all human genomic DNA samples that uses a custom-designed SNP genotyping assay panel to determine gender, ethnicity, uniqueness, and sample quality.
- Real-time quantitative polymerase chain reaction (qPCR) assays offer a more sensitive, modifiable method for quantitatively evaluating the extent of RNA degradation. Fluorescent probe-based assays can be customized to a specific tissue type or field of research by modifying the target genes. Additionally, this method offers a high-throughput, automatable solution for large-scale gene expression studies or biorepositories, significantly limiting sample replicate variability and technical error.
- qPCR quantitative polymerase chain reaction
- RNA degradation is a hindrance to gene expression research, it is a ubiquitous and controlled activity in vivo. Within the cell, active RNA degradation systems are in place to regulate RNA production and decay in order to maintain a steady-state level of RNA messages and their successive proteins. Misfolded or otherwise defective RNA molecules are rapidly degraded by cellular surveillance machinery [4]. In addition, it has been suggested that RNA-degrading enzymes, RNases, can confer protection from viruses by reducing viral replication and protein synthesis [5, 6]. Intact cells tightly control the essential activities of RNases, but when cells are disrupted during sample collection and RNA extraction, these endogenous cellular RNases are immediately released and can begin to break down RNA molecules.
- RNA molecules Identified by the direction of degradation along an RNA molecule, three major classes of RNases exist in eukaryotes: (1) 5' to 3' exonucleases, (2) 3' to 5' exonucleases, and (3) endonucleases, which cleave RNA internally [2].
- endonucleases which cleave RNA internally [2].
- nascent messenger RNA molecules are modified with protective structures on both ends that serve to maintain stability as mature messenger RNA is translated to protein.
- messenger RNA is transcribed, a methylated guanine cap is added to the 5' end of the molecule and a stretch of 150-200 adenine residues is added to the 3' end of the molecule, forming the poly-A tail [8].
- Exoribonucleases target the 5' cap or 3' poly-A tail as points of entry, while endoribonucleases can initiate degradation at specific sites within the molecule.
- Figure 1 depicts three mechanisms of
- RNA samples can be collected or stored in a variety of ways, all of which introduce inherent risk of RNA degradation.
- Formalin-fixed paraffin-embedded (FFPE) tissue samples are routinely used for disease diagnosis and provide a long-term sample storage solution.
- FFPE paraffin-embedded
- fresh samples can be collected from tissue biopsies or whole blood drawings for immediate processing, eliminating the fixation and storage limitations of FFPE tissue samples.
- these samples must be immediately and adequately stabilized by immersion in a proprietary reagent that protects RNA from endogenous ribonuclease degradation and minimizes post-collection gene induction [JJJ.
- RNA degradation Regardless of the collection method chosen, variability in RNA extraction techniques and mishandling by technicians further introduces opportunities for RNA degradation.
- the latency period and conditions between collection and processing, conditions of the extraction process such as time lapse and temperature, and inadvertent contamination with ubiquitous RNases present on lab surfaces, gloves, and skin are common sources of RNA degradation
- RNA degradation Prior to running an RNA sample on a gene expression platform, it must first be reverse transcribed to stable complementary DNA (cDNA).
- cDNA is synthesized from a messenger RNA template and serves as the input molecule for gene expression analysis platforms. Demonstrating a ripple-effect, if the messenger RNA template is degraded and of low quality, the cDNA synthesized from it will follow suit, resulting in skewed gene expression data that does not accurately portray the gene expression products present within a given sample at the time of RNA extraction.
- qPCR Real-time quantitative PCR
- Designing qPCR assays is a flexible and customizable process, allowing for the design of highly specific assay panels. For high-throughput studies or processes, the reaction set up can be fully automated for more accurate results and more consistent technical replicates.
- the qPCR workflow consists of three steps: (1) the reverse transcriptase-mediated conversion of labile RNA to stable cDNA, (2) the amplification of cDNA using the polymerase chain reaction (PCR), and (3) the realtime detection and quantification of amplification products [18].
- Individual qPCR reactions consist of or comprise the following components: (1) cDNA template, (2) gene expression master mix, (3) forward and reverse primers, (4) a fluorescent probe, and (5) DNase/RNase-free water.
- Master mix contains the components necessary for the DNA synthesis machinery, primarily thermo-stable DNA polymerase.
- Primers are short, specific oligonucleotides which hybridize to a DNA template and serve as a start point for DNA synthesis.
- Forward and reverse primers are used for amplification of both DNA template strands and can be designed to target a specific region for amplification.
- the probe is a short oligonucleotide labeled with a fluorescent reporter at one end and a fluorescence quencher at the opposite end.
- the probe hybridizes to the complementary sequence of the DNA template, proximal to and downstream of one of the hybridized primers. Due to the close proximity of the fluorescent moiety and quencher, a fluorescent signal is dampened until the amplification process begins. As the target PCR product is synthesized, the probe is cleaved by the 5' to 3' exonuc lease activity of DNA polymerase. Breaking the close proximity of the fluorophore and quencher emits a detectable fluorescent signal upon excitation by a laser within the PCR instrument 19].
- CT cycle threshold
- C T values are inversely related to the level of gene expression of the target gene: the greater the amount of target sequence present in the starting cDNA, the earlier the cycle at which fluorescence intensity surpasses the threshold, generating a lower C T value [18], Once generated, depending upon the application and objectives of the study, CT values are then analyzed with established statistical methods.
- Figure 2 depicts a typical qPCR amplification plot and threshold line. qPCR offers sensitive and reliable gene expression quantification, yet it is not without potential drawbacks stemming from lack of standardization at steps within the workflow.
- RNA sample quality is arguably the most important, followed by assay design efficiency, choice of chemistry, linearity during reverse transcription, and threshold determination [18, 20, 21].
- assays will henceforth be defined as a primer set/probe pairing.
- the variables of sample quality and assay design go hand-in-hand when considering the effects of degraded starting material on gene expression quantification. For instance, RNase activity is dictated by a directionally-driven mechanism: RNases move in a 5' to 3' direction, 3' to 5' direction, or attack at specific sequences of a transcript and cleave the molecule at that point.
- a given transcript may no longer contain the region for which an assay was designed, thus under-representing expression level of the target gene.
- This under-representation corresponds to a higher CT value, as the amount of starting material is smaller and the threshold takes longer to surpass.
- the location of the primer and probe sequences is critical. Assays designed proximal to the 3' or 5' ends of the molecule will be at greater risk for failure as they are the entry points for exoribonucleases, whereas assays designed in the middle region are prone to failure due to endoribonuclease degradation activity. Multiple assays per gene should be designed in order to compare regional efficacy. To choose optimal assays from a large candidate pool, a validation study must be conducted to eliminate assays that fail due to poor primer/probe hybridization, large variations in CT between RNA samples from different subjects, or significant expression level inconsistencies between regional assays of the same target gene.
- RNA degradation is tolerated without significantly impacting gene expression data, yet beyond which gene expression analysis is adversely impacted by sample degeneration [13, 14, 22, 23] .
- CT increase for a degraded sample as compared to an expected C value of a control sample, can potentially be used to weight the reliability of gene expression data for a given sample and allow for appropriate inclusion or exclusion of variably degraded RNA samples in a study.
- RNA integrity assessment tools each have inherent strengths and weaknesses, and each looks at different RNA structural features to determine quality.
- the three most common methods used to evaluate RNA integrity will be discussed for comparison: (1) Ratio method: measuring the ratio between the 28S and 18S ribosomal RNA (rRNA) subunit electrophoresis bands, (2) Manual method: subjective evaluation of an electropherogram, and (3) RNA Integrity Number (RIN): objective evaluation of an electropherogram [2]. All of these methods rely on measurements generated by an electrophoretic RNA separation system, such as the Agilent 2100 Bioanalyzer and corresponding RNA 6000 LabChip® kit.
- the Bioanalyzer combines disposable microfmidic chips, voltage-induced size separation, and laser-induced fluorescence quantification on a small scale, with the capacity to process 12 samples in approximately 30 minutes [24, 25]. Data is visualized within the software as electropherograms and simulated gel electrophoresis images, while RNA concentration, RNA area, and 28S/18S ratios are quantitatively reported.
- the 28S/18S rRNA ratio method uses agarose gel electrophoresis stained with ethidium bromide to produce a banding pattern representing the 28S and 18S ribosomal RNA species [3]. More recently, physical gels have been replaced by microfluidics chips. Though the concept remains the same, Bioanalyzer software generates simulated gel images and electropherograms from the data it collects during RNA separation. The intensities of the 28S and 18S bands are used to calculate a ratio reflecting RNA integrity.
- Band intensity and electropherogram peak amplitude are based on the size of the ribosomal subunit; the larger the molecule, the more intercalating dyes bind to it, hence a stronger intensity displayed by the larger 28S subunit.
- Figure 3 depicts typical 28S and 18S visualizations on both a gel and an electropherogram. On a gel or gel image, a ratio of 2.0 or greater indicates good to high quality RNA, while an electropherogram peak ratio of > 0.65 is considered high quality [2, 3]. The determination of a 28S/18S ratio via physical gel electrophoresis has been largely replaced by microcapillary gel electrophoresis due to the subjectivity involved with determining band intensity ratios.
- RNA degradation indicator [26].
- Bioanalyzer digital ratio calculation removes subjectivity, it also has drawbacks. Bioanalyzer calculation of the 28S/18S ratio is based on peak area measurements that are heavily dependent on exact definition of the start and end points of the peak, and even accurate determination of this ratio is not sufficient to detect RNA degradation [27].
- the manual method of evaluating RNA integrity involves visual inspection of an electropherogram, specifically looking at the 28S and 18S peaks of an electropherogram.
- a high quality RNA sample is characterized by distinct 28S and 18S peaks and a flat baseline. With increased degradation, there is a decrease in the 18S to 28S ribosomal band ratio and an increase in the baseline signal between the two ribosomal peaks and the lower marker, while additional peaks begin to appear in the small RNA range as short degradation products accumulate [27, 28].
- this method is subjective and prone to variability, but may have utility if used in conjunction with a secondary validation method to determine the extent of RNA degradation.
- RNA Integrity Number (RIN) algorithm was later developed and integrated into the Bioanalyzer software.
- the RIN algorithm is based on a selection of features that contribute different information about RNA quality, taking into account that a single feature is insufficient to universally evaluate RNA degradation.
- the features incorporated into the RIN algorithm are: (1) the fraction of area beneath the 28S and 18S peaks as compared to total area, reflecting the proportion of large molecules compared to smaller ones, (2) the amplitude of the 28S peak, which correlates with the onset of degradation, (3) the 'fast area' ratio, referring to the degradation peaks observed between the marker and 18S peaks of increasingly degraded RNA, and (4) marker height, an indicator for accumulation of short degradation products [3J.
- the RIN algorithm cannot predict the quality of downstream gene expression data without prior validation work; that is, an RNA sample might be too degraded for use in a microarray study, but might deliver good qPCR data [28, 29].
- the inadequate predictive utility of the RIN algorithm in terms of forecasting sample performance on a range of gene expression platforms, limits its value as an RNA quality control method and creates a niche in the market for a more sensitive quality control analytical tool.
- qPCR assays offer a highly sensitive, reproducible, and customizable quality control method. Already used to confirm and validate gene expression data generated by microarrays, using qPCR as a means to evaluate both RNA integrity and functional potential in one concerted effort is a natural extension of the technology [16, 32].
- qPCR assays are highly customizable and assay panels can be specifically designed based on tissue type or area of research based on the target genes chosen. Reaction setup can be automated to eliminate human pipetting error, ensure reproducibility, and allow for high-throughput quality control screening. Additionally, a qPCR quality control method addresses the needs of high-throughput laboratories by eliminating the need for additional costly instruments, consumables, and kits necessitated by other technologies.
- RNA degradation suggests that correlations may be drawn between transcript integrity and gene expression level for a target gene, as compared to an expected expression baseline.
- assay-centric class distinction algorithms can be developed and collectively considered to quantify the quality of RNA samples. The following work describes the development of a novel functional quality control method for RNA samples extracted from human whole blood, consisting of a custom gene expression assay panel and complementary class distinction algorithms.
- a pool of over 1,400 genes expressed in human whole blood was generated from literature and public database searches, primarily genome-wide analysis studies and the Weizmann Institute's GeneCards® online database (www dot genecards dot org) [33-351. Providing a complete summary for each gene, the GeneCards® human gene database acquires and compiles transcriptomic, genetic, proteomic, and functional information from relevant publications and public databases, including Weizmann Institute's own tissue- specific microarray expression data.
- Candidate genes were selected from the pool based on adherence to the following criteria: (1) the gene must be measurably expressed in human whole blood cells, (2) the gene must be expressed in a non-disease state, with limited potential for expression variability between whole blood samples from different donors, and (3) the gene must be central to blood cell structure or function (i.e. not an immediate early gene) [36].
- the final assay panel must be suited to accommodate samples from a broad range of subjects, controlling for disease states, immune challenge, and expression variability between subjects. Taking these variables into account, candidate genes were limited to normal-state, non-transient genes involved in white blood cell structure or function, as indicated by the GeneCards® database.
- GeneNote an arbitrary expression score (0-10,000) was assigned to each gene on the candidate list.
- GeneNote data was compiled from two sources: Weizmann Institute high- density DNA microarray data and BioGPS, a gene annotation portal (biogps dot gnf dot org) [37-39], Expression data is presented within GeneNote as a log-scale plot of normalized expression intensity across a range of healthy human tissues, as depicted in Figure 4.
- a comprehensive master list was compiled of all candidate genes, their functions as provided by the GeneCards®, Entrez Gene, and UniProtKB/Swiss-Prot databases, and expression scores provided by the GeneNote database. The list was ordered by expression score and a total of 62 genes, 10 from each expression tier and 2 control genes, were chosen for the assay design phase, as presented in Appendix I. The decision to include a gene in the design phase was primarily determined by gene function. Genes with a role in cell structure or function were highly preferred over genes with speculative functional roles or genes expressed during periods of immune system challenge or disease, as they are less variably expressed between individuals and are temporally stable.
- ProbeFinder is a web-based software tool that designs optimal primer set/probe pairings for a user-defined gene of interest.
- a total of 184 intron-spanning assays were designed with ProbeFinder: three designs per 60 genes of interest and two designs per 2 control genes. For each gene of interest, an optimal assay was designed for the 5', middle, and 3' regions. For control genes, ACTB and GAPDH, optimal assays were designed only for the 5' and 3' regions. Assay designs, consisting of forward and reverse primers and the corresponding UPL probe, were exported from the software and are presented in Appendix II. Primers were custom ordered from Sigma according to the following specifications: shipment in a 96-well plate format, purification by standard desalting, and lyophilized forward and reverse primer sets (20 nM each) were to be combined in a single well. ASSAY VALIDATION
- the lyophilized primer sets 20 nM each of both forward and reverse primers per assay design, were reconstituted with 200 ⁇ DNase/R ase-free water for a standard stock solution of 100 ⁇ . From the stock solution, working 1 :5 dilutions were prepared on a Biomek FX liquid handling instrument (Beckman Coulter) for use in subsequent qPCR reactions. Sample Collection and Automated RNA Extraction
- PAXgene® Blood RNA tubes Fresh human whole blood samples were collected in PAXgene® Blood RNA tubes (Qiagen/PreAnalytiX), according to manufacturer specifications.
- PAXgene® Blood RNA tubes contain a proprietary RNA stabilization reagent that protects RNA molecules from RNase degradation during cell lysis and minimizes gene induction post-collection [431. Blood samples were drawn from five healthy donors, totaling two PAXgene® Blood RNA tubes per subject, with 2.5 ml of whole blood drawn per collection tube. Tube sets were labeled A-E to ensure donor anonymity. One set of donor tubes was stored at -20°C for later extraction while the remaining set of tubes was processed immediately.
- RNA quality data is presented in Appendix ⁇ .
- RNA was reverse transcribed to cDNA, which was then amplified using the Ovation Pico WTA System (NuGEN) on a Biomek FX liquid handling instrument according to the manufacturer's protocol.
- cDNA yield and purity was assessed using Nanodrop ND-8000 spectrophotometric measurements.
- cDNA integrity was assessed with LabChip 90 HT RNA electropherogram and gel electrophoresis images.
- cDNA quality data is presented in Appendix IV. Working dilutions of 1 :200 cDNA were prepared with DNase/RNase-free water for use in subsequent qPCR reactions.
- CT values were grouped by assay then sub-grouped by sample for descriptive statistical analysis. For each assay, the statistical average and standard deviation of triplicate CT values per sample was calculated. Additionally, for each assay, a statistical average and standard deviation of CT values per all samples was calculated, as presented in Appendix VI. Outlying C T values below 15 and above 38.5 were excluded from all calculations due to experimental error or assay failure, and NTC CT values were checked for evidence of contamination. To better evaluate assay performance, the descriptive statistical data was visualized with histogram plots. Histograms were plotted to compare assay performance between individual samples per given assay; all regional assays for a given gene were plotted on the same histogram to reveal local biases, as presented in Appendix VII. To compare performance across all 184 assays, the overall average Rvalue and overall standard deviation of all four samples per given assay were plotted on a single histogram. Histogram plots were used to determine gene expression consistency across regional assay designs for a given gene.
- RNA integrity was assessed for each aliquot using the RNA 6000 Nano LabChip® kit on a Bioanalyzer 2100 instrument (Agilent); electropherogram and gel electrophoresis images are presented in Appendix IX.
- RNA integrity was assessed for each aliquot using the RNA 6000 Nano LabChip® kit on a Bioanalyzer 2100 instrument; electropherogram and gel electrophoresis images are presented in Appendix IX.
- RNase A treatments consisted of exposing native RNA aliquots to an optimal dilution of stock RNase A solution (Qiagen). The enzymatic reaction was stopped at set time points with optimally diluted SUPERase-ln (Ambion), a multiple RNase inhibitor. Several attempts to optimize dilutions and exposure periods resulted in completely degraded RNA before a final RNase A dilution of 1 :5,000,000 and SUPERase-ln dilution of 1 :2 produced measurable, incrementally degraded RNA [46, 47].
- RNA integrity was assessed for each aliquot using the RNA 6000 Nano LabChip® kit on a Bioanalyzer 2100 instrument; electropherogram and gel electrophoresis images are presented in Appendix IX. Based on the graded degradation patterns produced by the RNase A treatment, this method was chosen for subsequent degradation testing.
- RNA purification step was performed after the RNase inactivation step to ensure the degradation process would not continue to fragment the RNA beyond the desired inactivation time point.
- TRIzol® reagent Invitrogen
- chloroform Invitrogen
- TRIzol® reagent containing phenol and guanidine isothiocyanate, is often used prior to RNA extraction and purification protocols to maintain RNA integrity during the extraction process [48].
- the aqueous layer, containing stabilized RNA was transferred to a fresh microfuge tube and purified with an RNeasy Mini Kit (Qiagen), according to the manufacturer's protocol.
- the RNeasy Mini Kit is a system for RNA extraction and purification that binds RNA to a silica-membrane spin column, purifying the bound RNA through a series of buffer washes and centrifugation steps [49].
- RNA yield net loss was expected as a result of adding an additional purification step.
- the secondary RNase inactivation step was performed on native RNA. Once satisfied that RNA yield would not be compromised, the RNase A treatment of samples was followed by the secondary RNase inactivation step described previously for all subsequent testing.
- Nanodrop ND-8000 (Thermo Fisher) and Bioanalyzer 2100 yield and quality data are presented in Appendix X. Manual RNA Extraction and Experimental Degradation
- RNA was manually extracted from the second set of frozen blood samples using a PAXgene® Blood RNA Kit (Qiagen), according to the manufacturer's protocol. As opposed to the automated method, manually extracting the RNA provided a greater overall yield, necessary for running multiple degradation conditions and subsequent qPCR reactions. RNA yield and purity was assessed using Nanodrop ND-8000 spectrophotometric measurements. RNA integrity was assessed for each sample with electropherogram and gel electrophoresis images on a Bioanalyzer 2100, as presented in Appendix XI. Manually extracted RNA sample 'D' was arbitrarily chosen for experimental degradation by R ase A according to the optimized two-step method previously outlined.
- RNA yield and purity was assessed using Nanodrop ND-8000 spectrophotometry measurements.
- RNA integrity was assessed for each aliquot with electropherogram and gel electrophoresis images on a Bioanalyzer 100, as presented in Appendix XII.
- RNA aliquots were reverse transcribed to cDNA, which was then amplified using the Ovation Pico WTA System (NuGEN) on a Biomek FX liquid handling instrument according to the manufacturer's protocol.
- cDNA yield and purity was assessed using Nanodrop ND-8000 spectrophotometric measurements.
- cDNA integrity was assessed with LabChip 90 HT RNA electropherogram and gel electrophoresis images (Caliper Life Sciences).
- cDNA quality data is presented in Appendix XIII. Working dilutions of 1 :200 cDNA were prepared with DNase/RNase-free water for use in subsequent qPCR reactions.
- Incrementally Degraded RNA Real-time Quantitative PCR
- C T values were grouped by assay then sub-grouped by sample for descriptive statistical analysis. For each assay, the statistical average and standard deviation of triplicate CT values per sample was calculated. Additionally, for each assay, a statistical average and standard deviation of C T values per all samples was calculated, as presented in Appendix XV. Outlying CT values below 15 and above 38.5 were excluded from all calculations due to experimental error or assay failure, and NTC CT values were checked for evidence of contamination. To better evaluate assay performance, the descriptive statistical data was visualized with histogram plots. Histograms were plotted to compare assay performance between individual samples per given assay; all regional assays for a given gene were plotted on the same histogram to reveal local biases, as presented in Appendix XVI.
- RNA quality control method assessing RNA extracted from human whole blood samples. Designed to work in concert, the custom gene expression assay panel and set of class distinction algorithms provide an overall RNA quality score capable of predicting future performance on gene expression platforms. Setting it apart from current analytical quality control methodologies, this method relies on dynamic gene expression data rather than static measurements of RNA size, providing a more appropriate assessment of anticipated performance quality.
- Assays were designed using Roche ProbeFinder software, which provided forward and reverse primer sequences and a corresponding Universal Probe Library (UPL) probe per gene queried. All efforts were made to choose designs located precisely at the 3', middle, and 5' regions of a transcript; however, designs were limited to the regions of the transcript with sequences compatible with one of the 165 possible UPL probes. Additionally, all efforts were made to choose the highest quality assay as determined by the software's in silico PCR rating. As was the case with a number of genes, for instance, the 5 '-most assay design may be located closer to the middle of the transcript than the 5' end; in these cases, the most optimal assay design available was chosen.
- assay performance was based on three criteria: (1) consistency across all regional assays of a gene, (2) amplification plot homogeneity, also reflected in standard deviations, and (3) conformity to expected gene expressivity, as established by GeneNote values.
- For regional assay consistency a score of 0, 2, or 3 was given to assays designed for the same gene, reflecting the number of assays that expressed at approximately the same level.
- variations in assay performance are possible and might account for why two assays out of three were consistent, yet the third may have simply been a poorly designed assay.
- Amplification plots for individual assays were assessed subjectively, emphasis being placed on tight plots with little variation between samples from different subjects. To be used as a universal quality control method, it was important to limit expression variability between samples taken from different subjects. Assays were scored individually, either presenting tight or dispersed plots. Figure 6 shows the difference between an ideal plot versus a plot that showed great variability between samples from different subjects.
- GeneNote data was presented as normalized intensity ranging from 0-10,000 and the data from the validation phase was presented as CT values, so direct correlation between expected and actual data was not possible. Approximated low, middle, and high expressivity ranges were assigned to the expected GeneNote expression score for each gene as well as the CT values generated by the qPCR reactions. Assays were assigned scores of matching expectations, borderline, or not matching expectations.
- RNA samples By exploiting the regional degradation patterns of RNA, algorithms have been developed to compare gene expression measurements, CT values, of a test sample to those of an intact RNA control sample and synthetic/empirically degraded RNA samples. Based on the differentially weighted CT profiles for all assays in the panel, an overall quality constant is assigned to a given RNA sample, allowing researchers to properly normalize or exclude any given sample during gene expression data analysis and interpretation.
- a supervised learning approach is used to create a class assignment for degraded KNA samples as a function of cDNA transcripts.
- Assays carry specific weights according to their expression levels (low, medium, high) and their relative position on the transcript (5', middle, 3 ') with the lowest weighted assay being on the 3' end of the highest expressing genes and the highest weighted assay being on the 5' end of the lowest expressing genes. Weights are assigned to CT values using a principal designed after the foll ing formula:
- V l (g) W 2 (g) » Sx 2TR,m (s)
- the resultant of class prediction analysis is a static, quantitative class prediction matrix that is biologically specific for whole blood KNA samples yielding a value that can be used in conjunction with normalization approaches to directly improve the functional analysis of gene expression measurements as a direct correlative to transcript structure and representation.
- the algorithms may be further refined as desired, for example, to reduce bias and decreases sampling variability.
- a specific selected threshold e.g., a threshold empirically determined to provide desired results
- standard deviations are estimated under a linear model with the Buckley-James estimator. This estimator allows for censored data (e.g., dropouts). Including dropouts in the estimates of standard deviations reduces bias and decreases sampling variability by including the partial information contained in dropouts.
- Model fitting may also be used.
- on can fit separate logistic/multinomial regressions to the RNA, cDNA, and microarray quality scores.
- LASP1 NM_006148.2 4500 Homo sapiens LIM and SH3 protein 1 (LASP1), mRNA
- LCP1 NM_002298.4 6500 Homo sapiens lymphocyte cytosolic protein 1 (L-plastin) (LCP1), mRNA
- TM domain member 5 (LILRA5)
- transcript variant 1 mRNA
- LPXN NM_004811.2 1100 Homo sapiens leupaxin (LPXN), transcript variant 2, mRNA
- LY75 NM_002349.2 800 Homo sapiens lymphocyte antigen 75 (LY75), mRNA
- NCF1 NM_000265.4 5500 Homo sapiens neutrophil cytosolic factor 1 (NCF1), mRNA
- NCF2 neutrophil cytosolic factor 2
- NCOA1 nuclear receptor coactivator 1
- NLR1 Homo sapiens NLR family, pyrin domain containing 1 (NLRP1), transcript
- transcript variant 2 mRNA
- 0AS3 NM_006187.2 650 Homo sapiens 2'-5'-oligoadenylate synthetase 3, lOOkDa (OAS3), mRNA
- RAF1 v-raf-1 murine leukemia viral oncogene homolog 1
- Homo sapiens selectin P (granule membrane protein 140kDa, antigen
- member 1 member 1 (SERPINA1), transcript variant 1, mRNA
- STX4 NM_004604.3 600 Homo sapiens syntaxin 4 (STX4), mRNA
- SYNE2 nuclear envelope 2
- transcript variant 2 mRNA
- TRPM2 TRPM2
- TXNIP NM_006472.3 8000 Homo sapiens thioredoxin interacting protein (TXNIP), mRNA
- transcript variant 1 mRNA
- VIM 2151 56 tgctgtcc 252
- CAPN2 82 cagaggag
- CD163 50 tctggagc
- TRPM2 24 cagctccc
Landscapes
- Life Sciences & Earth Sciences (AREA)
- Health & Medical Sciences (AREA)
- Engineering & Computer Science (AREA)
- Physics & Mathematics (AREA)
- Chemical & Material Sciences (AREA)
- Biophysics (AREA)
- Bioinformatics & Cheminformatics (AREA)
- Organic Chemistry (AREA)
- Biotechnology (AREA)
- General Health & Medical Sciences (AREA)
- Medical Informatics (AREA)
- Proteomics, Peptides & Aminoacids (AREA)
- Genetics & Genomics (AREA)
- Evolutionary Biology (AREA)
- Theoretical Computer Science (AREA)
- Zoology (AREA)
- Wood Science & Technology (AREA)
- Spectroscopy & Molecular Physics (AREA)
- Bioinformatics & Computational Biology (AREA)
- Molecular Biology (AREA)
- Analytical Chemistry (AREA)
- Data Mining & Analysis (AREA)
- Computer Vision & Pattern Recognition (AREA)
- Software Systems (AREA)
- Public Health (AREA)
- Evolutionary Computation (AREA)
- Epidemiology (AREA)
- Immunology (AREA)
- Microbiology (AREA)
- Databases & Information Systems (AREA)
- Bioethics (AREA)
- Artificial Intelligence (AREA)
- Biochemistry (AREA)
- General Engineering & Computer Science (AREA)
- Chemical Kinetics & Catalysis (AREA)
- Measuring Or Testing Involving Enzymes Or Micro-Organisms (AREA)
Abstract
Methods for assessing the integrity of an RNA sample from a given tissue or blood type are disclosed.
Description
Compositions and Methods for Functional Quality Control for Human Blood-Based
Gene Expression Products
This application claims priority to United States Provisional Patent Application Serial Number 61/570,257, filed December 13, 201 1, the disclosure of which is herein incorporated by reference in its entirety.
Pursuant to 35 U.S.C. §202(c), it is acknowledged that the U.S. Government has rights in the invention described, which was made in part with funds from the National Institutes of Health, Grant Numbers,5U24MH0684 7 (NIMH); 5U10 AA008401 (NIAAA); SN271200900012C (NIDA) and HHSN276201100016C (NIDDK).
Field of the Invention
This invention relates the fields of molecular biology and quality control maintenance of samples stored in biorepositories. More specifically, the methods of the invention provide a high-throughput, automatable process for assessing and characterizing the integrity of RNA samples utilized in large-scale gene expression studies or biorepositories, significantly limiting sample replicate variability and technical error. Background of the Invention
Several publications and patent documents are cited throughout the specification in order to describe the state of the art to which this invention pertains. Each of these citations is incorporated by reference herein as though set forth in full.
Gene expression measurements and analytical methods rest upon the assumption that a given messenger RNA sample provides a faithful representation of in vivo transcript levels at the time of extraction. In an ideal scenario, fully intact messenger RNA is reverse transcribed to high-quality cDNA for use in gene expression analysis studies, generating reliable and robust data. However, as a labile molecule, the integrity of RNA can be jeopardized at several points prior to, during, and post-extraction, adversely affecting the fidelity of gene expression measurements and hindering data interpretation and discovery. Accurately assessing RNA integrity prior to gene expression analysis on platforms such as microarrays and real-time quantitative PCR proves to be a critical step, requiring a highly sensitive and standardized RNA quality control method [1].
The current industry-standard technique for measuring RNA quality is microcapillary electrophoretic RNA separation, predominantly performed on the Agilent 2100 Bioanalyzer [2, 3]. The 'lab-on-a-chip' microfiuidics technology and data visualization software offers multiple ways to visualize and evaluate RNA integrity, yet these broad-spectrum systems often lack sensitivity on the scale necessitated by RNA samples destined for gene expression analysis. While Bioanalyzer measurements provide a gross analytical assessment of RNA integrity, the proprietary RNA Integrity Number (RIN) scoring algorithm and visualization software has intrinsic limitations preventing in-depth RNA integrity profiles and cannot adequately predict the functional performance of RNA samples intended for gene expression analysis.
Clearly a need exists in the art for improved methods for assessing RNA integrity on a large scale.
Summary of the Invention
In accordance with the present invention, a method for reproducibly assessing the integrity of an RNA sample in a high through put manner is provided. In one embodiment, the method for quantitatively evaluating the extent of RNA degradation in a RNA sample obtained from a tissue or blood specimen entails identifying a candidate gene set specific to said tissue or blood specimen, and determining an arbitrary expression score for each gene present in said set, and sorting said genes into at least two tiers based on said expression score. A plurality of amplification plots and Cx profiles from the set of candidate genes encoding RNAs exposed to differential degradation conditions are then generated, thereby providing a series of differentially weighted Cx profiles correlating to the degradation state of said RNA, said scores corresponding to intact and incrementally degraded RNAs. The test sample is subjected to qPCR, and an amplification plot and a Cx, score generated. The Cx score of the sample is then correlated with those previously determined, thereby providing the degree of degradation of said sample.
In a preferred embodiment the candidate genes are isolated from whole blood. However, any sample type may be used. The term "sample" or "biological sample" as used herein is used in its broadest sense. A sample is derived from a specimen from any source that contains or may contain a molecule of interest (e.g., RNA), including any specimen that is collected from or is associated with a biological or environmental source, or which comprises or contains biological material, whether in whole or in part, and whether living or dead. Samples or biological samples may be plant or animal, including human, fluid (e.g.,
blood or blood fractions, urine, saliva, sputum, cerebral spinal fluid, pleural fluid, milk, lymph, or semen), swabs (e.g., buccal or cervical swabs), solid (e.g., stool), microbial cultures (e.g., plate or liquid cultures of bacteria, fungi, parasites, protozoans, or viruses), or cells or tissue (e.g., fresh or paraffin-embedded tissue sections, hair follicles, mouse tail snips, leaves, or parts of human, animal, plant, microbial, viral, or other cells, tissues, organs or whole organisms, including subcellular fractions or cell extracts), as well as liquid and solid food and feed products and ingredients such as dairy items, vegetables, meat and meat by-products, agricultural materials, and waste. Biological samples may be obtained from all of the various families of domestic plants or animals, as well as wild animals or plants. In some embodiments, the sample comprises or consists of one or more whole cells from a specimen, such as from a fixed or paraffin-embedded formalin-fixed ("FFPE") section, or cells, such as human, animal, plant, or microbial cells grown in culture (e.g., human, animal, or plant cells obtained by fluorescent-activated cell sorting ("FACS"), or replica-plated bacteria or yeast). Environmental samples include environmental material such as surface matter, soil, water, air, or industrial samples, as well as samples obtained from food and dairy processing instruments, apparatus, equipment, utensils, disposable and non-disposable items. These examples are not to be construed as limiting the sample types applicable to the present invention.
In an alternative embodiment the candidate genes are isolated from a tissue selected from the group consisting of breast tissue, colon tissue, lung tissue, kidney tissue, ovarian tissue, liver tissue, muscle tissue, brain tissue, and stomach tissue.
Also provided in accordance with the invention are novel class distinction algorithms which measure RNA quality as a function of the magnitude of deviation from an expected Ct value. This approach enables the researcher to properly weigh or exclude subpar samples from subsequent analysis.
Further provided herein are systems and devices that carry out any of the methods described herein. In some embodiments, such systems or devices employ a computer processor employing a computer memory and/or computer readable medium. As used herein, the terms "processor" and "central processing unit" or "CPU" are used interchangeably and refer to a device that is able to read a program from a computer memory (e.g., ROM or other computer memory) and perform a set of steps according to the program. Devices include, but are not limited to desktop computers, hand-held computers (including pads, phones, and other similar devices), and scientific instruments (e.g., thermocyclers, detection devices, mass spectrometers, etc.). In some embodiments, the systems and devices employ software
configured to carry out the data analysis approaches described herein. In some embodiments, the systems and devices further employ one or more databases or are in communication with such databases that are housed on a separate device or data storage system (e.g., cloud).
For example, in some embodiments, provided herein are methods for quantitatively evaluating the extent of RNA degradation in a sample, comprising; a) identifying a candidate gene set and determining an arbitrary expression score for each gene present in said set, said gene set being specifically expressed in said tissue or said blood specimen and sorting said genes into at least two tiers based on said expression score; b) generating a plurality of amplification plots and Cx profiles from a set of candidate genes encoding RNAs exposed to differential degradation conditions thereby providing a series of differentially weighted Cx profiles correlating to the degradation state of said RNA, said scores corresponding to intact and incrementally degraded RNAs; and c) subjecting RNA in said sample to quantitative amplification, thereby generating an amplification plot and a Cx score; said Cx score being correlated with those determined in step b) said score providing the degree of degradation of said sample. The sample can be of any type including environmental samples, samples obtained from a human, tissue samples, fluid samples, whole blood, and the like.
In some embodiments, the method is coupled with screening or diagnostic techniques for assessing any desired genotype or phenotype, including disease status and progression, general health status, and response to diet, therapeutics, or other stimuli. In some such embodiments, the method further comprises the step of d) analyzing a gene expression profile employing the sample. In some embodiments, the method further comprises the step of e) assessing disease status or progression using the gene expression profile. In some embodiments, the method further comprises the step of d) discarding the sample without conducting a gene expression profile analysis if the degree of degradation is unsuitable (e.g., is of a degree in which a screening or diagnostic test will lack the required or desired level of sensitivity or specificity).
As discussed above, further provided herein are systems and devices that can carry out one or more or all aspects of the methods. For example, in some embodiments, a system or device comprises a computer processor that generates the plurality of amplification plots and Cx profiles. Such systems can include any component useful, necessary, or sufficient for processing the sample, detecting the sample, analyzing the data, and/or using the data. Such components, include, but are not limited to thermocyclers, sample processing components (e.g., that purify or isolate RNA from cells or tissues or other sample types), detection
components (e.g., that mass, optical signals, heat, pH changes, radioactivity, or other detectable signals), and the like.
Brief Description of the Drawings
Figure 1: Mechanisms of messenger RNA degradation by RNases. (a) 5' to 3 ' exonuclease activity removes the 7-methyl guanosine cap and degrades RNA in a 5' to 3' direction, (b) 3' to 5' exonuclease activity removes the poly-A tail and degrades RNA in a 3' to 5' direction, and (c) endonucleases attack at specific sites within the molecule and endonucleolytically cleaves the RNA. Modified image from Newbury 2006 [9]. Figure 2: Typical qPCR amplification plot, ARn vs. Cycle. A measure of accumulating PCR products, the magnitude of fluorescence (ARn) is plotted against the PCR amplification cycle number (Cycle). The threshold line, in red, is set at the middle of the linear phase of the plot, defining the CT value for a given qPCR reaction. Figure 3: Visualizing 28S and 18S ribosomal subunits on gels and electropherograms.
The image on the left represents a typical electropherogram: the right peak depicts the 28S ribosomal subunit and the left peak depicts the 18S ribosomal subunit. The image on the right is a corresponding gel image, the top band depicting the 28S subunit and the bottom band depicting the 18S subunit. Image taken from uschel 2000 [25].
Figure 4: GeneNote and BioGPS expression data.A representative gene expression data plot generated for numerous experimental tissue vectors. The example shown below represents the GAPDH gene. Image taken from the GeneCards® website (www dot genecards dot org).
Figure 5: Roche UPL ProbeFinder assay design. ProbeFinder software designs UPL assays based on an input target gene; below is one possible assay design for the CD27 gene. ProbeFinder outputs forward and reverse primer sequences flanking the UPL probe of choice, shown in the 'Detailed view' as green and purple text, respectively. Image taken from the ProbeFinder website (www dot roche-applied-science dot com backslash sis backslash rtpcr backslash upl).
Figure 6: Comparison of ideal and poor amplification plots. Figure on left: an ideal, tight amplification plot for the CAPN2 5' assay; limited expression variability exists between
different subjects. Figure on right: a dispersed amplification plot for the TRPM2 3' assay; demonstrates great variability between different subjects.
Detailed Description of the Invention
Sample quality control is central to applied, and clinical genomic analyses. Most sample processing is decentralized, which leads to differential results between laboratories. Thus, in accordance with the present invention, an efficient protocol for QC of each unique sample has been developed and standardized. While QC of RNA from whole blood samples is exemplified herein, the methods described can be applied to a variety of sample sources. The research to develop such a technology is best developed in a biorepository setting where thousands of samples are processed every month. The Rutgers University Cell and DNA Repository currently employs a QC protocol for all human genomic DNA samples that uses a custom-designed SNP genotyping assay panel to determine gender, ethnicity, uniqueness, and sample quality. A similar approach has been developed for RNA given the labile nature of this nucleic acid and the variability associated with extraction and purification thus providing a metric for comparing samples extracted at different sites. This functional QC gene expression panel has commercial applications in terms of qualifying samples for diagnostic and clinical applications.
Real-time quantitative polymerase chain reaction (qPCR) assays offer a more sensitive, modifiable method for quantitatively evaluating the extent of RNA degradation. Fluorescent probe-based assays can be customized to a specific tissue type or field of research by modifying the target genes. Additionally, this method offers a high-throughput, automatable solution for large-scale gene expression studies or biorepositories, significantly limiting sample replicate variability and technical error. By exploiting the regional degradation patterns of RNA, algorithms have been developed to compare gene expression measurements, CT values, of a test sample to those of an intact RNA control sample and synthetic/empirically degraded RNA samples. Based on the differentially weighted CT profiles for all assays in the panel, an overall quality constant is assigned to a given RNA sample, allowing researchers to properly normalize or exclude any given sample during gene expression data analysis and interpretation.
The following work describes the de novo development and validation of a novel functional quality control method for RNA samples extracted from human whole blood, comprised of a custom gene expression assay panel and complementary algorithms.
RNA Degradation Mechanisms In Vivo
While RNA degradation is a hindrance to gene expression research, it is a ubiquitous and controlled activity in vivo. Within the cell, active RNA degradation systems are in place to regulate RNA production and decay in order to maintain a steady-state level of RNA messages and their successive proteins. Misfolded or otherwise defective RNA molecules are rapidly degraded by cellular surveillance machinery [4]. In addition, it has been suggested that RNA-degrading enzymes, RNases, can confer protection from viruses by reducing viral replication and protein synthesis [5, 6]. Intact cells tightly control the essential activities of RNases, but when cells are disrupted during sample collection and RNA extraction, these endogenous cellular RNases are immediately released and can begin to break down RNA molecules.
Identified by the direction of degradation along an RNA molecule, three major classes of RNases exist in eukaryotes: (1) 5' to 3' exonucleases, (2) 3' to 5' exonucleases, and (3) endonucleases, which cleave RNA internally [2]. During the transcription process, nascent messenger RNA molecules are modified with protective structures on both ends that serve to maintain stability as mature messenger RNA is translated to protein. As messenger RNA is transcribed, a methylated guanine cap is added to the 5' end of the molecule and a stretch of 150-200 adenine residues is added to the 3' end of the molecule, forming the poly-A tail [8]. Exoribonucleases target the 5' cap or 3' poly-A tail as points of entry, while endoribonucleases can initiate degradation at specific sites within the molecule. Figure 1 depicts three mechanisms of messenger RNA degradation by RNases.
Sources of RNA DegradationEx Vivo
As many gene expression studies are clinically based, subject sample collection and processing pose the challenge of stabilizing and maintaining RNA integrity in an ex vivo environment. First and foremost, biospecimen collection methods must be considered when controlling for RNA degradation. Dependent upon tissue type, samples can be collected or stored in a variety of ways, all of which introduce inherent risk of RNA degradation. Formalin-fixed paraffin-embedded (FFPE) tissue samples are routinely used for disease diagnosis and provide a long-term sample storage solution. As archived collections of these samples grow, so does the appeal of extracting RNA for large-scale gene expression studies. However, RNA extracted from fresh, frozen, or archival FFPE specimens is extensively degraded due to the fixation process and length of storage [10]. Alternatively, fresh samples can be collected from tissue biopsies or whole blood drawings for immediate processing,
eliminating the fixation and storage limitations of FFPE tissue samples. However, these samples must be immediately and adequately stabilized by immersion in a proprietary reagent that protects RNA from endogenous ribonuclease degradation and minimizes post-collection gene induction [JJJ.
Regardless of the collection method chosen, variability in RNA extraction techniques and mishandling by technicians further introduces opportunities for RNA degradation. The latency period and conditions between collection and processing, conditions of the extraction process such as time lapse and temperature, and inadvertent contamination with ubiquitous RNases present on lab surfaces, gloves, and skin are common sources of RNA degradation
[4, 12]· Post-extraction handling, such as freeze/thaw cycles, heat, and pH fluctuations are also potential sources of RNA degradation [1345]. The first line of defense against RNA degradation is tightly controlling the variables associated with its collection and processing, however, not all samples in a collection will be handled properly and some degree of RNA degradation is inevitable. When paired with the costly venture of biospecimen procurement and storage, it becomes financially and analytically advantageous to include all viable samples in a gene expression study, including data derived from variably degraded RNA [\ 3, 14]. Due to the propensity for RNA degradation, quality control methods become of paramount importance to ensure the reliability and reproducibility of downstream gene expression analysis and data interpretation.
Compounding the issue of RNA degradation is that prior to running an RNA sample on a gene expression platform, it must first be reverse transcribed to stable complementary DNA (cDNA). cDNA is synthesized from a messenger RNA template and serves as the input molecule for gene expression analysis platforms. Demonstrating a ripple-effect, if the messenger RNA template is degraded and of low quality, the cDNA synthesized from it will follow suit, resulting in skewed gene expression data that does not accurately portray the gene expression products present within a given sample at the time of RNA extraction. Numerous platforms exist for measuring gene expression, each with varied applications, multiplexing capability, and throughput. For the purposes of this discussion, the effect of RNA degradation on real-time quantitative PCR data will be considered.
RNA Degradation and Effects on Real-Time Quantitative PCR Measurements
Real-time quantitative PCR (qPCR) is considered a routine, 'gold standard' RNA quantification method. Due to the relatively low cost, speed, and reliability of performing qPCR assays, they are also often used to validate gene expression data generated by other
methods, as is the case with expression microarrays[16, 17]. Designing qPCR assays is a flexible and customizable process, allowing for the design of highly specific assay panels. For high-throughput studies or processes, the reaction set up can be fully automated for more accurate results and more consistent technical replicates. The qPCR workflow consists of three steps: (1) the reverse transcriptase-mediated conversion of labile RNA to stable cDNA, (2) the amplification of cDNA using the polymerase chain reaction (PCR), and (3) the realtime detection and quantification of amplification products [18].
Individual qPCR reactions consist of or comprise the following components: (1) cDNA template, (2) gene expression master mix, (3) forward and reverse primers, (4) a fluorescent probe, and (5) DNase/RNase-free water. Master mix contains the components necessary for the DNA synthesis machinery, primarily thermo-stable DNA polymerase. Primers are short, specific oligonucleotides which hybridize to a DNA template and serve as a start point for DNA synthesis. Forward and reverse primers are used for amplification of both DNA template strands and can be designed to target a specific region for amplification. The probe is a short oligonucleotide labeled with a fluorescent reporter at one end and a fluorescence quencher at the opposite end. The probe hybridizes to the complementary sequence of the DNA template, proximal to and downstream of one of the hybridized primers. Due to the close proximity of the fluorescent moiety and quencher, a fluorescent signal is dampened until the amplification process begins. As the target PCR product is synthesized, the probe is cleaved by the 5' to 3' exonuc lease activity of DNA polymerase. Breaking the close proximity of the fluorophore and quencher emits a detectable fluorescent signal upon excitation by a laser within the PCR instrument 19].
During the PCR thermal cycling course, as the target amplicons accumulate, a proportional amount of fluorescent signal accumulates. The magnitude of fluorescence emitted by individual reactions, and thereby the amount of accumulated PCR product, is quantified by a cycle threshold (CT) value. CT values are determined by a threshold line, which is set at the midpoint of the linear phase of an amplification plot and defines the PCR cycle iteration at which a measurable fluorescence level first surpasses the background fluorescence threshold. CT values are inversely related to the level of gene expression of the target gene: the greater the amount of target sequence present in the starting cDNA, the earlier the cycle at which fluorescence intensity surpasses the threshold, generating a lower CT value [18], Once generated, depending upon the application and objectives of the study, CT values are then analyzed with established statistical methods. Figure 2 depicts a typical qPCR amplification plot and threshold line.
qPCR offers sensitive and reliable gene expression quantification, yet it is not without potential drawbacks stemming from lack of standardization at steps within the workflow. Among the variables to consider when planning and executing qPCR assays, RNA sample quality is arguably the most important, followed by assay design efficiency, choice of chemistry, linearity during reverse transcription, and threshold determination [18, 20, 21]. For the purposes of this discussion, assays will henceforth be defined as a primer set/probe pairing. The variables of sample quality and assay design go hand-in-hand when considering the effects of degraded starting material on gene expression quantification. For instance, RNase activity is dictated by a directionally-driven mechanism: RNases move in a 5' to 3' direction, 3' to 5' direction, or attack at specific sequences of a transcript and cleave the molecule at that point. Depending on the entry point of ribonuclease attack and the extent of degradation or fragmentation, a given transcript may no longer contain the region for which an assay was designed, thus under-representing expression level of the target gene. This under-representation corresponds to a higher CT value, as the amount of starting material is smaller and the threshold takes longer to surpass.
In terms of designing effective assays, the location of the primer and probe sequences is critical. Assays designed proximal to the 3' or 5' ends of the molecule will be at greater risk for failure as they are the entry points for exoribonucleases, whereas assays designed in the middle region are prone to failure due to endoribonuclease degradation activity. Multiple assays per gene should be designed in order to compare regional efficacy. To choose optimal assays from a large candidate pool, a validation study must be conducted to eliminate assays that fail due to poor primer/probe hybridization, large variations in CT between RNA samples from different subjects, or significant expression level inconsistencies between regional assays of the same target gene. Studies have indicated that a certain threshold of RNA degradation is tolerated without significantly impacting gene expression data, yet beyond which gene expression analysis is adversely impacted by sample degeneration [13, 14, 22, 23] . The hallmark CT increase for a degraded sample, as compared to an expected C value of a control sample, can potentially be used to weight the reliability of gene expression data for a given sample and allow for appropriate inclusion or exclusion of variably degraded RNA samples in a study.
Current RNA Integrity Assessment Methods
Existing RNA integrity assessment tools each have inherent strengths and weaknesses, and each looks at different RNA structural features to determine quality. The
three most common methods used to evaluate RNA integrity will be discussed for comparison: (1) Ratio method: measuring the ratio between the 28S and 18S ribosomal RNA (rRNA) subunit electrophoresis bands, (2) Manual method: subjective evaluation of an electropherogram, and (3) RNA Integrity Number (RIN): objective evaluation of an electropherogram [2]. All of these methods rely on measurements generated by an electrophoretic RNA separation system, such as the Agilent 2100 Bioanalyzer and corresponding RNA 6000 LabChip® kit. The Bioanalyzer combines disposable microfmidic chips, voltage-induced size separation, and laser-induced fluorescence quantification on a small scale, with the capacity to process 12 samples in approximately 30 minutes [24, 25]. Data is visualized within the software as electropherograms and simulated gel electrophoresis images, while RNA concentration, RNA area, and 28S/18S ratios are quantitatively reported.
Traditionally used to evaluate RNA integrity, the 28S/18S rRNA ratio method uses agarose gel electrophoresis stained with ethidium bromide to produce a banding pattern representing the 28S and 18S ribosomal RNA species [3]. More recently, physical gels have been replaced by microfluidics chips. Though the concept remains the same, Bioanalyzer software generates simulated gel images and electropherograms from the data it collects during RNA separation. The intensities of the 28S and 18S bands are used to calculate a ratio reflecting RNA integrity. Band intensity and electropherogram peak amplitude are based on the size of the ribosomal subunit; the larger the molecule, the more intercalating dyes bind to it, hence a stronger intensity displayed by the larger 28S subunit. Figure 3 depicts typical 28S and 18S visualizations on both a gel and an electropherogram. On a gel or gel image, a ratio of 2.0 or greater indicates good to high quality RNA, while an electropherogram peak ratio of > 0.65 is considered high quality [2, 3]. The determination of a 28S/18S ratio via physical gel electrophoresis has been largely replaced by microcapillary gel electrophoresis due to the subjectivity involved with determining band intensity ratios. Furthermore, the large amount of input RNA required and the variability associated with electrophoresis conditions make physical gel analysis an unreliable RNA degradation indicator [26]. While Bioanalyzer digital ratio calculation removes subjectivity, it also has drawbacks. Bioanalyzer calculation of the 28S/18S ratio is based on peak area measurements that are heavily dependent on exact definition of the start and end points of the peak, and even accurate determination of this ratio is not sufficient to detect RNA degradation [27].
The manual method of evaluating RNA integrity involves visual inspection of an electropherogram, specifically looking at the 28S and 18S peaks of an electropherogram. A high quality RNA sample is characterized by distinct 28S and 18S peaks and a flat baseline.
With increased degradation, there is a decrease in the 18S to 28S ribosomal band ratio and an increase in the baseline signal between the two ribosomal peaks and the lower marker, while additional peaks begin to appear in the small RNA range as short degradation products accumulate [27, 28]. Much like the 28S/18S ratio used with physical gels, this method is subjective and prone to variability, but may have utility if used in conjunction with a secondary validation method to determine the extent of RNA degradation.
In order to standardize the subjective process of RNA integrity assessment, the RNA Integrity Number (RIN) algorithm was later developed and integrated into the Bioanalyzer software. The RIN algorithm is based on a selection of features that contribute different information about RNA quality, taking into account that a single feature is insufficient to universally evaluate RNA degradation. Specifically, the features incorporated into the RIN algorithm are: (1) the fraction of area beneath the 28S and 18S peaks as compared to total area, reflecting the proportion of large molecules compared to smaller ones, (2) the amplitude of the 28S peak, which correlates with the onset of degradation, (3) the 'fast area' ratio, referring to the degradation peaks observed between the marker and 18S peaks of increasingly degraded RNA, and (4) marker height, an indicator for accumulation of short degradation products [3J. While providing a much more comprehensive evaluation of RNA integrity than the other two methods, the RIN algorithm cannot predict the quality of downstream gene expression data without prior validation work; that is, an RNA sample might be too degraded for use in a microarray study, but might deliver good qPCR data [28, 29]. The inadequate predictive utility of the RIN algorithm, in terms of forecasting sample performance on a range of gene expression platforms, limits its value as an RNA quality control method and creates a niche in the market for a more sensitive quality control analytical tool.
Real-Time Quantitative PCR as a Functional RNA Quality Control Method
While instruments such as the Bioanalyzer offer a comprehensive method of determining RNA quality, to appropriately evaluate the functional potential of a given sample, 'like' must be compared with 'like'. In order to gauge the reliability of a given RNA sample during downstream gene expression analysis, functional performance must be measured as opposed to static evaluation within a system that solely considers structural features of the molecule. Furthermore, the sensitivity of these tools falls off quickly when analyzing RNA samples of increasingly lower quality and yield, sacrificing scoring linearity
at the lower boundary of RNA quality [30, 31] . The limiting threshold of sensitivity inherent to lab-on-a-chip solutions is surpassed by a functional expression assay.
If all variables are controlled for, qPCR assays offer a highly sensitive, reproducible, and customizable quality control method. Already used to confirm and validate gene expression data generated by microarrays, using qPCR as a means to evaluate both RNA integrity and functional potential in one concerted effort is a natural extension of the technology [16, 32]. qPCR assays are highly customizable and assay panels can be specifically designed based on tissue type or area of research based on the target genes chosen. Reaction setup can be automated to eliminate human pipetting error, ensure reproducibility, and allow for high-throughput quality control screening. Additionally, a qPCR quality control method addresses the needs of high-throughput laboratories by eliminating the need for additional costly instruments, consumables, and kits necessitated by other technologies.
With growing incentive to include all samples of a collection in a gene expression study, sample exclusion based on poor RNA integrity can potentially be countered by annotating expression data with sample quality metrics. The generally predictable nature of RNA degradation suggests that correlations may be drawn between transcript integrity and gene expression level for a target gene, as compared to an expected expression baseline. By exploiting the direction and magnitude of CT shift between a control RNA sample and a test sample, assay-centric class distinction algorithms can be developed and collectively considered to quantify the quality of RNA samples. The following work describes the development of a novel functional quality control method for RNA samples extracted from human whole blood, consisting of a custom gene expression assay panel and complementary class distinction algorithms.
ASSAY DEVELOPMENT
Literature and Database Search for Candidate Genes
A pool of over 1,400 genes expressed in human whole blood was generated from literature and public database searches, primarily genome-wide analysis studies and the Weizmann Institute's GeneCards® online database (www dot genecards dot org) [33-351. Providing a complete summary for each gene, the GeneCards® human gene database acquires and compiles transcriptomic, genetic, proteomic, and functional information from relevant publications and public databases, including Weizmann Institute's own tissue- specific microarray expression data. Candidate genes were selected from the pool based on
adherence to the following criteria: (1) the gene must be measurably expressed in human whole blood cells, (2) the gene must be expressed in a non-disease state, with limited potential for expression variability between whole blood samples from different donors, and (3) the gene must be central to blood cell structure or function (i.e. not an immediate early gene) [36]. For use as a universal RNA quality control method, the final assay panel must be suited to accommodate samples from a broad range of subjects, controlling for disease states, immune challenge, and expression variability between subjects. Taking these variables into account, candidate genes were limited to normal-state, non-transient genes involved in white blood cell structure or function, as indicated by the GeneCards® database.
Expression Profiles for Candidate Genes
Using public microarray data provided by the GeneCards® gene expression database, GeneNote, an arbitrary expression score (0-10,000) was assigned to each gene on the candidate list. GeneNote data was compiled from two sources: Weizmann Institute high- density DNA microarray data and BioGPS, a gene annotation portal (biogps dot gnf dot org) [37-39], Expression data is presented within GeneNote as a log-scale plot of normalized expression intensity across a range of healthy human tissues, as depicted in Figure 4. Primarily based on Weizmann Institute array experiments performed on the Affymetrix GeneChip® HG-U95 set A-E, consisting of 62,839 probesets representing the full human genome, all expression data was normalized in a tissue-specific manner for comparison on a single plot [37, 38].
GeneNote plots the normalized intensity for each tissue type run in microarray experiments on a scale of 0-10,000 without providing the exact intensity score so approximated expression scores were noted for each gene on the candidate list. Based on the expression score assigned, candidate genes were sorted into six tiers: (la) 150-449, (lb) 450- 749, (lc) 750-999, (2) 1000-3332, (3) 3333-6665, and (4) 6666-10,000. As lower-expressing genes can often serve as good class discriminators, genes exhibiting significantly different expression levels between two groups, the low expression group was further stratified for weighted representation in the assay validation experiments [40, 4j_].
Selection of Genes for Assay Design
A comprehensive master list was compiled of all candidate genes, their functions as provided by the GeneCards®, Entrez Gene, and UniProtKB/Swiss-Prot databases, and expression scores provided by the GeneNote database. The list was ordered by expression
score and a total of 62 genes, 10 from each expression tier and 2 control genes, were chosen for the assay design phase, as presented in Appendix I. The decision to include a gene in the design phase was primarily determined by gene function. Genes with a role in cell structure or function were highly preferred over genes with speculative functional roles or genes expressed during periods of immune system challenge or disease, as they are less variably expressed between individuals and are temporally stable.
Assay Design
Based on ease of design and cost effectiveness, Roche Universal ProbeLibrary assays were chosen for the assay validation phase. Within the online Universal ProbeLibrary Assay Design Center, ProbeFinder software (v2.45, human) was used to design region-specific realtime qPCR assays targeting the 62 genes of interest (www dot roche-applied-science dot com backslash sis backslash rtpcr backslashupl). ProbeFinder is a web-based software tool that designs optimal primer set/probe pairings for a user-defined gene of interest. Using 165 proprietary Universal ProbeLibrary (UPL)fluorescent probes, 8- and 9-mer motifs that are highly prevalent in the transcriptome, the software computes all possible primer/probe combinations around the probe hybridization sequences present within the gene of interest. To gauge the efficacy of individual assays, the software performs in silico PCR reactions to predict amplicon fidelity and minimize the risk of false assay signals [42]. Figure 5 depicts an example of a ProbeFinder UPL assay design.
A total of 184 intron-spanning assays were designed with ProbeFinder: three designs per 60 genes of interest and two designs per 2 control genes. For each gene of interest, an optimal assay was designed for the 5', middle, and 3' regions. For control genes, ACTB and GAPDH, optimal assays were designed only for the 5' and 3' regions. Assay designs, consisting of forward and reverse primers and the corresponding UPL probe, were exported from the software and are presented in Appendix II. Primers were custom ordered from Sigma according to the following specifications: shipment in a 96-well plate format, purification by standard desalting, and lyophilized forward and reverse primer sets (20 nM each) were to be combined in a single well.
ASSAY VALIDATION
Primer Preparation
The lyophilized primer sets, 20 nM each of both forward and reverse primers per assay design, were reconstituted with 200 μΐ DNase/R ase-free water for a standard stock solution of 100 μΜ. From the stock solution, working 1 :5 dilutions were prepared on a Biomek FX liquid handling instrument (Beckman Coulter) for use in subsequent qPCR reactions. Sample Collection and Automated RNA Extraction
Fresh human whole blood samples were collected in PAXgene® Blood RNA tubes (Qiagen/PreAnalytiX), according to manufacturer specifications. PAXgene® Blood RNA tubes contain a proprietary RNA stabilization reagent that protects RNA molecules from RNase degradation during cell lysis and minimizes gene induction post-collection [431. Blood samples were drawn from five healthy donors, totaling two PAXgene® Blood RNA tubes per subject, with 2.5 ml of whole blood drawn per collection tube. Tube sets were labeled A-E to ensure donor anonymity. One set of donor tubes was stored at -20°C for later extraction while the remaining set of tubes was processed immediately.
According to manufacturer specifications, the PAXgene® tubes were incubated for two hours at room temperature then stored overnight at 4°C to adequately lyse the blood cells and stabilize the RNA. Once lysed, total RNA was extracted and purified using the PAXgene® Blood RNA MDx Kit on the BioRobot Universal instrument (Qiagen), according to the manufacturer's protocol. Total RNA yield and purity was assessed using Nanodrop ND-8000 spectrophotometric measurements (Thermo Fisher). Total RNA integrity was assessed with LabChip 90 HT RNA electropherogram and gel electrophoresis images (Caliper Life Sciences). Total RNA quality data is presented in Appendix ΙΠ. cDNA Synthesis and Amplification
In a two-step process, extracted RNA was reverse transcribed to cDNA, which was then amplified using the Ovation Pico WTA System (NuGEN) on a Biomek FX liquid handling instrument according to the manufacturer's protocol. cDNA yield and purity was assessed using Nanodrop ND-8000 spectrophotometric measurements. cDNA integrity was assessed with LabChip 90 HT RNA electropherogram and gel electrophoresis images. cDNA
quality data is presented in Appendix IV. Working dilutions of 1 :200 cDNA were prepared with DNase/RNase-free water for use in subsequent qPCR reactions.
Assay Validation: Real-time Quantitative PCR
Real-time qPCR reactions were run for 184 assays against 4 cDNA samples generated from intact RNA on a 7900HT Real-Time PCR System (Applied Biosystems). Three technical sample replicates and one no template control (NTC) were run for each assay. A general reaction plate map is presented in Appendix V. Single 10 μΐ reactions consisted of a gene-specific forward/reverse primer set (Sigma), corresponding Universal ProbeLibrary probe (Roche), TaqMan Gene Expression Master Mix (Applied Biosystems), DNase/RNase- free water, and 1 :5 dilution cDNA template. To ensure accuracy and produce reliable gene expression data, all qPCR reaction plates were prepared in 384-well PCR plates on a Biomek FX liquid handling instrument. RESULTS
Assay Performance Analysis and Scoring
For each of the assay validation reactions, RQ Manager version 1.2 software (Applied Biosystems) plotted the magnitude of fluorescence (ARn) against the PCR amplification cycle number. A comprehensive logarithmic amplification plot was generated and a threshold line was manually set at the midpoint of the linear phase of each plot, intersecting to define an individual CT value for each reaction well of a given assay. Individual CT values and amplification plots were exported for qualitative and descriptive statistical analyses.
CT values were grouped by assay then sub-grouped by sample for descriptive statistical analysis. For each assay, the statistical average and standard deviation of triplicate CT values per sample was calculated. Additionally, for each assay, a statistical average and standard deviation of CT values per all samples was calculated, as presented in Appendix VI. Outlying CT values below 15 and above 38.5 were excluded from all calculations due to experimental error or assay failure, and NTC CT values were checked for evidence of contamination. To better evaluate assay performance, the descriptive statistical data was visualized with histogram plots. Histograms were plotted to compare assay performance between individual samples per given assay; all regional assays for a given gene were plotted on the same histogram to reveal local biases, as presented in Appendix VII. To compare performance across all 184 assays, the overall average Rvalue and overall standard deviation
of all four samples per given assay were plotted on a single histogram. Histogram plots were used to determine gene expression consistency across regional assay designs for a given gene.
Three criteria were used to score assay performance: (1) expression level consistency across all regional assays of a given gene, (2) amplification plot uniformity and C value standard deviation, and (3) conformity to expected expression levels, as determined by GeneNote public microarray data. Expression level consistency among regional assays designed for the same gene served as an indicator that there were no biases stemming from location of the assay design within the gene, important for establishing a reliable baseline for algorithm development and mitigating performance variability. Uniformity among individual reaction amplification plots and corresponding CT value standard deviations served as indicators of how similarly a given assay would perform between samples from different subjects, important for clinical applications and utility as a universal quality control method. Conformity to the expected expression level reported by the GeneNote database served to validate expression data and was indicative of high-quality input RNA, important for assay validation.
Based on these three criteria, two performance lists were generated, one placing emphasis on regional consistency and the other placing emphasis on amplification plot and CT value uniformity among different samples, as presented in Appendix VIII. While regional consistency is important for algorithm generation and assay performance predictability, just as important is the consistency between different samples within the same assay. When compared, most of the best-performing assays were found at the top of both lists, so they were combined when choosing the subset of assays for use in the experimental degradation phase of the project.
EXPERIMENTAL RNA DEGRADATIONAND ASSAY PEFORMANCE
MATERIALS AND METHODS Experimental RNA Degradation Conditions
To determine the best method for experimentally degrading RNA samples, multiple degradation conditions were evaluated [2, 13-15, 44, 45]. Aliquots of native RNA were either subjected to repeat freeze/thaw cycles, heat treatments, or exposure to an endoribonuclease, RNase A. Freeze/thaw cycling consisted of flash-freezing native RNA aliquots on dry ice for 2 minutes, followed by a complete thaw on wet ice for 7.5 minutes. Five 6 μΐ RNA aliquots were exposed to 3, 6, 9, and 12 freeze/thaw cycles, respectively. RNA integrity was assessed for each aliquot using the RNA 6000 Nano LabChip® kit on a Bioanalyzer 2100 instrument (Agilent); electropherogram and gel electrophoresis images are presented in Appendix IX.
Heat treatments consisted of exposing native RNA aliquots to high heat over a time continuum. Five 7 μΐ RNA aliquots were incubated in a 60°C Mastercycler® Ep thermal cycler heat block (Eppendori) for 30, 60, 90, and 120 minutes, respectively. After each 30- minute time interval, a single aliquot tube was removed from the heat block and frozen immediately on dry ice. RNA integrity was assessed for each aliquot using the RNA 6000 Nano LabChip® kit on a Bioanalyzer 2100 instrument; electropherogram and gel electrophoresis images are presented in Appendix IX.
RNase A treatments consisted of exposing native RNA aliquots to an optimal dilution of stock RNase A solution (Qiagen). The enzymatic reaction was stopped at set time points with optimally diluted SUPERase-ln (Ambion), a multiple RNase inhibitor. Several attempts to optimize dilutions and exposure periods resulted in completely degraded RNA before a final RNase A dilution of 1 :5,000,000 and SUPERase-ln dilution of 1 :2 produced measurable, incrementally degraded RNA [46, 47]. For eight 6 μΐ RNA aliquots, 1 μΐ of 1:5,000,000 diluted RNase A was added and tubes were incubated in a 37°C Mastercycler® Ep thermal cycler heat block. At time points 0.5, 1, 2, 4, 8, 16, and 32 minutes, a single tube was taken off the heat block and 1 μΐ of 1:2 diluted SUPERase-ln was added, thoroughly mixed, and the tube was immediately frozen on dry ice. RNA integrity was assessed for each aliquot using the RNA 6000 Nano LabChip® kit on a Bioanalyzer 2100 instrument; electropherogram and gel electrophoresis images are presented in Appendix IX.
Based on the graded degradation patterns produced by the RNase A treatment, this method was chosen for subsequent degradation testing. Since production of RNase inhibitors involves co-purification with RNases which can potentially contaminate stock solutions, a concern arose about reintroducing unwanted RNases during the supposed inactivation step. To address this concern in subsequent RNase experiments, a second RNA purification step was performed after the RNase inactivation step to ensure the degradation process would not continue to fragment the RNA beyond the desired inactivation time point. To stabilize the RNA during the purification step, ten volumes of TRIzol® reagent (Invitrogen) and two volumes of chloroform (Invitrogen) were added to each RNA aliquot in a phase lock gel heavy tube (5 Prime), shaken vigorously, incubated at room temperature for 3 minutes, then centrifuged at 12,000xgand 4°C for 15 minutes. TRIzol® reagent, containing phenol and guanidine isothiocyanate, is often used prior to RNA extraction and purification protocols to maintain RNA integrity during the extraction process [48]. The aqueous layer, containing stabilized RNA, was transferred to a fresh microfuge tube and purified with an RNeasy Mini Kit (Qiagen), according to the manufacturer's protocol. The RNeasy Mini Kit is a system for RNA extraction and purification that binds RNA to a silica-membrane spin column, purifying the bound RNA through a series of buffer washes and centrifugation steps [49].
To gauge the amount of RNA yield net loss to be expected as a result of adding an additional purification step, the secondary RNase inactivation step was performed on native RNA. Once satisfied that RNA yield would not be compromised, the RNase A treatment of samples was followed by the secondary RNase inactivation step described previously for all subsequent testing. Nanodrop ND-8000 (Thermo Fisher) and Bioanalyzer 2100 yield and quality data are presented in Appendix X. Manual RNA Extraction and Experimental Degradation
Once the combined RNase A treatment and purification step was defined as the optimal experimental degradation method, RNA was manually extracted from the second set of frozen blood samples using a PAXgene® Blood RNA Kit (Qiagen), according to the manufacturer's protocol. As opposed to the automated method, manually extracting the RNA provided a greater overall yield, necessary for running multiple degradation conditions and subsequent qPCR reactions. RNA yield and purity was assessed using Nanodrop ND-8000 spectrophotometric measurements. RNA integrity was assessed for each sample with electropherogram and gel electrophoresis images on a Bioanalyzer 2100, as presented in Appendix XI.
Manually extracted RNA sample 'D' was arbitrarily chosen for experimental degradation by R ase A according to the optimized two-step method previously outlined. Seven 10 μΐ RNA aliquots were treated and purified according to plan for time points 0, 0.5, 1, 2, 4, 8, and 16 minutes. RNA yield and purity was assessed using Nanodrop ND-8000 spectrophotometry measurements. RNA integrity was assessed for each aliquot with electropherogram and gel electrophoresis images on a Bioanalyzer 100, as presented in Appendix XII. cDNA Synthesis and Amplification
In a two-step process, the seven variably-degraded RNA aliquots were reverse transcribed to cDNA, which was then amplified using the Ovation Pico WTA System (NuGEN) on a Biomek FX liquid handling instrument according to the manufacturer's protocol. cDNA yield and purity was assessed using Nanodrop ND-8000 spectrophotometric measurements. cDNA integrity was assessed with LabChip 90 HT RNA electropherogram and gel electrophoresis images (Caliper Life Sciences). cDNA quality data is presented in Appendix XIII. Working dilutions of 1 :200 cDNA were prepared with DNase/RNase-free water for use in subsequent qPCR reactions.
Incrementally Degraded RNA: Real-time Quantitative PCR
Real-time qPCR reactions were run for 71 of the top-performing assays, as identified by the assay validation phase, against 7 cDNA samples generated from increasingly degraded RNA on a 7900HT Real-Time PCR System (Applied Biosystems). Three technical sample replicates and one no template control (NTC) were run for each assay. A general reaction plate map is presented in Appendix XIV. Single 10 μΐ reactions consisted of a gene-specific forward/reverse primer set (Sigma), corresponding Universal ProbeLibrary probe (Roche), TaqMan Gene Expression Master Mix (Applied Biosystems), DNase/RNase-free water, and 1:5 dilution cDNA template. To ensure accuracy and produce reliable gene expression data, all qPCR reaction plates were prepared in 384-well PCR plates on a Biomek FX liquid handling instrument.
RESULTS
Degraded RNA Assay Performance Analysis
For each of the degradation assays, RQ Manager version 1.2 software (Applied Biosystems) plotted the magnitude of fluorescence (ARn) against the PCR amplification cycle number. A comprehensive logarithmic amplification plot was generated for each assay and a threshold line was manually set at the midpoint of the linear phase of the plot, intersecting to define an individual CT value for each reaction well of a given assay. Individual C values and amplification plots were exported for qualitative and descriptive statistical analyses.
CT values were grouped by assay then sub-grouped by sample for descriptive statistical analysis. For each assay, the statistical average and standard deviation of triplicate CT values per sample was calculated. Additionally, for each assay, a statistical average and standard deviation of CT values per all samples was calculated, as presented in Appendix XV. Outlying CT values below 15 and above 38.5 were excluded from all calculations due to experimental error or assay failure, and NTC CT values were checked for evidence of contamination. To better evaluate assay performance, the descriptive statistical data was visualized with histogram plots. Histograms were plotted to compare assay performance between individual samples per given assay; all regional assays for a given gene were plotted on the same histogram to reveal local biases, as presented in Appendix XVI. To compare performance across all 71 assays, the overall average CT value and overall standard deviation of all seven samples per given assay were plotted on a single histogram. Comparisons with the initial assay validation phase CT values were also visualized in a single histogram to track general trends in expression level change, confirming that degradation increased overall average CT values for each assay. To visualize the change in CT over the course of increasing degradation for each assay, the percent change in CT was plotted using native RNA CT values (To minutes) as the baseline. The relationship between CT value and extent of degradation served as a foundation for deciding algorithm development approaches.
DISCUSSION
Overview
The development of a functional quality control method assessing RNA extracted from human whole blood samples is described herein. Designed to work in concert, the custom gene expression assay panel and set of class distinction algorithms provide an overall RNA quality score capable of predicting future performance on gene expression platforms. Setting it apart from current analytical quality control methodologies, this method relies on dynamic gene expression data rather than static measurements of RNA size, providing a more appropriate assessment of anticipated performance quality.
In summary, a list of candidate genes of variable expressivity in human whole blood cells was compiled, placing emphasis on intransient function and limited variability between subjects. Ultimately 62 genes were selected for Roche Universal Probe Library assay design. For each gene, assays were designed for the 3', middle, and 5' regions of each transcript; assays consisted of forward and reverse primers paired with a specific UPL probe. An assay validation phase consisting of 184 assays was conducted to assess assay performance when reactions were run with high-quality, intact RNA samples. For the top 71 best-performing assays, as determined by validation phase data, qPCR reactions were run with RNA that had been incrementally degraded by RNase A. Data generated by the experimentally degraded RNA reactions will be used to establish an expected baseline CT value (non-degraded RNA, To) for algorithm development. Additionally, O values for incrementally degraded RNA (To.5, Ti, T2, T4, T8, and T16 minutes) will serve to extrapolate the relationship between extent of sample degradation and increase in CT value. Assay Development
Assays were designed using Roche ProbeFinder software, which provided forward and reverse primer sequences and a corresponding Universal Probe Library (UPL) probe per gene queried. All efforts were made to choose designs located precisely at the 3', middle, and 5' regions of a transcript; however, designs were limited to the regions of the transcript with sequences compatible with one of the 165 possible UPL probes. Additionally, all efforts were made to choose the highest quality assay as determined by the software's in silico PCR rating. As was the case with a number of genes, for instance, the 5 '-most assay design may be located closer to the middle of the transcript than the 5' end; in these cases, the most optimal assay design available was chosen. While UPL assays were cost-efficient and easy
to design for the considerable number of validation reactions that were run, when finalizing the assay panel Taqman® assays might provide better results. Though more costly, these probe sequences can be custom designed, allowing for the design of assays in more optimal positions along the transcript unlike the pre-fabricated UPL probes.
Assay Validation
During assay validation analysis, assay performance was based on three criteria: (1) consistency across all regional assays of a gene, (2) amplification plot homogeneity, also reflected in standard deviations, and (3) conformity to expected gene expressivity, as established by GeneNote values. For regional assay consistency, a score of 0, 2, or 3 was given to assays designed for the same gene, reflecting the number of assays that expressed at approximately the same level. As the UPL assays wrere as optimally designed as possible, ideally all regions should express at the same level in intact KNA. However, variations in assay performance are possible and might account for why two assays out of three were consistent, yet the third may have simply been a poorly designed assay.
Amplification plots for individual assays were assessed subjectively, emphasis being placed on tight plots with little variation between samples from different subjects. To be used as a universal quality control method, it was important to limit expression variability between samples taken from different subjects. Assays were scored individually, either presenting tight or dispersed plots. Figure 6 shows the difference between an ideal plot versus a plot that showed great variability between samples from different subjects.
The last criterion used to score assay performance was correspondence with the expression values provided by GeneNote microarray data. GeneNote data was presented as normalized intensity ranging from 0-10,000 and the data from the validation phase was presented as CT values, so direct correlation between expected and actual data was not possible. Approximated low, middle, and high expressivity ranges were assigned to the expected GeneNote expression score for each gene as well as the CT values generated by the qPCR reactions. Assays were assigned scores of matching expectations, borderline, or not matching expectations.
Once assays were scored by these performance features, they were sorted in two ways. The first list weighted amplification plot scores more heavily while the second list weighted regional assay consistency more heavily. As stated previously, both performance features were rightly influential but due to the possibility of poorly designed assays underperforming, it was unclear which feature should weight most heavily in determining
assay performance. Once both lists were generated, many of the same assays appeared at the tops of both lists so choosing what assays moved on to the experimental RNA degradation phase became less of a challenge. Experimental RNA Degradation and Assay Performance
Once all assays were assessed using intact, high-quality input RNA, data from reactions using degraded RNA needed to be generated for algorithm development. Based on a literature search, three methods were chosen for testing: (1) freeze/thaw cycles, (2) heating, and (3) RNase treatments. Methods were chosen to mimic conditions that extracted RNA would likely be exposed to following blood samples collection. Small scale experimental conditions were run for each method followed by assessment on a Bioanalyzer. Based on the degradation banding patterns produced by each, RNase A was chosen as the method to move forward with. RNase A was also chosen because it is an extracellular, distributive enzyme produced in abundance on human skin and in blood [4, 50]. RNase A present on gloves, benchtops, and instrument surfaces would be a likely source of degradation in a laboratory setting. As established protocols for purposefully degrading RNA wrere limited, trial and error testing was run for a number of RNaseA and SUPERase-In dilutions until a final protocol was adopted, as described previously. Class Prediction Algorithm Development:
We are using a supervised, machine learning approach to discriminate between classes of degradation and ultimately provide a quality grade for each assay in the panel. Data generated by the experimentally degraded RNA reactions can be used to establish an expected baseline CT value (non-degraded RNA, To) for algorithm development. Additionally, CT values for incrementally degraded RNA (T0.s, ΊΊ, T2, T4, T8, and Ti6 minutes) will serve to extrapolate the relationship between extent of sample degradation and increase in C value. Based on deviation from the expected CT value for a given assay, the sample will be classified as good, moderate, or poor quality. By exploiting the regional degradation patterns of RNA, algorithms have been developed to compare gene expression measurements, CT values, of a test sample to those of an intact RNA control sample and synthetic/empirically degraded RNA samples. Based on the differentially weighted CT profiles for all assays in the panel, an overall quality constant is assigned to a given RNA sample, allowing researchers to properly normalize or exclude any given sample during gene expression data analysis and interpretation. A supervised learning approach is used to create
a class assignment for degraded KNA samples as a function of cDNA transcripts. Assays carry specific weights according to their expression levels (low, medium, high) and their relative position on the transcript (5', middle, 3 ') with the lowest weighted assay being on the 3' end of the highest expressing genes and the highest weighted assay being on the 5' end of the lowest expressing genes. Weights are assigned to CT values using a principal designed after the foll ing formula:

All values are subject to voting once weighted and prior to creation of the class prediction values using the principals in the following formula:
Vl (g) = W2 (g) » Sx 2TR,m (s)

Once weighting and vote assignments are completed votes are counted to create a class prediction set that will be used to measure the continuum of unknown samples on the quality spectrum using an approach related to the following formula:
P(x) = " p " i=l,p i=^,q
The resultant of class prediction analysis is a static, quantitative class prediction matrix that is biologically specific for whole blood KNA samples yielding a value that can be used in conjunction with normalization approaches to directly improve the functional analysis of gene expression measurements as a direct correlative to transcript structure and representation.
The algorithms may be further refined as desired, for example, to reduce bias and decreases sampling variability. For example, in some embodiments, one can count the number of dropouts (defined as either no expression value or a value exceeding a specific selected threshold (e.g., a threshold empirically determined to provide desired results)) overall and/or by region. For example, one can create a 3 -level categorized version of the
number of dropouts, using categories of zero, one to three, and more than three dropouts. From this, one can estimate standard deviation across replicates, across regions, and across genes and estimate as well standard deviations for replicates, regions, and genes when restricted to high, medium, and low expressing genes. In some embodiments, standard deviations are estimated under a linear model with the Buckley-James estimator. This estimator allows for censored data (e.g., dropouts). Including dropouts in the estimates of standard deviations reduces bias and decreases sampling variability by including the partial information contained in dropouts.
Model fitting may also be used. In some embodiments, on can fit separate logistic/multinomial regressions to the RNA, cDNA, and microarray quality scores. In some embodiments, to reduce overfitting, one can use the lasso or elastic net methods (or other approaches), which enforce sparse regression models by shrinking all regression coefficients towards zero with a penalty that discourages non-zero coefficients. The result is a small set of predictive variables in a model that is not over-fit. Any desirable variables can be mandated into the models, if desired.
An example of a classification scheme is provided in Table 1, below.

APPENDIX I
Genes for Validation Phase: Expression Scores
 IVNS1ABP NM_006469.4 750 Homo sapiens influenza virus NS1A binding protein (IVNS1ABP), mRNA
Homo sapiens killer cell lectin-like receptor subfamily F, member 1
KLRF1 NM_016523.1 650
(KLRF1), mRNA
LASP1 NM_006148.2 4500 Homo sapiens LIM and SH3 protein 1 (LASP1), mRNA
LCP1 NM_002298.4 6500 Homo sapiens lymphocyte cytosolic protein 1 (L-plastin) (LCP1), mRNA
Homo sapiens leukocyte immunoglobulin-like receptor, subfamily A (with
LILRA5 NM_021250.2 900
TM domain), member 5 (LILRA5), transcript variant 1, mRNA
LPXN NM_004811.2 1100 Homo sapiens leupaxin (LPXN), transcript variant 2, mRNA
LTF NM_002343.2 200 Homo sapiens lactotransferrin (LTF), mRNA
LY75 NM_002349.2 800 Homo sapiens lymphocyte antigen 75 (LY75), mRNA
NCF1 NM_000265.4 5500 Homo sapiens neutrophil cytosolic factor 1 (NCF1), mRNA
Homo sapiens neutrophil cytosolic factor 2 (NCF2), transcript variant 1,
NCF2 NM_000433.3 8500
mRNA
Homo sapiens neutrophil cytosolic factor 4, 40kDa (NCF4), transcript
NCF4 NM_013416.3 4500
variant 2, mRNA
NCL NM_005381.2 2000 Homo sapiens nucleolin (NCL), mRNA
Homo sapiens nuclear receptor coactivator 1 (NCOA1), transcript variant
NC0A1 NM_003743.4 850
1, mRNA
Homo sapiens NLR family, pyrin domain containing 1 (NLRP1), transcript
NLRP1 NM_033004.3 600
variant 1, mRNA
Homo sapiens 2'-5'-oligoadenylate synthetase 2, 69/71kDa (OAS2),
0AS2 NM_002535.2 500
transcript variant 2, mRNA
0AS3 NM_006187.2 650 Homo sapiens 2'-5'-oligoadenylate synthetase 3, lOOkDa (OAS3), mRNA
PDLIM1 NM_020992.2 900 Homo sapiens PDZ and LIM domain 1 (PDLIMl), mRNA
Homo sapiens PDZ and LIM domain 2 (mystique) (PDLIM2), transcript
PDLIM2 NM_176871.2 950
variant 1, mRNA
Homo sapiens v-raf-1 murine leukemia viral oncogene homolog 1 (RAF1),
RAF1 NM_002880.3 3000
mRNA
Homo sapiens Rho-associated, coiled-coil containing protein kinase 2
R0CK2 NM_004850.3 200
(ROCK2), mRNA
SELL NM_000655.3 8500 Homo sapiens selectin L (SELL), mRNA
Homo sapiens selectin P (granule membrane protein 140kDa, antigen
SELP NM_003005.3 700
CD62) (SELP), mRNA
Homo sapiens serpin peptidase inhibitor, clade A (alpha-1 antiproteinase,
SERPINA1 NM_000295.4 7500
antitrypsin), member 1 (SERPINA1), transcript variant 1, mRNA
Homo sapiens sortilin-related receptor, L(DLR class) A repeats-containing
S0RL1 NM_003105.4 7500
(SORL1), mRNA
Homo sapiens signal transducer and activator of transcription 6,
STAT6 NM_003153.3 1000
interleukin-4 induced (STAT6), mRNA
STX4 NM_004604.3 600 Homo sapiens syntaxin 4 (STX4), mRNA
Homo sapiens spectrin repeat containing, nuclear envelope 2 (SYNE2),
SYNE2 NM_182910.2 400
transcript variant 2, mRNA
Homo sapiens testis derived transcript (3 LIM domains) (TES), transcript
TES NM_015641.2 750
variant 1, mRNA
Homo sapiens triggering receptor expressed on myeloid cells 1 (TREM1),
TREM1 NM_018643.2 4500
mRNA
Homo sapiens transient receptor potential cation channel, subfamily M,
TRPM2 NM_003307.3 400
member 2 (TRPM2), mRNA
TXNIP NM_006472.3 8000 Homo sapiens thioredoxin interacting protein (TXNIP), mRNA
VIM NM_003380.3 9500 Homo sapiens vimentin (VIM), mRNA
Homo sapiens zeta-chain (TCR) associated protein kinase 70kDa (ZAP70),
ZAP70 NM_001079.3 650
transcript variant 1, mRNA
APPENDIX II
Assay Designs for Validation Phase
* UPL probe sequence orientation may be as listed OR as its reverse complement.

Rvs 585 604 59 50 a
Fwd ctcgggggtctacttcgag 103 121 59 63
Clorf3 NM_004848.
1650 34 ctgcctct 154
8 2
Rvs ggacctgggtgaccttgat 176 194 59 58
Fwd ctgctctttgtgcattcagc 495 514 59 50
N M_001146
CAPN2 3270 50 tctggagc 529
068.1 gcttcatagcatccgttgat
Rvs 562 583 60 45 ct
Fwd tcagtgcctgttttgtcacc 232 251 59 50
NM_004244.
CD163 4231 17 aggagctg 274
4
Rvs tccactctcccgctacactt 303 322 59 55 cactactgggctcagggaa
Fwd 302 321 60 55 a
NM_001242.
CD27 1320 72 ttcctggc 343
4
tcacagtccttcacgagga
Rvs 353 372 59 50 a
Fwd ctctgctcctcctgcttgtc 399 418 60 60
CD300 NM_006678.
1548 6 ttcctctg 429
C 3 tcatagcgacactgcacac
Rvs 478 498 60 52 tc
tcctgtttttcttcaacttgc
Fwd 206 228 59 39 tc
N M_001040
CD53 1572 5 tgtggctg 238
033.1
gtagatcccaaagcccaa
Rvs 251 270 59 45 aa
Fwd ggctggctgtgcttttct 196 213 59 56
NM_001251.
CD68 1872 3 cccagcag 222
2 tttttgtgaggacagtcatt
Rvs 253 274 59 41 cc
Fwd ctccagcttctgctcctga 191 209 59 58
NM_004233.
CD83 2478 36 ctggctcc 224
3
Rvs ggagcaagccaccttcac 245 262 59 61 accagctgtagctgaacgt
Fwd 132 152 59 52 ct
CDC42 N M_001038
3193 22 ctccacca 156
SE1 707.1
catatctccacgtgtgtcca
Rvs 182 202 59 52 g
gtccaagatcacaaagctg
Fwd 140 160 59 48
NM_000760. gt
CSF3R 3003 18 tcctgctg 225
2
Rvs ccgcactcctccagacttc 240 258 60 63 tggaccctacctacatcct
Fwd 217 237 59 52
NM_014314. ga
DDX58 4759 69 cttcctcc 260
3
Rvs ggcccttgttgtttttctca 287 306 60 45
tcactgatacccggaagga
Fwd 250 269 59 55 c
NM_001961.
EEF2 3163 9 tggtgatg 284
3
ttcaagtcattctccgaga
Rvs 323 343 59 48 gc
cctgaatgacatcggggta
Fwd 741 760 60 50
NM_000129. a
F13A1 3863 78 agctggag 796
3
Rvs gtccaggatgccatcttca 816 834 59 53 agaggcaggtgtcattgga
Fwd 284 303 60 55
NM_002003.
FCN1 1292 1 cctggagc 324 g
2
Rvs ctggtcctgcctttccag 334 351 59 61
Fwd agccacatcgctcagacac 83 101 60 58
NM_002046.
GAPDH 1310 60 cttcccca 104
3
Rvs gcccaatacgaccaaatcc 130 148 60 53 agatgcaaccaatcctgct
Fwd 65 84 59 45
NM_004131. t
GZMB 941 18 tcctgctg 98
4
Rvs catgtcccccgatgatct 125 142 59 56
Fwd ggtcgtgtgcttggagga 56 73 60 61
NM_000628.
IL10RB 1935 20 ccagccag 120
3 ggtaccattcccaatgctg
Rvs 145 164 60 50 a
Fwd ctcttcgcagtggggaca 312 329 60 61
NM_172200.
IL15RA 1843 47 tccagtgt 343
1
Rvs cccagatgtctgcgtgttc 433 451 60 58 gtagccgaggaggaagca
Fwd 421 439 59 58
NM_181359. t
IL6R 4082 10 ccacctcc 521
1
Rvs actggtcagcacgcctct 531 548 59 61 gcttttgaggacccagatg
Fwd 261 280 59 50 t
NM_002185.
IL7R 1809 9 tggtgatg 284
2
aggcactttacctccacga
Rvs 318 337 59 55 g
Fwd gctgtccccacaaaaagtg 479 497 59 53
NM_001127
ITGB2 2932 27 caggcagc 519
491.1
Rvs ccggaaggtcacgttgaa 531 548 60 56
121 123
Fwd atcaactgggtgcagcgta 60 53
8 6
IVNS1A NM_006469. 124
4205 14 ctgggaga
BP 4 1
tcagctgagtagtacaagg 128 130
Rvs 59 40 tttgaa 2 6
NM_016523. tgcccaaacatctcaactt
KLRF1 1242 48 ttcccagt 184 Fwd 121 142 60 41
1 aca
aataccattcacggttcca
vs 194 214 59 43 ga
Fwd gaaaaccttcgcctcaagc 539 557 59 53
NM_006148.
LASPl 4109 50 tctggagc 568
2
Rvs tgaaacctttgcccttgttc 607 626 60 45
Fwd ttggcacccaacactccta 573 591 60 53
NM_002298.
LCP1 3808 6 ttcctctg 594
4
Rvs ccagggctttgtttatccag 622 641 59 50
Fwd agtctgcctgtggcatgg 56 73 60 61
NM_021250.
LILRA5 1365 80 cctggaga 813
2 gctgtgcagatggatgaga
Rvs 132 151 59 55 c
ttggatgtaggacaatgga
Fwd 132 153 59 41
NM_004811. aga
LPXN 1926 17 aggagctg 219
2
Rvs cctttctggaatgctgatcc 235 254 59 50 gaccgcagacatgaaactt
Fwd 29 48 59 50
NM_002343.
LTF 2390 18 tcctgctg 58 g
2
Rvs gccagccagacacagtcc 81 98 60 67 aatgcatctgatgtctgga
Fwd 472 493 59 41 aga
NM_002349.
LY75 6927 6 ttcctctg 503
2
ccataagagttcccatctct
Rvs 545 566 59 50 gg
Fwd cctgctgggctttgagaa 100 117 60 56
NM_000265.
NCF1 1409 20 ccagccag 129
4 gacaggtcctgccatttca
Rvs 158 177 60 55 c
aaaatcgacaaggcgatg
Fwd 747 765 60 47
NM_000433. g
NCF2 2429 38 ctgcttcc 775
3
gggatcaccactggctcat
Rvs 789 808 60 55 a
Fwd gcgagactctccacctgct 146 164 60 63
NM_013416.
NCF4 1646 3 cccagcag 195
3 catccggaagctgttcaaa
Rvs 220 239 60 50 g
Fwd ccacttgtccgcttcaca 111 128 59 56
NM_005381.
NCL 2732 70 ccgccgcc 131
2
Rvs tcttggggtcaccttgattt 168 187 59 45 tcacagccaaaatcaattc
Fwd 937 957 59 33 aa
NM_003743.
NC0A1 6895 58 ctccatcc 960
4
gccgtgcaatacaaatcag 100
Rvs 984 59 45 a 3
Fwd agctgcctgacacatctgg 971 989 59 58
NM_033004. 100
NLRP1 5623 13 ctctgcct
3 8 ggagcttggaagagcttgg 102 104
Rvs 60 55 t 5 4 gagaatctctttcgaggtg
Fwd 548 569 60 50 ctg
NM_002535.
OAS2 3647 23 cccagccc 603
2
caaggatcttttgagctctc
Rvs 621 641 59 48 g
tggatggatgttagcctgg
Fwd 508 527 60 50
NM_006187. 172 t
OAS3 6646 8 ctgccttc
2 7
Rvs cttgtggcttgggtttgac 565 583 59 53 catgaccacccagcagat
Fwd 109 128 59 55
PDLIM NM_020992. ag
1462 81 ccagggcc 133
1 2
Rvs gccttgcttccaggagtg 208 225 59 61 gcccatcatggtgactaag
Fwd 209 228 60 55
PDLIM NM_176871.
4611 80 cctggaga 267 g
2 2
Rvs cgttgatggccacgatta 277 294 59 50
107 109
Fwd tgtttccaggatgcctgtt 59 47
5 3
NM_002880. 117
RAF1 3291 13 ctctgcct
3 5
ggacattaggtgtggatgt 118 120
Rvs 60 52 eg 5 5 tcagtggcattgggataac 152 154
Fwd 60 43 at 0 0
NM_004850. 155
R0CK2 6401 17 aggagctg
3 2
tgctgtctatgtcactgctg 157 159
Rvs 59 50 ag 2 3
Fwd ggggtggacaatgctctg 261 278 60 61
NM_000655.
SELL 2448 72 ttcctggc 286
3 taagtccagcagtcggttc
Rvs 301 320 60 55 c
actgtaagcagtctgggtt
Fwd 10 30 59 52
NM_003005. gg
SELP 3185 8 ctgccttc 34
3
gatggctatttggcagttg
Rvs 70 89 60 50 g
gettaaataeggacgagg
Fwd 185 205 59 48 aca
SERPIN NM_000295.
3220 73 tcctcagc 216
Al 4
acgagacagaagacggca
Rvs 261 280 59 50 tt
NM_00 105. 1092 144 gggaacctgggagtttctt 142 144
S0RL1 19 ctccagcc Fwd 59 55 4 4 4 c 1 0
148 149
vs acagccctgggaaagctc 60 61
2 9 agaagacagcagaggggt
Fwd 226 245 59 55
NM_003153. tg
STAT6 3993 54 tggtctc 287
3
Rvs cactttttctgggggcatc 298 316 60 53 caaactggggaataaagt
Fwd 383 404 59 45
NM_004604. ccag
STX4 1403 62 cagcaggt 417
3
Rvs cagctcctgcttcatgctc 455 473 59 58
Fwd ggatggtggcaaagaagg 461 478 59 56
NM_182910.
SYNE2 2586 4 cttcctgc 506
2 catctcccatctgtcgaag
Rvs 553 572 60 55 g
Fwd ggacccataggacgcgtta 161 179 60 58
NM 015641.
TES 2766 85 tccaggtc 185
2 cgtgacctaagcccatctt
Rvs 205 224 59 55 c
acaggaaggatgaggaag
Fwd 56 76 59 52 acc
NM_018643.
TRE 1 948 66 cagcagcc 87
2
ctgcccctctttcagttcat
Rvs 149 169 59 48 a
cctgagccagaaggtgaa
Fwd 502 521 60 50 aa
NM_003307.
TRP 2 5876 14 ctgggaga 534
3
gggtcatgaggtggtagat
Rvs 558 578 59 52 ca
cttctggaagaccagccaa
Fwd 570 589 59 55 c
NM_006472.
TXNIP 2953 85 tccaggtc 616
3
gaagctcaaagccgaactt
Rvs 638 657 60 50 g
gtttcccctaaaccgctag
Fwd 217 236 59 55
NM_003380. g
VIM 2151 56 tgctgtcc 252
3
Rvs agcgagagtggcagagga 267 284 59 61 ggagctcagcagacacca
Fwd 32 50 59 63
NM_001079. g
ZAP70 2450 3 cccagcag 92
3
Rvs ccaatgccaatggagagc 113 130 60 56
 129 130
Fwd ggctttggcatctatgaggt 59 50
0 9
NM_001146 327 131
CAPN2 82 cagaggag
068.1 0 2
133 134 vs gctgaggtggatgttggtct 60 55
0 9
120 122
Fwd gaagatgctggcgtgacat 59 53
3 1
NM 004244. 423 123
CD163 50 tctggagc
4 1 8
124 126
Rvs gctgcctccacctctaagtc 59 60
9 8
Fwd tccaaacccttcgctgac 580 597 59 56
NM_001242. 132
CD27 30 cctcagcc 629
4 0
Rvs tggcctccagcatctcac 657 674 60 61
Fwd gaggttgaggtgtccgtgtt 737 756 60 55
CD300 NM 006678. 154
19 ctccagcc 778
C 3 8
Rvs cttcgtgggaggacctga 806 823 59 61 cactcagacaatagcacca
Fwd 547 568 59 50
NM_001040 157 agg
CD53 58 ctccatcc 579
033.1 2
cgtgccatttataccacaac
Rvs 601 621 59 43 a
Fwd tcagctttggattcatgcag 859 878 59 45
NM_001251. 187
CD68 67 tgctggag 882
2 2 gagccgagaatgtccactg
Rvs 950 959 60 55 t
Fwd acggtctcctgggtcaagt 314 332 59 58
NM_004233. 247
CD83 58 ctccatcc 354
3 8
Rvs ccctgaggtggtcttcctg 368 386 60 63 gggaacatgagtgaattttg
Fwd 565 585 59 43
CDC42 NM_001038 319 g
26 cagcccag 592
SE1 707.1 3
Rvs cggtcaatccgtcttctctt 631 650 59 50 tgtaccagaatatgggcatc
Fwd 762 783 59 45
NM_000760. 300
CSF3 13 ctctgcct 789 tg
2 3
Rvs ggggctccagtttcacaa 849 856 59 56 atgtgggcaatgtcatcaa 230 232
Fwd 59 40 a 8 7
NM_014314. 475 234
DDX58 13 ctctgcct
3 9 2
a agca cttgcta cctcttgct 235 237
Rvs 60 50 c 3 4 ctggagatctgcctgaagg 174 176
Fwd 60 55 a 3 2
NM_001961. 316 176
EEF2 25 ctcctcca
3 3 5
179 181
Rvs gagacgaccgggtcagatt 60 58
8 6
F13A1 56 tgctgtcc Fwd ccttcctgttggatttggag 59 50
NM_000129. 386 131 127 129
3 3 1 8 7
134 135
Rvs ggccacaccgatacatgc 60 61
0 7
Fwd gctggggaacgacaacat 653 670 59 56
NM_002003. 129
FCN1 38 ctgcttcc 690
2 2
Rvs cctcaaagtccaccaggtct 710 729 59 55
Fwd - - - - -
NM_002046. 131
GAPDH - - - 3 0
Rvs - - - - -
Fwd cttctccaacgacatcatgc 378 397 59 50
NM_004131.
GZ B 941 78 agctggag 404
4
Rvs acagctctggtccgcttg 420 437 60 61 tggaaaaacggtactgatg
Fwd 574 595 59 36
NM_000628. 193
IL10RB 1 cctggagc 639
3 5
aaccctcgaacttgaacac
Rvs 660 680 59 43 aa
acaacccccagtctcaaat
Fwd 574 593 59 50
NM_172200. 184
IL15RA 37 ccagggca 606 g
1 3
Rvs tgccgtcgttactgtggag 636 654 60 58
Fwd ggactgtgcacttgctggt 748 756 59 58
NM 181359. 408
IL6R 38 ctgcttcc 797
1 2
Rvs attgctgagggggctctt 807 824 59 56 ggagaaaagagtctaacct
Fwd 423 445 59 43 gcaa
NM_002185. 180
IL7R 12 ctccttcc 509
2 9
gatgtattaaatgtcaccac
Rvs 521 547 60 33 aaagtca
123 125
Fwd cagcaatgtggtccaactca 60 50
5 4
NM_001127 293 127
ITGB2 25 ctcctcca
491.1 2 7
129 131
Rvs gagggcgttgtgatccag 60 61
3 0 cgttgcttcagaaaagactt 149 151
Fwd 59 41 ca 6 7
IVNS1A NM_006469. 420 153
76 tggctgtg
BP 4 5 7
gaaaaatgacacagaatat 154 157
Rvs 59 35 accatcc 7 2
Fwd tgatctccttgatcctgttgg 228 248 60 48
NM_016523. 124
KLRF1 47 tccagtgt 312
1 2 ttcttcttgtgccattattcac
Rvs 327 350 59 33 tt
Fwd accacatcccgaccagtg 816 833 60 61
NM_006148. 410
LASP1 3 cccagcag 852
2 9
Rvs 872 893 60 55 ccttgtagccaccataggac
tg
aaccctcgagtcaatcattt 146 148
Fwd 59 43
6
NM 002298. 380 150 g 6
LCPl 37 ccagggca
4 8 4
ttgatcttttcatagagctgg 151 153 vs 59 38 aag 6 9 gcagggagataccgctgtt
Fwd 451 470 60 55
NM 021250. 136 a
LILRA5 1 cctggagc 510
2 5
Rvs tgagagggtgggtttgttgt 536 555 60 50 caatatccaggagctcaat
Fwd 337 361 60 44
NM_004811. 192 gtctac
LPXN 77 ccaccacc 389
2 6
Rvs tgagctcatccaactgagca 415 434 60 50 tgtgtacactgcaggcaaat 128 130
Fwd 60 48
NM_002343. 239 132 g 9 9
LTF 53 ctctgcca
2 0 7
135 136
Rvs ggatcagggtcactgctttg 60 55
0 9
198 199
Fwd taagcctgatgacccctgtc 60 55
0 9
NM_002349. 692 200
LY75 53 ctctgcca
2 7 8
caattctttctgcatggaat 204 206
Rvs 60 38 acct 2 5 ccgagatctacgagttccat
Fwd 204 226 59 43
NM_000265. 140 aaa
NCF1 33 agctggga 294
4 9
Rvs ctgcccgtcaaaccactt 305 322 59 56 caactaccttgaaccagttg 114 117
Fwd 60 48 age 8 0
NM_000433. 242 119
NCF2 45 ctggggct
3 9 2
120 122
Rvs atgtcggactgcggagag 59 61
8 5
Fwd gcagctccgagagcagag 695 712 60 67
NM_013416. 164
NCF4 78 agctggag 760
3 6 ccgactgaggaggaagatc
Rvs 771 790 60 55 a
gtggatgtcagaattggtat 115 117
Fwd 59 42 gact 6 9
NM_005381. 273 121
NCL 80 cctggaga
2 2 8
caaaccagtgagttccaac 122 124
Rvs 59 50 S 9 8 tgagatcaggcatgcaaca 352 354
Fwd 60 50
7 6
NM 003743. 689 355 g
NC0A1 83 cagccacc
4 5 9
359 360
Rvs gtacagttcccgctgacgtt 60 55
0 9
Fwd catcctgcctgcaaactca 60 53
7 5
NM_033004. 562 342
NLRPl 45 ctggggct
3 3 1
345 347
Rvs cctcagttcctgcctcatct 59 55
2 1 tgttaacatcatccgtacatt 124 127
Fwd 59 38 cct 7 0
NM 002535. 364 128
OAS2 38 ctgcttcc
2 7 0
132 133
Rvs ctttggcggttgatcctc 59 56
1 8
170 172
Fwd gacggatgttagcctgctg 59 58
7 5
NM_006187. 664 174
OAS3 43 ctgcccca
2 6 2
176 177
Rvs tggggatttggtttggtg 60 50
1 8 aggctgcacagacaacttg
Fwd 322 341 59 50
PDLIM NM_020992. 146 a
54 ctggtctc 373
1 2 2
Rvs atggatgacgcttcccttc 395 413 60 53
Fwd ccagctcctttcggctct 850 857 60 61
PDLIM NMJL76871. 461
30 cctcagcc 884
2 2 1
Rvs gtgagctgggcaagaagg 910 927 59 61 tgggaaatagaagccagtg 143 145
Fwd 59 43 aa 9 9
NM 002880. 329 146
RAF1 56 tgctgtcc
3 1 4
cctttaggatctttactgcaa 152 155
Rvs 59 40 catc 6 0 tgaagaaaagaccaaactt 311 313
Fwd 60 32 ggtaaa 0 4
NM_004850. 640 314
R0CK2 84 tctgctgc
3 1 0
317 319
Rvs agttgggcagccaaagagt 59 53
5 3
Fwd gccccagtgtcagtttgtg 762 780 60 58
NM_000655. 244
SELL 57 ctggggcc 801
3 8 ccaaagggtgagtacagtc
Rvs 821 841 60 52 ca
Fwd ttagttggaccggaagtggt 957 976 59 50
NM_003005. 318 100
SELF 23 cccagccc
3 5 7 102 104
Rvs caggtgctgacactgcaca 60 58
8 6 gcacctggaaaatgaactc 111 113
Fwd 59 48 ac 6 6
SERPIN NM_000295. 322 114
9 tggtgatg
Al 4 0 6
gggtaaatgtaagctggca 118 120
Rvs 59 48 ga 0 0
NM_O031O5. 109 343 tggagacatgagcgatgag 338 340
S0RL1 85 tccaggtc Fwd 60 50 4 24 2 a 9 8
gactcctggcaacgaaact 344 346
Rvs 60 55 g 4 3
176 178
Fwd ggtcgcagttcaacaagga 59 53
7 5
NM_003153. 399 179
STAT6 3 cccagcag
3 3 0
gtccaggacaccatcaaac 182 184
Rvs 60 55 c 1 0
Fwd tgcagctgaaggccataga 520 538 60 53
NM_004604. 140
STX4 69 cttcctcc 548
3 3
Rvs cgaattgctgggacagga 610 627 60 56 gtgtcggagggaactaatg 110 112
Fwd 59 55 c 6 5
NM 182910. 258 113
SYNE2 17 aggagctg
2 6 5
114 116
Rvs tcca cttgaggttga cgttct 59 48
5 5 tgtctccatcaatacagtta
Fwd 490 516 60 37
NM_015641. 276 cctatga
TES 63 ctcctcct 522
2 6
Rvs tccttgggtagcatctgcat 560 579 60 50 tctggactgtatcagtgtgt
Fwd 386 410 60 44
NM_018643. gatct
TREM1 948 75 cagcctcc 413
2
Rvs ccaggggtccctgaaaaa 472 489 60 56
197 199
Fwd accttctcatttgggccatt 60 45
1 0
NM_003307. 587 200
TRPM2 24 cagctccc
3 6 4
203 204
Rvs cgatgcagtcctggctct 60 61
1 8
110 112
Fwd ttcgggttcagaagatcagg 60 50
5 4
NM_006472. 295 113
TXNIP 26 cagcccag
3 3 4
ggatccaggaacgctaaca 117 119
Rvs 59 50 t 7 6 gaccagctaaccaacgaca
Fwd 897 917 60 48
NM_003380. 215 aa
VIM 39 ctccacct 928
3 1
Rvs gaagcatctcctcctgcaat 977 996 59 50
Fwd gtga eta cgtgcgccaga c 578 596 60 63
NM_001079. 245
ZAP70 1 cctggagc 618
3 0 cgtagcaatgagcttctcca
Rvs 652 672 60 52 c

68.1 0 ct 6 agatt 3 8
tcgtccagagaatgtagaact 178 180
Rvs 59 48 cc 7 9 aatgggaatttataacccagt 358 360
Fwd 59 38
NM_004244. 423 tccagg 363 gag 5 8
CD163 85
4 1 tc 5
364 366
Rvs ggtgaatttctgctccattca 60 43
7 7 catcaacgaaggaaatatag
Fwd 845 871 60 33
NM_001242. 132 ctgccc atcaaac
CD27 43 916
4 0 ca
Rvs ctcctggatggggatggt 941 958 60 61
Fwd agcgtgaccagaaaggaca 845 863 59 53
CD300 NM 006678. 154 cccagc
23 872
C 3 8 cc
Rvs gaagcggacattgctgaac 895 913 59 53
Fwd tggtttcattccaatttcctg 700 720 59 38
NM_0010400 157 tggtga
CD53 9 732
33.1 2 tg Rvs aggacatccccaacacctc 757 775 59 58
105 107
Fwd gtccacctcgacctgctct 60 63
3 1
NM 001251. 187 cctgga 107
CD68 1
2 2 gc 9
112 114
Rvs cactggggcaggagaaact 60 58
2 0
Fwd acagagcggagattgtcctg 600 619 60 55
NM_004233. 247 tggctct
CD83 21 624
3 8 g ctctgtagccgtgcaaactta
Rvs 666 687 59 50 c
tctaggggcttatagctccaa
Fwd 796 820 59 40
CDC42 NM_0010387 319 cagccc taat
26 859
SEl 07.1 3 ag
Rvs ctggtaggggcagcatttc 869 887 60 58
219 221
Fwd ctgggtgcccacaatcat 60 56
4 1
NM_000760. 300 catcctc 221
CSF3R 88
2 3 c 5
225 227
Rvs gcactgtgagcttggtgatg 60 55
4 3
464 466
Fwd ccatgtaagacttgcctgctt 59 48
9 9
NM_014314. 475 cttctgc 467
DDX58 29
3 9 c 3
gaggcttaatagattcacagt 471 474
Rvs 60 40 tcca 6 0
230 232
Fwd gagcccatctaccttgtgga 60 55
7 6
NM_001961. 316 tccagt 232
EEF2 47
3 3 gt 9
235 237
Rvs cctgttcaaaaccccgtaga 59 50
9 8
F13A1 81 Fwd 60 38
NM_000129. 386 ccaggg 221 tggagtaacaagaccaatga 213 215
3 3 cc 3 agaa 6 9
223 224
Rvs tggctatcagcttccgatg 59 53
0 8 tgctaagtacaaatcattcaa
Fwd 743 767 59 36
NM_002003. 129 ctctgcc ggtg
FCNl 13 775
2 2 t
Rvs ggcccgttagagaattaccc 824 843 59 55
Fwd gagtccactggcgtcttcac 391 410 60 60
NM_002046. 131 ctgggg
GAPDH 45 425
3 0 ct
Rvs ttcacacccatgacgaacat 490 509 59 45
Fwd gggggacccagagattaaaa 633 652 60 50
NM_004131. ccaggg
GZ B 941 37 705
4 ca
Rvs ccattgtttcgtccataggag 717 737 59 48
Fwd gctgtggtgcgtttacaaga 831 850 59 50
NM_000628. 193 cttctcc
IL10RB 7 864
3 5 c
Rvs gaggatggcccaaaaactct 900 919 60 50
Fwd gtggctatctcca cgtcca c 931 950 60 60
NM_172200. 184 tcctgct
IL15RA 18 953
1 3 g 102 104
Rvs catggcttccatttcaacg 60 47
9 7 cggtcaaagacattcacaac 121 123
Fwd 59 43 a 8 8
NM_181359. 408 tg tgg 125
IL6R 67
1 2 ag 4
126 128
Rvs gcgtcgtggatgacacagt 60 58
4 2 a a agttttaa tgca cgatgta
Fwd 570 594 59 32 gctt
NM_002185. 180 ttcctgg
IL7R 72 598
2 9 c
tgtgctggata a a ttca catg
Rvs 626 647 60 41 c
218 219
Fwd gggactcagagggctgct 60 67
2 9
NM_0011274 293 tcctgct 222
ITGB2 18
91.1 2 g 0
226 228
Rvs ggcctgccacacactctc 60 67
6 3
223 225
Fwd ggactttaattgcacccatga 59 43
9 9
IVNS1A NM_006469. 420 aggagc 227
17
BP 4 5 tg 3
231 233
Rvs aaccatcaaagccaccacat 60 45
2 1
Fwd cgagatctgcagaccagaca 378 397 60 55
NM_016523. 124 agctgg
KLRF1 78 464
1 2 ag gagattttctttccaaacaat
Rvs 481 506 59 31 acaca
LASP1 77 932 Fwd cagccccagtctccatacag 900 919 60 60
NM_006148. 410 ccacca
2 9 cc Rvs ggcggcgctgtagtcata 962 979 60 61
171 173
Fwd gccttgatttggcagctaat 59 45
5 4
NM_002298. 380 tggtgg 177
LCPl 49
4 8 cc 1
179 182
Rvs tttcattcacccagttgacaat 59 36
9 0
Fwd tggtcagaacccagtgacct 793 812 60 55
NM_021250. 136 aggagc
LILRA5 68 831
2 5 ag Rvs tgttttgtgacggactgagg 846 865 59 50
Fwd ggagaggtgtttggtgcag 866 884 59 58
NM_004811. 192 cagcca
LPXIM 83 956
2 6 cc gaaaggtagttttccaacact
Rvs 971 993 59 43 gg
ctaatctgaaaaagtgctcaa 211 213
Fwd 59 40 cctc 0 4
NM_002343. 239 ccagga 213
LTF 79
2 0 gg 8
216 218
Rvs gccatcttcttcggttttacttc 60 43
5 7
355 357
Fwd tggatcggactcttcagtca 59 50
3 2
NM_002349. 692 cagccc 362
LY75 26
2 7 ag 7
363 365
Rvs cagtcttcgagttgcccatta 60 48
9 9
Fwd ctgcccaccaagatctcc 380 397 59 61
NM_000265. 140 ccacct
NCF1 10 406
4 9 cc
Rvs ttgggcatcaagtatgtctctg 477 498 60 45 ggaaggggatataatcctgg 171 173
Fwd 60 50
NM_000433. 242 cttcca 175 tg 2 3
NCF2 11
3 9 g 7
176 178
Rvs ccaccttccctttgcactc 60 58
7 5
117 119
Fwd gtcacccccttagggacatc 60 60
5 4
NM_013416. 164 cttcctc 120
NCF4 69
3 6 c 0
gagctatgtcctctctctgga 125 128
Rvs 59 50 act 9 2
178 179
Fwd gaaattgagggcagagcaat 59 45
0 9
NM_005381. 273 ctccag 180
NCL 19
2 2 cc 2
tgacaaacagagttttggatg 184 187
Rvs 60 41 g 9 0
436 438
Fwd gcaaccagctctcatccact 60 55
1 0
NM_003743. 689 cccagc 440
NC0A1 3
4 5 ag 9
442 444
Rvs gacgtcagcaaacacctgaa 59 50
7 6
442 444
Fwd cactgtgtctgggtctggttc 60 57
5 5
NM_033004. 562 cagcat 444
NLRPl 89
3 3 cc 8
448 450
Rvs tcttctccagggcttcgata 59 50
6 5
159 160
Fwd cctgcctttaatgcactgg 59 53
0 8
NM_002535. 364 ctggct 162
OAS2 36
2 7 cc 1
164 166
Rvs atgagccctgcataaacctc 59 50
1 0
275 276
Fwd gtgctgccagcctttgac 60 61
2 9
NM_006187. 664 cctgga 279
OAS3 1
2 6 gc 2
ggtcgacgtagacttgagag 280 282
Rvs 59 57 c 4 4
Fwd aacaatgccctggagtcaaa 587 606 60 45
PDLIM NM_020992. 146 ctgctg
74 609
1 2 2 cc
Rvs aggctgagcatggtctaagg 642 661 59 55
108 110
Fwd gggctgaacctgaagatgc 60 58
3 1
PDLIM NM_176871. 461 ctccac 117
22
2 2 1 ca 1
119 121
Rvs cctggtcttcctcctgtcc 59 63
3 1 ggttgaacaacctactggctc 191 193
Fwd 59 50 t 8 9
NM_002880. 329 ctgggg 195
RAF1 57
3 1 cc 1
196 198
Rvs gggttgttatcctgcattcg 60 50
7 6
458 460
Fwd acagcttgccccaaacaa 60 50
9 6
NM_004850. 640 tgcctt 461
R0CK2 8
3 1 c 7
tggaagaatacgatcaccttg 464 466
Rvs 59 41 a 3 4 tcaaatcctagtccaatatgt 112 115
Fwd 60 31 caaaa 6 1
NM_000655. 244 cagtgg 120
SELL 59
3 8 ca 8
cccagagaatgcagtaacca 121 123
Rvs 59 48 t 9 9 caaaaagatgatgggaaatg 246 248
Fwd 59 38 c 6 6
NM_003005. 318 tggctgt 249
SELF 76
3 5 g 9
catgggtgtttatggaaacct 255 257
Rvs 59 41 t 7 8
127 129
Fwd aatggggctgacctctcc 60 61
3 0
SERPIN NM_000295. 322 cagagg 129
82
Al 4 0 ag 8
133 134
Rvs gtcagcacagccttatgcac 59 55
0 9
cgattctaaatccattaccac 528 530
Fwd 60 39 ca 5 7
NM_003105. 109 ccacca 532
S0RL1 77
4 24 cc 5
533 535
Rvs caccatagctgtcaatgtgga 59 48
8 8
240 242
Fwd tcaacgtgttgtcagccttc 59 50
6 5
NM_003153. 399 cagcct 245
STAT6 64
3 3 gg 2
247 249
Rvs gggtgaggctggtcaaag 59 61
6 3
Fwd ttttctggctaccgaagtgg 899 918 60 50
NM_004604. 140 ctcctgc
STX4 51 988
3 3 c 100 101
Rvs gttctccagggccgtctt 60 61
2 9
129 131
Fwd taatggccttgcagggaac 60 53
4 2
NM_182910. 258 cagcct 136
SYNE2 75
2 6 cc 5
139 141
Rvs tctcactgctctga a ctttgct 59 45
7 8
Fwd ttcctggaggggatagaagc 804 823 60 55
NM_015641. 276 cccagc
TES 3 826
2 6 ag atactcagtttgcagcaatag
Rvs 887 909 59 39 ca
ttacaaatgtgacagatatca
Fwd 639 664 59 35 tcagg
NM_018643. ccagcc
TREM1 948 20 692
2 ag
aagaccaggctcttactcagg
Rvs 705 726 59 50 a
cgaggacatcagcaataagg 354 356
Fwd 59 48 t 4 4
NM_003307. 587 tccagg 358
TRPM2 85
3 6 tc 7
360 361
Rvs atggagcccgacctcttc 60 61
1 8
143 145
Fwd atgcccctgagttcaagttc 59 50
8 7
NM_006472. 295 ccacca 146
TXNIP 77
3 3 cc 1
149 151
Rvs actgcacattgttgttgagga 59 43
5 5
161 163
Fwd tacaggaagctgctggaagg 60 55
1 0
NM_003380. 215 ctctgcc 164
VIM 13
3 1 t 8
169 171
Rvs accagagggagtgaatccag 59 55
5 4
147 148
Fwd gctgcacaagttcctggtc 59 58
0 8
NM_001079. 245 ctcctcc 149
ZAP70 52
3 0 c 6
153 155
Rvs tcatccccatggacacct 59 56
8 5
APPENDIX III
Assay Validation Phase: RNA Extraction Quality Control Data
Nanodrop ND-8000 RNA Yield Data:
Sample ID ng/μΙ Α26Ό mm 260/280 260/230 Constant Yield (μ§)
30.48 0.762 0.315 2.42 0.18 40 3.66
6.99 0.175 0.038 4.59 0.05 40 0.84
28.46 0.712 0.303 2.35 0.12 40 3.42
28.08 0.702 0.29 2.42 0.19 40 3.37
65.4 1.635 0.711 2.3 0.32 40 7.85
LabChip 90 HT Microcapillary Electrophoresis RNAQuality Data :


Sample E

Time (seconds)
Assay Validation Phase: cDNA Synthesis and Amplification Quality
Nanodrop D-8Q00 cDNA Yield Data: L I 2 3 4 5 6 7 8 9 10 ll 12

LabChip 90 HT Microcapillary Electrophoresis cDNAQuality Data:
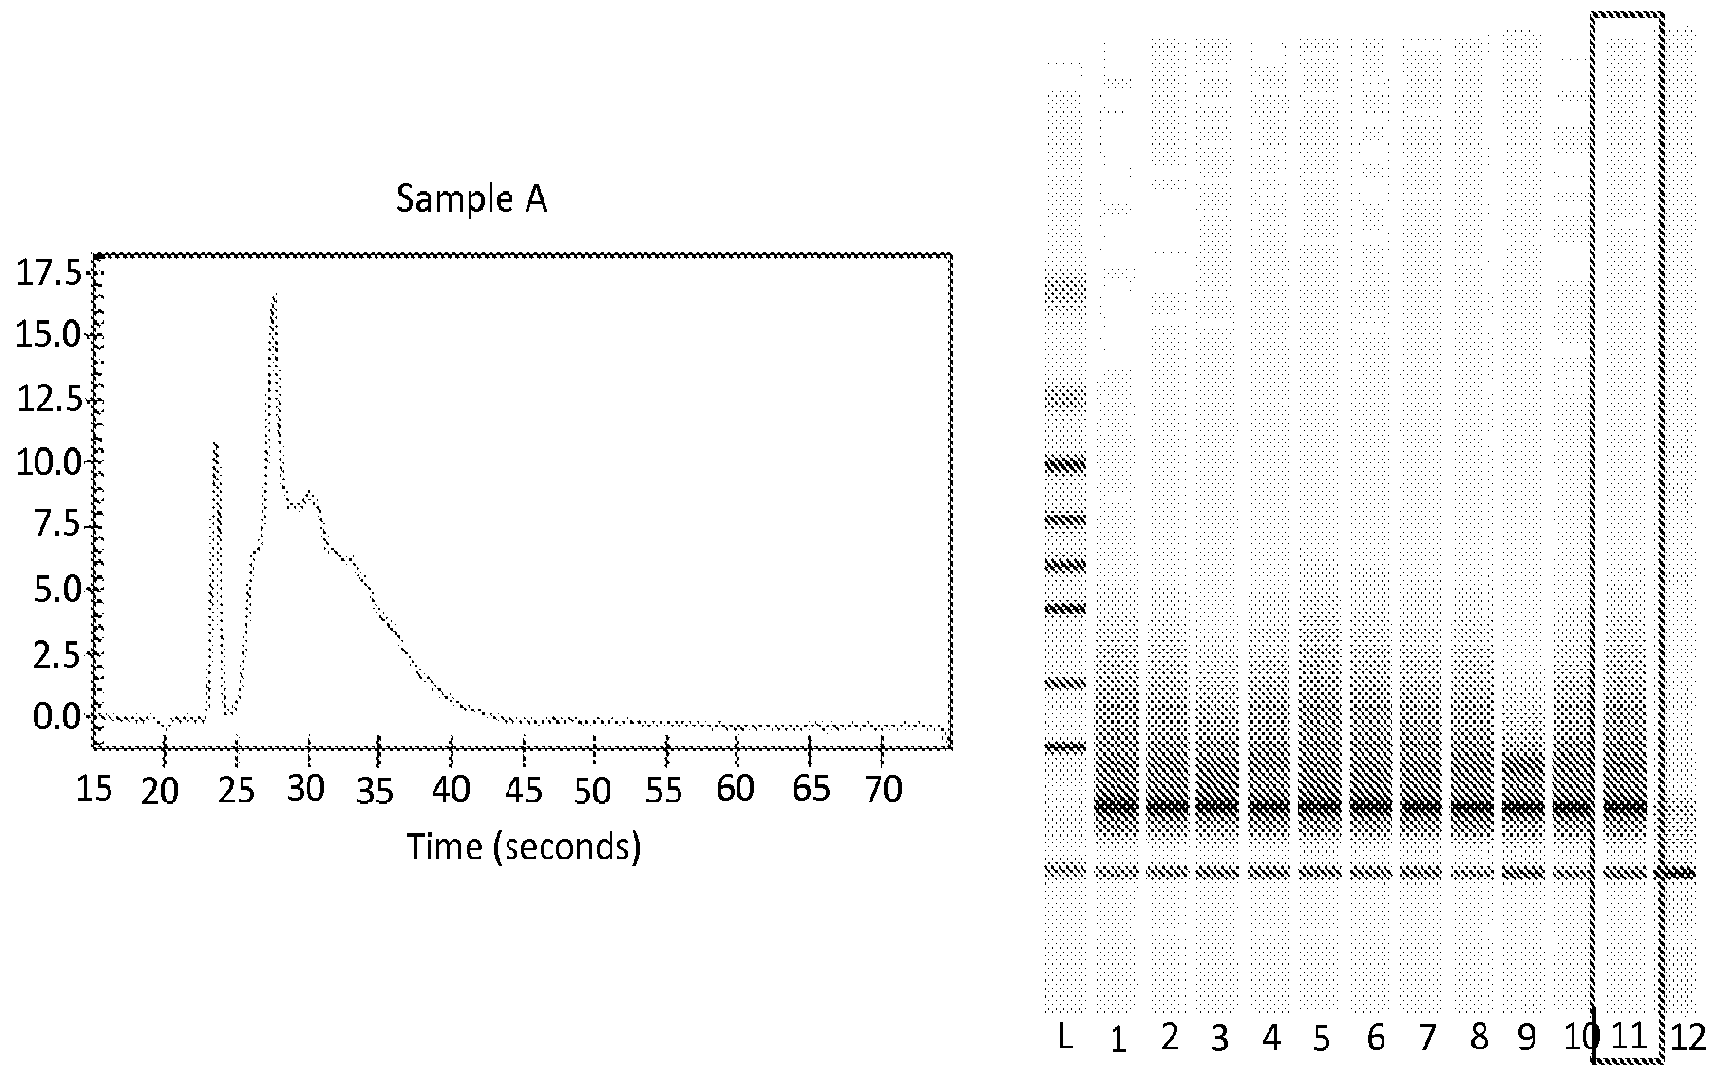
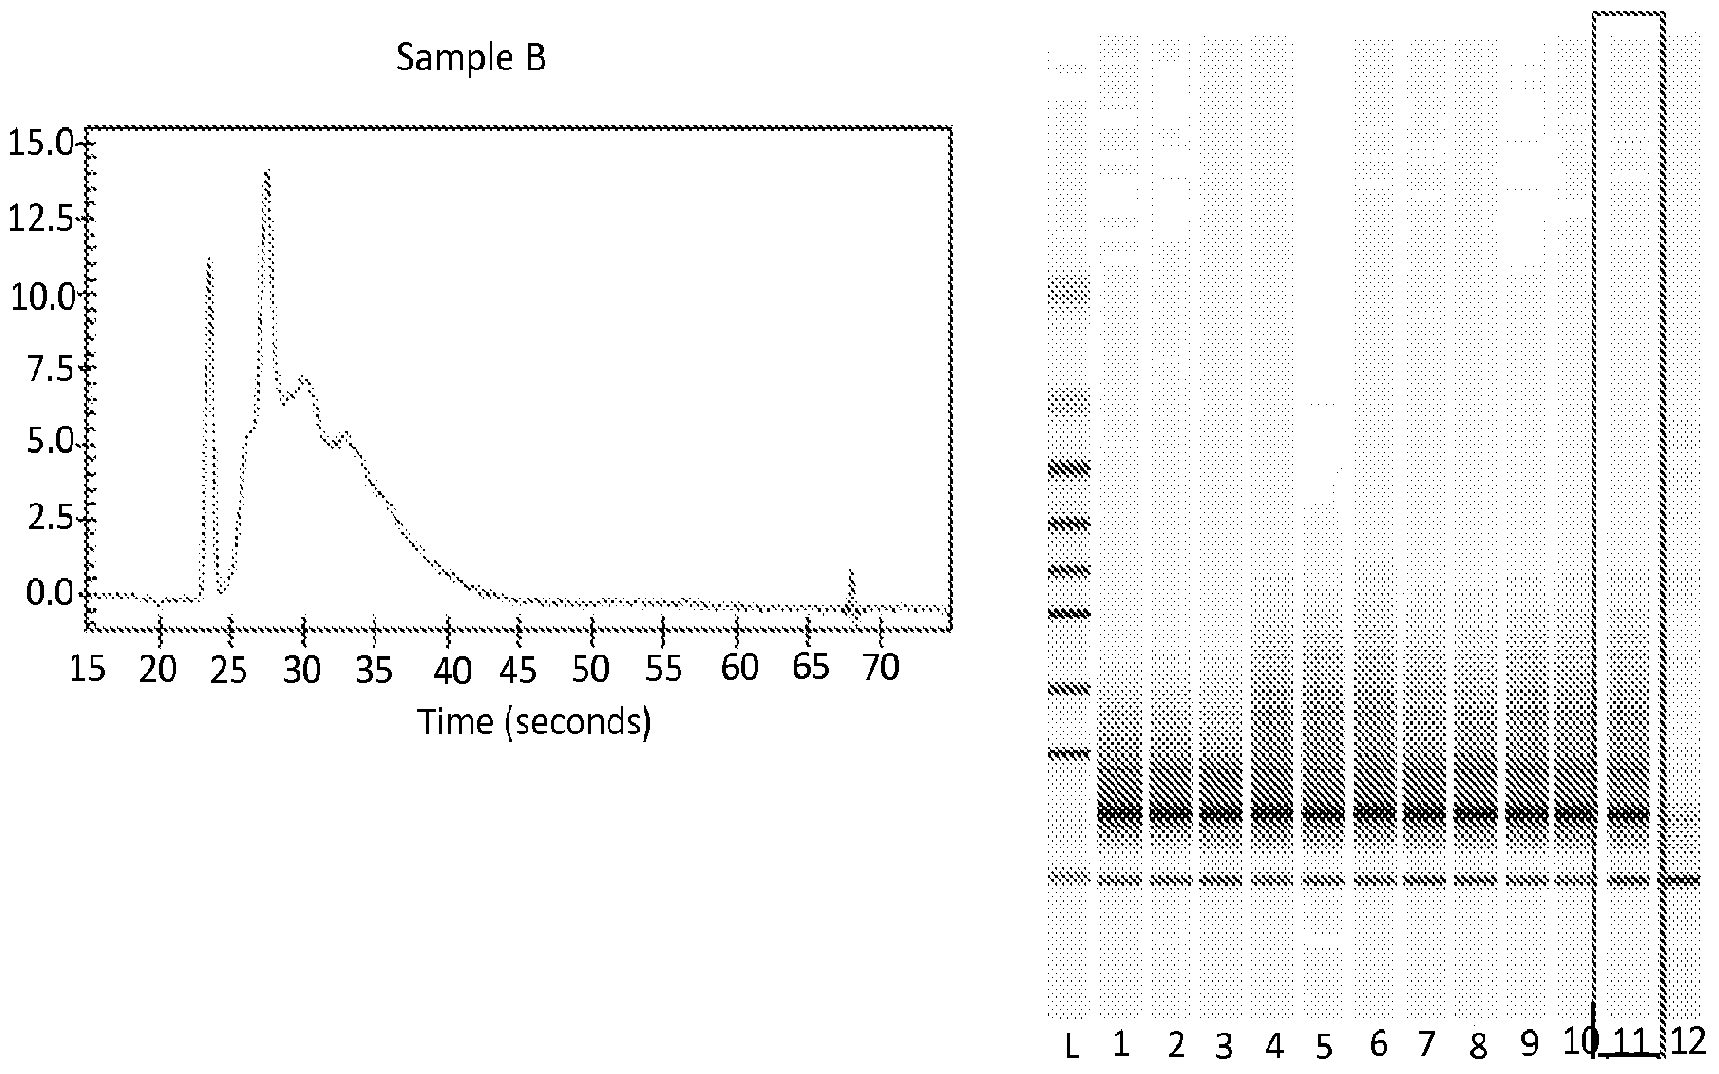


APPENDIX V
Assay Validation Phase: qPCR 384-well General Plate Map for Assay Validation qPCR Reactions
• Numbers refer to unique assays
• 'NTC stands for No Template Control; these wells contain only assay master mix but no cDNA sample

Assay Validation Phase: Expression Data and Descriptive Statistics
• Average CT is the average of three technical replicates
• Overall Average CT is the average of three technical replicates of all four samples · 'Undet.' indicates that the CT value was undetermined for that sample

Clorf38_M 0.071 28.85 0.06 27.89 0.13 28.02 0.05 28.69 0.19 28.36 0.44
Clorf38_R 0.08 35.5 1.08 31.88 0.44 32 0.4 31.9 0.1 32.82 1.7
CAPN2_L 0.086 28.17 0.07 27.95 0.1 28.69 0.19 27.34 0.05 28.04 0.51
CAPN2_M 0.088 24.1 0.19 23.74 0.1 23.77 0.12 23.89 0.16 23.88 0.19
CAPN2_R 0.093 25.12 0.1 25.06 0.14 25.11 0.08 25.32 0.13 25.15 0.14
CD163_L 0.019 30.25 0.49 30.01 0.07 30.2 0.19 30.19 0.16 30.16 0.26
CD163_M 0.046 28.2 0.61 28.91 0.87 28.64 0.35 28.06 0.09 28.45 0.6
CD163_R 0.082 27.76 0.05 27.71 0.1 27.97 0.02 27.86 0.08 27.83 0.12
CD27_L 0.032 28.74 0.17 28.73 0.21 30.11 0.11 29.14 0.25 29.18 0.61
CD27_M 0.028 31.83 0.06 32.55 0.26 31.96 0.27 32.81 0.07 32.29 0.45
CD27_R 0.05 30.1 0.13 30.03 0.37 30.66 0.33 30.72 0.12 30.38 0.4
CD300CJ. 0.031 32.8 0.26 32.61 0.13 34.07 0.39 31.06 0.21 32.63 1.14
CD300C_M 0.083 30.52 0.2 29.52 0.11 31.47 0.26 30.09 0.25 30.4 0.77
CD300C_R 0.066 30 0.39 30.03 0.33 31.18 0.34 29.69 0.11 30.23 0.65
CD53_L 0.022 23.2 0.28 23.35 0.59 23.6 0.65 23.27 0.3 23.36 0.44
CD53_M 0.061 24.94 0.21 24.71 0.12 24.85 0.22 24.69 0.13 24.8 0.19
CD53_R 0.023 26.16 0.21 25.93 0.41 25.88 0.25 25.63 0.29 25.9 0.33
CD68_L 0.04 22.1 0.09 21.45 0.04 21.89 0.18 21.58 0.08 21.75 0.28
CD68_M 0.059 27.48 0.2 27.34 0.69 27.15 0.23 28.61 0.23 27.65 0.69
CD68_R 0.132 26.55 0.08 25.54 0.07 26.09 0.12 25.95 0.2 26.03 0.39
Undet Undet Undet
CD83_L 0.036 36.28 0.41 37.07 36.94 1.05 36.63 0.66
Undet
CD83_M 0.061 33.21 0.22 34.6 0.97 36.34 2.97 37.32 34.82 1.92
CD83_R 0.095 30.81 0.34 29.83 0.15 30.34 0.17 31.5 0.17 30.62 0.67
CDC42SE1J. 0.04 29.85 0.19 30.36 0.16 31.55 0.47 31.67 0.49 30.86 0.86
CDC42SE1_
M 0.076 24.79 0.12 24.95 0.3 24.42 0.22 24.68 0.16 24.71 0.27
CDC42SE1_R 0.058 24.34 0.05 24.09 0.3 23.97 0.09 23.51 0.18 23.98 0.35
CSF3R_L 0.028 26.03 0.18 26.58 0.51 25.76 0.63 25.92 0.31 26.1 0.47
CSF3 _ 0.06 28.29 0.08 28.59 0.15 27.67 0.13 28.03 0.09 28.15 0.37
CSF3R_R 0.056 24.39 0.23 24.65 0.31 24.38 0.24 24.51 0.17 24.48 0.24
DDX58_L 0.062 27.34 0.58 28.48 0.2 27.41 0.07 27.82 0.18 27.76 0.55
DDX58_M 0.04 26.45 0.9 26.3 0.09 25.88 0.32 26.28 0.25 26.23 0.48
DDX58_R 0.056 27.79 0.1 27.63 0.08 27.4 0.19 28.35 0.33 27.8 0.41
Undet
EEF2_L 0.01 28.23 0.84 27.96 28.62 0.08 28.59 0.28 28.43 0.43
EEF2_M 0.062 24.29 0.1 24.13 0.14 24.15 0.34 24.28 0.07 24.21 0.18
EEF2_R 0.026 25.61 0.14 25.73 0.34 25.25 0.23 25.9 0.28 25.62 0.33
F13A1_L 0.06 27.91 0.11 27.31 0.14 26.29 0.09 26.96 0.12 27.12 0.62
F13A1_M 0.077 26.95 0.26 26.47 0.09 25.29 0.08 26.42 0.12 26.28 0.65
F13A1_R 0.085 27.85 0.15 26.89 0.16 26.01 0.11 27.52 0.23 27.07 0.75
FCN1_L 0.134 25.52 0.13 24.63 0.26 25.01 0.4 25.33 0.09 25.12 0.41
FCN1_M 0.054 29.98 0.33 23.7 0.42 23.81 0.49 24.68 0.14 25.54 2.72
FCN1_R 0.051 25.08 0.07 24.47 0.11 24.67 0.11 25.03 0.07 24.81 0.28
GAPDH_L 0.08 24.43 0.12 24.55 0.13 25.37 0.09 25.07 0.18 24.86 0.42
GAPDH_R 0.122 27.22 0.19 26.7 0.2 26.81 0.22 27.16 0.23 26.97 0.29
Undet Undet
GZMB_L 0.006 28.71 30.31 0.53 29.97 29.06 0.24 29.68 0.77
GZMB_ 0.06 33.12 0.92 26.79 0.14 25.95 0.24 26.24 0.13 28.02 3.11
GZMB_R 0.06 26.7 0.1 25.74 0.22 26.19 0.2 25.73 0.04 26.09 0.44
IL10RB_L 0.056 30.73 0.07 30.23 0.17 29.77 0.17 30.35 0.07 30.27 0.37
IL10RB_M 0.055 31.71 0.43 30.91 0.26 31.04 0.11 30.57 0.3 31.06 0.5
IL10RB_R 0.053 29.69 0.15 29.33 0.09 29.18 0.11 28.96 0.09 29.29 0.29
Undet
IL15RA_L 0.031 37.37 34.24 0.12 35.93 0.86 34.67 0.26 35.19 1.13
IL15RA_ 0.104 30.26 0.13 28.23 0.18 29.76 0.24 29.29 0.31 29.39 0.81
IL15RA_R 0.01 35.18 0.53 36.73 1.36 36.08 0.37 34.81 0.48 35.75 1.06
IL6R_L 0.066 33.22 0.29 34.2 0.22 33.69 0.38 33.91 0.33 33.75 0.46
IL6R_M 0.041 28.03 0.42 28.57 0.17 28.34 0.02 27.54 0.28 28.1 0.48
IL6R_R 0.076 25.43 0.19 25.48 0.09 25.42 0.02 25.58 0.22 25.48 0.15
Undet Undet Undet Undet
IL7R_L 0.022 26.88 0.16 27.26 0.2 27.07 0.26
IL7R_M 0.06 28.11 1.02 28.96 0.11 28.82 0.13 28.92 0.08 28.7 0.57
IL7R_R 0.033 25.03 0.23 26.06 0.07 25.62 0.4 26.28 0.03 25.75 0.54
ITGB2_L 0.061 25.49 0.22 25.25 0.11 25.48 0.09 25.3 0.11 25.38 0.17
ITGB2_ 0.042 25.97 0.45 25.81 0.32 26.18 0.29 26.25 0.3 26.05 0.35
ITGB2_R 0.018 26.96 0.35 26.6 0.28 26.86 0.27 27.34 0.57 26.94 0.43
IVNS1ABP_L 0.069 27.76 0.19 27.56 0.29 26.79 0.07 27.15 0.19 27.32 0.43
IVNS1ABP_
M 0.029 27.82 0.62 27.43 0.66 28.16 0.23 27.58 0 27.75 0.49
IVNS1ABP_R 0.035 27.12 0.13 27.55 0.1 26.72 0.32 26.75 0.18 27.04 0.39
KLRF1_L 0.03 34.22 0.29 32.9 0.18 32.51 0.23 32.89 0.24 33.13 0.71
KLRF1_ 0.021 34.32 0.51 34.07 0.62 35.22 2.32 34.41 0.3 34.44 0.92
KLRF1_R 0.05 33.06 0.28 33.5 0.37 33.64 0.06 34.94 0.45 33.78 0.79
LASP1_L 0.062 25.45 0.23 24.98 0.08 25.45 0.08 24.91 0.15 25.2 0.29
LASP1_M 0.059 25.62 0.26 25.31 0.15 24.89 0.15 24.82 0.09 25.16 0.37
LASP1_R 0.067 27.69 0.22 27.22 0.09 26.85 0.04 26.97 0.04 27.18 0.36
LCP1_L 0.015 21.57 0.33 21.54 0.37 21.63 0.16 21.17 0.36 21.5 0.32
LCP1_M 0.0S8 20.78 0.22 20.32 0.17 20.94 0.05 20.52 0.13 20.64 0.28
LCP1_R 0.033 25.34 0.21 25.06 0.24 25.1 0.57 25.08 0.11 25.14 0.3
LILRA5_L 0.025 31.01 0.24 30.99 0.08 32.35 0.25 30.95 0.07 31.33 0.64
LILRA5_M 0.112 29.65 0.29 29.39 0.25 31.21 0.11 30.2 0.33 30.11 0.76
LILRA5_R 0.067 28.1 0.05 27.59 0.2 29.03 0.19 27.68 0.17 28.1 0.61
LPXN_L 0.038 31.96 0.17 31.18 0.3 31.89 0.36 31.51 0.27 31.64 0.4
LPXN_M 0.08 29.41 0.14 29.76 0.2 29.76 0.07 29.57 0.06 29.63 0.19
LPXI\I_R 0.068 32.11 0.15 32.09 0.25 32.48 0.22 31.69 0.44 32.09 0.38
LTF_L 0.022 36.81 0.62 37.05 0.47 35.13 0.2 34.3 0.23 35.73 1.26
LTF_M 0.037 28.75 0.09 27.63 0.03 27.73 0.11 29.08 0.07 28.3 0.66
LTF_R 0.08 27.4 0.15 25.74 0.09 26.25 0.06 26.95 0.11 26.59 0.67
LY75_L 0.024 31.12 0.22 31.33 0.29 32.26 0.33 30.8 0.21 31.38 0.61
LY75_M 0.029 29.13 0.09 29.32 0.18 28.7 0.58 28.87 0.17 29.01 0.37
LY75_R 0.069 29.27 0.29 30.01 0.3 29.29 0.23 28.64 0.19 29.3 0.55
NCF1_L 0.061 24.76 0.51 24.93 0.13 24.38 0.06 24.39 0.19 24.62 0.35
NCF1_M 0.063 26.14 0.02 26.2 0.26 25.21 0.28 25.44 0.17 25.75 0.48
NCF1_R 0.064 23.91 0.04 24.06 0.15 23.69 0.24 23.74 0.22 23.85 0.22
NCF2_L 0.059 24.44 0.1 24.81 0.15 24.4 0.1 24.24 0.12 24.47 0.24
NCF2_M 0.093 23.09 0.17 23.54 0.19 23.45 0.1 23.27 0.17 23.34 0.23
NCF2_R 0.042 24.63 0.1 24.88 0.08 24.66 0.04 24.52 0.22 24.67 0.17
NCF4J. 0.052 27.47 0.38 28.01 0.1 27.61 0.04 27.35 0.13 27.61 0.31
NCF4_M 0.075 26.74 0.2 26.76 0.11 27.05 0.16 27.02 0.2 26.89 0.21
NCF4_R 0.147 31.07 0.18 31.03 0.26 32.49 0.37 31.71 0.08 31.58 0.65
NCL_L 0.057 25.74 0.15 25.55 0.19 25.82 0.15 26.23 0.08 25.84 0.29
NCL_M 0.03 24.31 0.11 23.83 0.2 24.39 0.22 24.41 0.12 24.24 0.29
NCL_R 0.059 23.42 0.16 23.46 0.21 23.19 0.11 23.47 0.01 23.39 0.17
NCOAl_L 0.049 25.09 0.35 24.7 0.14 24.37 0.22 24.64 0.15 24.7 0.33
NCOAl_M 0.058 24.79 0.16 25.08 0.09 24.61 0.1 24.49 0.14 24.74 0.26
NCOAl_R 0.096 27.8 0.2 28.47 0.06 28.04 0.11 27.9 0.1 28.05 0.29
NLRP1_L 0.06 26.98 0.13 27.55 0.23 27.16 0.33 27.05 0.09 27.19 0.3
NLRP1_M 0.129 28.39 0.21 28.58 0.23 28.25 0.11 28.5 0.18 28.43 0.21
NLRP1_R 0.032 28.86 0.11 29.05 0.21 28.96 0.25 28.57 0.23 28.86 0.26
OAS2_L 0.132 29.98 0.09 30.12 0.13 30.02 0.09 29.76 0.15 29.97 0.17
OAS2_M 0.051 27.4 0.14 26.76 0.08 27.4 0.1 27.34 0.15 27.23 0.3
OAS2_R 0.096 27.06 0.14 26.86 0.11 27.24 0.16 27.14 0.24 27.08 0.2
OAS3_L 0.068 29.73 0.2 31.92 0.14 34.05 0.87 31.36 0.1 31.77 1.66
OAS3_M 0.059 29.46 0.17 28.16 0.04 29.42 0.2 28.41 0.2 28.86 0.63
OAS3_R 0.08 28.09 0.22 29.69 0.22 29.04 0.13 28.94 0.06 28.94 0.61
PDLI 1_L 0.079 33.66 0.42 32.15 0.16 31.19 0.21 30.83 0.26 31.95 1.17
PDLI 1_M 0.093 28.86 0.33 28.01 0.19 27.86 0.06 28.06 0.15 28.2 0.45
PDLI 1_R 0.037 27.9 0.16 28.97 0.29 28.1 0.18 29.01 0.19 28.5 0.55
PDLI 2_L 0.041 30.35 0.07 31.38 0.62 30.44 0.24 30.85 0.2 30.75 0.52
PDLI 2_M 0.034 32.18 0.17 31.72 0.11 32.13 0.19 32.47 0.36 32.12 0.34
Undet Undet Undet Undet Undet Undet Undet Undet
PDLI 2_R 0.012 38.02 38.02
RAF1_L 0.047 30.25 0.11 29.6 0.2 29.67 0.15 29.62 0.23 29.79 0.32
RAF1_M 0.067 30.28 0.16 30.76 0.11 30.62 0.39 30.23 0.03 30.47 0.3
RAF1_R 0.082 27.46 0.04 27.02 0.07 26.97 0.11 26.69 0.1 27.03 0.29
ROCK2_L 0.038 23.79 0.1 23.8 0.2 23.88 0.28 23.77 0.12 23.81 0.17
ROCK2_M 0.013 31.41 0.25 30.43 0.09 30.37 0.46 31.01 0.18 30.81 0.51
ROCK2_R 0.083 30.54 0.15 29.61 0.1 30.95 0.11 30.98 0.25 30.52 0.59
SELL_L 0.045 23.28 0.2 24.06 0.11 23.8 0.12 22.65 0.26 23.45 0.59
SELL_M 0.17 24.4 0.16 24.58 0.27 24.99 0.14 23.96 0.08 24.48 0.41
SELL_R 0.039 26.91 0.14 27.37 0.17 27.33 0.39 26.68 0.1 27.05 0.36
SELP_L 0.104 35.34 0.55 30.57 0.07 28.75 0.03 30.61 0.15 31.32 2.56
SELP_M 0.072 33.18 0.3 30.78 0.23 31.87 0.17 32.78 0.9 32.15 1.05
Undet Undet
SELP_R 0.027 35.1 0.38 33.06 0.43 37.31 0.07 35.16 1.86
SERPINA1_L 0.064 25.82 0.25 24.34 0.02 23.83 0.15 24.52 0.16 24.63 0.78
SERPINA1_
M 0.03 26.43 0.49 24.44 0.22 24.66 0.2 25.34 0.23 25.22 0.85
SERPINA1_R 0.112 22.34 0.05 21.23 1.08 21.97 0.16 22.58 0.16 22.03 0.71
S0RL1_L 0.093 24.57 0.15 24.68 0.12 24.96 0.07 24.48 0.16 24.67 0.22
S0RL1_M 0.075 26.1 0.22 26.36 0.02 25.87 0.19 25.93 0.19 26.09 0.24
S0RL1_R 0.086 23.63 0.17 23.59 0.07 23.68 0.2 23.44 0.19 23.58 0.17
STAT6_L 0.08 24.4 0.04 24.27 0.25 24.39 0.29 24.2 0.1 24.32 0.19
STAT6_M 0.082 25.79 0.16 25.68 0.14 25.43 0.11 25.38 0.15 25.57 0.21
STAT6_R 0.05 27.44 0.06 28.55 0.43 27.94 0.28 27.98 0.21 27.98 0.47
STX4_L 0.072 25.77 0.25 25.22 0.11 25.69 0.08 25.71 0.21 25.6 0.28
STX4_M 0.076 29.93 0.18 29.66 0.38 32.2 0.46 29.9 0.22 30.42 1.12
STX4_R 0.082 29.09 0.16 28.54 0.21 28.76 0.08 28.55 0.12 28.74 0.26
SYNE2_L 0.06 28.25 0.36 28.18 0.22 28.98 0.13 27.76 0.1 28.29 0.5
SYNE2_M 0.057 25.26 0.27 25.63 0.12 25.57 0.17 25.5 0.09 25.49 0.21
SYNE2_R 0.062 33.43 1.08 32.01 0.08 31.27 0.09 33.01 0.34 32.43 1.01
TES_L 0.098 24.37 0.12 24.81 0.17 23.76 0.2 23.97 0.21 24.23 0.45
TES_M 0.095 28.53 0.06 28.77 0.17 28.96 0.02 28.19 0.05 28.61 0.31
TES_R 0.041 28.15 0.07 28.32 0.14 28.33 0.22 27.97 0.18 28.19 0.21
TREM1_L 0.053 29.88 0.1 29.54 0.03 29.54 0.16 29.57 0.24 29.63 0.2
TREM1_M 0.076 27.95 0.24 26.87 0.06 27.35 0.16 28.22 0.12 27.6 0.56
TREM1_R 0.05 26.72 0.01 26.38 0.12 26.72 0.13 27.21 0.18 26.76 0.33
TRPM2_L 0.069 30.54 0.16 35.71 0.59 35.65 0.98 31.57 0.3 33.37 2.5
TRPM2_ 0.075 34.13 0.92 32.99 0.51 33.32 0.14 34.05 0.69 33.62 0.74
Undet
TRPM2_R 0.091 35.71 37.02 1.16 33.16 0.49 33.83 0.31 34.77 1.82
TXNIP_L 0.086 20.51 0.07 20.32 0.1 20.15 0.2 19.81 0.12 20.2 0.29
TXNIP_ 0.057 21.78 0.04 21.78 0.23 21.63 0.21 21.37 0.21 21.64 0.24
TXNIP_R 0.11 23.83 0.15 23.94 0.13 23.62 0.13 23.59 0.18 23.75 0.2
VIM_L 0.057 35.4 0.28 37.37 0.98 35.47 0.21 37.63 0.84 36.39 1.17
VIM_M 0.051 25.59 0.12 25.56 0.19 25.88 0.36 25.96 0.12 25.75 0.26
VIM_R 0.056 23.23 0.12 23.03 0.02 23.28 0.15 23.45 0.16 23.24 0.19
ZAP70_L 0.054 37.11 1.17 36.46 0.94 36.35 0.1 36.41 0.89 36.56 0.76
ZAP70_M 0.106 31.13 0.11 31.28 0.24 31.43 0.18 31.48 0.01 31.33 0.2
ZAP70_R 0.091 30.35 0.05 30.92 0.3 29.93 0.33 30.51 0.25 30.42 0.43
APPENDIX VII
Assay Validation Histograms: Sample Average and Overall Average CT Values of Regional Assays

A E C D Avg A E C D Avg A E C D Avg
5' Middle 3'


A E C D Avg A E C D Avg A E C D Avg
5' Middle 3'

A E C D Avg D Avg A E C D Avg
5' 3'

A E C D Avg A E C D Avg E C D Avg
5' Middle 3'

A E C D Avg D Avg A E C D Avg
5' 3'

A E C D Avg A E C D Avg A E C D Avg
5' Middle 3'
Clorf38

D Avg D Avg E C D Avg 5' 3'

A E C D Avg A E C D Avg A E C D Avg
5' Middle 3'

A E C D Avg A E C D Avg A E C D Avg
5' Middle 3'

C D Avg D Avg C D Avg 5' 3'

A E C D Avg A E C D Avg A E C D Avg
5' Middle 3'

C D Avg C D Avg C D Avg 5' Middle 3'

A E C D Avg A E C D Avg A E C D Avg
5' Middle 3'

A E C D Avg A E C D Avg A E C D Avg
5' Middle 3'
CSF3R
40
35
TO _.
0)
25
20
A E C D Avg A E C D Avg A E C D Avg
5' Middle 3'


A E C D Avg A E C D Avg A E C D Avg
5' Middle 3'


D Avg A E C D Avg A E C D Avg
5' Middle 3'


A E C D Avg A E C D Avg A E C D Avg
5' Middle 3'
IVNS1ABP
40
35
003U
TO _.
0)
4 25
20
A E C D Avg A E C D Avg A E C D Avg
5' Middle 3'

A E C D Avg A E C D Avg A E C D Avg
5' Middle 3'
LCP1
40
35

20
A E C D Avg A E C D Avg A E C D Avg
5' Middle 3'

74

E C D Avg E C D Avg E C D Avg 5' Middle 3'

A E C D Avg D Avg A E C D Avg
5' 3'

A E C D Avg A E C D Avg A E C D Avg
5' Middle 3'
NC0A1
40
35

20
E C D Avg A E C D Avg A E C D Avg 5' Middle 3'

A E C D Avg D Avg A E C D Avg
5' 3'

A E C D Avg A E C D Avg A E C D Avg
5' Middle 3'

A E C D Avg A E C D Avg A E C D Avg
5' Middle 3'
PDLI 1

A E C D Avg A E C D Avg A E C D Avg
5' Middle 3'


A E C D Avg A E C D Avg A E C D Avg
5' Middle 3'

A E C D Avg A E C D Avg A E C D Avg
5' Middle 3'

A E C D Avg A E C D Avg A E C D Avg
5' Middle 3'
STAT6
40
35

20
E C D Avg A E C D Avg A E C D Avg 5' Middle 3'

A E C D Avg A E C D Avg A E C D Avg
5' Middle 3'

A E C D Avg A E C D Avg A E C D Avg
5' Middle 3'

A E C D Avg A E C D Avg A E C D Avg
5' Middle 3'

D Avg A E C D Avg A E C D Avg 5' Middle 3'


A E C D Avg A E C D Avg A E C D Avg
5' Middle 3'
APPENDIX VIII
Assay Performance, Regional Consistency weighted most heavily:
• In 'Assay' column: L = 5' design, M = Middle design, = 3' design

F13A1_L 3 Y Y 27.12 2300
F13A1_M 3 Y Y 26.28 2300
F13A1_R 3 Y Y 27.07 2300
FCN1_R 3 Y Y 24.81 9000
IL10RBJ. 3 Y Y 30.27 850
IL10RB_M 3 Y Y 31.06 850
NCF1_L 3 Y Y 24.62 5500
NCF1_R 3 Y Y 23.85 5500
NCF2_L 3 Y Y 24.47 8500
NCF2_M 3 Y Y 23.34 8500
NCF2_R 3 Y Y 24.67 8500
ADAR_R 3 Y Borderline 26.06 4500
FCN1_L 3 Y Borderline 25.12 9000
IL10RB_R 3 Y Borderline 29.29 850
ITGB2_L 3 Y Borderline 25.38 10000
ITGB2_M 3 Y Borderline 26.05 10000
NCF1_M 3 Y Borderline 25.75 5500
DDX58_L 3 Y N 27.76 350
DDX58_M 3 Y N 26.23 350
ITGB2_R 3 Y N 26.94 10000
IVNS1ABP_L 3 Y N 27.32 750
IVNS1ABP_M 3 Y N 27.75 750
IVNS1ABP_R 3 Y N 27.04 750
NLRP1_L 3 Y N 27.19 600
NLRP1_M 3 Y N 28.43 600
NLRP1_R 3 Y N 28.86 600
KLRF1_L 3 N Y 33.13 650
KLRF1_ 3 N Y 34.44 650
KLRF1_R 3 N Y 33.78 650
TRPM2_L 3 N Y 33.37 400
TRPM2_M 3 N Y 33.62 400
TRPM2_R 3 N Y 34.77 400
ADAR_L 3 N Borderline 25.6 4500
FCN1_M 3 N Borderline 25.54 9000
DDX58_R 3 N N 27.8 350
ACTR2_M 2 Y Y 25.6 2000
ADD3_L 2 Y Y 28.52 1500
ADD3_M 2 Y Y 27.52 1500
AIM1_R 2 Y Y 25.87 1000
Clorf38_ 2 Y Y 28.36 3000
CD53_M 2 Y Y 24.8 8000
CDC42SE1_M 2 Y Y 24.71 5000
CDC42SE1_R 2 Y Y 23.98 5000
EEF2_M 2 Y Y 24.21 7000
IL7R_M 2 Y Y 28.7 3500
IL7R_R 2 Y Y 25.75 3500
LCP1_L 2 Y Y 21.5 6500
LCP1_M 2 Y Y 20.64 6500
LPXN_M 2 Y Y 29.63 1100
NCL_L 2 Y Y 25.84 2000
PDLIM2_M 2 Y Y 32.12 950
RAF1_L 2 Y Y 29.79 3000
RAF1_R 2 Y Y 27.03 3000
ROCK2_R 2 Y Y 30.52 200
SERPINA1_R 2 Y Y 22.03 7500
ZAP70_M 2 Y Y 31.33 650
ZAP70_R 2 Y Y 30.42 650
ADD1_L 2 Y Borderline 29.43 750
AIM1_M 2 Y Borderline 30.45 1000
CD53_R 2 Y Borderline 25.9 8000
EEF2_R 2 Y Borderline 25.62 7000
LASP1_L 2 Y Borderline 25.2 4500
LASP1_ 2 Y Borderline 25.16 4500
LASP1_R 2 Y Borderline 27.18 4500
LCP1_R 2 Y Borderline 25.14 6500
LPXN_L 2 Y Borderline 31.64 1100
LPXN_R 2 Y Borderline 32.09 1100
LY75_M 2 Y Borderline 29.01 800
LY75_R 2 Y Borderline 29.3 800
NCF4_L 2 Y Borderline 27.61 4500
NCF4_M 2 Y Borderline 26.89 4500
OAS2_L 2 Y Borderline 29.97 500
PDLIM1_R 2 Y Borderline 28.5 900
RAF1_M 2 Y Borderline 30.47 3000
TREM1_L 2 Y Borderline 29.63 4500
TREM1_M 2 Y Borderline 27.6 4500
TREM1_R 2 Y Borderline 26.76 4500
ACTR2_L 2 Y N 22.72 2000
ACTR2_R 2 Y N 23.17 2000
ADD1_M 2 Y N 26.79 750
ADD1_R 2 Y N 25.43 750
ADD3_R 2 Y N 24.17 1500
CAPN2_L 2 Y N 28.04 750
88 CAPN2_M 2 Y N 23.88 750
89 CAPN2_R 2 Y N 25.15 750
90 CD163_R 2 Y N 27.83 200
91 CD68_L 2 Y N 21.75 250
92 CD68_R 2 Y N 26.03 250
93 LTF_R 2 Y N 26.59 200
94 NCF4_R 2 Y N 31.58 4500
95 NCL_ 2 Y N 24.24 2000
96 NCL_R 2 Y N 23.39 2000
97 NCOA1J. 2 Y N 24.7 850
98 NC0A1_M 2 Y N 24.74 850
99 NC0A1_R 2 Y N 28.05 850
100 OAS2_M 2 Y N 27.23 500
101 OAS2_R 2 Y N 27.08 500
102 OAS3_M 2 Y N 28.86 650
103 OAS3_R 2 Y N 28.94 650
104 PDLIM1_M 2 Y N 28.2 900
105 ROCK2_L 2 Y N 23.81 200
106 TES_L 2 Y N 24.23 750
107 TES_M 2 Y N 28.61 750
108 TES_R 2 Y N 28.19 750
109 Clorf38_L 2 N Y 27.49 3000
110 CD163_L 2 N Y 30.16 200
111 CD27_M 2 N Y 32.29 650
112 CD27_R 2 N Y 30.38 650
113 CD300C_L 2 N Y 32.63 500
114 CD300C_M 2 N Y 30.4 500
115 CD300C_R 2 N Y 30.23 500
116 CD53_L 2 N Y 23.36 8000
117 CD83_L 2 N Y 36.63 150
118 CD83_M 2 N Y 34.82 150
119 CD83_R 2 N Y 30.62 150
120 IL15RAJ. 2 N Y 35.19 300
121 IL15RA_R 2 N Y 35.75 300
122 IL7R_L 2 N Y 27.07 3500
123 LTF_L 2 N Y 35.73 200
124 LY75_L 2 N Y 31.38 800
125 OAS3_L 2 N Y 31.77 650
126 PDLIMIJ. 2 N Y 31.95 900
127 PDLIM2_L 2 N Y 30.75 950
128 PDLIM2_R 2 N Y 38.02 950
129 ROCK2_M 2 N Y 30.81 200
130 SERPINA1J. 2 N Y 24.63 7500
131 ZAP70_L 2 N Y 36.56 650
132 AIM1_L 2 N Borderline 30.33 1000
133 Clorf38_R 2 N Borderline 32.82 3000
134 SERPINA1_M 2 N Borderline 25.22 7500
135 CD163_M 2 N N 28.45 200
136 CD27_L 2 N N 29.18 650
137 CD68_M 2 N N 27.65 250
138 CDC42SE1_L 2 N N 30.86 5000
139 EEF2_L 2 N N 28.43 7000
140 IL15RA_M 2 N N 29.39 300
141 LTF_M 2 N N 28.3 200
142 ACTB_L 0 Y Y 23.94 10,000
143 ACTB_R 0 Y Y 21.05 10,000
144 CSF3R_R 0 Y Y 24.48 6500
145 GAPDH_L 0 Y Y 24.86 10,000
146 GZMB_R 0 Y Y 26.09 1500
147 IL6R_L 0 Y Y 33.75 500
148 LILRA5_L 0 Y Y 31.33 900
149 SELL_L 0 Y Y 23.45 8500
150 SELL_M 0 Y Y 24.48 8500
151 S0RL1_L 0 Y Y 24.67 7500
152 S0RL1_R 0 Y Y 23.58 7500
153 STAT6_ 0 Y Y 25.57 1000
154 STAT6_R 0 Y Y 27.98 1000
155 TXNIP_L 0 Y Y 20.2 8000
156 TXNIP_ 0 Y Y 21.64 8000
157 TXNIP_R 0 Y Y 23.75 8000
158 VIM_R 0 Y Y 23.24 9500
159 LILRA5_R 0 Y Borderline 28.1 900
160 SORLl_M 0 Y Borderline 26.09 7500
161 VIM_M 0 Y Borderline 25.75 9500
162 CSF3R_ 0 Y N 28.15 6500
163 GAPDH_R 0 Y N 26.97 10,000
164 IL6R_M 0 Y N 28.1 500
165 IL6R_R 0 Y N 25.48 500
166 SELL_R 0 Y N 27.05 8500
167 STAT6_L 0 Y N 24.32 1000
168 STX4_L 0 Y N 25.6 600
169 STX4_R 0 Y N 28.74 600
170 SYNE2_L 0 Y N 28.29 400
171 SYNE2_M 0 Y N 25.49 400
172 BACH2_L 0 N Y 34.45 150
173 BACH2_R 0 N Y 30.93 150
174 GZMB_L 0 N Y 29.68 1500
175 GZMB_ 0 N Y 28.02 1500
176 LILRA5_M 0 N Y 30.11 900
177 SELPJ. 0 N Y 31.32 700
178 SELP_M 0 N Y 32.15 700
179 SELP_R 0 N Y 35.16 700
180 STX4_M 0 N Y 30.42 600
181 SYNE2_R 0 N Y 32.43 400
182 CSF3R_L 0 N Borderline 26.1 6500
183 BACH2_M 0 N N 27.36 150
184 VIM_L 0 N N 36.39 9500
APPENDIX VIII (continued)
Assay Performance, Amplification Plot Consistency weighted most heavily: • In 'Assay' column: L = 5' design, M = Middle design, R = 3' design

DDX58_M Y 3 N 26.23 350
ITGB2_R Y 3 N 26.94 10000
IVNS1ABP_L Y 3 N 27.32 750
IVNS1ABP_M Y 3 N 27.75 750
IVNS1ABP_R Y 3 N 27.04 750
NLRP1_L Y 3 N 27.19 600
NLRP1_M Y 3 N 28.43 600
NLRP1_R Y 3 N 28.86 600
ACTR2_M Y 2 Y 25.6 2000
ADD3_L Y 2 Y 28.52 1500
ADD3_ Y 2 Y 27.52 1500
AIM1_R Y 2 Y 25.87 1000
Clorf38_M Y 2 Y 28.36 3000
CD163_L Y 2 Y 30.16 200
CD27_R Y 2 Y 30.38 650
CD300C_R Y 2 Y 30.23 500
CD53_M Y 2 Y 24.8 8000
CD83_R Y 2 Y 30.62 150
CDC42SE1_M Y 2 Y 24.71 5000
CDC42SE1_R Y 2 Y 23.98 5000
EEF2_M Y 2 Y 24.21 7000
IL7R_M Y 2 Y 28.7 3500
IL7R_R Y 2 Y 25.75 3500
LCP1_L Y 2 Y 21.5 6500
LCP1_M Y 2 Y 20.64 6500
LPXN_M Y 2 Y 29.63 1100
NCL_L Y 2 Y 25.84 2000
PDLIM2_M Y 2 Y 32.12 950
RAF1_L Y 2 Y 29.79 3000
RAF1_R Y 2 Y 27.03 3000
ROCK2_R Y 2 Y 30.52 200
SERPINA1_R Y 2 Y 22.03 7500
ZAP70_M Y 2 Y 31.33 650
ZAP70_R Y 2 Y 30.42 650
ADD1_L Y 2 Borderline 29.43 750
AIM1_M Y 2 Borderline 30.45 1000
CD53_R Y 2 Borderline 25.9 8000
EEF2_R Y 2 Borderline 25.62 7000
LASP1_L Y 2 Borderline 25.2 4500
LASP1_M Y 2 Borderline 25.16 4500
LASP1_R Y 2 Borderline 27.18 4500
LCP1_R Y 2 Borderline 25.14 6500
LPXN_L Y 2 Borderline 31.64 1100
LPXN_R Y 2 Borderline 32.09 1100
LY75_M Y 2 Borderline 29.01 800
LY75_R Y 2 Borderline 29.3 800
NCF4_L Y 2 Borderline 27.61 4500
NCF4_M Y 2 Borderline 26.89 4500
OAS2_L Y 2 Borderline 29.97 500
PDLIM1_R Y 2 Borderline 28.5 900
RAF1_M Y 2 Borderline 30.47 3000
TREM1_L Y 2 Borderline 29.63 4500
TREM1_M Y 2 Borderline 27.6 4500
TREM1_R Y 2 Borderline 26.76 4500
ACTR2_L Y 2 N 22.72 2000
78 ACTR2_R Y 2 N 23.17 2000
79 ADD1JVI Y 2 N 26.79 750
80 ADD1_R Y 2 N 25.43 750
81 ADD3_R Y 2 N 24.17 1500
82 CAPN2_L Y 2 N 28.04 750
83 CAPN2_M Y 2 N 23.88 750
84 CAPN2_R Y 2 N 25.15 750
85 CD163_R Y 2 N 27.83 200
86 CD68_L Y 2 N 21.75 250
87 CD68_R Y 2 N 26.03 250
88 LTF_R Y 2 N 26.59 200
89 NCF4_R Y 2 N 31.58 4500
90 NCL_M Y 2 N 24.24 2000
91 NCL_R Y 2 N 23.39 2000
92 NCOA1J. Y 2 N 24.7 850
93 NC0A1_M Y 2 N 24.74 850
94 NCOAl_R Y 2 N 28.05 850
95 OAS2_M Y 2 N 27.23 500
96 OAS2_R Y 2 N 27.08 500
97 OAS3_M Y 2 N 28.86 650
98 OAS3_R Y 2 N 28.94 650
99 PDLIM1_M Y 2 N 28.2 900
100 ROCK2_L Y 2 N 23.81 200
101 TES_L Y 2 N 24.23 750
102 TES_M Y 2 N 28.61 750
103 TES_R Y 2 N 28.19 750
104 ACTB_L Y 0 Y 23.94 10,000
105 ACTB_R Y 0 Y 21.05 10,000
106 CSF3R_R Y 0 Y 24.48 6500
107 GAPDH_L Y 0 Y 24.86 10,000
108 GZMB_R Y 0 Y 26.09 1500
109 IL6R_L Y 0 Y 33.75 500
110 LILRA5J. Y 0 Y 31.33 900
111 SELLJ. Y 0 Y 23.45 8500
112 SELL_M Y 0 Y 24.48 8500
113 S0RL1_L Y 0 Y 24.67 7500
114 S0RL1_R Y 0 Y 23.58 7500
115 STAT6_M Y 0 Y 25.57 1000
116 STAT6_R Y 0 Y 27.98 1000
117 TXNIP_L Y 0 Y 20.2 8000
118 TXNIP_M Y 0 Y 21.64 8000
119 TXNIP_R Y 0 Y 23.75 8000
120 VIM_R Y 0 Y 23.24 9500
121 LILRA5_R Y 0 Borderline 28.1 900
122 S0RL1_M Y 0 Borderline 26.09 7500
123 VIM_M Y 0 Borderline 25.75 9500
124 CSF3R_M Y 0 N 28.15 6500
125 GAPDH_R Y 0 N 26.97 10,000
126 IL6R_M Y 0 N 28.1 500
127 IL6R_R Y 0 N 25.48 500
128 SELL_R Y 0 N 27.05 8500
129 STAT6_L Y 0 N 24.32 1000
130 STX4_L Y 0 N 25.6 600
131 STX4_R Y 0 N 28.74 600
132 SYNE2_L Y 0 N 28.29 400
133 SYNE2_M Y 0 N 25.49 400
134 KLRF1_L N 3 Y 33.13 650
135 KLRF1_M N 3 Y 34.44 650
136 KLRF1_R N 3 Y 33.78 650
137 TRPM2J. N 3 Y 33.37 400
138 TRPM2_M N 3 Y 33.62 400
139 TRPM2_R N 3 Y 34.77 400
140 ADAR_L N 3 Borderline 25.6 4500
141 FCN1_M N 3 Borderline 25.54 9000
142 DDX58_R N 3 N 27.8 350
143 Clorf38_L N 2 Y 27.49 3000
144 CD27_M N 2 Y 32.29 650
145 CD300C_L N 2 Y 32.63 500
146 CD300C_M N 2 Y 30.4 500
147 CD53_L N 2 Y 23.36 8000
148 CD83_L N 2 Y 36.63 150
149 CD83_ N 2 Y 34.82 150
150 IL15RA_L N 2 Y 35.19 300
151 IL15RA_R N 2 Y 35.75 300
152 IL7R_L N 2 Y 27.07 3500
153 LTF_L N 2 Y 35.73 200
154 LY75_L N 2 Y 31.38 800
155 OAS3_L N 2 Y 31.77 650
156 PDLIM1_L N 2 Y 31.95 900
157 PDLIM2_L N 2 Y 30.75 950
158 PDLIM2_R N 2 Y 38.02 950
159 ROCK2_M N 2 Y 30.81 200
160 SERPINA1_L N 2 Y 24.63 7500
161 ZAP70_L N 2 Y 36.56 650
162 AIM1_L N 2 Borderline 30.33 1000
163 Clorf38_R N 2 Borderline 32.82 3000
164 SERPINA1_M N 2 Borderline 25.22 7500
165 CD163_M N 2 N 28.45 200
166 CD27_L N 2 N 29.18 650
167 CD68_M N 2 N 27.65 250
168 CDC42SE1_L N 2 N 30.86 5000
169 EEF2_L N 2 N 28.43 7000
170 IL15RA_M N 2 N 29.39 300
171 LTF_M N 2 N 28.3 200
172 BACH2_L N 0 Y 34.45 150
173 BACH2_R N 0 Y 30.93 150
174 GZMB_L N 0 Y 29.68 1500
175 GZMB_M N 0 Y 28.02 1500
176 LILRA5_M N 0 Y 30.11 900
177 SELP_L N 0 Y 31.32 700
178 SELP_M N 0 Y 32.15 700
179 SELP_R N 0 Y 35.16 700
180 STX4_M N 0 Y 30.42 600
181 SYNE2_R N 0 Y 32.43 400
182 CSF3R_L N 0 Borderline 26.1 6500
183 BACH2_M N 0 N 27.36 150
184 VIM_L N 0 N 36.39 9500
APPENDIX IX
RNA quality data for freeze/thaw cycle treatment (lanes 1-5) and heat treatment (lanes 6-10):


Heat -30 minutes Heat - 60 minutes


§§|§| ii: II II ill ill I m II II ill II II I iiiii

RNase A -0.5 minutes RNase A- 1 minute


APPENDIX X
Nanodrop ND-8000 Native RNA Yield Data:

Pre-Cleanup Bioanalyzer 2100 Data:

Post-Cleanup Bioanalyzer 2100 Data:

APPENDIX XI
Nanodrop ND-8000 Manually Extracted RNA Yield Data:


Nanodrop ND-8000 RNase A Degradation and Column-Purified RNA Yield Data :
Sample ID A260 260/280 260/230 Constant
RNase A - 0.5 minute 21.55 0.539 0.298 1.81 0.39 40.00
RNase A - 1 minute 21.95 0.549 0.321 1.71 0.63 40.00
RNase A - 2 minutes 19.18 0.480 0.272 1.76 0.62 40.00
RNase A - 4 minutes 23.66 0.591 0.364 1.63 0.24 40.00
RNase A - 8 minutes 19.43 0.486 0.289 1.68 0.25 40.00
RNase A - 16 minutes 11.43 0.286 0.186 1.53 0.74 40.00 RNase A Degradation and Column-Purified RNA Bioanalyzer 2100 Data:


APPENDIX XIII
RNA Degradation: cDNA Synthesis and Amplification Quality Control Data Nanodrop ND-8000 cDNA Yield Data:

LabChip 90 HT Microcapillary Electrophoresis cDNAQuality Data:


APPENDIX XIV
General Plate Map for Degraded RNA qPCR Reactions:
 APPENDIX XV
Degraded RNA: Expression Data and Descriptive Statistics
• Average CT is the average of three technical replicates
• Overall Average CT is the average of three technical replicates of all four samples · 'Undet.' indicates that the CT value was undetermined for that sample

NCF1_R 0.115 24.8 24.64 25.17 24.32 24.3 23.99 24.67 24.56 0.385
NCF2_L 0.09 24.81 25.16 25.35 25.57 25.37 25.43 25.47 25.31 0.264
NCF2_M 0.193 23.97 24.4 24.82 25.17 24.72 24.9 26.01 24.85 0.623
NCF2_R 0.086 24.75 25.88 25.99 26.49 26.36 26.7 29.11 26.47 1.262
NLRP1_L 0.091 27.99 28.42 29.56 30.71 27.9 28.71 29.79 29.01 1.002
NLRP1_M 0.183 27.91 29.23 28.84 30.04 27.77 31.47 31.26 29.5 1.416
NLRP1_R 0.061 29.77 30.46 29.47 33.78 32.27 32.45 33.47 31.67 1.689
TRPM2_L 0.067 34.34 35.72 37.76 37.72 34.73 Undet. 37.07 35.96 1.528
TRPM2_M 0.102 34.86 34.59 37.49 Undet. 35.29 33.08 Undet. 34.58 1.292
TRPM2_R 0.071 36.99 35.44 Undet. Undet. Undet. Undet. Undet. 35.83 1.228
ZAP70_L 0.097 37.45 Undet. 32.5 38.27 Undet. Undet. Undet. 35.11 2.927
ZAP70_M 0.13 31.34 32.36 31.76 33.25 32.34 34.57 Undet. 32.6 1.102
ZAP70_R 0.143 31.37 30.6 34.49 33.31 34.54 32.02 33.74 32.87 1.493
APPENDIX XVI
RNA Degradation Assay Histograms: Sample Average and Overall Average CT Values

TO T05 Tl T2 T4 T8 T16 Avg
Timepoint

Timepoint

Timepoint

Timepoint


ADD3 R

Timepoint

TO T05 Tl 12 T4 T8 T16 Avg
Timepoint

TO T05 Tl 12 T4 T8 T16 Avg
Timepoint

Timepoint

TO T05 Tl 12 T4 T8 T16 Avg
Timepoint

TO T05 Tl 12 T4 T8 T16 Avg
Timepoint

TO T05 Tl 12 T4 T8 T16 Avg
Timepoint


Timepoint

TO T05 Tl 12 T4 T8 T16 Avg
Timepoint

TO T05 Tl 12 T4 T8 T16 Avg
Timepoint

Timepoint

TO T05 Tl 12 T4 T8 T16 Avg
Timepoint
F13A1 M
40 u
re 30
>
25
20
T05 Tl T2 T4 T8 T16 Avg
Timepoint


Timepoint

Tl 12 T4 T8 T16 Avg Timepoint


Timepoint

TO T05 Tl 12 T4 T8 T16 Avg
Timepoint

TO T05 Tl T2 T4 T8 T16 Avg
Timepoint

TO T05 Tl T2 T4 T8 T16 Avg
Timepoint
IVNS1ABPJ.

T05 Tl T2 T4 T8 T16 Avg
Timepoint


KLRF1 M

Tl T2 T4 T8 T16 Avg Timepoint

Timepoint


T05 Tl 12 T4 T8 T16 Avg
Timepoint

TO T05 Tl 12 T4 T8 T16 Avg
Timepoint

TO T05 Tl 12 T4 T8 T16 Avg
Timepoint

Timepoint

Tl T2 T4 T8 T16 Avg Timepoint

TO T05 Tl 12 T4 T8 T16 Avg
Timepoint
NCF1 M


T05 Tl T2 T4 T8 T16 Avg
Timepoint

Timepoint

NCF2 M
40 u
re 30
>
25
20

T05 Tl T2 T4 T8 T16 Avg
Timepoint
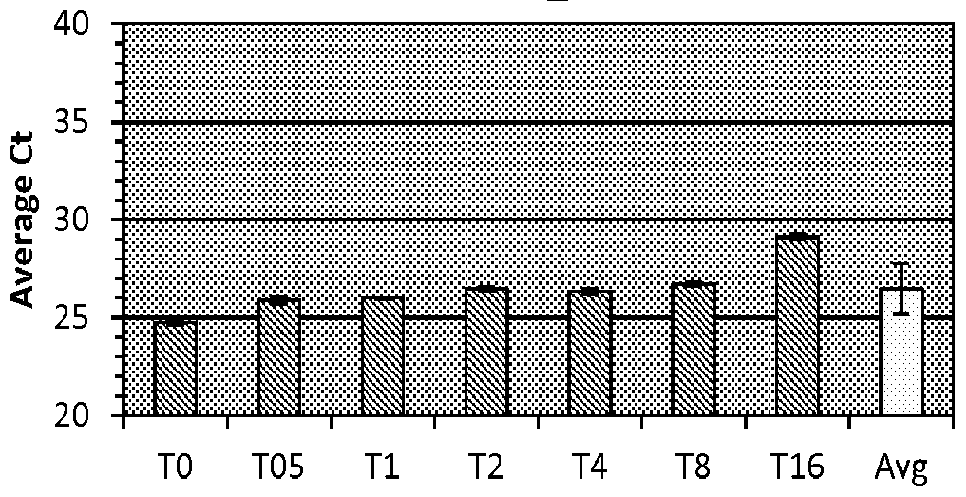
Timepoint


T05 Tl T2 T4 T8 T16 Avg
Timepoint

NLRP1_R

Timepoint

Timepoint


Timepoint

Tl T2 T4 T8 T16 Avg Timepoint


Tl T2 T4 T8 T16 Avg Timepoint

Timepoint


T05 Tl T2 T4 T8 T16 Avg
Timepoint
R0CK2 M


T05 Tl T2 T4 T8 T16
Timepoint

Timepoint

SERPINA1 M

TO T05 Tl 12 T4 T8 T16 Avg
Timepoint

Timepoint
TRPM2 L

TO T05 Tl 12 T4 T8 T16 Avg
Timepoint

T05 Tl T2 T4 T8 T16 Avg
Timepoint

Timepoint

Timepoint

Tl T2 T4 T8 T16 Avg Timepoint

Tl T2 T4 T8 T16 Avg Timepoint
REFERENCES
1. Vermeulen, J., K. De Preter, S. Lefever, J. Nuytens, F. De Vloed, S. Derveaux, J.
Hellemans, F. Speleman, and J. Vandesompele, Measurable impact of RNA quality on gene expression results from quantitative PCR. Nucleic Acids Res, 2011. 39(9): p. e63.
2. Strand, C, J. Enell, I. Hedenfalk, and M. Ferno, RNA quality in frozen breast cancer samples and the influence on gene expression analysis-a comparison of three evaluation methods using microcapillary electrophoresis traces. BMC Mol Biol, 2007. 8: p. 38.
3. Schroeder, A., O. Mueller, S. Stacker, R. Salowsky, M. Leiber, M. Gassmann, S.
Lightfoot, W. Menzel, M. Granzow, and T. Ragg, The RIN: an RNA integrity number for assigning integrity values to RNA measurements. BMC Mol Biol, 2006. 7: p. 3.
4. Houseley, J. and D. Tollervey, The many pathways of RNA degradation. Cell, 2009.
136(4): p. 763-76.
5. Samuel, M.A., K. Whitby, B.C. Keller, A. Marri, W. Barchet, B.R. Williams, R.H.
Silverman, M. Gale, Jr., and M.S. Diamond, PKR and RNase L contribute to protection against lethal West Nile Virus infection by controlling early viral spread in the periphery and replication in neurons. J Virol, 2006. 80(14): p. 7009-19.
6. Li, X.L., J.A. Blackford, and B.A. Hassel, RNase L mediates the antiviral effect of interferon through a selective reduction in viral RNA during encephalomyocarditis virus infection. J Virol, 1998. 72(4): p. 2752-9.
7. Beelman, C.A. and R. Parker, Degradation of mRNA in eukaryotes. Cell, 1995. 81(2): p. 179-83.
8. Watson, J.D., Molecular biology of the gene, 6th edition. 2008, Cold Spring Harbor, N.Y.: Cold Spring Harbor Laboratory Press.
9. Newbury, S.F., O. Muhlemann, and G. Stoecklin, Turnover in the Alps: an mRNA perspective. Workshops on mechanisms and regulation of mRNA turnover. EMBO Rep, 2006. 7(2): p. 143-8.
10. Takano, E.A., T. Mikeska, A. Dobrovic, D.J. Byrne, and S.B. Fox, A multiplex endpoint RT-PCR assay for quality assessment of RNA extracted from formalin-fixed paraffin-embedded tissues. BMC Biotechnol, 2010. 10: p. 89.
11. Baechler, E.C., F.M. Batliwalla, G. Karypis, P.M. Gaffney, K. Moser, W.A. Ortmann, K.J. Espe, S. Balasubramanian, K.M. Hughes, J.P. Chan, A. Begovich, S.Y. Chang, P.K. Gregersen, and T.W. Behrens, Expression levels for many genes in human
peripheral blood cells are highly sensitive to ex vivo incubation. Genes Immun, 2004. 5(5): p. 347-53.
12. Probst, J., S. Brechtel, B. Scheel, I. Hoerr, G. Jung, H.G. Rammensee, and S. Pascolo, Characterization of the ribonuclease activity on the skin surface. Genet Vaccines Ther, 2006. 4: p. 4.
13. Thompson, K.L., P.S. Pine, B.A. Rosenzweig, Y. Turpaz, and J. Retief, Characterization of the effect of sample quality on high density oligonucleotide microarray data using progressively degraded rat liver RNA. BMC Biotechnol, 2007. 7: p. 57.
14. Opitz, L., G. Salinas-Riester, M. Grade, . Jung, P. Jo, G. Emons, B.M. Ghadimi, T.
Beissbarth, and J. Gaedcke, Impact of RNA degradation on gene expression profiling. BMC Med Genomics, 2010. 3: p. 36.
15. Gingrich, J., T. Rubio, and C. arlak, Effect of RNA Degradation on Data Quality in Quantitative PCR and Microarray Experiments. Bio-Rad Bulletin #5452, 2006. 16. Quellhorst, G., Y. Han, and R. Blanchard, Validating Microarray Data Using RT2 Real-Time PCR. SABiosciences, 2005.
17. Morey, J.S., J.C. Ryan, and F.M. Van Dolah, Microarray validation: factors influencing correlation between oligonucleotide microarrays and real-time PCR. Biol Proced Online, 2006. 8: p. 175-93.
18. Nolan, T., R.E. Hands, and S.A. Bustin, Quantification of mRNA using real-time RT- PCR. Nat Protoc, 2006. 1(3): p. 1559-82.
19. Biosystems, A., Essentials of Real Time PCR. 2006.
20. Bustin, S.A. and T. Nolan, Pitfalls of quantitative real-time reverse-transcription polymerase chain reaction. J Biomol Tech, 2004. 15(3): p. 155-66.
21. Becker, C, A. Hammerle-Fickinger, I. Riedmaier, and M.W. Pfaffl, mRNA and microRNA quality control for RT-qPCR analysis. Methods, 2010. 50(4): p. 237-43.
22. Fleige, S. and M.W. Pfaffl, RNA integrity and the effect on the real-time qRT-PCR performance. Mol Aspects Med, 2006. 27(2-3): p. 126-39.
23. Schoor, O., T. Weinschenk, J. Hennenlotter, S. Corvin, A. Stenzl, H.G. Rammensee, and S. Stevanovic, Moderate degradation does not preclude microarray analysis of small amounts of RNA. Biotechniques, 2003. 35(6): p. 1192-6, 1198-201.
24. Mueller, O., K. Hahnenberger, M. Dittmann, H. Yee, R. Dubrow, R. Nagle, and D. llsley, A microfluidic system for high-speed reproducible DNA sizing and quantitation. Electrophoresis, 2000. 21(1): p. 128-34.
25. Kuschel, M. and W. Ausserer, Characterization of RNA quality using the Agilent 2100 Bioanalyzer. Agilent Application Note, 2000.
26. Palmer, M. and E. Prediger, Assessing RNA Quality. Ambion TechNotes, 2004. 11(1).
27. Auer, H., S. Lyianarachchi, D. Newsom, M.I. Klisovic, G. Marcucci, and K.
Kornacker, Chipping away at the chip bias: RNA degradation in microarray analysis.
Nat Genet, 2003. 35(4): p. 292-3.
28. Mueller, 0., S. Lightfoot, and A. Schroeder, RNA Integrity Number (RIN) - Standardization of RNA Quality Control. Agilent Technologies Application Note, 2004.
29. Pfaffl, M.W., S. Fleige, and I. Riedmaier, Validation of lab-on-chip capillary electrophoresis systems for total RNA quality and quantity control. Biotechnology & Biotechnological Equipment, 2008. 22(3): p. 829-834.
30. Riedmaier, L, M. Bergmaier, and M.W. Pfaffl, Comparison of two available platforms for determination of RNA quality. Biotechnology & Biotechnological Equipment, 2010. 24(4): p. 2154-2159.
31. Port, M., H.U. Schmelz, T. Stassen, K. Mueller, M. Stockinger, R. Obermair, and M.
Abend, Correcting false gene expression measurements from degraded RNA using RTQ-PCR. Diagn Mol Pathol, 2007. 16(1): p. 38-49.
32. Copois, V., F. Bibeau, C. Bascoul-Mollevi, N. Salvetat, P. Chalbos, C. Bareil, L.
Candeil, C. Fraslon, E. Conseiller, V. Granci, P. Maziere, A. Kramar, M. Ychou, B.
Pau, P. Martineau, F. Molina, and M. Del Rio, Impact of RNA degradation on gene expression profiles: assessment of different methods to reliably determine RNA quality. J Biotechnol, 2007. 127(4): p. 549-59.
33. Su, A.I., T. Wiltshire, S. Batalov, H. Lapp, K.A. Ching, D. Block, J. Zhang, R. Soden, M. Hayakawa, G. Kreiman, M.P. Cooke, J.R. Walker, and J.B. Hogenesch, A gene atlas of the mouse and human protein-encoding transcriptomes. Proc Natl Acad Sci U S A, 2004. 101(16): p. 6062-7.
34. Pant, P.V., H. Tao, E.J. Beilharz, D.G. Ballinger, D.R. Cox, and K.A. Frazer, Analysis of allelic differential expression in human white blood cells. Genome Res, 2006. 16(3): p. 331-9.
35. Safran, M., V. Chalifa-Caspi, O. Shmueli, T. Olender, M. Lapidot, N. Rosen, M.
Shmoish, Y. Peter, G. Glusman, E. Feldmesser, A. Adato, I. Peter, M. Khen, T. Atarot, Y. Groner, and D. Lancet, Human Gene-Centric Databases at the Weizmann Institute of Science: GeneCards, UDB, CroW 21 and HORDE. Nucleic Acids Res, 2003. 31(1): p. 142-6.
36. Min, J.L., A. Barrett, T. Watts, F.H. Pettersson, H.E. Lockstone, CM. Lindgren, J.M.
Taylor, M. Allen, K.T. Zondervan, and M.I. McCarthy, Variability of gene expression
profiles in human blood and lymphoblastoid cell lines. BMC Genomics, 2010. 11: p. 96.
37. Yanai, L, H. Benjamin, M. Shmoish, V. Chalifa-Caspi, M. Shklar, . Ophir, A. Bar- Even, S. Horn-Saban, M. Safran, E. Domany, D. Lancet, and O. Shmueli, Genome- wide midrange transcription profiles reveal expression level relationships in human tissue specification. Bioinformatics, 2005. 21(5): p. 650-9.
38. Shmueli, O., S. Horn-Saban, V. Chalifa-Caspi, M. Shmoish, R. Ophir, H. Benjamin- Rodrig, M. Safran, E. Domany, and D. Lancet, GeneNote: whole genome expression profiles in normal human tissues. C R Biol, 2003. 326(10-1 1): p. 1067-72.
39. Wu, C, C. Orozco, J. Boyer, M. Leglise, J. Goodale, S. Batalov, C.L. Hodge, J.
Haase, J. Janes, J.W. Huss, 3rd, and A.I. Su, BioGPS: an extensible and customizable portal for querying and organizing gene annotation resources. Genome Biol, 2009. 10(11): p. R130.
40. Bijlani, R., Y. Cheng, D.A. Pearce, A.I. Brooks, and M. Ogihara, Prediction of biologically significant components from microarray data: Independently Consistent
Expression Discriminator (ICED). Bioinformatics, 2003. 19(1): p. 62-70.
41. Troyanskaya, O.G., M.E. Garber, P.O. Brown, D. Botstein, and R.B. Altman,
Nonparametric methods for identifying differentially expressed genes in microarray data. Bioinformatics, 2002. 18(11): p. 1454-61.
42. Roche, RealTime Ready Universal ProbeLibrary: Redefining and revolutionizing real-time qPCR assays. 2009.
43. Qiagen/PreAnalytiX, PAXgene Blood RNA Kit Handbook. 2009.
44. Wilkes, T.M., A.S. Devonshire, S.L. Ellison, and C.A. Foy, Evaluation of a novel approach for the measurement of RNA quality. BMC Res Notes, 2010. 3: p. 89.
45. Ibberson, D., V. Benes, M.U. Muckenthaler, and M. Castoldi, RNA degradation compromises the reliability of microRNA expression profiling. BMC Biotechnol, 2009. 9: p. 102.
46. Breaker, R.R., G.M. Emilsson, D. Lazarev, S. Nakamura, I.J. Puskarz, A. Roth, and N. Sudarsan, A common speed limit for RNA-cleaving ribozymes and deoxyribozymes. RNA, 2003. 9(8): p. 949-57.
47. Emilsson, G.M., S. Nakamura, A. Roth, and R.R. Breaker, Ribozyme speed limits.
RNA, 2003. 9(8): p. 907-18.
48. Ambion, TRIzol® Reagent Manual. 2010.
49. Qiagen, RNeasy Mini Kit Handbook. 2010.
50. Raines, R.T., Ribonuclease A. Chem Rev, 1998. 98(3): p. 1045-1066.
While certain of the preferred embodiments of the present invention have been described and specifically exemplified above, it is not intended that the invention be limited to such embodiments. Various modifications may be made thereto without departing from the scope and spirit of the present invention, as set forth in the following claims.
Claims
1. A method for quantitatively evaluating the extent of RNA degradation in a sample, comprising; a) identifying a candidate gene set and determining an arbitrary expression score for each gene present in said set, said gene set being specifically expressed in said tissue or said blood specimen and sorting said genes into at least two tiers based on said expression score; b) generating a plurality of amplification plots and CT profiles from a set of candidate genes encoding RNAs exposed to differential degradation conditions thereby providing a series of differentially weighted CT profiles correlating to the degradation state of said RNA, said scores corresponding to intact and incrementally degraded RNAs; and c) subjecting RNA in said sample to quantitative amplification, thereby generating an amplification plot and a CT score; said Cx score being correlated with those determined in step b) said score providing the degree of degradation of said sample.
2. The method of claim 1, wherein said sample is an environmental sample.
3. The method of claim 1, wherein said sample is obtained from a human.
4. The method of claim 1, wherein said sample is a tissue sample.
5. The method of claim 1, wherein said sample is a fluid.
6. The method of claim 1, wherein said sample comprises whole blood.
7. The method of claim 6, further comprising the step of d) analyzing a gene expression profile employing said sample.
8. The method of claim 7, further comprising the step of e) assessing disease status or progression using said gene expression profile.
9. The method of claim 1 , further comprising the step of d) discarding said sample without conducting a gene expression profile analysis if said degree of degradation is unsuitable.
10. The method of claim 1, wherein said RNA is converted to cDNA during or prior to quantitative amplification.
11. The method of claim 1 , wherein said quantitative amplification comprises
PCR.
12. A system configured to carry out the method of any of claims 1-11.
13. The system of claim 12, comprising a computer processor that generates said plurality of amplification plots and Cx profiles.
14. The system of claim 11, comprising a thermocycler.
15. The system of claim 11, comprising a sample processing component.
16. The system of claim 15, wherein said sample processing components purifies or isolates RNA from cells or tissue.
17. The system of claim 11, comprising a detection component.
18. The system of claim 17, wrherein said detection component detects mass, optical signals, heat, pH changes, or radioactivity.
Priority Applications (1)
| Application Number | Priority Date | Filing Date | Title |
|---|---|---|---|
| US14/365,060 US9994893B2 (en) | 2011-12-13 | 2012-12-13 | Compositions and methods for functional quality control for human blood-based gene expression products |
Applications Claiming Priority (2)
| Application Number | Priority Date | Filing Date | Title |
|---|---|---|---|
| US201161570257P | 2011-12-13 | 2011-12-13 | |
| US61/570,257 | 2011-12-13 |
Publications (1)
| Publication Number | Publication Date |
|---|---|
| WO2013090613A1 true WO2013090613A1 (en) | 2013-06-20 |
Family
ID=48613184
Family Applications (1)
| Application Number | Title | Priority Date | Filing Date |
|---|---|---|---|
| PCT/US2012/069561 Ceased WO2013090613A1 (en) | 2011-12-13 | 2012-12-13 | Compositions and methods for functional quality control for human blood-based gene expression products |
Country Status (2)
| Country | Link |
|---|---|
| US (1) | US9994893B2 (en) |
| WO (1) | WO2013090613A1 (en) |
Cited By (2)
| Publication number | Priority date | Publication date | Assignee | Title |
|---|---|---|---|---|
| CN111373256A (en) * | 2017-11-09 | 2020-07-03 | 株式会社岛津制作所 | Waveform Analysis Device |
| WO2023275376A1 (en) * | 2021-07-02 | 2023-01-05 | Aarhus Universitet | Methods of treating alzheimer's disease |
Families Citing this family (2)
| Publication number | Priority date | Publication date | Assignee | Title |
|---|---|---|---|---|
| US11434480B2 (en) * | 2017-09-27 | 2022-09-06 | Industry Foundation Of Chonnam National University | Viral RNA extracting composition and viral RNA extracting method |
| WO2025000023A1 (en) * | 2023-06-26 | 2025-01-02 | Drop Bio Ltd | Systems and methods for training analyte correction models |
Citations (6)
| Publication number | Priority date | Publication date | Assignee | Title |
|---|---|---|---|---|
| US20050095634A1 (en) * | 2003-10-16 | 2005-05-05 | Genomic Health Inc. | qRT-PCR assay system for gene expression profiling |
| US20060063170A1 (en) * | 2004-03-18 | 2006-03-23 | Arcturus Bioscience, Inc. | Determination of RNA quality |
| US20060204989A1 (en) * | 1998-09-22 | 2006-09-14 | Kopreski Michael S | Comparative analysis of extracellular RNA species |
| US20060246577A1 (en) * | 2003-04-05 | 2006-11-02 | Agilent Technologies, Inc. | Determining the quality of biomolecule samples |
| US20100057371A1 (en) * | 2008-08-29 | 2010-03-04 | Bio-Rad Laboratories, Inc. | Determination of the integrity of rna |
| US20110027862A1 (en) * | 2009-06-29 | 2011-02-03 | Life Technologies Corporation | Sample stabilization |
Family Cites Families (1)
| Publication number | Priority date | Publication date | Assignee | Title |
|---|---|---|---|---|
| AU2006243757B2 (en) * | 2005-05-03 | 2012-02-09 | Altheadx, Inc. | Compositions and methods for the analysis of degraded nucleic acids |
-
2012
- 2012-12-13 US US14/365,060 patent/US9994893B2/en active Active
- 2012-12-13 WO PCT/US2012/069561 patent/WO2013090613A1/en not_active Ceased
Patent Citations (6)
| Publication number | Priority date | Publication date | Assignee | Title |
|---|---|---|---|---|
| US20060204989A1 (en) * | 1998-09-22 | 2006-09-14 | Kopreski Michael S | Comparative analysis of extracellular RNA species |
| US20060246577A1 (en) * | 2003-04-05 | 2006-11-02 | Agilent Technologies, Inc. | Determining the quality of biomolecule samples |
| US20050095634A1 (en) * | 2003-10-16 | 2005-05-05 | Genomic Health Inc. | qRT-PCR assay system for gene expression profiling |
| US20060063170A1 (en) * | 2004-03-18 | 2006-03-23 | Arcturus Bioscience, Inc. | Determination of RNA quality |
| US20100057371A1 (en) * | 2008-08-29 | 2010-03-04 | Bio-Rad Laboratories, Inc. | Determination of the integrity of rna |
| US20110027862A1 (en) * | 2009-06-29 | 2011-02-03 | Life Technologies Corporation | Sample stabilization |
Non-Patent Citations (2)
| Title |
|---|
| FLEIGE ET AL.: "Comparison of relative mRNA quantification models and the impact of RNA integrity in quantitative real-time RT-PCR.", BIOTECHNOL LETT, vol. 28, no. 19, October 2006 (2006-10-01), pages 1601 - 1613, XP019391614 * |
| OPITZ ET AL.: "Impact of RNA degradation on gene expression profiling. art 36", BMC MED GENOMICS, vol. 3, 9 August 2010 (2010-08-09), pages 1 - 14, XP021082973 * |
Cited By (3)
| Publication number | Priority date | Publication date | Assignee | Title |
|---|---|---|---|---|
| CN111373256A (en) * | 2017-11-09 | 2020-07-03 | 株式会社岛津制作所 | Waveform Analysis Device |
| CN111373256B (en) * | 2017-11-09 | 2022-07-22 | 株式会社岛津制作所 | Waveform analyzer |
| WO2023275376A1 (en) * | 2021-07-02 | 2023-01-05 | Aarhus Universitet | Methods of treating alzheimer's disease |
Also Published As
| Publication number | Publication date |
|---|---|
| US9994893B2 (en) | 2018-06-12 |
| US20140342938A1 (en) | 2014-11-20 |
Similar Documents
| Publication | Publication Date | Title |
|---|---|---|
| EP2825675B1 (en) | Measurement of nucleic acid variants using highly-multiplexed error-suppressed deep sequencing | |
| Fraga et al. | Real‐time PCR | |
| US10465238B2 (en) | Quantification of mutant alleles and copy number variation using digital PCR with nonspecific DNA-binding dyes | |
| EP2310527B1 (en) | Improved lysis and reverse transcription for mrna quantification | |
| AU2006243757B2 (en) | Compositions and methods for the analysis of degraded nucleic acids | |
| US20110183856A1 (en) | Diagnosis and Prognosis of Infectious Disease Clinical Phenotypes and other Physiologic States Using Host Gene Expression Biomarkers In Blood | |
| US20080318801A1 (en) | Method and kit for evaluating rna quality | |
| EP2640848A1 (en) | Methods and kits for multiplex amplification of short tandem repeat loci | |
| JP2007509613A (en) | QRT-PCR assay system for gene expression profiling | |
| US20150322515A1 (en) | Methods and compositions for detecting target snp | |
| Dedeoğlu | High-throughput approaches for microRNA expression analysis | |
| CN107109471A (en) | Method for the mixed cellularity group that deconvoluted using gene expression data | |
| US20140287946A1 (en) | Nucleic acid control panels | |
| US10975440B2 (en) | Experimentally validated sets of gene specific primers for use in multiplex applications | |
| US9994893B2 (en) | Compositions and methods for functional quality control for human blood-based gene expression products | |
| US10870879B2 (en) | Method for the preparation of bar-coded primer sets | |
| Zeka et al. | RT-qPCR-based quantification of small non-coding RNAs | |
| US20070048757A1 (en) | Methods for characterizing cells using amplified micro rnas | |
| Zhao et al. | Universal Exponential Amplification Confers Multilocus Detection of Mutation-Prone Virus | |
| US20040048297A1 (en) | Nucleic acid detection assay control genes | |
| US20180245164A1 (en) | Experimentally Validated Sets of Gene Specific Primers for Use in Multiplex Applications | |
| CN105886497A (en) | Allelic ladder of polymorphic short tandem repeat (STR) loci as well as preparation method, identification method and application thereof | |
| Artika et al. | Real-time polymerase chain reaction: current techniques, applications, and role in COVID-19 diagnosis. Genes. 2022; 13: 2387 | |
| Deharvengt et al. | Molecular assessment of human diseases in the clinical laboratory | |
| US11913062B2 (en) | System and method for isolation and qualification of nucleic acids |
Legal Events
| Date | Code | Title | Description |
|---|---|---|---|
| 121 | Ep: the epo has been informed by wipo that ep was designated in this application |
Ref document number: 12858669 Country of ref document: EP Kind code of ref document: A1 |
|
| WWE | Wipo information: entry into national phase |
Ref document number: 14365060 Country of ref document: US |
|
| NENP | Non-entry into the national phase |
Ref country code: DE |
|
| 122 | Ep: pct application non-entry in european phase |
Ref document number: 12858669 Country of ref document: EP Kind code of ref document: A1 |