QUANTIFICATION OF ADAPTIVE IMMUNE CELL GENOMES IN A COMPLEX
MIXTURE OF CELLS
SEQUENCE LISTING
The Sequence Listing associated with this application is provided in text format in lieu of a paper copy, and is hereby incorporated by reference into the specification. The name of the text file containing the Sequence Listing is 100168.404PC_SEQUENCE_LISTING.txt. This text file was created on October 19, 2012, is about 315 KB, and is being submitted electronically via EFS-Web. BACKGROUND
Technical Field
The present disclosure relates generally to the highly sensitive quantification of the relative representation of adaptive immune cells in complex mixtures of cells using multiplex digital polymerase chain reaction (dPCR) or multiplex quantitative polymerase chain reaction (qPCR). In particular, the present disclosure relates to methods for quantitative determination of lymphocyte presence in complex tissues including solid tissues, such as quantification of tumor-infiltrating lymphocyte (TIL) genomes as a relative proportion of all cellular genomes that are represented in a tumor DNA sample, or quantification of the genomes of lymphocytes that have infiltrated somatic tissue in the pathogenesis of inflammation, allergy or autoimmune disease or in transplanted organs as a relative proportion of all cellular genomes that are represented in a tissue DNA sample.
Description of the Related Art
The adaptive immune system protects higher organisms against infections and other pathological events that may be attributable to foreign
substances, using adaptive immune receptors, the antigen-specific recognition proteins that are expressed by hematopoietic cells of the lymphoid lineage and that are capable of distinguishing self from non-self molecules in the host.
These lymphocytes may be found in the circulation and tissues of a host, and their recirculation between blood and the lymphatics has been described, including their extravasation via lymph node high endothelial venules, as well as at sites of infection, inflammation, tissue injury and other clinical insults. (See, e.g., Stein et al., 2005 Immunol. 116:1-12; DeNucci et al., 2009 Crit. Rev. Immunol. 29:87-109; Marelli-Berg et al., 2010 Immunol. 130:158; Ward et al., 2009 Biochem. J. 418:13; Gonzalez et al., 2011 Ann. Rev. Immunol. 29:215; Kehrl et al., 2009 Curr. Top. Microb. Immunol. 334:107; Steinmetz et al., 2009 Front. Biosci. (Schol. Ed.) 1 :13.)
Accordingly, the dynamic nature of movement by lymphocytes throughout a host organism is reflected in changes in the qualitative (e.g., antigen-specificity of the clonally expressed adaptive immune receptor
(immunoglobulin or T cell receptor), T cell versus B cell, T helper (Th) cell versus T regulatory (Treg) cell, effector T cell versus memory T cell, etc.) and quantitative distribution of lymphocytes among tissues, as a function of changes in host immune status.
For example, numerous studies have found an association between (i) the presence of tumor infiltrating lymphocytes (TIL) in a variety of solid tumors and (ii) patient prognosis and overall survival rates. In some studies, tumor infiltrating T cells having a specific phenotype (e.g., CD8+ and CD4+ T cells or regulatory T cells) are positive or negative predictors of survival (e.g., Jochems et al., 2011 Experimental Biol. Med. 236:567-579). In certain cases, however, TIL count alone is a predictor of long-term survival (e.g., Katz et al., 2009 Ann. Surg. Oncol. 16:2524-2530). Thus, quantitative determination of TIL counts has high prognostic value in a variety of cancers including colorectal, hepatocellular, gallbladder, pancreatic, esophageal, ovarian endometrial, cervical, bladder and urothelial cancers. While more is known
about the association of tumor-infiltrating T cells, B cells are also known to infiltrate tumors and studies have shown an association of tumor-infiltrating B cells with survival advantage (e.g., Ladanyi, et al., Cancer Immunol.
Immunother. 60(12):1729-38, July 21 , 2011 (epub ahead of print).
The quantitative determination of the presence of adaptive immune cells (e.g., T and B lymphocytes) in diseased tissues may therefore provide useful information for diagnostic, prognostic and other purposes, such as in cancer, infection, inflammation, tissue injury and other conditions.
The adaptive immune system employs several strategies to generate a repertoire of T- and B-cell antigen receptors with sufficient diversity to recognize the universe of potential pathogens. B lymphocytes mature to express antibodies (immunoglobulins, Igs) that occur as heterodimers of a heavy (H) a light (L) chain polypeptide, while T lymphocytes express
heterodimeric T cell receptors (TCR). The ability of T cells to recognize the universe of antigens associated with various cancers or infectious organisms is conferred by its T cell antigen receptor (TCR), which is made up of both an a (alpha) chain and a β (beta) chain or a γ (gamma) and a δ (delta) chain. The proteins which make up these chains are encoded by DNA, which employs a unique mechanism for generating the tremendous diversity of the TCR. This multi-subunit immune recognition receptor associates with the CD3 complex and binds to peptides presented by the major histocompatibility complex (MHC) class I and II proteins on the surface of antigen-presenting cells (APCs).
Binding of TCR to the antigenic peptide on the APC is the central event in T cell activation, which occurs at an immunological synapse at the point of contact between the T cell and the APC.
Each TCR peptide contains variable complementarity determining regions (CDRs), as well as framework regions (FRs) and a constant region. The sequence diversity of αβ T cells is largely determined by the amino acid sequence of the third complementarity-determining region (CDR3) loops of the a and β chain variable domains, which diversity is a result of recombination
between variable (Vp), diversity (Dp), and joining (Jp) gene segments in the β chain locus, and between analogous Va and Ja gene segments in the a chain locus, respectively. The existence of multiple such gene segments in the TCR a and β chain loci allows for a large number of distinct CDR3 sequences to be encoded. CDR3 sequence diversity is further increased by independent addition and deletion of nucleotides at the Vp-Dp, Dp-Jp, and Va-Ja junctions during the process of TCR gene rearrangement. In this respect,
immunocompetence is reflected in the diversity of TCRs.
The γδ TCR is distinctive from the αβ TCR in that it encodes a receptor that interacts closely with the innate immune system. TCRy5, is expressed early in development, has specialized anatomical distribution, has unique pathogen and small-molecule specificities, and has a broad spectrum of innate and adaptive cellular interactions. A biased pattern of TCRy V and J segment expression is established early in ontogeny as the restricted subsets of TCRy5 cells populate the mouth, skin, gut, vagina, and lungs prenatally. Consequently, the diverse TCRy repertoire in adult tissues is the result of extensive peripheral expansion following stimulation by environmental exposure to pathogens and toxic molecules.
Igs expressed by B cells are proteins consisting of four
polypeptide chains, two heavy chains (H chains) and two light chains (L chains), forming an H2L2 structure. Each pair of H and L chains contains a hypervariable domain, consisting of a VL and a VH region, and a constant domain. The H chains of Igs are of several types, μ, δ, γ, a, and β. The diversity of Igs within an individual is mainly determined by the hypervariable domain. Similar to the TCR, the V domain of H chains is created by the combinatorial joining of the VH, DH, and JH gene segments. Hypervariable domain sequence diversity is further increased by independent addition and deletion of nucleotides at the VH-DH, DH-JH, and VH-JH junctions during the process of Ig gene rearrangement. In this respect, immunocompetence is reflected in the diversity of Igs.
Quantitative characterization of adaptive immune cells based on the presence in such cells of functionally rearranged Ig and TCR encoding genes that direct productive expression of adaptive immune receptors has been achieved using biological samples from which adaptive immune cells can be readily isolated in significant numbers, such as blood, lymph or other biological fluids. In these samples, adaptive immune cells occur as particles in fluid suspension. See, e.g., US 2010/0330571 ; see also, e.g., Murphy, Janeway's Immunobiology (8th Ed.), 2011 Garland Science, NY, Appendix I, pp. 717-762.
Current approaches to the detection and quantification of adaptive immune cells in tissues or organs from which adaptive immune cells cannot be readily isolated, however, are far more limited. For example, in solid tissues and solid tumors, adaptive immune cell detection typically requires histological detection in a small, non-representative sample such as a fixed or frozen section of a biopsy specimen, using laborious and at most semi-quantitative techniques such as immunohistochemistry or in situ hybridization {e.g., Bancroft and Gamble, Theory and Practice of Histological Techniques, Churchill
Livingstone, 2007; Carson and Hladik, Histotechnology: A Self-Instructional Text, 2009 Am. Soc. Clin. Pathol.). In conventional practice, the excised tissue may be cut into a plurality of serial histological sections along substantially parallel planes, for analysis by any of a number of known histological, histochemical, immunohistological, histopathologic, microscopic (including morphometric analysis and/or three-dimensional reconstruction), cytological, biochemical, pharmacological, molecular biological, immunochemical, imaging or other analytical techniques, which techniques are known to persons skilled in the relevant art. See, e.g., Bancroft and Gamble, Theory and Practice of Histological Techniques (6th Ed.), 2007 Churchill Livingstone, Oxford, UK;
Kiernan, Histological and Histochemical Methods: Theory and Practice, 2001 Cold Spring Harbor Laboratory Press, Cold Spring Harbor, NY; M.A. Hayat (Ed.), Cancer Imaging - Vols. 1 and 2, 2007 Academic Press, NY.
Efforts to obtain meaningful quantitative data from such
approaches are severely limited with regard to the number of adaptive immune cells that may have infiltrated a tissue, for instance, where high statistical significance cannot be achieved when sample collection depends on the number of events that can be detected by observation of a finite number of small fields on microscope slides. Alternatively, a tissue sample must be mechanically and/or enzymatically dissociated to produce a single-cell suspension that is amenable to flow immunocytofluorimetric analysis (e.g., Murphy, 2011 , pp. 740-742), although such time-consuming and labor-intensive steps are likely to result in incomplete recovery of lymphocytes from the sample due to loss or destruction of a portion of the sample in the course of handling. These and related limitations of the current approaches compromise the quality of quantitative data that may be obtained.
Clearly there is a need for an improved method for quantifying adaptive immune cells in a complex biological sample containing a mixture of cells that are not all adaptive immune cells, without requiring the isolation of adaptive immune cells from the sample, e.g., without having to separate the adaptive immune cells from the non-adaptive immune cells. The presently described embodiments address this need and offer other related advantages. BRIEF SUMMARY
In one aspect the present invention provides a method for quantifying the relative representation of adaptive immune cells in a test biological sample that comprises a mixture of cells, the mixture comprising adaptive immune cells and cells that are not adaptive immune cells, the method comprising (a) distributing test sample template DNA extracted from the test biological sample to form a set of assay samples, (b) amplifying said test sample template DNA in the set of assay samples in a multiplex digital polymerase chain reaction (dPCR) that comprises: (1) (i) a plurality of V- segment oligonucleotide primers that are each independently capable of
specifically hybridizing to at least one polynucleotide encoding a T cell receptor (TCR) V-region polypeptide or an immunoglobulin (Ig) V-region polypeptide, wherein each V-segment primer comprises a nucleotide sequence of at least 15 contiguous nucleotides that is complementary to at least one functional TCR or Ig V-encoding gene segment and wherein the plurality of V-segment primers specifically hybridize to substantially all functional TCR or Ig V-encoding gene segments that are present in the test sample, and (ii) a plurality of J-segment oligonucleotide primers that are each independently capable of specifically hybridizing to at least one polynucleotide encoding a T cell receptor (TCR) J- region polypeptide or an immunoglobulin (Ig) J-region polypeptide, wherein each J-segment primer comprises a nucleotide sequence of at least 15 contiguous nucleotides that is complementary to at least one functional TCR or Ig J-encoding gene segment and wherein the plurality of J-segment primers specifically hybridize to substantially all functional TCR or Ig J-encoding gene segments that are present in the test sample, wherein the V-segment and J- segment primers are capable of amplifying in said multiplex dPCR substantially all rearranged TCR or Ig CDR3-encoding regions in the test sample to produce a multiplicity of amplified rearranged DNA molecules from the adaptive immune cells in the test sample; and (2) a set of control primers to produce an internal control gene amplification product, wherein the set of control primers amplifies an internal control gene segment that is not specific to adaptive immune cells; and (c) comparing a first number of assay samples that detectably contain said multiplicity of amplified rearranged DNA molecules of (b)(1) with a second number of assay samples that detectably contain said internal control gene amplification product of (b)(2), and therefrom quantifying the relative
representation of adaptive immune cells in said test biological sample.
In certain embodiments the plurality of V-segment oligonucleotide primers and the plurality of J-segment oligonucleotide primers comprise the sequences set forth in SEQ ID NOS:1-65, 644-708 and 843-883. In certain embodiments either or both of (i) the V-segment oligonucleotide primers
comprise one or a plurality of oligonucleotides that exhibit at least 90% sequence identity to one or more of the nucleotide sequences set forth in SEQ ID NOS:1-52, 644-685, and 880-883, and (ii) the J-segment primers comprise one or a plurality of oligonucleotides that exhibit at least 90% sequence identity to one or more of the nucleotide sequences set forth in SEQ ID NOS:53-65, 696-708, and 880-883. In certain embodiments each amplified rearranged DNA molecule in the multiplicity of amplified rearranged DNA molecules is less than 600 nucleotides in length. In certain embodiments each functional TCR or Ig V-encoding gene segment comprises a V gene recombination signal sequence (RSS) and each functional TCR or Ig J-encoding gene segment comprises a J gene RSS, and wherein each amplified rearranged DNA molecule comprises (i) at least 10, 20, 30 or 40 contiguous nucleotides of a sense strand of the TCR or Ig V-encoding gene segment, said at least 10, 20, 30 or 40 contiguous nucleotides being situated 5' to the V gene RSS and (ii) at least 10, 20 or 30 contiguous nucleotides of a sense strand of the TCR or Ig J- encoding gene segment, said at least 10, 20 or 30 contiguous nucleotides being situated 3' to the J gene RSS.
In certain embodiments the above described method is capable of detecting a presence of at least ten adaptive immune cells per 10,000 cells in the mixture of cells. In certain embodiments the adaptive immune cells are T cells and in certain other embodiments the adaptive immune cells are B cells. In certain embodiments the biological sample is fresh tissue, frozen tissue, or fixed tissue. In certain embodiments the rearranged TCR or Ig CDR3-encoding regions are selected from rearranged TCRa CDR3-encoding regions, TCRp CDR3-encoding regions, TCRy CDR3-encoding regions, TCR6 CDR3-encoding regions, IgH CDR3-encoding regions, IgK CDR3-encoding regions, and IgA CDR3-encoding regions. In certain embodiments the test biological sample comprises human cells, mouse cells, or rat cells. In certain embodiments either or both of the first and second numbers of assay samples are determined by detecting fluorescence of a non-specific DNA-intercalating dye in the assay
samples. In certain embodiments the first number of assay samples is determined by detecting fluorescence of a labeled probe or of multiple labeled probes that specifically hybridize to the multiplicity of amplified rearranged DNA molecules, and the second number of assay samples is determined by detecting fluorescence of a labeled probe that specifically hybridizes to the internal control gene amplification products. In certain further embodiments the labeled probe that specifically hybridizes to the multiplicity of amplified rearranged DNA molecules comprises a sequence selected from SEQ ID NOS:66 and 709-839, or one or more of the multiple labeled probes that specifically hybridize to the multiplicity of amplified rearranged DNA molecules comprise one or more sequence selected from SEQ ID NOS:66 and 709-839.
In certain embodiments the test biological sample comprises somatic tissue, which in certain further embodiments is from a subject having an autoimmune disease and the tissue is targeted by an autoimmune reaction. In certain still further embodiments the autoimmune disease is selected from type 1 diabetes, rheumatoid arthritis, multiple sclerosis, Crohn's disease, Graves' disease, Addison's disease, celiac disease, Sjogren's, psoriasis, Guillian-Barre syndrome, and myasthenia gravis. In certain embodiments the somatic tissue comprises neoplastic tissue, which in certain further
embodiments is obtained or derived from a solid tumor. In certain
embodiments the somatic tissue is from a transplanted organ, which in certain further embodiments is selected from liver, lung, kidney, heart, spleen, pancreas, skin, intestine, and thymus. In certain further embodiments of the above described methods, the plurality of V-segment oligonucleotide primers and the plurality of J-segment oligonucleotide primers are RN2 modified.
Turning to another aspect of the present invention there is provided a method for assessing an effect of a therapeutic treatment on relative representation of adaptive immune cells in at least one tissue of a subject, the tissue comprising adaptive immune cells and cells that are not adaptive immune cells, the method comprising (I) obtaining one or a plurality of test
biological samples from a first tissue of the subject at one or a plurality of time points prior to administering the therapeutic treatment, wherein the test biological sample contains DNA from a mixture of cells, the mixture comprising adaptive immune cells and cells that are not adaptive immune cells; (II) obtaining one or a plurality of test biological samples from a second tissue of the subject at one or a plurality of time points after administering the therapeutic treatment, wherein the test biological sample contains DNA from a mixture of cells, the mixture comprising adaptive immune cells and cells that are not adaptive immune cells; (III) for each of said test biological samples from (I) and (II): (a) distributing test sample template DNA extracted from the test biological sample to form a set of assay samples, (b) amplifying said test sample template DNA in the set of assay samples in a multiplex digital polymerase chain reaction (dPCR) that comprises: (1) (i) a plurality of V-segment oligonucleotide primers that are each independently capable of specifically hybridizing to at least one polynucleotide encoding a T cell receptor (TCR) V-region polypeptide or an immunoglobulin (Ig) V-region polypeptide, wherein each V-segment primer comprises a nucleotide sequence of at least 15 contiguous nucleotides that is complementary to at least one functional TCR or Ig V-encoding gene segment and wherein the plurality of V-segment primers specifically hybridize to substantially all functional TCR or Ig V-encoding gene segments that are present in the test sample, and (ii) a plurality of J-segment oligonucleotide primers that are each independently capable of specifically hybridizing to at least one polynucleotide encoding a T cell receptor (TCR) J-region polypeptide or an immunoglobulin (Ig) J-region polypeptide, wherein each J-segment primer comprises a nucleotide sequence of at least 15 contiguous nucleotides that is complementary to at least one functional TCR or Ig J-encoding gene segment and wherein the plurality of J-segment primers specifically hybridize to substantially all functional TCR or Ig J-encoding gene segments that are present in the test sample, wherein the V-segment and J-segment primers are capable of amplifying in said multiplex dPCR of substantially all rearranged
TCR or Ig CDR3-encoding regions in the test sample to produce a multiplicity of amplified rearranged DNA molecules from the adaptive immune cells in the test sample; and (2) a set of control primers to produce an internal control gene amplification product, wherein the set of control primers amplifies an internal control gene DNA segment that is not specific to adaptive immune cells; and(c) comparing a first number of assay samples that detectably contain said multiplicity of amplified rearranged DNA molecules of (b)(1) with a second number of assay samples that detectably contain said internal control gene amplification product of (b)(2), and therefrom quantifying the relative
representation of adaptive immune cells in said test biological sample; and (IV) comparing the relative representation of adaptive immune cells in at least one test biological sample obtained at a time point prior to administering the therapeutic treatment to the relative representation of adaptive immune cells in at least one test biological sample obtained at a time point after administering the therapeutic treatment, and thereby assessing an effect of the therapeutic treatment on relative representation of adaptive immune cells in at least one tissue of a subject.
In certain further embodiments the first and second tissues are are the same tissue, and in certain other further embodiments the first and second tissues are different tissues. In certain embodiments the method assesses a dose-related effect of the therapeutic treatment, wherein a plurality of test biological samples are obtained from the second tissue of the subject at a plurality of time points after administering the therapeutic treatment, and wherein the therapeutic treatment is administered at a plurality of different dosages. In certain embodiments the method assesses a prognosis for the subject receiving the therapeutic treatment, wherein an altered relative representation of adaptive immune cells in at least one test biological sample obtained at a time point after administering the therapeutic treatment, compared to the relative representation of adaptive immune cells in at least one test biological sample obtained at a time point prior to administering the therapeutic
treatment, indicates an effect of the therapeutic treatment on relative
representation of adaptive immune cells in at least one tissue of a subject. In certain embodiments the method is selected from: (i) the method in which the subject has cancer and an increased relative representation of adaptive immune cells in at least one test biological sample obtained at a time point after administering the therapeutic treatment compared to the relative representation of adaptive immune cells in at least one test biological sample obtained at a time point prior to administering the therapeutic treatment, indicates a beneficial effect of the therapeutic treatment; (ii) the method in which the subject has an autoimmune disease and a decreased relative representation of adaptive immune cells in at least one test biological sample obtained at a time point after administering the therapeutic treatment compared to the relative representation of adaptive immune cells in at least one test biological sample obtained at a time point prior to administering the therapeutic treatment, indicates a beneficial effect of the therapeutic treatment; and (iii) the method in which the subject has a transplanted organ and a decreased relative representation of adaptive immune cells in at least one test biological sample from the transplanted organ obtained at a time point after administering the therapeutic treatment compared to the relative representation of adaptive immune cells in at least one test biological sample from the transplanted organ obtained at a time point prior to administering the therapeutic treatment, indicates a beneficial effect of the therapeutic treatment.
In certain embodiments of the above described methods, the method further comprises determining a polynucleotide sequence for each amplified rearranged DNA molecule from the population of adaptive immune cells in the test sample. In certain embodiments the plurality of V-segment oligonucleotide primers and the plurality of J-segment oligonucleotide primers comprise at least one of (1) the sequences set forth in SEQ ID NOS:1-65, (2) the sequences set forth in SEQ ID NOS:66-214, (3) the sequences set forth in SEQ ID NOS:215-238, (4) the sequences set forth in SEQ ID NOs:239-545, (5)
the sequences set forth in SEQ ID NOS:546-549 and 634-637, (6) the sequences set forth in SEQ ID NOS:550-633 and 638-643, (7) the sequences set forth in SEQ ID NOS:644-708, (8) the sequences set forth in SEQ ID
NOS:644-773, (9) the sequences set forth in SEQ ID NOS:843-879, (10) the sequences set forth in SEQ ID NOS:880-883, and (11) portions of sequences (1) to (10) that are at least 15 nucleotides in length. In certain embodiments either or both of: (i) the V-segment oligonucleotide primers comprise one or a plurality of oligonucleotides that exhibit at least 90% sequence identity to one or more of: (1) the nucleotide sequences set forth in SEQ ID NOS:1-52, (2) the nucleotide sequences set forth in SEQ ID NOS:67-201 , (3) the nucleotide sequences set forth in SEQ ID NOS:221-238, (4) the nucleotide sequences set forth in SEQ ID NOS:255-545, (5) the nucleotide sequences set forth in SEQ ID NOS:546-549, (6) the nucleotide sequences set forth in SEQ ID NOS:550-633, (7) the nucleotide sequences set forth in SEQ ID NOS:644-695, (8) the nucleotide sequences set forth in SEQ ID NOS:843-879, and (9) portions of sequences (1) to (8) that are at least 15 nucleotides in length; and (ii) the J- segment primers comprise one or a plurality of oligonucleotides that exhibit at least 90% sequence identity to one or more of: (1) the nucleotide sequences set forth in SEQ ID NOS:53-65, (2) the nucleotide sequences set forth in SEQ ID NOS:202-214, (3) the nucleotide sequences set forth in SEQ ID NOS:215- 220, (4) the nucleotide sequences set forth in SEQ ID NOS:239-254, (5) the nucleotide sequences set forth in SEQ ID NOS:634-637, (6) the nucleotide sequences set forth in SEQ ID NOS:638-643, (7) the nucleotide sequences set forth in SEQ ID NOS:696-708, (8) the nucleotide sequences set forth in SEQ ID NOS:880-883, and (9) portions of sequences (1) to (8) that are at least 15 nucleotides in length.
Turning to another embodiment of the presently disclosed invention, there is provided a method for quantifying the relative representation of adaptive immune cell DNA in a test biological sample that contains DNA from a mixture of cells, the mixture comprising adaptive immune cells and cells that
are not adaptive immune cells, the method comprising: (a) amplifying test sample template DNA extracted from the test biological sample in a multiplex quantitative polymerase chain reaction (qPCR) that comprises: (i) a plurality of V-segment oligonucleotide primers that are each independently capable of specifically hybridizing to at least one polynucleotide encoding a T cell receptor (TCR) V-region polypeptide or an immunoglobulin (Ig) V-region polypeptide, wherein each V-segment primer comprises a nucleotide sequence of at least 15 contiguous nucleotides that is complementary to at least one functional TCR or Ig V-encoding gene segment and wherein the plurality of V-segment primers specifically hybridize to substantially all functional TCR or Ig V-encoding gene segments that are present in the test sample, and (ii) a plurality of J-segment oligonucleotide primers that are each independently capable of specifically hybridizing to at least one polynucleotide encoding a T cell receptor (TCR) J- region polypeptide or an immunoglobulin (Ig) J-region polypeptide, wherein each J-segment primer comprises a nucleotide sequence of at least 15 contiguous nucleotides that is complementary to at least one functional TCR or Ig J-encoding gene segment and wherein the plurality of J-segment primers specifically hybridize to substantially all functional TCR or Ig J-encoding gene segments that are present in the test sample, wherein the V-segment and J- segment primers are capable of promoting amplification in said multiplex polymerase chain reaction (PCR) of substantially all rearranged TCR or Ig CDR3-encoding regions in the test sample to produce a multiplicity of amplified rearranged DNA molecules from a population of adaptive immune cells in the test sample; and (b) concurrently with said step of amplifying, measuring at one or a plurality of time points a first DNA signal level that is detectable in said multiplicity of amplified rearranged DNA molecules of (a); (c) comparing at said one or plurality of time points the first DNA signal level measured in (b) to a second DNA signal level that is detectable in amplification products of a known amount of control adaptive immune cell template DNA extracted from a control adaptive immune cell sample that has been amplified by the plurality of V-
segment oligonucleotide primers and the plurality of J-segment oligonucleotide primers, and therefrom quantifying a relative amount of adaptive immune cell DNA in the test sample template DNA extracted from the test biological sample; and (d) determining, from the relative amount of adaptive immune cell DNA quantified in (c), the relative representation of adaptive immune cell DNA in the test biological sample.
In certain embodiments the plurality of V-segment oligonucleotide primers and the plurality of J-segment oligonucleotide primers comprise the sequences set forth in SEQ ID NOS:1-65, 644-708, and 843-883. In certain embodiments either or both of: (i) the V-segment oligonucleotide primers comprise one or a plurality of oligonucleotides that exhibit at least 90%
sequence identity to one or more of the nucleotide sequences set forth in SEQ ID NOS:1-52, 644-695, and 843-879; and (ii) the J-segment primers comprise one or a plurality of oligonucleotides that exhibit at least 90% sequence identity to one or more of the nucleotide sequences set forth in SEQ ID NOS:53-65, 696-708, and 880-883. In certain embodiments each amplified rearranged DNA molecule in the multiplicity of amplified rearranged DNA molecules is less than 600 nucleotides in length. In certain embodiments each functional TCR or Ig V-encoding gene segment comprises a V gene recombination signal sequence (RSS) and each functional TCR or Ig J-encoding gene segment comprises a J gene RSS, and wherein each amplified rearranged DNA molecule comprises (i) at least 10, 20, 30 or 40 contiguous nucleotides of a sense strand of the TCR or Ig V-encoding gene segment, said at least 10, 20, 30 or 40 contiguous nucleotides being situated 5' to the V gene RSS and (ii) at least 10, 20 or 30 contiguous nucleotides of a sense strand of the TCR or Ig J- encoding gene segment, said at least 10, 20 or 30 contiguous nucleotides being situated 3' to the J gene RSS. In certain embodiments the above described method is capable of detecting a presence of at least ten adaptive immune cells per 10,000 cells in the mixture of cells. In certain embodiments the adaptive immune cells are T cells. In certain embodiments the adaptive
immune cells are B cells. In certain embodiments the biological sample is fresh tissue, frozen tissue, or fixed tissue. In certain embodiments the rearranged TCR or Ig CDR3-encoding regions are selected from rearranged TCRa CDR3- encoding regions, TCRp CDR3-encoding regions, TCRy CDR3-encoding regions, TCR5 CDR3-encoding regions, IgH CDR3-encoding regions, IgK CDR3-encoding regions, and IgA CDR3-encoding regions.
In certain further embodiments of the above described methods, the test biological sample and the control adaptive immune cell sample comprise cells that are selected from human cells, mouse cells and rat cells. In certain embodiments either or both of the first and second DNA signal levels are measured by detecting fluorescence of a non-specific DNA-intercalating dye. In certain embodiments the first DNA signal level is measured by detecting fluorescence of a labeled probe or of multiple labeled probes that specifically hybridize to the multiplicity of amplified rearranged DNA molecules and the second DNA signal level is measured by detecting fluorescence of a labeled probe or of multiple labeled probes that specifically hybridize to the amplification products of the control adaptive immune cell template DNA. In certain further embodiments the labeled probe that specifically hybridizes to the multiplicity of amplified rearranged DNA molecules comprises a sequence selected from SEQ ID NOS:66 and 709-839, or one or more of the multiple labeled probes that specifically hybridize to the multiplicity of amplified rearranged DNA molecules comprise a sequence selected from SEQ ID
NOS:66 and 709-839.
In certain further embodiments of the above described methods, the method comprises quantifying a relative amount of DNA in the mixture of cells that comprises adaptive immune cells and cells that are not adaptive immune cells, the method comprising: (e) amplifying test sample template DNA extracted from the test biological sample with a set of control primers to produce internal control gene amplification products, wherein the set of control primers amplifies an internal control gene DNA segment that is not specific to
adaptive immune cells; (f) concurrently with step (e), measuring at one or a plurality of time points a third DNA signal level that is detectable in the amplification products of (e); (g) comparing, at said one or plurality of time points, the third DNA signal level in (f) to a fourth DNA signal level that is detectable in amplification products of a known amount of internal control gene DNA that has been amplified by the control primers, and therefrom quantifying a relative amount of internal control gene DNA in the test sample template DNA extracted from the test biological sample; and (h) determining, from the relative amount of internal control gene DNA quantified in (g), the relative amount of DNA in the mixture of cells.
In certain further embodiments the control primers are present in the qPCR reaction of (a). In certain embodiments, in step (e) the control primers are present in a qPCR reaction that is separate from the qPCR reaction of (a). In certain embodiments the test biological sample comprises somatic tissue, which in certain further embodiments is from a subject having an autoimmune disease and the tissue is targeted by an autoimmune reaction. In certain still further embodiments the autoimmune disease is selected from type 1 diabetes, rheumatoid arthritis, multiple sclerosis, Crohn's disease, Graves' disease, Addison's disease, celiac disease, Sjogren's, psoriasis, Guillian-Barre syndrome, and myasthenia gravis. In certain embodiments the somatic tissue comprises neoplastic tissue, which in certain further embodiments is obtained or derived from a solid tumor. In certain other embodiments the somatic tissue is from a transplanted organ, which in certain further embodiments is selected from liver, lung, kidney, heart, spleen, pancreas, skin, intestine, and thymus. In certain embodiments the plurality of V-segment oligonucleotide primers and the plurality of J-segment oligonucleotide primers are RN2 modified.
Turning to another embodiment, there is provided herein a method for assessing an effect of a therapeutic treatment on relative
representation of adaptive immune cells in at least one tissue of a subject, the tissue comprising adaptive immune cells and cells that are not adaptive
immune cells, the method comprising: (I) obtaining one or a plurality of test biological samples from a first tissue of the subject at one or a plurality of time points prior to administering the therapeutic treatment, wherein the test biological sample contains DNA from a mixture of cells, the mixture comprising adaptive immune cells and cells that are not adaptive immune cells; (II) obtaining one or a plurality of test biological samples from a second tissue of the subject at one or a plurality of time points after administering the therapeutic treatment, wherein the test biological sample contains DNA from a mixture of cells, the mixture comprising adaptive immune cells and cells that are not adaptive immune cells; (III) for each of said test biological samples from (I) and (II): (a) amplifying test sample template DNA extracted from the test biological sample in a multiplex quantitative polymerase chain reaction (qPCR) that comprises: (i) a plurality of V-segment oligonucleotide primers that are each independently capable of specifically hybridizing to at least one polynucleotide encoding a T cell receptor (TCR) V-region polypeptide or an immunoglobulin (Ig) V-region polypeptide, wherein each V-segment primer comprises a nucleotide sequence of at least 15 contiguous nucleotides that is
complementary to at least one functional TCR or Ig V-encoding gene segment and wherein the plurality of V-segment primers specifically hybridize to substantially all functional TCR or Ig V-encoding gene segments that are present in the test sample, and (ii) a plurality of J-segment oligonucleotide primers that are each independently capable of specifically hybridizing to at least one polynucleotide encoding a T cell receptor (TCR) J-region polypeptide or an immunoglobulin (Ig) J-region polypeptide, wherein each J-segment primer comprises a nucleotide sequence of at least 15 contiguous nucleotides that is complementary to at least one functional TCR or Ig J-encoding gene segment and wherein the plurality of J-segment primers specifically hybridize to substantially all functional TCR or Ig J-encoding gene segments that are present in the test sample, wherein the V-segment and J-segment primers are capable of promoting amplification in said multiplex polymerase chain reaction
(PCR) of substantially all rearranged TCR or Ig CDR3-encoding regions in the test sample to produce a multiplicity of amplified rearranged DNA molecules from a population of adaptive immune cells in the test sample; and (b) concurrently with said step of amplifying, measuring at one or a plurality of time points a first DNA signal level that is detectable in said multiplicity of amplified rearranged DNA molecules of (a); (c) comparing at said one or plurality of time points the first DNA signal level measured in (b) to a second DNA signal level that is detectable in amplification products of a known amount of control adaptive immune cell template DNA extracted from a control adaptive immune cell sample that has been amplified by the plurality of V-segment
oligonucleotide primers and the plurality of J-segment oligonucleotide primers, and therefrom quantifying a relative amount of adaptive immune cell DNA in the test sample template DNA extracted from the test biological sample; and (d) determining, from the relative amount of adaptive immune cell DNA quantified in (c), the relative representation of adaptive immune cell DNA in the test biological sample; and (IV) comparing the relative representation of adaptive immune cell DNA in at least one test biological sample obtained at a time point prior to administering the therapeutic treatment to the relative representation of adaptive immune cell DNA in at least one test biological sample obtained at a time point after administering the therapeutic treatment, and thereby assessing an effect of the therapeutic treatment on relative representation of adaptive immune cells in at least one tissue of a subject.
In certain further embodiments the first and second tissues are the same tissue, and in certain other further embodiments the first and second tissues are different tissues. In certain embodiments of the above described method, step (III) further comprises, for each test biological sample, quantifying a relative amount of DNA in the mixture of cells that comprises adaptive immune cells and cells that are not adaptive immune cells, the method comprising: (e) amplifying test sample template DNA extracted from the test biological sample with a set of control primers to produce internal control
gene amplification products, wherein the set of control primers amplifies an internal control gene DNA segment that is not specific to adaptive immune cells; (f) concurrently with step (e), measuring at one or a plurality of time points a third DNA signal level that is detectable in the amplification products of (e); (g) comparing, at said one or plurality of time points, the third DNA signal level in (f) to a fourth DNA signal level that is detectable in amplification products of a known amount of internal control gene DNA that has been amplified by the control primers, and therefrom quantifying a relative amount of internal control gene DNA in the test sample template DNA extracted from the test biological sample; and (h) determining, from the relative amount of internal control gene DNA quantified in (g), the relative amount of DNA in the mixture of cells. In certain embodiments the method assesses a dose-related effect of the therapeutic treatment, wherein a plurality of test biological samples are obtained from the second tissue of the subject at a plurality of time points after administering the therapeutic treatment, and wherein the therapeutic treatment is administered at a plurality of different dosages. In certain embodiments the method assesses a prognosis for the subject receiving the therapeutic treatment, wherein an altered relative representation of adaptive immune cell DNA in at least one test biological sample obtained at a time point after administering the therapeutic treatment compared to the relative representation of adaptive immune cell DNA in at least one test biological sample obtained at a time point prior to administering the therapeutic treatment, indicates an effect of the therapeutic treatment on relative representation of adaptive immune cells in at least one tissue of a subject.
In certain further embodiments the method is selected from: (i) the method in which the subject has cancer and an increased relative
representation of adaptive immune cell DNA in at least one test biological sample obtained at a time point after administering the therapeutic treatment compared to the relative representation of adaptive immune cell DNA in at least one test biological sample obtained at a time point prior to administering the
therapeutic treatment, indicates a beneficial effect of the therapeutic treatment; (ii) the method in which the subject has an autoimmune disease and a decreased relative representation of adaptive immune cell DNA in at least one test biological sample obtained at a time point after administering the
therapeutic treatment compared to the relative representation of adaptive immune cell DNA in at least one test biological sample obtained at a time point prior to administering the therapeutic treatment, indicates a beneficial effect of the therapeutic treatment; and (iii) the method in which the subject has a transplanted organ and a decreased relative representation of adaptive immune cell DNA in at least one test biological sample from the transplanted organ obtained at a time point after administering the therapeutic treatment compared to the relative representation of adaptive immune cell DNA in at least one test biological sample from the transplanted organ obtained at a time point prior to administering the therapeutic treatment, indicates beneficial effect of the therapeutic treatment. In certain embodiments the method further comprises determining a polynucleotide sequence for each amplified rearranged DNA molecule from the population of adaptive immune cells in the test sample.
In certain other further embodiments the plurality of V-segment oligonucleotide primers and the plurality of J-segment oligonucleotide primers comprise at least one of (1) the sequences set forth in SEQ ID NOS:1-65, (2) the sequences set forth in SEQ ID NOS:67-214, (3) the sequences set forth in SEQ ID NOS:215-238, (4) the sequences set forth in SEQ ID NOS:239-545, (5) the sequences set forth in SEQ ID NOS:546-549 and 634-637, (6) the sequences set forth in SEQ ID NOS:550-633 and 638-643, (7) the sequences set forth in SEQ ID NOs:644-708, (8) the sequences set forth in SEQ ID
NOS:644-773, (9) the sequences set forth in SEQ ID NOS:843-879, (10) the sequences set forth in SEQ ID NOS:880-883, and (11) portions of sequences (1) to (10) that are at least 15 nucleotides in length.
In certain other further embodiments either or both of: (i) the V- segment oligonucleotide primers comprise one or a plurality of oligonucleotides
that exhibit at least 90% sequence identity to one or more of: (1) the nucleotide sequences set forth in SEQ ID NOS:1-52, (2) the nucleotide sequences set forth in SEQ ID NOS:67-201 , (3) the nucleotide sequences set forth in SEQ ID NOS:221-238, (4) the nucleotide sequences set forth in SEQ ID NOS:255-545, (5) the nucleotide sequences set forth in SEQ ID NOS:546-549, (6) the nucleotide sequences set forth in SEQ ID NOS:550-633, (7) the nucleotide sequences set forth in SEQ ID NOS:644-695, (8) the nucleotide sequences set forth in SEQ ID NOS:843-879, and (9) portions of sequences (1) to (8) that are at least 15 nucleotides in length; and (ii) the J-segment primers comprise one or a plurality of oligonucleotides that exhibit at least 90% sequence identity to one or more of: (1) the nucleotide sequences set forth in SEQ ID NOS:53-65, (2) the nucleotide sequences set forth in SEQ ID NOS:202-214, (3) the nucleotide sequences set forth in SEQ ID NOS:215-220, (4) the nucleotide sequences set forth in SEQ ID NOS:239-254, (5) the nucleotide sequences set forth in SEQ ID NOS:634-637, (6) the nucleotide sequences set forth in SEQ ID NOS:638-643, (7) the nucleotide sequences set forth in SEQ ID NOS:696-708, (8) the nucleotide sequences set forth in SEQ ID NO:880-883, and (9) portions of sequences (1) to (8) that are at least 15 nucleotides in length. These and other aspects of the herein described invention embodiments will be evident upon reference to the following detailed
description and attached drawings. All of the U.S. patents, U.S. patent application publications, U.S. patent applications, foreign patents, foreign patent applications and non-patent publications referred to in this specification and/or listed in the Application Data Sheet are incorporated herein by reference in their entirety, as if each was incorporated individually. Aspects and embodiments of the invention can be modified, if necessary, to employ concepts of the various patents, applications and publications to provide yet further embodiments.
BRIEF DESCRIPTION OF THE SEVERAL VIEWS OF THE DRAWINGS
Figure 1 shows quantitative PCR determination of the relative representation of T cell DNA in total DNA extracted from a tumor sample containing tumor infiltrating lymphocytes (TIL). Fig. 1A shows an amplification profile; Fig. 1 B shows a standard curve generated from known amounts of peripheral blood T cell DNA, as used to extrapolate T cell concentrations in complex cell mixtures of peripheral blood and tissue DNA.
Figure 2 is a schematic presentation of a PCR assay (e.g., a qPCR assay or a dPCR assay).
Figure 3 shows dPCR results using TCRV18, TCRV19 or RNase
P specific probes and buffy coat DNA as the template. Each data point represents a single dPCR specific reaction for the V18, V19, or RNase P specific probe. Droplets are assigned as positive (above horizontal separation lines) or negative (below horizontal separation lines) based on their
fluorescence amplitude. The number of positive and negative droplets in each channel is used to calculate the concentration of target molecules and the Poisson-based confidence intervals to enumerate the V gene segment-specific T lymphocyte population (0.6% for the V18 segment and 1.2% for the V19 segment).
Figure 4 shows an exemplary assay plate for using dPCR to quantify tumor infiltrating lymphocytes in samples.
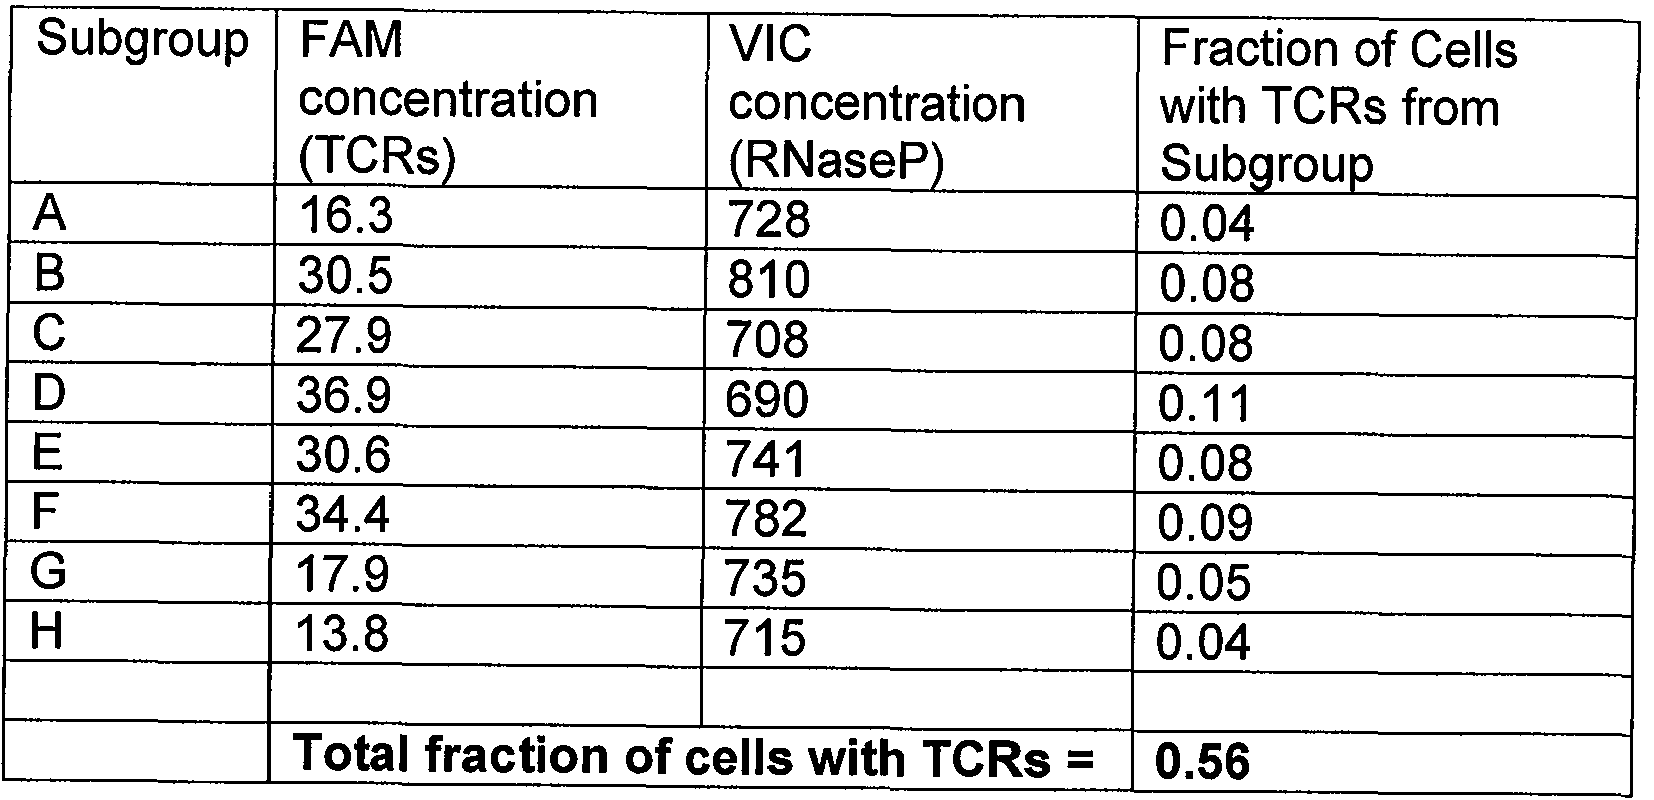
Figure 5 shows dPCR results using eight different subgroups of probes and primers (A through H). Each data point represents a single dPCR specific reaction for the probes of subgroups A through H. Droplets were assigned as positive (above horizontal separation lines) or negative (below horizontal separation lines) based on their fluorescence amplitude. The number of positive and negative droplets in each channel was used to calculate the concentration of target molecules and the Poisson-based confidence intervals to enumerate the V gene segment-specific T lymphocyte population. Fig. 5A shows dPCR T cell quantification using subgroups A-H by detection of
rearranged TCR genes in template DNA from peripheral blood lymphocytes from a healthy donor. Fig. 5B shows dPCR T cell quantification by detecting TCR rearrangements when template DNA was obtained from a bone marrow sample obtained from a T-ALL patient (79.7% for the subgroup A segment, which was a pattern characteristic of the disease state of the patient). Fig. 5C shows dPCR T cell quantification results when template DNA was obtained from a patient with ETP T-ALL, characterized by a primary T cell clone that has not undergone TCR encoding DNA rearrangement.
Figure 6 is a graph showing low variation in TIL percentage and clonality in three different biopsies from a large cervical tumor. Shading represents percentage of TIL identified with indicated pooled primer subgroup.
Figure 7 is a graph showing that an assay measuring RNaseP+ cell concentrations using dPCR was accurate across a large dynamic range (from 1 to 104 RNaseP+ cells per well).
DETAILED DESCRIPTION
According to certain embodiments as described herein there is provided a highly sensitive and accurate method for determining the relative representation of adaptive immune cells in a biological sample that contains a mixture of cells, where the mixture comprises adaptive immune cells as provided herein, and also comprises cells that are not adaptive immune cells.
Based on the present disclosure, the relative representation of DNA from adaptive immune cells (e.g., T and/or B lymphocytes having rearranged adaptive immune receptor genes, including T- and B-lineage cells of different maturational stages such as precursors, blast cells, progeny or the like) in DNA from a sample of mixed cell types may be quantified. For instance, certain embodiments permit determination, in DNA extracted from a biological sample, of the relative representation of DNA from tumor infiltrating
lymphocytes (TIL) in the DNA from the biological sample, where the sample
comprises all or a portion of a tumor that contains adaptive immune cells and cells that are not adaptive immune cells (including tumor cells). Certain other embodiments, for example, permit determination, in DNA extracted from a biological sample, of the relative representation of DNA from infiltrating lymphocytes in the DNA from the biological sample, where the sample comprises all or a portion of a somatic tissue that contains adaptive immune cells and cells that are not adaptive immune cells, such as cells of a solid tissue.
In certain embodiments, as described herein and according to non-limiting theory, rearranged adaptive immune cell DNA is amplified in real time quantitative PCR using rearranged adaptive immune receptor-specific oligonucleotide primer sets to quantify an adaptive immune cell-specific DNA signal that may be used as a marker for the relative contribution of adaptive immune cells to the total DNA that is extracted from a sample of mixed cell types. The present embodiments therefore provide quantitative determination of the relative representation of adaptive immune cell DNA in a DNA sample extracted from a mixture of cells. The cells in the mixture of cells may not all be adaptive immune cells, and certain unforeseen advantages of the herein described embodiments are obtained where the cells in the mixture of cells need not all be adaptive immune cells. As described herein, compositions and methods are provided for quantifying the proportion of cellular genomes in a DNA sample that are contributed by adaptive immune cells relative to the total number of cellular genomes in the sample, starting from a DNA sample that has been extracted from a mixture of cell types, such as a solid tumor or a solid tissue.
Further according to non-limiting theory, the present embodiments exploit the capability, in a real time quantitative polymerase chain reaction (qPCR), that is afforded by oligonucleotide primer sets that specifically amplify substantially all rearranged adaptive immune receptor genes (e.g., CDR3 encoding polynucleotide-containing portions of rearranged T cell receptor
and/or immunoglobulin genes) that may be present in a DNA sample, to generate a first detectable DNA signal that quantitatively reflects the production of a multiplicity of amplified rearranged adaptive immune receptor encoding DNA molecules. A second detectable DNA signal is generated, using the same oligonucleotide primer sets, in qPCR from a known amount of adaptive immune cell template DNA (e.g., sourced from a known number of adaptive immune cells or a known number of adaptive immune cell genomes), to produce a calibration curve, from which the relative amount of adaptive immune cell DNA reflected in the first detectable DNA signal can be determined.
Certain related embodiments may further include qPCR
amplification and detection of a third detectable DNA signal that quantitatively reflects the production of a multiplicity of amplified DNA molecules, using template DNA extracted from the mixture of cells with oligonucleotide primers that amplify an internal control gene that is present in adaptive immune cells and in cells that are not adaptive immune cells, and generation of a fourth detectable DNA signal using such primers in qPCR amplification of a known amount of template internal control gene DNA, to produce a calibration curve from which the relative amount of DNA in the cell mixture and hence the number of cellular genomes (e.g., cell number) can be determined.
In another embodiment, the present disclosure provides a method for quantifying the relative representation of adaptive immune cells in a test biological sample using digital polymerase chain reaction (dPCR). Substantially all rearranged adaptive immune cell DNA is amplified in dPCR using
rearranged adaptive immune receptor-specific oligonucleotide primer sets. The number of assay samples that detectably contain rearranged DNA amplified using diluted DNA from the test biological sample of interest as templates is compared to the number of assay samples that detectably contain an internal control gene amplified using the same diluted DNA as templates. Because the copy number of the internal control gene is known (e.g., 2), the relative representation of adaptive immune cells in the test biological sample (e.g.,
percentage of the total cells in the test biological sample that are adaptive immune cells) may be determined from the above comparison.
The present invention is thus directed in certain embodiments as described herein to quantification of DNA from adaptive immune cells that are present in solid tissues, and in particular embodiments, to solid tumors, such that the relative presence of adaptive immune cells as a proportion of all cell types that may be present in the tissue (e.g., tumor) can be determined. These and related embodiments are in part a result of certain surprising and heretofore unrecognized advantages disclosed in greater detail below that derive from exquisite sensitivity that is afforded, for the detection of adaptive immune cells, by the design of multiplexed qPCR or multiplexed dPCR using the herein described oligonucleotide primer sets. These primer sets permit production of amplified rearranged DNA molecules that encode portions of adaptive immune receptors. These and related embodiments feature the selection of a plurality of oligonucleotide primers that specifically hybridize to adaptive immune receptor (e.g., T cell receptor, TCR; or immunoglobulin, Ig) V- region polypeptide encoding polynucleotide sequences and J-region
polypeptide encoding polynucleotide sequences. The primers promote qPCR amplification of DNA molecules that include substantially all rearranged TCR CDR3-encoding or Ig CDR3-encoding gene regions that may be present in a test biological sample, where the sample contains a mixture of cells which comprises adaptive immune cells (e.g., T- and B- lymphocyte lineage cells) and cells that are not adaptive immune cells. For example, a cell mixture may be obtained from a solid tumor that comprises tumor cells and TIL.
In certain embodiments, qPCR amplification may be monitored at one or a plurality of time points during the course of the qPCR reaction, i.e., in "real time". Real-time monitoring permits determination of the quantity of DNA that is being generated by comparing a so-measured adaptive immune receptor-encoding DNA-quantifying signal to an appropriate control DNA- quantifying signal, which may be used as a calibration standard.
In certain other embodiments, rearranged adaptive immune cell DNA is quantified by dPCR. The DNA isolated from a test biological sample is distributed to form a set of assay samples, and the reaction is carried out in each assay sample individually. After the amplification, each assay sample produces either a negative result (i.e., no rearranged adaptive immune cell DNA is amplified) or a positive result (i.e., rearranged adaptive immune cell DNA is amplified). The amount of rearranged adaptive immune cell DNA may be quantified by counting the number of assay samples that produce positive results. For dPCR, the amplification process does not need to be monitored (as opposed to real time qPCR), which eliminates the reliance on uncertain exponential data to quantify target nucleic acid as in real time qPCR. In addition, dPCR does not require a calibration curve produced by amplifying a known amount of adaptive immune cell template DNA. Instead, dPCR amplifies an internal control (e.g., "housekeeping") gene that is present in adaptive immune cells and in cells that are not adaptive immune cells, which allows the determination of the total numbers of cells from which the template DNA is extracted.
In certain embodiments, a test biological sample of interest comprises somatic tissue. The somatic tissue may comprise a solid tissue that is a site for autoimmune disease pathology, such as a tissue that is
inappropriately targeted by a host's immune system for an "anti-self immune response. In certain other embodiments, the somatic tissue may comprise a solid tissue that is a site of an infection, such as a bacterial, yeast, viral or other microbial infection, for example, a Herpes Simplex Virus (HSV) infection. In yet other embodiments, the somatic tissue is from a transplanted organ (e.g., a transplanted liver, lung, kidney, heart, spleen, pancreas, skin, intestine and thymus). These and related embodiments, as described in greater detail below, will find uses in diagnostic, prognostic, disease monitoring, therapeutic efficacy monitoring and other contexts, thereby providing important information, such as quantification of adaptive immune cell representation in complex tissues that
comprise a mixture of cell types. Adaptive immune cell quantification (e.g., quantification of the relative representation of adaptive immune cells in samples) or adaptive immune cell DNA quantification (e.g., quantification of the relative representation of adaptive immune cell DNA in samples that contain DNA from a mixture of cells) in tissues before and after, and/or during the course of treatment of a subject, will usefully provide information of relevance to the diagnosis and prognosis in patients having cancer, inflammation and/or autoimmune disease, or any of a number of other conditions that may be characterized by alterations (e.g., statistically significant increases or decreases) in adaptive immune cell presence in one or more tissues.
As provided herein, the relative representation of adaptive immune cells or their DNA may be quantified in adaptive immune cells or their DNA obtained from a test biological sample that contains a mixture of cells, including adaptive immune cells and cells that are not adaptive immune cells, where the test sample is obtained from a solid tissue in a subject such as a solid tumor, prior to, during and/or following administration of a therapeutic regimen to the subject. A test biological sample may be obtained, for example, by excision of tissue from a pre- or post-treatment subject.
Adaptive immune cell quantification or adaptive immune cell DNA quantification as an indicator of the relative presence of adaptive immune cells in a mixed cell population as described herein may, in certain embodiments, optionally be accompanied by evaluation or analysis of the tissue according to other art-accepted criteria. Indicators of status (e.g., evidence of presence or absence of pathology, or of efficacy of a previously or contemporaneously administered therapeutic treatment) may be, for example, detectable indicator compounds, nanoparticles, nanostructures or other compositions that comprise a reporter molecule which provides a detectable signal indicating the
physiological status of a cell or tissue, such as a vital dye (e.g., Trypan blue), a colorimetric pH indicator, a fluorescent compound that may exhibit distinct fluorescence as a function of any of a number of cellular physiological
parameters (e.g., pH, intracellular Ca or other physiologically relevant ion concentration, mitochondrial membrane potential, plasma membrane potential, etc., see Haugland, The Handbook: A Guide to Fluorescent Probes and
Labeling Technologies (10th Ed.) 2005, Invitrogen Corp., Carlsbad, CA), an enzyme substrate, a specific oligonucleotide probe, a reporter gene, or the like.
Certain embodiments contemplate comparison of relative adaptive immune cell DNA quantities in view of total cell DNA (e.g., from adaptive immune cells plus non-adaptive immune cells in the cell mixture) and optionally other relevant parameters before, during or after administration to a control subject of control compositions that may be, for example, negative controls that have been previously demonstrated to have undergone no statistically significant alteration of physiological state, such as sham injection, saline, DMSO or other vehicle or buffer control, inactive enantiomers, scrambled peptides or nucleotides, etc.; and/or before, during or after administration of positive controls that have been previously demonstrated to cause a statistically significant alteration of physiological state, such as an FDA- approved therapeutic compound.
The subject or biological source, from which a test biological sample may be obtained, may be a human or non-human animal, or a transgenic or cloned or tissue-engineered (including through the use of stem cells) organism. In certain preferred embodiments of the invention, the subject or biological source may be known to have, or may be suspected of having or being at risk for having, a solid tumor or other malignant condition, or an autoimmune disease, or an inflammatory condition, and in certain preferred embodiments of the invention the subject or biological source may be known to be free of a risk or presence of such disease.
Certain preferred embodiments contemplate a subject or biological source that is a human subject such as a patient that has been diagnosed as having or being at risk for developing or acquiring cancer according to art-accepted clinical diagnostic criteria, such as those of the U.S.
National Cancer Institute (Bethesda, MD, USA) or as described in DeVita, Hellman, and Rosenberg's Cancer: Principles and Practice of Oncology (2008, Lippincott, Williams and Wilkins, Philadelphia/ Ovid, New York); Pizzo and Poplack, Principles and Practice of Pediatric Oncology (Fourth edition, 2001 , Lippincott, Williams and Wilkins, Philadelphia/ Ovid, New York); and Vogelstein and Kinzler, The Genetic Basis of Human Cancer (Second edition, 2002, McGraw Hill Professional, New York); certain embodiments contemplate a human subject that is known to be free of a risk for having, developing or acquiring cancer by such criteria.
Certain other embodiments contemplate a non-human subject or biological source, for example a non-human primate such as a macaque, chimpanzee, gorilla, vervet, orangutan, baboon or other non-human primate, including such non-human subjects that may be known to the art as preclinical models, including preclinical models for solid tumors and/or other cancers. Certain other embodiments contemplate a non-human subject that is a mammal, for example, a mouse, rat, rabbit, pig, sheep, horse, bovine, goat, gerbil, hamster, guinea pig or other mammal; many such mammals may be subjects that are known to the art as preclinical models for certain diseases or disorders, including solid tumors and/or other cancers (e.g., Talmadge et al., 2007 Am. J. Pathol. 170:793; Kerbel, 2003 Cane. Biol. Therap. 2(4 Suppl
1):S134; Man et al., 2007 Cane. Met. Rev. 26:737; Cespedes et al., 2006 Clin. Transl. Oncol. 8:318). The range of embodiments is not intended to be so limited, however, such that there are also contemplated other embodiments in which the subject or biological source may be a non-mammalian vertebrate, for example, another higher vertebrate, or an avian, amphibian or reptilian species, or another subject or biological source.
Biological samples may be provided by obtaining a blood sample, biopsy specimen, tissue explant, organ culture, biological fluid or any other tissue or cell preparation from a subject or a biological source. In certain preferred embodiments a test biological sample may be obtained from a solid
tissue (e.g., a solid tumor), for example by surgical resection, needle biopsy or other means for obtaining a test biological sample that contains a mixture of cells.
Solid tissues are well known to the medical arts and may include any cohesive, spatially discrete non-fluid defined anatomic compartment that is substantially the product of multicellular, intercellular, tissue and/or organ architecture, such as a three-dimensionally defined compartment that may comprise or derive its structural integrity from associated connective tissue and may be separated from other body areas by a thin membrane {e.g., meningeal membrane, pericardial membrane, pleural membrane, mucosal membrane, basement membrane, omentum, organ-encapsulating membrane, or the like). Non-limiting exemplary solid tissues may include brain, liver, lung, kidney, prostate, ovary, spleen, lymph node (including tonsil), skin, thyroid, pancreas, heart, skeletal muscle, intestine, larynx, esophagus and stomach. Anatomical locations, morphological properties, histological characterization, and invasive and/or non-invasive access to these and other solid tissues are all well known to those familiar with the relevant arts.
Solid tumors of any type are contemplated as being suitable for characterization of TIL using the compositions and methods described herein. In certain preferred embodiments, the solid tumor may be a benign tumor or a malignant tumor, which may further be a primary tumor, an invasive tumor or a metastatic tumor. Certain embodiments contemplate a solid tumor that comprises one of a prostate cancer cell, a breast cancer cell, a colorectal cancer cell, a lung cancer cell, a brain cancer cell, a renal cancer cell, a skin cancer cell (such as squamous cell carcinoma, basal cell carcinoma, or melanoma) and an ovarian cancer cell, but the invention is not intended to be so limited and other solid tumor types and cancer cell types may be used. For example, the tumor may comprise a cancer selected from adenoma, adenocarcinoma, squamous cell carcinoma, basal cell carcinoma, melanoma (e.g., malignant melanoma), small cell carcinoma, large cell undifferentiated
carcinoma, chondrosarcoma and fibrosarcoma, or the like. As also noted elsewhere herein, art-accepted clinical diagnostic criteria have been
established for these and other cancer types, such as those promulgated by the U.S. National Cancer Institute (Bethesda, MD, USA) or as described in DeVita, Hellman, and Rosenberg's Cancer: Principles and Practice of Oncology (2008, Lippincott, Williams and Wilkins, Philadelphia/ Ovid, New York); Pizzo and Poplack, Principles and Practice of Pediatric Oncology (Fourth edition, 2001 , Lippincott, Williams and Wilkins, Philadelphia/ Ovid, New York); and Vogelstein and Kinzler, The Genetic Basis of Human Cancer (Second edition, 2002, McGraw Hill Professional, New York). Other non-limiting examples of typing and characterization of particular cancers are described, e.g., in Ignatiadis et al. (2008 Pathobiol. 75:104); Kunz (2008 Curr. Drug Discov. Technol. 5:9); and Auman et al. (2008 Drug Metab. Rev. 40:303).
Accordingly, described herein are methods for measuring the number of adaptive immune cells, particularly T cells, in a complex mixture of cells. The present methods have particular utility in quantifying tumor-infiltrating lymphocytes or lymphocytes infiltrating somatic tissue that is the target of an autoimmune response. Existing methods for T and B cell quantification rely upon the physical separation of such cells from the mixture. However, in many cases, T and B cells cannot be separated from the initial sample, such as formalin-fixed or frozen tissue samples. Furthermore, prior methods for adaptive immune cell quantification (e.g., flow immunocytofluorimetry, fluorescence activated cell sorting (FACS), immunohistochemistry (IHC)) rely on the expression of T cell- or B cell-specific proteins, such as cell surface receptors. Since immune cells express varying amounts of these lineage specific receptors, quantifying the number of cells from such a highly variable measure requires costly standardization, specialized equipment and highly trained staff. The presently disclosed methods are, by contrast, platform- independent and can be performed on any real-time PCR instrument or dPCR instrument, and the reagents can be synthesized and provided in kit form. The
presently disclosed methods are also highly sensitive and can be applied in high throughput settings not previously attainable. As described herein, quantification of adaptive immune cells may be achieved by a simple
preparation of DNA from a complex mixture of cells, in concert with
quantification of the relative proportion of adaptive immune cells present by amplification of the uniquely rearranged adaptive immune cell CDR3-encoding genes.
According to certain embodiments, a method for quantification of the relative contribution to total DNA in a sample that is made by DNA from adaptive immune cells in a test biological sample that contains a mixture of cells (only some of which are adaptive immune cells) by qPCR analysis of amplified (using the herein described V- and J-specific primer sets) rearranged V-segments and J-segments from the adaptive immune cell contribution to the DNA extracted from the test sample, may also comprise qPCR analysis of amplified rearranged V- and J-segments amplified (using the same V- and J- primer sets) from DNA extracted from a control adaptive immune cell sample that comprises a known number of adaptive immune cells. The control adaptive immune cell sample comprises a population of pure or substantially pure (e.g., greater than at least 70%, 75%, 80%, 85%, 90%, 95%, 97%, 98% or 99%) adaptive immune cells that may be obtained from a subject or biological source as provided herein. Amplification from a known amount of such control adaptive immune cell DNA that is used as a starting template, and
measurement in qPCR of rearranged V-J-encoding amplification products, will permit the generation of a calibration curve from which to determine the quantity of amplified rearranged DNA molecules that are produced in the qPCR from a known number of adaptive immune cells. From such a calibration curve, the quantity of amplified rearranged DNA that is produced from the test biological sample may be compared, and from that quantity the number of adaptive immune cells in the test biological sample may be determined.
B cells and T cells can thus be obtained, for use as a control adaptive immune cell sample, from a biological sample, such as from a variety of tissue and biological fluid samples including bone marrow, thymus, lymph glands, lymph nodes, peripheral tissues and blood, but peripheral blood is most easily accessed. Any peripheral tissue can be sampled for the presence of B and T cells and is therefore contemplated for use in the methods described herein. Tissues and biological fluids from which adaptive immune cells, for use in a control adaptive immune cell sample, may be obtained include, but are not limited to skin, epithelial tissues, colon, spleen, a mucosal secretion, oral mucosa, intestinal mucosa, vaginal mucosa or a vaginal secretion, cervical tissue, ganglia, saliva, cerebrospinal fluid (CSF), bone marrow, cord blood, serum, serosal fluid, plasma, lymph, urine, ascites fluid, pleural fluid, pericardial fluid, peritoneal fluid, abdominal fluid, culture medium, conditioned culture medium or lavage fluid. In certain embodiments, adaptive immune cells may be isolated from an apheresis sample. Peripheral blood samples may be obtained by phlebotomy from subjects. Peripheral blood mononuclear cells (PBMC) are isolated by techniques known to those of skill in the art, e.g., by Ficoll- Hypaque® density gradient separation. In certain embodiments, whole PBMCs are used for analysis.
In certain related embodiments, preparations that comprise predominantly lymphocytes (e.g., T and B cells) or that comprise predominantly T cells or predominantly B cells, may be prepared for use as a control adaptive immune cell sample as provided herein, according to established, art-accepted methodologies. In other related embodiments, specific subpopulations of T or B cells may be isolated prior to analysis using the methods described herein. Various methods and commercially available kits for isolating different subpopulations of T and B cells are known in the art and include, but are not limited to, subset selection immunomagnetic bead separation or flow
immunocytometric cell sorting using antibodies specific for one or more of any of a variety of known T and B cell surface markers. Illustrative markers include,
but are not limited to, one or a combination of CD2, CD3, CD4, CD8, CD14, CD19, CD20, CD25, CD28, CD45RO, CD45RA, CD54, CD62, CD62L, CDw137 (41 BB), CD154, GITR, FoxP3, CD54, and CD28. For example, and as is known to the skilled person, cell surface markers, such as CD2, CD3, CD4, CD8, CD14, CD19, CD20, CD45RA, and CD45RO may be used to determine T, B, and monocyte lineages and subpopulations in flow cytometry. Similarly, forward light-scatter, side-scatter, and/or cell surface markers such as CD25, CD62L, CD54, CD137, CD154 may be used to determine activation state and functional properties of cells.
Illustrative combinations useful in certain of the methods described herein may include CD8+CD45RO+ (memory cytotoxic T cells), CD4+CD45RO+ (memory T helper), CD8+CD45RO"
(CD8+CD62L+CD45RA+ (naive-like cytotoxic T cells);
CD4+CD25+CD62LhiGITR+FoxP3+ (regulatory T cells). Illustrative antibodies for use in immunomagnetic cell separations or flow immunocytometric cell sorting include fluorescently labeled anti-human antibodies, e.g., CD4 FITC (clone M- T466, Miltenyi Biotec), CD8 PE (clone RPA-T8, BD Biosciences), CD45RO ECD (clone UCHL-1 , Beckman Coulter), and CD45RO APC (clone UCHL-1 , BD Biosciences). Staining of total PBMCs may be done with the appropriate combination of antibodies, followed by washing cells before analysis.
Lymphocyte subsets can be isolated by fluorescence activated cell sorting (FACS), e.g., by a BD FACSAria™ cell-sorting system (BD Biosciences) and by analyzing results with FlowJo™ software (Treestar Inc.), and also by
conceptually similar methods involving specific antibodies immobilized to surfaces or beads.
For nucleic acid extraction, total genomic DNA may be extracted from cells using methods known in the art and/or commercially available kits, e.g., by using the QIAamp® DNA blood Mini Kit (QIAGEN®). The approximate mass of a single haploid genome is 3 pg. Preferably, at least 100,000 to 200,000 cells are used for analysis, i.e., about 0.6 to 1.2 pg DNA from diploid T
or B cells. Using PBMCs as a source, the number of T cells can be estimated to be about 30% of total cells. The number of B cells can also be estimated to be about 30% of total cells in a PBMC preparation. Adaptive immune cell receptors
The native TCR is a heterodimeric cell surface protein of the immunoglobulin superfamily which is associated with invariant proteins of the CD3 complex involved in mediating signal transduction. TCRs exist in αβ and γδ forms, which are structurally similar but have quite distinct anatomical locations and probably functions. The MHC class I and class II ligands, which bind to the TCR, are also immunoglobulin superfamily proteins but are specialized for antigen presentation, with a highly polymorphic peptide binding site which enables them to present a diverse array of short peptide fragments at the APC cell surface.
The extracellular portions of native heterodimeric αβ and γδ TCRs consist of two polypeptides each of which has a membrane-proximal constant domain, and a membrane-distal variable domain. Each of the constant and variable domains includes an intra-chain disulfide bond. The variable domains contain the highly polymorphic loops analogous to the complementarity determining regions (CDRs) of antibodies. CDR3 of αβ TCRs interact with the peptide presented by MHC, and CDRs 1 and 2 of αβ TCRs interact with the peptide and the MHC. The diversity of TCR sequences is generated via somatic rearrangement of linked variable (V), diversity (D), joining (J), and constant genes.
The Ig and TCR gene loci contain many different variable (V), diversity (D), and joining (J) gene segments, which are subjected to
rearrangement processes during early lymphoid differentiation. Ig and TCR V, D and J gene segment sequences are known in the art and are available in public databases such as GENBANK. TCRB V region gene segment
sequences are set forth in the sequence listing at SEQ ID NOS:1-52, 66-201 ,
644-695, 709-839, and 843-879, and the TCRB J region segment sequences are set forth in SEQ ID NOS:53-65, 202-214, 696-708, and 880-883. TCRG J region gene segment sequences are set forth in SEQ ID NOs:215-220 and 634- 637. TCRG V region gene segment sequences are set forth in SEQ ID
NOs:221-238 and 546-549. IgH J region gene segment sequences are set forth in SEQ ID NOs:239-254 and 638-643; IgH V region gene segment sequences are set forth in SEQ ID NOs:255-545 and 550-633.
The V-D-J rearrangements are mediated via a recombinase enzyme complex in which the RAG1 and RAG2 proteins play a key role by recognizing and cutting the DNA at the recombination signal sequences (RSS), which are located downstream of the V gene segments, at both sides of the D gene segments, and upstream of the J gene segments. Inappropriate RSS reduce or even completely prevent rearrangement. The recombination signal sequence (RSS) consists of two conserved sequences (heptamer, 5'- CACAGTG-3', and nonamer, 5'-ACAAAAACC-3'), separated by a spacer of either 12 +/- 1 bp ("12-signal") or 23 +/- 1 bp ("23-signal"). A number of nucleotide positions have been identified as important for recombination including the CA dinucleotide at position one and two of the heptamer, and a C at heptamer position three has also been shown to be strongly preferred as well as an A nucleotide at positions 5, 6, 7 of the nonamer. (Ramsden et al. 1994 Nucl. Ac. Res. 22:1785; Akamatsu et al. 1994 J. Immunol. 153:4520; Hesse et al. 1989 Genes Dev. 3:1053). Mutations of other nucleotides have minimal or inconsistent effects. The spacer, although more variable, also has an impact on recombination, and single-nucleotide replacements have been shown to significantly impact recombination efficiency (Fanning et al. 1996 Cell. Immunol. Immumnopath. 79:1 , Larijani et al. 1999 Nucl. Ac. Res. 27:2304; Nadel et al. 1998 J. Immunol. 161 :6068; Nadel et al. 1998 J. Exp. Med. 187:1495). Criteria have been described for identifying RSS polynucleotide sequences having significantly different recombination efficiencies (Ramsden et al. 1994 Nucl. Ac.
Res. 22:1785; Akamatsu et al. 1994 J. Immunol. 153:4520; Hesse et al. 1989 Genes Dev. 3:1053, and Lee et al., 2003 PLoS 1(1):E1).
The rearrangement process generally starts with a D to J rearrangement followed by a V to D-J rearrangement in the case of Ig heavy chain (IgH), TCR beta (TCRB), and TCR delta (TCRD) genes or concerns direct V to J rearrangements in case of Ig kappa (IgK), Ig lambda (IgL), TCR alpha (TCRA), and TCR gamma (TCRG) genes. The sequences between rearranging gene segments are generally deleted in the form of a circular excision product, also called TCR excision circle (TREC) or B cell receptor excision circle (BREC).
The many different combinations of V, D, and J gene segments represent the so-called combinatorial repertoire, which is estimated to be -2x10⁶ for Ig molecules, -3x10⁶ for TCRa and ~ 5x10³ for TCRv5 molecules. At the junction sites of the V, D, and J gene segments, deletion and random insertion of nucleotides occurs during the rearrangement process, resulting in highly diverse junctional regions, which significantly contribute to the total repertoire of Ig and TCR molecules, estimated to be > 1012.
Mature B-lymphocytes further extend their Ig repertoire upon antigen recognition in follicle centers via somatic hypermutation, a process, leading to affinity maturation of the Ig molecules. The somatic hypermutation process focuses on the V- (D- ) J exon of IgH and Ig light chain genes and concerns single nucleotide mutations and sometimes also insertions or deletions of nucleotides. Somatically-mutated Ig genes are also found in mature B-cell malignancies of follicular or post-follicular origin.
In certain preferred embodiments described herein, V-segment and J-segment primers may be employed in a qPCR reaction or a dPCR reaction to amplify rearranged TCR or Ig CDR3-encoding DNA regions in a test biological sample, wherein each functional TCR or Ig V-encoding gene segment comprises a V gene recombination signal sequence (RSS) and each functional TCR or Ig J-encoding gene segment comprises a J gene RSS. In these and
related embodiments, each amplified rearranged DNA molecule may comprise (i) at least about 10, 20, 30 or 40 contiguous nucleotides of a sense strand of the TCR or Ig V-encoding gene segment, with the at least about 10, 20, 30 or 40 contiguous nucleotides being situated 5' to the V gene RSS and/or each amplified rearranged DNA molecule may comprise (ii) at least about 10, 20 or 30 contiguous nucleotides of a sense strand of the TCR or Ig J-encoding gene segment, with the at least about 10, 20 or 30 contiguous nucleotides being situated 3' to the J gene RSS. Multiplex Quantitative PCR
As described herein there is provided a method for quantifying the relative representation of adaptive immune cell DNA in DNA from a test biological sample of mixed cell types, and thus for estimating the relative number of T or B cells in a complex mixture of cells. According to certain embodiments, the method involves a multiplex PCR method using a set of forward primers that specifically hybridize to the V segments and a set of reverse primers that specifically hybridize to the J segments where the multiplex PCR reaction allows amplification of all the possible VJ (and VDJ) combinations within a given population of T or B cells. Because the multiplex PCR reaction amplifies substantially all possible combinations of V and J segments, it is possible to determine, using real-time quantitative PCR, the relative number of T cell or B cell genomes in a sample comprising a mixed population of cells. In particular, in order to measure the relative number of TCR or BCR genomes, it is assumed that there is 3 pg DNA per genome, or 6 pg per diploid cell. Once the amount of starting DNA is calculated using realtime qPCR with appropriate standards/controls as described further herein, from this number it is possible to calculate the number of TCR or BCR genomes. A standard DNA dilution panel of TCR genomes is used as a control to determine the amount of DNA in pg or pg in a given sample.
DNA or RNA may be extracted from a mixed population of cells from a sample, such as any neoplastic tissue sample or a sample of somatic tissue that is the target of an autoimmune reaction, blood sample, or
cerebrospinal fluid, using standard methods or commercially available kits known in the art. Illustrative samples for use in the present methods include any type of solid tumor, in particular, from colorectal, hepatocellular,
gallbladder, pancreatic, esophageal, lung, breast, prostate, head and neck, renal cell carcinoma, ovarian, endometrial, cervical, bladder and urothelial cancers. Any solid tumor in which tumor-infiltrating lymphocytes are to be assessed is contemplated for use in the present methods. Somatic tissues that are the target of an autoimmune reaction that are contemplated for analysis using the methods herein include, but are not limited to, joint tissues, skin, intestinal tissue, all layers of the uvea, iris, vitreous tissue, heart, brain, lungs, blood vessels, liver, kidney, nerve tissue, muscle, spinal cord, pancreas, adrenal gland, tendon, mucus membrane, lymph node, thyroid, endometrium, connective tissue, and bone marrow. In certain embodiments, DNA or RNA may be extracted from a transplanted organ, such as a transplanted liver, lung, kidney, heart, spleen, pancreas, skin, intestine, and thymus.
In certain embodiments, two or more samples may be obtained from a single tissue (e.g., a single neoplastic tissue) and the relative
representations of adaptive immune cells in the two or more samples are quantified to consider variations in different sections of a test tissue. In certain other embodiments, the determination of the relative representation of adaptive immune cells in one sample from a test tissue is sufficient due to mimimum variations among different sections of the test tissue (see, e.g., Example 8).
A multiplex PCR system may be used to amplify rearranged adaptive immune cell receptor loci from genomic DNA, preferably from a CDR3 region. In certain embodiments, the CDR3 region is amplified from a TCRa, "Ϊ Ρβ, TCRy or TCR6 CDR3 region or similarly from an IgH or IgL (lambda or kappa) locus.
Compositions are provided that comprise a plurality of V-segment and J-segment primers that are capable of promoting amplification in a multiplex polymerase chain reaction (PCR) of substantially all productively rearranged adaptive immune receptor CDR3-encoding regions in the sample for a given class of such receptors (e.g., TCRy, TCRp, IgH, etc.), to produce a multiplicity of amplified rearranged DNA molecules from a population of T cells (for TCR) or B cells (for Ig) in the sample.
Preferably and in certain embodiments, primers are designed so that each amplified rearranged DNA molecule in the multiplicity of amplified rearranged DNA molecules is less than 600 nucleotides in length, thereby excluding amplification products from non-rearranged adaptive immune receptor loci. An exemplary schematic presentation of a qPCR assay (which may also serve as a schematic presentation of a dPCR assay) is shown in Figure 2. The PCR assay uses forward primers and TaqMan® probes in each V segment and reverse primers in each J segment to selectively amplify the rearranged VDJ from each cell. While these primers can anneal to both rearranged and germline V and J gene segments, PCR amplification is limited to rearranged gene segments, due to size bias (e.g., 250 bp PCR product using rearranged gene segments as templates vs >10Kb PCR product using germline gene segments as templates).
In the human genome there are currently believed to be about 70 TCR Va and about 61 Ja gene segments, about 52 TCR Vp, about 2 Dp and about 13 jp gene segments, about 9 TCR Vy and about 5 Jy gene segments, and about 46 immunoglobulin heavy chain (IGH) VH, about 23 DH and about 6 JH gene segments. Accordingly, where genomic sequences for these loci are known such that specific molecular probes for each of them can be readily produced, it is believed according to non-limiting theory that the present compositions and methods relate to substantially all (e.g., greater than 90%, 91 %, 92%, 93%, 94%, 95%, 96%, 97%, 98% or 99%) of these known and
readily detectable adaptive immune receptor V-, D- and J-region encoding gene segments.
Primer selection and primer set design may be performed according to certain embodiments in a manner that preferably detects productive V and J gene segments, for example, by excluding TCR or IG pseudogenes. Pseudogenes may include V segments that contain an in-frame stop codon within the V-segment coding sequence, a frameshift between the start codon and the CDR3 encoding sequence, one or more repeat-element insertions, and deletions of critical regions, such as the first exon or the RSS. In the human IGH locus, for instance, the ImmunoGeneTics (IMGT) database (M.-P. LeFranc, Universite Montpellier, Montpellier, France; www .imgt.org) annotates 165 V segment genes, of which 26 are orphons on other
chromosomes and 139 are in the IGH locus at chromosome 14. Among the 139 V segments within the IGH locus, 51 have at least one functional allele, while 6 are ORFs (open-reading frames) which are missing at least one highly conserved amino-acid residue, and 81 are pseudogenes.
To detect functional TCR or IG rearrangements in a sample while avoiding potentially extraneous amplification signals that may be attributable to non-productive V and/or J gene segments such as pseudogenes and/or orphons, it is therefore contemplated according to certain embodiments to use a subset of oligonucleotide primers which is designed to include only those V segments that participate in a functional rearrangement to encode a TCR or IG, without having to include amplification primers specific to the pseudogene and/or orphon sequences or the like. Advantageous efficiencies with respect, inter alia, to time and expense are thus obtained.
The TCR and Ig genes can generate millions of distinct proteins via somatic mutation. Because of this diversity-generating mechanism, the hypervariable complementarity determining regions of these genes can encode sequences that can interact with millions of ligands, and these regions are linked to a constant region that can transmit a signal to the cell indicating
binding of the protein's cognate ligand. The adaptive immune system employs several strategies to generate a repertoire of T- and B-cell antigen receptors with sufficient diversity to recognize the universe of potential pathogens. In αβ and γδ T cells, which primarily recognize peptide antigens presented by MHC molecules, most of this receptor diversity is contained within the third
complementarity-determining region (CDR3) of the T cell receptor (TCR) a and β chains (or γ and δ chains).
The assay technology uses two pools of primers to provide for a highly multiplexed PCR reaction. The first, "forward" pool (e.g., by way of illustration and not limitation, V-segment oligonucleotide primers described herein may in certain preferred embodiments be used as "forward" primers when J-segment oligonucleotide primers are used as "reverse" primers according to commonly used PCR terminology, but the skilled person will appreciate that in certain other embodiments J-segment primers may be regarded as "forward" primers when used with V-segment "reverse" primers) includes an oligonucleotide primer that is specific to (e.g., having a nucleotide sequence complementary to a unique sequence region of) each V-region encoding segment ("V segment) in the respective TCR or Ig gene locus. In certain embodiments, primers targeting a highly conserved region are used, to simultaneously capture many V segments, thereby reducing the number of primers required in the multiplex PCR. Similarly, in certain embodiments, the "reverse" pool primers anneal to a conserved sequence in the joining ("J") segment.
Each primer may be designed so that a respective amplified DNA segment is obtained that includes a sequence portion of sufficient length to identify each J segment unambiguously based on sequence differences amongst known J-region encoding gene segments in the human genome database, and also to include a sequence portion to which a J-segment-specific primer may anneal for resequencing. This design of V- and J-segment-specific primers enables direct observation of a large fraction of the somatic
rearrangements present in the adaptive immune receptor gene repertoire within an individual. This feature in turn enables rapid comparison of the TCR and/or Ig repertoires (i) in individuals having a particular disease, disorder, condition or other indication of interest (e.g., cancer, an autoimmune disease, an
inflammatory disorder or other condition) with (ii) the TCR and/or Ig repertoires of control subjects who are free of such diseases, disorders conditions or indications.
The term "gene" means the segment of DNA involved in
producing a polypeptide chain such as all or a portion of a TCR or Ig
polypeptide (e.g., a CDR3-containing polypeptide); it includes regions
preceding and following the coding region "leader and trailer" as well as intervening sequences (introns) between individual coding segments (exons), and may also include regulatory elements (e.g., promoters, enhancers, repressor binding sites and the like), and may also include recombination signal sequences (RSSs) as described herein.
The nucleic acids of the present embodiments, also referred to herein as polynucleotides, and including oligonucleotides, may be in the form of RNA or in the form of DNA, which DNA includes cDNA, genomic DNA, and synthetic DNA. The DNA may be double-stranded or single-stranded, and if single stranded may be the coding strand or non-coding (anti-sense) strand. A coding sequence which encodes a TCR or an immunoglobulin or a region thereof (e.g., a V region, a D segment, a J region, a C region, etc.) for use according to the present embodiments may be identical to the coding sequence known in the art for any given TCR or immunoglobulin gene regions or polypeptide domains (e.g., V-region domains, CDR3 domains, etc.), or may be a different coding sequence, which, as a result of the redundancy or
degeneracy of the genetic code, encodes the same TCR or immunoglobulin region or polypeptide.
In one embodiment, the present disclosure provides a plurality of V segment primers and a plurality of J segment primers, wherein the plurality of
V segment primers and the plurality of J segment primers amplify substantially all combinations of the V and J segments of a rearranged immune receptor locus. By substantially all combinations is meant at least 90%, 91%, 92%, 93%, 94%, 95%, 96%, 97%, 98%, 99% or more of all the combinations of the V and J segments of a rearranged immune receptor locus. In certain
embodiments, the plurality of V segment primers and the plurality of J segment primers amplify all of the combinations of the V and J segments of a rearranged immune receptor locus.
In general, a multiplex PCR system may use at least 14, 15, 16, 17, 18, 19, 20, 21 , 22, 23, 24, or 25, and in certain embodiments, at least 26, 27, 28, 29, 30, 31 , 32, 33, 34, 35, 36, 37, 38, or 39, and in other embodiments 40, 41 , 42, 43, 44, 45, 46, 47, 48, 49, 50, 51 , 52, 53, 54, 55, 56, 57, 58, 59, 60, 65, 70, 75, 80, 85, or more forward primers, in which each forward primer specifically hybridizes to or is complementary to a sequence corresponding to one or more V region segments. Illustrative V region primers for amplification of the TCR are shown in SEQ ID NOs:1-52 (see also Table 1). Illustrative TCRy V region primers are provided in SEQ ID NOs:546-549. Illustrative IgH V region primers are provided in SEQ ID NOs:550-633. V region gene segment sequences may thus be used to design V region primers. Exemplary TCRB V region gene segment sequences are set forth in the sequence listing at SEQ ID NOS:1-52, 66-201 , 644-695, 709-839, and 843-879. Exemplary TCRG V region gene segment sequences are set forth in SEQ ID NOs:221-238 and 546- 549. Exemplary IgH V region gene segment sequences are set forth in SEQ ID NOs:255-545 and 550-633.
Table 1.
Table 1A. TCRB oligonucleotide sequences targeting the 52 TCRBV and 13 TCRBJ gene segments.
In the RN2 oligonucleotides of Table 1B, "r" represents a ribonucleotide base in the oligonucleotide sequence and 73SpC3/" represents a 3' three-carbon spacer on the hydroxyl group, preventing polymerase extension and amplification. The DNA repair endonuclease cleaves the oligonucleotide at the ribonucleotide after hybridization to a complementary sequence, creating an unblocked hydroxyl group that can be extended by a polymerase.
The multiplex PCR system also uses at least 3, 4, 5, 6, or 7, and in certain embodiments, 8, 9, 10, 1 1 , 12 or 13 reverse primers, in which each reverse primer specifically hybridizes to or is complementary to a sequence corresponding to one or more J region segments. Illustrative TCR J segment primers are provided in SEQ ID NOs:53-65 (see also Table 1). Illustrative TCRy J segment primers are provided in SEQ ID NOs:634-637. Illustrative IgH J segment primers are provided in SEQ ID NOs:638-643. J region gene segment sequences may thus be used to design J region primers. Exemplary TCRB J region segment sequences are set forth in SEQ ID NOS:53-65, 202- 214, 696-708, and 880-883. Exemplary TCRG J region gene segment sequences are set forth in SEQ ID NOs:215-220 and 634-637. Exemplary IgH J region gene segment sequences are set forth in SEQ ID NOs:239-254 and 638-643. In one embodiment, there is a J segment primer for every J segment.
Oligonucleotides or polynucleotides that are capable of
specifically hybridizing or annealing to a target nucleic acid sequence by nucleotide base complementarity may do so under moderate to high stringency conditions. For purposes of illustration, suitable moderate to high stringency conditions for specific PCR amplification of a target nucleic acid sequence would be between 25 and 80 PCR cycles, with each cycle consisting of a denaturation step (e.g., about 10-30 seconds (s) at at least about 95°C), an annealing step (e.g., about 10-30s at about 60-68°C), and an extension step (e.g., about 10-60s at about 60-72°C), optionally according to certain
embodiments with the annealing and extension steps being combined to provide a two-step PCR. As would be recognized by the skilled person, other PCR reagents may be added or changed in the PCR reaction to increase specificity of primer annealing and amplification, such as altering the
magnesium concentration, optionally adding DMSO, and/or the use of blocked primers, modified nucleotides, peptide-nucleic acids, and the like.
In certain embodiments, nucleic acid hybridization techniques may be used to assess hybridization specificity of the primers described herein.
Hybridization techniques are well known in the art of molecular biology. For purposes of illustration, suitable moderately stringent conditions for testing the hybridization of a polynucleotide as provided herein with other polynucleotides include prewashing in a solution of 5 X SSC, 0.5% SDS, 1.0 mM EDTA (pH 8.0); hybridizing at 50°C-60°C, 5 X SSC, overnight; followed by washing twice at 65°C for 20 minutes with each of 2X, 0.5X and 0.2X SSC containing 0.1 % SDS. One skilled in the art will understand that the stringency of hybridization can be readily manipulated, such as by altering the salt content of the hybridization solution and/or the temperature at which the hybridization is performed. For example, in another embodiment, suitable highly stringent hybridization conditions include those described above, with the exception that the temperature of hybridization is increased, e.g., to 60°C-65°C or 65°C-70°C.
In certain embodiments, the primers are designed not to cross an intron/exon boundary. The forward primers in certain embodiments anneal to the V segments in a region of relatively strong sequence conservation between V segments so as to maximize the conservation of sequence among these primers. Accordingly, this minimizes the potential for differential annealing properties of each primer, and so that the amplified region between V and J primers contains sufficient TCR or Ig V sequence information to identify the specific V gene segment used. In one embodiment, the J segment primers hybridize with a conserved element of the J segment, and have similar annealing strength. In one particular embodiment, the J segment primers anneal to the same conserved framework region motif.
Oligonucleotides (e.g., primers) can be prepared by any suitable method, including direct chemical synthesis by a method such as the
phosphotriester method of Narang et al., 1979, Meth. Enzymol. 68:90-99; the phosphodiester method of Brown et al., 1979, Meth. Enzymol. 68:109-151 ; the diethylphosphoramidite method of Beaucage et al., 1981 , Tetrahedron Lett. 22:1859-1862; and the solid support method of U.S. Pat. No. 4,458,066, each incorporated herein by reference. A review of synthesis methods of conjugates
of oligonucleotides and modified nucleotides is provided in Goodchild, 1990, Bioconjugate Chemistry 1(3): 165-187, incorporated herein by reference.
The term "primer," as used herein, refers to an oligonucleotide capable of acting as a point of initiation of DNA synthesis under suitable conditions. Such conditions include those in which synthesis of a primer extension product complementary to a nucleic acid strand is induced in the presence of four different nucleoside triphosphates and an agent for extension (e.g., a DNA polymerase or reverse transcriptase) in an appropriate buffer and at a suitable temperature.
A primer is preferably a single-stranded DNA. The appropriate length of a primer depends on the intended use of the primer but typically ranges from 6 to 50 nucleotides, or in certain embodiments, from 15-35 nucleotides. Short primer molecules generally require cooler temperatures to form sufficiently stable hybrid complexes with the template. A primer need not reflect the exact sequence of the template nucleic acid, but must be sufficiently complementary to hybridize with the template. The design of suitable primers for the amplification of a given target sequence is well known in the art and described in the literature cited herein.
As described herein, primers can incorporate additional features which allow for the detection or immobilization of the primer but do not alter the basic property of the primer, that of acting as a point of initiation of DNA synthesis. For example, primers may contain an additional nucleic acid sequence at the 5' end which does not hybridize to the target nucleic acid, but which facilitates cloning/detection, or sequencing of the amplified product. The region of the primer which is sufficiently complementary to the template to hybridize is referred to herein as the hybridizing region.
As used herein, a primer is "specific," for a target sequence if, when used in an amplification reaction under sufficiently stringent conditions, the primer hybridizes primarily to the target nucleic acid. Typically, a primer is specific for a target sequence if the primer-target duplex stability is greater than
the stability of a duplex formed between the primer and any other sequence found in the sample. One of skill in the art will recognize that various factors, such as salt conditions as well as base composition of the primer and the location of the mismatches, will affect the specificity of the primer, and that routine experimental confirmation of the primer specificity will be needed in many cases. Hybridization conditions can be chosen under which the primer can form stable duplexes only with a target sequence. Thus, the use of target- specific primers under suitably stringent amplification conditions enables the selective amplification of those target sequences which contain the target primer binding sites.
In particular embodiments, primers for use in the methods described herein comprise or consist of a nucleic acid of at least about 15 nucleotides long that has the same sequence as, or is complementary to, a 15 nucleotide long contiguous sequence of the target V or J segment. Longer primers, e.g., those of about 16, 17, 18, 19, 20, 21 , 22, 23, 24, 25, 26, 27, 28, 29, 30, 31 , 32, 33, 34, 35, 36, 37, 38, 39, 40, 45, or 50 nucleotides long that have the same sequence as, or sequence complementary to, a contiguous sequence of the target V or J segment that is at least 15, 16, 17, 18, 19, 20, 21 , 22, 23, 24, 25, 26, 27, 28, 29, 30, 31 , 32, 33, 34, 35, 36, 37, 38, 39, 40, 45, or 50 nucleotides long, will also be of use in certain embodiments. All
intermediate lengths of the aforementioned primers are contemplated for use herein. As would be recognized by the skilled person, the primers may have additional sequence added (e.g., nucleotides that may not be the same as or complementary to the target V or J segment), such as restriction enzyme recognition sites, adaptor sequences for sequencing, bar code sequences, and the like (see e.g., primer sequences provided herein and in the sequence listing). Therefore, the length of the primers may be longer, such as 55, 56, 57, 58, 59, 60, 65, 70, 75, nucleotides in length or more, depending on the specific use or need. For example, in one embodiment, the forward and reverse
primers are both modified at the 5* end with the universal forward primer sequence compatible with a DNA sequencer.
Also contemplated for use in certain embodiments are adaptive immune receptor V-segment or J-segment oligonucleotide primer variants that may share a high degree of sequence identity to the oligonucleotide primers for which nucleotide sequences are presented herein, including those set forth in the Sequence Listing or portions thereof that are at least 15, 16, 17, 18, 19, 20, 21 , 22, 23, 24, 25, 26, 27, 28, 29, 30, 31 , 32, 33, 34, 35, 36, 37, 38, 39, 40, 45, or 50 nucleotides long. Thus, in these and related embodiments, adaptive immune receptor V-segment or J-segment oligonucleotide primer variants may have substantial identity to the adaptive immune receptor V-segment or J- segment oligonucleotide primer sequences disclosed herein, for example, such oligonucleotide primer variants may comprise at least 70% sequence identity, preferably at least 75%, 80%, 85%, 90%, 91%, 92%, 93%, 94%, 95%, 96%, 97%, 98%, or 99% or higher sequence identity compared to a reference polynucleotide sequence such as the oligonucleotide primer sequences disclosed herein, using the methods described herein (e.g., BLAST analysis using standard parameters). One skilled in this art will recognize that these values can be appropriately adjusted to determine corresponding ability of an oligonucleotide primer variant to anneal to an adaptive immune receptor segment-encoding polynucleotide by taking into account codon degeneracy, reading frame positioning and the like. Typically, oligonucleotide primer variants will contain one or more substitutions, additions, deletions and/or insertions, preferably such that the annealing ability of the variant
oligonucleotide is not substantially diminished relative to that of an adaptive immune receptor V-segment or J-segment oligonucleotide primer sequence that is specifically set forth herein. As also noted elsewhere herein, in preferred embodiments adaptive immune receptor V-segment and J-segment
oligonucleotide primers are designed to be capable of amplifying a rearranged TCR or IGH sequence that includes the coding region for CDR3.
According to certain embodiments contemplated herein, the primers for use in the multiplex PCR methods of the present disclosure may be functionally blocked to prevent non-specific priming of non-T or B cell sequences. For example, the primers may be blocked with chemical modifications as described in U.S. patent application publication
US2010/0167353. According to certain herein disclosed embodiments, the use of such blocked primers in the present multiplex PCR reactions involves primers that may have an inactive configuration wherein DNA replication (i.e., primer extension) is blocked, and an activated configuration wherein DNA replication proceeds. The inactive configuration of the primer is present when the primer is either single-stranded, or when the primer is specifically hybridized to the target DNA sequence of interest but primer extension remains blocked by a chemical moiety that is linked at or near to the 3' end of the primer.
The activated configuration of the primer is present when the primer is hybridized to the target nucleic acid sequence of interest and is subsequently acted upon by RNase H or another cleaving agent to remove the 3' blocking group, thereby allowing an enzyme (e.g., a DNA polymerase) to catalyze primer extension in an amplification reaction. Without wishing to be bound by theory, it is believed that the kinetics of the hybridization of such primers are akin to a second order reaction, and are therefore a function of the T cell or B cell gene sequence concentration in the mixture. Blocked primers minimize non-specific reactions by requiring hybridization to the target followed by cleavage before primer extension can proceed. If a primer hybridizes incorrectly to a sequence that is related to the desired target sequence but which differs by having one or more non-complementary nucleotides that result in base-pairing mismatches, cleavage of the primer is inhibited, especially when there is a mismatch that lies at or near the cleavage site. This strategy to improve the fidelity of amplification reduces the frequency of false priming at such locations, and thereby increases the specificity of the reaction. As would be recognized by the skilled person, reaction conditions, particularly the
concentration of RNase H and the time allowed for hybridization and extension in each cycle, can be optimized to maximize the difference in cleavage efficiencies between highly efficient cleavage of the primer when it is correctly hybridized to its true target sequence, and poor cleavage of the primer when there is a mismatch between the primer and the template sequence to which it may be incompletely annealed.
As described in US2010/0167353, a number of blocking groups are known in the art that can be placed at or near the 3' end of the
oligonucleotide {e.g., a primer) to prevent extension. A primer or other oligonucleotide may be modified at the 3'-terminal nucleotide to prevent or inhibit initiation of DNA synthesis by, for example, the addition of a 3' deoxyribonucleotide residue (e.g., cordycepin), a 2',3'-dideoxyribonucleotide residue, non-nucleotide linkages or alkane-diol modifications (U.S. Pat. No. 5,554,516). Alkane diol modifications which can be used to inhibit or block primer extension have also been described by Wilk et al., (1990 Nucleic Acids Res. 18 (8):2065), and by Arnold et al. (U.S. Pat. No. 6,031 ,091). Additional examples of suitable blocking groups include 3' hydroxyl substitutions (e.g., 3'- phosphate, 3'-triphosphate or 3 -phosphate diesters with alcohols such as 3- hydroxypropyl), 2'3'-cyclic phosphate, 2' hydroxyl substitutions of a terminal RNA base (e.g., phosphate or sterically bulky groups such as triisopropyl silyl (TIPS) or tert-butyl dimethyl silyl (TBDMS)). 2 -alkyl silyl groups such as TIPS and TBDMS substituted at the 3'-end of an oligonucleotide are described by Laikhter et al., U.S. patent application Ser. No. 11/686,894, which is
incorporated herein by reference. Bulky substituents can also be incorporated on the base of the 3'-terminal residue of the oligonucleotide to block primer extension.
In certain embodiments, the oligonucleotide may comprise a cleavage domain that is located upstream (e.g., 5' to) of the blocking group used to inhibit primer extension. As examples, the cleavage domain may be an RNase H cleavage domain, or the cleavage domain may be an RNase H2
cleavage domain comprising a single RNA residue, or the oligonucleotide may comprise replacement of the RNA base with one or more alternative
nucleosides. Additional illustrative cleavage domains are described in
US2010/0167353. Oligonucleotide primers that comprise an RNase H2 cleavage domain upstream to a blocking group that inhibits primer extension are referred to as "RN2 modified" primers. Exemplary RN2 modified primers are listed above in Table I B.Thus, a multiplex PCR system may use 40, 45, 50, 55, 60, 65, 70, 75, 80, 85, or more forward primers, wherein each forward primer is complementary to a single functional TCR or Ig V segment or a small family of functional TCR or Ig V segments, e.g. , a TCR \/β segment, or (see e.g., the TCR primers as shown in Table 1), and, for example, thirteen reverse primers, each specific to a TCR or Ig J segment, such as TCR ϋβ segment (see e.g., Table 1). In another embodiment, a multiplex PCR reaction may use four forward primers each specific to one or more functional TCRy V segment and four reverse primers each specific for one or more TCRy J segments. In another embodiment, a multiplex PCR reaction may use 84 forward primers each specific to one or more functional V segments and six reverse primers each specific for one or more J segments.
The present methods provide the ability to quantify the relative number of T or B cells in a complex mixture of cells by determining the relative representation of adaptive immune cell DNA in a DNA sample extracted from the cell mixture, by multiplex PCR using real-time quantitative PCR methods. Real-time PCR is a technique that evaluates the level of PCR product accumulation during successive amplification cycles (see e.g., Gibson et al., Genome Research 6:995-1001 , 1996; Heid et al. , Genome Research 6:986- 994, 1996; Real-Time PCR: Current Technology and Applications, Edited by Julie Logan, Kirstin Edwards and Nick Saunders, 2009, Caister Academic Press, Norfolk, UK). This technique permits quantitative evaluation of DNA (or mRNA/cDNA) levels in multiple samples. Briefly, DNA (or mRNA/cDNA) is extracted from a sample (e.g., tumor and normal tissue) using standard
techniques. Real-time PCR is performed using the multiplex PCR primer sets as described herein using, for example, any of a variety of commercially available real-time PCR machines, such as LightCycler® 480 System (Roche Diagnostics Corporation, Indianapolis, IN), real-time detection systems from Bio-Rad (e.g., CFX384™ or other similar systems; Bio-Rad; Hercules, CA), or the Eco™ real-time PCR system (lllumina Inc., San Diego, CA).
A number of established qPCR methodologies are described herein and may be employed according to certain preferred embodiments of the present invention, but the invention is not intended to be so limited and also contemplates digital PCR (dPCR, e.g., droplet digital PCR or "ddPCR") and various quantitative PCR techniques and instrumentation, including by way of illustration and not limitation the ABI QuantStudio™ 12K Flex System (Life Technologies, Carlsbad, CA), the QuantaLife™ digital PCR system (BioRad, Hercules, CA) and the RainDance™ microdroplet digital PCR system
(RainDance Technologies, Lexington, MA) (e.g., Pekin et al., 2011 Lab. Chip 11(13):2156; Zhong et al., 2011 Lab. Chip 11(13):2167; Tewhey et al., 2009 Nature Biotechnol. 27:1025; 2010 Nature Biotechnol. 28:178), any of which may be adapted by the skilled person for use with the herein described compositions and methods.
Quantification of amplified DNA molecules that are the products of qPCR or dPCR or other quantitative PCR techniques may be achieved by detecting a level of a DNA-quantifying signal that is generated by a detectable indicator of the presence of DNA. In preferred embodiments, the detectable indicator generates a DNA-quantifying signal that is a fluorescent signal, using well known reagents and detection instrumentation. In one exemplary embodiment, amplified PCR product may be detected using a DNA intercalating dye, such as SYBR™ green, a fluorescent dye that only intercalates into double-stranded DNA, i.e., the DNA-quantifying signal is SYBR™ green fluorescence and the detectable indicator is SYBR™ green, such that fluorimetric quantification of the fluorescent signal provides a measureable
DNA-quantifying signal level. Other illustrative dyes that may be used as detectable indicators to generate measureable levels of DNA-quantifying signals include SYTO9, SYTO-82 and SYTO-13 and EvaGreen™ (see e.g., Anal Biochem, 340: 24 - 34, 2005; Nucleic Acids Res. 35: e127, 2007). These detectable indicators may advantageously permit quantitative determination of PCR products without the use of sequence-specific oligonucleotide probes, such as oligonucleotide probes for use in real-time qPCR that may bear a detectable labeling moiety such as a fluorescent moiety and/or a fluorescence quencher or dequenching moiety, examples of which are described below.
The increase in fluorescence may be monitored at one or a plurality of timepoints during the during the amplification process, including monitoring fluorescence throughout all or substantially all of the amplification process. A threshold for detection of fluorescence above background is determined, where the cycle threshold, Ct, is the cycle (i.e., the cycle number in the succession of PCR cycles, where each cycle comprises steps of DNA denaturation, primer annealing, and template-directed DNA synthesis via primer extension) at which the fluorescence crosses the threshold. During the exponential phase, the quantity of DNA theoretically doubles every cycle.
Therefore, relative amounts of DNA can be calculated, e.g., a first sample for which the Ct is three cycles earlier than the Ct of a second sample has 23 = 8 times more template than the second sample.
The amount of DNA or RNA in the test sample is determined by comparing the real-time PCR results to a standard curve. The standard curve is generated for each qPCR run using a standard control DNA containing the gene or genes of interest. In one embodiment of the present disclosure, the standard control is prepared by purifying DNA from adaptive immune cells, such as from T and/or B cells (e.g., from T cells or B cells bead sorted from peripheral blood). The purified DNA is quantified and then serially diluted to concentrations ranging from 60 picograms to 250 nanograms per reaction. The skilled person would understand that other similar standard control templates
may also be used, such as plasmid DNA containing the target template(s) of interest.
In addition, in certain embodiments, an additional qPCR standard curve may be generated for amplification products of all or a portion of an internal control gene that, unlike the rearranged TCR or Ig CDR3-encoding gene regions found in adaptive immune cells, is common to all of the cells in the test biological sample, i.e., in the adaptive immune cells and in the cells that are not adaptive immune cells. Non-limiting examples of such internal control genes include those that encode β-actin, RNaseP, glyceraldehyde-3-phosphate dehydrogenase, MHC I (major histocompatibility complex type I antigens, such as HLA-A or HLA-B), cyclophilin, and others as are known in the art, and which may be amplified using appropriate concentrations of target DNA (or cDNA) as template. These and related embodiments permit standardization of the initial DNA or RNA content of a tissue sample, and hence quantification of the total number of cells present in a test sample that comprises a mixture of cells (e.g., adaptive immune cells and other cells), based on the amount of internal control gene (e.g., β-actin and RNaseP) DNA that is detectable in qPCR, for
comparison purposes.
Thus, the mean copy number for each test biological sample in which rearranged adaptive immune receptor (TCR or Ig) encoding DNA is quantified as a measure of adaptive immune cells, may be normalized relative to the DNA quantity that is determined for the internal control gene, which is present at constant levels in adaptive immune cells and in cells that are not adaptive immune cells. For instance, determination of the amount of β-actin encoding DNA, or another appropriate internal control gene, permits evaluation of the level of adaptive immune receptor encoding DNA relative to the level of the internal control gene DNA in each test sample.
Accordingly, certain of the herein described methods for quantifying the number of adaptive immune cells in a test sample that comprises a mixture of cells may further comprise quantifying the number of
cells in the mixture of cells, by amplifying test sample template DNA extracted from the test biological sample with a set of control primers, wherein the set of control primers amplifies an internal control gene DNA segment that is not specific to adaptive immune cells, to produce internal control gene amplification products. Concurrently with the amplification of the internal control gene segment, at one or a plurality of time points a DNA signal level is measured that is detectable for the internal control gene amplification products. This internal control gene amplification signal is compared, at the one or plurality of time points (e.g., in real time), to a reference DNA signal level that is detectable in amplification products of a known amount of the internal control gene DNA that has been amplified by the control primers, to provide a calibration standard for use as a reference. By this comparison, the amount of internal control gene DNA that is present in the test sample template DNA that was extracted from the test biological sample, can be quantified, from which the number of cells in the mixture of cells in the test sample can be determined. In certain such embodiments, the control primers are present in the same qPCR reaction as the reaction in which rearranged adaptive immune receptor encoding DNA is amplified with V-segment and J-segment primers. In certain other
embodiments, the control primers are present in a separate qPCR reaction from the reaction in which amplification occurs using the V-segment and J-segment primers.
In another embodiment, matching primers and fluorescent probes (e.g., Taqman® probes from Roche Molecular Systems, Pleasanton, CA; or Molecular Probes® fluorescent dyes from Invitrogen Corp., Carlsbad, CA), 3' minor groove binding (MGB) DNA probes (e.g., dihydrocyclopyrroloindole tripeptides described by Kutyavin et al., 2000 Nucl. Ac. Res. 28:655-661), or other appropriate molecular beacons (see, e.g., Manganelli et al., 2001 Meth. Mol. Med. 54:295; Tyagi et al., 2000 Nat. Biotech. 18:1191) may be designed for genes of interest (e.g., TCR or Ig V and J segment genes; internal control genes) as described herein. Optimal concentrations of primers and probes may
be initially determined by those of ordinary skill in the art, and control {e.g., β-actin) primers and probes may be obtained commercially from, for example, Perkin Elmer/Applied Biosystems (Foster City, CA). Table 2 shows exemplary probes designed to target the human TCRB gene family, using the PCR primers presented in TablelA, the fluorophore FAM (6-carboxyfluorescein), the (MGB) minor groove-binder modification to increase Tm, and a non-fluorescent quencher (NFQ; e.g., QSY21 , Kabelac et al., 2010 Phys Chem Chem Phys 12:9677; QSY9, Anderson et al., 2009 Biochem. 48:8516; 4-(4'- dimethylaminophenylazo)benzoic acid (DABCYL), Manganelli et al., 2001 Meth. Mol. Med. 54:295; BHQ-1 , (4-(2-nitro-4-toluyldiazo)-2'-methoxy-5'-methyl- azobenzene-4"-(N-ethyl)-N-ethyl-2-cyanoethyl-(N,N-diisopropyl)- phosphoramidite) or other members of the BHQ® series, available from
Biosearch Technologies, Inc., Novato, CA). Related embodiments contemplate alternative means for generating high Tm probes in which the MGB is replaced, such as using longer probes without MGB, or using locked nucleic acids (LNA, see, e.g., Kaur et al., 2007 Chem. Rev. 107:4672). Alternative quenchers may also be employed, including fluorescent quenchers (e.g., Marras, 2006 Meths. Mol. Biol. 335:3; Stefflova et al., 2007 Curr. Med. Chem. 14:2110). Alternative fluorophores including TET, VIC, ROX, TAMRA, Cy3, Cy5, Hex, Yellow 555 and others may also be substituted for FAM (e.g., Marras, 2006; see also Molecular Probes® fluorescent dyes from Invitrogen Corp., Carlsbad, CA).
Mixtures of fluorophores may also be used in certain embodiments, for example, to detect multiple V segments in a single reaction. Table 2: TaqMan® MGB probes for use with the PCR primers of
Table 1A.
Gene segment SEQ ID NO: probe
TCRBV03-2p 712 FAM-AATTCCCTGGAGCTTGGTGACT-MGB-NFQ
TCRBV04-1 713 FAM-CAGAAGACTCAGCCCTGTATCT-MGB-NFQ
TCRBV04-2 714 FAM-AGAAGACTCGGCCCTGTATCT-MGB-NFQ
TCRBV04-3 715 FAM-AGAAGACTCGGCCCTGTATCT-MGB-NFQ
TCRBV05-1 716 FAM-AATGTGAGCACCTTGGAGCT-MGB-NFQ
TCRBV05-2p 717 FAM-ACTGAGTCAAACACGGAGCT-MGB-NFQ
TCRBV05-3 718 FAM-AATGTGAGTGCCTTGGAGCT-MGB-NFQ
TCRBV05-4 719 FAM-AATGTGAACGCCTTGGAGCT-MGB-NFQ
TCRBV05-5 720 FAM-TGTGAACGCCTTGTTGCT-MGB-NFQ
TCRBV05-6 721 FAM-TGTGAACGCCTTGTTGCT-MGB-NFQ
TCRBV05-7 722 FAM-TGTGAACGCCTTGTTGCT-MGB-NFQ
TCRBV05-8 723 FAM-TGTGAACGCCTTGTTGCT-MGB-NFQ
TCRBV06-1 724 FAM-CCTCCCAGACATCTGTGTACTT-MGB-NFQ
TCRBV06-2 725 FAM-TCCCTCCCAAACATCTGTGT-MGB-NFQ
TCRBV06-3 726 FAM-TCCCTCCCAAACATCTGTGT-MGB-NFQ
TCRBV06-4 727 FAM-TGCTGTAC CCTCTCAGACATCT-M G B-N FQ
TCRBV06-5 728 FAM-CCTCCCAGACATCTGTGTACTT-MGB-NFQ
TCRBV06-6 729 FAM-CCTCCCAGACATCTGTGTACTT-MGB-NFQ
TCRBV06-7 730 FAM-TGCTCCCTCTCAGACTTCTGTT-MGB-NFQ
TCRBV06-8 731 FAM-CCTCCCAGAC ATCTGTGTACTT-M G B-N FQ
TCRBV06-9 732 FAM-TCCCTCCCAGACATCTGTAT-MGB-NFQ
TCRBV07-1 733 FAM-AAGTTCCAGCGCACACA-MGB-NFQ
TCRBV07-2 734 FAM-ATCCAGCGCACACAGCA-MGB-NFQ
TCRBV07-3 735 FAM-AAGATCCAGCGCACAGA-MGB-NFQ
TCRBV07-4 736 FAM-AAGATCCAGCGCACAGA-MGB-NFQ
TCRBV07-5p 737 FAM-ATCCAGCGCACAGAGCAA-MGB-NFQ
Gene segment SEQ ID NO: probe
TCRBV07-6 738 FAM-ATCCAGCGCACAGAGCA-MGB-NFQ
TCRBV07-7 739 FAM-ATTCAGCGCACAGAGCA-MGB-NFQ
TCRBV07-8 740 FAM-AAGATCCAGCGCACACA-MGB-NFQ
TCRBV07-9 741 FAM-ATCCAGCGCACAGAGCA-MGB-NFQ
TCRBV08-1 p 742 FAM-AACCCTGGAGTCTACTAGCA-MGB-NFQ
TCRBV08-2p 743 FAM-AGCCAGACCTATCTGTACCA-MGB-NFQ
TCRBV09 744 FAM-AGCTCTCTGGAGCTGG-MGB-NFQ
TCRBV10-1 745 FAM-CCTCCTCCCAGACATCTGTATA-MGB-NFQ
TCRBV10-2 746 FAM-CGCTCCCAGACATCTGTGTATT-MGB-NFQ
TCRBV10-3 747 FAM-AGCTCCCAGACATCTGTGTACT-MGB-NFQ
TCRBV1 1-1 748 FAM-AAGATCCAGCCTGCAGAGCTT-MGB-NFQ
TCRBV11-2 749 FAM-ATCCAGCCTGCAAAGCTTGA-MGB-NFQ
TCRBV11-3 750 FAM-AAGATCCAGCCTGCAGAGCTT-MGB-NFQ
TCRBV12-1 p 751 FAM-CCAGGGACTTGGGCCTATATTT-MGB-NFQ
TCRBV12-2p 752 FAM-AAGATCCAGCCTGCAGAGCA-MGB-NFQ
TCRBV12-3 753 FAM-AGGGACTCAGCTGTGTACTT-MGB-NFQ
TCRBV12-4 754 FAM-AGGGACTCAGCTGTGTACTT-M G B-N FQ
TCRBV12-5 755 FAM-CCAGGGACTCAGCTGTGTATTT-MGB-NFQ
TCRBV13 756 FAM-AACATGAGCTCCTTGGAGCT-MGB-NFQ
TCRBV14 757 FAM-TGCAGAACTGGAGGATTCTGGA-MGB-NFQ
TCRBV15 758 FAM-ACGCAGCCATGTACCT-MGB-NFQ
TCRBV16 759 FAM-ATCCAGGCTACGAAGCTTGA-MGB-NFQ
TCRBV17p 760 FAM-AGGGACTCAGCCGTGTATCT-MGB-NFQ
TCRBV18 761 FAM-CGAGGAGATTCGGCAGCTTATT-MGB-NFQ
TCRBV19 762 FAM-AGAACCCGACAGCTTTCT-MGB-NFQ
TCRBV20-1 763 FAM-TCCTGAAGACAGCAGCTTCT-MGB-NFQ
Gene segment SEQ ID NO: probe
TCRBV21 -1 p 764 FAM-AGATCCAGTCCACGGAGTCA-MGB-NFQ
TCRBV22p 765 FAM-ACACCAGCCAAACAGCTT-MGB-NFQ
TCRBV23-1 p 766 FAM-GGCAATCCTGTCCTCAGAA-MGB-NFQ
TCRBV24-1 767 FAM-CCCAACCAGACAGCTCTTTACT-MGB-NFQ
TCRBV25-1 768 FAM-CCTCACATACCTCTCAGTACCT-MGB-NFQ
TCRBV26p 769 FAM-AGCACCAACCAGACATCTGT-MGB-NFQ
TCRBV27-1 770 FAM-CCAACCAGACCTCTCTGTACTT-MGB-NFQ
TCRBV28 771 FAM-AGCACCAACCAGACATCT-MGB-NFQ
TCRBV29-1 772 FAM-TGAGCAACATGAGCCCTGAA-MGB-NFQ
TCRBV30 773 FAM-TCCTTCTCAGTGACTCTGGCTT-MGB-NFQ
In certain embodiments, oligonucleotide probes useful in the methods disclosed herein may be modified, for example, with the ZEN moiety or to contain "locked nucleic acid" (LNA) where the ribose ring is "locked" by a methylene bridge connecting the 2'-O atom and the 4'-C atom (see, Owczarzy et al. 201 1 Biochemistry 50(43):9352-67). Both types of oligonucleotides may be obtained from Integrated DNA Technologies, Inc. (IDT, Coralville, IA).
To quantitate the amount of specific DNA or RNA in a sample, a standard curve can be generated using standard control DNA (e.g., a plasmid containing the gene(s) of interest, or, as described elsewhere herein, known quantities of purified T cell or B cell DNA). Standard curves are generated using the Ct values determined in the real-time PCR, which are related to the initial template DNA or cDNA concentration used in the assay. Standard dilutions ranging from 10-106 copies of the gene of interest are generally sufficient. In addition, a standard curve is generated for the control sequence. This permits standardization of initial DNA or RNA content of a tissue sample to the amount of control for comparison purposes.
The present methods are highly sensitive and are capable of detecting the presence of 10 or even fewer adaptive immune cells per 10,000 cells in the mixture of cells. In one embodiment, the present methods are capable of detecting the presence of 9, 8, 7, 6, 5, 4, 3, 2, or 1 adaptive immune cell per 10,000 cells in the mixture of cells.
In certain embodiments, the present methods are capable of detecting 10 picograms of adaptive immune cell DNA in a DNA sample extracted from a population of mixed cells. In certain embodiments, the present methods are capable of detecting, 9, 8, 7, 6, or 5 picograms of adaptive immune cell DNA from a source of DNA extracted from a mixed population of cells, such as a tumor sample.
Multiplex Digital PCR
Alternatively, in a related aspect also contemplated herein, digital PCR methods can be used to quantitate the number of target genomes in a sample, without the need for a standard curve. In digital PCR, the PCR reaction for a single sample is performed in a multitude of more than 100 microcelis or droplets (also referred to herein as "assay samples"), such that each droplet either amplifies (e.g., generation of an amplification product provides evidence of the presence of at least one template molecule in the microcell or droplet) or fails to amplify (evidence that the template was not present in a given microcell or droplet). Hence, the individual readout signals are qualitative or "digital" in nature. By simply counting the number of positive microcelis, it is possible directly to count the number of target genomes that are present in an input sample. Digital PCR methods typically use an endpoint readout, rather than a conventional quantitative PCR signal that is measured after each cycle in the thermal cycling reaction (see, e.g., Vogelstein and Kinzler, 1999 Proc. Natl. Acad. Sci. USA 96:9236-41 ; Pohl and Shih, 2004 Expert Rev. Mot. Diagn. 4(1);41-7, 2004; Pekin et al., 2011 Lab. Chip
11 (13):2156; Zhong et al., 2011 Lab. Chip 11 (13):2167; Tewhey et al., 2009
Nature Biotechnol. 27:1025; 2010 Nature Biotechnol. 28:178). Compared with traditional PCR, dPCR has the following advantages: (1) there is no need to rely on references or standards, (2) desired precision may be achieved by increasing the total number of PCR replicates, (3) it is highly tolerant to inhibitors, (4) it is capable of analyzing complex mixtures, and (5) it provides a linear response to the number of copies present in a sample to allow for small change in the copy number to be detected.
Accordingly, in a related aspect, the present disclosure provides a method for quantifying the relative representation of adaptive immune cells in a test biological sample that comprises a mixture of cells (i.e., both adaptive immune cells and cells that are not adaptive immune cells). The method comprises first distributing test sample template DNA extracted from the test biological sample to form a set of assay samples followed by amplifying the test sample template DNA in the set of assay samples in a multiplex dPCR. The multiplex dPCR comprises (i) a plurality of V-segment oligonucleotide primers that are each independently capable of specifically hybridizing to at least one polynucleotide encoding a TCR V-region polypeptide or an Ig V-region polypeptide, wherein each V-segment primer comprises a nucleotide sequence of at least 15 contiguous nucleotides that is complementary to at least one functional TCR or Ig V-encoding gene segment and wherein the plurality of V- segment primers specifically hybridize to substantially all functional TCR or IgV- encoding gene segments that are present in the test sample, and (ii) a plurality of J-segment oligonucleotide primers that are each independently capable of specifically hybridizing to at least one polynucleotide encoding a TCR J-region polypeptide or an Ig J-region polypeptide, wherein each J-segment primer comprises a nucleotide sequence of at least 15 contiguous nucleotides that is complementary to at least one functional TCR or Ig J-encoding gene segment and wherein the plurality of J-segment primers specifically hybridize to substantially all functional TCR or Ig J-encoding gene segments that are present in the test sample. The V-segment and J-segment primers are capable
of amplifying in the multiplex dPCR substantially all rearranged TCR or Ig CDR3-encoding regions in the test sample to produce a multiplicity of amplified rearranged DNA molecules from the adaptive immune cells in the test sample. The multiplex dPCR further comprises a set of control primers to produce an internal control gene amplification product, wherein the set of control primers amplifies an internal control gene DNA segment that is not specific to adaptive immune cells. The number of assay samples that detectably contain the amplified rearranged DNA molecules is compared with the number of assay samples that detectably contain the internal control gene amplification product, from which the relative representation of adaptive immune cells in the test biological sample is quantified.
Any of the DNA or RNA extracted from a mixed population of cells from a sample described herein (e.g., samples described in connection with multiplex qPCR), any of the amplified regions described herein (e.g., various CDR3 regions), any of the compositions that comprise multiple of V-segment and J-segment primers provided herein (e.g., those described in connection with multiplex qPCR), any of the methods for detecting amplification products (e.g., using fluorescent probes described in connection with multiplex qPCR), and any of the internal controls common to all of the cells (i.e., in the adaptive immune cells and the in the cells that are not adaptive immune cells) in a test biological sample (e.g., the internal controls described in connection with multiplex qPCR) may be used in multiplex dPCR as provided herein.
Unlike qPCR, a known amount of control adaptive immune cell template DNA extracted from a control adaptive immune cell sample is not needed in dPCR. In addition, because dPCR typically uses an endpoint readout, rather than a conventional qPCR signal that is measured after each cycle in the thermal cycling reaction, no standard curve of amplification of adaptive immune cell template DNA is needed. However, in certain
embodiments, although not necessary, it is possible that a known amount of control adaptive immune cell template DNA may be amplified separately from
template DNA extracted from a test biological sample by qPCR to be used as a positive control for the template DNA extracted from the test biological sample.
As described herein, an internal control gene segment that is not specific to adaptive immune cells may be amplified in a multiplex dPCR.
Because the number of copies of the internal control gene segment per cell is known, the number of assay samples that detectably contain the amplification product of the internal control gene segment allows the quantification of the number of the total cells (including adaptive immune cells and those that are not adaptive immune cells) from which test sample template DNA was extracted. If the number of copies of rearranged TCR or Ig CDR3-encoding regions per cell is known (e.g., about 80% of αβ T cells have only one of their two TCR alleles rearranged, while the other 20% have both alleles rearranged, with one of the two productive and the other non-productive), comparing the number of assay samples that detectably contain the amplification products of rearranged TCR or lgCDR3-encoding region with the number of assay samples that detectably contain the amplification product of the internal control gene segment allows quantification of the relative representation of adaptive immune cells {i.e., percentage of the cells in the test biological sample that are adaptive immune cells).
In certain embodiments, a DNA sample (e.g., DNA extracted from a test biological sample described herein) is fractionated by the simple process of dilution so that each fraction contains approximately one copy of DNA template or less. By isolating individual DNA templates, this process effectively enriches DNA molecules that were present at very low levels in the original sample. In certain embodiments, the sample is split into many fractions by dilution so that about 0.1 to about 0.3, about 0.3 to about 0.6, about 0.6 to about 1 copy of DNA per individual reactions.
Any systems known in the art for performing digital PCR methodology may be used in the methods provided herein, for example, the ABI QuantStudio™ 12K Flex System (Life Technologies, Carlsbad, CA), the
QX100I M Droplet Digital™ PCR system (BioRad, Hercules, CA), the
QuantaLife™ digital PCR system (BioRad, Hercules, CA), or the RainDance™ microdroplet digital PCR system (RainDance Technologies, Lexington, MA).
The present methods using dPCR are highly sensitive and are capable of detecting the presence of 10 or even fewer adaptive immune cells per 10,000 cells in the mixture of cells. In one embodiment, the present methods are capable of detecting the presence of 9, 8, 7, 6, 5, 4, 3, 2, or 1 adaptive immune cell per 10,000 cells in the mixture of cells.
In certain embodiments, the present methods using dPCR are capable of detecting 10 picograms of adaptive immune cell DNA in a DNA sample extracted from a population of mixed cells. In certain embodiments, the present methods are capable of detecting, 9, 8, 7, 6, or 5 picograms of adaptive immune cell DNA from a source of DNA extracted from a mixed population of cells, such as a tumor sample.
Methods of Use
The methods described herein may be used to enumerate the relative presence of tumor-infiltrating lymphocytes, or of lymphocytes infiltrating a somatic tissue that is the target of an autoimmune reaction, based on quantification of the relative representation of DNA from such adaptive immune cells in DNA extracted from a biological sample, comprising a mixture of cell types, that has been obtained from such a tumor or tissue. Such methods are useful for determining cancer or autoimmune disease prognosis and diagnosis, for assessing effects of a therapeutic treatment {e.g., assessing drug efficacy and/or dose-response relationships), and for identifying therapeutic courses for cancer treatment, for treatment of autoimmune diseases, or for treatment of transplant rejection, and may find other related uses.
To assess a therapeutic treatment, for example, certain
embodiments contemplate a method in which is assessed an effect of the therapeutic treatment on the relative representation of adaptive immune cells in
at least one tissue in a subject to whom the treatment has been administered. By way of illustration and not limitation, according to certain such embodiments a treatment that alters (e.g., increases or decreases in a statistically significant manner) the relative representation of adaptive immune cells in a tissue or tissues may confer certain benefits on the subject. For instance, certain cancer immunotherapies are designed to enhance the number of tumor infiltrating lymphocytes (TIL). It has been shown that the presence of CD3+ TIL in ovarian tumors is stongly correlated with patient outcome (see, e.g., Hwang et al., 2011 Gynecol. Oncol., 124(2): 192). Further data clarified that in addition to TIL presence, the characteristics of the TIL populations were also significant: CD8+ TILs and clonal TILs were associated with longer Disease Free Survival (DFS), and infiltrating regulatory T cells were associated with shorter DFS [see, Stumpf et al., 2009 Br. J. Cancer 101 : 1513-21). These studies indicated that TIL may be an independent prognostic factor (see, Clarke et al., 2009 Mod. Pathol.
22:393-402). Thus, quantification of the relative representation of adaptive immune cell DNA as described herein, for purposes of detecting possible increases in TIL in tumor tissue samples obtained at one or a plurality of time points before treatment, during the course of treatment and/or following treatment may provide highly useful information with respect to determining efficacy of the treatment, and therefrom developing a prognosis for the subject.
As another example, certain autoimmune disease-directed immunotherapies are designed to reduce the number of tissue infiltrating lymphocytes in one or more afflicted tissues such as tissues or organs that may be targets of clinically inappropriate autoimmune attack, such that quantification of the relative representation of adaptive immune cell DNA as described herein, for purposes of detecting possible decreases in adaptive immune cells in tissue samples obtained at one or a plurality of time points before treatment, during the course of treatment and/or following treatment may provide highly useful information with respect to determining efficacy of the treatment, and therefrom developing a prognosis for the subject.
As a further example, certain transplant rejection-directed immunotherapies are designed to reduce the number of tissue infiltrating lymphocytes in transplanted organs, such that quantification of the relative representation of adaptive immune cell DNA as described herein, for purposes of detecting possible decreases in adaptive immune cells in tissue samples from transplanted organs obtained at one or a plurality of time points before treatment, during the course of treatment and/or following treatment may provide highly useful information with respect to determining efficacy of the treatment, and therefrom developing a prognosis for the subject.
In these and related embodiments, the herein described methods for quantifying the relative representation of adaptive immune cell DNA may be practiced using test biological samples obtained from a subject at one or a plurality of time points prior to administering the therapeutic treatment to the subject, and at one or a plurality of time points after administering the
therapeutic treatment to the subject. The samples may be obtained from the same or from different tissues, which may vary as a function of the particular condition of the subject. For example, by way of illustration and not limitation, in the case of an inoperable tumor the test biological samples that are obtained from the subject before and after treatment may be from the same tissue, whereas in the case of a tumor that is partially removed surgically, or that occurs at multiple sites in the subject, the test biological samples may be obtained from different tissues or from different tissue sites before and after the therapeutic treatment is administered.
Also contemplated herein are embodiments in which any of the herein described methods may further comprise determination of the relative structural diversity of adaptive immune receptors (e.g., the sequence diversity among products of productively rearranged TCR and/or immunoglobulin genes) in the adaptive immune cell component of the mixture of cells that is present in the test biological sample. In certain such embodiments, the present qPCR methodologies using the herein described rearranged adaptive immune
receptor encoding specific oligonucleotide primer sets permit ready
identification of the particular primer combinations that generate the production of amplified rearranged DNA molecules. Accordingly, for example, these embodiments permit determination of the relative degree of clonality of an adaptive immune cell population that is present as part of a mixed cell population in a test biological sample, which may have prognostic value.
For instance, in a solid tumor sample in which TILs are detected by quantifying the relative representation of adaptive immune cell DNA in DNA extracted from the sample as described herein, the present methods
contemplate determination of whether only one or a few (e.g., no more than 1 , 2, 3, 4, 5, 6, 7, 8, 9 or 10) combinations of a particular V-segment
oligonucleotide primer and a particular J-segment oligonucleotide primer are predominantly (e.g., generating at least 80, 85, 90, 95, 97 or 99 percent of amplification products) responsible for the PCR production of amplified rearranged adaptive immune cell DNA molecules. Such an observation of one or a few predominant adaptive immune receptor gene-encoding amplification product would, according to non-limiting theory, indicate a low degree of TIL heterogeneity. Conversely, determination of a high degree of heterogeneity in adaptive immune receptor structural diversity by characterization of TIL DNA would indicate that a predominant TIL clone is not present.
It is thus further contemplated for these and related embodiments of any of the herein described methods that such a method may, optionally, further comprise sequencing the amplified adaptive immune receptor encoding DNA molecules that are produced. In certain embodiments, at least 30, 40, 50, 60, 70, 80, 90, 100, 101-150, 151-200, 201-300, 301-500, and not more than 1000 contiguous nucleotides of the amplified adaptive immune receptor encoding DNA molecules are sequenced. Compositions and methods for the sequencing of rearranged adaptive immune receptor gene sequences and for adaptive immune receptor clonotype determination are described in Robins et al., 2009 Blood 114, 4099; Robins et al., 2010 Sci. Translat. Med. 2:47ra64;
Robins et al., 2011 J. Immunol. Meth. doi:10.1016/j.jim.2011.09. 001 ; Sherwood et al. 2011 Sci. Translat. Med. 3:90ra61 ; U.S. A.N. 13/217,126 (US Pub. No. 2012/0058902), U.S.A.N. 12/794,507 (US Pub. No. 2010/0330571),
WO/2010/151416, WO/2011/106738 (PCT/US2011/026373), WO2012/027503 (PCT/US2011/049012), U.S.A.N. 61/550,311 , and U.S.A.N. 61/569,118, herein incorporated by reference.
In certain embodiments, there is provided a method for
quantifying the relative representation of adaptive immune cells in a mixture of cells in a biological sample, comprising: (a) amplifying DNA extracted from the mixture of cells with a plurality of V segment primers and a plurality of J segment primers in a quantitative polymerase chain reaction (qPCR), wherein the plurality of V segment primers and the plurality of J segment primers permit amplification of substantially all combinations of the V and J segments of a rearranged immune receptor locus; (b) measuring in real time an amount of DNA amplified in (a) by the plurality of V segment primers and the plurality of J segment primers; (c) comparing the amount of amplified DNA measured in (b) to a known amount of adaptive immune cell DNA that has been amplified by the plurality of V segment primers and the plurality of J segment primers, and therefrom determining an amount of adaptive immune cell DNA extracted from the mixture of cells; and (d) quantifying, from the amount of adaptive immune cell DNA of (c), the relative number of adaptive immune cells in the mixture of cells.
In certain other embodiments, there is provided a method for quantifying the relative representation of adaptive immune cells in a mixture of cells in a biological sample, comprising: (a) amplifying DNA extracted from the mixture of cells with a plurality of V segment primers and a plurality of J segment primers in a dPCR, wherein the plurality of V segment primers and the plurality of J segment primers permit amplification of substantially all
combinations of the V and J segments of a rearranged immune receptor locus; and (b) comparing the number of assay samples that detectably contain
amplified DNA of (a) to the number of assay samples that detectably contain an amplification product of an internal control gene segment, and therefrom determining the relative representation of adaptive immune cells in the mixture of cells.
According to certain herein expressly disclosed embodiments, there are also presently provided methods in which the degree of clonality of adaptive immune cells that are present in a sample, such as a sample that comprises a mixture of cells only some of which are adaptive immune cells, can be determined advantageously without the need for cell sorting or for DNA sequencing. These and related embodiments overcome the challenges of efficiency, time and cost that, prior to the present disclosure, have hindered the ability to determine whether adaptive immune cell presence in a sample {e.g., TIL) is monoclonal or oligoclonal {e.g., whether all TILs are the progeny of one or a relatively limited number of adaptive immune cells), or whether instead adaptive immune cell presence in the sample is polyclonal {e.g., TILs are the progeny of a relatively large number of adaptive immune cells).
According to non-limiting theory, these embodiments exploit current understanding in the art (also described above) that once an adaptive immune cell (e.g., a T or B lymphocyte) has rearranged its adaptive immune receptor-encoding (e.g., TCR or Ig) genes, its progeny cells possess the same adaptive immune receptor-encoding gene rearrangement, thus giving rise to a clonal population that can be uniquely identified by the presence therein of rearranged CDR3-encoding V- and J-gene segments that may be amplified by a specific pairwise combination of V- and J-specific oligonucleotide primers as herein disclosed.
In such presently disclosed embodiments, qPCR or dPCR may be practiced using specifically selected subsets of the adaptive immune receptor- encoding gene V- and J-segment specific oligonucleotide primers as described herein, to determine a degree of adaptive immune cell clonality in a biological sample. For example, in certain embodiments, separate amplification reactions
are set up for a plurality of replicate samples of template DNA that has been extracted from a complex biological sample comprising a heterogeneous mixture of cells (e.g., a solid tumor sample containing tumor cells,
mesenchymal cells and TILs). A complete set of TCR J region specific primers is added to every replicate sample, but each replicate sample receives only one TCR V region specific primer. Quantitative PCR amplification is then permitted to proceed, and each replicate sample is quantitatively assessed for the presence or absence of amplification products. The relative representation of amplification products that is generated in each separate reaction, using each particular primer combination, indicates the relative abundance in the sample template DNA of TCR-encoding DNA containing the V-J rearrangement that is capable of being amplified by a specific V-J primer pair that is present in the reaction. The relative abundance of each amplification product reflects the relative representation of T cells of distinct clonal origin in the biological sample.
In certain other embodiments, separate amplification reactions
(e.g. , qPCR or dPCR) are set up for multiple replicate samples of template DNA extracted from a test biological sample. A complete set of TCR J region specific primers is added to every replicate sample, but each replicate sample receives a subgroup of TCR V region specific primers. Exemplary subgroups of TCR V region specific primers include those provided in Example 5. The relative representation of amplification products generated in each separate reaction, using each particular primer combination, indicates the relative abundance in the sample template DNA of TCR-encoding DNA containing the V-J rearrangements capable of being amplified by specific V-J primer pairs present in the reaction.
In certain embodiments, the methods for quantifying the relative representation of adaptive immune cells in a test biological sample further comprise quantifying the relative representation of CD4+ adaptive immune cells and/or CD8+ adaptive immune cells. Similarly, in certain embodiments, the methods for assessing an effect of a therapeutic treatment on relative
representation of adaptive immune cells disclosed herein further comprise assessing an effect of a therapeutic treatment on relative representation of CD4+ adaptive immune cells and/or on relative representation of CD8+ adaptive immune cells.
The human cellular adaptive immune system is mediated by two primary types of T cells, killer T cells and helper T cells. Killer T cells, marked by the surface expression of CD8, recognize short peptides (about 8-10 amino acids) presented on the surface of cells by human leukocyte antigen (HLA Class I molecules. Helper T cells, marked by the surface expression of CD4, recognize longer peptides (about 12-16 amino acids) presented on the surface of cells by HLA Class II molecules. Both of these T cell types derive from a common progenitor cell type.
During the development of T cells in the thymus, the DNA coding for the alpha and beta chains of the Y-like T cell receptors (TCR) rearrange in a pseudo-random process to form an enormous variety of TCRs. TCR sequence diversity is primarily contained in the complementarity determining region 3 (CDR3) loops of the a and β chains, which bind to the peptide antigen, conveying specificity. The nucleotide sequences that encode the CDR3 loops are generated by V(D)J recombination: variable (Vp), diversity (Dp) and joining (Jp) genes in the genome are rearranged to form a β chain, while Va and Ja genes rearrange to form an a chain.
After the alpha and beta chains rearrange, while still in the thymus, T cells are both positively and negatively selected against self peptides displayed by Class I and Class II HLA molecules. If a TCR binds strongly to a self peptide:HLA complex, the T cell usually dies. Additionally, a T cell is positively selected, requiring some minimal threshold of binding to either a Class I or Class II presented peptide. Prior to selection, T cells express both CD4 and CD8 on their surface, and are referred to as double positive T cells. Upon positive selection the T cell halts expression of one of these two surface
proteins, leaving a single positive T cell committed as either a helper or killer T cell. These two T cell types serve very different functional roles.
The present inventors have discovered that the TCR sequences from, respectively, helper and killer T cells, preferentially utilize different Vp gene segments (see, Example 6). For example, 21 of 48 νβ segments measured have differential usage between CD4+ and CD8+ samples.
Exemplary ν segments preferentially used by CD4+ cells and exemplary \ β segments preferentially used by CD8+ cells include the following: νβ segments more frequent in:
CD4+ T cells CD8+ T cells
TRBV1 1-1 *** TRBV10-2 *
TRBV18 *** TRBV13 ***
TRBV30 * TRBV16 *
TRBV5-1 *** TRBV19 **
TRBV5-4 *** TRBV4-1 **
TRBV5-7 *** TRBV4-2 *
TRBV7-2 *** TRBV4-3 **
TRBV7-3 * TRBV6-1 ***
TRBV7-7 * TRBV6-4 ***
TRBV7-6 ***
TRBV7-8 **
TRBV7-9 ***
* p < 0.05
** p < 0.01
*** p < 0.001
Based on knowledge about such preferential use of different νβ gene segments in a subject, the relative representation in a sample of CD4+ adaptive immune cells and/or CD8+ adaptive immune cells may be quantified. For example, the frequency with which productively rearranged TCR sequences use each \ β segment may be calculated in one or more CD4+ samples isolated from a subject (e.g., a sorted peripheral blood cell population
containing predominantly CD4+ T cells, as may be obtained by fluorescence activated cell sorting (FACS) or with anti-CD4 antibody-coated
immunomagnetic beads or by other techniques). Similarly, the frequency with which productively rearranged TCR sequences use each \/β segment may be calculated in one or more CD8+ samples from the subject. Such frequencies may be used to train a likelihood model {e.g., a computer program), which may in turn be used to estimate the proportion of CD4+ cells in a sample from the subject having an unknown proportion of CD4+ cells (e.g., a sample of mixed cell types that is obtained from a solid tumor or from a solid tissue organ) based on the information (e.g., partial or complete sequences) used to train the model with respect to utilization of particular rearranged DNA molecules in the CD4+ and CD8+ compartments, which information is obtained by amplification according to the methods described herein using qPCR or dPCR.
For example, rearranged TCR νβ segments amplified by qPCR or dPCR as described herein may be sequenced, and the resulting sequences may be used to estimate the proportion of CD4+ cells or CD8+ cells using a likelihood model developed as described herein. Alternatively, primers specific for TCR \/β gene segments that are preferentially used in CD4+ adaptive immune cells may be grouped together to form one or more subgroups of primers ("first subgroups"), while primers specific for \/β gene segments preferentially used in CD8+ adaptive immune cells may form one or more other subgroups ("second subgroups"). Multiple qPCR or dPCR reactions are performed individually, each using primers of only one of the first subgroups or one of the second subgroups. For qPCR, the amounts of amplification products using primers from the first subgroups of primers and from the second subgroups are separately measured. Similarly, for dPCR, the numbers of assay samples that detectably contain amplified rearranged DNA molecules using primers from the first subgroups of primers and from the second subgroups are separately measured. The amounts of amplification products from qPCR reactions and the numbers of assay samples from dPCR reactions may then be used to estimate the proportion of CD4+ cells or CD8+ cells using the likelihood model.
In certain embodiments, the preferential usage of different \/β gene segments in a subject {e.g., a patient) may be determined by sorting cells from the subject (e.g., blood cells) into CD4+ cells and CD8+ cells followed by measuring the frequency of each rearranged TCR sequence in the CD4+ cells and CD8+ cells. The frequencies of rearranged TCR sequences in the CD4+ cells and CD8+ cells may be used to develop a possibility or probability model. A test biological sample from the same subject may then be used to isolate genomic DNA and is used as a template in amplifying rearranged TCR loci by qPCR or dPCR according to the methods described herein. The information about the amplified rearranged adaptive TCR loci (e.g., their sequences or their types based on specific primers or specific groups of primers used in
amplification reactions) may then be used to estimate the proportion of CD4+ cells or CD8+ cells in the test biological sample. Using the frequencies of particular rearranged TCR sequences in known CD4+ cells and CD8+ cells (e.g. , FACS-sorted peripheral blood cells) of the same subject from which the test biological sample is also obtained may avoid or reduce the observed variability in CD4+-specific or CD8+-specific preferential use of different νβ gene segments among different subjects.
It will be appreciated by the skilled person based on the present disclosure that variations and permutations of the assay design may be practiced, such as setting up parallel reactions in which every reaction contains template DNA from the mixed cell-type sample and a complete complement of V region primers but only one J region primer, or reactions that contain different known subsets of V and/or J region primers. As another example, replicate qPCR or dPCR amplification reactions may be set up that each contain template DNA from the mixed cell-type sample and a full complement of V and J region oligonucleotide primers such as those disclosed herein, and each individual reaction also contains a single, different detectably labeled V region probe such as one of the labeled probes presented in Table 2, or a different subset of the labeled probes presented in Table 2 (e.g., 1 , 2, 3, 4, 5, 6, 7, 8, 9
or 10 different detectably labeled V region probes from Table 2). Detection of the presence of amplification products in one or more particular reactions permits determination of the degree of adaptive immune cell clonality in the sample from which template DNA was obtained.
The degree of adaptive immune cell clonality in a sample may in this manner be readily determined, without requiring isolation and sorting of adaptive immune cells, and without requiring (although not precluding, as provided by certain herein disclosed embodiments) DNA sequencing. In a solid tissue tumor sample containing TILs, for example, these and related
embodiments permit determination of whether the TIL population is
predominantly monoclonal or oligoclonal and thus represents a relatively small number of clones that have undergone extensive expansion via cellular (clonal) proliferation, or whether instead the TIL population is clonally diverse and thus heterogeneous with respect to adaptive immune receptor utilization.
Information from such analyses will usefully provide information concerning the physiological and pathological status of the tissue (and hence of the source subject), and will be particularly useful in situations where samples obtained before, during and/or after therapy are assayed, according to certain
embodiments described elsewhere herein. For instance, the degree of TIL clonality in a tumor tissue may provide diagnostic and/or prognostic information, including information regarding the potential efficacy of a therapeutic regimen or regarding the optimal dosing regimen. Similarly, the degree of TIL clonality in a tissue that is a target of autoimmune attack may usefully permit identification and refinement of clinical approaches to autoimmune disease.
Also provided herein according to certain embodiments is a method for determining a course of treatment for a patient in need thereof, comprising quantifying the relative representation of tumor-infiltrating
lymphocytes or lymphocytes infiltrating a somatic tissue that is the target of an autoimmune reaction, using the methods described herein. In this regard, the patient in need thereof may be a cancer patient or a patient having an
autoimmune disease. In certain embodiments, a patient may have a cancer including, but not limited to, colorectal, hepatocellular, gallbladder, pancreatic, esophageal, lung, breast, prostate, skin (e.g., melanoma), head and neck, renal cell carcinoma, ovarian, endometrial, cervical, bladder and urothelial cancer. In certain other embodiments, a patient may have an organ transplant, such as a liver transplant, a lung transplant, a kidney transplant, a heart transplant, a spleen transplant, a pancreas transplant, a skin transplant/graft, an intestine transplant, and a thymus transplant.
Autoimmune diseases include, but are not limited to, arthritis (including rheumatoid arthritis, reactive arthritis), systemic lupus erythematosus (SLE), psoriasis, inflammatory bowel disease (IBD) (including ulcerative colitis and Crohn's disease), encephalomyelitis, uveitis, myasthenia gravis, multiple sclerosis, insulin dependent diabetes, Addison's disease, celiac disease, chronic fatigue syndrome, autoimmune hepatitis, autoimmune alopecia, ankylosing spondylitis, fibromyalgia, pemphigus vulgaris, Sjogren's syndrome, Kawasaki's Disease, hyperthyroidism/Graves disease,
hypothyroidism/Hashimoto's disease, endometriosis, scleroderma, pernicious anemia, Goodpasture syndrome, Guillain-Barre syndrome, Wegener's disease, glomerulonephritis, aplastic anemia (including multiply transfused aplastic anemia patients), paroxysmal nocturnal hemoglobinuria, idiopathic
thrombocytopenic purpura, autoimmune hemolytic anemia, Evan's syndrome, Factor VIII inhibitor syndrome, systemic vasculitis, dermatomyositis,
polymyositis and rheumatic fever, autoimmune lymphoproliferative syndrome (ALPS), autoimmune bullous pemphigoid, Parkinson's disease, sarcoidosis, vitiligo, primary biliary cirrhosis, and autoimmune myocarditis.
The practice of certain embodiments of the present invention will employ, unless indicated specifically to the contrary, conventional methods in microbiology, molecular biology, biochemistry, molecular genetics, cell biology, virology and immunology techniques that are within the skill of the art, and reference to several of which is made below for the purpose of illustration.
Such techniques are explained fully in the literature. See, e.g., Sambrook, et al., Molecular Cloning: A Laboratory Manual (3rd Edition, 2001); Sambrook, et al., Molecular Cloning: A Laboratory Manual {2ηύ Edition, 1989); Maniatis et al., Molecular Cloning: A Laboratory Manual (1982); Ausubel et al., Current Protocols in Molecular Biology (John Wiley and Sons, updated July 2008); Short Protocols in Molecular Biology: A Compendium of Methods from Current Protocols in Molecular Biology, Greene Pub. Associates and Wiley- Interscience; Glover, DNA Cloning: A Practical Approach, vol. I & II (IRL Press, Oxford Univ. Press USA, 1985); Current Protocols in Immunology (Edited by: John E. Coligan, Ada M. Kruisbeek, David H. Margulies, Ethan M. Shevach, Warren Strober 2001 John Wiley & Sons, NY, NY); Real-Time PCR: Current Technology and Applications, Edited by Julie Logan, Kirstin Edwards and Nick Saunders, 2009, Caister Academic Press, Norfolk, UK; Anand, Techniques for the Analysis of Complex Genomes, (Academic Press, New York, 1992); Guthrie and Fink, Guide to Yeast Genetics and Molecular Biology (Academic Press, New York, 1991); Oligonucleotide Synthesis (N. Gait, Ed., 1984); Nucleic Acid Hybridization (B. Hames & S. Higgins, Eds., 1985); Transcription and
Translation (B. Hames & S. Higgins, Eds., 1984); Animal Cell Culture (R.
Freshney, Ed., 1986); Perbal, A Practical Guide to Molecular Cloning (1984); Next-Generation Genome Sequencing (Janitz, 2008 Wiley-VCH); PCR
Protocols (Methods in Molecular Biology) (Park, Ed., 3rd Edition, 2010 Humana Press); Immobilized Cells And Enzymes (IRL Press, 1986); the
treatise, Methods In Enzymology (Academic Press, Inc., N.Y.); Gene Transfer Vectors For Mammalian Cells (J. H. Miller and M. P. Calos eds., 1987, Cold Spring Harbor Laboratory); Harlow and Lane, Antibodies, (Cold Spring Harbor Laboratory Press, Cold Spring Harbor, N.Y., 1998); Immunochemical Methods In Cell And Molecular Biology (Mayer and Walker, eds., Academic Press, London, 1987); Handbook Of Experimental Immunology, Volumes l-IV (D. M. Weir and CC Blackwell, eds., 1986); Riott, Essential Immunology, 6th Edition, (Blackwell Scientific Publications, Oxford, 1988); Embryonic Stem Cells:
Methods and Protocols (Methods in Molecular Biology) (Kurstad Turksen, Ed., 2002); Embryonic Stem Cell Protocols: Volume I: Isolation and Characterization (Methods in Molecular Biology) (Kurstad Turksen, Ed., 2006); Embryonic Stem Cell Protocols: Volume II: Differentiation Models (Methods in Molecular Biology) (Kurstad Turksen, Ed., 2006); Human Embryonic Stem Cell Protocols (Methods in Molecular Biology) (Kursad Turksen Ed., 2006); Mesenchymal Stem Cells: Methods and Protocols (Methods in Molecular Biology) (Darwin J. Prockop, Donald G. Phinney, and Bruce A. Bunnell Eds., 2008); Hematopoietic Stem Cell Protocols (Methods in Molecular Medicine) (Christopher A. Klug, and Craig T. Jordan Eds., 2001); Hematopoietic Stem Cell Protocols (Methods in Molecular Biology) (Kevin D. Bunting Ed., 2008) Neural Stem Cells: Methods and
Protocols (Methods in Molecular Biology) (Leslie P. Weiner Ed., 2008).
Unless specific definitions are provided, the nomenclature utilized in connection with, and the laboratory procedures and techniques of, molecular biology, analytical chemistry, synthetic organic chemistry, and medicinal and pharmaceutical chemistry described herein are those well known and
commonly used in the art. Standard techniques may be used for recombinant technology, molecular biological, microbiological, chemical syntheses, chemical analyses, pharmaceutical preparation, formulation, and delivery, and treatment of patients.
Unless the context requires otherwise, throughout the present specification and claims, the word "comprise" and variations thereof, such as, "comprises" and "comprising" are to be construed in an open, inclusive sense, that is, as "including, but not limited to". By "consisting of is meant including, and typically limited to, whatever follows the phrase "consisting of." By
"consisting essentially of is meant including any elements listed after the phrase, and limited to other elements that do not interfere with or contribute to the activity or action specified in the disclosure for the listed elements. Thus, the phrase "consisting essentially of indicates that the listed elements are required or mandatory, but that no other elements are required and may or may
not be present depending upon whether or not they affect the activity or action of the listed elements.
In this specification and the appended claims, the singular forms "a," "an" and "the" include plural references unless the content clearly dictates otherwise. As used herein, in particular embodiments, the terms "about" or "approximately" when preceding a numerical value indicates the value plus or minus a range of 5%, 6%, 7%, 8% or 9%. In other embodiments, the terms "about" or "approximately" when preceding a numerical value indicates the value plus or minus a range of 10%, 11 %, 12%, 13% or 14%. In yet other embodiments, the terms "about" or "approximately" when preceding a numerical value indicates the value plus or minus a range of 15%, 16%, 17%, 18%, 19% or 20%.
Reference throughout this specification to "one embodiment" or "an embodiment" or "an aspect" means that a particular feature, structure or characteristic described in connection with the embodiment is included in at least one embodiment of the present invention. Thus, the appearances of the phrases "in one embodiment" or "in an embodiment" in various places
throughout this specification are not necessarily all referring to the same embodiment. Furthermore, the particular features, structures, or characteristics may be combined in any suitable manner in one or more embodiments.
It should also be noted that the term "or" is generally employed in its sense including "and/or" {i.e., to mean either one, both, or any combination thereof of the alternatives) unless the content clearly dictates otherwise. The term, "at least one," for example, when referring to at least one compound or to at least one composition, has the same meaning and understanding as the term, "one or more." In addition, any ranges provided herein include all the values in the ranges.
The following examples are for illustration and are not limiting.
EXAMPLES EXAMPLE 1
QUANTIFICATION OF RELATIVE T LYMPHOCYTE DNA REPRESENTATION FROM T CELLS IN NORMAL TISSUES AND FROM TUMOR-INFILTRATING T LYMPHOCYTES IN A TUMOR
SAMPLE
Samples of peripheral blood, fresh adipose biopsies, frozen muscle biopsy, and skin biopsies were processed for DNA extraction using the following procedure:
Samples of 1 x 10⁴ to 1 x 10⁶ fresh, frozen, or fixed cells were lysed in 200 ul of lysis buffer (50 mM TrisHCI pH7.4, 250 mM NaCI, 0.1% SDS, 0.5% Triton-X100) and 20 ul of proteinase K (10 mg/ml) using the kitted ATL buffer and proteinase K reagents from the Qiagen Blood and Tissue kit (Qiagen #69504, Qiagen Corp., Valencia, CA), and incubated at 56° C for one hour with mixing every 20 minutes. The lysate was diluted with 200 ul of an
ethanol/buffer mixture (20 mM Tris, pH 7.5, 2.0 mM EDTA, in 50% v/v ethanol) and mixed briefly. Alternatively, the AL buffer of the Qiagen Blood and Tissue kit was used. SDS precipitates formed on occasion, but were not observed to adversely impact DNA extraction or sequencing efficiency. To the diluted lysate was added 200 ul of ethanol (96-100%).
The lysate/ethanol mixture was carefully applied to a solid support of either silica resin Sigma Celite 454 resin (Sigma #419931 , Sigma, St. Louis, MO) or to a Qiagen Blood and Tissue kit column. The column was centrifuged at 6000 x g for one minute in a micro-centrifuge and the filtrate was discarded. The column was washed with 500 ul of Qiagen AW1 wash buffer, or 6M guanidine thiocyanate (GuSCN), 20 mM EDTA pH 8.0, 10 mM Tris-HCI pH 6.4, 4% Triton X-100 in 50% ethanol (v/v), and was then centrifuged at 6000 x g in a microcentrifuge for one minute. The filtrate was discarded the filtrate and the column was washed with 500 ul of Qiagen AW2 wash buffer or 100 mM Tris,
pH 7.5 in 70 ethanol (v/v), after which the column was centrifuged at 14,000 x g for three minutes, and the filtrate discarded.
Next, the column was centrifuged at 14,000 x g for one minute to dry the column of residual ethanol. 100 ul of either Qiagen AE elution buffer, or 10 mM Tris, pH 7.5, 1 mM EDTA, was applied to the column, which was placed on a clean collection tube, incubated at room temperature for five minutes, and then centrifuged at 6000 x g for one minute to collect DNA. An aliquot of 2 ul of the eluate was transferred to a clean tube or 96 well plate to determine yield by spectrophotometry (A260 A280) and the DNA concentration was calculated. An aliquot of 5 ul of the DNA-containing eluate was transferred to a 96 well plate and diluted with 20 ul TE for processing by qPCR.
The number of T cells in complex mixtures of tissues was estimated by determining the relative representation of T cell DNA in the samples of peripheral blood (PBMC), and in muscle, skin and adipose tissue biopsies, by quantitative PCR amplification of the rearranged TCR-β (TCRB) genes. The relative representation of T cell genomes in each tissue sample was determined by comparing the tissue sample qPCR signal profile to a calibration standard profile generated using a panel of T cell DNAs of known concentrations, and then comparing the values so obtained to the total DNA concentration of the tissue. The percent T cell composition of the tissues ranged from less than 1% in adipose tissue to greater than 92% in PBMC (Table 3).
Table 3. Quantitative PCR Amplification/T Cell Quantification in Tissues by Relative Representation of Adaptive Immune Receptor DNA as a Component of Tissue DNA
measured Total DNA
T cells concentration
samplelD (nanograms) (nanograms) Percent T cells
SKIN RB 8/11/11 7.43 14.85 50.0
SKIN RB 9/8/11 2.46 18.46 13.3
SKIN TB 7/13/11 1.52 19.95 7.6
MUSCLE 1995- 2-6 0.13 3.06 4.32
MUSCLE 1995- 8- 0.05 2.24 2.23 12
MUSCLE 2062- 2-6 4.18 6.62 63.18
MUSCLE 2062- 8- 2.20 8.02 27.47 12
MUSCLE 2417- 2-6 0.47 4.94 9.50
MUSCLE 2417- 8- 0.07 4.64 1.47 12
MUSCLE 2426- 2-6 0.17 4.35 4.02
MUSCLE 2426- 8- 0.21 6.31 3.34 12
MUSCLE 2444- 2-6 0.02 3.29 0.68
MUSCLE 2444- 8- 0.16 13.79 1.19 12
MUSCLE 2450- 2-6 2.33 4.42 52.78
MUSCLE-2450- 8- 1.51 5.22 28.90 12
PBMC 9 15.52 90.55 17.14
PBMC 8 87.59 124.32 70.45
PBMC 7 10.42 42.97 24.26
PBMC 6 115.52 125.33 92.17
PBMC 5 21.15 46.09 45.88
PBMC 4 36.35 130.00 27.96
PBMC 3 10.81 142.16 7.60
PBMC 14 11.14 49.08 22.70
PBMC 11 94.22 223.56 42.14
ADIPOSE 8-SQ 0.50 10.55 4.70
ADIPOSE 8-OM 1.90 19.34 9.84
ADIPOSE 6-SQ 0.43 11.22 3.80
ADIPOSE 6-OM 0.64 19.14 3.35
ADIPOSE 4-SQ 0.20 8.22 2.39
ADIPOSE 4-OM 3.49 34.23 10.21
ADIPOSE 2-SQ 0.83 11.62 7.14
ADIPOSE 2-OM 1.00 18.39 5.44
ADIPOSE 17-SQ 2.44 11.59 21.10
ADIPOSE 17-OM 0.24 18.94 1.27
ADIPOSE 16-SQ 0.72 6.13 11.79
ADIPOSE 16-OM 0.96 33.66 2.85
qPCR
measured Total DNA
T cells concentration
samplelD (nanograms) (nanograms) Percent T cells
ADIPOSE 14-SQ 0.23 8.97 2.56
ADIPOSE 14-OM 1.60 10.57 15.13
ADIPOSE 11 -SQ 0.60 9.67 6.22
ADIPOSE 11 -OM 0.06 60.21 0.10
ADIPOSE 10-SQ 2.50 1 1.51 21.70
ADIPOSE 10-OM 0.63 105.50 0.60
EXAMPLE 2
QUANTIFICATION OF TUMOR-INFILTRATING T LYMPHOCYTES IN A TUMOR SAMPLE
USING A TCR V-REGION SPECIFIC QPCR PROBE
Tumor-infiltrating T lymphocytes (TILs) were quantified using a multiplex real-time PCR assay as follows.
Multiplex primer sequences: The multiplex oligonucleotide primer sets that were used had the sequences shown in Table 1. The "r" in Table 1 B represents a ribonucleotide base in the oligonucleotide sequence and "/3SpC3/" represents a 3' three carbon spacer on the hydroxyl group preventing polymerase extension and amplification. The DNA repair endonuclease cleaves the oligonucleotide at the ribonucleotide after hybridization to a complementary sequence, creating an unblocked hydroxyl group that can be extended by a polymerase.
Assay reagents: 20 μΙ PCR reactions were set up having final concentrations of 1X Taq polymerase buffer, 10 ng/ul analyte DNA, 1
micromolar TCRBV_RN2 oligonucleotide primer mix (Table 1), 1 micromolar TCRBJ_RN2 oligonucleotide primer mix (Table 1), and 0.1 milliunits/ul of
RNAse H2 (IDT, Coralville, IA). Analytes and standard PCR reactions were set up in quadruplicate.
Thermal cycling conditions: Reactions were thermal cycled on a real time PCR platform (lllumina Eco™, lllumina Inc., San Diego, CA) with the
amplification profile of 95°C for 5 minutes, followed by 80 cycles of incubations at 95°C for 15 seconds, 58°C for 30 seconds. Following thermocycling, a melt curve was collected at 55°C for 15 seconds.
Standards (See Table 4.) Purified T cell DNA was extracted from TCRa -positive bead-sorted peripheral blood cells (Miltenyi 130-091-236), then serially diluted and used in the thermal cycling reaction conditions as described above at concentrations ranging from 60 picograms to 250
nanograms per reaction.
Data analysis: A standard curve was calculated for each replicate of the DNA standards and evaluated for consistency by calculating the r2. The Ct was determined for each replicate of the analytes, then averaged and evaluated for consistency by calculating the standard deviation. The average T cell concentration of each analyte was determined by extrapolating from the standard curve using the Cq for each replicate. In particular, in order to measure the number of TCR genomes, it was assumed that there was 3pg DNA/cell. Once the amount of starting DNA was calculated using real-time qPCR with the standards as described in Table 4, it was possible to calculate the number of TCR genomes in the sample.
Figure 1A shows a sample output from a TIL qPCR experiment demonstrating the amplification profile of standard T cell DNA (shown as gray traces in the Amplification plot) and TIL samples (shown as black traces) as measured by the RFU (relative fluorescent units) of SYBR green incorporated in the amplification products. T cell sample DNA was obtained from peripheral blood and tissues by purification on a silica matrix (Qiagen 69504). The Ct values of the standards, calculated from the cycle at which the standard DNA amplification profile reached the threshold of exponential amplification (indicated by the horizontal line), were fitted to a standard curve (Fig. 1 B) which was used to extrapolate the concentration of T cells in the complex mixtures of peripheral blood DNA. The Cq values were determined for the standards of known DNA concentrations, measured in four replicate amplifications, and are
shown as circles in the standard curve plot (Fig. 1 B). The T cell DNA concentrations of the peripheral blood and tissue (tumor) samples, indicated by Xs, were determined from the best fit of the log of the standard DNA concentration plotted against standard DNA Cq value.
The DNA concentration of T cell genomes in a complex mixture of solid tumor DNA was thus measured by comparing the Ct value from the sample to the Ct values obtained from known quantities of purified T cell DNA. The Ct values of the standards were obtained from the amplification plot and were then used to prepare the standard curve from which the corresponding T cell concentration was determined for the tumor DNA samples (Table 4).
Table 4. TILs Quantified by Relative Representation of Rearranged TCR Encoding DNA in Tumor DNA Sample
estimated T cell
TCRB starting cone, DNA concn.
SamplelD Replicate Ct (ng/ul) (ng/ul)
GV-INF1-D+508 B 44 3.01 E+02
GV-INF1-D+508 C 45.22 1.11 E+02
GV-INF1-D+508 D 44.18 2.61 E+02
The presently described method provided a quantitative and highly sensitive method for enumerating T or B cell genomes in samples where such analysis was previously not possible, such as formalin fixed or frozen samples. The present methods were sensitive enough to detect as low as picogram quantities of T or B cell genomes (e.gf, fewer than 100 T or B cells in a complex mixture of non-T or non-B cells, such as a solid tumor).
Table 5. T cell standards
QUANTIFICATION OF TUMOR-INFILTRATING T LYMPHOCYTES IN A TUMOR SAMPLE
USING A V7-SPECIFIC QPCR PROBE TCRB V7+ tumor-infiltrating T lymphocytes are quantified using a multiplex real-time PCR assay as follows.
Multiplex primer sequences: The multiplex primer sequences are provided in Table 1. The "r" represents a ribonucleotide base in the oligonucleotide sequence and 73SpC3/" represents a 3' three carbon spacer on the hydroxyl group preventing polymerase extension and amplification. The DNA repair endonuclease cleaves the oligonucleotide at the ribonucleotide after hybridization to a complementary sequence, creating an unblocked hydroxyl group that can be extended by a polymerase.
Assay reagents (volumes and concentrations): The assay consists of a 20 μΙ PCR reaction at final concentrations of 1X Taq polymerase buffer, 10 ng/ul analyte DNA, 1 micromolar TCRBV_RN2 oligonucleotide primer mix, 1 micromolar TCRBJ_RN2 oligonucleotide primer mix) 100 nanomolar TaqMan™ probe (SEQ ID NO:66), 0.1 milliunits/ul of RNAse H2 (IDT).
Analytes and standard PCR reactions are set up in quadruplicate.
Thermal cycling conditions: Reactions are thermal cycled on a real time PCR platform (such as the lllumina Eco™ or Bio Rad CFX384) with the amplification profile of 95°C for 5 minutes, followed by 80 cycles of incubations at 95°C for 15 seconds, 58°C for 30 seconds. Following
thermocycling, a melt curve is collected at 55°C for 15 seconds.
Standards (See Table 5.) Purified T cell DNA is extracted from
TCRap positive bead-sorted peripheral blood cells (Miltenyi 130-091-236), then serially diluted and used in the thermal cycling reactions as described above at concentrations ranging from 60 picograms to 250 nanograms per reaction.
Data analysis: A standard curve is calculated for each replicate of the DNA standards and evaluated for consistency by calculating the r2. The
cycle threshold, Ct, is determined for each replicate of the analytes, then averaged and evaluated for consistency by calculating the standard deviation. The average T cell concentration of each analyte is determined by extrapolating from the standard curve using the Cq for each replicate. In particular, in order to measure the number of V7+ TCR genomes, it is assumed that there is 3 pg DNA cell. Once the amount of starting DNA is calculating using real-time qPCR with the standards as described in Table 2, it is possible to calculate the number of TCR genomes in the sample.
The present Example demonstrates the quantitative and highly sensitive method for enumerating TCRB V7+ T cells in a mixed population of cells.
EXAMPLE 4
QUANTIFICATION OF TCRB V18+ AND TCBV19+ TUMOR-INFILTRATING T
LYMPHOCYTES IN A BUFFY COAT SAMPLE USING DPCR
TCRB V18+ and V19+ tumor-infiltrating T lymphocytes were quantified in a buffy coat sample using a digital PCR (dPCR) assay as described herein, with RNase P as an internal control as follows.
Equipment:
QX100 Droplet Digital PCR System (Bio-rad, Item No. 186-3001) Heat Sealer (Eppendorf, Item No. 951023078)
Primer and probe sequences: The following primers and probes were used for the dPCR assay:
V region (forward) primers
V18-specific: ATTTTCTGCTGAATTTCCCAAAGAGGGCC (SEQ
ID NO:686)
V19-specific: TATAGCTGAAGGGTACAGCGTCTCTCGGG (SEQ ID NO:843, have TATA 5' upstream of TRBV19 SEQ ID NO:656)
J region (reverse) primers
J 1 -1 TTACCTACAACTGTGAGTCTGGTGCCTTGTCCAAA (SEQ ID NO:696)
J 1-2 ACCTACAACGGTTAACCTGGTCCCCGAACCGAA (SEQ
ID NO:880)
J 1 -3 ACCTACAACAGTGAGCCAACTTCCCTCTCCAAA (SEQ ID NO:881)
J1-4 CCAAGACAGAGAGCTGGGTTCCACTGCCAAA (SEQ ID NO:882
J1-5 ACCTAGGATGGAGAGTCGAGTCCCATCACCAAA (SEQ ID NO:700)
J1-6 CTGTCACAGTGAGCCTGGTCCCGTTCCCAAA (SEQ ID
J2-1 CGGTGAGCCGTGTCCCTGGCCCGAA (SEQ ID NO:702)
J2-2 CCAGTACGGTCAGCCTAGAGCCTTCTCCAAA (SEQ ID
J2-3 ACTGTCAGCCGGGTGCCTGGGCCAAA (SEQ ID
J2-4 AGAGCCGGGTCCCGGCGCCGAA (SEQ ID NO:705)
J2-5 GGAGCCGCGTGCCTGGCCCGAA (SEQ ID NO:706)
J2-6 GTCAGCCTGCTGCCGGCCCCGAA (SEQ ID NO:707)
J2-7 GTGAGCCTGGTGCCCGGCCCGAA (SEQ ID NO:708)
TCRB V region probes
V18-specific: FAM-ATCCAGCAGGTAGTGCGAGG-MGB (SEQ ID
NO:796)
V19-specific: FAM-CACTGTGACATCGGCCCAA-MGB (SEQ ID NO:797)
RNaseP primers and probe
RNaseP forward primer: AGATTTGGACCTGCGAGC (SEQ ID
NO:840)
RNaseP reverse primer: GAGCGGCTGTCTCCACAAGT (SEQ
ID NO:841)
RNaseP-VIC probe: CCGCGCAGAGCCTTC (SEQ ID NO:842)
Assay reagents:
The reaction mixture contained 900 nM V18-specific forward primer (or V19-specific forward primer), 900 nM each of the 13 J region reverse primers, 900 nM RNaseP forward primer, 900 nM RNaseP reverse primer, 250 nM V18-specific Taqman™ probe (or V19-specific probe) with FAM
fluorophore, 900 nM RNaseP probe with VIC fluorophore, 0-100 ng sample DNA, and ddPCR supermix (Catalogue No. 186-3027 from Bio-RAD, Hercules, USA). Bulk reaction volumes were converted into 1 nl_ droplet-in-oil
immersions with the QX100 ddPCR System Droplet Generator (Bio-Rad) via the standard vendor's protocol. Droplets were cycled with the following conditions: 95°C for 10 min, followed by 50 cycles of 94°C for 30 sec and 61 °C for 1 min, then held at 10°C. Droplets were individually analyzed for
fluorescence by flow cytometry in the QX100 ddPCR System Droplet Reader (Bio-Rad) according to the manufacturer's instructions. A threshold was set between highly fluorescent droplets (containing target molecules) and less fluorescent droplets (without target molecules), and the concentrations of target molecules were calculated by Poisson statistics to quantify T cells (FAM) and total cells (VIC) in each well.
Data analysis:
The data were analyzed using QuantaSoft™ software. QuantaSoft™ calculated FAM and VIC concentration values for each well. Florescence thresholds were set so that they were above the negative droplets and below the positive droplets.
The data can be reported in two different ways. The first reports the ratio of genomes with rearranged TCRB genes to total diploid genomes. This ratio is computed by dividing the number of molecules with a TCRB rearrangement, as determined by PCR amplification and V specific probes, by half the number of RNaseP genes, as determined by PCR amplification and RNaseP specific probes. The factor of a half is required because each diploid genome has two RNaseP genes. Data reported in this manner are described in this example.
Alternatively, a second set of data can be reported. This is output as an estimation of the fraction of T cells in a sample. Approximately 80% of αβ T cells have only one of their two TCR alleles rearranged. The other 20% have both alleles rearranged, with one of the two being productively rearranged and the other non-productively rearranged. Other cell types lack the TCRp rearrangement. Hence, an accurate count of the number of TCRp
rearrangements in a sample of cells is directly proportional to the number of T cells within that mix. To approximate the number of T cells in the sample, the total count of TCRB rearrangements is divided by 1.2. So, this second data analysis is equal to the first count described above divided by 1.2.
Figure 3 shows a sample output from a TIL dPCR experiment using buffy coat DNA as the template. Each data point represents a single dPCR specific reaction for the V18, V19 or RNaseP gene segment. Droplets were assigned as positive or negative based on their fluorescence amplitudes. The number of positive and negative droplets in each channel was used to calculate the concentration of target molecules and the Poisson-based confidence intervals to enumerate the V gene segment-specific T lymphocyte population. In this sample, 0.6% of the sample was composed of V18-specific T lymphocytes, while 1.2% of the sample was V19-specific T lymphocytes.
EXAMPLE 5
DPCR-BASED DETECTION OF TUMOR-INFILTRATING LYMPHOCYTES
Tumor-infiltrating T lymphocytes were quantified by detecting rearranged DNA encoding TCRB using a digital droplet PCR (dPCR) assay with the RNase P gene as an internal control as follows.
Equipment:
QX100 Droplet Digital PCR System (Bio-rad, Item No. 186-3001) Heat Sealer (Eppendorf, Item No. 951023078)
Primer and probe sequences: The following primers and probes were used for the dPCR assay:
V region (forward) primers
V06-6 GAC AAA GGA GAA GTC CCG AAT GGC TAC AAC 675
V06-7 GTT CCC AAT GGC TAC AAT GTC TCC AGA TC 855
V06-8 CTC TAG ATT AAA CAC AGA GGA TTT CCC AC 856
V06-9 AAG GAG AAG TCC CCG ATG GCT ACA ATG TA 692
V07-1 TCC CCG TGA TCG GTT CTC TGC ACA GAG GT 857
V07-2 AGT GAT CGC TTC TCT GCA GAG AGG ACT GG 858
V07-3 GGC TGC CCA ACG ATC GGT TCT TTG CAG T 859
V07-4 GGC GGC CCA GTG GTC GGT TCT CTG CAG AG 860
V07-6/7 ATG ATC GGT TCT CTG CAG AGA GGC CTG AGG 861
V07-8 GCT GCC CAG TGA TCG CTT CTT TGC AGA AA 862
V07-9 GGT TCT CTG CAG AGA GGC CTA AGG GAT CT 863
V09 GTT CCC TGA CTT GCA CTC TGA ACT AAA C 864
V10-1 AAC AAA GGA GAA GTC TCA GAT GGC TAC AG 865
V10-2 GAT AAA GGA GAA GTC CCC GAT GGC TAT GT 866
V10-3 GAC AAA GGA GAA GTC TCA GAT GGC TAT AG 867
V11-1/2/3 CTA AGG ATC GAT TTT CTG CAG AGA GGC TC 868
V12-3/4 TCG ATT CTC AGC TAA GAT GCC TAA TGC 869
V12-5 TTC TCA GCA GAG ATG CCT GAT GCA ACT TTA 870
V13 CTG ATC GAT TCT CAG CTC AAC AGT TCA GT 871
V14 TCT TAG CTG AAA GGA CTG GAG GGA CGT AT 650
V15 GCC GAA CAC TTC TTT CTG CTT TCT TGA C 872
V16 TTC AGC TAA GTG CCT CCC AAA TTC ACC CT 873
V18 ATT TTC TGC TGA ATT TCC CAA AGA GGG CC 686
V19 TAT AGC TGA AGG GTA CAG CGT CTC TCG GG 874
V20-1 ATG CAA GCC TGA CCT TGT CCA CTC TGA CA 875
V24-1 ATC TCT GAT GGA TAC AGT GTC TCT CGA CA 876
V25-1 TTT CCT CTG AGT CAA CAG TCT CCA GAA TA 877
42 V27 TCC TGA AGG GTA CAA AGT CTC TCG AAA AG 878
43 V28 TCC TGA GGG GTA CAG TGT CTC TAG AGA GA 652
44 V29-1 CAT CAG CCG CCC AAA CCT AAC ATT CTC AA 685
45 V30 GAC CCC AGG ACC GGC AGT TCA TCC TGA GT 879
J region (reverse) primers
The J region reverse primers were the same as in Example 4. TCRB V region probes
All probes included a minor groove binder (MGB) and had a FAM fluorophore on the 5' end.
V06b V06-7, CTGGAGTCAGCTGCTCCC 823 V06-9
V06c V06-4 CACAGATGATTTCCCCCTC 837
V06d V06-1 , TGCTCCCTCCCAGACATC 81 1
V06-5,
V06-6,
V06-8,
V06-9
V07a1 V07-1 CTGAAGTTCCAGCGCACA 838
V07a2 V07-2 TCCGTCTCCACTCTGACGA 839
V07b V07-3, ACTCTGAAGATCCAGCGCA 824
V07-4,
V07-8
V07c V07-4, TCCAGCGCACAGAGCA 825
V07-6,
V07-9
V07d V07-7 CAGCGGGACTCAGCCA 829
V09 V09 TGAGCTCTCTGGAGCTGG 815
V10a1 V10-1 TCAAACACAGAGGACCTCCC 830
V10a2 V10-2 CACTCTGGAGTCAGCTACCC 831
V10b V10-3 TCACTCTGGAGTCCGCTACC 787
V11 V11-1 , AGTAGACTCCACTCTCAAGATCCA 788
V11-2,
V1 1-3
V12c V 2-3, ATCCAGCCCTCAGAACCCAG 791
V12-4,
V12-5
V13 V13 ACATGAGCTCCTTGGAGCTG 792
V14 V14 TGCAGAACTGGAGGATTCTGG 793
V15 V15 TGTACCTGTGTGCCACCAGC 794
26 V16 V16 CCTTGAGATCCAGGCTACG 816
27 V18 V18 ATCCAGCAGGTAGTGCGAGG 796
28 V19 V19 CACTGTGACATCGGCCCAA 797
29 V20 V20-1 CAGTGCCCATCCTGAAGACA 798
30 V24 V24-1 TGTCCCTAGAGTCTGCCATCC 800
31 V25 V25-1 CAGGCCCTCACATACCTCTC 801
32 V27 V27-1 TGGAGTCGCCCAGCC 818
33 V28 V28 AGGAGCGCTTCTCCCTG 819
34 V29 V29-1 TGTGAGCAACATGAGCCCTG 804
35 V30 V30 TCCTTCTCAGTGACTCTGGC 820
RNaseP primers and probe.
The RNase P primers and probe were the same as in Example 4. Assay reagents: The assay reagents were prepared as follows: V region primer/probe mix
The V region (forward) primers and Taqman probes were assigned to 8 different subgroups (A through H). Each subgroup contained 3 to 4 probes and 4 to 7 corresponding primers, allowing each subgroup to specifically detect a subset of T-cell rearrangements. The subgroups were as follows:
Although eight subgroups (A-H) were prepared as described herein with subsets of primers and probes, other embodiments are contemplated in which all probes and primers may be present in a single
reaction or in 7, 6, 5, 4, 3 or 2 reactions, or alternatively in a greater number of reactions, where the number of reactions may vary as a function of herein described parameters that may be altered for particular assay configurations, such as concentrations of the assay components, amplification cycle steps, instrumentation capacity and capabilities, and other factors. For each subgroup described in this example, a 20X stock mix was made. Primer concentrations were 18 μΜ each in the stock, and 900 nM in the final reaction volume. Probe concentrations were 5 μΜ each in the stock, and 250 nM in the final reaction volume. For example, a recipe for a 20X stock of the subgroup A primer/probe mix was as follows:
J region primer mix
All 13 J region (reverse) primers were combined into a 20X stock. Primer concentrations were 18 μΜ each in the stock, and 900 nM in the final reaction volume. The recipe was as follows:
J2-5 reverse primer (1000 μΜ) 3.6
J2-6 reverse primer (1000 μΜ) 3.6
J2-7 reverse primer (1000 μΜ) 3.6
Nuclease-free water 153.2
Total 200
RNaseP reference assay mix
RNaseP was used as a reference gene to quantify the number of cells interrogated. The RNaseP gene was known to be present at two copies per diploid genome.
The 20X RNaseP reference assay stock was prepared as follows:
Bulk dPCR volumes
Before droplet generation, bulk dPCR volumes were prepared. A bulk dPCRs was prepared with each well having the following recipe:
A typical plate was configured as shown in Figure 4. Samples 1 through 10 were the experimental samples. The negative control was genomic DNA from a source where no detection of T-cell rearrangements was expected (e.g., HT29 human colon adenocarcinoma cells, a non-lymphoid cancer cell
no
line, catalogue number HTB-38™, American Type Culture Colleciton,
Manassas, VA), and the "no template control" (NTC) group used water in place of DNA.
1) To set-up the plate, primary mastermix was created:
2) Then individual mastermixes for each assay subgroup were created:
3) Each subgroup mastermix was pipetted into all appropriate wells, and then the sample DNA (or water for NTC wells) was pipetted in each well of the indicated column:
4) The plate was sealed with a removable foil PCR sheet and briefly spun in a centrifuge (e.g., 1000 x g for 5 seconds) to make sure the dPCR bulk reaction volumes were at the bottom of each well.
Droplet Generation:
Wells of a DG8 cartrige were each loaded with 20 μί. of reaction mixture. Droplets were generated and transferred into a fresh Eppendorf twin.tec PCR plate (Eppendorf, Order No. 0030 128.648). The plate was then heat-sealed.
Thermal cycling conditions:
The thermal cycling conditions were the same as described above in Example 4.
Data analysis:
The data were analyzed using QuantaSoft™ software (Bio-Rad, Hercules, CA). QuantaSoft™ calculated FAM and VIC concentration values for each well. Florescence thresholds were set so that they were above the negative droplets and below the positive droplets. To determine the fraction of cells with TCRs of a given subgroup in a given well, the following formula was used:
Fraction of Cells with TCRs (subgroup X) = 2*(FAM concentration)/(VIC concentration)
The above formula was applied to a sample data set to determine % TIL and the results were as follows:
DPCR-BASED DETECTION AND CHARACTERIZATION OF TUMOR-INFILTATING
LYMPHOCYTES IN A LEUKEMIA PATIENT Digital PCR reactions in this example were performed essentially as described above in Examples 4 and 5. In pilot studies, subgroups A-H mastermixes were processed for thermal cycling as described above using template DNA (20ng/pL) from either isolated human peripheral blood T cells of a healthy donor or from HT29 cells, or no-template controls (NTC), with FAM signal for TCR and VIC for the internal control Rnase P gene as described above. Figure 5A shows representative data for the eight subgroups, in which pronounced detection of amplification products can be seen when T cell DNA templates were present, with virtually no background signal detectable when non-lymphoid HT29 DNA was used as the template, or when no template was present (NTC). Each data point represents a single dPCR specific reaction for the probes of subgroups A through H. Droplets are assigned as positive (above horizontal separation lines) or negative (below horizontal separation lines) based on their fluorescence amplitudes. The number of positive and negative droplets in each channel was used to calculate the concentration of target molecules and the Poisson-based confidence intervals to enumerate the V gene segment-specific T lymphocyte population.
Tumor-infiltrating T lymphocytes in a sample from a patient with T cell acute lymphocytic leukemia (T-ALL) were quantified using a dPCR assay with the RNase P gene as an internal control, essentially as described above according to Example 5. For use as amplification template, DNA was extracted from a bone marrow sample taken prior to treatment of the patient. The results of dPCR using 8 different subgroups of probes and primers (A through H) and DNA from the sample are shown in Figure 5B. Each data point represents a single dPCR specific reaction for the probes of subgroups A through H.
Droplets are assigned as positive (above horizontal separation lines) or
negative (below horizontal separation lines) based on their fluorescence amplitudes. The number of positive and negative droplets in each channel was used to calculate the concentration of target molecules and the Poisson-based confidence intervals to enumerate the V gene segment-specific T lymphocyte population. The results showed that a majority (79.7%) of the cells from the sample of the patient had the rearranged νβ segment(s) of subgroup A. Similar evidence of clonal overrepresentation within a subgroup was also
independently observed when template DNA from another T-ALL patient was analyzed in the dPCR assay for quantifying T cells in the sample by TCRB rearrangement; in that patient a pronounced signal representing >90% of cells was detected in subgroup B. By contrast, when template DNA from a patient diagnosed with early thymic precursor (ETP) T-ALL was used in the dPCR method, substantially no rearranged TCRB FAM signal was detectable, consistent with TCR gene rearrangement not having yet taken place in ETP cells that occur as the predominant clonal population in ETP T-ALL (Fig. 5C).
EXAMPLE 7
PREFERENTIAL USE OF DIFFERENT VB GENE SEGMENTS BY CD4+ AND CD8+ CELLS
For each Vp segment, the frequency is calculated with which productively rearranged TCR sequences in each of the CD4+ samples are used (CD4+ and CD8+ T cell populations were sorted using a FacsARIA, BD
Biosciences, San Jose, CA), and the mean value of these frequencies is taken to be the population mean usage for that Vp segment. This value is compared to the usage of each segment in CD8+ T cells. Many of the individual Vp segments are preferentially used more frequently in either CD4+ cells relative to their usage in CD8+ cells, or in CD8+ cells relative to their usage in CD4+ cells. To assess statistical significance of such preferential usage, a two-tailed unpaired t-test for difference of means is performed. 21 of 48 measured Vp segments have differential usage between CD4+ and CD8+ samples, indicating
that T cell subpopulation differentiative pathways influence the frequency with which TCR gene rearrangements bearing certain particular V gene segments survive the selection process.
Having established the existence of TCR sequence features that distinguish CD4+ from CD8+ T cells, a computational method was developed to estimate the proportion of T cells that are CD4+ in an unknown sample using TCR sequence data alone. Briefly, a usage frequency for each \/β segment was calculated for CD4+ and CD8+ T cells using flow-sorted samples from 42 subjects. These values were used to train a likelihood model which treats each observed TCR sequence as independent and uses the observed means as generative probabilities.
To determine the likelihood of new data under this model, a proportion of CD4+ T cells, p, is assumed. The observed mean usage for each νβ segment in the training data for CD4+ T cells is taken to be the same as the probability of an unknown CD4+ T cell using that segment, and likewise for CD8+ T cells. Thus, the likelihood of observing in new data a single sequence with a given \ β segment is calculated as:
[p * P(V\CD4)] + [(l - p) * P(V\CD8)] The likelihood of a dataset is calculated as the product of the likelihoods of its constituent sequences. To determine the proportion of CD4+ T cells in new data, the likelihood of the new data is calculated at each p from 0 to 1 with a granularity of 0.01 , and the value of p leading to the highest likelihood of the observed data is chosen as the estimate of the proportion of CD4+ T cells in the sample.
EXAMPLE 8
DPCR-BASED DETECTION AND CLONALITY ANALYSIS OF TUMOR-INFILTRATING
LYMPHOCYTES IN CERVICAL TUMOR BIOPSIES This example describes quantitative digital droplet PCR
quantification of TIL in three fresh-frozen solid human ovarian tumor samples obtained from distinct sites of the same tumor from the same cervical cancer patient. Genomic DNA was extracted from tumor punch biopsies using a proteinase K digest and solid-phase reversible immobilization, magnetic bead technology (Agencourt #A41497) on a Biomek™ FX workstation according to the manufacturers' instructions. Following extraction, the DNA yield and purity were assessed using UV spectral analysis on a Trinean DropSense™ spectrophotometer by measuring the UV absorbance at 260 nm (A260) and 280 nm (A28o)- DNA samples were then processed for quantitative digital droplet PCR. Tumor-infiltrating T lymphocytes in these three biopsies were quantified using a dPCR assay with the RNase P as an internal control and eight subgroups of TCRB probes and primers (subgroups A through H), essentially as described above in Example 5. The results are summarized in Figure 6, which shows low variability in the TIL percentages and degrees of clonality that were detected according to the herein described methods in these three different biopsy samples, despite their being obtained from distinct sites in the tumor. These results demonstrate that there was low variation in TIL
percentage (0.8% -2.3%) and low variation between biopsy samples as indicated by the degree of T cell receptor sequence, and hence T cell clonal, diversity (shown as the percent of each T cell class in A-H).
EXAMPLE 9
DETERMINING ACCURACY OF DPCR-BASED ASSAY ACROSS A LARGE SENSITIVITY
RANGE The accuracy of dPCR-based TIL quantification was performed using DNA from various dilutions of T cells, either in the presence or absence of 4000 MRC5 cells (a normal human lung cell line), to simulate a range of TIL detection down to roughly one T cell in a background of 1000 human cells.
Digital PCR was performed using TCRB- and RNase P-specific primers essentially as described above in Examples 4 and 5. Figure 7 shows that dPCR-based TIL quantification was accurate across a large dynamic range of T cell representation in a mixed cell population.
The various embodiments described above can be combined to provide further embodiments. All of the U.S. patents, U.S. patent application publications, U.S. patent applications, foreign patents, foreign patent
applications and non-patent publications referred to in this specification and/or listed in the Application Data Sheet herein by reference, in their entirety.
Aspects of the embodiments can be modified, if necessary to employ concepts of the various patents, applications and publications to provide yet further embodiments.
These and other changes can be made to the embodiments in light of the above-detailed description. In general, in the following claims, the terms used should not be construed to limit the claims to the specific
embodiments disclosed in the specification and the claims, but should be construed to include all possible embodiments along with the full scope of equivalents to which such claims are entitled. Accordingly, the claims are not limited by the disclosure.