PROGNOSTIC MARKER SETS FOR PROSTATE CANCER
Cross-reference to Related Applications
This application claims the benefit of United States Provisional Patent Application USSN 61/452,439 filed March 14, 201 1 , the entire contents of which is herein incorporated by reference.
Field of the Invention
The present invention is related to prostate cancer, more particularly to methods and markers for predicting prostate cancer risk.
Background of the Invention There has been significant effort in the past directed to the diagnosis of prostate cancer. The well known prostate specific antigen (PSA) test is one diagnostic test. Another test (Belacel 2010) describes the use of eight different marker genes for diagnosing prostate cancer. Although a variety of tests have been developed for diagnosing prostate cancer, there have been relatively few efforts directed to developing prognostic tests for predicting low-risk patients in order to determine the proper treatment regime for patients diagnosed with prostate cancer. Two large scale studies of prostate cancer recently showed that there is significant over-diagnosis and overtreatment of prostate cancer patients (Andriole 2009; Schroder 2009). Many prostate cancer patients suffer from the side effects of treatment and society is bearing the related costs. Most of these treatments are unnecessary.
Recently, an algorithm (Multiple Survival Screening (MSS)) has been developed for identifying high-quality cancer prognostic markers and this algorithm was applied for identifying robust marker sets for breast cancer prognosis (Li 2010; Wang 2010).
There is a need to find new markers and develop new tests which are able to more accurately predict low-risk patients for prostate cancer who should receive little or no treatment.
Summary of the Invention
It has now been found that prostate cancer marker sets consisting of particular genes differentially expressed in prostate tumours advantageously provide improved accuracy of prostate cancer prognosis. The prostate cancer marker sets of the present
invention, one of which consists of 30 genes related to apoptosis, one of which consists of 22 genes related to cell cycle and one of which consists of 30 genes related to response to external stimulus, may be used in a clinical setting to provide information about the likelihood of a prostate cancer patient to survive without treatment (i.e. whether the prostate tumour is "good" or "bad").
In one aspect of the present invention, there is provided a method of assessing likelihood of a patient having a prostate tumour benefiting from prostate cancer treatment, the method comprising: obtaining a sample of the prostate tumour or an extract thereof having message RNA therein of the patient; determining a gene expression profile of the sample for genes of a gene marker set; and, comparing the gene expression profile of the sample to standardized "good" and "bad" profiles of the marker set to determine whether the gene expression profile of the sample predicts that the tumour is "good" or "bad", wherein "good" indicates that the patient is predicted to be at low-risk and would not likely benefit from prostate cancer treatment, "bad" indicates that the patient is predicted to be at high-risk and would likely benefit from prostate cancer treatment, and the gene marker set is Set 1 , Set 2 or Set 3, wherein
Set 1 consists of apoptosis-related genes as follows:
RARB 5915 retinoic acid receptor, beta
VAV1 7409 vav 1 guanine nucleotide exchange factor
WRN 7486 Werner syndrome, RecQ helicase-like
TNFRSF10A 8797 tumour necrosis factor receptor superfamily, member
10a
RIPK1 8737 receptor (TNFRSF)-interacting serine-threonine kinase 1
ABL1 25 c-abl oncogene 1 , non-receptor tyrosine kinase
TERT 7015 telomerase reverse transcriptase
GLI3 2737 GLI family zinc finger 3
JUN 3725 jun proto-oncogene
NFKBIA 4792 nuclear factor of kappa light polypeptide gene enhancer in B-cells inhibitor, alpha
LCK 3932 lymphocyte-specific protein tyrosine kinase
CASP3 836 caspase 3, apoptosis-related cysteine peptidase
E2F2 1870 E2F transcription factor 2
LTA 4049 lymphotoxin alpha (TNF superfamily, member 1 )
Set 2 consists of cell cycle-related genes as follows:
RAD54L 8438 RAD54-like (S. cerevisiae)
CCND3 896 cyclin D3
WEE1 7465 WEE1 homolog (S. pombe)
BIRC5 332 baculoviral IAP repeat containing 5
HDAC1 3065 histone deacetylase 1
Set 3 consists of response to external stimulus-related genes as follows:
CASP3 836 caspase 3, apoptosis-related cysteine peptidase
BLM 641 Bloom syndrome, RecQ helicase-like
FYN 2534 FYN oncogene related to SRC, FGR, YES
WRN 7486 Werner syndrome, RecQ helicase-like
The genes in the prostate cancer marker sets of the present invention are individually known and are individually known to be differentially expressed in prostate tumour cells. How they are differentially expressed and whether their differential expression generally correlates to "good" or "bad" tumours can also be determined from publicly available datasets. However, the specific combination of the genes in each marker set of the present invention unexpectedly provides for more robust marker sets having improved prognostic accuracy for prostate cancer survival. The marker sets of the present invention consisting of the specific combination of genes that gives rise to the improved prognostic accuracy may be generated using the Multiple Survival Screening (MSS) method previously developed (Li 2010; Wang 2010).
The sample comprises a sample of the prostate tumour of the patient or an extract thereof, which contains the genes in the marker set or message RNA that hybridizes to the genes in the marker set. Preferably, the sample comprises a sample of the prostate tumour of the patient.
Preferably, all three sets are used together to make risk predictions. Thus, gene expression profiles of the sample are preferably determined for the genes in each of Sets 1 , 2 and 3. In this case, the gene expression profiles are compared to standardized "good" and "bad" profiles of each respective gene marker set to determine whether each of the gene expression profiles predicts that the tumour is "good" or "bad". If all three marker sets predict that the tumour is "good" then the patient is predicted to be at low-risk and would not likely benefit from prostate cancer treatment. If all three marker sets predict that the tumour is "bad" then the patient is predicted to be at high-risk and would likely benefit from prostate cancer treatment. If one or two of the marker sets predict that the tumour is "good" or one or two of the marker sets predict that the tumour is "bad" then the patient is predicted to be at intermediate-risk and may or may not benefit from prostate cancer treatment. Using all three marker sets improves accuracy of the prognosis.
In a particular embodiment, each gene in the gene expression profile has a gene expression value and a modified gene expression profile is obtained by multiplying the gene expression value by its marker-factor. Standardized "good" and "bad" profiles are
determined by computing standardized centroids for both "good" and "bad" classes using prediction analysis for microarrays method (Tibshirani 2002). Modified class centroids of the marker set are obtained by multiplying the standardized centroids for each class by the marker-factor. The modified gene expression profile of the sample is compared to each modified class centroid to determine the tumour is "good" or "bad". The class whose centroid is closest to the modified gene expression profile, in Pearson correlation distance, is predicted to be the class for the sample.
Gene expression profiles of a patient's prostate tumour may be readily obtained by any number of methods known in the art, for example microarray analysis, individual gene screening, etc. In a preferred embodiment, the sample is screened that against a microarray on which gene probes of the marker sets are printed. An output of the gene expression profile of the sample is preferably obtained before comparing the gene expression profile to the standardized "good" and "bad" profiles of the marker set. To obtain the output, message RNA in the sample may be hybridized to the genes on the microarray, the hybridized microarray may be scanned to get all the readouts of marker genes for the sample, the readouts may be normalized and the gene expression profile of the marker set for the sample is thereby obtained. Detailed information for making microarray gene chip, scanning and normalization of array data is generally known in the art and can be found in the publicly available literature (http://en.wikipedia.org/wiki/DNA_microarray). It is also possible to obtain the gene expression profile by RNA-sequencing and related sequencing technologies as these technologies become more accessible (http://en.wikipedia.org/wiki/RNA-Seq).
In another embodiment, kits or commercial packages are provided, which comprise gene probes for each of the genes in a gene marker set of the present invention along with instructions for obtaining a gene expression profile of a sample for the gene marker set. The kit or commercial package may further comprise instructions for comparing the gene expression profile of the sample to standardized "good" and "bad" profiles of the marker set to determine whether the gene expression profile of the sample predicts that the tumour is "good" or "bad". Preferably, the kit or commercial package comprises gene probes for all three gene marker sets of the present invention. The kit or commercial package may further comprise means for obtaining a sample of a prostate tumour having message RNA therein from a patient, for example suitable syringes, fluid and/or tissue separation means, etc. In addition to the gene probes, the kit or commercial package may further comprise reagents and/or equipment useful for screening the sample against the gene probes for obtaining the gene expression profile of the sample.
Various standard elements of such kits or commercial packages are generally known in the art.
Further features of the invention will be described or will become apparent in the course of the following detailed description. Brief Description of the Drawings
In order that the invention may be more clearly understood, embodiments thereof will now be described in detail by way of example, with reference to the accompanying drawings, in which:
Fig. 1A provides gene names and EntrezGene ID numbers for genes in the GSE10645 prostate cancer gene expression dataset which are deposited in a public database (http://www.ncbi.nlm.nih.gov/geo/) that belong to apoptosis GO term;
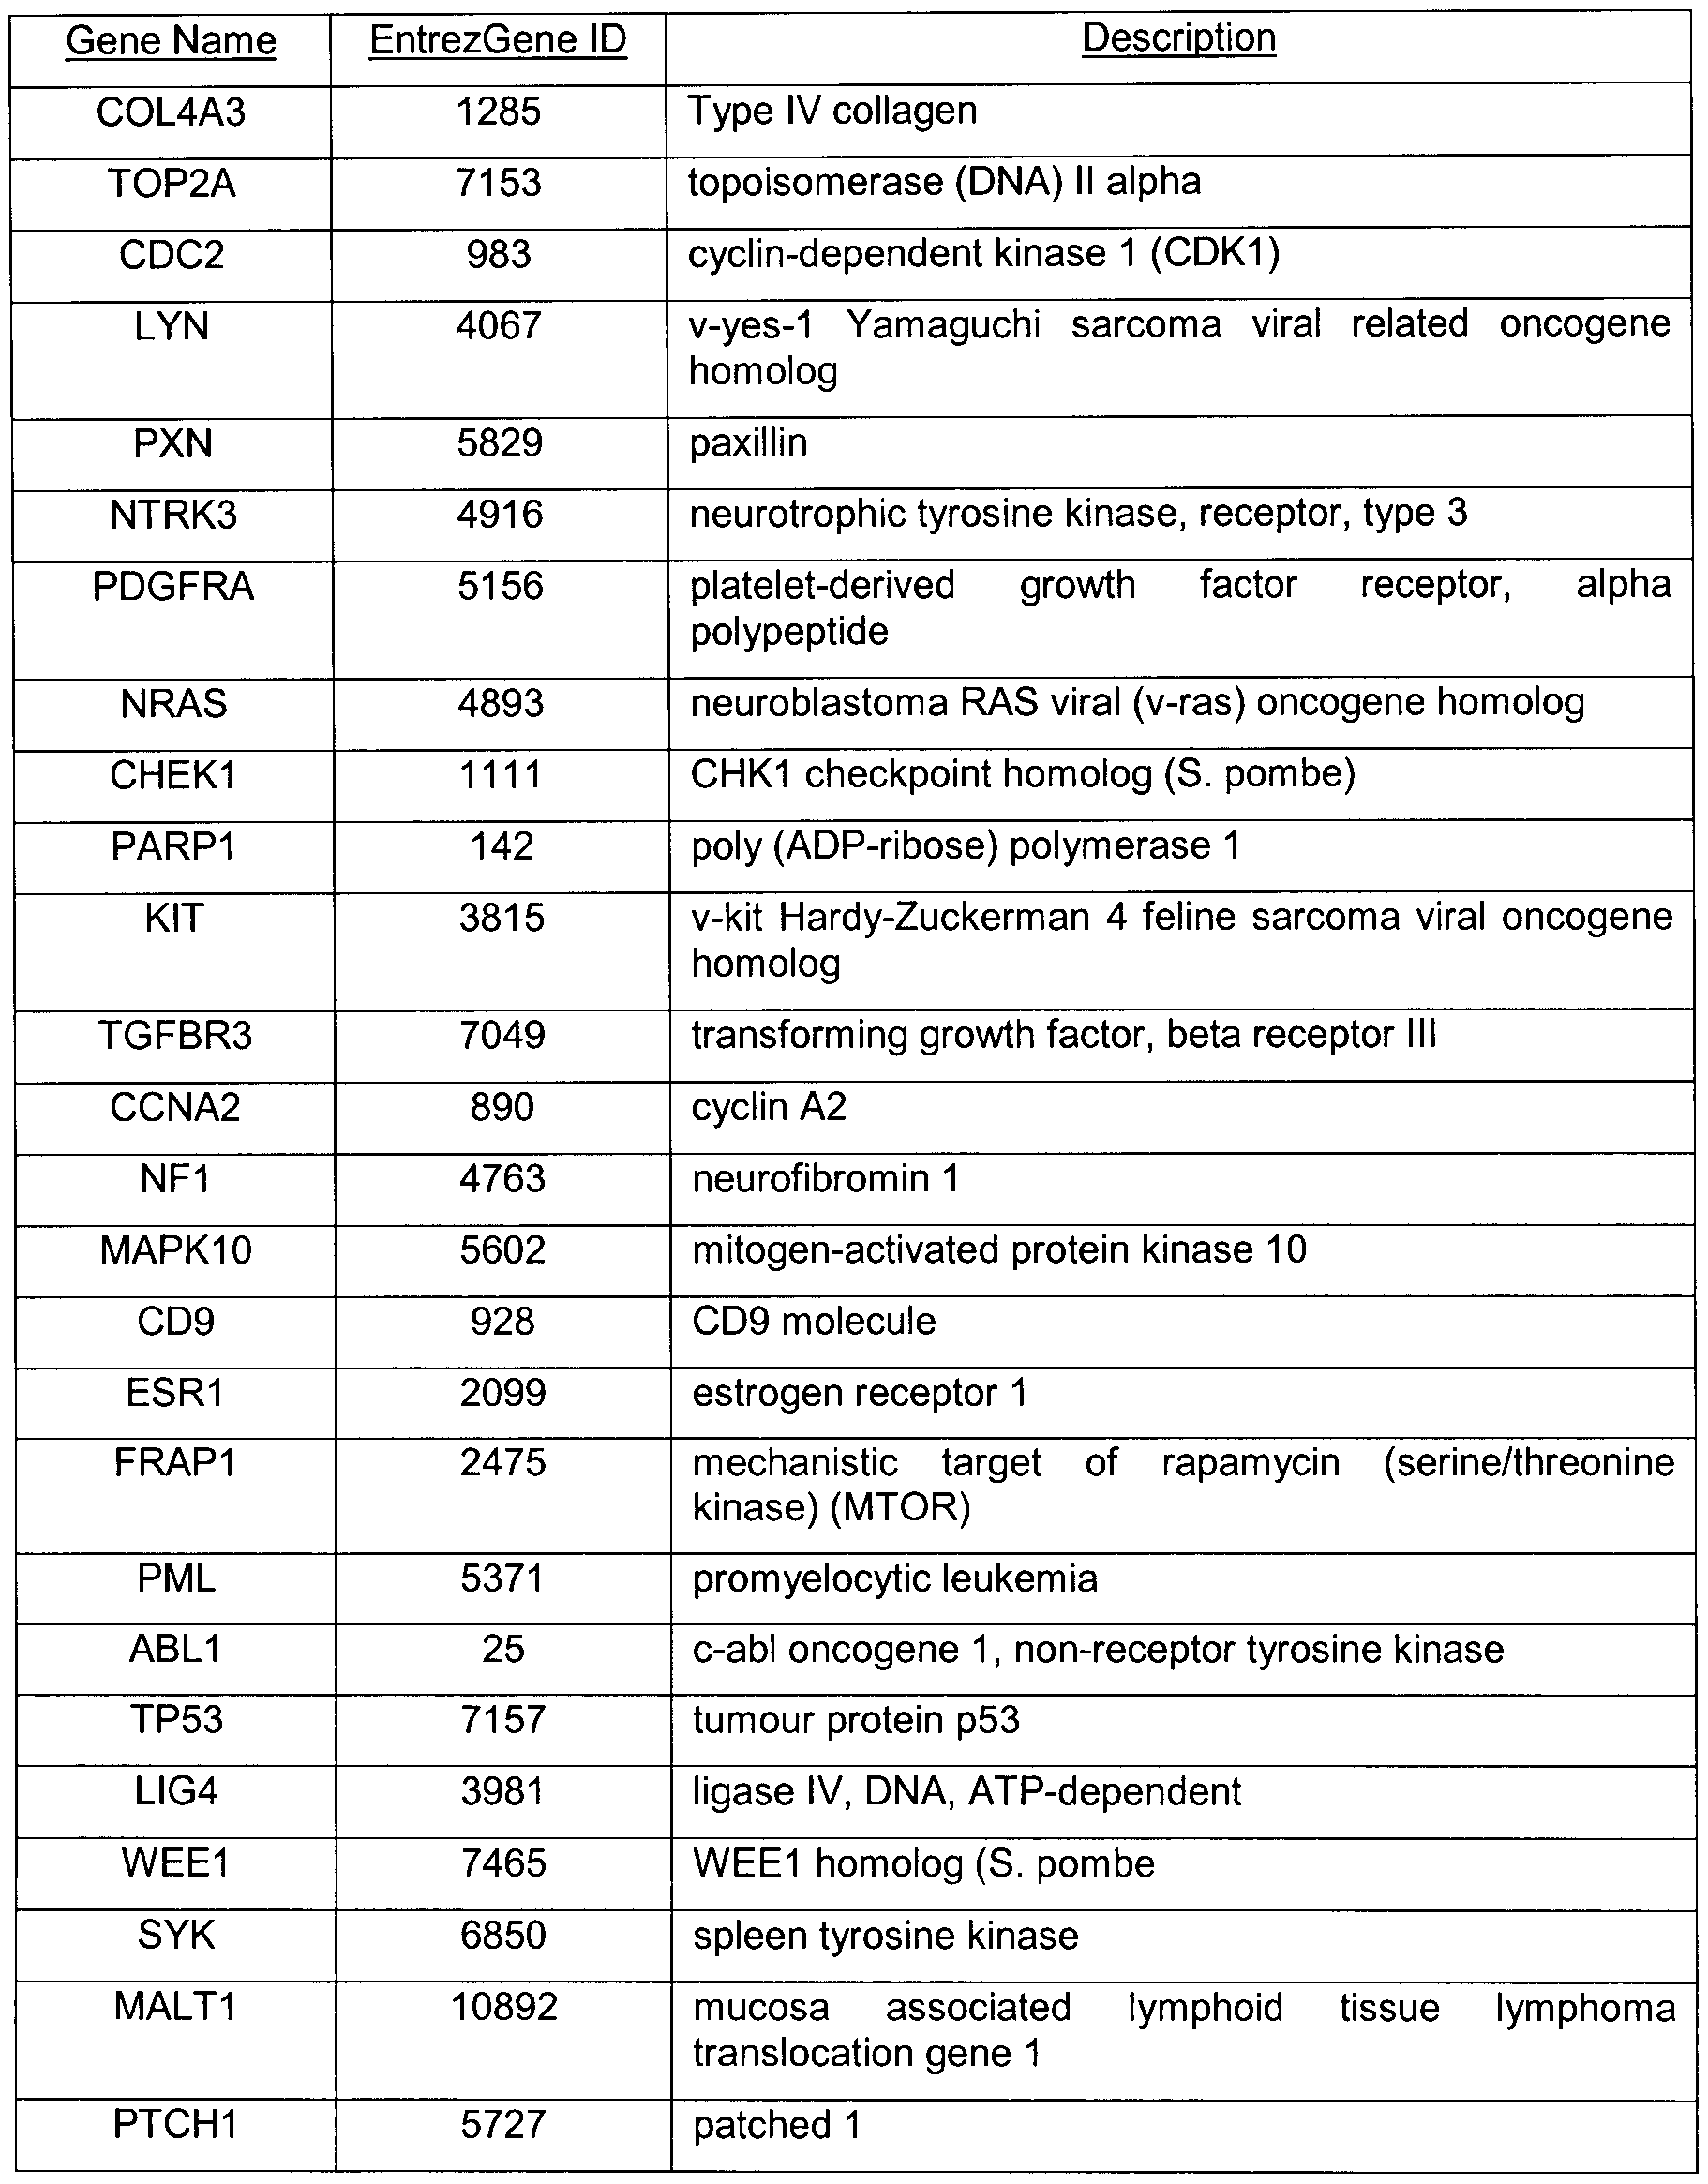
Fig. 1 B provides gene names and EntrezGene ID numbers for genes in the GSE10645 prostate cancer gene expression dataset that belong to cell cycle GO term; and, Fig. 1 C provides gene names and EntrezGene ID numbers for genes in the
GSE10645 prostate cancer gene expression dataset that belong to response to external stimulus GO term.
Description of Preferred Embodiments
Example 1: Generation of Prostate Cancer Marker Sets To develop the prostate cancer marker sets of the present invention, the Multiple
Survival Screening (MSS) method (Li 2010; Wang 2010) was used. In applying this method, a training set of 189 samples was selected from the GSE10645 GEO dataset (Nakagawa 2008). This prostate cancer gene expression datatset is from the population- based Swedish-Watchful Waiting cohort. The cohort consists of men with localized prostate cancer (clinical stage T1 -T2, Mx, NO). The GSE10645 GEO dataset contains information about genes that are differentially expressed in prostate tumours. The dataset identifies whether each of these genes is up-regulated or down-regulated in tumours and correlates these genes to patient survival (i.e. "good" vs. "bad" tumours).
The 189 samples from GSE10645 were randomly divided into three groups of 63 samples, each group retaining the same proportion of "good" vs. "bad" tumours that was
identified in the original GSE10645 dataset. Array-wide screening of the genes was performed on each of the three groups as described in the art (Li 2010; Wang 2010) to obtain survival genes, which are genes whose differential expression values are correlated with prostate cancer patient survivals. It is not relevant whether the expression of each gene is upregulated or downregulated so long as the differential expression is correlated to patient survival. Merging the results from each of the three groups yielded a survival gene set, which includes 133 survival genes.
Using the survival gene set, Gene Ontology (GO) analysis (using GO annotation software, David, http://david.abcc.ncifcrf.gov/) was performed to identify only those genes that belong to GO terms that are known to be associated with prostate cancer, such as apoptosis (cell death), cell adhesion, cell cycle, phosphorylation, response to external stimulus, cell motility and cell assembly. Table 1 lists the cancer-related GO term gene sets. One million distinct random-gene-sets were generated by randomly picking 30 genes from each cancer-related GO term gene set.
Table 1
Of the 189 samples selected from the GSE10645 GEO dataset to form the training set, 36 random datasets were generated by randomly picking 60 samples from the training set while retaining in each random dataset the same proportion of "good" vs. "bad" tumours that was identified in the original GSE10645 dataset.
For a given GO term gene set, survival screening was then conducted using the 1 million random-gene-sets against all the 36 random datasets. For each random dataset, the statistical significance of the correlation between the expression values of each random-gene-set (30 genes) and patient survival status ("good" or "bad") was examined by Kaplan-Meier analysis by implementing the Cox-Mantel log-rank test (Cui 2007). If
the P value was less than a cut-off for a survival screening using one random-gene-set against one random dataset, that random-gene-set was said to have passed. When a few thousands of random-gene-sets had passed 32 or more random datasets (the detailed parameters are shown in Table 5), the random-gene-sets that had passed were retained for further analysis. The genes in the retained random-gene-sets were then ranked based on their frequency of appearance in the passed random-gene-sets. The top 30 genes were chosen as a potential-marker-set. A similar survival screening of random-gene-sets against random datasets was performed for each of the other selected GO term gene sets. For each GO term gene set another 1 million distinct random-gene-sets were generated and the survival screening process using the random datasets mentioned above was repeated. If the gene members for the top 30 were substantially the same as those in the potential-marker-set generated by the first screening, then the potential- marker-set is stable and can be used as a real prostate cancer marker set. If the genes for the two potential marker sets were not substantially the same, then these GO term genes are unsuitable for finding a real marker set and the potential marker set was dropped from further analysis. In some cases somewhat fewer than 30 genes may be the same in the two potential marker sets, in which case the smaller set may be designated as a marker set. In this way, three prostate cancer marker sets were generated having stable signatures, one related to apoptosis, one related to cell cycle and one related to response to external stimulus. The genes, EntrezGene ID and full names of the genes in each of the three marker sets are given in the Tables 2-4 below. More details of each gene, including the nucleotide sequence of each gene, are known in the art and may be conveniently found in the National Center for Biotechnology Information (NCBI) Databases at http://www.ncbi.nlm.nih.gov/.
Table 2 - Marker Set Related to Apoptosis (30 genes)
LIG4 3981 ligase IV, DNA, ATP-dependent
OSM 5008 oncostatin M
PML 5371 promyelocytic leukemia
TP53 7157 tumour protein p53
NF1 4763 neurofibromin 1
SIAH1 6477 seven in absentia homolog 1 (Drosophila)
MALT1 10892 mucosa associated lymphoid tissue lymphoma translocation gene 1
KIT 3815 v-kit Hardy-Zuckerman 4 feline sarcoma viral oncogene homolog
RHOA 387 ras homolog gene family, member A
ESR1 2099 estrogen receptor 1
RARB 5915 retinoic acid receptor, beta
VAV1 7409 vav 1 guanine nucleotide exchange factor
WRN 7486 Werner syndrome, RecQ helicase-like
TNFRSF10A 8797 tumour necrosis factor receptor superfamily, member
10a
RIPK1 8737 receptor (TNFRSF)-interacting serine-threonine kinase 1
ABL1 25 c-abl oncogene 1 , non-receptor tyrosine kinase
TERT 7015 telomerase reverse transcriptase
GLI3 2737 GLI family zinc finger 3
JUN 3725 jun proto-oncogene
NFKBIA 4792 nuclear factor of kappa light polypeptide gene enhancer in B-cells inhibitor, alpha
LCK 3932 lymphocyte-specific protein tyrosine kinase
CASP3 836 caspase 3, apoptosis-related cysteine peptidase
E2F2 1870 E2F transcription factor 2
LTA 4049 lymphotoxin alpha (TNF superfamily, member 1 )
Table 3 - Marker Set Related to Cell Cycle (22 genes)
BLM 641 Bloom syndrome, RecQ helicase-like
ABL1 25 c-abl oncogene 1 , non-receptor tyrosine kinase
LIG4 3981 ligase IV, DNA, ATP-dependent
CCNA2 890 cyclin A2
NUMA1 4926 nuclear mitotic apparatus protein 1
CCNC 892 cyclin C
RBL2 5934 retinoblastoma-like 2 (p130)
LTA 4049 lymphotoxin alpha (TNF superfamily, member 1 )
ERCC2 2068 excision repair cross-complementing rodent repair deficiency, complementation group 2
CASP3 836 caspase 3, apoptosis-related cysteine peptidase
TP53 7157 tumour protein p53
RAD54L 8438 RAD54-like (S. cerevisiae)
CCND3 896 cyclin D3
WEE1 7465 WEE1 homolog (S. pombe)
BIRC5 332 baculoviral IAP repeat containing 5
HDAC1 3065 histone deacetylase 1
Table 4 - Marker Set Related to Response to External Stimulus (30 genes)
Gene Name EntrezGene ID Description
COL4A3 1285 Type IV collagen
TOP2A 7153 topoisomerase (DNA) II alpha
CDC2 983 cyclin-dependent kinase 1 (CDK1 )
LYN 4067 v-yes-1 Yamaguchi sarcoma viral related oncogene homolog
PXN 5829 paxillin
NTRK3 4916 neurotrophic tyrosine kinase, receptor, type 3
PDGFRA 5156 platelet-derived growth factor receptor, alpha polypeptide
NRAS 4893 neuroblastoma RAS viral (v-ras) oncogene homolog
CHEK1 1 1 1 1 CHK1 checkpoint homolog (S. pombe)
PARP1 142 poly (ADP-ribose) polymerase 1
KIT 3815 v-kit Hardy-Zuckerman 4 feline sarcoma viral oncogene homolog
TGFBR3 7049 transforming growth factor, beta receptor III
CCNA2 890 cyclin A2
NF1 4763 neurofibromin 1
MAPK10 5602 mitogen-activated protein kinase 10
CD9 928 CD9 molecule
ESR1 2099 estrogen receptor 1
FRAP1 2475 mechanistic target of rapamycin (serine/threonine kinase) (MTOR)
PML 5371 promyelocyte leukemia
ABL1 25 c-abl oncogene 1 , non-receptor tyrosine kinase
TP53 7157 tumour protein p53
LIG4 3981 ligase IV, DNA, ATP-dependent
WEE1 7465 WEE1 homolog (S. pombe)
SYK 6850 spleen tyrosine kinase
MALT1 10892 mucosa associated lymphoid tissue lymphoma translocation gene 1
PTCH1 5727 patched 1
CASP3 836 caspase 3, apoptosis-related cysteine peptidase
BLM 641 Bloom syndrome, RecQ helicase-like
FYN 2534 FYN oncogene related to SRC, FGR, YES
WRN 7486 Werner syndrome, RecQ helicase-like
Table 5 - Parameters for Screening of the Marker Sets
Example 2: Validating Effectiveness of the Marker Sets in Prostate Cancer Prognosis The effectiveness of the three marker sets generated in Example 1 was validated against three separate GEO datasets containing prostate cancer gene expression data from sample populations. One of the three datasets against which the markers were validated was the GSE16560 dataset described above except that 261 samples from that dataset were used. The other two test datasets were GEO datasets GSE21034 (Taylor 2010) and GSE10645 (Nakagawa 2008, the validation samples marked by the authors). In all three cases, test datasets were constructed by selecting samples from the GEO datasets so that the test datasets contained 90% "good" tumours and 10% "bad" tumours,
based on ultimate patient survival outcomes, in order to simulate the suggestion that over 90% of prostate cancer patients do not actually need to be treated.
To perform the validation for a given test dataset containing 'n' samples, the gene expression profile of the marker set was extracted. For each gene expression value its marker-factor was multiplied to obtain a modified gene expression profile of the testing sample. Standardized centroids were computed for both "good" and "bad" classes from n- 1 samples for the marker set using the Prediction Analysis for Microarrays (PAM) method (Tibshirani 2002). The marker-factor of each gene was multiplied to the class centroids to get modified class centroids of the marker set. For predicting the recurrence of the targeted testing sample using the marker set the modified gene expression profile of the sample was compared to each of these modified class centroids. The class whose centroid that it is closest to, in Pearson correlation distance, is the predicted class for that sample. If the sample is predicted to be a "good" tumour, it is denoted as 0, otherwise it is denoted as 1. If all three marker sets predict that a particular prostate cancer sample is "good" (i.e. denoted as 0 for all 3 marker sets), the sample is assigned to low-risk group. If all three marker sets predict that a particular prostate cancer sample is "bad" (i.e. denoted as 1 for all 3 marker sets), the sample is assigned to high-risk group. If a sample is not assigned to low-risk or high-risk group, it is assigned to intermediate-risk group.
This validation process was carried out in all three of the test datasets. Table 6 shows the results for the low-risk group in comparison to the GSE16560 training set originally used to generate the three marker sets (see Example 1 ). As would be expected, the accuracy of the marker sets against the training set is 100%. The accuracy of the marker sets against the test datasets derived from the three GEO datasets is remarkably high.
Table 6 - Predicting Accuracy of the Marker Sets
The accuracy of the present marker sets can be compared to the prior art. Table 7 provides the performance of several markers and marker sets of the prior art. Table 7 is derived from Table 5 of Nakagawa 2008. The clinical models used and the nature of the various markers and marker sets listed in Table 7 below are explained in Nakagawa 2008. It is clear comparing Table 6 to Table 7 that the prognostic accuracy of the present marker sets for determining the expected survival of a prostate cancer patient is substantially greater than the prior art markers and marker sets.
Table 7 - AUC's of Prior Art Markers and Marker Sets
References: The contents of the entirety of each of which are incorporated by this reference.
Andriole GL, Crawford ED, Grubb III RL, et al. (2009) Mortality Results from a Randomized Prostate-Cancer Screening Trial. The New England Journal of Medicine. 360(13), 1310-1319. Belacel N, Cuperlovic-Culf M, Ouellette R. (2010) Molecular Method for Diagnosis of Prostate Cancer. United States Patent 7,759,060 issued July 20, 2010.
Cui Q, Ma Y, Jaramillo M, Bari H, Awan A, Yang S, Zhang S, Liu L, Lu M, O'Connor- McCourt M, Purisima EO, Wang E. (2007) A map of human cancer signaling. Molecular Systems Biology. 3: 152, 13 pages.
Glinsky GV, Glinskii AB, Stephenson AJ, Hoffman RM, Gerald WL. (2004) Gene expression profiling predicts clinical outcome of prostate cancer. J Clin Invest. 1 13, 913- 23.
Glinsky GV, Berezovska O, Glinskii AB. (2005) Microarray analysis identifies a death- from-cancer signature predicting therapy failure in patients with multiple types of cancer. J Clin Invest. 1 15, 1503-21.
GO annotation software, David, http://david.abcc.ncifcrf.gov/.
Lapointe J, Li C, Higgins JP, van de Rijn M, Bair E, et al. (2004) Gene expression profiling identifies clinically relevant subtypes of prostate cancer. Proc Natl Acad Sci USA. 101 , 81 1-6.
Li J, Lenferink AEG, Deng Y, Collins C, Cui Q, Purisima EO, O'Connor-McCourt MD, Wang E. (2010) Identification of high-quality cancer prognostic markers and metastasis network modules. Nature Communications. 1 :34, DOI: 10.1038/ncomms1033.
Nakagawa T, Kollmeyer TM, Morlan BW, et al. (2008) A Tissue Biomarker Panel Predicting Systemic Progression after PSA Recurrence Post-Definitive Prostate Cancer Therapy. PLoS one. 3(5), e2318.
National Center for Biotechnology Information (NCBI) Databases. http://www.ncbi.nlm.nih.gov/.
Sboner A, Demichelis F, Calza S, et al. (2010) Molecular Sampling of Prostate Cancer: A Dilemma for Predicting Disease Progression. BMC Medical Genomics. 3-8. (GEO Gene Expression Omnibus GSE16560).
Schroder FH, Hugosson J, Roobol MJ, et al. (2009) Screening and Prostate-Cancer Mortality in a Randomized European Study. The New England Journal of Medicine. 360(13), 1320-1328. Singh D, Febbo PG, Ross K, Jackson DG, Manola J, et al. (2002) Gene expression correlates of clinical prostate cancer behavior. Cancer Cell. 1 , 203-9.
Taylor BS, Schultz N, Hieronymus H, et al. (2010) Integrative Genomic Profiling of Human Prostate Cancer. Cancer Cell. 8(1 ), 1 1-22.
Tibshirani R, Hastie T, Narasimhan B, Chu G. (2002) Diagnosis of multiple cancer types by shrunken centroids of gene expression. PNAS. 99, 6567-6572.
Wang E, Li J, Deng Y, Lenferink AEG, O'Connor-McCourt MD, Purisima EO. (2010) Process for Tumour Characteristic and Marker Set Identification, Tumour Classification and Marker Sets for Cancer. International Patent Application WO 2010/1 18520 published October 21 , 2010. Wikipedia, the free encyclopedia. (2010a) DNA Microarray. http://en.wikipedia.org/wiki/DNA_microarray.
Wikipedia, the free encyclopedia. (2010b) RNA-Seq. http://en.wikipedia.org/wiki/RNA- Seq.
Yu YP, Landsittel D, Jing L, Nelson J, Ren B, et al. (2004) Gene expression alterations in prostate cancer predicting tumour aggression and preceding development of malignancy. J Clin Oncol. 22, 2790-9.
Other advantages that are inherent to the structure are obvious to one skilled in the art. The embodiments are described herein illustratively and are not meant to limit the scope of the invention as claimed. Variations of the foregoing embodiments will be evident to a person of ordinary skill and are intended by the inventor to be encompassed by the following claims.