WO2012039484A1 - 遺伝子クラスタ及び遺伝子の探索、同定法およびそのための装置 - Google Patents
遺伝子クラスタ及び遺伝子の探索、同定法およびそのための装置 Download PDFInfo
- Publication number
- WO2012039484A1 WO2012039484A1 PCT/JP2011/071731 JP2011071731W WO2012039484A1 WO 2012039484 A1 WO2012039484 A1 WO 2012039484A1 JP 2011071731 W JP2011071731 W JP 2011071731W WO 2012039484 A1 WO2012039484 A1 WO 2012039484A1
- Authority
- WO
- WIPO (PCT)
- Prior art keywords
- gene
- gene cluster
- genes
- cluster
- virtual
- Prior art date
- Legal status (The legal status is an assumption and is not a legal conclusion. Google has not performed a legal analysis and makes no representation as to the accuracy of the status listed.)
- Ceased
Links
Images





















Classifications
-
- G—PHYSICS
- G16—INFORMATION AND COMMUNICATION TECHNOLOGY [ICT] SPECIALLY ADAPTED FOR SPECIFIC APPLICATION FIELDS
- G16B—BIOINFORMATICS, i.e. INFORMATION AND COMMUNICATION TECHNOLOGY [ICT] SPECIALLY ADAPTED FOR GENETIC OR PROTEIN-RELATED DATA PROCESSING IN COMPUTATIONAL MOLECULAR BIOLOGY
- G16B20/00—ICT specially adapted for functional genomics or proteomics, e.g. genotype-phenotype associations
-
- G—PHYSICS
- G16—INFORMATION AND COMMUNICATION TECHNOLOGY [ICT] SPECIALLY ADAPTED FOR SPECIFIC APPLICATION FIELDS
- G16B—BIOINFORMATICS, i.e. INFORMATION AND COMMUNICATION TECHNOLOGY [ICT] SPECIALLY ADAPTED FOR GENETIC OR PROTEIN-RELATED DATA PROCESSING IN COMPUTATIONAL MOLECULAR BIOLOGY
- G16B20/00—ICT specially adapted for functional genomics or proteomics, e.g. genotype-phenotype associations
- G16B20/20—Allele or variant detection, e.g. single nucleotide polymorphism [SNP] detection
-
- G—PHYSICS
- G16—INFORMATION AND COMMUNICATION TECHNOLOGY [ICT] SPECIALLY ADAPTED FOR SPECIFIC APPLICATION FIELDS
- G16B—BIOINFORMATICS, i.e. INFORMATION AND COMMUNICATION TECHNOLOGY [ICT] SPECIALLY ADAPTED FOR GENETIC OR PROTEIN-RELATED DATA PROCESSING IN COMPUTATIONAL MOLECULAR BIOLOGY
- G16B25/00—ICT specially adapted for hybridisation; ICT specially adapted for gene or protein expression
- G16B25/10—Gene or protein expression profiling; Expression-ratio estimation or normalisation
-
- G—PHYSICS
- G16—INFORMATION AND COMMUNICATION TECHNOLOGY [ICT] SPECIALLY ADAPTED FOR SPECIFIC APPLICATION FIELDS
- G16B—BIOINFORMATICS, i.e. INFORMATION AND COMMUNICATION TECHNOLOGY [ICT] SPECIALLY ADAPTED FOR GENETIC OR PROTEIN-RELATED DATA PROCESSING IN COMPUTATIONAL MOLECULAR BIOLOGY
- G16B20/00—ICT specially adapted for functional genomics or proteomics, e.g. genotype-phenotype associations
- G16B20/30—Detection of binding sites or motifs
-
- G—PHYSICS
- G16—INFORMATION AND COMMUNICATION TECHNOLOGY [ICT] SPECIALLY ADAPTED FOR SPECIFIC APPLICATION FIELDS
- G16B—BIOINFORMATICS, i.e. INFORMATION AND COMMUNICATION TECHNOLOGY [ICT] SPECIALLY ADAPTED FOR GENETIC OR PROTEIN-RELATED DATA PROCESSING IN COMPUTATIONAL MOLECULAR BIOLOGY
- G16B25/00—ICT specially adapted for hybridisation; ICT specially adapted for gene or protein expression
Definitions
- the present invention relates to a search and identification method for gene clusters and useful genes, and a search apparatus for the purpose, which are aimed at searching for gene clusters as targets and finding new useful genes in the gene clusters.
- Secondary metabolites are highly likely to have physiological activity and are extremely useful as lead compounds for pharmaceuticals. Secondary metabolites are diverse and have been discovered from various species such as actinomycetes, fungi, plants, etc., but the conditions for expression are often special and unknown, and many secondary properties with useful properties Metabolites are thought to be sleeping without being discovered. Even if discovered, it is a problem in use that it is difficult to produce a stable and sufficient amount. On the other hand, in recent years, due to the innovative development of DNA sequencing technology, the accumulation of genome information of various species, especially microorganisms, has been increasing at an accelerating rate. It is certain that will become clear. If it becomes possible to construct a database etc.
- the target gene is verified by sequentially verifying the candidate gene as to whether the estimated gene is absolutely essential for biosynthesis of the metabolite of interest by gene disruption, etc. It was essential to identify.
- the gene disruption experiment is usually a step that takes a long time and effort because a skilled engineer for several genes spends about a month or more. Therefore, in the state where the candidate genes are usually narrowed down to the 10th to 100th candidates, prioritized destruction experiments are performed, but if the correct genes can be narrowed down as candidates within the 10th, it can be said that they are quite fortunate.
- gene disruption experiments cannot be performed, so verification itself is impossible and it is difficult to specify genes.
- Non-Patent Documents 1-5) Several methods for identifying secondary metabolism-related genes from the genome sequence of microorganisms have been reported for NRPS and PKS so far (Non-Patent Documents 1-5), and several of them have been verified (Non-patents) References 3, 4, 6).
- a strategy for extracting a motif for performing a specific reaction from gene sequence information is taken, and the range of genes to be identified is limited to NRPS and PKS.
- the existing method is based on the one-to-one correspondence between genes and functions, and this proposal is based on the biological knowledge that secondary metabolism-related genes in microorganisms are gathered and located on the genome. It is essentially different from the method.
- the proposed method makes it possible to identify not only NRPS and PKS, which are representative secondary metabolic pathways of microorganisms, but also other gene groups that contain motifs related to other reactions. Moreover, since it identifies based on expression information, the gene group which does not actually work, such as a dormancy gene and a Pseudo gene, can be avoided.
- Patent Document 1 there is an example in which a gene that produces an antibacterial substance is identified based on genome information (Patent Document 1), but this method assumes an antibacterial substance that is a protein or RNA as a production substance, and “clone coverage”. This method is a method for searching for genes involved in the production of secondary metabolites that have no sequence information and are extremely diverse. It cannot be.
- the present invention in the search for useful genes such as genes involved in the production of metabolites in the above-described prior art, does not greatly depend on the knowledge and experience of researchers found in the above-mentioned prior art, and also in gene disruption experiments To provide a method and apparatus for searching and identifying useful genes in a logical and systematic manner in a very short time and efficiently without the need to sequentially perform genome information. It can be used to accelerate the search for new useful genes, to collect detailed and enormous information on the correspondence between gene sequences in genomes and useful genes, and to build a database, etc. The challenge is to contribute to the discovery of gene products.
- the present inventor has found that information on expression variation of individual genes in the genome as found in conventional gene search by microarray genomic gene expression induction or destruction experiments, etc. Rather than squeezing target genes directly from each other, the expression variation information of each gene on the genome by a microarray or the like is added together as expression variation information of a virtual gene cluster unit composed of a plurality of genes. By scoring clusters and finding gene clusters containing useful genes and useful genes contained in these virtual gene clusters, it is much more accurate and efficient than the conventional useful gene search method described above. In order to complete the present invention. Was Tsu. That is, the present invention is as follows.
- the present invention provides a method for searching and identifying the following useful genes.
- a method for searching a gene cluster including a target gene in a biological genome and / or a target gene in the gene cluster, wherein a genomic gene generated under a condition that causes a physiological state change of the biological cell and a control condition The score obtained by scoring for each virtual gene cluster unit by summing up the expression level fluctuation ratio as the virtual gene cluster unit composed of multiple genes arranged on the genomic DNA.
- any number in the case of a genome consisting of circular DNA it consists of a set of virtual gene clusters consisting of each gene group extracted from the genes starting from the genes arranged in sequence on the genomic DNA, and all of the gene clusters existing on the genome are virtual gene clusters.
- Formula a) (8) In a case where a gene arranged on genomic DNA is presumed to have a target gene function, or a case where the possibility of having a target gene function is low or not presumed The method according to (7) above, wherein the following weighting calculation is applied to a gene arranged on the genomic DNA. (9) When a gene arranged on genomic DNA is presumed to have a target gene function, a hypothetical gene cluster including a gene presumed to have a target gene function is selected and selected. The method according to (7) above, wherein the virtual gene cluster is scored. (10) Constructed from only one or more of the following 1) to 3), or from one or more genes including at least the gene, provided that a virtual gene cluster exists in the vicinity of the genome.
- Formula d) (16) A hypothetical gene cluster composed of a plurality of genes arranged on the genomic DNA, wherein the expression level variation ratio of each gene arranged on the genomic DNA generated under conditions that cause changes in physiological state of biological cells and control conditions By summing up the expression level fluctuation ratio of the unit, scoring is performed for each virtual gene cluster unit, and based on the obtained score, whether the target gene cluster exists in the genome or whether the target gene cluster is A method for predicting gene size when present, The number of continuous genes on the genomic DNA is increased from 2 to 1 until the maximum number of genomic genes included in the assumed gene cluster is reached, and for each number of genes extracted in the extraction.
- each virtual gene cluster composed of the extracted gene groups is scored by the following calculation formula a), and the score of the obtained virtual gene cluster is calculated for each number of genes included in each gene cluster.
- the gene cluster score distribution judgment value ( ⁇ ) is obtained for each gene number unit according to the following calculation formula e), and based on the judgment value, a standard value is obtained in advance.
- a device for searching for a gene cluster including a target gene in a biological genome and / or a target gene in the gene cluster, wherein a) a condition that causes a physiological state change of a biological cell and genomic DNA under control conditions Means for storing the expression level fluctuation ratio of each gene under the above two conditions calculated based on the expression level data of each gene arranged in the above, b) a hypothetical gene by combining a plurality of genes arranged on the genomic DNA Means for constructing a cluster, c) summing the expression level variation ratio of each gene arranged on the calculated and stored genomic DNA as the expression level variation ratio of the virtual gene cluster unit constructed by a plurality of genes.
- Means for scoring each virtual gene cluster unit and storing the score of each virtual gene cluster, and d) obtained A means for selecting a gene cluster including a target gene that is a causative gene of the physiological state change based on the score; or e) a means for displaying a gene included in the selected gene cluster
- the expression level data is fluorescence intensity information obtained by a DNA microarray for measuring gene expression level.
- the fluorescence intensity information is numerical data output by a fluorescence intensity reading device having means for reading and digitizing the fluorescence intensity.
- the above-mentioned contrast condition set includes at least a contrast condition set under a metabolite production induction condition and a non-induction condition or a metabolite production suppression condition and a non-inhibition condition (22)
- the apparatus described in. (25) The device according to (24) above, wherein the metabolite is a secondary metabolite.
- each virtual gene cluster increases the number of continuous genes on the genomic DNA from two to one, and reaches the maximum number of genomic genes included in the assumed gene cluster
- the apparatus for each number of genes to be extracted, from any end of the DNA in the case of a genome consisting of linear DNA, any gene in the case of a genome consisting of circular DNA
- the apparatus is constructed by each gene group extracted while shifting the genes arranged on the genomic DNA one by one as a starting point.
- scoring of each virtual gene cluster is performed by the following calculation formula a).
- Formula a) It has annotation giving means for selecting a specific gene in each gene arranged on the genomic DNA, and in the scoring of the gene cluster, the expression level for the gene selected based on the given annotation
- the annotation giving means is means for giving a different annotation for each type of gene function.
- the gene selected on the basis of the annotation is one or more genes of 1) to 3). Enzyme genes belonging to the enzyme species that are assumed to be.
- Formula d) (40) a) a means for inputting the expression level of each gene arranged on the genomic DNA generated under conditions that cause changes in physiological state of biological cells and control conditions; b) the same gene under the above two input conditions Expression level fluctuation ratio calculating means for calculating the ratio of the expression level of the gene, c) expression of the virtual gene cluster unit constructed by a plurality of genes, the expression level fluctuation ratio of each gene arranged on the calculated genomic DNA Means for summing up as a quantity variation ratio and scoring for each virtual gene cluster unit; and d) gene cluster distribution judgment value ( ⁇ ) for each number of genes included in the gene cluster from the score of the obtained virtual gene cluster From the gene cluster distribution judgment value ( ⁇ ), whether or not the target gene cluster exists in the genome, An apparatus for predicting the gene size when a gene cluster exists, in which a virtual gene cluster construction means is assumed to increase the number of consecutive genes on the genomic DNA from two genes one by one.
- each virtual gene cluster is a means for making each gene group extracted while sequentially shifting genes arranged on the genomic DNA one by one starting from an arbitrary gene.
- the scoring means for each cluster is composed of arithmetic means based on the following calculation formula a) and calculates the gene cluster distribution judgment value ( ⁇ ). Means, characterized in that it is due to the following calculation formula e), the device.
- Formula a) Formula e) (41) The gene cluster distribution determination value ⁇ value ( ⁇ (k)) when the number of genes is k, and the same ⁇ value ( ⁇ (k ⁇ 1), ⁇ (k + 1)) when the number of genes is around, The above (40) is characterized in that, when the following relationship is satisfied, it is determined that the target gene cluster exists in the genome, and an expected value with the number of genes included in the target gene cluster being k is output.
- the device described. (42) A program for executing the virtual gene cluster construction means described in (26) above, wherein the following means 1) or 2) is executed based on the position information of the genomic gene. Virtual gene cluster construction program. 1) When the genomic gene is a linear genome, a.
- Genes included in an assumed gene cluster starting from a gene located at one end of the genomic DNA and sequentially increasing the number of consecutive genes on the genomic DNA from two to one in the direction of the other end A means for constructing a plurality of gene groups including genes that are combined and used as a starting point and having different numbers of genes. b. While the origin is sequentially shifted one gene at a time in the direction of the other end, the a. A plurality of gene groups including a new origin gene and having different numbers of genes, and a. A means for constructing a virtual gene cluster composed of a gene group obtained by combining a plurality of genes together with the gene group. 2) When the genomic gene is circular, starting from any gene on the genomic DNA, 1) a. And b.
- a scoring program for a virtual gene cluster characterized in that scoring according to the following calculation formula a) is executed for the virtual gene cluster constructed by the program of (42).
- Formula a) (44)
- a genomic gene is selected based on the given annotation, and the expression level fluctuation ratio calculation for the selected gene is performed by the following weighting formula: 43).
- a virtual gene cluster including the selected genomic gene is selected from the constructed gene clusters.
- a virtual gene clutter construction program characterized by constructing a virtual gene cluster from one or more genes including at least
- Formula b) (49) Degree of deviation from the score distribution of the entire virtual gene cluster with respect to the score of each virtual gene cluster calculated by the scoring program according to any of (43) to (45) or (47) above
- Formula c) (50) Expression level fluctuation ratio of the above virtual gene cluster unit constructed by a plurality of genes, the expression level fluctuation ratio of each gene arranged on the genomic DNA under conditions that cause changes in physiological state of biological cells and control conditions And a means for scoring for each virtual gene cluster unit, and calculating a gene cluster distribution judgment value ( ⁇ ) for each number of genes included in the gene cluster from the obtained virtual gene cluster score, From the gene cluster distribution judgment value ( ⁇ ), whether or not the target gene cluster exists in the genome, or a program used for predicting the gene size when the target gene cluster exists, A program for executing at least the following means (A) to (C).
- B Means for scoring each virtual gene cluster unit by the following calculation formula a) for the virtual gene cluster constructed by the means of (A).
- C) From the score of the virtual gene cluster obtained by the means of (B) above, the gene cluster distribution judgment value ( ⁇ ) for each gene number unit included in the virtual gene cluster is calculated by the following calculation formula e) Means to do.
- the gene search method and apparatus of the present invention constructs a virtual gene cluster from a plurality of adjacent or nearby genes, and searches for useful genes using this virtual gene cluster as a search target first.
- the method itself is extremely logical and mechanical, and can be quickly performed using a computer without greatly depending on the knowledge and experience of researchers as seen in conventional DNA microarray analysis.
- a useful gene can be accurately identified, and at the same time, a gene cluster including the gene can be identified.
- the gene search method of the present invention if there is an error in the search condition, it can be grasped from the acquired data itself. In this case, the search condition can be reset and the search can be performed again.
- a verification experiment such as a gene disruption experiment is required to determine whether or not the analysis result is incorrect, and enormous costs and labor are required. Therefore, the advantages of the gene search method and search device of the present invention are clear.
- the gene search method and apparatus of the present invention are extremely suitable for searching for metabolite-producing genes, particularly secondary metabolite-producing genes that have been difficult in the past. This is because genes involved in the production of secondary metabolites often constitute gene clusters. Furthermore, by using sequence information such as useful genes such as secondary metabolite-producing genes that have been searched and identified in this manner, it is possible to obtain new similar genes.
- the gene search method and apparatus of the present invention not only such a search for metabolite-producing genes but also a gene having a wide universality and causing various physiological state changes of an organism, At the same time, it is possible to search for a gene cluster involved in a change in physiological state, whereby it is possible to identify other genes that cooperate with the causative gene. Therefore, the present invention is extremely effective in searching for metabolites, particularly secondary metabolite production genes, genes causing various diseases, or genes cooperating with these, and obtaining new useful compounds.
- the technology can be dramatically improved in mass production or drug development.
- FIG. 7 is a diagram showing a determination value ⁇ for determining whether or not each virtual gene cluster is a target gene cluster in the Aspergillus oryzae array data acquisition system C2.
- Horizontal axis cluster size, vertical axis: ⁇ .
- the dimension number d ' is 2.
- FIG. 6 is a diagram showing an evaluation value ⁇ ⁇ ⁇ for determining whether or not each virtual gene cluster is a target gene cluster in the Aspergillus oryzae array data acquisition system C2.
- Horizontal axis cluster size
- vertical axis ⁇ ⁇ ⁇ .
- the dimension number d ' is 2.
- FIG. 6 is a diagram showing a gene cluster score distribution determination value ⁇ for determining whether or not a target gene cluster is included after weighting by function annotation in Aspergillus oryzae array data. Horizontal axis: cluster size, vertical axis: ⁇ value at 6 dimensions.
- FIG. 7 is a diagram illustrating a determination value ⁇ for determining whether or not each virtual gene cluster is a target gene cluster after weighting by function annotation in the Aspergillus oryzae array data acquisition system C2.
- Horizontal axis cluster size, vertical axis: ⁇ .
- the dimension number d ' is 2.
- FIG. 10 is a diagram showing an evaluation value ⁇ ⁇ ⁇ for determining whether or not each virtual gene cluster is a target gene cluster after weighting by function annotation in the Aspergillus oryzae array data acquisition system C2.
- Horizontal axis cluster size, vertical axis: ⁇ ⁇ ⁇ .
- the dimension number d ' is 2.
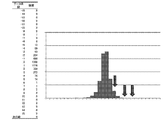
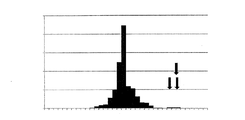
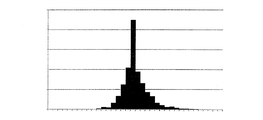
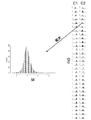
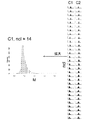
- Horizontal axis expression variation ratio score M value, vertical axis: frequency. It is the figure which showed the gene cluster score distribution determination value (epsilon) which determines whether the target gene cluster is contained in the array data of Aspergillus flavus.
- Horizontal axis cluster size, vertical axis: ⁇ value at 6 dimensions. It is the figure which showed the judgment value ⁇ which determines whether each virtual gene cluster is a target gene cluster in the array data acquisition system C2 of Aspergillus flavus.
- Horizontal axis cluster size, vertical axis: ⁇ . It is the figure which showed the judgment value ⁇ which determines whether each virtual gene cluster is a target gene cluster in the array data acquisition system C2 of Aspergillus flavus.
- Horizontal axis cluster size, vertical axis: ⁇ .
- FIG. 6 is a diagram showing an evaluation value ⁇ ⁇ ⁇ for determining whether or not each virtual gene cluster is a target gene cluster in the Aspergillus flavus array data acquisition system C2.
- Horizontal axis cluster size, vertical axis: ⁇ ⁇ ⁇ .
- FIG. 10 is a diagram showing an evaluation value ⁇ ⁇ ⁇ for determining whether or not each virtual gene cluster is a target gene cluster in the Aspergillus niger array data acquisition systems C1 and C2.
- Horizontal axis cluster size, vertical axis: ⁇ ⁇ ⁇ .
- the dimension number d ' is 2.
- the determination value ⁇ for determining whether or not the virtual gene cluster constructed to include the gene including the annotation of the corresponding function is the target gene cluster is shown.
- the determination value ⁇ for determining whether or not the virtual gene cluster constructed to include the gene including the annotation of the corresponding function is the target gene cluster is shown.
- an evaluation value ⁇ ⁇ ⁇ for judging whether or not a virtual gene cluster constructed so as to include a gene including an annotation of the corresponding function is a target gene cluster
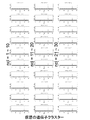
- FIG. 5 is a diagram showing the horizontal axis as virtual gene cluster numbers.
- Horizontal axis virtual gene cluster ID
- vertical axis ⁇ ⁇ ⁇ .
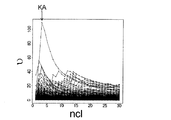
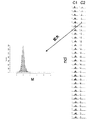
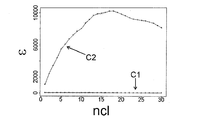
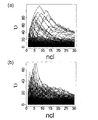
- the dimension number d ' is 2. It is the figure which showed the score histogram which took the cluster size from 1 to 30 of the hypothetical gene cluster in Fusarium verticiliodes. (Right) Overall view when ncl is changed in the systems C1 and C2.
- Horizontal axis cluster size, vertical axis: ⁇ . (Left) C1, (Right) C2. It is the figure which showed the judgment value u which determines whether each hypothetical gene cluster is a target gene cluster in the array data acquisition system C1 and C2 of Fusarium verticiliides.
- Horizontal axis cluster size, vertical axis: ⁇ . The dimension number d 'is 2. (Left) C1, (Right) C2. It is the figure which showed the evaluation value c'u which judges whether each hypothetical gene cluster is a target gene cluster in the array data acquisition system C1 and C2 of Fusarium vertisiliides.
- Horizontal axis hypothetical gene cluster origin gene ID, vertical axis: ⁇ ⁇ ⁇ .
- the dimension number d ' is 2.
- the value of ncl taking the maximum absolute value is plotted.
- FIG. 6 is a diagram showing a determination value c for determining whether each virtual gene cluster is a target gene cluster in the E. coli array data acquisition system C2.
- Horizontal axis cluster size, vertical axis: ⁇ .
- FIG. 5 is a diagram showing an evaluation value c′u for determining whether or not each virtual gene cluster is a target gene cluster in the array data acquisition system of E. coli, with the horizontal axis as the origin gene ID on the genome.
- Horizontal axis hypothetical gene cluster origin gene ID, vertical axis: ⁇ ⁇ ⁇ .
- the present invention relates to a hypothetical gene composed of a plurality of genes arranged on a genomic DNA, the expression level variation ratio of the genes arranged on the genomic DNA generated under conditions that cause changes in physiological state of biological cells and control conditions.
- scoring is performed for each virtual gene cluster unit, and based on the obtained score, first, the gene cluster that includes the target gene that is the causative gene of the physiological state change is specified. And a method for specifying a target gene from the cluster.
- the present invention is also based on the above method as a basic principle, and a device for searching for a gene cluster containing a target gene in an organism genome and / or a target gene in the gene cluster (hereinafter simply referred to as the gene searching device of the present invention). Further, the present invention relates to a device for predicting the presence and size of a gene cluster to which a part of the device is applied.
- gene clusters containing useful genes in the genome can be targeted for search for any species, regardless of whether they are eukaryotes or prokaryotes.
- the method and apparatus of the present invention can be applied even if the boundaries of gene clusters are not clarified as long as the genome sequence is clarified. Useful genes in the cluster can be searched.
- the physiological state change in the present invention refers to, for example, changes in the amount of metabolite production in organisms, changes in types and amounts of secreted substances, differences in growth phase such as growth rate, growth of cells in stationary phase and interphase, etc. This refers to differences in division state, cell morphology and function (including differences in differentiation state such as hyphae, conidia, etc.), etc.
- the conditions for causing these physiological state changes and the control conditions are one contrasting condition. As a set, one or more of the contrast condition sets are set, the expression level of the genomic gene under each condition of each contrast condition set is measured, and the ratio (expression amount variation ratio) is obtained.
- Conditions that cause changes in physiological conditions include, for example, artificial induction of changes in physiological conditions by adjusting drug use, temperature, nutrient source, culture medium, culture time, etc.
- a time condition when a physiological state change occurs over time is also included.
- the control condition refers to a condition in which a change in physiological state does not occur or is small even if it occurs and can be compared with a change in physiological state under a condition that causes a change in physiological state. For example, when searching for gene clusters or genes involved in the production of secondary metabolites, secondary metabolite production induction conditions (or suppression conditions) and secondary metabolite production non-induction conditions as control conditions (or The expression level of the genomic gene is measured under production conditions.
- the above-mentioned secondary metabolite production inducing condition and secondary metabolite production non-inducing condition to be compared, or the secondary metabolite production inhibiting condition and the secondary metabolite production condition are conditions in which the metabolite production rate, amount, etc. are different.
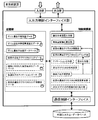
- the overall flow of the gene cluster and gene search method in the present invention is shown in FIG. Among these, the inside of a large square shown in gray (including two white squares) is a characteristic part of the present invention.
- the expression level of each gene arranged on the genomic DNA is measured by, for example, a microarray, but the other processes are mathematically performed based on the expression level data of the gene arranged on the genomic DNA. It can be performed by data processing, does not require experimentation, and the selection of the genomic gene for which the expression level is to be measured, etc. is hardly affected mechanically or by the special knowledge or intuition of the researcher. It can be carried out. Therefore, the search method of the present invention is extremely suitable for computer use.
- a useful gene can be searched quickly and efficiently, which has been difficult in the past, and it is difficult to produce metabolites, particularly secondary metabolites. It is particularly effective in searching for genes involved in and genes clusters containing the genes.
- the process of the present invention will be described more specifically.
- A) a method in which a plurality of genes arranged on the genomic DNA are combined in the order of sequence to construct virtual gene clusters having different sizes, and B) a position in the vicinity
- An example is a method of constructing a plurality of genes that may functionally constitute a gene cluster.
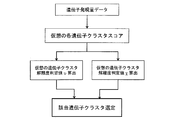
- the process of the present invention will be specifically described sequentially (see FIG. 1).
- 1) Measurement of expression level and acquisition of expression level variation ratio data when using the method of A) above In the case of the method A), in principle, for each gene arranged on the genomic DNA, the expression level is measured under conditions that cause changes in physiological conditions and under control conditions, and the ratio of the expression levels under both conditions is determined. And the expression level variation ratio (value calculated using the expression level under physiological condition changing conditions as the numerator and the expression level under control conditions as the denominator) The expression level can be measured by a method known per se using, for example, a microarray having probes specific to each gene arranged on genomic DNA.
- cells are cultured under one or more secondary metabolite production induction conditions (or suppression conditions), and genomic RNA is extracted from the cells. And the expression level of each gene on the genomic DNA is measured with a microarray having a probe specific to each gene on the genomic DNA.
- a control condition the expression level in the case of non-induction production conditions (or production conditions) of the above-mentioned secondary metabolite is measured, and the ratio of the expression levels under both conditions is taken. To do.
- each gene expression level can be measured by extracting mRNA from the cultured cells, labeling with a dye, etc., and immobilizing the oligo DNA having a part of the DNA sequence in each gene in each gene cluster as a probe on the substrate. Using labeled arrays, the labeled mRNA is hybridized to each oligo DNA, washed, and then the luminescence intensity is measured.
- Each virtual gene cluster is obtained by increasing the number of continuous genes on the genomic DNA from 2 to 1 to maximize the number of genes included in the assumed gene cluster.
- a genome consisting of linear DNA for each number of genes to be extracted from either end of the DNA, a genome consisting of circular DNA Is composed of each gene group extracted by sequentially shifting genes arranged on the genomic DNA one by one starting from an arbitrary gene.
- this virtual gene cluster construction technique includes the following technique.
- genomic gene is a linear genome
- N + 1 the number of consecutive genes on the genomic DNA is sequentially increased from 2 to 1 in the same direction toward the other end (N + 1).
- ncl the maximum number of genes included in the gene cluster
- the virtual gene cluster In the construction of the virtual gene cluster, a method of increasing one by two from two genes is adopted in that the virtual gene cluster is composed of a plurality of genes. It does not exclude the method of increasing each time. That is, in this case, the case of one gene is mixed in a virtual gene cluster to be constructed.
- a virtual gene gene cluster composed of a combination of two or more genes including the mixed gene is included. Since the score of the hypothetical gene cluster is always the sum of the expression level fluctuation ratios of the combined genes, if the target gene exists in the genome, it is compared with the score of this target gene alone.
- the score of the virtual gene cluster to be included is at least equal to or higher, and the above contamination is not a substantial problem. Therefore, as long as the virtual gene construction includes a method of increasing one gene at a time from two genes, it is included in the present invention even when one gene is increased at a time.
- the constructed virtual gene cluster is composed of each gene group shown in Table 1.
- each virtual gene cluster constructed by the above extraction is composed of the following gene groups.
- the number of virtual gene clusters constructed is 45, but these gene clusters are merely constructed on the data, and are not actually constructed by experiments.
- the actual number of genes on genomic DNA is 12084 registered in the external database DOGAN (http://www.bio.nite.go.jp/dogan/project/view/AO) in the case of Neisseria gonorrhoeae. It is 14032 in the case of those used for the creation of a DNA microarray platform by loosening the definition of genes.
- a virtual gene cluster is constructed from a region on the genome that is known to be continuous.
- the maximum number of genes to be extracted can theoretically be the number of genes in the genome, but it may be the maximum number of genes of the assumed gene cluster size. The number is about 30 at maximum, and it is not usually necessary to exceed this number.
- the method B) is simpler than the above method A) and is a gene involved in the production of secondary metabolites. It is particularly suitable for searching for clusters and genes for producing secondary metabolites in the clusters.
- This technique is based on (1) an enzyme gene belonging to an enzyme species assumed to be involved in secondary metabolism, (2) a transporter gene, and (3) a gene encoding a transcription factor.
- a virtual gene cluster is formed from these genes or by combining genomic genes so that these genes are included.
- the specific conditions located in the above should be within the upper limit of about 30 in terms of the number of genes arranged on the genome.
- the cells are cultured under conditions for inducing secondary metabolite production (or under suppression conditions), and genomic RNA is extracted from the cells.
- genomic RNA is extracted from the cells.
- the expression level of each gene in the genome is measured, and compared with the case where the secondary metabolite production is not induced (or production condition), Obtain the expression level fluctuation ratio.
- the expression level in the microarray is measured for all genes on the genomic DNA, but the target genes for extraction of the expression fluctuation amount are narrowed down, so only microarrays using probes having sequences corresponding to these genes are used. May be used.
- the above-mentioned secondary metabolite production inducing condition and secondary metabolite production non-inducing condition to be compared, or the secondary metabolite production inhibiting condition and the secondary metabolite production condition are conditions in which there is a difference in the metabolite production rate, amount, etc.
- no special experiment is required other than the measurement of the expression fluctuation amount, and mathematical data processing is performed.
- the identification of (1) an enzyme gene belonging to an enzyme species assumed to be involved in secondary metabolism, (2) a transporter gene, and (3) a gene encoding a transcription factor in the genome sequence is known. What is necessary is just to distinguish by the homology with the gene of the same enzyme species or a motif etc. For example, whether these genes exist in the gene sequence in each hypothetical gene cluster is determined by the enzyme, trans It can be identified by whether or not a base sequence encoding an amino acid sequence common to the motif unique to each amino acid sequence of the porter and transcription factor exists in the gene cluster. Commercial software can be used for these.
- the device user designates each gene in the stored location information of each gene on the genome based on the result of homology search or motif search in advance for the gene on the search target genome.
- this specified gene may be configured to be annotated, but the number of genes on the genome is extremely large, and commercially available software that performs the motif search described above is installed on the computer together with the attached motif information. It is preferable to use an external computer in which the software is stored together with motif information or stored in the apparatus of the present invention.
- a search corresponding to the motif corresponding to the expected function can be performed, and the gene to be annotated can be automatically selected. it can.
- another annotation assignment means after annotating all genes on the genome to be searched by the above motif search, select a gene that matches the expected function from the type of annotation (gene function) given May be.
- Annotation may be given to genomic genes with similar functions, or may be given to multiple types of genes with different types of functions.
- the annotation is given so that each function of the genomic gene can be identified.
- the gene to be selected by annotation is (1) involved in secondary metabolism in the genomic DNA sequence. It is possible to select an enzyme gene belonging to the assumed enzyme species, (2) a transporter gene, and (3) a gene encoding a transcription factor.
- the enzyme species is the chemical structure of the secondary metabolite, precursor, coenzyme involved, chemical / physical properties, examples of known enzyme reactions, production efficiency / speed
- the production reaction is estimated from the above, and the enzyme species involved are assumed, but in the assumption of this enzyme species, it is not necessary to assume the level of the specific enzyme that would actually participate in the reaction.
- the enzyme species at a more reliable level may be involved in the reaction. For example, if you know that the enzyme belongs to oxygenase, but you cannot identify the enzyme species of the subordinate concept, select the oxygenase level as the enzyme species, search the sequence of each gene on the genome, and Each of all the genomic genes to which it belongs may be a constituent gene of each virtual gene cluster.
- the range of the hypothetical gene cluster to be searched may be narrowed, and the search becomes more efficient accordingly.
- M is the score of each virtual gene cluster
- m is the expression level variation ratio of each gene selected based on the annotations included in each virtual gene cluster to be scored
- m ⁇ is all virtual
- s (m) is all genes selected based on the annotations included in all virtual gene clusters Represents the standard deviation of the expression level fluctuation ratio (m value).
- the overall distribution is generally a normal distribution, but is separated from such an overall score distribution. If there is a virtual gene cluster to be determined, it can be determined that it corresponds to at least the target gene cluster. That is, this hypothetical gene cluster is obtained by increasing the score, which is the total amount of expression fluctuation, as a result of cooperation of at least two genes in the cluster under the metabolite production induction condition.
- the genes in this hypothetical gene cluster can be identified as genes involved in the production of metabolites present in at least the actual gene cluster.
- the gene arranged on the genomic DNA has a target gene function, or the possibility that the target gene function has a low or no possibility
- the gene can be weighted by the following calculation formula.
- the weight w When it is estimated that the weight w is set to have the target gene function, the weight w is set to exceed 1, and when the possibility of having the target gene function is low or not possible is estimated , Set to be 0 or more and less than 1.
- the estimation of whether or not the target gene function has a low possibility can be determined by homology with a known gene or a motif in the same manner as described above, and the above-described annotation providing means can be used.
- the gene arranged on the genomic DNA has a target gene function, it has the target gene function from the virtual gene cluster constructed by the method of A). It is also possible to select a virtual gene cluster including the estimated gene and score only the selected virtual gene cluster.
- the number of virtual gene clusters to be scored can be reduced.
- the virtual gene cluster selected by this method may be the same as the virtual gene cluster constructed by the above method B) as a result. If a virtual gene cluster group is constructed, it is advantageous in that the function of a gene to be targeted freely or a gene cluster including the gene can be freely changed, and function-selective gene analysis can be easily performed. Moreover, since the score of the gene to which the corresponding annotation is not given can be included in consideration, it is possible to flexibly cope with the case where the influence of the gene whose function is unknown is large.
- the present invention composes a virtual gene cluster by combining a plurality of genes on the genomic DNA, and scores each virtual gene cluster by adding up the expression level fluctuation ratios under the physiological condition change conditions of these multiple genes. Based on this, the first method is to search for a target gene cluster. If a high score is obtained by scoring, it is the result of cooperation of multiple genes included in the virtual gene cluster, and the overall score is higher than the expression level variation ratio score of each gene alone. The specificity for the distribution becomes clearer. On the other hand, when a useful gene is detected only from the expression fluctuation amount of each gene as in the past, even the correct gene is absorbed in the overall score distribution, Even if it exists, verification of the gene disruption experiment etc. of whether it is a target gene is required.
- the expression level fluctuation ratio for the genes weighted as described above is added to the expression level fluctuation ratio of other genes in the scoring of each virtual gene cluster constructed in the method of A),
- the score of each hypothetical gene cluster containing genes that are presumed to have the target gene function is higher, and conversely, it is estimated that the possibility of having the target gene function is low or not
- the score of the hypothetical gene cluster containing the gene is lower, and the deviation from the overall score distribution becomes clear. Therefore, this makes it more efficient to search for a gene having a target gene function or a gene cluster including the gene.
- the determination value indicating the degree of deviation from the score distribution of the entire virtual gene cluster is based on the score calculated by the above process 3), for example, It is calculated from the calculation formula b) or c).
- the appearance frequency of the score M in the calculation formula b) is a value when the total of the appearance frequencies (P) of each score in the group including all of the virtual gene clusters is 1, and therefore exceeds 1 So logP will never be positive.
- the log P approaches - ⁇ as the frequency of appearance decreases, the absolute value of log P increases as the gene cluster has a low score value. Therefore, in the above calculation formula b), by multiplying logP and the score of each virtual gene cluster and multiplying by ⁇ 1, the one with a low frequency and a high score gives a larger judgment value I ( ⁇ ). Will have.
- the virtual gene cluster whose determination value I ( ⁇ ) exceeds 0 and shows a high value is far from the appearance frequency distribution with respect to the score of each virtual gene cluster, and the high determination value I Can be selected as a target gene cluster or a candidate corresponding to the target gene cluster.
- the selection of candidates is performed, for example, by selecting a certain number of virtual gene clusters in descending order of the determination value I, or selecting a virtual cluster whose determination value I shows a certain value or more.
- This decision value II ( ⁇ ) is obtained by dividing the score of each virtual gene cluster from the average score of the entire virtual gene cluster divided by the real number multiple of the standard deviation to the power of the number of dimensions (d ′). Therefore, the value is large in a hypothetical gene cluster having a score that deviates from the appearance frequency distribution with respect to the normal distribution-like score.
- d ′ is a positive integer dimension that can be arbitrarily set, and the larger the value, the more the distance from the average score is emphasized. If the value is too large, the value greatly deviating from the average score is emphasized and the other values are relatively small. Therefore, the value is usually set to 2 or 4. When it is desired to detect a detached object more sensitively, an even number of 6 or more is set.
- a in the equation is a coefficient representing the degree of divergence, and by adjusting this value, it is possible to adjust how much the deviation from the normal distribution-like distribution is taken.
- the number is less than 1, it is possible to pick up a smaller one.
- this calculation formula c as in the case of the determination value I, a virtual gene cluster showing a high value can be selected as a candidate corresponding to the target gene cluster or the target gene cluster. . Selection of candidates is performed, for example, by selecting a certain number of virtual gene clusters in descending order of the determination value II, or selecting a virtual cluster having the determination value II equal to or higher than a predetermined value.
- b is a threshold value for determining how many gene cluster candidates are narrowed down, and the larger b is, the higher the candidate narrowing effect becomes.
- the setting of the value of b depends on the target species and culture conditions. That is, if the candidate gene cluster is strong and highly expressed, it is necessary to increase the value. Conversely, if the expression intensity is weak and the number is small, the candidate gene does not appear unless the value is decreased.
- the former for example, it is set to an arbitrary value in the range of 5000 to 10,000 or 10,000 to 30,000, and in the case of the latter, it is usually set to 100 or more, for example, an arbitrary value in the range of 1000 to 2000, or 2000 to 5000. .
- Presence / absence of target gene cluster and size estimation when target gene cluster exists In the present invention, whether or not the target gene cluster exists in the genome in advance and when the target gene cluster exists Gene size (number of genes constituting the cluster; ncl) can be estimated.
- this method first, the expression level fluctuation ratio of the genes arranged on the genomic DNA generated under the conditions that cause changes in the physiological state of biological cells and the control conditions is added to obtain the score of the hypothetical gene cluster.
- the processes of measuring the amount, obtaining the expression variation ratio data, constructing the virtual gene cluster, and scoring each virtual gene cluster are the same processes as 1) to 3) in the method A) above. It is.
- the expression level fluctuation ratio of each gene on the genomic DNA generated under the conditions that cause changes in the physiological state of the biological cell and the control conditions is calculated as a hypothetical gene composed of a plurality of genes on the genomic DNA.
- scoring is performed for each virtual gene cluster unit.
- Each virtual gene cluster is divided into two genes from one continuous gene on the genomic DNA. Extract until the maximum number of genomic genes included in the expected gene cluster, and for each number of genes extracted in the extraction, in the case of a genome consisting of linear DNA, one of the DNAs In the case of a genome consisting of circular DNA or from the end of DNA, sequence on genomic DNA in order from any gene Constituting from each gene group extracted by shifting one by one that gene.
- the score of each gene cluster configured in this way is calculated by the following calculation formula a) in the same manner as the process 3) in the method A).
- the virtual gene cluster does not form a cluster in the actual genomic DNA, the expression level fluctuation is not involved in the change in the physiological state of the target contained in the virtual gene cluster.
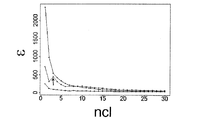
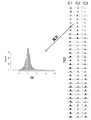
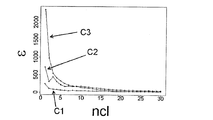
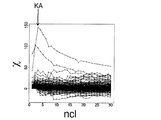
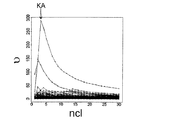
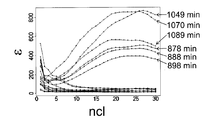
- the hypothetical gene cluster score (M) is averaged, that is, the ⁇ value increases monotonically as the size increases. Decrease (see first and third curves from the top in FIG. 2).
- the distribution bias ⁇ increases in that size and does not become the above monotonically decreasing curve, and the ⁇ value indicates a singular point in that size. (See the point indicated by the arrow in FIG. 2). Therefore, it is possible to estimate the presence and size of a gene cluster from whether or not the ⁇ value forms a singular point and the size of the gene cluster that formed the singular point.
- the ⁇ value ( ⁇ (k)) when the number of genes is (k) and the ⁇ value when the number is around If ( ⁇ (k-1), ⁇ (k + 1)) has the following relationship, it is determined that the target gene cluster exists in the genome, and the number of genes included in the target gene cluster is predicted to be k. Can do.
- This technique is effective as a technique to be performed in advance when performing the target gene cluster search method according to the present invention, in particular, the technique B). That is, if a gene cluster exists and its size can be predicted, an enzyme gene belonging to the target enzyme species, (2) a transporter gene, and (3) a gene encoding a transcription factor exist within the expected size. What is necessary is just to search only the genome arrangement
- this method can be used to change the physiological state of a cell under certain conditions. Even when the mechanism itself is not completely known, whether the cause of the change is the linkage of genes in the gene cluster or the gene size of the cluster can be easily predicted by the linkage of genes in the gene cluster. In other words, this method can clarify that the cause of the physiological change of organisms is caused by the cooperation of genes in a gene cluster when it is caused by the linkage of multiple genes that are extremely difficult to search, and It is extremely useful in that its size can be predicted.
- the gene search apparatus of the present invention performs mathematical data processing based on the expression level data of genes arranged on genomic DNA, and is not affected by the special knowledge or intuition of the researcher. It becomes possible to search for useful genes efficiently, and is particularly effective in searching for metabolites that have been difficult in the past, particularly genes involved in the production of secondary metabolites and gene clusters containing the genes.
- the gene search apparatus of the present invention is constituted by at least the following means a) to f). a) Means for inputting expression level data of each gene arranged on the genomic DNA under conditions that cause changes in the physiological state of biological cells and control conditions.
- FIG. 2 An overview of the device of the present invention with such means is shown in FIG.
- a dotted line portion indicates data that is preferably stored in the apparatus of the present invention and a processing portion related to the data.
- the apparatus of the present invention includes a data input / output unit (keyboard, mouse, display, etc.), an input / output control interface for controlling the input / output unit, a storage unit (hard disk), a main storage unit (memory), and a control calculation unit (CPU). ), Including a communication control interface connected to an external network.
- the storage unit of this device stores the expression level data of each gene, the expression level fluctuation ratio data, the gene position data on the genome, and the score data of the virtual gene cluster. Data on gene function corresponding to, annotation data of each gene, and score divergence data of virtual gene clusters are sequentially stored.
- control calculation unit includes a calculation unit for the expression level variation ratio of each gene in the genome, a virtual gene cluster construction unit that constructs a virtual gene cluster based on the position information of the genes on the genome, and the above calculation At least a hypothetical gene cluster scoring unit that sums up the expression level fluctuation ratios and scores the hypothetical gene cluster is provided.
- annotation unit for each gene, the weighting unit for weighting the virtual gene gene according to the annotation, and the virtual gene cluster construction are limited to the selected functional gene.
- a functional gene selection unit a virtual gene cluster divergence calculation unit that calculates the degree of divergence from the entire distribution of virtual gene clusters, and further selection of gene cluster candidates is sufficient with the calculated divergence degree If it is not possible, a gene cluster candidate narrowing-down unit that narrows down gene cluster candidates may be provided.
- the gene search device of the present invention it is possible to further possess the function of predicting the presence / absence of the target gene cluster and the size of the target gene cluster, if the device configuration remains the same.
- a size scoring unit for scoring for each size of the virtual gene cluster and a virtual gene cluster distribution determination value ( ⁇ ) calculation unit are provided.
- This device does not require a special computer, and consists of a general control processing unit (CPU), main storage (memory), storage (hard disk), and input / output devices (keyboard, mouse, display) Can be configured.
- CPU general control processing unit
- main storage memory
- storage hard disk
- input / output devices keyboard, mouse, display
- any of Linux, Windows, and Mac can be used, but a 64-bit one is more preferable in consideration of the memory space.
- the memory is preferably 2 GB or more if possible, but even if it is about 1 GB, it can be a microorganism.
- the positional information of each gene on the genome and the base sequence database corresponding to the function are NCBI (http://www.ncbi.nlm.nih.gov/) and InterproScan (http: //www.ebi. External databases such as ac.uk/Tools/InterProScan/) can be used.
- A) Gene search device 1 Input of expression amount data of each gene arranged on genomic DNA and calculation of expression amount variation ratio
- all genes arranged on genomic DNA are physiologically Measure the expression level under condition change condition and control condition, input the expression level data of each gene to the input means of the device of the present invention, and change the expression level based on the input expression level data of each gene A ratio is calculated.
- the expression level can be measured, for example, by means known per se using a microarray having probes specific to each gene arranged on the genomic DNA.
- a useful gene involved in the production of a metabolite particularly a secondary metabolite
- cells are cultured under one or more secondary metabolite production induction conditions (or suppression conditions), and genomic RNA is extracted from the cells.
- genomic RNA is extracted from the cells.
- the expression level of each gene on the genomic DNA is measured with a microarray having a probe specific to each gene on the genomic DNA.
- control condition the expression level in the case of non-induction production conditions (or production conditions) of the above-mentioned secondary metabolite is measured, and the ratio of the expression levels under both conditions is taken. To do.
- the expression level of each gene can be measured, for example, by extracting mRNA from the cultured cells, labeling with a dye or the like, and immobilizing an oligo DNA having a part of the DNA sequence in each gene as a probe on a substrate.
- the labeled mRNA is hybridized to each oligo DNA, washed, and then measured for emission intensity and the like.
- the light emission intensity of each gene in the microarray is read by, for example, an image reading means accompanied by a scanning means in the microarray reading apparatus, and the read light emission intensity is digitized and input to the apparatus of the present invention by the input means a).
- an image reading apparatus a commercially available apparatus can be used. However, all the means of such a reading apparatus or some means such as a digitizing means is incorporated in the apparatus of the present invention, or the reading apparatus You may design so that it can input automatically into the input means of this invention apparatus via the numerical data to output.
- the digitized data on the luminescence intensity of the gene input to the device of the present invention is stored in the storage unit of the device of the present invention, and the stored digitized data for each condition is stored in each storage device.
- Expression level variation ratio value calculated with the expression level under physiological condition change as the numerator and the expression level under the control condition as the denominator
- the expression level fluctuation ratio is calculated for each (same gene). This calculation includes correction of distortion due to the expression intensity of each gene as necessary. In other words, the value of the expression level fluctuation ratio of a gene depends on the intensity of expression, and the value may be emphasized due to the influence of noise. Perform background correction.
- the Rowess algorithm in R which is free software, can be used.
- the calculated expression level variation ratio of each gene is stored in the storage unit of the device of the present invention.
- the expression level fluctuation ratio is obtained in advance from the expression level data under both conditions described above, and this expression level fluctuation amount is input to the apparatus and stored in the storage device of the apparatus. You may let them.
- each gene on the genome including the continuous information and / or position number of the gene on the genome is used as means for constructing this virtual gene cluster.
- Location information and a virtual gene construction program for constructing a virtual gene cluster are stored.
- Each virtual gene cluster is constructed by executing the virtual gene cluster construction program based on the position information of each gene on the genome. That is, a virtual gene cluster is extracted by increasing the number of genes one by one from two consecutive genes on the genomic DNA in the same direction until the maximum number of genes included in the assumed gene cluster is reached.
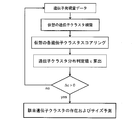
- the virtual gene cluster construction program is stored in the memory of the present invention device. Based on the position information of each gene on the genomic DNA stored in the apparatus, the following processing means is executed. The procedure is shown in FIG. In FIG. 3, N represents the number of genes constituting the virtual gene cluster.
- genomic gene is a linear genome
- N + 1 the number of consecutive genes on the genomic DNA is sequentially increased from 2 to 1 in the same direction toward the other end (N + 1).
- N + 1 the maximum number of genes included in the gene cluster
- a plurality of gene groups including genes as starting points and having different numbers of genes are configured.
- a virtual gene cluster composed of a gene group obtained by combining a plurality of genes is constructed together with the gene group of a).
- the virtual gene cluster In the construction of the virtual gene cluster, a method of increasing one by two from two genes is adopted in that the virtual gene cluster is composed of a plurality of genes. It does not exclude the method of increasing each time. That is, in this case, the case of one gene is mixed in a virtual gene cluster to be constructed.
- a virtual gene gene cluster composed of a combination of two or more genes including the mixed gene is included. Since the score of the hypothetical gene cluster is always the sum of the expression level fluctuation ratios of the combined genes, if the target gene exists in the genome, it is compared with the score of this target gene alone.
- the score of the virtual gene cluster to be included is at least equal to or higher, and the above contamination is not a substantial problem. Therefore, as long as the virtual gene construction includes a method of increasing one gene at a time from two genes, it is included in the present invention even when one gene is increased at a time.
- the position information of each gene on the genome is used for gene matching in the following hypothetical gene cluster scoring by adding the same position information to the expression level data by microarray. It is also an identification means when selecting a virtual gene cluster with a specific gene weighting or a specific gene.
- the sequence of the input genes can be stored as a gene position number, and a virtual gene cluster can be constructed using the position number.
- the virtual gene cluster construction program may be configured to set an upper limit on the number of genes to be combined based on the command.
- the upper limit depends on the gene cluster to be searched, but in most cases, a maximum of 30 is sufficient.
- the virtual gene cluster constructed in this way is stored in the storage unit.
- the virtual gene cluster to be constructed is composed of the following gene group when there are 10 genes A to J arranged on the genomic DNA as follows (Table 1).
- the number of virtual gene clusters constructed is 45, but each of these gene clusters is only constructed based on data processing in the apparatus of the present invention, and is actually constructed by experiments. It is not something.
- the actual number of genes on genomic DNA is 12084 registered in the external database DOGAN (http://www.bio.nite.go.jp/dogan/project/view/AO) in the case of Neisseria gonorrhoeae. It is 14032 in the case of those used for the creation of a DNA microarray platform by loosening the definition of genes.
- a virtual gene cluster is constructed from a region on the genome that is known to be continuous.
- the maximum number of genes to be extracted can theoretically be the number of genes in the genome, but it may be the maximum number of genes of the assumed gene cluster size. The number is about 30 at the maximum, and it is not usually necessary to construct a gene cluster beyond this number.
- Each virtual gene cluster constructed as described above is scored by the scoring means of the device of the present invention.
- the scoring means is executed by a scoring program stored in the processing calculation unit of this apparatus (FIG. 4).
- the program calls the expression level variation ratio data of each gene on genomic DNA and the constructed virtual gene cluster information stored in the storage unit, and constructs each gene and each expression constituting the virtual gene cluster.
- the means of calculating the score of each hypothetical gene cluster is executed by collating the genes of the quantity fluctuation ratio data and adding the expression quantity fluctuation ratio of each gene using the following calculation formula a.
- the obtained score of each virtual gene cluster is output and / or stored in the storage unit.
- all genes included in all virtual gene clusters refer to all genes on genomic DNA extracted to constitute all virtual gene clusters.
- the overall distribution is generally a normal distribution, but is separated from such an overall score distribution. If there is a virtual gene cluster to be determined, it can be determined that it corresponds to at least the target gene cluster.
- this hypothetical gene cluster is obtained by increasing the score, which is the total amount of expression variation, as a result of cooperation of at least two genes in the cluster under physiological condition change conditions such as induction of metabolite production.
- a gene in this virtual gene cluster can be identified as a gene involved in a physiological state change such as metabolite production present in at least the actual gene cluster. Furthermore, for example, by examining the genes in the virtual gene cluster and, if necessary, the metabolite production mechanism, not only target genes directly involved in metabolite production but also discovery of genes with unknown functions can be expected. Furthermore, the overall picture of the metabolite production mechanism can also be clarified.
- Annotation In the gene search device of the present invention, means for giving an annotation to each gene on the input genome can be provided. Annotation is performed when a gene on the genome is presumed to have a target gene function, or when the possibility of having a target gene function is low or impossible. Such annotation is performed on the genes in the position information of each gene on the genome stored in the storage unit based on the base sequence information of each gene on the search target genome.
- the device user designates genes in the position information of each gene on the stored genome one by one based on the results of homology search or motif search in advance for the genes on the search target genome.
- the specified gene may be configured to be annotated, but the number of genes on the genome is extremely large, and commercially available software for performing the motif search described above together with the attached motif information It is preferable that the software can be connected to an external computer stored with the motif information.
- the base sequence information of each gene on the genome to be searched is input to the input means of the apparatus of the present invention or input to an external computer, so that the motif corresponding to the expected function is searched and annotated. Genes can be selected automatically.
- a gene that matches the expected function is selected from the type of annotation (gene function) given. You may choose.
- the selected gene is collated with each gene in the position information of the gene on the genome stored in the storage unit of the device of the present invention. According to such a system, annotation can be automatically assigned without bothering a researcher.
- Annotation may be given to genomic genes having the same function, or may be given to a plurality of types of genes having different types of functions.
- the annotation is given so that each function of the genomic gene can be identified. For example, when targeting a gene cluster involved in secondary metabolite production or a gene therein, the gene to be selected by annotation is (1) involved in secondary metabolism in the genomic DNA sequence. It is possible to select an enzyme gene belonging to the assumed enzyme species, (2) a transporter gene, and (3) a gene encoding a transcription factor.
- the weight w When it is estimated that the weight w is set to have the target gene function, the weight w is set to exceed 1, and it is estimated that the target gene function has low or no possibility. If possible, it is set to be 0 or more and less than 1.
- the estimation of whether or not the target gene function is low or its possibility may be determined by homology with a known gene, a motif, or the like, as described above.
- a virtual gene cluster including genes selected based on the annotation is selected from the constructed virtual gene clusters, and this selection is performed.
- a program for performing scoring for the virtual cluster of the virtual gene may be stored.
- Such means is effective when it is presumed to have the target gene function, and is particularly effective, for example, in searching for a functional gene involved in the production of the secondary metabolite described above.
- the number of virtual gene clusters to be scored can be reduced, and the scoring time can be shortened.
- the virtual gene cluster selected by this method is constructed by the selected functional genes shown in 5) Virtual gene cluster scoring 2 when a gene is selected based on the annotation described later.
- the present invention composes a virtual gene cluster by combining a plurality of genes on the genomic DNA, and scores each virtual gene cluster by adding up the expression level fluctuation ratios under the physiological condition change conditions of these multiple genes. Based on this, first, the present invention relates to an apparatus for searching for a target gene cluster. If a high score is obtained by scoring, it is the result of cooperation of multiple genes included in the virtual gene cluster, and the overall score is higher than the expression level variation ratio score of each gene alone. The specificity for the distribution becomes clearer. On the other hand, when a useful gene is detected only from the expression fluctuation amount of each gene as in the past, even the correct gene is absorbed in the overall score distribution, Even if it exists, verification of the gene disruption experiment etc. of whether it is a target gene is required.
- the expression level fluctuation ratio for the genes weighted as described above is added to the expression level fluctuation ratio of other genes in the scoring of each hypothetical gene cluster, and the target gene function is present. Then, the score of each hypothetical gene cluster including the estimated gene is higher, and conversely, the hypothetical gene cluster including the gene that is estimated to be less likely or not likely to have the targeted gene function. The score becomes lower and the deviation from the overall score distribution becomes clear. Therefore, this makes it more efficient to search for a gene having a target gene function or a gene cluster including the gene.
- Virtual gene cluster scoring 2 when genes are selected by annotation on the other hand, one or more, preferably two or more functional genes are extracted for each type of annotation for genes existing in the vicinity of the genome, or the genome is included so that these genes are included.
- a means for constructing a cluster of virtual genes can be provided by extracting genes on DNA to form virtual gene clusters. According to this, the number of gene clusters to be scored can be greatly reduced, the amount of processing data is small and simple, gene clusters involved in the production of secondary metabolites, and secondary metabolism in the clusters. It is particularly suitable for searching for product production genes.
- the program for executing such processing FIG.
- 6) is based on the condition that the gene selected by annotation is located in the vicinity on the genomic DNA based on the position information of the gene on the genome stored in the storage unit. Extract one or more, preferably two or more of the selected genes, and construct a virtual gene cluster or extract genomic genes so that at least these selected genes are included.
- a virtual gene cluster For example, when only functional genes are combined in the construction of these virtual gene clusters, the number of genes arranged on the genome is within the upper limit of about 30.
- the range of functional genes to be combined is input,
- the program selects functional genes to be combined based on this. The program selects a gene to be combined based on the type of annotation given to the gene and the position number in the position information of each gene on the genome stored in the storage unit.
- the target is an enzyme gene belonging to an enzyme species assumed to be, (2) a transporter gene, and (3) a gene encoding a transcription factor.
- the virtual gene cluster may be composed of AC and GJ, and may be composed of ABC and GHIJ so that these genes are included, and each virtual gene cluster such as ABCDE or FGHIJ.
- Each virtual gene cluster may be configured by dividing the genome so that is composed of a certain number of genes.
- an enzyme gene belonging to an enzyme species assumed to be involved in secondary metabolism (2) a transporter gene, and (3) a gene encoding a transcription factor are identified by the same known enzyme. What is necessary is just to discriminate
- the enzyme species is the chemical structure of the secondary metabolite, precursor, coenzyme that can be involved, chemical and physical properties, examples of known enzyme reactions, production efficiency and speed
- the production reaction is estimated from the above, and the enzyme species involved are assumed, but in the assumption of this enzyme species, it is not necessary to assume the level of the specific enzyme that would actually participate in the reaction.
- the enzyme species at a more reliable level may be involved in the reaction. For example, if you know that the enzyme belongs to oxygenase, but you cannot identify the enzyme species of the subordinate concept, select the oxygenase level as the enzyme species, search the sequence of each gene on the genome, and Each of all the genomic genes to which it belongs may be a constituent gene of each virtual gene cluster.
- the range of the hypothetical gene cluster to be searched may be narrowed, and the search becomes more efficient accordingly.
- scoring of each virtual gene cluster combining such functional genes may be performed using only the expression level variation ratio of the selected functional gene in the calculation by the calculation formula 1a).
- the scoring program described in 3) Scoring of virtual gene clusters can be used.
- the definition of the calculation formula 1a) is as follows: “In the above formula, M is a score of each virtual gene cluster, m is each selected based on the annotation provided in each virtual gene cluster to be scored.
- m- is the average expression fluctuation ratio (m value) of all genes selected based on annotations included in all virtual gene clusters
- s (m) is all virtual genes It represents the standard deviation of the expression level variation ratio (m value) of all genes selected based on the annotations included in the cluster.
- the display medium such as a screen display and / or paper in the form calculated by the virtual gene clustering scoring or the processed form as described above.
- a means for outputting can be provided.
- the display means for example, virtual gene clusters are displayed in descending order of scores, or graphs showing the distribution state of virtual gene cluster scores are listed, and further, genes included in the virtual gene clusters are displayed. Means can be provided, and based on these, a virtual gene cluster can be selected. On the other hand, a virtual gene cluster having a high score and deviating from the overall distribution is highly likely to be a virtual gene cluster that matches or corresponds to an actual target gene cluster.
- the means 7) or 8) shown below selects target gene cluster candidates or further narrows candidates by looking at the degree of deviation of the score of each virtual gene cluster from the overall score.
- These means 7) or 8) are provided in the device of the present invention, and the selection value I ( ⁇ ), the determination value II ( ⁇ ) or the narrowing result (b value) indicating the degree of deviation is selected as described above. Can be displayed together with the generated virtual gene cluster and the genes contained therein. By these, the target gene cluster and the target gene contained in the gene cluster can be specified.
- the apparatus of the present invention can further include means for selecting a virtual gene cluster having a score that deviates from the score distribution of the entire virtual gene cluster as a target gene cluster candidate.
- FIG. 7 shows a procedure for determining the degree of deviation from the overall distribution of the score of such a virtual gene cluster in the apparatus of the present invention.
- the candidate selection means stores a divergence degree determination program for calculating a determination value indicating the degree of divergence from the score distribution of the entire virtual gene cluster. There are two types of divergence determination programs.
- Execute FIG. 7
- the selection result is output together with the determination value, an average value of the divergence degree or the like may also be output.
- the appearance frequency of the score M in the calculation formula b) is a value when the total of the appearance frequencies (P) of each score in the group including all of the virtual gene clusters is 1, and therefore exceeds 1 So logP will never be positive.
- the log P approaches - ⁇ as the frequency of appearance decreases the absolute value of log P increases as the gene cluster has a low score value. Therefore, in the above calculation formula b), by multiplying logP and the score of each virtual gene cluster and multiplying by ⁇ 1, the one with a low frequency and a high score gives a larger judgment value I ( ⁇ ). Will have. On the other hand, a low frequency and low score has a smaller negative determination value I ( ⁇ ).
- the virtual gene cluster whose determination value I ( ⁇ ) exceeds 0 and whose absolute value is high is separated from the appearance frequency distribution for the score of each virtual gene cluster,
- a hypothetical gene cluster having a determination value I having a high absolute value can be selected as a target gene cluster or a candidate corresponding to the target gene cluster.
- This decision value II ( ⁇ ) is obtained by dividing the score of each virtual gene cluster from the average score of the entire virtual gene cluster divided by the real number multiple of the standard deviation to the power of the number of dimensions (d ′). Therefore, the value is large in a hypothetical gene cluster having a score that deviates from the appearance frequency distribution with respect to the normal distribution-like score.
- d ′ is a positive even number of dimensions that can be arbitrarily set, and the larger the value, the more the distance from the average score is emphasized. If the value is too large, the value greatly deviating from the average score is emphasized and the other values are relatively small. Therefore, the value is usually set to 2 or 4.
- a in the equation is a coefficient representing the degree of divergence, and by adjusting this value, it is possible to adjust how much the deviation from the normal distribution-like distribution is taken.
- the number is less than 1, it is possible to pick up a smaller one.
- a virtual gene cluster showing a high value can be selected as a candidate corresponding to the target gene cluster or the target gene cluster. .
- the apparatus of the present invention can store a candidate narrowing program for performing calculation according to the following calculation formula d) as gene cluster candidate narrowing means (FIG. 8). That is, for each virtual gene cluster, it is possible to further narrow down target gene cluster candidates by excluding at least a virtual cluster having b of less than 100 from the product of the determination values I and II. .
- b is a threshold value for determining how many gene cluster candidates are narrowed down, and the larger b is, the higher the candidate narrowing effect becomes.
- the setting of the value of b depends on the target species and culture conditions. That is, if the candidate gene cluster is strong and highly expressed, it is necessary to increase the value. Conversely, if the expression intensity is weak and the number is small, the candidate gene does not appear unless the value is decreased.
- the former case for example, it is set to an arbitrary numerical value in the range of 5000 to 10,000 or 10,000 to 30,000, and in the latter case, it is usually set to an arbitrary numerical value in the range of 100 or more, for example, 1000 to 2000, or 2000 to 5000. .
- a gene cluster prediction apparatus an apparatus for estimating a size (number of genes constituting a cluster; ncl) (hereinafter referred to as a gene cluster prediction apparatus) can be given.
- An outline of this gene cluster prediction apparatus in the apparatus of the present invention is shown in FIG.
- a virtual gene cluster score is obtained by adding up the expression level fluctuation ratios of genes arranged on the genomic DNA generated under the control conditions under conditions that cause changes in the physiological state of biological cells.
- the means for inputting the expression level data of each gene arranged on the genomic DNA, calculating the expression level fluctuation ratio, constructing a virtual gene cluster, and scoring each virtual gene cluster are the above 1) to 3) It is the same as the means described in).
- this apparatus is the above-described gene search apparatus of the present invention, in which a) means for inputting the expression level of each gene arranged on the genomic DNA generated under conditions that cause changes in physiological state of biological cells and control conditions; b A) expression level fluctuation ratio calculating means for calculating the ratio of the expression level of the same gene under the above two input conditions; c) the expression level fluctuation ratio of each gene arranged on the genomic DNA was constructed by a plurality of genes.
- the virtual gene cluster unit has a means for scoring for each virtual gene cluster unit by adding the expression level variation ratios of the virtual gene cluster unit, and the virtual gene cluster construction means Increase the number of genes from 2 by one until extraction reaches the maximum number of genomic genes included in the assumed gene cluster, and
- the virtual gene cluster construction means Increase the number of genes from 2 by one until extraction reaches the maximum number of genomic genes included in the assumed gene cluster, and
- a genome consisting of linear DNA for each number of genes to be extracted in step 1, on the genomic DNA in order starting from either end of the DNA or in the case of a genome consisting of circular DNA
- Is a means for making each gene group extracted while shifting the genes arranged one by one into virtual gene clusters, and storing a program for performing calculation according to the following calculation formula a) as scoring means Then, it is common with the gene search apparatus of this invention.
- the characteristic points of this apparatus are the processes of the means 1 to 3) described above, and based on the output score of each virtual gene cluster, d) determination of gene cluster distribution for each number of genes included in the virtual gene cluster It is in the means for calculating the value ( ⁇ ), and the gene cluster distribution judgment value ( ⁇ value) calculation program is stored as a program for executing this means (FIG. 9).
- the virtual gene cluster does not form a cluster in the actual genomic DNA, the expression level fluctuation is not involved in the change in the physiological state of the target contained in the virtual gene cluster.
- the hypothetical gene cluster score (M) is averaged, that is, the ⁇ value increases monotonically as the size increases. Decrease (see the first and third curves from the top in FIG. 10).
- the distribution bias ⁇ increases in that size and does not become the above monotonically decreasing curve, and the ⁇ value indicates a singular point in that size. (See the point indicated by the arrow in FIG. 10). Therefore, it is possible to estimate the presence and size of a gene cluster from whether or not the ⁇ value forms a singular point and the size of the gene cluster that formed the singular point.
- the gene cluster prediction apparatus of the present invention may be configured as an independent apparatus having the means a) to d), but the means a) to c) are common to the gene search apparatus of the present invention. Therefore, means for calculating a gene cluster distribution judgment value ( ⁇ ) for each gene number unit is further provided in the gene search device of the present invention, and the presence or absence of the target gene cluster and the size of the gene cluster are included in the gene search device of the present invention.
- a prediction function may be added. Such a prediction function is effective as a technique to be performed in advance when a virtual gene cluster is constructed by combining a plurality of selected functional genes using the gene search apparatus of the present invention and scoring is performed.
- a gene cluster exists and its size can be predicted, an enzyme gene belonging to the target enzyme species, (2) a transporter gene, and (3) a gene encoding a transcription factor exist within the expected size. Only the genome sequence can be searched as the virtual gene cluster.
- this gene cluster prediction apparatus when a cell undergoes some physiological state change under a certain condition, if the condition for contrasting the change can be set regardless of any physiological state change, the cause Even if the mechanism of the change of the gene itself is completely unknown, whether the cause of the change is the linkage of the gene in the gene cluster or the gene size of the cluster in the case of the linkage of the gene in the gene cluster. Easy to predict. In other words, this technique can clarify that the cause of the physiological change of an organism is caused by the cooperation of genes in a gene cluster when it is caused by the linkage of multiple genes that are extremely difficult to search, and It is extremely useful in that its size can be predicted.
- Reference example 1 Identification of genes essential for the production of kojic acid
- this reference example first searches for and identifies kojic acid-producing genes of Aspergillus oryzae using conventional methods. It is shown.
- Aspergillus oryzae strain RIB40 (hereinafter simply referred to as Aspergillus oryzae) is a liquid medium having the following composition under conditions of 30 ° C. and 150 rpm.
- Kojic acid is produced in the culture medium. Place 250 mL of medium in a 500 mL knotted Erlenmeyer flask and inoculate a spore suspension of Aspergillus oryzae to 105-107 / mL.
- kojic acid production medium 10% (W / V) glucose 0.25% (W / V) Yeast Extract 0.1% (W / V) K 2 HPO 4 0.05% (W / V) MgSO 4 ⁇ 7H 2 O After adjusting the pH to 6.0, sterilize by autoclaving.
- the production of kojic acid by the above culture by Aspergillus oryzae can be detected by red coloration due to the formation of a chelate compound of kojic acid and ferric chloride.
- a solution obtained by adding a high concentration ferric chloride solution to a sample obtained by appropriately diluting a culture supernatant or the like to a final concentration of about 10 mM and measuring the absorbance at a wavelength of 500 nm
- the absorbance at a wavelength of 500 nm is proportional to the concentration of kojic acid in the range of about 0.1 to 1.0.
- production can be detected on the third or fourth day after inoculation, and kojic acid is produced at a sufficient rate on at least the seventh day.
- Kojic acid production is inhibited by adding 0.1% (W / V) or more of sodium nitrate to the production medium. This inhibition by sodium nitrate is reversible.
- the fungus starts production of kojic acid by transferring the hyphae inhibited by the addition of sodium nitrate to a newly prepared medium that satisfies the production conditions after washing the medium components.
- the genes shown in Table 2 are genes whose expression is remarkably increased under the production conditions of kojic acid under the two conditions to be compared with each other. That is, it is a gene that is highly likely to be an essential gene for the production of kojic acid. About these genes, gene deletion destruction experiment was performed from the top.
- each of the three systems C1 to C3 is a comparison of two conditions in which the production amount of kojic acid is significantly different. Therefore, ideally, it was expected that genes essential for kojic acid production would appear at the top in any system. In reality, however, no genes were higher in all three systems.
- both AO090113000136 and AO090113000138 genes significantly reduce the production of kojic acid by disruption. Since the above two genes do not have an orthologous relationship with genes whose functions in the genomes of other species are known, it was impossible to know the functions of both genes from the genome information. However, there are known sequence motifs scattered in the amino acid sequence of the gene, and it was possible to predict the outline of the function.
- the gene of AO090113000136 has a FAD-dependent oxidoreductase motif. When considering the conversion of glucose to kojic acid, it is expected that multiple redox reactions are involved in the conversion process, so this gene is an enzyme in the biosynthesis of kojic acid. Strongly suggest.
- AO090113000138 has a sequence motif related to membrane transport and is classified as Major facilitator superfamily. It is clear that kojic acid produced during the biosynthesis of kojic acid is secreted into the medium, suggesting that this gene is essential for the production of kojic acid.
- the distributions in the systems C1 to C3 are shown in FIGS.
- Table 3 in the system C2, the corresponding three genes are in the first place, such as the 1st, 6th, and 71st positions, and identification of essential genes is relatively easy with this system array.
- the system C3 although the production of kojic acid is noticeable, the value of the essential gene is at most 2658 and is not seen at the top. Based on this array, it is virtually impossible to specify genes by conventional methods. In addition, in situations where the essential genes are not known, it is difficult to even determine which array can give the correct answer.
- it was possible with the method shown above to identify that three genes are essential for kojic acid production using only the three array data shown here Large and less general. Even in the case of estimation based on function annotations, there is a possibility that it will not be understood unless more than 100 genes are destroyed. In this case, verification usually takes about three years or more.
- Example 1 Identification of kojic acid synthesis gene by gene cluster scoring in Aspergillus oryzae According to the identification method of the relevant gene filed in this patent, the gene cluster consisting of kojic acid production related genes of Aspergillus oryzae is identified did.
- the apparatus used in this experiment is composed of a data input / output device, an input / output interface, a storage device, and a control arithmetic device (CPU).
- the control arithmetic device comprises an expression level variation ratio calculation unit, a virtual gene cluster construction unit , A virtual gene cluster scoring unit, a virtual gene cluster divergence degree determination value calculation unit, a gene cluster candidate narrowing unit, and a gene cluster prediction unit.
- a program, a virtual gene cluster construction program, a virtual gene cluster scoring program, a divergence degree determination value ( ⁇ ) and ( ⁇ ) calculation program, a candidate narrowing program, and a gene cluster distribution determination value ( ⁇ ) calculation program are stored. Yes.
- the calculations in these parts were performed on the Linux operating system using Free Software R and the programming language Perl.
- the DNA microarray data used was the same as in Reference Example 1. That is, the following two-color method data in the C1-C3 system were measured using the culture conditions for producing kojic acid as the numerator and the control culture conditions as the denominator.
- the hybridization is performed on the oligo DNA on the array, the detection wavelength intensity information is input, and the expression level fluctuation ratio calculation program stored in the expression level fluctuation ratio calculation unit is applied to change the expression level fluctuation ratio (m Value).
- m Value expression level fluctuation ratio
- the expression level fluctuation ratio of the 5179 genes whose expression is commonly confirmed in the systems C1 to C3 is collated with each gene included in the constructed virtual gene cluster, thereby scoring the virtual gene cluster.
- Each of the virtual gene clusters constructed as described above was scored according to the calculation formula a) by applying a partial scoring program to obtain a score (M value).
- M value a score
- genes whose expression was not confirmed in common in the systems C1 to C3 and no signal was detected were counted as components of the hypothetical gene cluster, but calculations were performed without entering values.
- a predetermined number (1 to 30) of genes cannot be combined for the genes located on the end side of the genome, but in this case, scoring was performed with the maximum number of genes that can be combined. In this way, the estimation of the gene cluster is not essentially affected.
- FIG. 14 shows the histogram. As you can see from the enlarged image on the left, if there is a hypothetical gene cluster that has a high M value outside the normal distribution-like population with a mountain shape centered on zero, the center of the mountain is on the left side in the histogram representing the whole. Sneak away.
- the gene cluster score distribution determination value ⁇ in the systems C1 to C3 was calculated according to the calculation formula e) (FIG. 15). Specifically, the score of each virtual gene cluster stored in the apparatus of the present invention is called, a gene cluster distribution determination value ( ⁇ ) calculation program stored in the gene cluster prediction unit is applied, and a calculation formula e) Thus, the gene cluster score distribution judgment value ⁇ in the systems C1 to C3 was calculated (FIG. 15). In the calculation, the number n of virtual gene clusters in the calculation formula e) was 5179, and virtual gene clusters not including any of the 5179 genes with the expression level data were excluded. The dimension number d is 6.
- the ⁇ value basically decreases monotonously in any of the systems C1 to C3, and the influence of averaging by cluster scoring can be seen.
- the candidate narrowing program stored in the gene cluster narrowing unit was applied to the ⁇ and ⁇ values thus obtained, and the gene cluster evaluation value was calculated from the product of the two values according to the calculation formula d) (FIG. 18).
- the gene cluster evaluation value was calculated from the product of the two values according to the calculation formula d) (FIG. 18).
- the target biosynthetic gene could be identified by using the method and apparatus of the present invention.
- the threshold value b in the calculation formula d) is 2000, for example, there are only four corresponding gene clusters, which are numerical values that can be easily obtained even in the case of verification by an experimental system.
- the ⁇ value (FIG. 16) and the ⁇ value (FIG. 17) By multiplying the ⁇ value (FIG. 16) and the ⁇ value (FIG. 17), many peaks that existed in each are canceled, and only those corresponding to the search target show high values. From the above, it has been shown that the method and apparatus of the present invention is an effective means that enables searching and identification of biosynthetic genes that function by gathering on the genome using only DNA microarray data. .
- Example 2 Search for kojic acid synthesis gene by hypothetical gene cluster scoring when weighted by annotation (functional annotation) in Aspergillus oryzae
- the m-values of the annotated genes related to the predicted function were weighted, and then the corresponding genes were identified.
- the apparatus used in this experiment is basically the same as the apparatus described in Example 1 above, except that it has a gene selection part by annotation and a weighting part for the expression level variation ratio for the selected gene. It is different.
- the following three functions were selected as functions necessary for kojic acid production.
- ⁇ Membrane transporter transporter or major facilitator
- Transcriptional regulator transcription
- Oxidoreductase oxidoreductase or dehydrogenase
- the English words are keywords used for gene selection by annotation.
- the normalized weight w the expression level variation ratio (m value) of each of the three array measurement systems C1 to C3 described in Example 1.
- the expression level fluctuation ratio for the gene thus selected is weighted (see [Equation 2]) by the weighting unit, and each weight of the expression level fluctuation ratio is calculated using the weighted expression level fluctuation ratio.
- the calculated score of each virtual gene cluster was stored in the storage device of the device of the present invention.
- FIG. 19 is a histogram of the calculated virtual gene cluster scores. Comparing the enlarged image on the left with FIG. 14, since a higher score appears due to weighting, the mountain-shaped distribution centered on zero is seen more sharply, and the center of the mountain is shifted to the left. I understand that.
- the score distribution evaluation value ⁇ in the systems C1 to C3 was calculated according to the calculation formula e) (FIG. 20). Specifically, the score of each virtual gene cluster calculated and stored in (A) above is called, and the gene cluster distribution determination value ( ⁇ ) calculation program stored in the gene cluster prediction unit is applied and calculated. Went.
- the number of virtual gene clusters n was 5179 and the number of dimensions d was 6.
- Example 3 Search for kojic acid biosynthetic genes when a virtual gene cluster is constructed and scored with genomic genes having specific functions in Aspergillus oryzae. This is an experiment for verifying that a gene essential for kojic acid production can be searched by constructing a virtual gene cluster with the possessed genes and analyzing the score of the virtual gene cluster.
- the size (ncl) of virtual gene clusters was set to 5, and 14032 virtual gene clusters were created from the Aspergillus oryzae genome sequence.
- a missing gene cluster or a hypothetical gene cluster located at the end of a genome fragment was composed of fewer than ncl genes.
- the apparatus of Example 2 was used.
- the size of the virtual gene cluster is set to 5 in terms of the number of genes, and the condition is that multiple types of functional genes selected by annotation are included from the constructed virtual gene cluster.
- the virtual gene cluster was selected, and the system was changed so that the selected virtual gene cluster was the virtual gene cluster to be scored. Others are the same as in the second embodiment.
- the size (ncl) of the virtual gene cluster is set to 5, and 14032 virtual genes are based on the position information on the genome of Aspergillus oryzae stored in the storage device. Created a cluster.
- the missing genes and the hypothetical gene cluster located at the end of the genome fragment were composed of fewer than ncl genes.
- a gene including genes having annotations of the corresponding function was selected from a total of 14032 hypothetical gene clusters.
- the Venn diagram of that number is shown in FIG.
- the number of virtual gene clusters having all of the above three factors (membrane transporter, transcriptional regulatory factor, and oxidoreductase) was 176 out of 14032.
- the above procedure selects genes having the following three functions from the annotation data stored in the storage device by applying the selection program of the functional gene selection unit. Furthermore, it was carried out by selecting those containing the selected functional gene from among a total of 14032 virtual gene clusters constructed.
- cluster scoring was performed on each selected virtual gene cluster.
- the array data were measured by the two-color method in the systems C1 to C3 as described in Reference Example 1 and Examples 1 and 2, and were grown under production conditions and non-production conditions. MRNA is taken out from the cells, labeled with a dye, and then hybridized with oligo DNA on the array to obtain data, from which the expression level variation ratio (m) of each gene is obtained. . Furthermore, in order to obtain one score for each hypothetical gene cluster, the m values obtained from the three systems C1 to C3 were added to obtain one value for each gene.
- the score (M value) was calculated. Specifically, the expression level variation ratio based on the experiment of each of the functional gene systems C1 to C3 included in each virtual gene cluster selected according to the above procedure is called from the storage unit, and the virtual gene cluster scoring unit A scoring program was applied, and the virtual gene cluster was scored according to the calculation formula a).
- FIG. 25A shows the distribution of score M values of 14032 virtual gene clusters.
- FIG. 25 (b) shows the score distribution of 176 hypothetical gene clusters having all three factors (membrane transporter, transcriptional regulatory factor, and oxidoreductase) presumed to be related to the production of kojic acid. showed that. Furthermore, the score positions of hypothetical gene clusters including three genes essential for production are shown on both sides.
- the virtual gene cluster is set to five genes that are aligned, so three clusters including three essential genes that are aligned (AO090113000136-AO090113000138) (AO090113000134-AO090113000138, AO090113000135-AO090113000139, AO090113000136-AO090113000140) Exists. Therefore, the position is indicated by three arrows. These were located at positions 24, 58 and 59 in a total of 14032 hypothetical gene clusters. If the analysis was performed for each gene one by one, it can be said that the accuracy rate was sufficiently increased considering that it was below 3000. However, by adding a process of selecting a virtual gene cluster according to the function of the gene further included, it has been found that the rank of the cluster score is clearly higher, 2, 5, and 6.
- Example 4 Examination of selection conditions of gene clusters essential for kojic acid production by hypothetical gene cluster scoring in Aspergillus oryzae
- the results obtained in Example 3 change by changing the selection conditions of hypothetical gene clusters by functional annotation
- the search target of the gene cluster is limited to a hypothetical gene cluster including three factors (membrane transporter, transcriptional regulatory factor, oxidoreductase) presumed to be related to production of kojic acid.
- the hypothetical gene cluster containing the three genes that were found to be essential for production was confirmed to be located at the top. The effect of reducing these three factors to two was examined.
- the procedure for virtual gene cluster selection and cluster scoring by function annotation is the same as in Example 3. In this experiment, the apparatus of Example 3 was used, and only the functional gene selection command for the functional gene selection unit was changed.
- FIG. 27 shows a score distribution of 2949 hypothetical gene clusters including a membrane transporter but not including a transcriptional regulatory factor.
- the transcriptional regulatory factor is located in the middle of the three genes essential for kojic acid production.
- five genes that are aligned are used as selection conditions for the hypothetical gene cluster. If there is no condition, a hypothetical gene cluster containing 3 genes essential for kojic acid production is not constructed. Therefore, the score distribution of the virtual gene cluster shown here corresponds to the distribution of only the background.
- the base of the distribution spreads and distributes up to a high score, but on the other hand, a single mountain distribution centering on the top of the mountain is shown. In this distribution, there was no hypothetical gene cluster located as a separate distribution on the high score side, indicating that there was no correct answer.
- Example 5 Identification of biosynthetic genes by virtual gene cluster scoring in Aspergillus flavus ⁇ Identified a gene cluster that synthesizes secondary metabolites for flavus. Aspergillus flavus is known to strongly produce aflatoxin, which is a secondary metabolite and one of mycotoxins, and its optimum production temperature is around 25 ° C. The apparatus used for this experiment is the same as the apparatus of Example 1.
- the DNA microarray data is a part of NCBI GEO (http://www.ncbi.nlm.nih.gov/geo/), which is a public database of gene expression analysis data. (Reference 1). That is, this data was stored in the storage unit through the gene expression level input unit.
- This array data is measured by the one-color method, unlike the first to fourth embodiments. Therefore, in order to obtain the expression level fluctuation ratio m value of each genomic gene, the following conditions are compared with the conditions that are likely to produce more secondary metabolites, and the values that are the former as the numerator and the latter as the denominator. Calculated as m value. There are two systems in total. C1: 96 hours / 18 hours after the start of culture C2: Growth temperature 28 ° C./37° C. during culture
- systems C1 and C2 respectively.
- 12955 genes in each of the two systems.
- (A) Cluster scoring For each of the systems C1 and C2, cluster scoring is performed with a virtual gene cluster size ncl 1 to 30 according to the calculation formula a) in the same manner as in Example 1, and each virtual gene A cluster score (M value) was obtained.
- the right side of FIG. 28 is a histogram showing a score distribution state for each size of each virtual gene cluster.
- the left graph in FIG. 28 is a partially enlarged view of the histogram. As you can see, if there is a hypothetical gene cluster with a high score (M value) that is out of the mountain-shaped normal distribution-like population centered on zero, the center of the mountain is on the left side in the histogram showing the whole. At first glance, it can be seen that in the system C2, the center of the mountain shifts to the left as ncl increases.
- the ⁇ value is on the order of the fourth power of 10, but the ⁇ value of Aspergillus oryzae, which is a species with weak expression of secondary metabolites, is the third power of 10 as shown in FIG. It is an order. This is consistent with the fact that Aspergillus flavus expresses the secondary metabolite very strongly compared to the same oryzae. From the above, it can be predicted from the score in the virtual gene cluster using the expression level variation ratio data of the system C2 that the target gene cluster is included in the constructed virtual gene cluster. The following experiment was performed using the microarray data set.
- FIG. 31 also shows the determination values of the virtual gene clusters of gene sizes 1 to 30 having the same genes as the starting points in the construction of the virtual gene clusters, as in FIG. Is. As shown in FIG. 31, many virtual gene clusters show maximum values. Of these, those having a ⁇ value of around 200 can be divided into four sizes.
- the one having the highest peak with the maximum maximum is the size around 20 as in the case of the ⁇ value.
- Each of the top 10 hypothetical gene clusters of each peak contained the aflatoxin synthesis gene described above. Some of them contain the aflatoxin synthesis gene cluster described above. In other words, the gene cluster involved in aflatoxin biosynthesis and the aflatoxin biosynthesis genes contained therein could be specified to some extent also by this evaluation value ⁇ .
- FIG. 32 is a graph showing the relationship between the virtual gene cluster size and the ⁇ ⁇ ⁇ value based on this calculation result. As is clear from FIG. 32, it can be seen that many virtual gene clusters show maximum values at a specific ncl.
- the functional annotations of hypothetical gene clusters showing values of 25000 or more there are typical secondary metabolite-related gene functions such as NRPS and P450, which are also unknown. It is likely to be a secondary metabolite synthesis gene cluster.
- the magnitude of the value is compared with Aspergillus oryzae (FIG. 18) of Example 1, it can be seen that the flavus is nearly three times higher.
- Example 6 Biosynthetic gene estimation by gene cluster scoring in Aspergillus niger According to the identification method of the present invention, a gene cluster that synthesizes a secondary metabolite of Aspergillus niger was estimated.
- the apparatus used in this experiment is the same as the apparatus of Example 1.
- the DNA microarray data uses part of the data registered by GSE17329 ID from NCBBI GEO (http://www.ncbi.nlm.nih.gov/geo/), a public database of gene expression analysis data. It was. That is, this data was stored as genomic gene expression level data in the storage unit through the gene expression level data input unit.
- the gene expression variation ratio calculation unit sets the following conditions as conditions for changing the physiological state as follows, with the former as the numerator and the latter as the denominator: The value was calculated as m value.
- the following two systems have been studied. These systems are expected to involve some secondary metabolism-related gene cluster under carbon source deficiency conditions. For example, these systems target specific functions such as kojic acid or aflatoxin production as described above. is not.
- C1 55.55 hours after carbon source depletion during culture / 5 hours after C2: 24 hours after carbon source depletion / 3.5 hours before carbon source depletion under culture, conditions under which the above two physiological states change
- the systems are C1 and C2.
- the expression level fluctuation ratio was calculated for 14509 genes in each of the two systems.
- (A) Cluster scoring For each of the systems C1-2, cluster scoring was performed with ncl 1-30 according to the calculation formula a) in the same manner as in Example 1 to obtain M values for each virtual gene cluster.
- the right side of FIG. 33 is a histogram showing a score distribution state for each size of each virtual gene cluster.
- the gene cluster evaluation value ⁇ was calculated according to the calculation formula c) in the same manner as in Example 1 (FIG. 36 (a); C1, same (b); C2 ).
- the dimension number d ′ is 2 and the coefficient a is 1.
- a plurality of virtual gene clusters show maximum values.
- the difference between the upper and lower ⁇ values is larger than the ⁇ value (FIG. 35).
- the ⁇ value is more advantageous for extracting a small number of hypothetical gene clusters. .
- the ⁇ value is 100 or more in the system C1, there is only one corresponding virtual gene cluster.
- the gene cluster determination evaluation value was calculated from the product of the two values according to the calculation formula d) in the same manner as in Example 1 (FIG. 37 (a); C1, (B); C2).
- the genes constituting these virtual gene clusters when we looked at the annotations of the presumed function based on the motif search based on the sequences, many of them were unknown in function, and the corresponding functional genes could not be found.
- Example 7 Searching for kojic acid synthesis genes when constructing a hypothetical gene cluster on condition that one or more genes selected based on annotation (functional annotation) are included.
- Gene cluster consisting of genes related to kojic acid production of Aspergillus oryzae
- a virtual gene cluster is constructed to include one or more of the genes, and each constructed virtual gene cluster is scored.
- the relevant genes were identified by ringing.
- the technique used in this experiment is basically the same as that of Example 1, but in Example 1, when constructing a virtual gene cluster, the size of the virtual gene cluster was set to 1 to 30.
- the virtual gene cluster was constructed so that all the genes were included in the sequence of the genomic genes.
- the functional genes selected based on the annotations appeared in the genomic position information (sequence information).
- the expression level fluctuation ratio for genes other than the selected functional gene ( m value) is ignored, and the difference is that only the expression level variation ratio of the selected gene is used.
- the gene size was set to 1 to 30 in the sequence of the genomic gene as in Example 1.
- the apparatus used in this experiment is basically the same as the apparatus described in Example 1, but in the virtual gene cluster construction program, annotation is added to the genome position information (sequence information).
- Interproscan http://www.ebi.ac.uk/Tools/InterProScan/), one of the commonly used annotation estimation programs ) was used to annotate each gene on the Aspergillus oryzae genomic DNA, and the genes having the above three functions were selected.
- annotation data for each gene was input to the input device of this device and stored in the storage device.
- the stored annotation data was recalled, and genes having the above three functions were selected by applying the selection program of the functional gene selection unit. The selection is made based on whether or not the keywords assigned to the above three functional groups are included in the annotations given for each gene. As a result, the selected gene can acquire gene expression data effectively in the system C2. It was 796 out of 5595 genes.
- the selected gene is the starting point.
- virtual gene clusters were constructed by changing the cluster size from 1 to 30 in the sequence of genomic genes.
- the virtual gene size to be constructed always includes at least one gene selected based on the assigned annotation, and a virtual gene cluster that does not include the selected functional gene is not constructed.
- the constructed gene cluster includes genes other than the selected functional gene. The reason for this is because the change of the virtual gene construction program stored in the apparatus of Example 1 is minimized.
- the scoring of the constructed virtual gene cluster the expression level fluctuation ratio for genes other than the selected functional gene is ignored, and only the expression level fluctuation ratio of the selected functional gene is used.
- the calculation by the calculation formula a) was performed. According to this, the score of the virtual gene cluster is exactly the same as the score when the virtual gene cluster is constructed only from the selected functional gene. Thus, the score of each obtained virtual gene cluster was memorize
- the constructed virtual gene cluster includes a case where only one gene is included. In this example, as in Examples 1 to 4, the end side on the genome is included.
- a virtual gene cluster was constructed with the maximum number of genes that can be combined, but due to the nature of cluster scoring, there is no effect on the search for gene clusters.
- the number of virtual gene clusters constructed in this way is 796 for each cluster size.
- the determination value ⁇ for each virtual gene cluster was calculated according to the calculation formula b). Specifically, the score of each virtual gene cluster stored is called, and the ⁇ value calculation program is applied among the virtual gene divergence degree determination programs stored in the virtual gene cluster divergence degree calculation unit. In accordance with equation b), a decision value ⁇ for each hypothetical gene cluster was calculated.
- FIG. 38 shows the determination values ⁇ of virtual gene clusters having the same starting gene for each virtual gene cluster, with the horizontal axis connected as the cluster size.
- AO090113000136 In addition to the three genes essential for kojic acid production, AO090113000136, AO090113000137, and AO090113000138, this is located next to it, and “major facilitator” (membrane transporter) is used as an annotation for gene selection in this example. It has AO090113000139. That is, in this example, since the virtual gene cluster is scored using only the expression level fluctuation ratio of the gene with the annotation to be selected, the elements to be scored are extremely scraped off. As a result, when there is a gene selected by annotation in the vicinity of the corresponding gene cluster, the gene cluster including the gene can take a high value.
- the virtual gene cluster showing the maximum value includes three genes essential for the production of kojic acid
- this method is effective as a gene cluster search method.
- a determination value ⁇ was calculated for each virtual gene cluster according to the calculation formula c). Specifically, the determination value ⁇ was calculated for each virtual gene cluster according to the calculation formula c) by applying a ⁇ value calculation program stored in the divergence degree calculation unit of the virtual gene cluster. As in the first embodiment, 2 and 1 were adopted as the dimension number d ′ and the coefficient a, respectively.
- the candidate narrowing program stored in the gene cluster narrowing unit was applied to the ⁇ value and ⁇ value thus obtained, and the gene cluster evaluation value was calculated from the product of the two values according to the calculation formula d) (FIG. 40).
- FIG. 40 with FIG. 38 and FIG.
- a virtual gene cluster containing the gene selected by annotation is constructed, and cluster scoring is performed using the expression level fluctuation ratio of the selected gene. It has been shown that gene clusters and genes contained therein can be searched. From this experimental result, it is clear that a similar result can be obtained by constructing a virtual gene cluster by combining one or more genes selected by annotation and scoring. This method involves a strong filtering operation, and may excessively reflect the m value of the gene having the corresponding annotation. However, conversely, when the expression fluctuation ratio between genes is relatively small, the target gene cluster can be accurately predicted.
- Example 8 Prediction and verification of secondary metabolite biosynthetic genes by gene cluster scoring in Fusarium verticiliides Predicted gene clusters.
- the genus Fusarium is a fungus that is distant from the evolutionary tree by the fungus Aspergillus used in Examples 1 to 6 (Reference 4). Moreover, it is known to produce mycotoxins including fumonisin, and is considered to have many other secondary metabolite biosynthetic gene clusters (Reference 5).
- the DNA microarray data is the GSE16900 ID from the GEO (http://www.ncbi.nlm.nih.gov/geo/) public database of gene expression analysis data provided by the National Center for Biotechnology Information (NCBI). Part of the registered one was used.
- the expression level of the gene is measured by the one-color method for each of the culture conditions in which the culture time in the fumonisin production medium is 24, 48, 72, and 96 hours. Therefore, in order to obtain the expression level fluctuation ratio m value, the condition that is considered to produce more secondary metabolites is compared with the condition that is not so as follows, and the value with the former as the numerator and the latter as the denominator is set as the m value. Calculated. There are two systems examined.
- C1 Culturing time 72 hours / same 24 hours
- C2 Culturing time 96 hours / same 48 hours
- This expression information includes 12230 genes used to construct a gene cluster. In the original array data, since three data were taken for each culture time, the expression level was averaged among the three data for each gene, and then the following procedure was performed.
- FIG. 42 shows the histogram.
- FIG. 42 shows the histogram.
- the center of the mountain in the histogram of M values at each ncl Shifts to the left.
- the histogram for each ncl on the right side of the figure it can be seen that the center of the mountain shifts to the left as ncl increases.
- the genome information required for cluster scoring is the database “Fusarium Comparative Sequencing Project, Broad Institute of Harvard and MIT” published by the Broad Institute, a research institution in the United States. (http://www.broadinstitute.org/) "fusarium_verticillioides_3_genome_summary_per_gene.txt was used.
- the gene cluster determination value c was calculated from the DNA microarray data of the systems C1 and C2 according to the calculation formula b) for each virtual gene cluster (FIG. 44).
- the gene cluster evaluation value u was calculated according to the calculation formula c) (FIG. 45).
- the dimension number d ′ is 2 and the coefficient a is 1.
- a plurality of virtual gene clusters show maximum values.
- the difference between the upper and lower u values in the maximum value is larger than that of the c value (FIG. 44), and it is easier to extract a small number of virtual gene clusters in the upper rank by the u value. .
- the u value is 100 or more in the system C1
- the corresponding gene cluster can be highly evaluated by using the evaluation value u.
- FIG. 5 is a diagram in which the horizontal axis is plotted as a gene serving as a starting point on the genome. In the figure, the scales of the vertical axes of C1 and C2 are matched. In system C1, there are three hypothetical gene clusters that stand out and take high values.
- Each of these has a cluster size of 14, 5, and 16 starting from genes FVEG_00316, FVEG_08708, and FVEG_12519, respectively.
- Table 3 shows the results of gene sequence homology search (blast) for the genes constituting these virtual gene clusters.
- the database is provided by NCBI and stores NR (Non-Redundant, http://www.ncbi.nlm.nih.gov/staff/tao/URLAPI/blastdb) that stores gene sequences of many species including microorganisms. .html).
- the best hits are extracted from those whose value E-value for evaluating the degree of homology is 10 to the -100th power.
- the biosynthetic gene of fumonisin is reported to be a 15-cluster cluster in Gibberellin moniliformis, the full generation of Fusarium verticiliides (References 6, 7, 8).
- Fusarium verticiliides five of FUM1 (5), FUM6, FUM7, FUM8, and FUM9 have been identified as fumonisin biosynthetic genes (Reference: 9). Looking at the table, it can be seen that 14 of the gene clusters labeled A are 14 of 15 fumonisin biosynthetic genes (labeled Fum).
- a virtual gene cluster having a cluster size of 4 starting from FVEG_08709 takes a large negative value. This is equivalent to the positive value in the system C1, but the starting point is shifted one by one.
- the expression was 72 hours after the start of the culture, but the expression stopped after 96 hours. It is speculated that this is a gene cluster.
- FVEG_12523 contained in the hypothetical gene cluster C is a polyketide that is one of the secondary metabolite biosynthesis genes.
- the proposed method also functions in Fusarium verticiliides, a fungus that is distant from the genus Aspergillus, in the genome based on the expression information of all genes, as in the case of Aspergillus. It has been shown to be an effective means of identifying biosynthetic genes.
- Example 9 Detection and verification of lactose operon by gene cluster scoring in E. coli
- Escherichia coli is a prokaryote and differs greatly from the eukaryote used in the verification of the method of the present invention in Examples 1 to 8 in classification of the organism.
- E. coli is the first organism to demonstrate the presence of an operon.
- An operon is a single control unit that functions by gathering on the genome, and corresponds to the identification object of the present invention because of the property that a plurality of genes are present on the genome and are highly expressed and function.
- the lactose operon demonstrated in a present Example is demonstrated.
- the lactose operon is composed of lacI encoding a repressor protein, followed by a promoter sequence lacP, an operator sequence lacO, and three genes lacZ, lacY, and lacA (lacZYA) that metabolize lactose. Since lacI is always expressed and binds strongly to the lacO region, its downstream lacZYA is usually not translated. However, the repressor protein translated into lacI is released from the lacO region by changing the higher-order structure in the presence of an inducer such as isomerized lactose. As a result, lacZYA, which is a lactose metabolism system, is translated and lactose can be metabolized (Reference Document 10).
- DNA microarray data is GSE7265 ID from GEO (http://www.ncbi.nlm.nih.gov/geo/), a public database of gene expression analysis data provided by the National Center for Biotechnology Information (NCBI). The registered ones were used (References 11 and 12).
- This array data follows changes in gene expression in increments when cultured on a medium containing two nutrient sources, glucose and lactose, using Escherichia coli MG1655 strain and mutants thereof. On a medium containing these two nutrient sources, E. coli first metabolizes glucose, and then metabolizes lactose after the glucose is exhausted.
- the wild strain data of this data set includes data sets at 17 stages after the start of culture, which were taken 780,830,861,869,878,888,898,908,919,929,939,969,999,1035,1049,1070,1089 minutes after the start of culture, respectively. Since each data is described in the form of an expression induction ratio using the data at the beginning of logarithmic growth (after 780 minutes) as the denominator, it can be directly applied to this method. However, since 3 to 4 data were taken for each measurement step, the values were averaged between 3 to 4 data for each gene, and then the following procedure was performed. The number of genes included in the data is 4102.
- (A) Cluster scoring For each of the systems in each of the 17 measurement steps, cluster scoring was performed with ncl 1-30 according to the calculation formula a) to obtain M values for each virtual gene cluster.
- the continuous information of the genes on the genome required for cluster scoring is the genome information of E. coli MG1655 strain (ID: NC_000913; http: // www) registered in NCBI, a public academic database. .ncbi.nlm.nih.gov / nuccore / NC_000913). Since Escherichia coli is a circular genome, the starting point was the gene named b0001 in the genome information, and all genes were treated as continuous.
- FIG. 47 is a part of a histogram of M values of each virtual gene cluster. As can be seen from the enlarged image on the left, if there is a virtual gene cluster having a high M value that is out of the normal distribution-like population of the mountain shape centered on zero, the center of the mountain in the histogram of M values at each ncl Shifts to the left.
- FIG. 48 Data determination According to the calculation formula e), score distribution evaluation values e in 17 systems were calculated (FIG. 48).
- the virtual gene cluster number n is 4102 in each ncl, and the dimension number d is 6.
- the e value shows a maximum value in six systems after 878,888,898 minutes after the start of culture and after 1049,1070,1089 minutes. This result is now compared with the growth rate of E. coli.
- FIG. 49 is a time-series change in turbidity indicating the growth of E. coli after the start of culture described in the literature (reference document 11) relating to this array data. Although the time label with the array data is shifted depending on where the pre-culture is taken, the starting point in FIG.
- score distribution evaluation value e shows a maximum maximum value after 878,888,898 minutes (7,8,9 points) and after 1049,1070,1089 minutes (15,16,17 points) All of the data correspond to the places where the increase in turbidity remains in FIG. 49, that is, the growth stagnation period.
- the first stagnation period is the stage where all the glucose is consumed and the nutrient source is switched to lactose.
- the e value shows a maximum value at this stage is consistent with the phenomenon of suppression of the ribosome genes and expression of the lactose operon.
- the second stagnation period is a stage in which lactose is also depleted, and growth itself stagnate, so here again, the ribosome gene essential for proliferation is strongly suppressed (Reference Document 13).
- the maximum value of the e value at this stage is considered to detect the suppression of this ribosomal gene.
- (C) Determination of gene cluster The gene cluster determination value c was calculated for each virtual gene cluster from the DNA microarray data at the 17th stage after the start of cultivation of Escherichia coli MG1655 according to the calculation formula b) (FIG. 50).
- one line is drawn in gray for one hypothetical gene cluster, and the black drawn line is the first gene on the genome information of the four genes that make up the lactose operon.
- It is a gene cluster starting from lacA (b0342). This gene cluster starts to rise gradually from the 869 minute system, and shows the maximum value among the imaginary gene clusters that show maximum values in the 908,919 minute system. The point showing the maximum value is when the cluster size is 3, and is composed of lacZYA.
- the gene cluster evaluation value u was calculated according to the calculation formula c) (FIG. 51).
- the dimension number d ′ is 2, and the coefficient a is 1.
- the gene cluster starting from lacA (b0342) indicated by the thick black line started to increase gradually from the 869 minute system, and all the hypotheses in the 908,919 minute system
- the maximum maximum value among the gene clusters is shown by cluster size 3.
- the lactose operon indicated by the black arrow shows the maximum value in the 908 minute system.
- the ribosomal gene group indicated by the white arrow is strongly negative in the 878,888,898 minute and 1049,1070,1089 minute systems in the growth stagnation period. From these results, it was shown that this evaluation value can accurately detect a group of genes that function collectively on the genome according to the state of the cells. From the above, it was shown that the proposed method is an effective means for detecting a group of genes that function on the genome in prokaryotes as well as eukaryotes.
Landscapes
- Health & Medical Sciences (AREA)
- Life Sciences & Earth Sciences (AREA)
- Physics & Mathematics (AREA)
- Bioinformatics & Cheminformatics (AREA)
- Engineering & Computer Science (AREA)
- Genetics & Genomics (AREA)
- Theoretical Computer Science (AREA)
- Biophysics (AREA)
- Medical Informatics (AREA)
- Molecular Biology (AREA)
- Spectroscopy & Molecular Physics (AREA)
- Bioinformatics & Computational Biology (AREA)
- Biotechnology (AREA)
- Evolutionary Biology (AREA)
- General Health & Medical Sciences (AREA)
- Analytical Chemistry (AREA)
- Proteomics, Peptides & Aminoacids (AREA)
- Chemical & Material Sciences (AREA)
- Apparatus Associated With Microorganisms And Enzymes (AREA)
- Measuring Or Testing Involving Enzymes Or Micro-Organisms (AREA)
- Management, Administration, Business Operations System, And Electronic Commerce (AREA)
Abstract
Description
一方、近年、DNAシークエンス技術の革新的な発展により、様々な生物種、特に微生物のゲノム情報の蓄積は加速度的に増加しており、3~5年後には数千種の微生物のゲノム塩基配列が明らかになることは確実である。このようなゲノム中の遺伝子配列と2次代謝産物との対応関係について、詳細かつ膨大な情報を収集してデータベースなどを構築することが可能になれば、これにより、二次代謝物質の構造、多様性、生物界での分布などに関する情報を、遺伝子の配列に基づいて推定することが可能になり、有用な未知の2次代謝物質の発見及び該2次代謝物質の生合成に関与する遺伝子の取得が容易になり、この遺伝子組み換え技術を用いて、2次代謝産物を安定して大量に生産することも可能となる。
(1)生物ゲノム中の標的遺伝子を含む遺伝子クラスタ及び/または該遺伝子クラスタ中の標的遺伝子を探索する方法であって、生物細胞の生理状態変化を生じる条件とコントロール条件下において生じたゲノム遺伝子の発現量変動比を、ゲノムDNA上に配列する複数の遺伝子により構成される仮想の遺伝子クラスタ単位の発現量変動比として合算することにより、仮想の遺伝子クラスタ単位毎にスコアリングし、得られたスコアに基づき、上記生理状態変化の原因遺伝子である標的遺伝子を含む遺伝子クラスタ及び/または該遺伝子クラスタ中の標的遺伝子を探索する方法。
(2)生物細胞の生理状態変化を生じる条件とコントロール条件下とを一の対比条件セットとして、該対比条件セットが一種以上設定されていることを特徴とする上記(1)に記載の方法。
(3)生理状態変化を生じる条件とコントロール条件が、少なくとも代謝産物の産生誘導条件下と非誘導条件下あるいは代謝産物の産生抑制条件下と非抑制条件下との対比条件セットを含むことを特徴とする上記(1)または(2)に記載の方法。
(4)代謝物産生に関与する遺伝子が2次代謝物産生に関与する遺伝子であることを特徴とする上記(3)に記載の方法。
(5)仮想の各遺伝子クラスタは、ゲノムDNA上に連続する遺伝子を2個から遺伝子数を一つずつ増やして、想定される遺伝子クラスタに含まれる最大限のゲノム遺伝子数になるまで抽出し、かつ該抽出において、抽出する遺伝子の各個数毎に、直鎖状DNAからなるゲノムの場合には該DNAのいずれかの末端から、環状DNAからなるゲノムの場合には任意の遺伝子を起点として順にゲノムDNA上に配列する遺伝子を一つずつずらしながら抽出された各遺伝子群からなることを特徴とする、上記(1)~(4)のいずれかに記載の方法。
(6)スコアリングされる仮想の各遺伝子クラスタの集合体が、ゲノムDNA上に連続する遺伝子を2個から遺伝子数を一つずつ増やし想定される遺伝子クラスタに含まれる最大限のゲノム遺伝子数になるまで抽出し、かつ該抽出において、抽出する遺伝子の各個数毎に、直鎖状DNAからなるゲノムの場合には該DNAのいずれかの末端から、環状DNAからなるゲノムの場合には任意の遺伝子を起点として順にゲノムDNA上に配列する遺伝子を一つずつらしながら抽出された各遺伝子群からなる仮想の各遺伝子クラスタの集合からなり、ゲノム上に存在する遺伝子クラスタの全てが仮想の遺伝子クラスタの集合体中に含まれるように構成されていることを特徴とする上記(1)~(5)のいずれかに記載の方法。
(7)仮想の各遺伝子クラスタのスコアリングが以下の計算式a)によりなされることを特徴とする、上記(1)~(6)のいずれかに記載の方法。
計算式a)


(10)仮想の遺伝子クラスタが、ゲノムにおいて、近傍に存在することを条件として、以下の1)~3)の内の1以上の遺伝子のみから、あるいは該遺伝子を少なくとも含む1以上の遺伝子から構築されることを特徴とする、上記(4)に記載の方法。
1)2次代謝物産生に関与していると想定される酵素種に属する酵素遺伝子。
2)トランスポーター遺伝子
3)転写因子をコードする遺伝子
(11)仮想の各遺伝子クラスタのスコアリングが以下の計算式a)によりなされることを特徴とする、上記(10)に記載の方法。
計算式a)

(13)仮想の遺伝子クラスタ全体のスコアの分布からの乖離の程度を示す判定値I(χ)を、以下の計算式b)により算出し、算出された該判定値I(χ)に基づき仮想の遺伝子クラスタを標的の遺伝子クラスタ候補として選定することを特徴とする、上記(12)に記載の方法。
計算式b)

計算式c)

計算式d)

ゲノムDNA上に連続する遺伝子を2個から遺伝子数を一つずつ増やし想定される遺伝子クラスタに含まれる最大限のゲノム遺伝子数になるまで抽出し、かつ該抽出において抽出する遺伝子の各個数毎に、直鎖状DNAからなるゲノムの場合には該DNAのいずれかの末端から、あるいは環状DNAからなるゲノムの場合には任意の遺伝子を起点として順にゲノムDNA上に配列する遺伝子を一つずつずらしながら抽出された各遺伝子群から構成された仮想の各遺伝子クラスタを、以下の計算式a)によりスコアリングし、この得られた仮想の各遺伝子クラスタのスコアを各遺伝子クラスタに含まれる遺伝子数毎に分け、以下の計算式e)により、各遺伝子数単位毎に遺伝子クラスタスコア分布判定値(ε)を求め、該判定値に基づき、予め、標的とする遺伝子クラスタがゲノム中に存在するか否かあるいは、標的クラスタが存在する場合のその遺伝子サイズを予測することを特徴とする、上記方法。
計算式a)


(18)生物ゲノム中の標的遺伝子を含む遺伝子クラスタ及び/または該遺伝子クラスタ中の標的遺伝子を探索する装置であって、a)生物細胞の生理状態変化を生じる条件とコントロール条件下におけるゲノムDNA上に配列する各遺伝子の発現量データに基づき算出された上記2つの条件下における上記各遺伝子の発現量変動比を記憶する手段、b)ゲノムDNA上に配列する複数の遺伝子を組み合わせて仮想の遺伝子クラスタを構築する手段、c)該算出され、記憶されたゲノムDNA上に配列する各遺伝子の発現量変動比を複数の遺伝子により構築された上記仮想の遺伝子クラスタ単位の発現量変動比として合算し、仮想の遺伝子クラスタ単位毎にスコアリングし、仮想の各遺伝子クラスタのスコアを記憶する手段、及びd)得られたスコアに基づき上記生理状態変化の原因遺伝子である標的遺伝子を含む遺伝子クラスタを選定する手段を有するか、あるいはさらにe)選定された遺伝子クラスタ中に含まれる遺伝子を表示する手段を有することを特徴とする、上記装置。
(19)発現量データが、遺伝子発現量測定用DNAマイクロアレイによる蛍光強度情報であることを特徴とする上記(18)に記載の装置。
(20)蛍光強度情報が、蛍光強度を読み取り、数値化する手段を有する蛍光強度読み取り装置により出力される数値データであることを特徴とする、上記(19)に記載の装置。
(21)生物細胞の生理状態変化を生じる条件とコントロール条件とを1の対比条件セットとして1以上設定されている場合において、各対比条件セットに含まれる条件毎に各遺伝子の発現量データが入力され、各対比条件セットにおける同一遺伝子の発現量変動比が算出されることを特徴とする、上記(18)~(20)のいずれかに記載の装置。
(22)標的遺伝子が代謝物産生に関与する遺伝子であることを特徴とする、上記(18)~(21)のいずれかに記載の装置。
(23)代謝物産生に関与する遺伝子が2次代謝物産生に関与する遺伝子であることを特徴とする、上記(22)に記載の装置。
(24)設定される対比条件セットが、少なくとも代謝産物の産生誘導条件下と非誘導条件下あるいは代謝産物の産生抑制条件下と非抑制条件下との対比条件セットを含むことを特徴とする上記(22)に記載の装置。
(25)代謝産物が2次代謝産物であることを特徴とする、上記(24)に記載の装置。
(26)仮想の各遺伝子クラスタの構築手段が、ゲノムDNA上に連続する遺伝子を2個から遺伝子数を一つずつ増やして、想定される遺伝子クラスタに含まれる最大限のゲノム遺伝子数になるまで抽出し、かつ該抽出において、抽出する遺伝子の各個数毎に、直鎖状DNAからなるゲノムの場合には該DNAのいずれかの末端から、環状DNAからなるゲノムの場合には任意の遺伝子を起点として順にゲノムDNA上に配列する遺伝子を一つずつずらしながら抽出した各遺伝子群により構築する手段であることを特徴とする、上記(18)~(25)のいずれかに記載の装置。
(27)仮想の各遺伝子クラスタのスコアリングが以下の計算式a)によりなされることを特徴とする、上記(18)~(26)のいずれかに記載の装置。
計算式a)


(30)アノテーションに基づき選定される遺伝子が、1)~3)のうちの1以上の遺伝子であることを特徴とする、上記(29)に記載の装置
1)2次代謝物産生に関与していると想定される酵素種に属する酵素遺伝子。
2)トランスポーター遺伝子
3)転写因子をコードする遺伝子
(31)上記(28)~(30)のいずれかに記載のアノテーション付与手段と、構築された仮想の遺伝子クラスタから、アノテーションに基づき選出された遺伝子を含む仮想の遺伝子クラスタを選出する手段を有し、選出された仮想の遺伝子クラスタについてスコアリングすることを特徴とする、上記(27)に記載の装置。
(32)ゲノムDNA上に配列する各遺伝子中の特定遺伝子を選定するためのアノテーション付与手段を有し、ゲノムDNA上において近傍に位置することを条件として、アノテーションに基づき選定された遺伝子により、あるいは該遺伝子を少なくとも含む1以上の遺伝子から仮想の遺伝子クラスタを構築する手段を有することを特徴とする、上記(18)~(25)に記載の装置。
(33)上記(32)に記載のアノテーション付与手段が、それぞれ遺伝子機能の種類に応じたアノテーションを付与する手段であることを特徴とする上記(32)に記載の装置。
(34)アノテーション付与に基づき選定される遺伝子が、1)~3)のうちの1以上の遺伝子であることを特徴とする、上記(33)に記載の装置
1)2次代謝物産生に関与していると想定される酵素種に属する酵素遺伝子。
2)トランスポーター遺伝子
3)転写因子をコードする遺伝子
(35)仮想の各遺伝子クラスタのスコアリングが以下の計算式a)によりなされることを特徴とする、上記(32)~(34)のいずれかに記載の装置。
計算式a)

(37)標的の遺伝子クラスタ候補として選定する手段として、仮想の遺伝子クラスタ全体のスコアの分布からの乖離の程度を示す判定値I(χ)を、以下の計算式b)により算出するプログラムが格納されていることを特徴とする、上記(36)に記載の装置。
計算式b)

計算式c)

計算式d)

計算式a)


1)ゲノム遺伝子が直鎖状ゲノムの場合、
a.ゲノムDNAの一方の末端に位置する遺伝子を起点として、他方の末端方向に、順次、ゲノムDNA上に連続する遺伝子を同一方向に2個から一つずつ増やして想定される遺伝子クラスタに含まれる遺伝子数の最大限になるまで組み合わせ、起点とした遺伝子を含み、かつ遺伝子の個数の異なる複数の遺伝子群を構成する手段。
b.起点を、順次、他方の末端方向に一遺伝子ずつずらせながら、上記a.と同様の処理を行い、新たな起点遺伝子を含みかつ遺伝子の個数が異なる複数の遺伝子群を構成し、a.の遺伝子群と併せて、複数の遺伝子を組み合わせた遺伝子群からなる仮想の遺伝子クラスタを構築する手段。
2)ゲノム遺伝子が環状の場合、ゲノムDNA上の任意の遺伝子を起点として、上記1)a.及びb.と同様の処理を順次行い、最初に起点とした遺伝子が起点となる時点で処理を終了する手段。
(43)上記(42)のプログラムにより構築された仮想の遺伝子クラスタについて、以下の計算式a)によるスコアリングを実行することを特徴とする、仮想の遺伝子クラスタのスコアリングプログラム。
計算式a)


(46)上記(32)に記載の仮想の遺伝子クラスタの構築手段を実行するプログラムであって、ゲノムDNA上において近傍に位置することを条件として、アノテーションに基づき選定された遺伝子により、あるいは該遺伝子を少なくとも含む1以上の遺伝子から仮想の遺伝子クラスタを構築することを特徴とする、仮想の遺伝子クラタの構築プログラム。
(47)上記(46)のプログラムにより構築された仮想の遺伝子クラスタについて、以下の計算式a)によるスコアリングを実行することを特徴とする、仮想の遺伝子クラスタのスコアリングプログラム。
計算式a)

計算式b)

計算式c)

少なくとも以下(A)~(C)の手段を実行するプログラム。
(A)ゲノム遺伝子の位置情報に基づき、以下の1)または2)の手段により仮想の遺伝子クラスタを構築する手段、
1)ゲノム遺伝子が直鎖状の場合、
a.ゲノムDNAの一方の末端に位置する遺伝子を起点として、他方の末端方向に、順次、ゲノムDNA上に連続する遺伝子を同一方向に2個から一つずつ増やして想定される遺伝子クラスタに含まれる遺伝子数の最大限になるまで組み合わせ、起点とした遺伝子を含み、かつ遺伝子の個数の異なる複数の遺伝子群を構成する手段。
b.起点を、順次、他方の末端方向に遺伝子一つずつずらせながら、上記a.と同様の処理を行い、新たな起点遺伝子を含みかつ遺伝子の個数が異なる複数の遺伝子群を構成し、a.の遺伝子群と併せて、複数の遺伝子の組み合わせた遺伝子群からなる仮想の遺伝子クラスタを構築する手段。
2)ゲノム遺伝子が環状の場合、ゲノムDNA上の任意の遺伝子を起点として、上記1)a.及びb.と同様の処理を順次行い、最初に起点とした遺伝子が起点となる時点で処理を終了する手段。
(B)上記(A)の手段により構築された仮想の遺伝子クラスタについて、以下の計算式a)により仮想の遺伝子クラスタ単位毎にスコアリングする手段。
計算式a)

計算式e)


本発明は、また、上記方法を基本原理とし、生物ゲノム中の標的遺伝子を含む遺伝子クラスタ及び/または該遺伝子クラスタ中の標的遺伝子を探索する装置(以下、単に、本発明の遺伝子探索装置という場合がある。)に関するものであり、さらに該装置の一部を応用した遺伝子クラスタの有無及びそのサイズを予測する装置に関する。
本発明の探索法および探索装置においては、真核生物、原核生物を問わず、あらゆる生物種について、ゲノム中の有用遺伝子を含有する遺伝子クラスタを探索対象とすることができる。
また、本発明によれば、ゲノムの配列が明らかになっているものであれば、遺伝子クラスタの境界が明らかになっていない場合であっても本発明の手法および装置を適用でき、遺伝子クラスタ及び該クラスタ中の有用遺伝子を探索することができる。
生理状態変化を生じる条件とは、例えば、薬剤の使用、温度、栄養源、培地、培養時間等の調整により、人為的に生理状態変化を誘導する場合の他、特にこのような誘導をせず、経時的に生理状態変化が生じる場合の時間条件も含める。コントロール条件とは、生理状態変化を生じないかあるいは生じても変化が少なく、生理状態変化を生じる条件下での生理状態変化と対比しうるものをいう。
例えば、2次代謝物の産生に関与する遺伝子クラスタあるいは遺伝子を探索する場合、2次代謝物産生誘導条件下(あるいは抑制条件下)とコントロール条件としての2次代謝物産生非誘導条件下(あるいは産生条件下)におけるゲノム遺伝子の発現量を測定する。
比較する上記2次代謝物産生誘導条件と2次代謝物産生非誘導条件、あるいは2次代謝物産生抑制条件と2次代謝物産生条件とは、代謝物産生速度、量等に差が生じる条件であればよく、例えば、薬剤の使用、温度、栄養源、培地等の調製の有無等、あるいは特にこのような誘導をせず、経時的に2次代謝物産生量に生じる場合の時間条件も含まれる。
本発明のプロセスにおいては、ゲノムDNA上に配列する各遺伝子の発現量の測定は、例えばマイクロアレイ等により行うが、その他のプロセスは、ゲノムDNA上に配列する遺伝子の発現量データに基づき、数学的データ処理により行うことができ、実験を必要とせず、また、上記発現量測定対象とするゲノム遺伝子の選定等も機械的に、あるいは研究者の特別な知識あるいは勘にほとんど左右されることがなく行うことができる。したがって、本発明の探索法は、コンピューター利用に極めて適しており、本発明によれば、迅速、効率的に有用遺伝子が探索可能となり、従来困難であって、代謝物、とりわけ2次代謝物産生に関与する遺伝子及び該遺伝子が含まれる遺伝子クラスタの探索に特に効力を発揮する。
以下、本発明のプロセスについて、さらに具体的に説明する。
1)上記A)の手法による場合の発現量の測定及び発現量変動比データの取得、
A)の手法による場合、原則、ゲノムDNA上に配列する各遺伝子全てについて、生理状態変化を生じる条件とコントロール条件下とにおいて、それぞれ発現量を測定し、両条件下における発現量の比を求め、発現量変動比(生理状態変化条件下での発現量を分子、コントロール条件下での発現量を分母として算出した値)とする。
発現量の測定は、例えば、ゲノムDNA上に配列する各遺伝子に特異的なプローブを有するマイクロアレイを用いてそれ自体周知の方法で行うことができる。
例えば、代謝産物、特に2次代謝物の産生に関与する有用遺伝子を標的とする場合、1以上の2次代謝物産生誘導条件下(あるいは抑制条件下)で細胞を培養し、細胞からゲノムRNAを抽出し、ゲノムDNA上の各遺伝子に特異的なプローブを有するマイクロアレイでゲノムDNA上の各遺伝子の発現量を測定する。一方、コントロール条件として、上記2次代謝物の産生非誘導条件下(あるいは産生条件下)の場合における発現量を測定し、両条件下における発現量の比をとり、これを発現量変動比とする。
各遺伝子発現量の測定は、例えば、上記培養細胞からmRNAを抽出して、色素等でラベリングし、各遺伝子クラスタにおける上記各遺伝子中のDNA配列の一部を有するオリゴDNAをプローブとして基板に固定化したアレイを用い、上記該ラベリングしたmRNAを各オリゴDNAにハイブリダイズさせ、洗浄した後、発光強度等を測定することにより行う。
仮想の各遺伝子クラスタは、ゲノムDNA上に連続する遺伝子を2個から遺伝子数を1ずつ増やして、想定される遺伝子クラスタに含まれる最大限の遺伝子数になるまで抽出し、かつ該抽出において、抽出する遺伝子の各個数毎に、直鎖状DNAからなるゲノムの場合には該DNAのいずれかの末端から、環状DNAからなるゲノムの場合には任意の遺伝子を起点として順にゲノムDNA上に配列する遺伝子を一つずつずらしながら抽出された各遺伝子群から構成される。
この仮想の遺伝子クラスタの構築手法をより具体的に示すと例えば以下の手法が挙げられる。
a)ゲノムDNAの一方の末端に位置する遺伝子を起点として、他方の末端方向に、順次、ゲノムDNA上に連続する遺伝子を同一方向に2個から一つずつ増やして(N+1)、想定される遺伝子クラスタに含まれる遺伝子数の最大限(ncl)になるまで組み合わせ、起点とした遺伝子を含み、かつ遺伝子の個数の異なる複数の遺伝子群を構成する。
b)起点を、順次、他方の末端方向に一遺伝子づつずらしながら(起点遺伝子の移動)、上記aと同様の処理を行い、新たな起点遺伝子を含みかつ遺伝子の個数が異なる複数の遺伝子群を構成し、a)の遺伝子群と併せて、複数の遺伝子の組み合わせた遺伝子群からなる仮想の遺伝子クラスタを構築する。
(2)ゲノム遺伝子が環状の場合、ゲノムDNA上の任意の遺伝子を起点として、上記(1)a)及びb)と同様の処理を順次行い、最初に起点とした遺伝子が起点となる時点で処理を終了する(最初に起点として遺伝子に基づく仮想の遺伝子クラスタの構築は再度行わない。)。


遺伝子の2個の各仮想の遺伝子クラスタ(9個);AB,BC,CD,DE,EF,FG,GH,HI,IJ
同3個の仮想の各遺伝子クラスタ(8個);ABC,BCD,CDE,DEF,EFG,FGH,GHI,IJK
同4個の仮想の各遺伝子クラスタ(7個);ABCD,BCDE,CDEF,DEFG,EFGH,FGHI,GHIJ
同5個の仮想の各遺伝子クラスタ(6個);ABCDE,BCDEF,CDEFG,DEFGH,EFGHI,FGHIJ
同6個の仮想の各遺伝子クラスタ(5個);ABCDEF,BCDEFG,CDEFGH,DEFGHI,EFGHIJ
同7個の仮想の各遺伝子クラスタ(4個);ABCDEFG.BCDEFGH,CDEFGHI,DEFGHIJ
同8個の仮想の各遺伝子クラスタ(3個);ABCDEFGH,BCDEFGHI,CDEFGHIJ
同9個の仮想の各遺伝子クラスタ(2個);ABCDEFGHI、BCDEFGHIJ
同10個の仮想の各遺伝子クラスタ(1個);ABCDEFGHIJ
抽出する遺伝子の数の最大限は論理上ゲノム中の遺伝子の数とすることができるが、想定される遺伝子クラスタサイズの最大限の遺伝子数でよく、実際問題として、遺伝子クラスタを構成する遺伝子の数は、最大でも30個程度であり、これを超える必要は通常ない。
このB)手法は、上記A)の手法に比べ簡便であり、2次代謝産物の産生に関与する遺伝子クラスタ及び該クラスタ中の2次代謝産物産生遺伝子の探索に特に適している。
この手法は、ゲノムDNAの配列中、(1)2次代謝に関与していると想定される酵素種に属する酵素遺伝子、(2)トランスポーター遺伝子、(3)転写因子をコードする遺伝子の内、1種以上、好ましくは2種以上が近傍に位置する場合、これらの遺伝子から、あるいはこれら遺伝子が含まれるようにゲノム遺伝子を組み合わせて仮想の遺伝子クラスタとするものであり、この場合において、近傍に位置する具体的な条件は、ゲノム上に配列する遺伝子数でいえば、上限30程度以内に存在すればよい。
比較する上記2次代謝物産生誘導条件と2次代謝物産生非誘導条件、あるいは2次代謝物産生抑制条件と2次代謝物産生条件とは、代謝物産生速度、量等に差が生じる条件であればよく、例えば、薬剤の使用、温度、栄養源、培地等の調製の有無等、あるいは特にこのような誘導をせず、経時的に2次代謝物産生量に生じる場合の時間条件も含まれる。
なお、この手法においても、上記A)の手法と同様に発現変動量の測定の他は格別の実験を必要とせず、数学的データ処理によりなされる。
また、2次代謝物産生反応において複数の酵素が関与していると想定できる場合には、その複数の酵素種を選定することも可能である。
トランスポーター遺伝子及び転写因子遺伝子においても同様で、標的とする2次代謝物産生に直接関与している遺伝子を特定しなければならないというわけではない。
上記B)の手法による場合、近傍に位置する2次代謝に関与していると想定される酵素種に属する酵素遺伝子、2)トランスポーター遺伝子、3)転写因子をコードする遺伝子のうち少なくとも1種以上、好ましくは2種以上の遺伝子を抽出し、これらを組み合わせることにより、あるいはこれら遺伝子が含まれるようにゲノムDNA上の遺伝子を抽出して仮想の遺伝子クラスタとする。
例えば、以下のように、ゲノムDNA上に配列する遺伝子がA~Jの10個である場合、

前者の場合、仮想の遺伝子クラスタは、AC及びGJとにより構成される。一方、後者の場合は、ABC及びGHIJで構成してもよく、さらにABCDEあるいはFGHIJのように、各仮想の遺伝子クラスタが一定数の遺伝子により構成されるようにゲノムを分割して、各仮想の遺伝子クラスタを構成しても良い。
上記1)のプロセスにより取得されたゲノムDNA上に配列する各遺伝子の発現量変動比は、各対比条件セット毎に、正規化され、上記2)のプロセスにより構築された仮想の各遺伝子クラスタ単位で、以下の計算式a)により合算され、算出された値を、仮想の各遺伝子クラスタのスコアとする。

一方、1’)のプロセスにより取得された各遺伝子の発現量変動比も、同様に各対比条件セット毎に、正規化され、上記2)のプロセスにより構築された仮想の各遺伝子クラスタ単位で合算されるが、この手法はアノテーション付与により選定された特定の遺伝子のみの発現量変動比を用いるため、計算式a)の定義が異なる。すなわち上記式中、Mは各仮想の遺伝子クラスタのスコア、mはスコアリングされる仮想の各遺伝子クラスタに含まれるアノテーション付与に基づき選定された各遺伝子の発現量変動比、m-は全ての仮想の遺伝子クラスタに含まれるアノテーション付与に基づき選定された全遺伝子の発現量変動比(m値)の平均、s(m)は全ての仮想の遺伝子クラスタに含まれるアノテーション付与に基づき選定された全遺伝子の発現量変動比(m値)の標準偏差を表す。
すなわち、この仮想の遺伝子クラスタは、該クラスタ中の少なくとも2つの遺伝子が、代謝物産生誘導条件下協働した結果、発現変動量の総量であるスコアが増大したものであり、標的の遺伝子クラスタとみなすことができ、この仮想の遺伝子クラスタ中の遺伝子は少なくとも実際の遺伝子クラスタ中に存在する代謝物産生に関与する遺伝子であると同定することができる。さらに、仮想の遺伝子クラスタ中の遺伝子及び必要に応じ代謝産物の産生機構を検討すれば、直接代謝産物の産生に関与する標的遺伝子のみではなく、未知の機能を有する遺伝子の発見も期待でき、さらに代謝物産生機構の全体像も明らかにすることができる。

また、ゲノムDNA上に配列する遺伝子が、標的とする遺伝子機能を有すると推定される場合においは、A)の手法により構築された仮想の遺伝子クラスタの中から、標的とする遺伝子機能を有すると推定された遺伝子を含む仮想の遺伝子クラスタを選出し、選出された仮想の遺伝子クラスタのみについて、スコアリングすることも可能である。標的とする遺伝子機能を有するか否かについての推定においては、上記したアノテーション付与手段の全てを利用することができる。この手法によれば、スコアリングする対象となる仮想の遺伝子クラスタの数を低減することができる。また、この手法により選定された仮想の遺伝子クラスタは、結果として上記手法B)により構築された仮想の遺伝子クラスタと同様になる場合があるが、この手法による場合、一度A)の手法による網羅的な仮想の遺伝子クラスタ群を構築しておけば、自由に標的とする遺伝子あるいはこれを含む遺伝子クラスタの機能を変更でき、機能選択的な遺伝子解析が容易に行える点で有利である。また、該当するアノテーションが付与されなかった遺伝子のスコアを考慮に含めることができるため、機能未知の遺伝子の影響が大きい場合などに柔軟に対応できる。
仮想の遺伝子クラスタ全体のスコアの分布からの乖離の程度を示す判定値は、上記3)のプロセスにより算出されたスコアに基づき、例えば、以下の計算式b)あるいはc)から算出される。

上記計算式b)によれば、判定値I(χ)が0を超え、高い値を示す仮想の遺伝子クラスタは、仮想の各遺伝子クラスタのスコアに対する出現頻度分布から離れており、高い判定値Iを示した仮想の遺伝子クラスタを標的の遺伝子クラスタあるいは標的の遺伝子クラスタに対応する候補として選定することができる。候補の選定は、例えば判定値Iが高い順に仮想の遺伝子クラスタを一定数選定するかあるいは判定値Iが一定値以上を示した仮想のクラスタを選定するか等により行う。

この計算式c)による場合も 上記判定値Iと同様に、υが0を超え、高い値を示す仮想の遺伝子クラスタを標的の遺伝子クラスタあるいは標的の遺伝子クラスタに対応する候補として選定することができる。候補の選定は、例えば判定値IIが高い順に仮想の遺伝子クラスタを一定数選定するかあるいは判定値IIが一定値以上を示した仮想のクラスタを選定するか等により行う。
上記計算式b)、c)により算出された判定値(χあるいはυ)により、標的の遺伝子クラスタ候補となった仮想の遺伝子クラスタの数が多く、さらに候補を絞り込みたい場合は、以下の計算式d)の算出結果に基づき、bが100未満の仮想のクラスタを少なくとも除外することにより、標的の遺伝子クラスタ候補をさらに絞り込むことが可能である。

本発明においては、予めゲノム中に標的の遺伝子クラスタが存在するか否か及び標的遺伝子クラスタが存在する場合の遺伝子サイズ(クラスタを構成する遺伝子数;ncl)を推定することができる。
この手法は、まず、生物細胞の生理状態変化を生じる条件とコントロール条件下において生じたゲノムDNA上に配列する遺伝子の発現量変動比を合算し、仮想の遺伝子クラスタのスコアとするが、上記発現量の測定、発現量変動比データの取得、仮想の遺伝子クラスタの構築、及び仮想の各遺伝子クラスタをスコアリングの各プロセスは、上記A)の手法中1)~3)のプロセスと同様なプロセスである。
このように構成された各遺伝子クラスタは、上記A)の手法中3)のプロセスと同様に以下の計算式a)により、そのスコアが算出される。


また、この手法は、ある条件下で細胞が何らかの生理的状態変化を起こす場合においては、どのような生理的状態変化であっても変化を対比する条件が設定できれば、その原因遺伝子はもちろんその変化を生じる機構そのものが全く不明である場合においても、その変化原因が遺伝子クラスタ中の遺伝子の連関にあるのか否か、遺伝子クラスタ中の遺伝子の連関による場合該クラスタの遺伝子サイズも容易に予測できる。すなわちこの手法は、生物の生理的変化が、極めて探索の難しい複数の遺伝子の連関によって生じている場合において、その原因が遺伝子クラスタ中の遺伝子の共働によるものであることを明らかにでき、かつそのサイズも予測できる点で極めて有用である。
一方、本発明の手法を行った結果、仮に仮想の遺伝子クラスタ全体のスコア分布から乖離したスコアの遺伝子クラスタが見いだされなかった場合、設定する生理状態変化条件、重み付けするゲノムDNA上の遺伝子の選定、あるいは上記B)の手法による仮想の遺伝子クラスタ構築のためのゲノムDNA上の遺伝子の選定等の探索条件設定に問題点がある。したがって、このような場合には、探索条件を再設定して、バックグランドの分布から離れたスコアの遺伝子クラスタが見つかるまで、上記した遺伝子クラスタの探索法を繰り返し行えばよい。すなわち本発明においては、得られたデータのみから、探索条件設定の問題点を把握できる。
これに対して、上記したような従来法の場合には、もともと正解の遺伝子であっても、遺伝子全体の発現量についての分布中に埋もれてしまうので、得られたデータからでは正解か否かは不明であり、結果的に無意味かもしれない検証実験を繰り返さなければならない。
本発明の遺伝子探索装置は、ゲノムDNA上に配列する遺伝子の発現量データに基づき、数学的データ処理を行うもので、研究者の特別な知識あるいは勘にほとんど左右されることがなく、迅速、効率的に有用遺伝子が探索可能となり、従来困難であった代謝物、とりわけ2次代謝物産生に関与する遺伝子及び該遺伝子が含まれる遺伝子クラスタの探索に特に効力を発揮する。
本発明の遺伝子探索装置は少なくとも以下のa)~f)の手段により構成される。
a)生物細胞の生理状態変化を生じる条件とコントロール条件下におけるゲノムDNA上に配列する各遺伝子の発現量データを入力する手段。
b)入力された上記2つの条件下における各遺伝子の発現量の比を算出する手段。
c)ゲノムDNA上に配列する複数の遺伝子を組み合わせて仮想の遺伝子クラスタを構築する手段。
d)該算出されたゲノムDNA上に配列する各遺伝子の発現量変動比を複数の遺伝子により構築された上記仮想の遺伝子クラスタ単位の発現量変動比として合算し、仮想の遺伝子クラスタ単位毎にスコアリングする手段。
e)得られたスコアに基づき上記生理状態変化の原因遺伝子である標的遺伝子を含む遺伝子クラスタを選定する手段。
あるいはさらに
f)選定された遺伝子クラスタ中に含まれる遺伝子を表示する手段。
本発明装置は、データの入出力部(キーボード、マウス、ディスプレイ等)、該入出力部の制御を行う入出力制御インターフェース、記憶部(ハードディスク)、主記憶部(メモリ)、制御演算部(CPU)、外部ネットワークと接続する通信制御インターフェースを含む。
本装置の記憶部には、各遺伝子の発現量データ、該発現量変動比データ、ゲノム上の各遺伝子位置データ、及び仮想の遺伝子クラスタのスコアデータが記憶され、さらに必要に応じて、塩基配列に対する遺伝子機能の対応データ、各遺伝子のアノテーションデータ、仮想の遺伝子クラスタのスコア乖離度データが順次格納される。
また、さらに必要に応じて、各遺伝子へのアノテーション付与部、アノテーションに応じて、仮想の遺伝子遺伝子のスコアリングにおいて重み付けを行う重み付け付与部、仮想の遺伝子クラスタ構築を選定された機能遺伝子に限定して行うための機能遺伝子選択部、仮想の遺伝子クラスタの全体分布からの乖離度を算出する仮想の遺伝子クラスタの乖離度算出部を設け、さらに算出された乖離度では、遺伝子クラスタ候補の選定が充分できない場合に遺伝子クラスタ候補の絞り込みを行う遺伝子クラスタ候補の絞り込み部を設けてもよい。
本装置は、特別なコンピューターを必要とせず、一般的な、制御演算処理装置(CPU)、主記憶装置(メモリ)、記憶装置(ハードディスク)、入出力装置(キーボード、マウス、ディスプレイ)からなるもので構成可能である。オペレーティングシステムは、Linux、Windows、Macのいずれも使用可能であるが、メモリ空間を考慮すると、64bitのものがより望ましい。メモリは、本装置が生物のゲノム全体を対象とすることを考慮して、できれば2GB以上のものが望ましいが、1GB程度であっても、微生物であれば可能である。
A)遺伝子探索装置
1)ゲノムDNA上に配列する各遺伝子の発現量データ入力及び発現量変動比算出
本発明装置の場合、原則、ゲノムDNA上に配列する各遺伝子全てについて、生理状態変化条件下とコントロール条件下における発現量を測定し、得られた各遺伝子の発現量データを本発明装置の入力手段に入力し、入力された各遺伝子の発現量データに基づき、発現量変動比が算出される。
発現量の測定は、例えば、ゲノムDNA上に配列する各遺伝子に特異的なプローブを有するマイクロアレイを用いてそれ自体周知の手段により行うことができる。
例えば、代謝産物、特に2次代謝物の産生に関与する有用遺伝子を標的とする場合、1以上の2次代謝物産生誘導条件下(あるいは抑制条件下)で細胞を培養し、細胞からゲノムRNAを抽出し、ゲノムDNA上の各遺伝子に特異的なプローブを有するマイクロアレイでゲノムDNA上の各遺伝子の発現量を測定する。一方、コントロール条件として、上記2次代謝物の産生非誘導条件下(あるいは産生条件下)の場合における発現量を測定し、両条件下における発現量の比をとり、これを発現量変動比とする。
マイクロアレイ中の各遺伝子の発光強度は、例えば、マイクロアレイ読み取り装置における走査手段を伴う画像読み取り手段により読み取り、読み取った発光強度を数値化して、上記a)の入力手段により本発明の装置に入力する。このような画像読み取り装置は、市販されている装置が使用できるが、このような読み取り装置の手段全部あるいは例えば数値化手段等の一部手段を本発明の装置に組み込むか、あるいは該読み取り装置が出力する数値データを介して本発明装置の入力手段に自動で入力可能なように設計しても良い。
a)本発明の遺伝子探索装置においては、この仮想の遺伝子クラスタの構築手段として、ゲノム上での遺伝子の連続情報及び/又は位置番号を含むゲノム上の各遺伝子の位置情報、及び仮想の遺伝子クラスタの構築を実行する仮想の遺伝子構築プログラムが格納される。
仮想の各遺伝子クラスタは、上記ゲノム上の各遺伝子の位置情報に基づき、上記仮想の遺伝子クラスタ構築プログラムを実行することにより構築される。
すなわち、仮想の遺伝子クラスタは、ゲノムDNA上に連続する遺伝子を同一方向に2個から遺伝子数を一つずつ増やして、想定される遺伝子クラスタに含まれる最大限の遺伝子数になるまで抽出され、かつ該抽出において、抽出する遺伝子の各個数毎に、直鎖状DNAからなるゲノムの場合には該DNAのいずれかの末端から、環状DNAからなるゲノムの場合には任意の遺伝子を起点として順にゲノムDNA上に配列する遺伝子を一つずつずらしながら抽出された各遺伝子群からなるが、このような仮想の遺伝子クラスタを構築するため、上記仮想の遺伝子クラスタの構築プログラムは、本発明装置の記憶装置に記憶されたゲノムDNA上の各遺伝子の位置情報に基づき、以下の処理手段を実行する。その手順を図3に示す。なお、図3中、Nは、仮想の遺伝子クラスタを構成する遺伝子数を表す。
a)ゲノムDNAの一方の末端に位置する遺伝子を起点として、他方の末端方向に、順次、ゲノムDNA上に連続する遺伝子を同一方向に2個から一つずつ増やして(N+1)、想定される遺伝子クラスタに含まれる遺伝子数の最大限(ncl)になるまで組み合わせ、起点とした遺伝子を含み、かつ遺伝子の個数の異なる複数の遺伝子群を構成する。
b)起点を、順次、他方の末端方向に一遺伝子ずつずらせながら(起点遺伝子の移動)、上記a.と同様の処理を行い、新たな起点遺伝子を含みかつ遺伝子の個数が異なる複数の遺伝子群を構成し、a)の遺伝子群と併せて、複数の遺伝子の組み合わせた遺伝子群からなる仮想の遺伝子クラスタを構築する。
(2)ゲノム遺伝子が環状の場合、ゲノムDNA上の任意の遺伝子を起点として、上記(1)a)及びb)と同様の処理を順次行い、最初に起点とした遺伝子が起点となる時点で処理を終了する(最初に起点として遺伝子に基づく仮想の遺伝子クラスタの構築は再度行わない。)。
一方、上記のようにゲノム上の各遺伝子の各位置情報を格納しなくとも、例えば予めマイクロアレイ上の各DNAをゲノムDNA上の配列順に整列させておくことにより、ゲノムDNA上の遺伝子の配列順に従いそのまま入力して、入力された遺伝子の順序を遺伝子位置番号として記憶し、該位置番号を用いて仮想遺伝子クラスタを構築することもできる。
このようにして構築された仮想の遺伝子クラスタは記憶部に記憶される。
構築される仮想の遺伝子クラスタは、例えば、次のように、ゲノムDNA上に配列する遺伝子がA~Jの10個である場合、以下の遺伝子群からなる(表1)。


抽出する遺伝子の数の最大限は論理上ゲノム中の遺伝子の数とすることができるが、想定される遺伝子クラスタサイズの最大限の遺伝子数でよく、実際問題として、遺伝子クラスタを構成する遺伝子の数は、最大でも30個程度であり,これを超えて遺伝子クラスタを構築する必要は通常ない。
上記のように構築された仮想の各遺伝子クラスタは、本発明装置のスコアリング手段により、スコアリングされる。該スコアリング手段は、本装置の処理演算部に格納されているスコアリングプログラムにより実行される(図4)。
該プログラムは、記憶部に記憶されている、ゲノムDNA上の各遺伝子の発現量変動比データと上記構築された仮想の遺伝子クラスタ情報を呼び出して、各仮想の遺伝子クラスタを構成する遺伝子と各発現量変動比データの遺伝子を照合して、以下の計算式aを使用して各遺伝子の発現量変動比を合算して、各仮想の遺伝子クラスタのスコアを算出する手段を実行する。得られた各仮想の遺伝子クラスタのスコアは、出力されるか及び/又は記憶部に記憶される。

本発明によれば、このようにして得られた一群の仮想の遺伝子クラスタのスコアに対する出現頻度分布をみる場合、全体としては大凡正規分布となるが、このような全体のスコア分布から離れて存在する仮想の遺伝子クラスタが存在すれば、少なくとも標的の遺伝子クラスタと対応していると判定できる。
すなわち、この仮想の遺伝子クラスタは、該クラスタ中の少なくとも2つの遺伝子が、代謝物産生誘導などの生理状態変化条件下で協働した結果、発現変動量の総量であるスコアが増大したものであり、標的の遺伝子クラスタとみなすことができ、この仮想の遺伝子クラスタ中の遺伝子は少なくとも実際の遺伝子クラスタ中に存在する代謝物産生などの生理状態変化に関与する遺伝子であると同定することができる。さらに、例えば、仮想の遺伝子クラスタ中の遺伝子及び必要に応じ代謝産物の産生機構を検討すれば、直接代謝産物の産生に関与する標的遺伝子のみではなく、未知の機能を有する遺伝子の発見も期待でき、さらに代謝物産生機構の全体像も明らかにすることができる。
本発明の遺伝子探索装置においては、入力されたゲノム上の各遺伝子にアノテーションを付与する手段を設けることができる。アノテーション付与は、ゲノム上の遺伝子が、標的とする遺伝子機能を有すると推定される場合、あるいは標的とする遺伝子機能を有する可能性が低いか若しくはその可能性がないと推定できる場合において行う。
このようなアノテーション付与は、探索対象ゲノム上の各遺伝子の塩基配列情報等を基に、記憶部に記憶されたゲノム上の各遺伝子の位置情報中の遺伝子について行う。
このようなシステムによれば、アノテーション付与を研究者の手を煩わすことなく自動で行うことができる。アノテーション付与は、機能が同様なゲノム遺伝子に付与しても良いし、機能の種類が異なる複数種の遺伝子に付与しても良い。機能が異なる複数種のゲノム遺伝子にアノテーションを付与する場合には、ゲノム遺伝子の機能毎に識別可能なように付与する。アノテーションによる選定の対象となる遺伝子は、例えば、2次代謝物産生に関与する遺伝子クラスタあるいはその中の遺伝子を標的とする場合、ゲノムDNAの配列中、(1)2次代謝に関与していると想定される酵素種に属する酵素遺伝子、(2)トランスポーター遺伝子、(3)転写因子をコードする遺伝子を選定可能である。
(1)本発明の遺伝子探索装置においては、各仮想の各遺伝子クラスタのスコアリングにおいて、各仮想の遺伝子クラスタ中に該当する機能に関するアノテーションが付与された遺伝子がある場合、その遺伝子についての発現量変動比に重み付けを実行する重み付けスコアリングプログラム(図5)を格納することができる。これにより、アノテーションに基づき選定されたゲノム遺伝子についての発現量変動比は重み付けがなされ、仮想の各遺伝子クラスタのスコアリングがなされる。この重み付けスコアリングプログラムは、各仮想の遺伝子クラスタのスコアリングにおいて、アノテーションに基づき選定された遺伝子について、以下の計算式による重み付け計算手段を実行する他は、上記3)のスコアリングプログラムと同様の手段を実行する。

(2)一方、本発明の遺伝子探索装置においては、上記重み付けの代わりに、構築された仮想の遺伝子クラスタの中から、アノテーションに基づき選定された遺伝子を含む仮想の遺伝子クラスタを選出し、この選出された仮想の遺伝子クラスタについてのスコアリングを実行するプログラムを格納してもよい。このような手段は、上記標的とする遺伝子機能を有すると推定される場合に有効であり、例えば上記した2次代謝物産生に関与する機能遺伝子の探索等においては、特に有効である。これにより、スコアリングする仮想の遺伝子クラスタの数を削減できスコアリング時間を短縮することができる。例えば、上記表1において、アノテーション付与された遺伝子がAとCである場合、遺伝子AとCを含む仮想の遺伝子クラスタのスコアリングは、合計8個ですむ。
また、この手法により選定された仮想の遺伝子クラスタは、結果として、後記する5)アノテーションに基づき遺伝子を選定した場合の仮想の遺伝子クラスタ・スコアリング2において示される、選定された機能遺伝子により構築された仮想の遺伝子クラスタと同様なものになる場合があるが、この手法による場合、後記する一度Aの手法による網羅的な仮想の遺伝子クラスタ群を構築しておけば、自由に標的とする遺伝子あるいはこれを含む遺伝子クラスタの機能を変更でき、種々の機能選択的な遺伝子解析が容易に行える点で有利である。また、該当するアノテーションが付与されなかった遺伝子のスコアを考慮することもできるため、機能未知の遺伝子の影響が大きい場合などに柔軟に対応できる。
一方、本発明の遺伝子探索装置においては、ゲノム上近傍に存在する遺伝子について、アノテーションの種類毎に、機能遺伝子を一種以上、好ましくは2種以上抽出するか、あるいはこれら遺伝子が含まれるようにゲノムDNA上の遺伝子を抽出して仮想の遺伝子クラスタとする、仮想の遺伝子をクラスタの構築手段を設けることができる。これによればスコアリングの対象となる遺伝子クラスタの数を大幅に減らすことができ、処理データ量が少なく簡便であり、2次代謝産物の産生に関与する遺伝子クラスタ及び該クラスタ中の2次代謝産物産生遺伝子の探索に特に適している。このような処理を実行するプログラム(図6)は、記憶部に記憶されたゲノム上の遺伝子の位置情報に基づき、アノテーションにより選定された遺伝子について、ゲノムDNA上において近傍に位置することを条件として、上記選定された遺伝子を1種以上、好ましくは2種以上抽出し、これら抽出した遺伝子により、仮想の遺伝子クラスタを構築するかあるいは少なくともこれら選定された遺伝子が含まれるようにゲノム遺伝子を抽出して仮想の遺伝子クラスタとする手段を実行する。
例えば、これら仮想の遺伝子クラスタの構築において機能遺伝子のみを組み合わせる場合、ゲノム上に配列する遺伝子数で上限30程度の範囲にある遺伝子であり、本発明装置においては、組み合わせる機能遺伝子の範囲の入力、設定手段を設けるとともに、上記プログラムはこれに基づき組み合わせる機能遺伝子を選択する。該プログラムは、上記遺伝子に付与されたアノテーションの種類と上記記憶部に記憶された上記ゲノム上の各遺伝子の位置情報中の位置番号により組みあわせる遺伝子を選択する。
例えば、以下のように、ゲノムDNA上に配列する遺伝子がA~jの10個である場合、

仮想の遺伝子クラスタは、AC及びGJとにより構成してもよく、また、これら遺伝子が含まれるように、ABC及びGHIJで構成してもよく、さらにABCDEあるいはFGHIJのように、各仮想の遺伝子クラスタが一定数の遺伝子により構成されるようにゲノムを分割して、各仮想の遺伝子クラスタを構成しても良い。
また、二次代謝物産生反応において複数の酵素が関与していると想定できる場合には、その複数の酵素種を選定することも可能である。
本発明の遺伝子探索装置においては、上記したように仮想の遺伝子クラスタンスコアリングにより算出されたスコアあるいはこれを加工した形態で、画面表示及び/または紙等の表示媒体に出力する手段を設けることができる。表示手段としては、例えば、スコアの高い順に仮想の各遺伝子クラスタを表示したり、あるいは仮想の遺伝子クラスタのスコアの分布状態を表すグラフ等があげられ、さらに仮想の遺伝子クラスタに含まれる遺伝子を表示する手段を設けることもでき、これらに基づき、仮想の遺伝子クラスタを選定することができる。
一方、スコアが高く全体分布と乖離している仮想の遺伝子クラスタは、実際に存在する標的の遺伝子クラスタに一致ないし対応する仮想の遺伝子クラスタの可能性が高い。以下に示す7)あるいは8)の手段は、仮想の各遺伝子クラスタのスコアの全体のスコアからの乖離の程度をみることにより、標的の遺伝子クラスタ候補を選定するか、あるいはさらに候補の絞り込みを行うための手段であり、本発明装置にこれら7)あるいはさらに8)の手段を設けて、乖離度を示す判定値I(χ)、判定値II(υ)あるいは絞り込み結果(b値)を上記選定された仮想の遺伝子クラスタ及びその中に含まれる遺伝子とともに表示することができる。これらにより、標的の遺伝子クラスタ及び該遺伝子クラスタに含まれる標的の遺伝子を特定できる。
上記スコアリング結果の表示から、標的とする遺伝子クラスタあるいはその中の標的遺伝子を見いだすことは十分可能と考えられるが、より客観性及び効率性を高めるため、本発明装置においては、さらに仮想の遺伝子クラスタ全体のスコアの分布から乖離して存在するスコアを有する仮想の遺伝子クラスタを、標的の遺伝子クラスタ候補として選定する手段を設けることができる。本発明の装置における、このような、仮想の遺伝子クラスターのスコアの、全体分布からの乖離度を判定する手順について、図7に示す。
この候補選定手段には、仮想の遺伝子クラスタ全体のスコアの分布からの乖離の程度を示す判定値を算出する、乖離度判定プログラムが格納されている。この乖離度判定プログラムは2種あり、上記仮想の遺伝子クラスタのスコアリングプロセスにより算出されたスコアに基づき、例えば、以下の計算式b)あるいはc)に基づき、それぞれ判定値I(χ)あるいは判定値II(υ)を算出し、判定値I(χ)あるいは判定値II(υ)が、例えば、予め設定した一定値以上を示した仮想のクラスタを標的の遺伝子クラスタの候補として選定する手段を実行する(図7)。選定結果は判定値とともに出力されるが、併せて乖離度の平均値等も出力するようにしてもよい。これら2種のプログラムは、本発明装置にともに格納しても良いが、そのうち1種のみを格納しても良い。

上記計算式b)によれば、判定値I(χ)が0を超え、その絶対値が高い値を示す仮想の遺伝子クラスタは、仮想の各遺伝子クラスタのスコアに対する出現頻度分布から離れており、その絶対値が高い判定値Iを示した仮想の遺伝子クラスタを標的の遺伝子クラスタあるいは標的の遺伝子クラスタに対応する候補として選定することができる。

この計算式c)による場合も上記判定値Iと同様に、υが0を超え、高い値を示す仮想の遺伝子クラスタを標的の遺伝子クラスタあるいは標的の遺伝子クラスタに対応する候補として選定することができる。
上記計算式b)、c)により算出された判定値(χあるいはυ)により、標的の遺伝子クラスタ候補となった仮想の遺伝子クラスタの数が多く、さらに候補を絞り込みたい場合に備えて、本発明装置においては、遺伝子クラスタ候補絞り込み手段として以下の計算式d)による計算を行う、候補絞り込みプログラムを格納することができる(図8)。すなわち、各仮想の遺伝子クラスタについて、判定値IおよびIIの積を取った値について、bが100未満の仮想のクラスタを少なくとも除外することにより、標的の遺伝子クラスタ候補をさらに絞り込むことが可能である。

一方、本発明の手法を行った結果、仮に仮想の遺伝子クラスタ全体のスコア分布から乖離したスコアの遺伝子クラスタが見いだされなかった場合、設定する生理状態変化条件、重み付けするゲノムDNA上の遺伝子の選定、あるいは上記B)の手法による仮想の遺伝子クラスタ構築のためのゲノムDNA上の遺伝子の選定等の探索条件設定に問題点がある。したがって、このような場合には、探索条件を再設定して、バックグランドの分布から離れたスコアの遺伝子クラスタが見つかるまで、上記した遺伝子クラスタの探索法を繰り返し行えばよい。すなわち本発明においては、得られたデータのみから、探索条件設定の問題点を把握できる。
これに対して、上記したような従来法の場合には、もともと正解の遺伝子であっても、遺伝子全体の発現量についての分布中に埋もれてしまうので、得られたデータからでは正解か否かは不明であり、結果的に無意味かもしれない検証実験を繰り返さなければならない。
一方、本発明における上記仮想の遺伝子クラスタの構築手段及びそのスコアリング手段を用いた他の態様として、標的とする遺伝子クラスタの有無及び標的とする遺伝子クラスタが存在する場合のサイズ(クラスタを構成する遺伝子数;ncl)を推定する装置(以下、遺伝子クラスタ予測装置という。)を挙げることができる。本発明の装置における、この遺伝子クラスタ予測装置の概要を図9に示す。
この遺伝子クラスタ予測装置においては、まず、生物細胞の生理状態変化を生じる条件とコントロール条件下において生じたゲノムDNA上に配列する遺伝子の発現量変動比を合算し、仮想の遺伝子クラスタのスコアとするが、ゲノムDNA上に配列する各遺伝子の発現量データの入力、発現量変動比の計算、仮想の遺伝子クラスタの構築、及び仮想の各遺伝子クラスタのスコアリングの各手段は、上記1)~3)に記載した手段と同様である。


コウジ酸の産生に必須の遺伝子の同定
本参考例は、本発明による遺伝子の探索、同定の有利性を明らかにするため、まず従来法によるアスペルギルス・オリゼのコウジ酸産生遺伝子の探索、同定手法について示すものである。
アスペルギルス・オリゼ(Aspergillus oryzae)の菌株RIB40(以下、単にアスペルギルス・オリゼと書いた場合にはこの菌株を指す)は、以下の組成の液体培地中で、30℃、150回転/毎分の条件下で生育させた場合、コウジ酸を培地中に産生する。500mLのこぶつき三角フラスコ中に250mLの培地を入れ、アスペルギルス・オリゼの胞子懸濁液を105-107/mLになるように接種する。
10%(W/V)グルコース
0.25%(W/V)イーストエクストラクト(Yeast Extract)
0.1%(W/V)K2HPO4
0.05%(W/V)MgSO4・7H2O
pHを6.0に調整後、オートクレーブにより滅菌する。
このような検出法によれば、接種後3または4日目には産生を検出することが可能であり、少なくとも7日目には十分な速度をもってコウジ酸の産生が行われている。またコウジ酸の産生は、上記の産生培地に0.1%(W/V)以上の硝酸ナトリウムを加えることで阻害される。この硝酸ナトリウムによる阻害は可逆的である。硝酸ナトリウムの添加によって阻害された菌糸を、培地成分の洗浄後、新たに用意した産生条件を満たす培地に移すことによって、菌はコウジ酸の産生を開始する。
C1.上記コウジ酸産生培地で、4日間および2日間生育させた菌体の遺伝子の発現を比較した(4日目/2日目)。
C2.上記コウジ酸産生培地で、7日間および4日間生育させた菌体の遺伝子の発現を比較した(7日目/4日目)。
C3.上記コウジ酸産生培地に0.3%(W/V)の硝酸ナトリウムを添加してコウジ酸産生を阻害した菌体と、上記コウジ酸産生培地で生育させた菌体を比較した。どちらも4日間、30℃、150回転/分の条件で生育させた(NO3 -なし/あり)。
発現量の比、および発現の強度に相当する値は、それぞれで正規分布に近い分布をするが、値の絶対値は大きな違いがある。この両者を統合して候補を抽出するために、発現量の比、発現の強度は、それぞれで値の正規化を実施した後で、比較した。それぞれ正規化した発現量の比、および発現の強度に相当する値の積を作成した。その積が高いほど、コウジ酸の産生に関係する可能性が高いと考え、それぞれの実験で高い積の値をもつもの上位5つを選び出した(表2)。

ここで上記C1~C3の3つの系は、いずれもコウジ酸の産生量が有意に異なる2つの条件を比較したものである。したがって理想的には、どの系においてもコウジ酸産生に必須の遺伝子が上位に現れると予想した。しかし現実には、3つの系全てにおいて上位にくる遺伝子はなかった。したがっていずれの系においても、上位に来るものはコウジ酸の産生に必須であるか、または各条件に特異的に誘導される遺伝子である可能性の両者を含む。これらの中からコウジ酸の産生に必須の遺伝子を選び出すために、各系において上位に来ている候補遺伝子のいずれかを破壊して変異体を作製し、当該変異体のコウジ酸産生能を解析した。
以上の解析により、AO090113000136、AO090113000137、AO090113000138の3つの遺伝子がコウジ酸の産生に必須の遺伝子であると同定された。本同定過程には、培養条件の検討などを除いて、およそ1年の時間を要した。
このようにして同定されたコウジ酸の産生に必須の3つの遺伝子について、系C1~C3におけるDNAマイクロアレイの結果において、その発現量変動比m値が全遺伝子中どの位置に来るかを表3にまとめた。

アスペルギルス・オリゼにおける遺伝子クラスタ・スコアリングによるコウジ酸合成遺伝子同定
本特許で出願する該当遺伝子の同定手法に従い、本発明装置を使用して、アスペルギルス・オリゼのコウジ酸産生関連遺伝子からなる遺伝子クラスタを同定した。
この実験に使用した装置は、データの入出力装置、入出力インターフェース、記憶装置、制御演算装置(CPU)から構成され、上記制御演算装置は、発現量変動比算出部、仮想の遺伝子クラスタ構築部、仮想の遺伝子クラスタのスコアリング部、仮想の遺伝子クラスタの乖離度判定値算出部、遺伝子クラスタ候補絞り込み部、及び遺伝子クラスタ予測部を有し、これら各部には、それぞれ順に、発現量変動比算出プログラム、仮想の遺伝子クラスタ構築プログラム、仮想の遺伝子クラスタ・スコアリングプログラム、乖離度判定値(χ)および(υ)算出プログラム、候補絞り込みプログラム並びに遺伝子クラスタ分布判定値(ε)算出プログラムが格納されている。
また、これら各部での計算は、Linuxオペレーティングシステム上で、フリーソフトウェアR、およびプログラム言語Perlを用いて行った。
DNAマイクロアレイのデータは、参考例1と同様のものを使用した。すなわち以下の、コウジ酸を産生する培養条件を分子に、コントロールとなる培養条件を分母にして測定した、以下のC1~C3の系における二色法データである。
C2.7日目/4日目
C3.NO3 -なし/あり
これらは各々、産生条件と非産生条件の下で生育させた菌体からmRNAを取り出し、それぞれ色素でラベリングした後でアレイ上のオリゴDNAにハイブリダイズすることによりデータを得て、そこから各遺伝子の発現量変動比(m値)を得た。
具体的には、上記系C1~C3における各産生条件と非産生条件の下で生育させた菌体からmRNAを取り出し、産生条件と非産生条件から取り出したmRNAをそれぞれ異なる蛍光色素でラベリングした後でアレイ上のオリゴDNAにハイブリダイズさせ、それぞれの検出波長強度情報を入力し、発現量変動比算出部に格納された発現量変動比算出プログラムを適用して各遺伝子の発現量変動比(m値)を得た。
このDNAマイクロアレイの実験においては、14032個のプローブからなるプラットフォームを用いたが、その全てに対応する遺伝子が発現し値を取れるわけではない。そこで本実施例では、3つの系に共通して発現が確認された5179個の遺伝子についての発現強度情報を用いた。
記憶部に記憶されたアスペルギルス・オリゼのゲノムDNA上の各遺伝子の位置情報に基づき、仮想の遺伝子クラスタ構築部に格納された仮想の遺伝子クラスタ構築プログラムを適用して、遺伝子サイズを1~30と設定し仮想の遺伝子クラスタを構築した。なお、本実施例及び以降の実施例においては、個々の遺伝子を探索する従来法に対する本発明による探索法の有利性を検証するため、仮想の遺伝子クラスタの構築においては、遺伝子サイズを1~30と設定し、順次遺伝子1個から遺伝子数を1つずつ増やしながら30個になるまで行ったが、2個以上の遺伝子の組み合わせからなる仮想の遺伝子クラスタのスコアリングに加え、遺伝子数1の場合のスコアリングも行っている。
図14はそのヒストグラムである。左の拡大図をみると分かるように、ゼロを中心とした山型の正規分布様集団から外れて高いM値を持つ仮想の遺伝子クラスタがあると、全体を表したヒストグラムにおいて山の中心が左側にずれる。
計算式e)にしたがって、系C1~3における遺伝子クラスタスコア分布判定値εを算出した(図15)。
具体的には、本発明の装置に記憶された各仮想の遺伝子クラスタのスコアを呼び出し、遺伝子クラスタ予測部に格納されている遺伝子クラスタ分布判定値(ε)算出プログラムを適用し、計算式e)にしたがって、系C1~3における遺伝子クラスタスコア分布判定値εを算出した(図15)。該算出に当たり計算式e)における仮想の遺伝子クラスタの数nは5179とし、上記発現量データを伴う遺伝子5179個中の遺伝子が一つも含まれない仮想の遺伝子クラスタは除外した。また、次元数dは6を採用した。
図にあるように、C1~3のいずれの系においてもε値は基本的に単調減少しており、クラスタ・スコアリングによる平均化の影響が見て取れる。しかし系C2において、ncl=3のときε値はいったん増加に転じており、次のncl=4において再び減少している。すなわちこの点において、ε値は隣り合う二点よりも大きいため、[数6]より、系C2において、標的とする遺伝子クラスタがゲノム中に存在し、その遺伝子クラスタに含まれる遺伝子数は3個であると推定された。
以上の結果をふまえ、系C2のDNAマイクロアレイデータを用いて、以下の検証、同定実験を行った。
系C2のDNAマイクロアレイデータに基づき算出した上記各仮想の遺伝子クラスタのスコア(M値)に基づき、計算式b)にしたがって遺伝子クラスタの判定値χを算出した(図16)。
具体的には、本発明の装置に記憶されている系C2における各仮想の遺伝子クラスタのスコアに、仮想の遺伝子クラスタの乖離度算出部に格納された仮想の遺伝子乖離度判定プログラムのうちχ値算出プログラムを適用し、計算式b)にしたがって、各仮想の遺伝子クラスタについての判定値χを算出した。
なお、図16中の各折れ線は、仮想の遺伝子クラスタ構築において起点となる遺伝子が共通する遺伝子サイズ1~30の各仮想の遺伝子クラスタの判定値を結んだものである(図17、18、21、23、30~32、35~37も同様。)。
ここで、ncl=1のときの値がncl=2のときの値より大きい仮想の遺伝子クラスタは、本手法におけるクラスタ・スコアリングによってスコアを上げているわけではないので、該当しない。またncl=1のときの値が負の仮想の遺伝子クラスタは、本手法におけるクラスタ・スコアリングにおいて、そのスコアの上昇に寄与しないため、該当しない。そこで図13においては、これらのものを除外してある。
この結果は参考例の結果と一致し、上記遺伝子クラスタ分布判定値(ε)算出による予測結果が正しいことが分かる。また、判定値χによって、標的とする遺伝子クラスタ及び該クラスタに含まれる遺伝子も同定可能なことが明らかとなった。
続いてもう一つの遺伝子クラスタ判定値であるυを、上記と同様の各仮想の遺伝子クラスタのスコアに、各仮想の遺伝子クラスタについて、仮想の遺伝子クラスタの乖離度算出部に格納された遺伝子乖離度判定プログラムのうちυ値算出プログラムを適用し、計算式c)にしたがって算出した(図17)。ここでも、χ値と同様、ncl=1のときの値がncl=2のときの値より大きい仮想の遺伝子クラスタは除外してある。ここで次元数d’は2、係数aは1を採用した。すると図のように、ncl=3のとき極大かつ最大値をとる仮想遺伝子クラスタが一つある。これはχ値のときと同様、コウジ酸産生に必須の3つの遺伝子のみを含む遺伝子クラスタである。したがって、判定値υによっても標的とする遺伝子クラスタ及び該クラスタに含まれる遺伝子が同定可能であることが明らかとなった。
以上から、本発明の手法および装置は、DNAマイクロアレイデータのみを用いて、ゲノム上に集合して機能を果たす生合成遺伝子の探索、同定を可能とする実効的な手段であることが示された。
アスペルギルス・オリゼにおけるアノテーション(機能注釈)による重み付けを行った場合の仮想の遺伝子クラスタ・スコアリングによるコウジ酸合成遺伝子の探索
アスペルギルス・オリゼのコウジ酸産生関連遺伝子からなる遺伝子クラスタを同定することを目的として、予測される機能に関連した注釈のついた遺伝子のm値に重み付けをした後、該当遺伝子の同定を行った。
この実験に使用した装置は、上記実施例1に記載した装置と基本的に同様であるが、アノテーションによる遺伝子選定部、選定された遺伝子に対する発現量変動比の重み付与部を有している点で異なる。
コウジ酸産生に必要な機能は以下の3つの機能を選出した。
・膜輸送体:transporterまたはmajor facilitator
・転写制御因子:transcription
・酸化還元酵素:oxidoreductaseまたはdehydrogenase
なお、上記英単語は、アノテーションによる遺伝子選定に用いたキーワードである。
一般に利用されているアノテーション推定ソフトウェアシステムの一つであるInterproscan(http://www.ebi.ac.uk/Tools/InterProScan/)を用いて、アスペルギルス・オリゼのゲノムDNA上の各遺伝子についてアノテーションを付与し、その結果付与されたアノテーションに基づき、上記3つの機能に該当する遺伝子を選出した。具体的には、該各遺伝子についてのアノテーションデータを本装置の入力装置に入力し、記憶装置に記憶した。記憶したアノテーションデータのデータを呼び出し、上記3種の機能を有する遺伝子を機能遺伝子選択部の選択プログラムを適用して選定した。なお、選定は各遺伝子について付与されたアノテーション中に上記3つの機能群に対応する英単語が含まれるかどうかで行い、その結果、該当した遺伝子は5179個のうち709個であった。
続いてこれらの該当する注釈のついた遺伝子に対して、実施例1に記載した3つのアレイ測定の系C1~3のそれぞれについて、その発現量変動比(m値)に正規化後重みw=2.0を積算した後、計算式a)にしたがってncl=1~30でクラスタ・スコアリングを行い、各仮想の遺伝子クラスタのM値を得た。
具体的には、このように選定された遺伝子についての発現量変動比は、重み付与部により重み付け([数2]参照)がなされ、この重み付けされた発現量変動比を用いて、各仮想の遺伝子クラスタのスコアが算出される。アノテーションに基づき選定された遺伝子の発現量変動比に重み付けする以外は、仮想の遺伝子クラスタの構築プログラム、スコアリングプログラム自体、実施例1と相違しない。この実験においては、発現量変動比(m値)に正規化後、アノテーションにより選定された遺伝子の発現量変動比には、重みw=2.0を積算し、仮想の遺伝子クラスタのスコアリング部に格納されたスコアリングプログラムを適用し、計算式a)にしたがってncl=1~30でクラスタ・スコアリングを行って各仮想の遺伝子クラスタのスコア(M値)を得た。なお、算出された各仮想の遺伝子クラスタのスコアは、本発明装置の記憶装置に記憶した。
図19は、上記算出された各仮想の遺伝子クラスタスコアのヒストグラムである。左の拡大図を図14と比較すると、重み付けによってより高いスコアが出現したために、相対的にゼロを中心とした山型の分布がより尖ってみえ、かつ山の中心がより左側にずれていることが分かる。
続いて計算式e)にしたがって、系C1~3におけるスコア分布評価値εを算出した(図20)。具体的には、上記(A)により算出され、記憶された各仮想の遺伝子クラスタのスコアを呼び出し、遺伝子クラスタ予測部に格納されている遺伝子クラスタ分布判定値(ε)算出プログラムを適用し、計算を行った。ここで実施例1と同様に、仮想遺伝子クラスタ数nは5179、次元数dは6を採用した。図20にあるように、系C1およびC3ではε値は基本的に単調減少しているのに対し、系C2ではncl=3のときε値は大きく増加し極大値を示す。その値は実施例1におけるもの(図15)の10倍以上であった。すなわち機能の注釈による重み付けによって、より機能限定的に高精度で該当遺伝子クラスタの存在及びその遺伝子数が予測可能であることを示している。
この実験によって、系C2のマイクロアレイデータ中に標的とする遺伝子クラスタによるものと推定されるデータが存在することが強く示唆されたため、続いてC2のDNAマイクロアレイデータを用いて以下の検証、同定実験を行った。
上記(A)で得られた系C2についての注釈重み付け後の仮想に遺伝子クラスタのスコア(M値)から、計算式b)にしたがって遺伝子クラスタ判定値χを算出した(図21)。
具体的には、記憶されている系C2における各仮想の遺伝子クラスタのスコアを呼び出し、仮想の遺伝子クラスタの乖離度算出部に格納された仮想の遺伝子乖離度判定プログラムのうちχ値算出プログラムを適用し、計算式b)にしたがって、各仮想の遺伝子クラスタについての判定値χを算出した。なお、図21においても、実施例1の図16と同様に、ncl=1のときの値がncl=2のときの値より大きい仮想の遺伝子クラスタ、及びncl=1のときの値が負の仮想の遺伝子クラスタは除外している。
結果は、図21に示されるように、実施例1と同様、1つの仮想遺伝子クラスタがncl=3で極大かつ最大値を示した。これがコウジ酸産生に必須の3つの遺伝子、AO090113000136、AO090113000137、AO090113000138のみを含んだものである点は、実施例1(図16)と同様だが、ここでは上位のχ値が重み付けによって図16におけるものより2倍程度高くなり、他との差が広がっている。すなわち注釈による重み付けによって、機能に即した該当遺伝子クラスタの検出精度が向上しているといえる。
実施例1と同様、ncl=3のとき極大かつ最大値をとる仮想の遺伝子クラスタが一つあり、これがコウジ酸産生に必須の3つの遺伝子のみを含む遺伝子クラスタである。その他にncl=2に小さなピークを持つものが1つ見受けられるが、これはコウジ酸産生関連遺伝子の3つのうちの2つ(AO090113000137、AO090113000138)からなるものである。図22を図17と比較すると分かるように、アノテーション付与により選定された機能を有する遺伝子の発現量変動比に重み付けを行うことで、標的とする遺伝子クラスタのスコアが嵩上げされて浮き彫りになり、探索対象の遺伝子クラスタをより高精度に検出可能となっている。
以上より、該当アノテーションにより選択されたる遺伝子の発現量変動比に重み付けを行うことによって、より高精度に機能に即した形で該当遺伝子クラスタを検出、同定できることが示された。
アスペルギルス・オリゼにおける特定機能を有するゲノム遺伝子により、仮想の遺伝子クラスタを構築し、スコアリングした場合の、コウジ酸生合成遺伝子の探索
本実施例は、アスペルギルス・オリゼのゲノム遺伝子中、特定の機能を持った遺伝子によって仮想の遺伝子クラスタを構築し、仮想の遺伝子クラスタのスコアを解析することにより、コウジ酸産生に必須の遺伝子を探索しうることを検証するための実験である。
本実施例では、仮想の遺伝子クラスタのサイズ(ncl)を5として、アスペルギルス・オリゼのゲノム配列より14032個の仮想遺伝子クラスタを作成した。実施例1と同様、途中抜けているものやゲノム断片の末端に位置する仮想の遺伝子クラスタは、ncl個より少ない遺伝子よりなるものとして構成した。
この実験においては、実施例2の装置を用いた。ただし、実施例2における実験系C1からC3の3種のアレイデータについては、足し合わせて一つの発現量変動比(m値)にまとめたものを使用した。また、重み付けの代わりに、仮想の遺伝子クラスタのサイズを遺伝子数で5と設定し、構築された仮想の遺伝子クラスタ中から、アノテーションにより選定された複数種の機能遺伝子が含まれていることを条件として、仮想の遺伝子クラスタを選出し、該選出された仮想の遺伝子クラスタを、スコアリングする対象の仮想の遺伝子クラスタとするように、システムを変更した。その他は実施例2と同様である。
すなわち、ゲノム上近傍に位置する条件として、仮想の遺伝子クラスタのサイズ(ncl)を5と設定して、記憶装置に記憶されたアスペルギルス・オリゼのゲノム上の位置情報に基づき、14032個の仮想遺伝子クラスタを作成した。この場合において実施例1と同様、途中抜けているものやゲノム断片の末端に位置する仮想の遺伝子クラスタは、ncl個より少ない遺伝子で構成した。
・膜輸送体:transporterまたはmajor facilitator
・転写制御因子:transcription
・酸化還元酵素:oxidoreductaseまたはdehydrogenase
上記手順は、具体的には、実施例2と同様にして、記憶装置に記憶されたアノテーションデータの中から以下の3種の機能を有する遺伝子を機能遺伝子選択部の選択プログラムを適用して選定し、さらに、構築された総数で14032個ある仮想の遺伝子クラスタの中から、選定された機能遺伝子を含むものを選出することにより行った。
なお、アレイのデータは、参考例1および実施例1~2で述べたものと同様、系C1~C3におけるものを二色法によって測定したものであり、産生条件と非産生条件の下で生育させた菌体からmRNAを取り出し、それぞれ色素でラベリングした後でアレイ上のオリゴDNAにハイブリダイズすることによりデータを得て、そこから各遺伝子の発現量変動比(m)を得たものである。
さらに、仮想の各遺伝子クラスタにつき一つのスコアを得るために、それぞれの遺伝子について、3つの系C1~C3から得られたm値を足し合わせて一つの値とした。続いて上記で選出した、該当する機能の注釈を持つ遺伝子を含む仮想の遺伝子クラスタのうち、膜輸送体、転写制御因子、酸化還元酵素の3つ全てを含む176個について、計算式a)にしたがって、スコア(M値)を算出した。
具体的には、上述の手順に従って選出した各仮想遺伝子クラスタ中に含まれる各機能遺伝子の系C1~C3の実験に基づく発現量変動比を記憶部から呼び出し、仮想の遺伝子クラスタ・スコアリング部のスコアリングプログラムを適用し、計算式a)にしたがい、仮想の遺伝子クラスタのスコアリングを行った。
これらは、総数14032の仮想の遺伝子クラスタの中で24、58、59位に位置していた。遺伝子1つ1つで解析した場合は3000位以下であったことを考えれば、正解率は十分に上がっているといえる。しかし、さらに含まれる遺伝子の機能により仮想の遺伝子クラスタを選択する過程を加えることにより、クラスタスコアの順位が2、5、6位と明らかに上位になることが判明した。
アスペルギルス・オリゼにおける仮想の遺伝子クラスタ・スコアリングによるコウジ酸産生に必須の遺伝子クラスタの選出条件検討
実施例3で得られた結果が、機能注釈による仮想の遺伝子クラスタの選出条件を代えることによって変化するか否かを解析し、方法の検討を行った。
実施例3においては、該遺伝子クラスタの探索対象を、コウジ酸の産生に関連すると推定される3つの要因(膜輸送体、転写制御因子、酸化還元酵素)を含む仮想遺伝子クラスタに限定することにより、産生に必須と判明している3つの遺伝子を含む仮想の遺伝子クラスタが上位に位置することを確認したが、この3つの要因を、2つに減らすことの影響を検討した。機能の注釈による仮想の遺伝子クラスタ選出およびクラスタ・スコアリングに関する手順は、実施例3と同様である。
この実験においては、上記実施例3の装置を用い、機能遺伝子選択部に対する機能遺伝子選択コマンドのみを代えて行った。
アスペルギルス・フラバスにおける仮想の遺伝子クラスタ・スコアリングによる生合成遺伝子同定
本発明の遺伝子の探索、同定方法がアスペルギルス・オリゼのコウジ酸産生に必須の遺伝子クラスタ以外にも適応可能なことを示すため、アスペルギルス・フラバスを対象として二次代謝産物を合成する遺伝子クラスタを同定した。アスペルギルス・フラバスは、二次代謝産物でありマイコトキシンの一つであるアフラトキシンを強く産生することで知られており、その産生至適温度は25℃前後である。この実験に使用した装置は、実施例1の装置と同様である。
C1: 培養開始後96時間/同18時間
C2: 培養中、育成温度28℃/同37℃
系C1、C2のそれぞれについて、実施例1と同様に計算式a)に従って、仮想の遺伝子クラスタのサイズncl=1~30でクラスタ・スコアリングを行い、各仮想の遺伝子クラスタのスコア(M値)を得た。図28右は、各仮想の遺伝子クラスタの各サイズ毎にスコアの分布状態を示したヒストグラムである。図28左のグラフはヒストグラムの一部拡大図である。これをみると分かるように、ゼロを中心とした山型の正規分布様集団から外れて高いスコア(M値)を持つ仮想の遺伝子クラスタがあると、全体を表したヒストグラムにおいて山の中心が左側にずれるが、一見して、系C2において、nclの増加とともに、山の中心が左にずれていくことが分かる。
実施例1と同様にして、計算式e)にしたがって、系C1およびC2におけるスコア分布評価値εを算出した(図29)。ここで仮想の遺伝子クラスタ数nは各々のクラスタサイズについて12955、次元数dは6を採用した。なお実施例1および2同様、ncl=1のときの値に応じて該当しない仮想の遺伝子クラスタは除外してある。図29示されるように、系C1ではε値はほぼゼロであるのに対し、系C2ではncl=18において極大かつ最大値を示す。これは、アフラトキシン産生至適温度25℃であるため、系C2における温度に関する生理状態変化条件の設定が適切であり、他方系C1の変化条件設定は適切ではなかったことを反映している。
すなわち系C2に基づく発現量変動比データを用いたクラスタ・スコアリングによって、ε値を増加させる同定対象の遺伝子クラスタが存在すること、及び、そのクラスタサイズは20前後であることが推定することができた。なおアスペルギルス・フラバスが最も強く産生する二次代謝産物の一つは前述のアフラトキシンであり、その生合成遺伝子は29の遺伝子(AFLA_139100-AFLA_139440)からなる遺伝子クラスタを形成していることが知られている(参考文献2)。ただしこの全てが同時に発現しているわけではなく、環境等によってその発現強度は変化する。本結果においてncl=20程度の大きなクラスタサイズの位置にピークが存在することは、アフラトキシンの生合成遺伝子クラスタの発現と対応していると考えられる。また本図ではε値が10の4乗のオーダーの値を示しているが、二次代謝産物の発現の弱い種であるアスペルギルス・オリゼのε値は、図15にあるように10の3乗オーダーである。これは、アスペルギルス・フラバスが同オリゼと比較して二次代謝産物を非常に強く発現する事実と一致する。
以上より、系C2の発現量変動比データを用いた仮想の遺伝子クラスタ中のスコアから、構築された仮想の遺伝子クラスタ中に、標的とする遺伝子クラスタが含まれると予測できたため、系C2のDNAマイクロアレイデータセットを用いて、以下の実験を行った。
系C2に基づく仮想の各遺伝子クラスタのスコア(M値)から、実施例1と同様にして、各仮想の遺伝子クラスタについて、計算式b)にしたがって遺伝子クラスタ判定値χを算出した。なお、この算出においては、実施例1および2同様、ncl=1のときの値に応じて該当しない仮想の遺伝子クラスタは除外してある。結果を図30に示すが、この折れ線グラフは、実施例1(C)に記載したように、各仮想の遺伝子クラスタの構築において起点とした遺伝子が共通する、遺伝子サイズ1~30の各仮想の遺伝子クラスタの判定値を結んだものである。
図30の結果から明らかなように、起点を同じくする仮想遺伝子クラスタの各折れ線グラフは、あるサイズでχ値の極大値をとっている。この起点を同じくする仮想の遺伝子クラスタの各折れ線グラフにおいて、χ値の極大値が高く、150程度を示すものは、大凡4種のサイズに分けられるが、このうち、極大値が高いピークを最も多く含むものは、サイズ(ncl)が20付近のものである。アスペルギルス・フラバスのアフラトキシン合成に関与する遺伝子クラスタは既知であり、このサイズ20付近のピークの高いもの上位10個の各仮想の遺伝子クラスタ中の遺伝子について機能注釈を参照した結果、いずれもアフラトキシン合成に関与する遺伝子を含むことが明らかとなった。この結果は上記(b)の予測結果と一致し、このχ値の算出により、アスペルギルス・フラバスにおけるアフラトキシン生合成に関与する遺伝子クラスタとその中に含まれるアフラトキシン生合成遺伝子を、ある程度特定可能であることを示す。一方、図30では他にも大きな値をとる仮想の遺伝子クラスタが複数存在するが、これは、その推定機能の注釈をみても、未知の二次代謝産物合成に関与する遺伝子クラスタである可能性が高い。
図31に示されるように、多くの仮想の遺伝子クラスタが極大値を示している。このうちυ値が200前後を示すものは、4つのサイズに分けられるが、このうち極大値が高いピークを最も多く含むものは、χ値の場合と同様にサイズが20付近ものであり、この各ピークの上位10個の仮想の遺伝子クラスタは、いずれも上述のアフラトキシン合成遺伝子を含んでいた。中には上述のアフラトキシン合成遺伝子クラスタを含むものが含まれる。すなわち本評価値υによっても、アフラトキシン生合成に関与する遺伝子クラスタ及びその中に含まれるアフラトキシン生合成遺伝子をある程度特定することができた。
以上より、本発明がDNAマイクロアレイデータからゲノム上に集合して機能を果たす生合成遺伝子を同定する有効な手段であることが示された。
Beyond aflatoxin:four distinct expression patterns and functional roles associated with Aspergillus flavus secondary metabolism gene clusters
D.RYAN GEORGIANNAら、MOLECULAR PLANT PATHOLOGY(2010)11(2),213-226
(参考文献2)
Genetic regulation of aflatoxin biosynthesis:from gene to genome
D.RYAN GEORGIANNAら、Fungal Genetics and Biology(2009)46(2),113-125
アスペルギルス・ニガーにおける遺伝子クラスタ・スコアリングによる生合成遺伝子推定
本発明の同定手法に従って、アスペルギルス・ニガーの二次代謝産物を合成する遺伝子クラスタを推定した。この実験の使用装置は、実施例1の装置と同様である。
DNAマイクロアレイのデータは、遺伝子発現解析データの公共データベースであるNCBBIのGEO(http://www.ncbi.nlm.nih.gov/geo/)より、GSE17329のIDで登録されたものの一部を用いた。すなわち、このデータを、遺伝子発現量データ入力部を通じて記憶部にゲノム遺伝子発現量データとして保存した。このアレイデータは実施例1~4で用いたアスペルギルス・オリゼのものとは異なり、一色法で測定されている。そこで、ゲノム遺伝子発現量変動比m値を得るため、遺伝子発現量変動比算出部において、以下のように生理状態が変化する条件として以下の条件を設定し、前者を分子に後者を分母にした値をm値として算出した。検討した系は以下の2つである。なお、これらの系は、炭素源欠乏条件下で何らかの二次代謝関連遺伝子クラスタが関与していることを期待したもので、例えば上記したコウジ酸あるいはアフラトキシン産生等の特定の機能を標的としたものではない。
C2:培養中、炭素源枯渇後24時間/炭素源枯渇前3.5時間
以下、上記2つの生理状態が変化する条件をそれぞれ系C1、C2とする。なお、発現量変動比は、2つの系それぞれにおいて14509個の遺伝子について算出した。
系C1~2のそれぞれについて、実施例1と同様に計算式a)に従ってncl=1~30でクラスタ・スコアリングを行い、各仮想遺伝子クラスタのM値を得た。図33右は、各仮想の遺伝子クラスタの各サイズ毎にスコアの分布状態を示したヒストグラムである。図33左のグラフはヒストグラムの一部拡大図である。図33左の拡大図をみると分かるように、ゼロ付近を中心とした山型の正規分布様集団から外れて高いM値を持つ仮想遺伝子クラスタがあると、全体を表したヒストグラムにおいて山の中心が左側にずれるが、系C2において、ncl=5付近で山の中心が左にずれていることが分かる。
実施例1、2、5と同様にして、計算式e)にしたがって、系C1~2におけるスコア分布評価値εを算出した(図34)。ここで仮想の遺伝子クラスタ数nは14509、次元数dは6を採用した。図34に示されるように、系C1はncl=8、系C2はncl=5においてそれぞれ極大値を示している。したがって二つの系においてともに、クラスタ・スコアリングによる平均化の方向に反して値を増加させる仮想の遺伝子クラスタが存在することを意味する。すなわちこの二つの系(C1、C2)における発現量変動比データを用いた、仮想の遺伝子クラスタのスコアリングによって、ε値を増大させる遺伝子クラスタが存在すること、及びその遺伝子クラスタのサイズが8前後あるいは5前後と推定された。ただし、この実験においては、上記したように、生理状態変化状件として炭素源欠乏条件を設定したものであり、該条件は特定の遺伝子クラスタを標的としたものではないので、極めて多数の遺伝子クラスタが関与していることが予想され、ε値によるサイズの予想は確定的なものではない。
この点をふまえ、さらに以下の実験を行った。
系C1およびC2のそれぞれについて、系C1およびC2のDNAマイクロアレイデータから、実施例1と同様に計算式b)にしたがって、各仮想遺伝子クラスタについて遺伝子クラスタ判定値χ算出した(図35(a);C1、同(b);C2)。なお実施例1、2、5と同様に、ncl=1のときの値に応じて該当しない仮想の遺伝子クラスタは除外してある。
図35の結果から明らかなように、系C1、C2の双方において、多くの仮想遺伝子クラスタが極大値を示している。これより、アスペルギルス・ニガーには、系C2、C3の生理状態変化条件で変動する遺伝子クラスタが存在すると考えられ、これは既存の事実と一致する(参考文献3)。
次に、系C1およびC2の各仮想遺伝子クラスタについて、実施例1と同様にして遺伝子クラスタ評価値υを計算式c)にしたがって算出した(図36(a);C1、同(b);C2)。ここで次元数d’は2、係数aは1を採用した。ここでも実施例1、2、5と同様に、ncl=1のときの値に応じて該当しない仮想の遺伝子クラスタは除外してある。図36の結果に示されるように、系C1およびC2の双方において、複数の仮想の遺伝子クラスタが極大値を示す。ただしυ値の上位と下位の差はχ値(図35)に比べて増大しており、本実験においてはυ値の方が、少数の仮想の遺伝子クラスタを抽出するためにはより有利である。例えば、系C1においてυ値が100以上のものとした場合、該当する仮想遺伝子クラスタは1つのみである。系C2の場合、υ値が60以上の仮想遺伝子クラスタは3つのみである。
(参考文献3)
Review of secondary metabolites and mycotoxins from the Aspergillus niger group
K.FOG NIELSENら、Analytical and Bioanalytical Chemistry(2009)395(5),1225-1242
アノテーション(機能注釈)に基づき選定された遺伝子を一以上含むことを条件として、仮想の遺伝子クラスタを構築した場合における、コウジ酸合成遺伝子の探索
アスペルギルス・オリゼのコウジ酸産生関連遺伝子からなる遺伝子クラスタを同定することを目的として、予測される機能に関連した注釈のついた遺伝子を選定したのち、該遺伝子を1以上含むように仮想の遺伝子クラスタを構築し、構築された各仮想の遺伝子クラスタをスコアリングして、該当遺伝子の同定を行った。
この実験に使用した手法は、実施例1と基本的には同様であるが、実施例1においては、仮想の遺伝子クラスタの構築をする際、仮想の遺伝子クラスタのサイズを1~30と設定し、ゲノム遺伝子の配列順に全ての遺伝子が含まれるように仮想の遺伝子クラスタを構築したが、本実施例においては、ゲノム位置情報(配列情報)中に、アノテーション付与に基づき選定された機能遺伝子が出現したとき、その機能遺伝子を起点とする仮想の遺伝子クラスタを構築するように変更した点、構築された仮想の遺伝子クラスタのスコアリングにおいて、選定された機能遺伝子以外の遺伝子についての発現量変動比(m値)は無視し、選定された遺伝子の発現量変動比のみを用いるように変更した点で異なる。なお、遺伝子サイズについては、実施例1と同様にゲノムの遺伝子配列順に1~30個と設定した。
具体的には、この実験に使用した装置は、実施例1に記載した装置と基本的に同様であるが、仮想の遺伝子クラスタ構築プログラムにおいて、ゲノム位置情報(配列情報)中に、アノテーション付与に基づく遺伝子選定部において選定された機能遺伝子が出現したとき、その機能遺伝子を起点とする仮想の遺伝子クラスタを構築するように変更した点、構築された仮想の遺伝子クラスタのスコアリングにおいて、選定された機能遺伝子以外の遺伝子についての発現量変動比(m値)は無視し、選定された遺伝子の発現量変動比のみを用いるように変更した点で異なる。なお、遺伝子サイズについては、実施例1と同様にゲノムの遺伝子配列順に1~30個と設定した。
なお、本実施例では、実施例1のデータ判定結果において該当遺伝子クラスターが含まれていると予測された、系C2(7日目/4日目)のアレイデータのみを用いて実験を行った。また、実施例2と同様、コウジ酸産生に必要な機能として以下の3つの機能を選出した。
・膜輸送体:transporterまたはmajor facilitator
・転写制御因子:transcription
・酸化還元酵素:oxidoreductaseまたはdehydrogenase
キーワードである。
一般に利用されているアノテーション推定プログラムの一つであるInterproscan(http://www.ebi.ac.uk/Tools/InterProScan/)を用いて、アスペルギルス・オリゼのゲノムDNA上の各遺伝子についてアノテーションを付与し、上記3種の機能を有する遺伝子を選定した。具体的には、各遺伝子についてのアノテーションデータを本装置の入力装置に入力し、記憶装置に記憶した。記憶したアノテーションデータのデータを呼び出し、上記3種の機能を有する遺伝子を機能遺伝子選択部の選択プログラムを適用して選定した。なお、選定は各遺伝子について付与されたアノテーション中に上記3つの機能群に対応するキーワードが含まれるかどうかで行い、その結果、選定された遺伝子は、系C2において有効に遺伝子発現データを取得できた5595個の遺伝子のうち、796個であった。
なお、本実施例では、構築された仮想の遺伝子クラスタに1つの遺伝子のみしか含まれない場合が含まれ、また、本実施例においては、実施例1~4と同様に、ゲノム上の末端側に位置する遺伝子については、組み合わせうる最大個数の遺伝子で仮想の遺伝子クラスタを構築したが、クラスタ・スコアリングの性質上、これらによる遺伝子クラスタの探索についての影響はない。このようにして構築された仮想の遺伝子クラスタは、各クラスタサイズについてそれぞれ796個である。
つづいて、構築した各々の仮想の遺伝子クラスタについて、計算式a)にしたがって、ncl=1~30でクラスタ・スコアリングを行って各仮想の遺伝子クラスタのスコア(M値)を得た。
算出した各仮想の遺伝子クラスタのスコア(M値)に基づいて、計算式b)にしたがって、各仮想の遺伝子クラスタについての判定値χを算出した。具体的には、記憶されている各仮想の遺伝子クラスタのスコアを呼び出し、仮想の遺伝子クラスタの乖離度算出部に格納された仮想の遺伝子乖離度判定プログラムのうちχ値算出プログラムを適用し、計算式b)にしたがって、各仮想の遺伝子クラスタについての判定値χを算出した。図38は、各仮想の遺伝子クラスタについて、起点遺伝子を同じくする仮想の遺伝子クラスタの判定値χを、横軸をクラスタサイズとして結んで描いたものである。ここで、クラスタ・スコアリングによって絶対値を増加させない仮想の遺伝子クラスタは該遺伝子クラスタではないため、ncl=1のときの絶対値がncl=2のときの絶対値より大きい仮想の遺伝子クラスタは除外している。
図をみると、多くの仮想の遺伝子クラスタの判定値χがゼロ付近に位置するのに対し、起点を同じくする仮想の遺伝子クラスタの3組が、大きな値を取っていることが分かる。その中で最大のものは、ncl=4のときに極大かつ最大値を取っている。これは、コウジ酸産生に必須の3つの遺伝子、AO090113000136、AO090113000137、AO090113000138に加えて、その隣に位置し、本実施例において遺伝子選定の対象であるアノテーションとして”major facilitator”(膜輸送体)を持つAO090113000139を含むものである。すなわち、本実施例では、選定対象のアノテーションがついた遺伝子の発現量変動比のみを用いて仮想の遺伝子クラスタのスコアリングを行っているため、スコアリングの対象となる要素が極度にそぎ落とされており、その結果、該当遺伝子クラスタの近傍にアノテーションによって選定された遺伝子がある場合、それを含んだ遺伝子クラスタが高い値をとりうる。しかし、この最大値を示す仮想の遺伝子クラスタが、コウジ酸の産生に必須の3つの遺伝子を含むことから、本手法は遺伝子クラスタの探索手法として有効である。実際、図38において最大値を示す起点遺伝子を同じくする仮想の遺伝子クラスタの組において、コウジ酸産生に必須の3つの遺伝子のみからなるncl=3のものと、隣接したAO090113000139を含むncl=4のものは、値がそれほど大きく変わらない。
なお、その他にゼロから外れて大きな値を示す2組の仮想の遺伝子クラスタが存在するが、これらはコウジ酸産生に必須の3つの遺伝子のうち、AO090113000136を含まないものである。
判定値χのときと同様、ncl=4のとき極大かつ最大値をとる仮想の遺伝子クラスタが一つあり、これがコウジ酸産生に必須の3つの遺伝子に加えてもう一つの遺伝子AO090113000139を含む遺伝子クラスタである。図17と比較すると分かるように、アノテーションによる遺伝子の選定によって候補となる仮想の遺伝子クラスタの数が大きく減り、該当遺伝子クラスタが存在する場合、他のゼロ付近の値を持つものとの差がより明確になる。
図41は、上記遺伝子クラスタ評価値を、横軸を遺伝子クラスタ番号として、各クラスタサイズについてプロットしたものである。クラスタサイズに対応した各図は、縦軸のスケールを合わせてある。この図でncl=4のときに最大値をとり、いずれのクラスタサイズにおいても突出して高い値を示しているのが、コウジ酸産生に必須の3つの遺伝子の3つあるいは2つを含む遺伝子クラスタである。このように本手法によって、本実施例の予測の対象であるコウジ酸産生遺伝子クラスタは鋭敏に検出されていることが分かる。
以上の実験結果により、アノテーションにより選定されたる遺伝子を含む仮想の遺伝子クラスタ構築し、該選定された遺伝子の発現量変動比を用いてクラスタ・スコアリングを行うことで、高感度に、目的とする遺伝子クラスタ及びその中に含まれる遺伝子を探索できることが示された。また、この実験結果からいえば、アノテーションにより選定された1以上の遺伝子を組み合わせて仮想の遺伝子クラスタを構築し、スコアリングしても同様な結果が得られることは明らかである。
本手法は強いフィルタリング操作を伴うものであり、該当するアノテーションを持つ遺伝子のm値を過度に反映する場合もある。しかし逆に、遺伝子間の発現変動比が比較的小さい場合などには、目的の遺伝子クラスタを鋭敏に予測できる手法である。
フザリウム・バーティシリオイデスにおける遺伝子クラスタ・スコアリングによる二次代謝産物生合成遺伝子の予測と検証
本発明の同定手法に従って、菌類であるフザリウム属の一種、フザリウム・バーティシリオイデスの二次代謝産物を合成する遺伝子クラスタを予測した。フザリウム属は、実施例1~6で用いた真菌類アスペルギルス属とは、進化系統樹的に遠い菌類である(参考文献4)。またフモニシンを始めとするマイコトキシンを産生することで知られており、その他多くの二次代謝産物生合成遺伝子クラスタを有すると考えられる(参考文献5)。
DNAマイクロアレイのデータは、米国国立生物工学情報センター(NCBI)が提供する遺伝子発現解析データの公共データベースGEO(http://www.ncbi.nlm.nih.gov/geo/)より、GSE16900のIDで登録されたものの一部を用いた。このアレイデータは、フモニシン産生培地における培養時間が24,48,72,96時間である培養条件のそれぞれについて、一色法にて遺伝子の発現量を測定したものである。そこで、発現量変動比m値を得るため、以下のように二次代謝産物をより多く産生すると考えられる条件とそうでない条件を比較し、前者を分子に後者を分母にした値をm値として算出した。検討した系は2つである。
C2:培養時間96時間/同48時間
以降これらの系をそれぞれC1,C2とする。本発現情報には、遺伝子クラスタを構成するのに用いられる遺伝子が12230個含まれている。また、元のアレイデータでは各培養時間について3つのデータがとられているため、各遺伝子について3つのデータ間で発現量を平均化した後、以下の手順に進んだ。
系C1,C2のそれぞれについて、計算式a)に従ってncl=1~30でクラスタ・スコアリングを行い、各仮想遺伝子クラスタのM値を得た。図42はそのヒストグラムである。左の拡大図をみると分かるように、ゼロを中心とした山型の正規分布様集団から外れて高いM値を持つ仮想遺伝子クラスタがあると、各nclにおけるM値のヒストグラムにおいて、山の中心が左側にずれる。図右側の各nclにおけるヒストグラムを上から見ていくと、nclの増加とともに山の中心が左にずれていくことが分かる。なおクラスタ・スコアリングを行う際に必要となるゲノム上の遺伝子の連続情報は、アメリカ合衆国の研究機関であるBroad Instituteがウェブ上で公開しているデータベース“Fusarium Comparative Sequencing Project, Broad Institute of Harvard and MIT (http://www.broadinstitute.org/)”中の、fusarium_verticillioides_3_genome_summary_per_gene.txtを用いた。
計算式e)にしたがって、系C1,C2におけるスコア分布評価値eを算出した(図43)。ここで、仮想の遺伝子クラスタ数nは各nclにおいて12230であり、次元数dは6を採用した。図にあるように、系C1はncl=14、系C2はncl=5において極大値を示す。これは、二つの系においてともに、クラスタ・スコアリングによる平均化の方向に反して値を増加させる仮想の遺伝子クラスタが存在することを意味する。すなわちこの二つの系(C1、C2)において、クラスタ・スコアリングによって値を増加させる、本提案の同定対象に該当する遺伝子クラスタが存在すると判定できる。
以上より、系C1、C2双方の遺伝子発現情報を用いて、以下の同定過程へ進む。
系C1およびC2のDNAマイクロアレイデータから、各仮想遺伝子クラスタについて、計算式b)にしたがって遺伝子クラスタ判定値cを算出した(図44)。ここで、遺伝子クラスタを検出するという目的に鑑み、ncl=1のときの絶対値がncl=2のときのものより大きな仮想の遺伝子クラスタについては除外してある。すると図にあるように、系C1、C2の双方において、ncl=1以外で複数の仮想遺伝子クラスタが極大値、極小値を示している。これより、フザリウム・バーティシリオイデスには、複数の二次代謝関連遺伝子クラスタが存在すると考えられる。これは既存の事実と一致する(参考文献5)。
次に、系C1およびC2の各仮想遺伝子クラスタについて、遺伝子クラスタ評価値uを計算式c)にしたがって算出した(図45)。ここで次元数d’は2、係数aは1を採用した。ここでcと同様、ncl=1のときの値がncl=2のときのものより大きな仮想の遺伝子クラスタについては除外してある。すると図のように、系C1およびC2の双方において、複数の仮想の遺伝子クラスタが極大値を示す。ただし極大値におけるu値の上位と下位の差はc値(図44)に比べて増大しており、u値によって上位の少数の仮想の遺伝子クラスタを抽出することはc値よりさらに容易である。例えば系C1においてu値が100以上のものとした場合、該当する仮想遺伝子クラスタは1つのみである。系C2の場合、u値が150以上の仮想遺伝子クラスタは3つのみである。このように、評価値uを用いることで、該当遺伝子クラスタを高く評価することが出来ると考えられる。
系C2においても複数の顕著なピークがみられるが(図46)、なかでもFVEG_03696を起点とするクラスタサイズ4の仮想の遺伝子クラスタが、値10000を超える最大の正のピークを示している。このピークは、培養開始72時間後を24時間後と比較した系C1では見られなかったもので、培養開始96時間後に初めて発現してくる遺伝子クラスタの存在を示唆している。また系C2では、FVEG_08709を起点とするクラスタサイズ4の仮想の遺伝子クラスタが、大きな負の値をとっている。これは、系C1においては正の値を示していたものと、起点は一つずつずれているものの同等であり、培養開始72時間後には発現していたものが、96時間後には発現を止めた遺伝子クラスタであると推測される。このように、本手法を用いる際に、比較する系を目的に応じて選ぶことで、一つの生物種であっても異なる遺伝子クラスタを検出することが可能である。これらの該当遺伝子クラスタ候補の機能については、blast検索の結果をみても判然としないが(表4)、仮想の遺伝子クラスタCに含まれるFVEG_12523は二次代謝物質生合成遺伝子の一つであるpolyketide synthaseと高い配列相同性を示しており、これまでに知られていない新規な二次代謝物質生合成遺伝子が検出されたと期待される。
以上より本提案方法が、アスペルギルス属からは進化系統樹的に遠い菌類であるフザリウム・バーティシリオイデスにおいても、アスペルギルス属のものと同様、全遺伝子の発現情報からゲノム上に集合して機能を果たす生合成遺伝子を同定する実効的な手段であることが示された。
Evolution of the Fot1 transposons in the genus Fusarium: discontinuous distribution and epigenetic inactivation
M.-J. Daboussiら、Molecular Biology and Evolution (2002) 19 (4), 510-520
(参考文献5)
Biochemistry and genetics of Fusarium toxins
A. E. Desjardinsら、Fusarium: Paul E. Nelson Symposium, APS Press (1999)
(参考文献6)
Linkage among genes responsible for fumonisin biosynthesis in Gibberella fujikuroi mating population A
Desjardinsら、Applied and Environmental Microbiology (1996) 62, 2571-2576
(参考文献7)
A polyketide synthase gene required for biosynthesis of fumonisin mycotoxins in Gibberella fujikuroi mating population A
R. H. Proctorら、Fungal Genetics and Biology (1999) 27, 100-112
(参考文献8)
Co-expression of 15 contiguous genes delineates a fumonisin biosynthetic gene cluster in Gibberella moniliformis
R. H. Proctorら、Fungal Genetics and Biology (2003) 38, 237-249
(参考文献9)
Characterization of four clustered and coregulated genes associated with Fumonisin biosynthesis in Fusarium verticillioides
J.-A. Seoら、Fungal Genetics and Biology (2001) 34, 155-165

大腸菌における遺伝子クラスタ・スコアリングによるラクトースオペロンの検出と検証
本発明の同定手法に従って、大腸菌のラクトースオペロンを検出した。大腸菌は原核生物であり、実施例1~8までで本発明手法の検証に用いた真核生物とは生物の分類上大きく異なる。
大腸菌はオペロンの存在が実証された最初の生物である。オペロンとは、ゲノム上に集合して機能を果たす一つの制御単位であり、複数の遺伝子がゲノム上にまとまって存在し高発現して機能するという性質上、本発明の同定対象に該当する。
ここで、本実施例で実証するラクトースオペロンについて説明する。ラクトースオペロンは、リプレッサータンパク質をコードするlacIに続いて、プロモーター配列lacP、オペレーター配列lacO、そしてラクトースを代謝する3つの遺伝子lacZ,lacY,lacA(lacZYA)から構成される。lacIは常時発現しており、lacO領域と強く結合するため、通常はその下流lacZYAは翻訳されない。ところが、lacIに翻訳されるリプレッサータンパク質は、ラクトースが異性化したような誘導物質が存在すると、高次構造を変化させて、lacO領域から遊離する。これによってラクトース代謝系であるlacZYAが翻訳され、ラクトースの代謝が可能となる(参考文献10)。
17の各測定段階における系のそれぞれについて、計算式a)に従ってncl=1~30でクラスタ・スコアリングを行い、各仮想遺伝子クラスタのM値を得た。なおクラスタ・スコアリングを行う際に必要となるゲノム上の遺伝子の連続情報は、公共の学術データベースであるNCBIに登録されている、大腸菌MG1655株のゲノム情報(ID:NC_000913;http://www.ncbi.nlm.nih.gov/nuccore/NC_000913)を用いた。ここで大腸菌は環状ゲノムであるため、起点を上記ゲノム情報の中でb0001と名付けられた遺伝子とし、全ての遺伝子は連続しているものとして扱った。また、ラクトースオペロンを構成するlacI,lacZ,lacY,lacAの4つの遺伝子は、本ゲノム情報では向きが逆になっており、lacA,lacY,lacZ,lacIの順に並んでいる。これらの遺伝子IDはそれぞれ、b0342,b0343,b0344,b0345である。図47は、各仮想の遺伝子クラスタのM値のヒストグラムの一部である。左の拡大図をみると分かるように、ゼロを中心とした山型の正規分布様集団から外れて高いM値を持つ仮想遺伝子クラスタがあると、各nclにおけるM値のヒストグラムにおいて、山の中心が左側にずれる。図右側の各nclにおけるヒストグラムを上から見ていくと、nclの増加とともに山の中心が左または右にずれていくことが分かる。これは、正規分布から外れて高い(低い)値を持つ仮想の遺伝子クラスタの存在を示している。
計算式e)にしたがって、17つの各系におけるスコア分布評価値eを算出した(図48)。ここで、仮想の遺伝子クラスタ数nは各nclにおいて4102であり、次元数dは6を採用した。図にあるように、e値は、培養開始後878,888,898分後、および1049,1070,1089分後の6つの系において、大きな極大値を示す。ここでこの結果を、大腸菌の成長速度と照らし合わせる。図49は、本アレイデータに関する文献(参考文献11)に記載されている、培養開始後の大腸菌の増殖を表す濁度の時系列変化である。前培養をどこからとるかでアレイデータとの時間のラベルがずれているが、図49での開始点が、アレイデータの780分にあたり、以降の各点がアレイデータの各17段階に順次相当する。すると、図をみると分かるように、スコア分布評価値eが大きな極大値を示す878,888,898分後(7,8,9点目)および1049,1070,1089分後(15,16,17点目)のデータはすべて、図49において濁度の上昇が留まっている箇所、すなわち増殖の停滞期にあたる。このうち最初の停滞期は、グルコースを全て消費して栄養源をラクトースに切り替えようとしている段階である。この段階では増殖を一時停止するため、ゲノム上でまとまって存在する増殖に必須のリボソーム遺伝子群が強く抑制される一方、ラクトースを消費するためにラクトースオペロンを発現する。したがって、この段階でe値が大きな極大値を示していることは、リボソーム遺伝子群の抑制およびラクトースオペロンの発現という現象と一致する。二つ目の停滞期はラクトースも枯渇した段階であり、成長そのものが停滞するために、ここでも増殖に必須のリボソーム遺伝子が強く抑制される(参考文献13)。この段階でのe値の大きな極大値は、このリボソーム遺伝子の抑制を検出していると考えられる。
以上より、e値によって、ゲノム上でまとまって発現(または抑制)して機能する遺伝子群の存在を感度よく判定できることが示された。本実施例では、すでに同定されているラクトースオペロンを本手法によって検出できることを示すことが目的であるため、引き続き17段階すべてのデータを用いて以下の手順に進む。
大腸菌MG1655株の培養開始後17段階におけるDNAマイクロアレイデータから、各仮想遺伝子クラスタについて、計算式b)にしたがって遺伝子クラスタ判定値cを算出した(図50)。図において、一つの仮想の遺伝子クラスタにつき一本の線がグレーで描かれており、このうち黒の太線で描かれた線が、ラクトースオペロンを構成する4つの遺伝子のゲノム情報上の最初の遺伝子lacA(b0342)を起点とする遺伝子クラスタである。この遺伝子クラスタは、869分の系から徐々に上昇を始め、908,919分の系で、極大値を示す仮想の遺伝子クラスタの中で最大値を示している。極大値を示す点はクラスタサイズ3のときであり、lacZYAからなるものである。一方この遺伝子クラスタにlacIは含まれないが、これは、lacIがラクトースオペロンの発現に関係なく常時発現しているという事実と一致する。
次に同様に、17の各系における各仮想遺伝子クラスタについて、遺伝子クラスタ評価値uを計算式c)にしたがって算出した(図51)。ここで次元数d’は2、係数aは1を採用した。すると図のように、c値のときと同様、黒い太線で示したlacA(b0342)から始まる遺伝子クラスタは、869分の系から徐々に値の上昇を始め、908,919分の系で、全ての仮想の遺伝子クラスタの中で最大の極大値をクラスタサイズ3で示す。これは、グルコースが枯渇してラクトース代謝系が動き出すときに、ラクトース代謝遺伝子群lacZYAが発現するという事実と一致する。またこの段階において、黒の太線とその他のグレーで示した線の差は、図50におけるよりも拡大しており、評価値uを用いることで、該当遺伝子クラスタをc値よりもさらに高く評価することが出来ることが示された。
以上より本提案方法が、真核生物だけでなく原核生物においても、ゲノム上に集合して機能を果たす遺伝子群を検出する実効的な手段であることが示された。
The lactose repressor system: paradigms for regulation, allosteric behavior and protein folding
C. J. Wilsonら、Cellular and Molecular Life Sciences (2007) 64, 3-16
(参考文献11)
Gene expression profiling of Escherichia coli growth transitions: an expanded stringent response model
Dong-Eun Changら、Molecular Microbiology (2002) 45 (2), 289-306
(参考文献12)
Guanosine 3’,5’-bispyrophosphate coordinates global gene expression during glucose-lactose diauxie in Escherichia coli
Matthew F. Traxlerら、Proceedings of the National Academy of Sciences (2006) 103 (7), 2374-2379
(参考文献13)
Control of protein synthesis in Escherichia coli. II. Translation and degradation of lactose operon messenger ribonucleic acid after energy source shift-down
K. C. Westoverら、Journal of Biological Chemistry (1974) 249 (19), 6280-6287
Claims (51)
- 生物ゲノム中の標的遺伝子を含む遺伝子クラスタ及び/または該遺伝子クラスタ中の標的遺伝子を探索する方法であって、生物細胞の生理状態変化を生じる条件とコントロール条件下において生じたゲノム遺伝子の発現量変動比を、ゲノムDNA上に配列する複数の遺伝子により構成される仮想の遺伝子クラスタ単位の発現量変動比として合算することにより、仮想の遺伝子クラスタ単位毎にスコアリングし、得られたスコアに基づき、上記生理状態変化の原因遺伝子である標的遺伝子を含む遺伝子クラスタ及び/または該遺伝子クラスタ中の標的遺伝子を探索する方法。
- 生物細胞の生理状態変化を生じる条件とコントロール条件下とを一の対比条件セットとして、該対比条件セットが一種以上設定されていることを特徴とする請求項1に記載の方法。
- 生理状態変化を生じる条件とコントロール条件が、少なくとも代謝産物の産生誘導条件下と非誘導条件下あるいは代謝産物の産生抑制条件下と非抑制条件下との対比条件セットを含むことを特徴とする請求項1または2に記載の方法。
- 代謝物産生に関与する遺伝子が2次代謝物産生に関与する遺伝子であることを特徴とする請求項3に記載の方法。
- 仮想の各遺伝子クラスタは、ゲノムDNA上に連続する遺伝子を2個から遺伝子数を一つずつ増やして、想定される遺伝子クラスタに含まれる最大限のゲノム遺伝子数になるまで抽出し、かつ該抽出において、抽出する遺伝子の各個数毎に、直鎖状DNAからなるゲノムの場合には該DNAのいずれかの末端から、環状DNAからなるゲノムの場合には任意の遺伝子を起点として順にゲノムDNA上に配列する遺伝子を一つずつずらしながら抽出された各遺伝子群からなることを特徴とする、上記請求項1~4のいずれかに記載の方法。
- スコアリングされる仮想の各遺伝子クラスタの集合体が、ゲノムDNA上に連続する遺伝子を2個から遺伝子数を一つずつ増やし想定される遺伝子クラスタに含まれる最大限のゲノム遺伝子数になるまで抽出し、かつ該抽出において、抽出する遺伝子の各個数毎に、直鎖状DNAからなるゲノムの場合には該DNAのいずれかの末端から、環状DNAからなるゲノムの場合には任意の遺伝子を起点として順にゲノムDNA上に配列する遺伝子を一つずつずらしながら抽出された各遺伝子群からなる仮想の各遺伝子クラスタの集合からなり、ゲノム上に存在する遺伝子クラスタの全てが仮想の遺伝子クラスタの集合体中に含まれるように構成されていることを特徴とする請求項1~5のいずれかに記載の方法。
- 仮想の各遺伝子クラスタのスコアリングが以下の計算式a)によりなされることを特徴とする、請求項1~6のいずれかに記載の方法。
計算式a)

- ゲノムDNA上に配列する遺伝子が、標的とする遺伝子機能を有すると推定される場合、あるいは標的とする遺伝子機能を有する可能性が低いか若しくはその可能性がないと推定される場合において、当該ゲノムDNA上に配列する遺伝子については、以下の重み付け計算が適用されることを特徴とする、請求項7の方法。

- ゲノムDNA上に配列する遺伝子が、標的とする遺伝子機能を有すると推定される場合において、標的とする遺伝子機能を有すると推定された遺伝子を含む仮想の遺伝子クラスタを選出し、選出された仮想の遺伝子クラスタについて、スコアリングすることを特徴とする、請求項7に記載の方法。
- 仮想の遺伝子クラスタが、ゲノムにおいて近傍に存在することを条件として、以下の1)~3)の内の1以上の遺伝子のみから、あるいは該遺伝子を少なくとも含む1以上の遺伝子から構築されることを特徴とする、上記(4)に記載の方法。
1)2次代謝物産生に関与していると想定される酵素種に属する酵素遺伝子。
2)トランスポーター遺伝子
3)転写因子をコードする遺伝子 - 仮想の各遺伝子クラスタのスコアリングが以下の計算式a)によりなされることを特徴とする、上記(10)に記載の方法。
計算式a)

- 仮想の遺伝子クラスタ全体のスコアの分布から乖離して存在するスコアを有する仮想の遺伝子クラスタを、標的の遺伝子クラスタ候補として選定することを特徴とする、請求項1~11のいずれかに記載の方法。
- 仮想の遺伝子クラスタ全体のスコアの分布からの乖離の程度を示す判定値I(χ)を、以下の計算式b)により算出し、算出された該判定値I(χ)に基づき仮想の遺伝子クラスタを標的の遺伝子クラスタ候補として選定することを特徴とする、請求項12に記載の方法。
計算式b)

- 仮想の遺伝子クラスタ全体のスコアの分布からの乖離の程度を示す判定値II(υ)を、以下の計算式c)により算出し、算出された判定値II(υ)に基づき仮想の遺伝子クラスタを、標的の遺伝子クラスタ候補として選定することを特徴とする、請求項12に記載の方法。
計算式c)

- さらに、以下の計算式d)の算出結果に基づき、bが100未満の仮想のクラスタを少なくとも除外し、標的の遺伝子クラスタ候補をさらに絞り込むことを特徴とする、請求項13または14に記載の方法。
計算式d)

- 生物細胞の生理状態変化を生じる条件とコントロール条件下において生じたゲノムDNA上に配列する各遺伝子の発現量変動比を、ゲノムDNA上に配列する複数遺伝子により構成される仮想の遺伝子クラスタ単位の発現量変動比として合算することにより、仮想の遺伝子クラスタ単位毎にスコアリングし、得られたスコアに基づき、標的とする遺伝子クラスタがゲノム中に存在するか否かあるいは、標的遺伝子クラスタが存在する場合の遺伝子サイズを予測する方法であって、
ゲノムDNA上に連続する遺伝子を2個から遺伝子数を一つずつ増やし想定される遺伝子クラスタに含まれる最大限のゲノム遺伝子数になるまで抽出し、かつ該抽出において抽出する遺伝子の各個数毎に、直鎖状DNAからなるゲノムの場合には該DNAのいずれかの末端から、あるいは環状DNAからなるゲノムの場合には任意の遺伝子を起点として順にゲノムDNA上に配列する遺伝子を一つずつずらしながら抽出された各遺伝子群から構成された仮想の各遺伝子クラスタを、以下の計算式a)によりスコアリングし、この得られた仮想の各遺伝子クラスタのスコアを各遺伝子クラスタに含まれる遺伝子数毎に分け、以下の計算式e)により、各遺伝子数単位毎に遺伝子クラスタスコア分布判定値(ε)を求め、該判定値に基づき、予め、標的とする遺伝子クラスタがゲノム中に存在するか否かあるいは、標的クラスタが存在する場合のその遺伝子サイズを予測することを特徴とする、上記方法。
計算式a)


- 遺伝子数がk個のときのε値(ε(k))と、その前後数のときのε値(ε(k-1)、ε(k+1))が、以下の関係にあるとき、標的とする遺伝子クラスタがゲノム中に存在すると判定し、標的遺伝子クラスタに含まれる遺伝子数をk個と予想することを特徴とする、請求項16に記載の方法。

- 生物ゲノム中の標的遺伝子を含む遺伝子クラスタ及び/または該遺伝子クラスタ中の標的遺伝子を探索する装置であって、a)生物細胞の生理状態変化を生じる条件とコントロール条件下におけるゲノムDNA上に配列する各遺伝子の発現量データに基づき算出された上記2つの条件下における上記各遺伝子の発現量変動比を記憶する手段、b)ゲノムDNA上に配列する複数の遺伝子を組み合わせて仮想の遺伝子クラスタを構築する手段、c)該算出され、記憶されたゲノムDNA上に配列する各遺伝子の発現量変動比を複数の遺伝子により構築された上記仮想の遺伝子クラスタ単位の発現量変動比として合算し、仮想の遺伝子クラスタ単位毎にスコアリングし、仮想の各遺伝子クラスタのスコアを記憶する手段、及びd)得られたスコアに基づき上記生理状態変化の原因遺伝子である標的遺伝子を含む遺伝子クラスタを選定する手段を有するか、あるいはさらにe)選定された遺伝子クラスタ中に含まれる遺伝子を表示する手段を有することを特徴とする、上記装置。
- 発現量データが、遺伝子発現量測定用DNAマイクロアレイによる蛍光強度情報であることを特徴とする請求項18に記載の装置。
- 蛍光強度情報が、蛍光強度を読み取り、数値化する手段を有する蛍光強度読み取り装置により出力される数値データであることを特徴とする、請求項19に記載の装置。
- 生物細胞の生理状態変化を生じる条件とコントロール条件とを1の対比条件セットとして1以上設定されている場合において、各対比条件セットに含まれる条件毎に各遺伝子の発現量データが入力され、各対比条件セットにおける同一遺伝子の発現量変動比が算出されることを特徴とする、請求項18~20のいずれかに記載の装置。
- 標的遺伝子が代謝物産生に関与する遺伝子であることを特徴とする、請求項18~21のいずれかに記載の装置。
- 代謝物産生に関与する遺伝子が2次代謝物産生に関与する遺伝子であることを特徴とする、請求項22に記載の装置。
- 設定される対比条件セットが、少なくとも代謝産物の産生誘導条件下と非誘導条件下あるいは代謝産物の産生抑制条件下と非抑制条件下との対比条件セットを含むことを特徴とする請求項22に記載の装置。
- 代謝産物が2次代謝産物であることを特徴とする、請求項24に記載の装置。
- 仮想の各遺伝子クラスタの構築手段が、ゲノムDNA上に連続する遺伝子を2個から遺伝子数を1ずつ増やして、想定される遺伝子クラスタに含まれる最大限のゲノム遺伝子数になるまで抽出し、かつ該抽出において、抽出する遺伝子の各個数毎に、直鎖状DNAからなるゲノムの場合には該DNAのいずれかの末端から、環状DNAからなるゲノムの場合には任意の遺伝子を起点として順にゲノムDNA上に配列する遺伝子を一つずつずらしながら抽出した各遺伝子群により構築する手段であることを特徴とする、請求項18~25のいずれかに記載の装置。
- 仮想の各遺伝子クラスタのスコアリングが以下の計算式a)によりなされることを特徴とする、請求項18~26のいずれかに記載の装置。
計算式a)

- ゲノムDNA上に配列する各遺伝子中の特定の遺伝子を選定するためのアノテーション付与手段を有し、上記遺伝子クラスタのスコアリングにおいて、付与されたアノテーションに基づき選定された遺伝子についての発現量変動比計算を以下の重み付け計算式により行うことを特徴とする、請求項27に記載の装置。

- アノテーション付与手段が、それぞれ遺伝子機能の種類毎に異なるアノテーションを付与する手段であることを特徴とする請求項28に記載の装置。
- アノテーションに基づき選定される遺伝子が、1)~3)のうちの1以上の遺伝子であることを特徴とする、請求項29に記載の装置
1)2次代謝物産生に関与していると想定される酵素種に属する酵素遺伝子。
2)トランスポーター遺伝子
3)転写因子をコードする遺伝子 - 上記請求項28~30のいずれかに記載のアノテーション付与手段と、構築された仮想の遺伝子クラスタから、アノテーションに基づき選出された遺伝子を含む仮想の遺伝子クラスタを選出する手段を有し、選出された仮想の遺伝子クラスタについてスコアリングすることを特徴とする、請求項27に記載の装置。
- ゲノムDNA上に配列する各遺伝子中の特定遺伝子を選定するためのアノテーション付与手段を有し、ゲノムDNA上において近傍に位置することを条件として、アノテーションに基づき選定された遺伝子のみから、あるいは該遺伝子を少なくとも含む1以上の遺伝子から仮想の遺伝子クラスタを構築する手段を有することを特徴とする、請求項18~25のいずれかに記載の装置。
- 請求項32に記載のアノテーション付与手段が、それぞれ遺伝子機能の種類に応じたアノテーションを付与する手段であることを特徴とする請求項32に記載の装置。
- アノテーション付与に基づき選定される遺伝子が、1)~3)のうちの1以上の遺伝子であることを特徴とする、請求項33に記載の装置
1)2次代謝物産生に関与していると想定される酵素種に属する酵素遺伝子。
2)トランスポーター遺伝子
3)転写因子をコードする遺伝子 - 仮想の各遺伝子クラスタのスコアリングが以下の計算式a)によりなされることを特徴とする、請求項32~34のいずれかに記載の装置。
計算式a)

- 仮想の遺伝子クラスタ全体のスコアの分布から乖離して存在するスコアを有する仮想の遺伝子クラスタを、標的の遺伝子クラスタ候補として選定する手段を有することを特徴とする、請求項18~35のいずれかに記載の装置。
- 標的の遺伝子クラスタ候補として選定する手段として、仮想の遺伝子クラスタ全体のスコアの分布からの乖離の程度を示す判定値I(χ)を、以下の計算式b)により算出するプログラムが格納されていることを特徴とする、請求項36に記載の装置。
計算式b)

- 標的の遺伝子クラスタ候補として選定する手段として、遺伝子クラスタ全体のスコアの分布からの乖離の程度を示す判定値II(υ)を、以下の計算式c)により算出するプログラムが格納されていることを特徴とする、請求項37に記載の装置。
計算式c)

- さらに、以下の計算式d)の算出結果に基づき、bが100未満の仮想のクラスタを少なくとも除外し、標的の遺伝子クラスタ候補をさらに絞り込むプログラムが格納されていることを特徴とする、請求項37または38に記載の装置。
計算式d)

- a)生物細胞の生理状態変化を生じる条件とコントロール条件下において生じたゲノムDNA上に配列する各遺伝子の発現量を入力する手段、b)入力された上記2つの条件下における同一遺伝子の発現量の比を算出する発現量変動比算出手段、c)該算出されたゲノムDNA上に配列する各遺伝子の発現量変動比を複数の遺伝子により構築された上記仮想の遺伝子クラスタ単位の発現量変動比として合算し、仮想の遺伝子クラスタ単位毎にスコアリングする手段、及びd)得られた仮想の遺伝子クラスタのスコアから遺伝子クラスタに含まれる遺伝子数単位毎の遺伝子クラスタ分布判定値(ε)を算出する手段を有し、該遺伝子クラスタ分布判定値(ε)から、標的とする遺伝子クラスタがゲノム中に存在する否かあるいは、標的遺伝子クラスタが存在する場合の遺伝子サイズを予測する装置であって、仮想の遺伝子クラスタの構築手段が、ゲノムDNA上に連続する遺伝子を2個から遺伝子数を一つずつ増やし想定される遺伝子クラスタに含まれる最大限のゲノム遺伝子数になるまで抽出し、かつ該抽出において抽出する遺伝子の各個数毎に、直鎖状DNAからなるゲノムの場合には該DNAのいずれかの末端から、あるいは環状DNAからなるゲノムの場合には任意の遺伝子を起点として順にゲノムDNA上に配列する遺伝子を一つずつずらしながら抽出された各遺伝子群を仮想の各遺伝子クラスタとする手段であり、上記仮想の遺伝子クラスタ単位のスコアリング手段は以下の計算式a)による演算手段からなるとともに、上記遺伝子クラスタ分布判定値(ε)の算出手段が、以下の計算式e)によるものであることを特徴とする、上記装置。
計算式a)


- 遺伝子数がk個のときの遺伝子クラスタ分布判定値ε値(ε(k))と、その前後数のときの同ε値(ε(k-1)、ε(k+1))が、以下の関係にあるとき、標的とする遺伝子クラスタがゲノム中に存在すると判定し、標的遺伝子クラスタに含まれる遺伝子数をk個とする予想値を出力することを特徴とする、請求項40に記載の装置。

- 請求項26に記載の仮想の遺伝子クラスタの構築手段を実行するプログラムであって、ゲノム遺伝子の位置情報に基づき、以下の1)または2)の手段を実行することを特徴とする、仮想の遺伝子クラスタ構築プログラム。
1)ゲノム遺伝子が直鎖状ゲノムの場合、
a.ゲノムDNAの一方の末端に位置する遺伝子を起点として、他方の末端方向に、順次、ゲノムDNA上に連続する遺伝子を同一方向に2個から一つずつ増やして想定される遺伝子クラスタに含まれる遺伝子数の最大限になるまで組み合わせ、起点とした遺伝子を含み、かつ遺伝子の個数の異なる複数の遺伝子群を構成する手段。
b.起点を、順次、他方の末端方向に一遺伝子ずつずらせながら、上記a.と同様の処理を行い、新たな起点遺伝子を含みかつ遺伝子の個数が異なる複数の遺伝子群を構成し、a.の遺伝子群と併せて、複数の遺伝子を組み合わせた遺伝子群からなる仮想の遺伝子クラスタを構築する手段。
2)ゲノム遺伝子が環状の場合、ゲノムDNA上の任意の遺伝子を起点として、上記1)a.及びb.と同様の処理を順次行い、最初に起点とした遺伝子が起点となる時点で処理を終了する手段。 - 請求項42のプログラムにより構築された仮想の遺伝子クラスタについて、以下の計算式a)によるスコアリングを実行することを特徴とする、仮想の遺伝子クラスタのスコアリングプログラム。
計算式a)

- 上記遺伝子クラスタのスコアリングにおいて、付与されたアノテーションに基づきゲノム遺伝子を選定し、選定された遺伝子についての発現量変動比計算を以下の重み付け計算式により行うことを特徴とする、請求項43に記載のスコアリングプログラム。

- 上記遺伝子クラスタのスコアリングにおいて、付与されたアノテーションに基づきゲノム遺伝子を選定し、構築された遺伝子クラスタの中から、該選定されたゲノム遺伝子を含む仮想の遺伝子クラスタを選出し、選出された仮想の遺伝子クラスタについてスコアリングを実行することを特徴とする、請求項43に記載のスコアリングプログラム。
- 上記請求項32に記載の仮想の遺伝子クラスタの構築手段を実行するプログラムであって、ゲノムDNA上において近傍に位置することを条件として、アノテーションに基づき選定された遺伝子のみから、あるいは該遺伝子を少なくとも含む1以上の遺伝子から仮想の遺伝子クラスタを構築することを特徴とする、仮想の遺伝子クラタの構築プログラム。
- 請求項46のプログラムにより構築された仮想の遺伝子クラスタについて、以下の計算式a)によるスコアリングを実行することを特徴とする、仮想の遺伝子クラスタのスコアリングプログラム。
計算式a)

- 請求項43~45又は47のいずれかに記載のスコアリングプログラムにより算出された各仮想の遺伝子クラスタのスコアについて、仮想の遺伝子クラスタ全体のスコアの分布からの乖離の程度を算出するプログラムであって、以下の計算式b)により、判定値I(χ)を算出することを特徴とする、上記プログラム。
計算式b)

- 請求項43~45又は47のいずれかに記載のスコアリングプログラムにより算出された各仮想の遺伝子クラスタのスコアについて、仮想の遺伝子クラスタ全体のスコア分布からの乖離の程度を算出するプログラムであって、以下の計算式c)により判定値II(υ)の算出を実行する、上記プログラム。
計算式c)

- 生物細胞の生理状態変化を生じる条件とコントロール条件下とにおけるゲノムDNA上に配列する各遺伝子の発現量変動比を複数の遺伝子により構築された上記仮想の遺伝子クラスタ単位の発現量変動比として合算し、仮想の遺伝子クラスタ単位毎にスコアリングする手段、及び得られた仮想の遺伝子クラスタのスコアから遺伝子クラスタに含まれる遺伝子数単位毎の遺伝子クラスタ分布判定値(ε)を算出し、該遺伝子クラスタ分布判定値(ε)から、標的とする遺伝子クラスタがゲノム中に存在する否かあるいは、標的遺伝子クラスタが存在する場合の遺伝子サイズを予測する手段に用いるプログラムであって、
少なくとも以下(A)~(C)の手段を実行するプログラム。
(A)ゲノム遺伝子の位置情報に基づき、以下の1)または2)の手段により仮想の遺伝子クラスタを構築する手段、
1)ゲノム遺伝子が直鎖状の場合、
a.ゲノムDNAの一方の末端に位置する遺伝子を起点として、他方の末端方向に、順次、ゲノムDNA上に連続する遺伝子を同一方向に2個から一つずつ増やして想定される遺伝子クラスタに含まれる遺伝子数の最大限になるまで組み合わせ、起点とした遺伝子を含み、かつ遺伝子の個数の異なる複数の遺伝子群を構成する手段。
b.起点を、順次、他方の末端方向に一遺伝子ずつずらせながら、上記a.と同様の処理を行い、新たな起点遺伝子を含みかつ遺伝子の個数が異なる複数の遺伝子群を構成し、a.の遺伝子群と併せて、複数の遺伝子の組み合わせた遺伝子群からなる仮想の遺伝子クラスタを構築する手段。
2)ゲノム遺伝子が環状の場合、ゲノムDNA上の任意の遺伝子を起点として、上記1)a.及びb.と同様の処理を順次行い、最初に起点とした遺伝子が起点となる時点で処理を終了する手段。
(B)上記(A)の手段により構築された仮想の遺伝子クラスタについて、以下の計算式a)により仮想の遺伝子クラスタ単位毎にスコアリングする手段。
計算式a)

計算式e)

- 遺伝子数がk個のときの遺伝子クラスタ分布判定値ε値(ε(k))と、その前後数のときの同ε値(ε(k-1)、ε(k+1))が、以下の関係にあるとき、標的とする遺伝子クラスタがゲノム中に存在すると判定し、標的遺伝子クラスタに含まれる遺伝子数をk個とする予想値を出力することを特徴とする、請求項50に記載のプログラム。

Priority Applications (2)
| Application Number | Priority Date | Filing Date | Title |
|---|---|---|---|
| US13/825,453 US20130237435A1 (en) | 2010-09-22 | 2011-09-22 | Gene cluster, gene searching/identification method, and apparatus for the method |
| JP2012535087A JP5780560B2 (ja) | 2010-09-22 | 2011-09-22 | 遺伝子クラスタ及び遺伝子の探索、同定法およびそのための装置 |
Applications Claiming Priority (6)
| Application Number | Priority Date | Filing Date | Title |
|---|---|---|---|
| JP2010-212116 | 2010-09-22 | ||
| JP2010212116 | 2010-09-22 | ||
| JP2011053301 | 2011-03-10 | ||
| JP2011-053301 | 2011-03-10 | ||
| JP2011-053729 | 2011-03-11 | ||
| JP2011053729 | 2011-03-11 |
Publications (1)
| Publication Number | Publication Date |
|---|---|
| WO2012039484A1 true WO2012039484A1 (ja) | 2012-03-29 |
Family
ID=45873967
Family Applications (1)
| Application Number | Title | Priority Date | Filing Date |
|---|---|---|---|
| PCT/JP2011/071731 Ceased WO2012039484A1 (ja) | 2010-09-22 | 2011-09-22 | 遺伝子クラスタ及び遺伝子の探索、同定法およびそのための装置 |
Country Status (3)
| Country | Link |
|---|---|
| US (1) | US20130237435A1 (ja) |
| JP (1) | JP5780560B2 (ja) |
| WO (1) | WO2012039484A1 (ja) |
Cited By (2)
| Publication number | Priority date | Publication date | Assignee | Title |
|---|---|---|---|---|
| WO2014046284A1 (ja) * | 2012-09-24 | 2014-03-27 | 独立行政法人産業技術総合研究所 | 二次代謝系遺伝子を含む遺伝子クラスタの予測方法、予測プログラム及び予測装置 |
| KR101771042B1 (ko) | 2015-01-16 | 2017-08-24 | 연세대학교 산학협력단 | 질병 관련 유전자 탐색 장치 및 그 방법 |
Families Citing this family (6)
| Publication number | Priority date | Publication date | Assignee | Title |
|---|---|---|---|---|
| WO2015105771A1 (en) * | 2014-01-07 | 2015-07-16 | The Regents Of The University Of Michigan | Systems and methods for genomic variant analysis |
| WO2016077416A1 (en) * | 2014-11-11 | 2016-05-19 | The Regents Of The University Of Michigan | Systems and methods for electronically mining genomic data |
| US10612032B2 (en) | 2016-03-24 | 2020-04-07 | The Board Of Trustees Of The Leland Stanford Junior University | Inducible production-phase promoters for coordinated heterologous expression in yeast |
| CA3042726A1 (en) * | 2016-11-16 | 2018-05-24 | The Board Of Trustees Of The Leland Stanford Junior University | Systems and methods for identifying and expressing gene clusters |
| US20190376067A1 (en) * | 2017-02-13 | 2019-12-12 | The Regents Of The University Of Colorado, A Body Corporate | Compositions, methods and uses for multiplexed trackable genomically-engineered polypeptides |
| WO2025101762A1 (en) * | 2023-11-08 | 2025-05-15 | Hexagon Bio, Inc. | Methods for identification of compound interaction partners and compounds produced by gene clusters |
-
2011
- 2011-09-22 US US13/825,453 patent/US20130237435A1/en not_active Abandoned
- 2011-09-22 JP JP2012535087A patent/JP5780560B2/ja not_active Expired - Fee Related
- 2011-09-22 WO PCT/JP2011/071731 patent/WO2012039484A1/ja not_active Ceased
Non-Patent Citations (3)
| Title |
|---|
| KATSUHISA HORIMOTO ET AL.: "Inference of a Genetic Network with Use of a Hierarchical Clustering from a Large Amount of Gene Expression Data", BIOPHYSICS, vol. 42, no. 3, 2002, pages 110 - 115 * |
| STARCEVIC A. ET AL.: "ClustScan: an integrated program package for the semi-automatic annotation of modular biosynthetic gene clusters and in silico prediction of novel chemical structures", NUCLEIC ACIDS RESEARCH, vol. 36, no. 21, 2008, pages 6882 - 6892, XP002517623, DOI: doi:10.1093/nar/gkn685 * |
| ZHAO H. ET AL.: "A probabilistic relaxation labeling framework for reducing the noise effect in geometric biclustering of gene expression data", PATTERN RECOGNITION, vol. 42, 2009, pages 2578 - 2588, XP026250853, DOI: doi:10.1016/j.patcog.2009.03.016 * |
Cited By (3)
| Publication number | Priority date | Publication date | Assignee | Title |
|---|---|---|---|---|
| WO2014046284A1 (ja) * | 2012-09-24 | 2014-03-27 | 独立行政法人産業技術総合研究所 | 二次代謝系遺伝子を含む遺伝子クラスタの予測方法、予測プログラム及び予測装置 |
| JP5946149B2 (ja) * | 2012-09-24 | 2016-07-05 | 国立研究開発法人産業技術総合研究所 | 二次代謝系遺伝子を含む遺伝子クラスタの予測方法、予測プログラム及び予測装置 |
| KR101771042B1 (ko) | 2015-01-16 | 2017-08-24 | 연세대학교 산학협력단 | 질병 관련 유전자 탐색 장치 및 그 방법 |
Also Published As
| Publication number | Publication date |
|---|---|
| US20130237435A1 (en) | 2013-09-12 |
| JPWO2012039484A1 (ja) | 2014-02-03 |
| JP5780560B2 (ja) | 2015-09-16 |
Similar Documents
| Publication | Publication Date | Title |
|---|---|---|
| JP5780560B2 (ja) | 遺伝子クラスタ及び遺伝子の探索、同定法およびそのための装置 | |
| Vaishnav et al. | The evolution, evolvability and engineering of gene regulatory DNA | |
| Schocha et al. | Nuclear ribosomal internal transcribed spacer (ITS) region as a universal DNA barcode marker for Fungi | |
| Oliver et al. | Systematic functional analysis of the yeast genome | |
| Andersen et al. | Accurate prediction of secondary metabolite gene clusters in filamentous fungi | |
| Bar-Or et al. | Cross-species microarray hybridizations: a developing tool for studying species diversity | |
| McIsaac et al. | Perturbation-based analysis and modeling of combinatorial regulation in the yeast sulfur assimilation pathway | |
| JP5946149B2 (ja) | 二次代謝系遺伝子を含む遺伝子クラスタの予測方法、予測プログラム及び予測装置 | |
| Jia et al. | Telomere-to-telomere genome assemblies of cultivated and wild soybean provide insights into evolution and domestication under structural variation | |
| Roy et al. | Genome-wide prediction and functional validation of promoter motifs regulating gene expression in spore and infection stages of Phytophthora infestans | |
| Kroc et al. | Development and validation of a gene-targeted dCAPS marker for marker-assisted selection of low-alkaloid content in seeds of narrow-leafed lupin (Lupinus angustifolius L.) | |
| Vignolle et al. | FunOrder: A robust and semi-automated method for the identification of essential biosynthetic genes through computational molecular co-evolution | |
| Weiser et al. | Novel distal eQTL analysis demonstrates effect of population genetic architecture on detecting and interpreting associations | |
| Shi et al. | Identify essential genes based on clustering based synthetic minority oversampling technique | |
| Zhang et al. | From multi‐scale methodology to systems biology: to integrate strain improvement and fermentation optimization | |
| Abraham et al. | Genome-wide expression QTL mapping reveals the highly dynamic regulatory landscape of a major wheat pathogen | |
| Prade et al. | Accumulation of stress and inducer-dependent plant-cell-wall-degrading enzymes during asexual development in Aspergillus nidulans | |
| Connelly et al. | Population genomics and transcriptional consequences of regulatory motif variation in globally diverse Saccharomyces cerevisiae strains | |
| Zhang et al. | Enzyme annotation for orphan reactions and its applications in biomanufacturing | |
| Bowyer et al. | Genome-wide discovery and phenotyping of non-coding transcripts in A. fumigatus reveals lncRNAs with a role in antifungal drug sensitivity | |
| Boiko | The trends in the spread of simple sequence repeats in the genomes of Schizophyllum commune | |
| JP2010086142A (ja) | 遺伝子クラスタリング装置およびプログラム | |
| Shkurin et al. | Known sequence features explain half of all human gene ends | |
| Soanes et al. | A bioinformatic tool for analysis of EST transcript abundance during infection‐related development by Magnaporthe grisea | |
| Giles et al. | A relational database for the discovery of genes encoding amino acid biosynthetic enzymes in pathogenic fungi |
Legal Events
| Date | Code | Title | Description |
|---|---|---|---|
| 121 | Ep: the epo has been informed by wipo that ep was designated in this application |
Ref document number: 11826929 Country of ref document: EP Kind code of ref document: A1 |
|
| ENP | Entry into the national phase |
Ref document number: 2012535087 Country of ref document: JP Kind code of ref document: A |
|
| NENP | Non-entry into the national phase |
Ref country code: DE |
|
| WWE | Wipo information: entry into national phase |
Ref document number: 13825453 Country of ref document: US |
|
| 122 | Ep: pct application non-entry in european phase |
Ref document number: 11826929 Country of ref document: EP Kind code of ref document: A1 |