WO2011102226A1 - 電気生理測定装置及び方法 - Google Patents
電気生理測定装置及び方法 Download PDFInfo
- Publication number
- WO2011102226A1 WO2011102226A1 PCT/JP2011/052164 JP2011052164W WO2011102226A1 WO 2011102226 A1 WO2011102226 A1 WO 2011102226A1 JP 2011052164 W JP2011052164 W JP 2011052164W WO 2011102226 A1 WO2011102226 A1 WO 2011102226A1
- Authority
- WO
- WIPO (PCT)
- Prior art keywords
- membrane
- current
- cell
- electrophysiological
- sample cell
- Prior art date
- Legal status (The legal status is an assumption and is not a legal conclusion. Google has not performed a legal analysis and makes no representation as to the accuracy of the status listed.)
- Ceased
Links
Images



Classifications
-
- G—PHYSICS
- G01—MEASURING; TESTING
- G01N—INVESTIGATING OR ANALYSING MATERIALS BY DETERMINING THEIR CHEMICAL OR PHYSICAL PROPERTIES
- G01N33/00—Investigating or analysing materials by specific methods not covered by groups G01N1/00 - G01N31/00
- G01N33/48—Biological material, e.g. blood, urine; Haemocytometers
- G01N33/483—Physical analysis of biological material
- G01N33/487—Physical analysis of biological material of liquid biological material
- G01N33/48707—Physical analysis of biological material of liquid biological material by electrical means
- G01N33/48728—Investigating individual cells, e.g. by patch clamp, voltage clamp
Definitions
- the present invention relates to an electrophysiological measurement apparatus and method for measuring the response of cells to drugs and electrical stimulation.
- An ion channel or ion channel-coupled receptor existing in the cell membrane of a cell allows various ions to permeate inside or outside the cell through the ion channel when a stimulus (chemical stimulus or physical stimulus) is applied.
- a stimulus chemical stimulus or physical stimulus
- One of the methods for examining such a cellular response is a method in which a current is injected into a cell and a change in membrane potential at that time is measured to observe a response of an ion channel or a receptor.
- a current fixing method has been used in which a constant current or a steady current is injected into a cell and a change in the membrane potential of the cell membrane at that time is measured.
- Non-Patent Document 1 a method of changing the current injected into the cell according to the membrane potential has been proposed (see Non-Patent Document 1).
- This method is called a conductance injection method or a dynamic clamp method because the product of conductance (membrane conductivity) and membrane potential is added to the cell membrane as an injection current.
- the conductance injection method the dynamics of ion channels and receptors on the cell membrane can be examined in a state closer to real cells.
- ion channels and receptors present in the cell membrane do not respond only to the membrane potential, but are also affected by cations and anions inside and outside the cell, chemical substances such as neurotransmitters and hormones. For this reason, even with the conductance injection method, it cannot always be said that the cell response in a state close to the actual state is observed.
- the problem to be solved by the present invention is to provide an electrophysiological measurement apparatus and method capable of observing a cell response in a more realistic state.
- the present invention made to solve the above problems is an electrophysiological measurement device for measuring an electrophysiological response of a cell when a stimulus is applied to the cell, a) a membrane potential measuring means for continuously measuring the membrane potential of the sample cell; b) a concentration measuring means for continuously measuring the concentration of a substance involved in the electrophysiological response in the sample cell; c) Membrane current calculation means for calculating the membrane current from the substance concentration involved in the electrophysiological response and the membrane potential of the sample cell based on a mathematical model including a plurality of parameters relating to the membrane current of the cell membrane; d) Current injection means for injecting the calculated membrane current into the sample cell in real time.
- the electrophysiological response participating substance when the electrophysiological response of the sample cell is the opening and closing of an ion channel depending on the membrane potential, the electrophysiological response participating substance may be a cation or / and an anion. Further, when the sample cell is a nerve cell, the electrophysiological response participating substance may be a neurotransmitter or / and an ion.
- the electrophysiological measurement method of the present invention includes a) preparing a sample cell that exhibits a constant electrophysiological response to a predetermined stimulus; b) continuously measuring and recording the membrane potential of the sample cells; c) continuously measuring and recording intracellular substance concentrations in the sample cells; d) calculating the membrane current from the membrane potential and the intracellular substance concentration based on a mathematical model including a plurality of parameters relating to the membrane current of the cell membrane; e) injecting the calculated membrane current into the sample cell in real time.
- the voltage-dependent ion channels and synaptic receptors in the cell's biological membrane open depending on the membrane potential and allow ions to permeate from higher to lower electrochemical potential.
- the gradient of the electrochemical potential is the sum of the gradient of the chemical potential due to the difference in ion concentration inside and outside the membrane and the gradient of the electrical potential due to the membrane potential. Therefore, from the membrane potential and the ion concentration, the direction of ion transmission and the magnitude of current (ion channel current, synaptic current) flowing through the cell membrane due to ion transmission can be obtained.
- the membrane potential and intracellular substance concentration of the sample cell are continuously measured, and a plurality of parameters relating to the membrane current of the cell membrane are included from the measured values of the membrane potential and intracellular substance concentration.
- the cellular response in a state closer to reality can be measured.
- the electrophysiological measurement apparatus and method of the present invention synthesizes currents flowing through imaginary ion channels and receptors that exist in sample cells or do not actually exist in sample cells based on membrane potential and intracellular substance concentration. Therefore, it is possible to suppress the functions of ion channels and receptors existing in the cell membrane (knock out) or to express the functions of fictitious ion channels and receptors (knock in).
- imaging ion channel” and “imaginary receptor” refer to artificially created so-called constructed ion channels and constructed receptors. Therefore, the present invention is useful for verifying the function of a specific ion channel or receptor, or for drug discovery targeting a specific ion channel or receptor.
- FIG. 1 is a schematic configuration diagram of an electrophysiological measurement device according to an embodiment of the present invention.
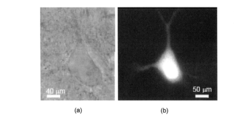
- a differential interference image (a) of cells at the start of the experiment and a fluorescence image (b) after Fura-2 injection are shown.
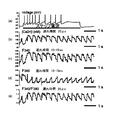
- Time variation waveform of membrane potential (a) time variation of calcium ion concentration (b)
- R2 fluorescence intensity
- R2 fluorescence intensity ratio
- R1 / R2 e
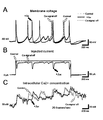
- A is a time-varying waveform of membrane potential
- B is an injection current
- C is an intracellular calcium ion concentration.
- a to C respectively show a control experiment (Control), a case where a synthetic current corresponding to the SK channel current is injected (+ Isk), and a case where the calcium ion concentration is constant (Ca signal off).
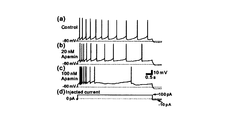
- the effect of apamin on the firing phenomenon of dopamine neurons is shown, (a) is a control group, (b) is a 20 nM apamin treatment group, (c) is a 100 nM apamin treatment group, and (d) is an injection current.
- FIG. 7 is a diagram showing the influence on the waveform of sAHP (slow spike after slow hyperpolarization) caused by injection of SK current in the presence of 20 nM apamin, including membrane potential (a), intracellular calcium ion concentration (b), SK conductance (c) and injected SK current (d) are shown.
- FIG. 5B is a diagram corresponding to FIG. 5B when the intracellular calcium ion concentration is obtained from fluorescence imaging.
- electrophysiological measurement apparatus and method according to an embodiment of the present invention will be described.
- the electrophysiological measurement apparatus and method of the present invention are not limited to the examples shown below.
- the electrophysiological measurement method comprises the steps of preparing a sample cell that exhibits a certain electrophysiological response by a predetermined stimulus, a step of continuously measuring and recording the membrane potential of the sample cell, A step of continuously measuring and recording an intracellular substance concentration, a step of calculating a membrane current from the membrane potential and the intracellular substance concentration based on a mathematical model including a plurality of parameters relating to a membrane current of the cell membrane, and a calculation And injecting the membrane current into the sample cell in real time.
- the ion channel current I (t, V) can be simulated by the following equation (1) using a conductance base model depending on the membrane potential V and time t (Hille, 2001).
- the following equation shows an example of a calcium ion concentration-dependent potassium ion channel that selectively permeates potassium ions depending on the intracellular calcium ion concentration.
- m 1 , m 2 , and m 3 are natural numbers, and their values are determined by specifying an ion channel model.
- g represents the maximum conductance and is usually a constant.
- E rev is a constant representing the reversal potential of the cell membrane.
- variables x, y, and z correspond to variables representing activation / deactivation of the ion channel, and are variables for qualitatively simulating the channel opening / closing probability.
- the variables x, y, and z are defined by the following equation, and usually vary with time in accordance with the membrane potential V.
- ⁇ i (V) and ⁇ i (V) are functions relating to the membrane potential, and are generally known in the conductance base model.
- Z is a function of intracellular calcium ion concentration [Ca 2+ ] i
- K d is a dissociation constant between intracellular calcium (Ca 2+ ) and an ion channel.
- n represents a natural number.
- the membrane potential and calcium ion concentration of the sample cell at time t are known, the ion channel current I (t, V) can be synthesized.
- the membrane potential of the sample cell can be obtained by arranging a pair of electrodes inside and outside the sample cell and measuring the potential difference between the pair of electrodes.
- Various calcium ion measuring reagents can be used to measure the calcium ion concentration in the sample cell.
- the calcium fluorescent indicator Fura-2 is known to change its excitation spectrum by binding to calcium ions.
- the calcium ion can be calculated from the following equation (5).
- the (Ca 2+ ) concentration can be determined (Grynkiewicz et al., 1985).
- the values of R min , R max and Sf 2 / Sb 2 are values specific to the calcium fluorescent indicator Fura-2. However, for R min and R max , the maximum value and the minimum value of the fluorescence intensity R are obtained for each experiment, and these may be used as R max and R min .
- a method combining the two-wavelength measurement method and the one-wavelength measurement method can be used for measuring the calcium ion concentration.
- Fluorescence intensity can be measured using a photomultiplier tube system, a fluorimeter, or a CCD camera.
- a photomultiplier tube system a fluorimeter
- a CCD camera a high-speed, high-sensitivity CCD camera or a high-speed, high-resolution CCD camera as the CCD camera, the calcium ion concentration in the sample cells can be measured in real time.
- FIG. 1 is a diagram illustrating a schematic configuration of an electrophysiological measurement apparatus 10 according to the present embodiment.
- the sample cell 12 is accommodated in the recording chamber 14 together with the tissue recovery solution. Tissue recovery fluid is perfused as needed.
- a glass electrode 16 is used for measuring the membrane potential of the sample cell.
- the glass electrode 16 stores the liquid in the electrode in the glass tube, and uses the electrolytic solution column in the glass tube as an electrode.
- the glass electrode 16 is also used for injecting a synthetic current into a sample cell.
- the glass electrode 16 (inside electrolyte) is connected to the analog / digital converter 22 via the lead wire 18 for measuring the membrane potential and the lead wire 20 for current injection.
- the analog / digital converter 22 includes, for example, a digital signal processor (DSP) 23.
- DSP digital signal processor
- the electrophysiological measurement device 10 of this embodiment includes a digital CCD camera 24.
- the digital CCD camera 24 is for measuring the concentration of calcium ions, which are intracellular substances involved in the electrophysiological response in the sample cell, and when the calcium ion in the sample cell and the calcium fluorescent indicator Fura-2 are combined. Fluorescence images generated at the same time are acquired continuously.
- EXiBlue registered trademark, Qimaging
- Qimaging which is a high-speed and high-sensitivity CCD camera
- the fluorescence image data acquired by the digital CCD camera 24 is sent to a personal computer 26 (hereinafter referred to as “personal computer”) and processed to calculate the fluorescence intensity and estimate the calcium ion concentration.
- the calcium fluorescent indicator Fura-2 was injected into the sample cells through the glass electrode 16.
- the electrophysiological measurement device 10 of the present embodiment includes a display device 28 that displays a fluorescent image acquired by the digital CCD camera 24.
- the electrophysiological measurement apparatus 10 includes an excitation light source for irradiating the sample cells with excitation light, an optical microscope for obtaining an optical image of the sample cells, a display device for the optical microscope, and the like.
- Electrophysiology A section of the basal ganglia was placed in the recording chamber 14, refluxed with ACSF, and maintained at 34 ⁇ 2 ° C.
- CNQX and AP5 were manufactured by Tocris Cookson.
- the glass electrode was made from borosilicate glass, and the intercellular fluid (105 mM potassium gluconate, 30 mM potassium chloride, 10 mM HEPES (2- [4- (2-Hydroxyethyl) -1-piperazinyl] ethanesulfonic acid), 10 mM creatine phosphorus Acid, 4 mM ATP-Mg, 0.3 mM Na-GTP, 5 mg / ml biocytin, adjusted to pH 7.3 with potassium hydroxide). To block the SK current, 10-100 nM apamin (Sigma-Aldrich) was added to the perfusate.
- the intercellular fluid 105 mM potassium gluconate, 30 mM potassium chloride, 10 mM HEPES (2- [4- (2-Hydroxyethyl) -1-piperazinyl] ethanesulfonic acid), 10 mM creatine phosphorus Acid, 4 mM ATP-M
- Membrane currents are recorded using a patch clamp amplifier (Multiclamp 700B, manufactured by Axon Instruments, Inc.) and digital data with an analog / digital converter 22 (NI PCI-6259 DAQ card, National Instruments, Inc.) at a sampling frequency of 20 kHz. Was taken into the personal computer 26. The acquired data was processed with data acquisition software written in MATLAB (MathWorks).
- a digital CCD camera 24 (EXiBlue; manufactured by QImaging), which is a high-speed / high-sensitivity CCD camera, was used.
- the transmission speed of the fluorescence image from the digital CCD camera 24 to the personal computer 26 depends on the size of the field of view and is set to 50 to 80 (frame / second).
- DSP digital signal processor 23
- P25M “Innovative Integration”, or sBOX, “MTT”
- FIG. 2 shows a differential interference image (a) of brain neurons at the start of the experiment and a fluorescence image (b) after Fura-2 injection. It can be seen that Fura-2 is dispersed throughout the cell.
- the transmission speed of the fluorescent image from the digital CCD camera 24 to the personal computer 26 is set to 50 to 80 (frame / second).
- FIG. An example when it is set to (frame / sec) is shown.
- the “delay time” described in each figure of FIG. 3 will be described.
- an exposure time is required.
- a delay time is generated for each exposure time.
- This delay time is about 15 to 30 ms (milliseconds) for each frame of the digital CCD camera 24.
- calculation of the fluorescence intensity ratio R (R1 / R2) based on the fluorescence image when excited with two wavelengths is performed on the DSP 23. Therefore, the sampling period (20 to 40 kHz) of the DSP 23 becomes a delay time (25 to 50 ⁇ s) for calculating the fluorescence intensity ratio R.
- the delay time when the image transmission rate is set to 50 to 80 frames / second is about 12.5 to 20 ms in the case of one wavelength measurement, and is 25 to 40 ms because it is for two frames in the case of two wavelength measurement.
- setting is made so as to synthesize the injection current based on the above equation (1) from the measured value of the membrane potential of the sample cell and the measured value of the calcium ion concentration obtained after the delay time.
- FIG. 4 shows a time-dependent waveform of membrane potential (A), injection current (B), and intracellular calcium ion concentration (C) when a SK channel current which is a calcium ion concentration-dependent potassium ion channel is injected into a sample cell.
- A membrane potential
- B injection current
- C intracellular calcium ion concentration
- FIG. 4 shows the result of a control experiment in which the SK channel current is constant (in the figure, indicated as “Control”, hereinafter also referred to as “control group”), the SK channel current synthesized from the membrane potential and the calcium ion concentration.
- Experimental results of injecting the synthesized current (indicated as “+ Isk” in the figure), SK channel currents synthesized with a constant calcium ion concentration (80 nM), and experimental results of injecting the synthesized current (in the figure) , “Ca signal off”, which corresponds to the conventional current injection method).
- the membrane potential and the fluctuation waveform of the calcium ion concentration when the SK channel current is obtained with a constant calcium ion concentration are similar to the results of the control experiment, whereas the membrane potential and calcium When the SK channel current was determined from the ion concentration, it was significantly different from the control group. From this, it can be seen that the electrophysiological measurement apparatus and method of the present embodiment can measure the cellular response in a more realistic state.
- FIGS. 5A-5C show the effect of apamin on the firing phenomenon of dopamine neurons.
- apamin has an action of blocking the SK current.
- FIG. 5A shows changes in membrane potential after injection of a step pulse current (100 pA) in the control group (a), the 20 nM apamin treatment group (b), and the 100 nM apamin treatment group (c).
- irregular bursting activity was observed in the presence of 100 nM apamin, but in the control group (a) or 20 nM apamin treatment group (b) Single spike firing (regular single spiking) was observed.
- the presence of 100 nM apamin increased the negative voltage peak following each spike and reduced sAHP (spike hyperpolarization). In addition, the peak value of each spike decreased.
- FIGS. 5B (a) and 5C (a) show the effect on the sAHP waveform due to the injection of SK current in the presence of 20 nM apamin.
- the calcium ion concentration shown in (b) of FIG. 5B was obtained by substituting the recorded membrane potential into a mathematical model, and the calcium ion concentration shown in (b) of FIG. 5C was obtained from fluorescence imaging. It is a thing.
- sAHP was decreased by injection of SK current, and as a result, the negative voltage peak following each spike decreased.
- g - sk and Km represent the maximum SK value and dissociation constant, respectively.
- FIG. 5B (d) and FIG. 5C (d) show the SK current obtained from the calcium ion concentration using the dynamic clamp method. It can be seen that the changes in the SK current obtained using the calcium ion concentration obtained by using the mathematical model and the calcium ion concentration obtained by fluorescence imaging show a similar tendency.
- the ion channel has been described as an example, but the electrophysiological measurement apparatus and method of the present invention can also be applied when measuring the response of a synaptic receptor.
- the current flowing through the synapse is preferably synthesized based on a mathematical model relating to the membrane current of the cell membrane from the membrane potential of the cell membrane and the concentration of the neurotransmitter.
- a ligand binds to an ion (calcium ion, potassium ion, sodium ion, etc.) that permeates the channel in response to the opening of the ion channel, or a synaptic receptor.
- ions that permeate the receptor neurotransmitters released from synapses, cAMP important in intracellular signal transduction systems, and the like can be mentioned.
- Fura-2 is used as a fluorescent dye whose excitation energy changes due to binding of intracellular substances, but other fluorescent dyes may be used.
- fluorescent dyes other than Fura-2 include BCECF (2 wavelength excitation 1 wavelength fluorescence) and C-SNARF-1 (1 wavelength excitation 2 wavelength fluorescence) used for measurement of intracellular pH.
- a fluorescent dye corresponding to each substance may be injected into the sample cell.
- the electrophysiological measurement apparatus and method of the present invention can generate all action potential cells such as nerve cells and cardiomyocytes and have excitable membranes as sample cells.
- Electrophysiology measuring device 12 ... Sample cell 14 ... Recording chamber 16 ... Glass electrode 22 ... Analog / digital converter 23 ... Digital signal processor (DSP) 24 ... Digital CCD camera 26 ... Personal computer
Landscapes
- Health & Medical Sciences (AREA)
- Engineering & Computer Science (AREA)
- Life Sciences & Earth Sciences (AREA)
- Biomedical Technology (AREA)
- Chemical & Material Sciences (AREA)
- Physics & Mathematics (AREA)
- Food Science & Technology (AREA)
- Biochemistry (AREA)
- Urology & Nephrology (AREA)
- Hematology (AREA)
- Biophysics (AREA)
- Medicinal Chemistry (AREA)
- Analytical Chemistry (AREA)
- Molecular Biology (AREA)
- General Health & Medical Sciences (AREA)
- General Physics & Mathematics (AREA)
- Immunology (AREA)
- Pathology (AREA)
- Measuring Or Testing Involving Enzymes Or Micro-Organisms (AREA)
- Apparatus Associated With Microorganisms And Enzymes (AREA)
- Investigating, Analyzing Materials By Fluorescence Or Luminescence (AREA)
Abstract
本発明は、細胞に刺激を加えたときの当該細胞の電気生理応答を測定する電気生理測定装置であって、試料細胞の膜電位を連続的に測定する膜電位測定手段と、前記試料細胞内の電気生理応答に関与する物質の濃度を連続的に測定する濃度測定手段と、電気生理応答に関与する物質濃度と前記試料細胞の膜電位から、細胞膜の膜電流に関する複数のパラメータを含む数理モデルに基づき、膜電流を算出する膜電流算出手段と、算出した膜電流を前記試料細胞に実時間で注入する電流注入手段とを備える。
Description
本発明は、薬剤や電気刺激に対する細胞の応答を測定する電気生理測定装置及び方法に関する。
細胞の細胞膜に存在するイオンチャネルやイオンチャネル共役型レセプターは、刺激(化学的刺激や物理的刺激)が加わることにより、イオンチャネルを通じて各種イオンを細胞内あるいは細胞外に向かって透過させる。この結果、細胞内外をイオン電流が流れるため、細胞内外の電位勾配が変化し、これに伴い膜電位が変化する。従って、刺激を付与する前後の膜電位を記録することで細胞応答を調べることができる。
このような細胞応答を調べる手法の一つに、細胞に電流を注入し、その時の膜電位の変化を測定してイオンチャネルやレセプター等の応答を観察する方法がある。従来の電気生理学では、一定電流や定常電流を細胞に注入し、そのときの細胞膜の膜電位の変化を測定する電流固定法が用いられてきた。
これに対して、細胞に注入する電流を膜電位に応じて変化させる手法が提案されている(非特許文献1参照)。この手法は、コンダクタンス(膜伝導性)と膜電位の積を注入電流として細胞膜に加えることから、コンダクタンス注入法、あるいは、ダイナミッククランプ法と呼ばれている。コンダクタンス注入法によれば、より実細胞に近い状態で細胞膜上のイオンチャネルやレセプターの動態を調べることができる。
しかし、細胞膜に存在するイオンチャネルやレセプターは膜電位のみに応答するのではなく、細胞内外の陽イオンや陰イオン、神経伝達物質やホルモン等の化学物質の影響も受ける。このため、コンダクタンス注入法であっても、必ずしも実際に近い状態での細胞応答を観察しているとはいえなかった。
Hugh P.C.Robinson and Nobufumi Kawai,"Injection of digitally synthesized synaptic conductance transients to measure the integrative properties of neurons", Journal of Neuroscience Methods, 49(1993), pp.157-165
本発明が解決しようとする課題は、より実際に近い状態での細胞応答を観察することができる電気生理測定装置及び方法を提供することである。
上記課題を解決するために成された本発明は、細胞に刺激を加えたときの当該細胞の電気生理応答を測定する電気生理測定装置であって、
a) 試料細胞の膜電位を連続的に測定する膜電位測定手段と、
b) 前記試料細胞内の電気生理応答に関与する物質の濃度を連続的に測定する濃度測定手段と、
c) 前記電気生理応答に関与する物質濃度と前記試料細胞の膜電位から、細胞膜の膜電流に関する複数のパラメータを含む数理モデルに基づき、膜電流を算出する膜電流算出手段と、
d) 算出した膜電流を前記試料細胞に実時間で注入する電流注入手段と
を備えることを特徴とする。
a) 試料細胞の膜電位を連続的に測定する膜電位測定手段と、
b) 前記試料細胞内の電気生理応答に関与する物質の濃度を連続的に測定する濃度測定手段と、
c) 前記電気生理応答に関与する物質濃度と前記試料細胞の膜電位から、細胞膜の膜電流に関する複数のパラメータを含む数理モデルに基づき、膜電流を算出する膜電流算出手段と、
d) 算出した膜電流を前記試料細胞に実時間で注入する電流注入手段と
を備えることを特徴とする。
この場合、前記試料細胞の電気生理応答が膜電位に依存するイオンチャネルの開閉であるときは、前記電気生理応答関与物質は陽イオン又は/及び陰イオンにすると良い。
また、前記試料細胞が神経細胞であるときは、前記電気生理応答関与物質は、神経伝達物質又は/及びイオンにすると良い。
また、前記試料細胞が神経細胞であるときは、前記電気生理応答関与物質は、神経伝達物質又は/及びイオンにすると良い。
また、本発明の電気生理測定方法は、
a)所定の刺激によって一定の電気生理学的応答を示す試料細胞を準備する工程と、
b)前記試料細胞の膜電位を連続的に測定し、記録する工程と、
c)前記試料細胞内の細胞内物質濃度を連続的に測定し、記録する工程と、
d)前記膜電位及び前記細胞内物質濃度から、細胞膜の膜電流に関する複数のパラメータを含む数理モデルに基づき膜電流を算出する工程と、
e)算出した膜電流を前記試料細胞に実時間で注入する工程と
を備えることを特徴とする。
a)所定の刺激によって一定の電気生理学的応答を示す試料細胞を準備する工程と、
b)前記試料細胞の膜電位を連続的に測定し、記録する工程と、
c)前記試料細胞内の細胞内物質濃度を連続的に測定し、記録する工程と、
d)前記膜電位及び前記細胞内物質濃度から、細胞膜の膜電流に関する複数のパラメータを含む数理モデルに基づき膜電流を算出する工程と、
e)算出した膜電流を前記試料細胞に実時間で注入する工程と
を備えることを特徴とする。
細胞の生体膜(細胞膜や内膜)にある電位依存性のイオンチャネルやシナプスのレセプターは膜電位に依存して開き、電気化学ポテンシャルの高い方から低い方に向かってイオンを透過させる。電気化学ポテンシャルの勾配は、膜内外でのイオン濃度差による化学ポテンシャルの勾配と、膜電位による電気ポテンシャルの勾配の和である。従って、膜電位とイオン濃度から、イオンの透過方向、及び、イオンの透過により細胞膜に流れる電流(イオンチャネル電流、シナプス電流)の大きさを求めることができる。
本発明の電気生理測定装置及び方法では、試料細胞の膜電位と細胞内物質濃度を連続的に測定し、これら膜電位及び細胞内物質濃度の測定値から細胞膜の膜電流に関する複数のパラメータを含む数理モデルに基づきイオンチャネル電流やシナプス電流を算出すると共に、この算出した電流を測定中の細胞膜にほぼ即時に、実時間(リアルタイム)で注入するため、より一層、実際に近い状態での細胞応答を測定することができる。
また、本発明の電気生理測定装置及び方法では、試料細胞に実在する、或いは試料細胞に実際には存在しない架空のイオンチャネルやレセプターを流れる電流を、膜電位や細胞内物質濃度に基づいて合成することができるため、細胞膜に実在するイオンチャネルやレセプターの機能を抑えたり(ノックアウト)、架空のイオンチャネルやレセプターの機能を発現させたり(ノックイン)することができる。ここで、「架空のイオンチャネル」、「架空のレセプター」とは、人工的に作り出した、いわゆる構成イオンチャネル(constructed ion channel)、構成レセプター(constructed receptor)をいう。従って、本発明は、特定のイオンチャネルやレセプターの機能の検証や、特定のイオンチャネルやレセプターを標的とした創薬に有用である。
以下、本発明の一実施の形態に係る電気生理測定装置及び方法について説明する。なお、本発明の電気生理測定装置及び方法は、以下に示す例に限られるものではない。
まず、本実施の形態の電気生理測定方法について説明する。本電気生理測定方法は、所定の刺激によって一定の電気生理学的応答を示す試料細胞を準備する工程と、前記試料細胞の膜電位を連続的に測定し、記録する工程と、前記試料細胞内の細胞内物質濃度を連続的に測定し、記録する工程と、前記膜電位及び前記細胞内物質濃度から、細胞膜の膜電流に関する複数のパラメータを含む数理モデルに基づき膜電流を算出する工程と、算出した膜電流を前記試料細胞に実時間で注入する工程とを備える。
一般に、イオンチャネル電流I(t,V)は、膜電位Vと時刻tに依存したコンダクタンスベースモデルを用いて、以下の式(1)で模擬できることが知られている(Hille,2001)。以下の式は、細胞内カルシウムイオン濃度に依存して,カリウムイオンを選択的に透過させるカルシウムイオン濃度依存性カリウムイオンチャネルの例を示す。

ここで、m1,m2,m3は自然数であり、イオンチャネルのモデルを指定するとそれらの値が決まる。g は最大コンダクタンスを表し、通常、定数である。Erevは細胞膜の反転電位を表す定数である。また、x,y,zの変数はイオンチャネルの活性化・不活性化を表す変数に対応し、チャネルの開閉確率を定性的に模擬するための変数である。x,y,zの変数は以下の方程式で規定され、通常、膜電位Vに応じて時間的に変動する。
ここで、m1,m2,m3は自然数であり、イオンチャネルのモデルを指定するとそれらの値が決まる。g は最大コンダクタンスを表し、通常、定数である。Erevは細胞膜の反転電位を表す定数である。また、x,y,zの変数はイオンチャネルの活性化・不活性化を表す変数に対応し、チャネルの開閉確率を定性的に模擬するための変数である。x,y,zの変数は以下の方程式で規定され、通常、膜電位Vに応じて時間的に変動する。
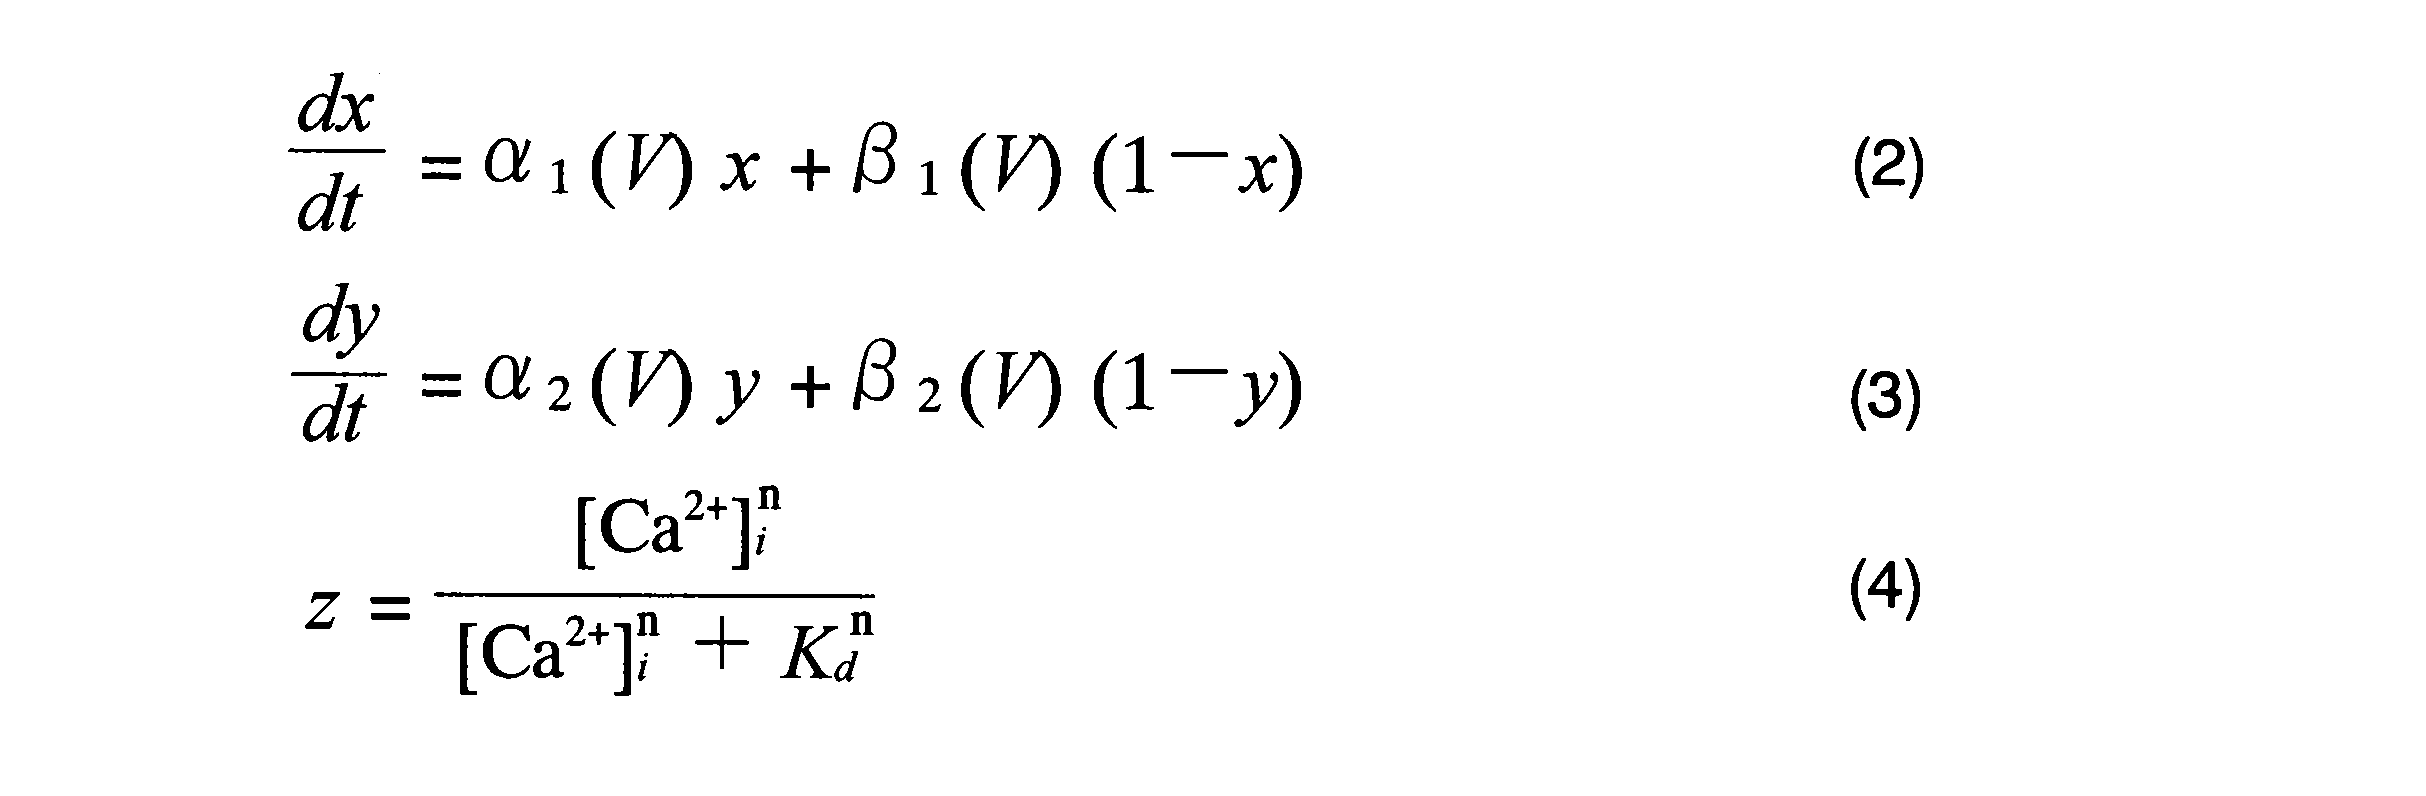
αi(V)、βi(V)は膜電位に関する関数であり、コンダクタンスベースモデルにおいて一般的に知られている関数である。また、zは細胞内カルシウムイオン濃度[Ca2+]iの関数であり、Kdは細胞内カルシウム(Ca2+)とイオンチャネルとの解離定数である。nは自然数を表す。
従って、時刻tにおける試料細胞の膜電位及びカルシウムイオン濃度が分かれば、イオンチャネル電流I(t,V)を合成することができる。
試料細胞の膜電位は、試料細胞の内外に一対の電極を配置し、これら一対の電極間の電位差を測定することで求めることができる。
試料細胞の膜電位は、試料細胞の内外に一対の電極を配置し、これら一対の電極間の電位差を測定することで求めることができる。
試料細胞内のカルシウムイオン濃度の測定には、種々のカルシウムイオン測定用試薬を用いることができる。その一つであるカルシウム蛍光指示薬 Fura-2 はカルシウムイオンと結合することにより励起スペクトルが変化することが知られている。適当な二波長(λ1=340nm, λ2=380nm)を選択して励起し、各励起波長における蛍光強度の比R(=R1/R2)を算出することにより、以下の式(5)からカルシウムイオン(Ca2+)濃度を求めることができる(Grynkiewicz et al., 1985 )。

上式(5)で、Kd(=135nM)は細胞内カルシウム(Ca2+)と蛍光色素との解離定数を表し、Rmin(=0.768)、Rmax(=35.1)、及び、Sf2/Sb2(=15.3)は全て定数である。なお、Rmin、Rmax及びSf2/Sb2の値はカルシウム蛍光指示薬Fura-2に固有の値である。ただし、Rmin、Rmaxについては、実験ごとに蛍光強度Rの最大値及び最小値を求め、それらをRmax及びRminとしても良い。
なお、カルシウムイオン濃度の計測には上記した二波長計測法の他、二波長計測法と一波長計測法を組み合わせた方法を用いることができる。二波長計測法と一波長計測法を組み合わせた方法では、二波長計測法を用いてカルシウムイオンの初期濃度を求め、その後のカルシウムイオン濃度の計測は一波長(λ=380nm)計測法を用いる。一波長計測法の方が二波長計測法よりも時間分解能が優れているため、この方法を用いることにより、短時間におけるカルシウムイオン濃度の変化を精度良く検出することができる。
蛍光強度の測定には光電子倍増管システムや蛍光光度計、CCDカメラを用いることができる。CCDカメラとして高速・高感度のCCDカメラ、あるいは高速・高解像度のCCDカメラを用いることにより、試料細胞中のカルシウムイオン濃度をリアルタイムで測定することができる。
以下、具体的な実施例について図1~図5を参照しつつ説明する。
図1は本実施例に係る電気生理測定装置10の概略構成を示す図である。試料細胞12は、組織回復液と共に記録用チャンバ14に収容される。組織回復液は必要に応じて灌流する。試料細胞の膜電位の測定にはガラス電極16が用いられる。ガラス電極16は、ガラス管内に電極内液を貯留することにより、ガラス管内の電解液柱を電極とするものである。本実施例では、このガラス電極16は試料細胞への合成電流の注入にも利用される。このため、ガラス電極16(内の電解液)は、膜電位測定用のリード線18、電流注入用のリード線20を介してアナログ/デジタル変換器22に接続されている。アナログ/デジタル変換器22は、例えばデジタルシグナルプロセッサ(DSP)23を備えている。
図1は本実施例に係る電気生理測定装置10の概略構成を示す図である。試料細胞12は、組織回復液と共に記録用チャンバ14に収容される。組織回復液は必要に応じて灌流する。試料細胞の膜電位の測定にはガラス電極16が用いられる。ガラス電極16は、ガラス管内に電極内液を貯留することにより、ガラス管内の電解液柱を電極とするものである。本実施例では、このガラス電極16は試料細胞への合成電流の注入にも利用される。このため、ガラス電極16(内の電解液)は、膜電位測定用のリード線18、電流注入用のリード線20を介してアナログ/デジタル変換器22に接続されている。アナログ/デジタル変換器22は、例えばデジタルシグナルプロセッサ(DSP)23を備えている。
また、本実施例の電気生理測定装置10はデジタルCCDカメラ24を備えている。デジタルCCDカメラ24は試料細胞内の電気生理応答に関与する細胞内物質であるカルシウムイオンの濃度を測定するためのもので、試料細胞内のカルシウムイオンとカルシウム蛍光指示薬Fura-2とが結合したときに発生する蛍光画像を連続的に取得する。例えば、デジタルCCDカメラ24として、高速・高感度CCDカメラであるEXiBlue(登録商標、Qimaging社)を用いることができる。
デジタルCCDカメラ24が取得した蛍光画像データはパーソナルコンピュータ26(以下、「パソコン」という)に送られ、処理されることにより、蛍光強度が算出され、カルシウムイオン濃度が推定される。試料細胞へのカルシウム蛍光指示薬 Fura-2 の注入は前記ガラス電極16を通して行った。
デジタルCCDカメラ24が取得した蛍光画像データはパーソナルコンピュータ26(以下、「パソコン」という)に送られ、処理されることにより、蛍光強度が算出され、カルシウムイオン濃度が推定される。試料細胞へのカルシウム蛍光指示薬 Fura-2 の注入は前記ガラス電極16を通して行った。
上記したほか、本実施例の電気生理測定装置10はデジタルCCDカメラ24の取得した蛍光画像を表示する表示装置28を備えている。また、図示しないが、電気生理測定装置10は、試料細胞に励起光を照射するための励起光源、試料細胞の光学画像を得るための光学顕微鏡及びその表示装置などを備えている。
次に、本発明の具体的な実験例について説明する。
1.実験手順
(1)脳切片の準備
大脳基底核の切片は生後15-18日のラット(Wistar rat, 日本エスエルシー株式会社)から得た。
脳は、人工脳髄液(ACSF;125mM NaCl, 2.5mM KCl, 25mM NaHCO3, 25mM Glucose, 1.25mM NaH2PO4, 2mM CaCl2, 及び1mM MgCl2を含有。pH 7.4になるように95%O2-5%CO2でバブリングした。)に浸した。その後、大脳基底核をビブラトームに設置し、300μm厚の冠状断面の切片を作成した。黒質緻密部(SNc:substantia nigra pars compacta)を含む切片は、記録前に少なくとも1時間、32℃のACSFでインキュベートした。
1.実験手順
(1)脳切片の準備
大脳基底核の切片は生後15-18日のラット(Wistar rat, 日本エスエルシー株式会社)から得た。
脳は、人工脳髄液(ACSF;125mM NaCl, 2.5mM KCl, 25mM NaHCO3, 25mM Glucose, 1.25mM NaH2PO4, 2mM CaCl2, 及び1mM MgCl2を含有。pH 7.4になるように95%O2-5%CO2でバブリングした。)に浸した。その後、大脳基底核をビブラトームに設置し、300μm厚の冠状断面の切片を作成した。黒質緻密部(SNc:substantia nigra pars compacta)を含む切片は、記録前に少なくとも1時間、32℃のACSFでインキュベートした。
(2)電気生理
大脳基底核の切片を記録用チャンバ14内に入れ、ACSFで還流し、34±2℃に保持した。ここでは、シナプスの伝達を阻害するために100μMのピクロトキシン(picrotoxin)或いは10μMのギャバジン(gabazine)(いずれもSigma-Aldrich社製)と、10μMのCNQX(6-シアノ-7-ニトロキノキサリン-2,3-ジオン)、10μMのAP5(D-(-)-2-amino-5-phosphonopentanoic acid)を含有するACSFを用いた。なお、CNQX及びAP5はTocris Cookson社製のものを用いた。
続いて、ステージ固定式顕微鏡を用いて切片を観察し、60倍の水浸対物レンズを用いてSNc中のドーパミンニューロン(ドーパミンを産生する神経細胞)を同定した。同定した全てのニューロンについて、チロシンハイドロキシラーゼによる免疫細胞化学的検出にてドーパミンニューロンであることを確認した。
大脳基底核の切片を記録用チャンバ14内に入れ、ACSFで還流し、34±2℃に保持した。ここでは、シナプスの伝達を阻害するために100μMのピクロトキシン(picrotoxin)或いは10μMのギャバジン(gabazine)(いずれもSigma-Aldrich社製)と、10μMのCNQX(6-シアノ-7-ニトロキノキサリン-2,3-ジオン)、10μMのAP5(D-(-)-2-amino-5-phosphonopentanoic acid)を含有するACSFを用いた。なお、CNQX及びAP5はTocris Cookson社製のものを用いた。
続いて、ステージ固定式顕微鏡を用いて切片を観察し、60倍の水浸対物レンズを用いてSNc中のドーパミンニューロン(ドーパミンを産生する神経細胞)を同定した。同定した全てのニューロンについて、チロシンハイドロキシラーゼによる免疫細胞化学的検出にてドーパミンニューロンであることを確認した。
ガラス電極はホウケイ酸ガラスから作成したもので、細胞間液(105mM グルコン酸カリウム,30mM 塩化カリウム,10mM HEPES(2-[4-(2-Hydroxyethyl)-1-piperazinyl]ethanesulfonic acid),10mM クレアチンリン酸,4mM ATP-Mg,0.3mM Na-GTP,5mg/ml biocytinを含有し、水酸化カリウムでpH7.3に調製したもの)で満たした。SK電流を遮断するために、10~100nMのアパミン(Sigma-Aldrich社)を灌流液に添加した。
膜電流の記録は、パッチクランプ用増幅器(Multiclamp 700B、Axon Instruments 社製)を用い、アナログ/デジタル変換器22(NI PCI-6259 DAQ card, National Instrument社)を介して20kHzのサンプリング周波数でデジタルデータとしてパソコン26に取り込んだ。取り込んだデータは、MATLAB(MathWorks社)で書かれたデータ収集ソフトウェアで処理した。
(3)Ca2+イメージング
カルシウムイオン濃度の計測にはドーパミンニューロンの体細胞に連結する樹状突起を用いた。カルシウムイオンの初期濃度は、二波長(波長340nm及び380nm)で励起したときの蛍光発光強度の比率計測(二波長計測)により求め、その後のカルシウムイオン濃度は一波長(波長380nm)で励起したときの蛍光発光強度の計測(一波長計測)により行った。蛍光色素にはFura-2(Molecular Proves社製)を用い、細胞中のFura-2の濃度は、細胞中に電極を注入するまでは0μMとし、定常状態では100μMとなるように調製した。また、計測には高速/高感度CCDカメラであるデジタルCCDカメラ24(EXiBlue;QImaging社製)を用いた。デジタルCCDカメラ24からパソコン26への蛍光画像の伝送速度は視野の大きさに依存し、50~80(frame/秒)に設定した。
カルシウムイオン濃度の計測にはドーパミンニューロンの体細胞に連結する樹状突起を用いた。カルシウムイオンの初期濃度は、二波長(波長340nm及び380nm)で励起したときの蛍光発光強度の比率計測(二波長計測)により求め、その後のカルシウムイオン濃度は一波長(波長380nm)で励起したときの蛍光発光強度の計測(一波長計測)により行った。蛍光色素にはFura-2(Molecular Proves社製)を用い、細胞中のFura-2の濃度は、細胞中に電極を注入するまでは0μMとし、定常状態では100μMとなるように調製した。また、計測には高速/高感度CCDカメラであるデジタルCCDカメラ24(EXiBlue;QImaging社製)を用いた。デジタルCCDカメラ24からパソコン26への蛍光画像の伝送速度は視野の大きさに依存し、50~80(frame/秒)に設定した。
パソコン26では、デジタルCCDカメラ24からの画像をカルシウムイオンイメージングソフトウェア(QCam-DA,日本ローパー社製)にて、視野の小領域内の空間平均処理を行った後、波長λ1=340nm及びλ2=380nmの蛍光強度R1及びR2をDA変換ボードからアナログ信号としてアナログ/デジタル変換器22に出力した。その後、除算(R1/R2)をデジタルシグナルプロセッサ23(DSP;P25M, Innovative Integration社、もしくはsBOX, MTT社)上で実行し、蛍光強度比Rを得た。カルシウムイオン濃度の詳細な計算法は、文献(J Biol Chem 1985;260:3440-3450、J Neurophysiol 2000;83:3084-3100)に従い、DSP23上で行った。
(4)膜モデル電流の注入
前述の式(1)に基づく膜モデル電流の合成に当たり、膜電位やカルシウムイオン濃度、その他の変数間の演算を、DSP23で行った。DSP23内のサンプリング周波数は40kHzとした。また、上述したように、細胞内カルシウムイオン濃度のサンプリング周波数(画像の伝送速度)が50~80(frames/秒)であり、DSP23内のサンプリング周波数よりも低いため、ガラス電極16からのアナログ出力信号はローパスフィルタ30で濾波した後、DSP23に送った。
前述の式(1)に基づく膜モデル電流の合成に当たり、膜電位やカルシウムイオン濃度、その他の変数間の演算を、DSP23で行った。DSP23内のサンプリング周波数は40kHzとした。また、上述したように、細胞内カルシウムイオン濃度のサンプリング周波数(画像の伝送速度)が50~80(frames/秒)であり、DSP23内のサンプリング周波数よりも低いため、ガラス電極16からのアナログ出力信号はローパスフィルタ30で濾波した後、DSP23に送った。
2.結果
本実験では、27匹の動物から得た43個のドーパミンニューロンについて記録及びイメージングを行った。いずれのドーパミンニューロンも、1.97±0.23(mean±SD)Hzの自発的発火活動が見られた。いくつかの実験では、電流クランプモードでの振動を阻止するために、誘起反応を得る前に膜を過分極化した。
本実験では、27匹の動物から得た43個のドーパミンニューロンについて記録及びイメージングを行った。いずれのドーパミンニューロンも、1.97±0.23(mean±SD)Hzの自発的発火活動が見られた。いくつかの実験では、電流クランプモードでの振動を阻止するために、誘起反応を得る前に膜を過分極化した。
図2は、実験開始時における脳神経細胞の微分干渉像(a)、Fura-2注入後の蛍光像(b)を示す。細胞内全体にFura-2が分散していることが分かる。
図3は、膜電位の時間変動波形(a)、式(1)に基づき推定したカルシウムイオン濃度の時間変動(b)、波長λ1=340nmで励起したときの蛍光強度R1(c)、波長λ2=380nmで励起したときの蛍光強度R2(d)、蛍光強度比R1/R2(e)を示す。なお、上述したように、本実験ではデジタルCCDカメラ24からパソコン26への蛍光画像の伝送速度を50~80(frame/秒)に設定したが、この図3のみ、伝送速度を8~22(frame/秒)に設定した場合の例を示す。
ここで、図3の各図に記載されている「遅れ時間」について説明する。本実験で用いたデジタルCCDカメラ24で蛍光画像を取得する際には露光時間が必要となる。このため、波長λ1=340nm及び/又は波長λ2=380nmの励起光を当てて蛍光画像を取得する際、露光時間の分だけそれぞれ遅れ時間が生じる。この遅れ時間は、デジタルCCDカメラ24のフレーム毎に15~30ms(ミリ秒)程度である。一方、2波長で励起したときの蛍光画像に基づく蛍光強度比R(R1/R2)の計算はDSP23上で行われる。このため、DSP23のサンプリング周期(20~40kHz)が、蛍光強度比Rの計算の遅れ時間(25~50μs)となる。
これら全ての遅れ時間を合計した時間が細胞内カルシウムイオン濃度を推定するために要する時間となる。つまり、膜電位測定に対してカルシウムイオン濃度の推定は、30~60msの遅れ時間が生じる。
通常、画像の伝送速度と遅れ時間の積は約1になる。従って、画像の伝送速度を50~80 frame/秒に設定した場合の遅れ時間は、1波長計測では約12.5~20msとなり、2波長計測では2フレーム分であるため25~40msとなる。
通常、画像の伝送速度と遅れ時間の積は約1になる。従って、画像の伝送速度を50~80 frame/秒に設定した場合の遅れ時間は、1波長計測では約12.5~20msとなり、2波長計測では2フレーム分であるため25~40msとなる。
DSP23では、試料細胞の膜電位の測定値と、それに対して遅れ時間の分だけ後に得られたカルシウムイオン濃度の測定値から、上述の式(1)に基づき注入電流を合成するように設定する。ただし、現時点のカルシウムイオン濃度の測定値から将来のカルシウムイオン濃度を推定し、その推定値と試料細胞の膜電位の測定値から注入電流を合成するようにしても良い。
図4は、カルシウムイオン濃度依存性カリウムイオンチャネルであるSKチャネル電流を試料細胞に注入したときの膜電位の時間変動波形(A)、注入電流(B)、細胞内のカルシウムイオン濃度(C)を示す。SKチャネルは単純な動態を持つイオンチャネルとして知られており、SKチャネルの数理モデルでは、式(1)中、m1=0、m2=0、m3=1となる。
図4には、SKチャネル電流を一定にした対照実験の結果(図中、「Control」と示す。以下、「対照群」ともいう。)、膜電位とカルシウムイオン濃度からSKチャネル電流を合成し、その合成電流を注入した実験結果(図中、「+Isk」と示す。)、カルシウムイオン濃度を一定(80nM)にしてSKチャネル電流を合成し、その合成電流を注入した実験結果(図中、「Ca signal off」と示す。従来の電流注入法に相当する)をそれぞれ示している。
図4に示すように、カルシウムイオン濃度を一定にしてSKチャネル電流を求めた場合の膜電位やカルシウムイオン濃度の変動波形は対照実験の結果に類似しているのに対して、膜電位とカルシウムイオン濃度からSKチャネル電流を求めた場合は、対照群と大きく異なっていた。このことから、本実施例の電気生理測定装置及び方法では、より実際に近い状態での細胞応答を測定できることが分かる。
図5A~5Cは、ドーパミンニューロンの発火現象に対するアパミンの効果を示す。アパミンは、前述したようにSK電流を遮断する作用を有している。図5Aは対照群(a)、20nMのアパミン処置群(b)、100nMのアパミン処置群(c)における、ステップパルス電流(100pA)の注入後の膜電位の変化を示す。図5Aの(c)に示すように、100nMのアパミン存在下では不規則なバースト的発火活動(irregular bursting)がみられたが、対照群(a)或いは20nMのアパミン処置群(b)では規則的で単一スパイク発火(regular single spiking)がみられた。100nMのアパミンの存在により、各スパイクの後に続くネガティブ電圧ピークが増加し、sAHP(スパイク後の緩慢な過分極、spike afterhyperpolarization)が小さくなった。加えて、各スパイクのピーク値が減少した。
図5B及び図5Cは、20nMのアパミン存在下におけるSK電流の注入によるsAHP波形に対する影響を示す。尚、図5Bの(b)に示したカルシウムイオン濃度は記録した膜電位を数理モデルに代入して求めたものであり、図5Cの(b)に示したカルシウムイオン濃度は、蛍光イメージングから求めたものである。
これら図5B(a)及び図5C(a)に示すように、20nMのアパミン存在下ではSK電流の注入によりsAHPが減少し、その結果、各スパイクの後に続くネガティブな電圧ピークが減少した。
これら図5B(a)及び図5C(a)に示すように、20nMのアパミン存在下ではSK電流の注入によりsAHPが減少し、その結果、各スパイクの後に続くネガティブな電圧ピークが減少した。
図5B(b)及び図5C(b)に示すように、数理モデルを用いて求めたカルシウムイオン濃度と蛍光イメージングにより求めたカルシウムイオン濃度は同様の結果を示した。しかし、図5C(b)から明らかなように、時間分解能の制約から、本発明のイメージングシステムを用いてカルシウムイオン濃度の振動性の細かな変化を観察することは容易ではなかった。
図5B(c)及び図5C(c)に示すSKコンダクタンスは、カルシウムイオン濃度の変化に基づき下記のHillの式(6)を用いて算出した(Hill係数n=4)。

ここで、g- sk及びKmは最大SK値及び解離定数をそれぞれ示す。
ここで、g- sk及びKmは最大SK値及び解離定数をそれぞれ示す。
図5B(d)及び図5C(d)は、ダイナミッククランプ法を用いてカルシウムイオン濃度から求めたSK電流を示す。数理モデルを用いて求めたカルシウムイオン濃度、及び蛍光イメージングにより求めたカルシウムイオン濃度を用いて得られたSK電流の変化はよく似た傾向を示すことが分かる。
尚、上記した実施例ではイオンチャネルを例に挙げて説明したが、シナプスのレセプターの応答を測定する場合にも本発明の電気生理測定装置及び方法を適用することができる。この場合、シナプスを流れる電流(シナプス電流)は、細胞膜の膜電位、神経伝達物質の濃度から、細胞膜の膜電流に関する数理モデルに基づき合成すると良い。
また、電気生理応答に関与する細胞内物質としては、例えばイオンチャネルの開放に応じて当該チャネルを透過するイオン(カルシウムイオン、カリウムイオン、ナトリウムイオン等)、シナプスのレセプターにリガンドが結合することに応じて該レセプターを透過するイオンやシナプスから放出される神経伝達物質、細胞内シグナル伝達系で重要なcAMP等が挙げられる。
上記実施例では、細胞内物質が結合することにより励起エネルギーが変化する蛍光色素としてFura-2を用いたが、これ以外の蛍光色素を用いても良い。Fura-2以外の蛍光色素の例として、細胞内pHの計測に用いられるBCECF(2波長励起1波長蛍光)やC-SNARF-1(1波長励起2波長蛍光)が挙げられる。また、電気生理応答に関与する細胞内物質が2種類以上ある場合は、各物質に対応する蛍光色素を試料細胞に注入するようにしても良い。試料細胞に2種類以上の蛍光色素を同時に注入する場合は、互いに干渉しない蛍光色素を選択する必要があるが、このようにすると2種類以上の細胞内物質濃度を同時に測定することができる。
さらに、本発明の電気生理測定装置及び方法は、神経細胞や心筋細胞等、活動電位を発生し、興奮膜を持つ細胞全てを試料細胞とすることができる。
上記実施例では、細胞内物質が結合することにより励起エネルギーが変化する蛍光色素としてFura-2を用いたが、これ以外の蛍光色素を用いても良い。Fura-2以外の蛍光色素の例として、細胞内pHの計測に用いられるBCECF(2波長励起1波長蛍光)やC-SNARF-1(1波長励起2波長蛍光)が挙げられる。また、電気生理応答に関与する細胞内物質が2種類以上ある場合は、各物質に対応する蛍光色素を試料細胞に注入するようにしても良い。試料細胞に2種類以上の蛍光色素を同時に注入する場合は、互いに干渉しない蛍光色素を選択する必要があるが、このようにすると2種類以上の細胞内物質濃度を同時に測定することができる。
さらに、本発明の電気生理測定装置及び方法は、神経細胞や心筋細胞等、活動電位を発生し、興奮膜を持つ細胞全てを試料細胞とすることができる。
10…電気生理測定装置
12…試料細胞
14…記録用チャンバ
16…ガラス電極
22…アナログ/デジタル変換器
23…デジタルシグナルプロセッサ(DSP)
24…デジタルCCDカメラ
26…パーソナルコンピュータ
12…試料細胞
14…記録用チャンバ
16…ガラス電極
22…アナログ/デジタル変換器
23…デジタルシグナルプロセッサ(DSP)
24…デジタルCCDカメラ
26…パーソナルコンピュータ
Claims (4)
- 細胞に刺激を加えたときの当該細胞の電気生理応答を測定する電気生理測定装置であって、
a) 試料細胞の膜電位を連続的に測定する膜電位測定手段と、
b) 前記試料細胞内の電気生理応答に関与する物質の濃度を連続的に測定する濃度測定手段と、
c) 前記電気生理応答に関与する物質濃度と前記試料細胞の膜電位から、細胞膜の膜電流に関する複数のパラメータを含む数理モデルに基づき、膜電流を算出する膜電流算出手段と、
d) 算出した膜電流を前記試料細胞に実時間で注入する電流注入手段と
を備えることを特徴とする電気生理測定装置。 - 前記試料細胞の電気生理応答が、膜電位に依存するイオンチャネルの開閉であり、
前記電気生理応答関与物質が陽イオン又は/及び陰イオンであることを特徴とする請求項1に記載の電気生理測定装置。 - 前記電気生理応答関与物質が結合することにより励起エネルギーが変化する少なくとも1種の蛍光色素を前記試料細胞内に注入する手段を備え、
前記濃度測定手段は、前記蛍光色素を所定の励起波長で励起したときの発光エネルギーをそれぞれ測定する手段と、前記発光エネルギーから前記電気生理応答関与物質濃度を算出する算出手段とから構成されることを特徴とする請求項1又は2に記載の電気生理測定装置。 - a) 所定の刺激によって一定の電気生理学的応答を示す試料細胞を準備する工程と、
b) 前記試料細胞の膜電位を連続的に測定し、記録する工程と、
c) 前記試料細胞内の細胞内物質濃度を連続的に測定し、記録する工程と、
d) 前記膜電位及び前記細胞内物質濃度から、細胞膜の膜電流に関する複数のパラメータを含む数理モデルに基づき膜電流を算出する工程と、
e) 算出した膜電流を前記試料細胞に実時間で注入する工程と
を備えることを特徴とする電気生理測定方法。
Applications Claiming Priority (2)
| Application Number | Priority Date | Filing Date | Title |
|---|---|---|---|
| JP2010-032646 | 2010-02-17 | ||
| JP2010032646 | 2010-02-17 |
Publications (1)
| Publication Number | Publication Date |
|---|---|
| WO2011102226A1 true WO2011102226A1 (ja) | 2011-08-25 |
Family
ID=44482819
Family Applications (1)
| Application Number | Title | Priority Date | Filing Date |
|---|---|---|---|
| PCT/JP2011/052164 Ceased WO2011102226A1 (ja) | 2010-02-17 | 2011-02-02 | 電気生理測定装置及び方法 |
Country Status (1)
| Country | Link |
|---|---|
| WO (1) | WO2011102226A1 (ja) |
Citations (1)
| Publication number | Priority date | Publication date | Assignee | Title |
|---|---|---|---|---|
| JP2005269987A (ja) * | 2004-03-25 | 2005-10-06 | National Institute Of Advanced Industrial & Technology | 神経回路網電気活動調整装置 |
-
2011
- 2011-02-02 WO PCT/JP2011/052164 patent/WO2011102226A1/ja not_active Ceased
Patent Citations (1)
| Publication number | Priority date | Publication date | Assignee | Title |
|---|---|---|---|---|
| JP2005269987A (ja) * | 2004-03-25 | 2005-10-06 | National Institute Of Advanced Industrial & Technology | 神経回路網電気活動調整装置 |
Non-Patent Citations (6)
Similar Documents
| Publication | Publication Date | Title |
|---|---|---|
| Dindas et al. | AUX1-mediated root hair auxin influx governs SCFTIR1/AFB-type Ca2+ signaling | |
| Beurg et al. | Variable number of TMC1-dependent mechanotransducer channels underlie tonotopic conductance gradients in the cochlea | |
| Harvey et al. | Locally dynamic synaptic learning rules in pyramidal neuron dendrites | |
| Verhoog et al. | Layer-specific cholinergic control of human and mouse cortical synaptic plasticity | |
| Levy et al. | Circuit asymmetries underlie functional lateralization in the mouse auditory cortex | |
| Ruiz et al. | Presynaptic GABAA receptors enhance transmission and LTP induction at hippocampal mossy fiber synapses | |
| Kanichay et al. | Synaptic and cellular properties of the feedforward inhibitory circuit within the input layer of the cerebellar cortex | |
| Cangiano et al. | The photovoltage of rods and cones in the dark‐adapted mouse retina | |
| Lee et al. | Improving a genetically encoded voltage indicator by modifying the cytoplasmic charge composition | |
| Klett et al. | Intracellular chloride regulation in AVP+ and VIP+ neurons of the suprachiasmatic nucleus | |
| Canepari et al. | Imaging inhibitory synaptic potentials using voltage sensitive dyes | |
| Anderzhanova et al. | Brain microdialysis and its applications in experimental neurochemistry | |
| Yoo et al. | Long-term intracellular recording of optogenetically-induced electrical activities using vertical nanowire multi electrode array | |
| Johannsmeier et al. | Gold nanoparticle-mediated laser stimulation induces a complex stress response in neuronal cells | |
| Kisnieriene et al. | Electrical signalling in Nitellopsis obtusa: potential biomarkers of biologically active compounds | |
| Bohmbach et al. | An astrocytic signaling loop for frequency-dependent control of dendritic integration and spatial learning | |
| Milojkovic et al. | Initiation of sodium spikelets in basal dendrites of neocortical pyramidal neurons | |
| Zhang et al. | Comparison of fluorescence biosensors and whole-cell patch clamp recording in detecting ACh, NE, and 5-HT | |
| Rong et al. | Imaging sodium flux during action potentials in neurons with fluorescent nanosensors and transparent microelectrodes | |
| Leybaert et al. | Intercellular calcium signaling and flash photolysis of caged compounds: a sensitive method to evaluate gap junctional coupling | |
| Lin et al. | Dynamics of volume‐averaged intracellular Ca2+ in a rat CNS nerve terminal during single and repetitive voltage‐clamp depolarizations | |
| George et al. | Auditory Hair Cell Mechanotransduction Channels Dynamically Shape the Mechanical Properties of Their Membrane Environment | |
| Ando et al. | Photogeneration of membrane potential hyperpolarization and depolarization in non-excitable cells | |
| Blakemore et al. | Zinc released from olfactory bulb glomeruli by patterned electrical stimulation of the olfactory nerve | |
| Hussain et al. | Spontaneous calcium transients in hair cell stereocilia |
Legal Events
| Date | Code | Title | Description |
|---|---|---|---|
| 121 | Ep: the epo has been informed by wipo that ep was designated in this application |
Ref document number: 11744514 Country of ref document: EP Kind code of ref document: A1 |
|
| NENP | Non-entry into the national phase |
Ref country code: DE |
|
| 122 | Ep: pct application non-entry in european phase |
Ref document number: 11744514 Country of ref document: EP Kind code of ref document: A1 |
|
| NENP | Non-entry into the national phase |
Ref country code: JP |