WO2010144192A1 - Prognosis indicators for solid human tumors - Google Patents
Prognosis indicators for solid human tumors Download PDFInfo
- Publication number
- WO2010144192A1 WO2010144192A1 PCT/US2010/033755 US2010033755W WO2010144192A1 WO 2010144192 A1 WO2010144192 A1 WO 2010144192A1 US 2010033755 W US2010033755 W US 2010033755W WO 2010144192 A1 WO2010144192 A1 WO 2010144192A1
- Authority
- WO
- WIPO (PCT)
- Prior art keywords
- genes
- cin
- mrna expression
- cancer
- mts
- Prior art date
- Legal status (The legal status is an assumption and is not a legal conclusion. Google has not performed a legal analysis and makes no representation as to the accuracy of the status listed.)
- Ceased
Links
Classifications
-
- C—CHEMISTRY; METALLURGY
- C12—BIOCHEMISTRY; BEER; SPIRITS; WINE; VINEGAR; MICROBIOLOGY; ENZYMOLOGY; MUTATION OR GENETIC ENGINEERING
- C12Q—MEASURING OR TESTING PROCESSES INVOLVING ENZYMES, NUCLEIC ACIDS OR MICROORGANISMS; COMPOSITIONS OR TEST PAPERS THEREFOR; PROCESSES OF PREPARING SUCH COMPOSITIONS; CONDITION-RESPONSIVE CONTROL IN MICROBIOLOGICAL OR ENZYMOLOGICAL PROCESSES
- C12Q1/00—Measuring or testing processes involving enzymes, nucleic acids or microorganisms; Compositions therefor; Processes of preparing such compositions
- C12Q1/68—Measuring or testing processes involving enzymes, nucleic acids or microorganisms; Compositions therefor; Processes of preparing such compositions involving nucleic acids
- C12Q1/6876—Nucleic acid products used in the analysis of nucleic acids, e.g. primers or probes
- C12Q1/6883—Nucleic acid products used in the analysis of nucleic acids, e.g. primers or probes for diseases caused by alterations of genetic material
- C12Q1/6886—Nucleic acid products used in the analysis of nucleic acids, e.g. primers or probes for diseases caused by alterations of genetic material for cancer
-
- C—CHEMISTRY; METALLURGY
- C12—BIOCHEMISTRY; BEER; SPIRITS; WINE; VINEGAR; MICROBIOLOGY; ENZYMOLOGY; MUTATION OR GENETIC ENGINEERING
- C12Q—MEASURING OR TESTING PROCESSES INVOLVING ENZYMES, NUCLEIC ACIDS OR MICROORGANISMS; COMPOSITIONS OR TEST PAPERS THEREFOR; PROCESSES OF PREPARING SUCH COMPOSITIONS; CONDITION-RESPONSIVE CONTROL IN MICROBIOLOGICAL OR ENZYMOLOGICAL PROCESSES
- C12Q2600/00—Oligonucleotides characterized by their use
- C12Q2600/106—Pharmacogenomics, i.e. genetic variability in individual responses to drugs and drug metabolism
-
- C—CHEMISTRY; METALLURGY
- C12—BIOCHEMISTRY; BEER; SPIRITS; WINE; VINEGAR; MICROBIOLOGY; ENZYMOLOGY; MUTATION OR GENETIC ENGINEERING
- C12Q—MEASURING OR TESTING PROCESSES INVOLVING ENZYMES, NUCLEIC ACIDS OR MICROORGANISMS; COMPOSITIONS OR TEST PAPERS THEREFOR; PROCESSES OF PREPARING SUCH COMPOSITIONS; CONDITION-RESPONSIVE CONTROL IN MICROBIOLOGICAL OR ENZYMOLOGICAL PROCESSES
- C12Q2600/00—Oligonucleotides characterized by their use
- C12Q2600/158—Expression markers
-
- G—PHYSICS
- G01—MEASURING; TESTING
- G01N—INVESTIGATING OR ANALYSING MATERIALS BY DETERMINING THEIR CHEMICAL OR PHYSICAL PROPERTIES
- G01N2800/00—Detection or diagnosis of diseases
- G01N2800/52—Predicting or monitoring the response to treatment, e.g. for selection of therapy based on assay results in personalised medicine; Prognosis
Definitions
- the present teachings relate generally to the field of cancer diagnostics and treatment, and more specifically to the determination of a likelihood that the outcome of a treatment using microtubule stabilizing drags and/or carboplatin will be successful.
- Solid tumors can be treated chemotherapeutically, radiologically, surgically, or with a combination of these therapies.
- Each therapy produces undesirable side effects, which may be extensive enough that some patients cannot complete the course of treatment.
- the side effects of cancer therapy also have a severe impact on the quality of life of these patients.
- the present teachings provide a method for determining likelihood of clinical outcome based on the malignancy of the tumor.
- the present teachings relate to methods for predicting the outcome of the treatment of solid human tumors.
- the methods generally include measuring in a particular solid tumor cancer type the degree of chromosomal abnormalities and/or the expression levels of a large number of genes; identifying a subset of the measured genes characteristic of chromosomal instability (CIN); and determining in clinical samples whether the CIN signature accurately predicts the outcome of the treatment of the solid tumor.
- the methods can include the use of the CIN signature to analyze a tumor of a patient to determine the prognosis of the cancer and whether treatment is likely to be successful.
- the treatment can involve administration of microtubule stabilizing (MTS) agents, such as taxanes, or carboplatin.
- MTS microtubule stabilizing
- the present teachings also relate to optimizing therapeutic efficacy for treatment of a tumor.
- the methods can include measuring in a particular solid tumor cancer type the expression levels of a set of genes characteristic of chromosomal instability (CIN), and determining whether one or more microtubule stabilizing (MTS) agents or carboplatin should be administered to a patient for treatment of a tumor in the patient.
- CIN chromosomal instability
- MTS microtubule stabilizing
- carboplatin carboplatin
- the results of the CIN signature analysis may predict that taxane treatment is unlikely to be successful in treating a tumor.
- the methods may include administering one or more non-taxane drugs, e.g., DNA alkylating agents, to the patient in the treatment of the tumor.
- the present teachings provide a method of predicting the clinical outcome of treating a patient having a tumor using one or more microtubule stabilizing (MTS) drugs.
- the method can include the steps of measuring, in a sample comprising a tumor cell from a patient, the mRNA expression levels of at least 10 of the following genes:
- Gene expression levels can be measured using any suitable methods, including, for example, using a microarray or polymerase chain reaction (PCR) (e.g., quantitative PCR, such as real-time PCR).
- PCR polymerase chain reaction
- the mRNA expression levels of more than 10 genes are measured.
- the mRNA expression levels of 10, 15, 20, or all 22 genes can be measured.
- the method can include the step of administering a suitable MTS drug to the patient.
- the method also can include the step of measuring mRNA expression levels at one or more times after administration of the MTS drug to the patient.
- the present teachings can be used with any MTS drug or drugs, such as taxanes (e.g., paclitaxel or docetaxel) and epothilones.
- the statistical measure of the mRNA expression level of the measured genes is a linear combination of the mRNA expression level of the genes.
- the linear combination of the mRNA expression level of the genes is the mean of logarithms of the mRNA expression levels.
- the linear combination of the mRNA expression level in the set of genes is a combination of weighted mRNA expression levels.
- the tumor is a solid tumor, including, by non- limiting example, breast cancer, ovarian cancer, colorectal cancer, lung cancer, prostate cancer, medulloblastoma, glioma, and lymphoma.
- the present teachings also provide a method of selecting a treatment for a patient having a tumor.
- the method can include the steps of measuring, in a sample comprising a tumor cell from a patient, the mRNA expression levels of at least 15 genes of the following set of genes:
- Gene expression levels can be measured using any suitable methods, including, for example, using a microarray or PCR (e.g., quantitative PCR, such as real-time PCR).
- the mRNA expression levels of more than 15 genes are measured.
- the mRNA expression levels of 20, 25, 30, 35, 40 or 50 more genes can be measured.
- gene expression levels are measured before onset of paclitaxel or carboplatin drug treatment.
- the method can include the step of administering carboplatin or recommending administration of carboplatin to the patient.
- the statistical measure of the mRNA expression level of the measured genes is a linear combination of the mRNA expression level of the genes.
- the linear combination of the mRNA expression level of the genes is the mean of logarithms of the mRNA expression levels.
- the linear combination of the mRNA expression level in the set of genes is a combination of weighted mRNA expression levels.
- the method comprises measuring, in a sample comprising a tumor cell from a patient, the mRNA expression level of at least 25 genes in the following set of genes:
- the solid tumor is of a cancer selected from lung cancer, prostate cancer, medulloblastoma, glioma, breast cancer, and lymphoma. In certain embodiments, the solid tumor is of a cancer selected from breast cancer, ovarian cancer, and colorectal cancer.
- the statistical measure of the mKNA expression level of the measured genes is a linear combination of the mRNA expression level of the genes in the set of genes. In particular embodiments, the linear combination of the mRNA expression level in the set of genes is a combination of weighted mRNA expression levels.
- the linear combination of the mRNA expression level in the set of genes is the mean of the logarithm of each of the mRNA expression levels.
- the statistical measure of the mRNA expression level of the measured genes is elevated relative to the mRNA expression level of the measured genes from a tumor whose prognosis is good.
- the present teachings relate to a method for predicting outcome of the treatment of the human solid tumors.
- the method generally includes the steps of measuring, in a sample comprising the cells of a tumor from a patient, the mRNA expression level of a set of genes (or subset of a gene set) whose change is related to chromosomal instability; taking a statistical measure of the mRNA expression level of the set of measured genes; and if the statistical measure of the mRNA expression level of the set of measured genes is elevated, determining that the prognosis for treatment with a MTS drug is poor.
- the present teachings relate to a method for predicting the outcome of the treatment of human solid tumors with taxanes such as paclitaxel.
- the method can include measuring, in a sample comprising the cells of a tumor from a patient, the mRNA expression level of the followin enes or a subset thereof):
- chromosomal instability can be measured by array comparative genomic hybridization (aCGH) and/or counting the number of morphologically visible chromosomal aberrations by the application of chromosome visualization methods such as spectral karyotyping (SKY). Such techniques can be used in conjunction with mRNA expression levels or to correlate and/or corroborate expression levels.
- aCGH array comparative genomic hybridization
- SKY spectral karyotyping
- Analytical results and/or measurements described herein, including expression level data can be displayed, transmitted, or outputted to a user interface device, a computer readable storage medium, or a local or remote computer system.
- Displaying or outputting a result or measurement means that the results of any of the analyses described herein are communicated to a user using any medium, such as for example, orally, writing, visual display etc., computer readable medium or computer system. It will be clear to one skilled in the art that outputting the result is not limited to outputting to a user or a linked external component(s), such as a computer system or computer memory, but may alternatively or additionally be outputted to internal components, such as any computer readable medium.
- Computer readable media may include, but are not limited to hard drives, floppy disks, CD-ROMs, DVDs 3 and DATs. Computer readable media does not include carrier waves or other wave forms for data transmission. It will be clear to one skilled in the art that the taking of a statistical measure as disclosed and claimed herein generally is computer-implemented, but the displaying or outputting step can include communicating to a person orally or in writing.
- Another aspect of the present teachings is a set of genes or data from a set of genes, e.g., expression level data, useful in determining the outcome of treatment of solid tumors.
- the set of genes comprises or consists essentially of: or
- Data derived from a set of genes can include the expression level measurement of each of the genes in the set or for a subset of genes in a gene set as well as other measurements related to the genes as described herein.
- the data of the other measurements can be independent of the expression levels. Further, such data can be contained (e.g., stored) on a computer readable medium.
- Figure 1 shows that genes over-expressed in tumors with CIN are repressed by MTS treatment in vitro and in vivo:
- (a) The CIN27wp gene expression signature, which correlates with total functional aneuploidy in several cancer types (Carter, et al., (2006) Nat Genet, 38:1043-1048), was analyzed in five gene expression data sets measuring response to MTS treatment. The distribution of changes induced by MTS was lower in CIN27WP genes (red) than in the set of all measured genes (black) (P 3.3e-7).
- Figures 2a-b show that siRNA silencing of MTS repressed genes impairs cell viability and promotes cell death: (a) Genes repressed within the two MTS expression signatures that are over-expressed in CIN tumors significantly alter HCT- 116 cell viability when targeted by siRNA. The Acumen eX3 cytometer (Acumen TTP Labtech) was used to quantify viable cells 72 hours after siRNA transfection. SDs are displayed for 3 independent experiments.
- FIG. 2c-d describe the identification of 22 CEST survival genes and provide a flowchart of analysis resulting in the derivation of the 22 CIN-survival genes:
- (c) Cells were transfected with siRNA targeting the 50 genes overexpressed in CIN rumors and repressed by MTS agents. Cell viability was quantified by cell titer blue assay 4 days after siRNA transfection in triplicate. Shown are the 22 genes which significantly impair viability in MDA-MB-468, A549 and HCT- 116 cell lines; (d) the binomial test with probability correction (BTPC) and rank methods were used to derive two MTS expression signatures. 50 genes were repressed in the MTS signatures and overexpressed in CIN tumors. 22/50 genes impaired cancer cell viability and/or induced apoptosis when silenced by RNA interference in 3 cancer cell lines: HCT-116 (colon), A549 (NSCLC) and MDA-MB-468 (breast).
- Figure 3a describes the quantification of gene repression following paclitaxel treatment of cell lines with increasing chromosomal numerical heterogeneity.
- Fold change in gene expression post-paclitaxel treatment (24hrs) relative to expression in vehicle control treated cells was determined by qPCR analysis (normalization to 18S and GAPDH) following 24hrs of paclitaxel treatment (50% of the Gi50 concentration) in 3 biological replicate experiments in cell lines with increasing CIN.
- Colour coding represents the mean fold change in gene expression of 3 biological replicates relative to cells treated with vehicle alone +1SD.
- MTS repressed genes inducing a significant reduction in cell viability when silenced by siRNA compared to control transfected cells are highlighted in grey.
- Gene expression following paclitaxel treatment is compared to the HCT-116 cell line displaying the lowest CIN. The significance of the differences in gene expression determined using the unpaired two-sided Student T test: * P value ⁇ 0.05, ** P value ⁇ 0.005.
- Figure 3b shows that CIN-survival genes are relatively over-expressed in CIN high CQLO205 and SW620 cells compared to near diploid CIN low HCT-116. Relative quantification of gene expression normalised to 18S and GAPDH in COLO205 and SW620 cells compared to near diploid HCT-116 cells. Graph shows the mean fold change in gene expression compared to HCT-116 cells of 3 biological replicates (+ ISD).
- Figure 3c shows that colorectal cancer cell lines with increasing chromosomal numerical heterogeneity uncouple mitotic arrest from cell death.
- Cell lines were treated with paclitaxel relative to the Gi50, Gi50/2 and Gi50/4 concentrations. Quantification of dying cells (SubGl fraction) and cells arrested in mitosis (MPM2 positive fraction) were assessed by FACS analysis. The MPM2/SubGl ratio was calculated by assessing the percentage change in MPM2 and SubGl cells relative to vehicle control treated cells 24 hours following paclitaxel treatment. The mean ratio of 3 independent experiments is presented (+1SD). Cell lines are represented in ascending order of CIN status (Roschke, et al, (2003) Cancer Res, 63:8634-8647).
- Figure 3d shows that silencing CIN-survival genes in the S W620 CIN high cell line promotes cell death following 24 hours of paclitaxel Gi50 treatment. Forty- eight hours following transfection of CIN-survival siRNAs, SW620 cells were treated with paclitaxel for 24 hours and cells prepared and analyzed as for Figure 3c. The mean MPM2/SubGl ratio of two independent experiments is presented (+1SD).
- Figure 3e shows impaired repression of CIN-survival genes following paclitaxel treatment in an isogenic models of CIN: Quantification of gene repression by qPCR analysis of 21 CIN survival genes following treatment of HCT-116 wild type parental cells and isogenic Mad2+/- cells following 24 hours of paclitaxel treatment (5OnM) normalised to 18s. Colour coding represents the mean fold repression + 1 SD from 3 biological replicates. P values indicate significantly greater gene repression in the HCT-116 parental cell line (Student one sided T-test).
- Figure 3f shows that CIN survival gene repression correlates with cytotoxic response and stable tumor karyotype.
- Figure 4a shows that expression of CIN70 genes determines sensitivity to paclitaxel and carboplatin.
- Figure 4b shows that residual CIN expression post-treatment is higher in paclitaxel-resistant compared to paclitaxel-sensitive tumors.
- Figure 4c shows that expression of CIN and CIN-survival genes is greater in aneuploid, genomically unstable breast cancers.
- DNA image cytometry was used to classify breast cancers as diploid, genomically stable (dGS), aneuploid, genomically stable (aGS) or aneuploid, genomically unstable (aGU). Box plots summarize the expression of the CIN70, CIN27wp and CIN-survival signatures within each group. P values were calculated using the Student two-tailed T test.
- Figure Sl shows the results of binomial test with probability correction MTS expression signature demonstrating the most significant repressed and expressed genes following MTS exposure in the 5 datasets. Shown are heatmaps reflecting gene expression changes with Iog2 fold change values of significantly up (red)- or down (green)-regulated genes in the rows and tumor cell line datasets in the columns, both sorted by hierarchical clustering with euclidean distance (www.bioconductor.org). White cells indicate that this gene was not included on the microarray or removed in the filtering step prior to the meta-analysis.
- Figure S2 shows the results of binomial test with probability correction MTS expression signature demonstrating the most significant repressed and expressed genes following 5-FU exposure in the 3 datasets.
- Figure S3a summarizes repression of genes by MTS using two meta- analysis methods which are over-expressed in the top 15% of genes expressed in CIN tumors with proliferation genes removed (10).
- List of 50 genes repressed in the MTS expression signatures derived from the two methods that are over-expressed in CIN tumors as part of the CESf signature were chosen for further functional analysis using RNA interference.
- Figure S3b describes the validation of MTS expression signature repressed genes in HCT-116 colorectal cancer cell line.
- Fold change in gene expression (+/- ISD) determined by TLDA qPCR analysis of genes normalised to 18s RNA expression derived from the two MTS expression signatures following 24hrs of Paclitaxel treatment (5OnM) in 3 biological replicate experiments compared to gene expression in vehicle (DMSO) control treated HCT- 116 cells.
- 5OnM Paclitaxel treatment
- DMSO vehicle
- BBC3/Puma a known taxane induced gene derived from our meta-signature and LAMP2 and WDFYl (genes whose expression is not influenced by taxane exposure Swanton and Downward unpublished data) were used as controls.
- Figure S4a shows that MTS repressed genes promote aneuploidy and cell death when silenced by siRNA. Genes repressed within the two MTS expression signatures that are over-expressed in CIN tumors significantly increase the fraction of aneuploid cells assessed by Acumen and flow cytometry when silenced using RNAi. CIN survival genes are highlighted in grey. Colour coding: Lower limit of SD of mean percentage of aneuploid cells from 3 independent experiments is greater than mean aneuploid population in control transfected cells +2 SDs (light grey) or +3 SDs (dark grey) from 3 independent experiments. [0042] Figure S4b shows deconvolution of siKNA smartpools and assessment of cell viability.
- Figure S4c assesses target silencing. Fast SYBR green real-time PCR quantification of target silencing (+1SD from 3 independent transfections) was confirmed 72 hours following transfection of HCT-116 cells with siRNAs conferring an effect on cell viability, cell death or aneuploidy compared to gene expression in non-targeting control siRNA transfected cells.
- Figure S5a illustrates quantification of gene repression following paclitaxel treatment of MCF-7 and BT549 cell lines.
- Fold change in gene expression post-paclitaxel treatment (24hrs) relative to expression in vehicle control treated cells was determined by TaqMan qPCR analysis (normalization to GAPDH) following 24hrs of paclitaxel treatment (concentration 50% of the Gi50 dose) in 3 biological replicate experiments in the MCF-7 (CTN low ) and the BT549 (CIN hiBh ) breast cancer cell lines.
- Colour coding represents the mean fold change in gene expression of 3 biological replicates relative to cells treated with vehicle alone (+1 standard deviation).
- CESF survival genes are highlighted in grey. Significance of differential gene repression compared to the MCF-7 cell line following paclitaxel treatment is determined by the 2 tailed Student T test: * P value ⁇ 0.05, ** P value ⁇ 0.005.
- FIG. 5b shows that silencing CIN-survival genes in the SW620 CIN high cell line promotes a synergistic increase in cell death following 24 hours of paclitaxel Gi50 treatment compared to DMSO treated cells.
- Forty-eight hours following transfection of CIN-survival siRNAs SW620 cells were treated with paclitaxel for 24 hours and cells prepared and analyzed for SUBGl content by FACS analysis as for Figure 3c. Results of two biological replicates are shown with standard deviation.
- Silencing BRCAl, TOP2A, CDC6, H2AFX and NUP205 promotes a significant increase in SUBGl cells following Paclitaxel exposure compared to DMSO treated cells (p ⁇ 0.05 Student's T Test).
- Figure S5c shows impaired repression of CIN-survival genes following paclitaxel treatment in an isogenic model of CIN, specifically quantification of gene repression following treatment of HCT-116 wild type parental cells compared to HCT-116 isogenic hSecurin (-/-)following 24 hours of paclitaxel treatment (5OnM) normalised to 18s.
- Colour coding represents the mean fold repression + ISD from 3 biological replicates.
- P values (* PO.05) indicate significantly greater gene repression in the HCT-116 parental cell line (one sided Student T-test).
- Figure S5d shows how expression of CIN-survival genes correlates with poorer survival in breast cancer.
- the mean of the logged expression levels of CIN- survival genes was taken as a single prognostic factor and tested as a predictor of outcome in 4 cancer cohorts. Similar to what was reported by Carter et al. (10), patients were divided into two groups with above or below median expression of the CIN-survival gene signature expression and the prognostic effects examined with Kaplan-Meier survival analysis and Cox proportional hazard model.
- Table Ia provides the datasets used to derive the MTS response signature. Cell lines treated with the MTS and author of the study are shown. The type of array used to derive each gene expression signature (cDNA or Affymetrix) together with the number of genes on the platform, the duration and concentration of drug exposure and the number of biological replicates for each experiment are demonstrated.
- Table Ib shows that genes over-expressed in CIN tumors are significantly repressed following MTS treatment across all datasets. Cell cycle regulated genes were removed from the CIN70 signature and the signature of the top 5%
- CIN382WP 10% (CIN826WP) and 15% (CIN1264WP) of over-expressed genes in CIN tumors.
- the empirical frequency distribution of CIN27wp, CIN382WP, CIN826WP and CIN1264WP signature genes was compared to the gene expression changes across all datasets following MTS exposure using the one sided bootstrap Kolmogorov-Smirnov test.
- the test statistic and the p-value for the Kolmogorov- Smirnov test reveals a significant left shift of the empirical frequency distribution of the CIN genes indicating that genes in the CIN signatures are more likely to be repressed following MTS treatment.
- Table 1c shows that genes over-expressed in CIN tumors are significantly repressed in MTS expression signatures but not in a 5-FU signature.
- Genes whose expression is influenced by cell cycle phase (20) were removed from the CIN70 signature and the signature of the top 5% (CDNF382WP) of over-expressed genes in CIN tumors.
- Repression of genes in the CIN signature derived from two MTS metaanalysis signature methods (Rank and Binomial Test with Probability Correction, BTPC) with the number of repressed genes after filtering demonstrated for each meta-analysis method are shown. Three published datasets were used to derive a 5- FU signature using the BTPC method.
- Table demonstrates the level of significance for the representation of MTS or 5-FU-repressed genes in the CIN signature.
- P values indicate the significance of the association of the CIN signature genes within the MTS or 5-FU expression signatures of repressed genes using the one-sided fisher's exact test with the number of genes overlapping with each CIN dataset shown in parenthesis.
- Table 1d shows that repression of CIN genes occurs preferentially in taxane-sensitive xenografts.
- Publicly available expression data deriving from paclitaxel-treated human ovarian cancer xenografts in nude mice (19) were analyzed for repression of genes over-expressed in CIN tumors following paclitaxel treatment.
- the sensitive ovarian cancer cell line (1A9) and its paclitaxel resistant derivative (1A9PTX22) were treated with 60mg/kg of paclitaxel which resulted in tumor responses in 1A9 tumors but not in 1 A9PTX22 xenografts.
- P-values are given for the Kolmogorov-Smirnov test comparing the distribution of genes over-expressed in the CIN signature (with proliferation genes excluded) with the distribution of genes having a negative fold change in ovarian cancer xenografts following paclitaxel treatment of nude mice.
- CIN genes are significantly repressed in taxane sensitive ovarian cancer xenografts, but not in the paclitaxel-resistant xenograft model.
- Table 2 demonstrates the Gi50 for each cell line and the concentrations of paclitaxel used in each cell line (nM) relative to the cell line Gi50.
- Table 3 summarizes clinical and experimental parameters in 14 diploid genomic stable (dGS), 14 aneuploid genomic stable (aGS), and 16 aneuploid genomic unstable(aGU) breast carcinomas.
- dGS diploid genomic stable
- aGS aneuploid genomic stable
- aGU 16 aneuploid genomic unstable
- the tumor With respect to the chromosomal complement of a solid human tumor, the tumor exhibits various aberrations such as multiple trisomies, tetrasomy, and multiple translocations and deletions. These aberrations in chromosomal stability are found in solid tumors of the lung, prostate, breast, brain (both medulloblastoma and glioma), ovaries, colon, and lymph nodes (lymphoma).
- chromosome visualization methods such as spectral karyotyping
- aCGH array comparative genomic hybridization
- CGH array comparative genomic hybridization
- chromosomal instability Similarly to aneuploidy, its causative mechanism, CIN is also associated with malignancies. High levels of CIN are expected to confer a more malignant phenotype.
- the expression "level" of a gene can be determined by any method known in the art which measures gene expression products, including, but not limited to, mRNA transcripts and proteins. It should be understood that the amount of gene expression levels need not be determined in absolute terms, but can be determined in relative terms.
- a gene expression signature of CIN is derived by the identification of genes with the highest level of correlation between a gene's expression level and the overall level of chromosomal aberrations across a given set of cancer samples.
- the overall level of chromosomal aberrations in a given clinical sample can be derived by any of the three techniques described herein.
- chromosomes can be visualized by spectral karyotyping (SKY) that allows counting the total number of chromosomes and morphological aberrations of chromosomes such as deletions, insertions, translocations, and inversions of various chromosomal regions.
- SKY spectral karyotyping
- the total number of such numerical and morphological aberrations in a cancer cell is used to estimate the overall level of chromosomal aberrations.
- the copy number of each chromosomal region can be measured by array comparative genomic hybridization using microarrays by containing either long cDNA clones targeting the individual chromosomal regions or short DNA probes, such as those used on the so-called single nucleotide polymorphism (SNP) chips.
- the total number of chromosomal aberrations in a cancer sample is calculated by adding up the deviation of each chromosomal region from the normal chromosomal copy number across the entire genome.
- chromosomal copy number changes have a direct impact on the RNA expression level of the genes contained in a given chromosomal region. Therefore, chromosomal copy number changes can be estimated by calculating the net deviation of the expression level of all genes contained in a given chromosomal region relative to the remainder of the sampled transcriptome.
- each probe or probe set was first mapped to its corresponding transcriptome by sequence mapping and then, through this transcript, the microarray probes were mapped to their respective chromosomal cytobands.
- each chromosomal cytoband all of the genes present in the microarray measurement that map to that region are grouped into a set designated B (short for band). In one embodiment, if less than ten genes were mapped to a band, the group was disregarded as statistically unreliable. Although in this embodiment the mapping of genes to the cytobands of the chromosome was used to group the genes, it is contemplated that the grouping of genes into statistically meaningful sets can be accomplished by using windows of equal linear length along the chromosome (5-30 IvIb long) or genes can be grouped by neighborhood criteria (20 to 100 genes that are located next to each other on the same chromosome would form a set of genes for further analysis). Also, although ten genes were considered the minimum number of genes necessary to form a group, it is contemplated that other numbers of genes can be used to determine statistical reliability.
- the rest of the genes i.e., the rest of the transcriptome that is localized somewhere else on the chromosomes and which are measured on the same microarray, are grouped into a set G (short for genome).
- the sets B and G are disjoint.
- the distributions of the genes in B and G are then compared using an appropriate statistical metric, such as the t-statistic.
- the statistical significance of the group of genes was determined by taking the mean of the log to the base ten of the expression level of each gene in the group B and comparing it with the expression level of the genes from group G.
- the statistical metric is formed on a linear combination of the expression level of the genes in the set of genes.
- the expression levels can be weighted.
- Other statistical tests, which can be used include: Wilcoxon-Rank test, Signal to Noise ratio, Kolmogorov-Smirnov test and Kruskal-Wallis test
- the overall level of chromosomal aberrations can be characterized by summing up the level of functional aneuploidy across all chromosomal regions. This novel measure is termed total functional aneuploidy.
- RNA level for typically 10,000-20,000 genes, usually but not exclusively obtained by microarray measurements. In addition to these measurements, the following measures may also be obtained (b) array comparative genomic hybridization across the entire genome and/or (c) a detailed morphological characterization of all chromosomal aberrations.
- each gene in a given cancer data the gene's expression level across all samples will form a gene expression vector.
- the total number of chromosomal aberrations in the individual cancer samples as determined by the total number of morphological aberrations, total number of aCGH based chromosomal copy number deviations and total functional aneuploidy will form three additional vectors. Correlation between each gene expression vector and the three vectors characterizing the overall level of chromosomal aberrations is calculated for all genes.
- the genes with the highest level of correlation to the overall level of chromosomal aberrations will form the CTN gene expression signature.
- a group of expressed genes in a tumor which was difficult to treat showed increased expression relative to tumors which were easier to treat. These genes included:
- the cell population gene expression approaches described herein can be used to predict in advance of treatment in vivo how a tumor may respond to specific cytotoxic drugs, in particular, MTS agents such as taxanes and epothilones, and/or carboplatin.
- MTS agents such as taxanes and epothilones, and/or carboplatin.
- the methods described herein also can be used after commencement of treatment with taxanes, epothilones, or carboplatin, to monitor the tumor's responsiveness to the drugs.
- Taxanes include, for example, docetaxel and paclitaxel.
- Epothilones include, for example, epothilone A, epothilone B, patupilone (EPO906), sagopilone (SH-Y03757A, ZK-EPO), ixabepilone (aza-epothilone B, BMS-247550), epothilone C, KOS-862 (epothilone D), epothilone E, epothilone F, BMS-310705, and KOS-1584 as well as compounds with related microtuble stabilizing activity such as discodermolide, laulimalide, isolaulimalide, taccalonolides and others.
- the application of the present method to multiple datasets indicates that the following genes consistently have increased expression in tumors exhibiting drug resistance to taxanes: 1 BRCAl 9 H2AFX 17 RFC3
- CIN-survival genes were found to be significantly over-expressed in CESI tumors (Carter, et al., (2006) Nat Genet, 38:1043-1048). Data included hereinbelow indicate that cell lines with a high level of CIN (CIN hlgh ) fail to repress these CIN-survival genes following paclitaxel exposure as efficiently as cell lines with a low level of CIN (CIN low ), despite an efficient mitotic arrest in response to paclitaxel treatment, suggesting an uncoupling of mitotic arrest from cell death in CIN lg tumor cells that is associated with an attenuated cytotoxic gene expression program.
- CESf signature can be a surrogate marker of CIN in vivo and that CIN-survival genes are over-expressed in aneuploid, genomically unstable breast cancer. Furthermore, CIN signature expression appears to be greater in residual paclitaxel resistant compared to sensitive tumors, suggesting that there can be a selection pressure for sustaining CIN in paclitaxel resistant tumors. [0079] Intriguingly, aGU tumors are almost exclusively basal-like or Her2-positive breast cancers and analogous to clinical trial data in ovarian cancer described below, might be predicted to be taxane-resistant but platinum-sensitive.
- Her2 expression confers resistance to taxanes that can be reversed by trastuzumab exposure (Yu, et al, (1998) MoI Cell, 2:581-591; Tan, et al., (2002) MoI Cell, 9:993-1004; Lee, et al., (2002) Cancer Res, 62:5703-5710), and in vitro studies of BRCAl associated breast cancers (frequently associated with basal-like phenotype) have demonstrated sensitivity to platinum drugs and taxane resistance (Bhattacharyya, et al., (2000) J Biol Chem, 275:23899-23903; Quinn, et al., (2003) Cancer Res, 63:6221-6228).
- CIN also can provide a "catalyst" promoting acquired drug resistance (Duesberg, et al., (2000) Proc Natl Acad Sci U S A, 97:14295-14300; Duesberg, et al., (2001) Proc Natl Acad Sci U S A, 98:11283- 11288; Farabegoli, et al., (2001) Cytometry, 46:50-56).
- paclitaxel causes repression of CIN-survival genes followed by cell death in diploid cells but not in chromosomally unstable cells.
- CESf appears to be functionally associated with altered intrinsic tumor sensitivity to at least two distinct chemotherapy agents (namely, paclitaxel and carboplatin).
- the expression levels (e.g., mRNA or protein) of a set of genes are utilized to identify patients who potentially will respond favorably to a specific drug treatment and/or patients who potentially will not respond favorably to a specific drug treatment.
- One or more genes in the set of genes is differentially expressed (e.g., overexpressed) in difficult to treat cancers.
- the set of genes comprises or consists essentiall of:
- the accuracy and reliability of a prognosis generally will increase as the number of measured genes in the statistical measure increases.
- the expression of less than all (i.e., a subset) of genes in a given gene set can be measured while still obtaining a clinically acceptable prognosis.
- the expression levels of between about 10 and about 25 genes (e.g., 10, 12, 14, 16, 18, 20, 22, 24 or 25 genes) in a given gene set are measured and, more preferably, between about 22 and about 25 genes in a given gene set are measured.
- a determination is made, for example, a statistical measure, based on the measured gene expressions levels, as to whether a patient is likely to respond to treatment.
- Information about the likelihood of a favorable (or unfavorable) response to drug treatment can be displayed or outputted to a user interface device, a computer readable storage medium, or a local or remote computer system.
- Such information can include, for example, the measured levels of one or more genes, the statistical measure of one or more genes, the likely outcome or prognosis, or an equivalent thereof (e.g., a graph, figure, symbol, etc.).
- Displaying or outputting information means that the information is communicated to a user using any medium, for example, orally, in writing, by visual display computer readable medium, computer system, or other electronic device (e.g., smart phone, personal digital assistant (PDA), laptop, etc.).
- outputting information is not limited to outputting to a user or a linked external component(s), such as a computer system or computer memory, but can alternatively or additionally be outputted to internal components, such as any computer readable medium.
- Computer readable media can include, but are not limited to hard drives, floppy disks, CD-ROMs, DVDs, and DATs. Computer readable media does not include carrier waves or other wave forms for data transmission.
- the various sample evaluation and diagnosis methods disclosed and claimed herein can, but need not be, computer-implemented, and that, for example, the displaying or outputting step can be done by, for example, by communicating to a person orally or in writing (e.g., in handwriting).
- the measured expression levels of one or more genes, the statistical measure of one or more genes, the likely outcome or prognosis, or an equivalent thereof can be displayed on a screen or a tangible medium or can be transmitted to a person in a medical industry, a medical insurance provider, a health care provider, or to a physician.
- the binomial test with probability correction (BTPC) method was used following the application of Entrez Gene IDs to each of the publicly available datasets.
- the BTPC method delivers a number of genes which are differentially expressed across experiments in one direction and which show a significant difference in the expression level compared to control samples.
- the ordinary binomial test was calculated for each gene by using the dichotomized fold change values ("-1" for negative fold change and "1" one positive fold change) and a significance threshold of p ⁇ 0.05.
- Each gene was assessed for differential expression with the moderated t-test, implemented in the lirnma-package in Bioconductor.
- the moderated t-test uses a nonparametric empirical Bayes method to shrink the estimated sample variances towards a pooled estimate, resulting in more stable inference when the number of replicates is small.
- the p values for each gene were calculated and adjusted for multiple testing by calculating a q value (Storey, et al., (2003) Proc Natl Acad Sci U S A, 100:9440-9445).
- the q values were weighted based on a measure of the spread (the inter quartile range).
- a threshold of the weighted mean q values was used, delivering the signature.
- a permutation-based false discovery rate was calculated to control the genes identified by chance alone.
- FDR permutation-based false discovery rate
- the gene identifiers within one dataset were separated from the values and randomly assigned again. In each permutation a number of genes appear, tagged to be significantly differentially expressed although they are identified by chance alone. Ten permutations were performed and for each permutation the FDR was calculated. The arithmetic mean across all FDRs delivers the overall FDR and therefore the percentage of false positives within the significant genes.
- Three other meta-analysis methods were calculated and validated by the FDR, but the BTPC method delivered the lowest FDR for up- and down-regulated genes. The standard deviation and the 95% confidence interval for the FDRs were also calculated for each meta-analysis method.
- the Rank method delivers a number of genes which are regulated with a specific difference to control samples.
- the genes within each experiment were sorted by the fold change values and a rank was calculated for each gene. Genes were selected based on a rank threshold of 30. Genes were selected for the signature if they appeared in half or more of the datasets and if in all of those datasets genes were consistently regulated in one direction with no assessment of significance level.
- CIN Signature The published CIN signature (CIN70 and CIN27wp) and an extended gene list incorporating the top 5%, 10% and 15% of genes over- expressed in the CIN signature were used in this analysis (Carter, et al., (2006) Nat Genet, 38:1043-1048). Genes were excluded from the final signature (WP) if they were identified as cell cycle regulated transcripts rendering a final gene list: CIN382wp, CIN826wp and CIN1264wp (Whitfield, et al., (2002) MoI Biol Cell, 13:1977-2000).
- TaqMan low-density arrays HCTl 16 hSecurin +/+ and hSecurin - ⁇ , A549, HCC-2998, SW620, COLO205, HCT-15, KM12, MCF7, MDA- MB-231, HS578T and BT549 cells were plated at 3xlO 6 cells per 10cm plate. Twenty-four hours later, cells were treated for additional 24 hours with 0.5x of the cell specific GI50 of paclitaxel. Total RNA was extracted and cDNA synthesized as described above.
- the TLDAs used allowed 8 samples to be simultaneously quantified against 47 pre-loaded specifically designed TaqMan assays with the additional 18S RNA and GAPDH TaqMan assay detecting the endogenous controls. For each port, 100 ⁇ l reaction mixture was added which contained 2 ⁇ l of the 20 ⁇ l RT reaction and 2x TaqMan Universal PCR MasterMix. The cards were run on the TLDA block of the 7900 HT Real-Time PCR System (Applied Biosystems). Data analysis was performed using the SDS Relative Quantification software (Applied Biosystems).
- Dulbecco's Modified Eagle's Medium supplemented with 10% Fetal Bovine Serum (FBS), 2 mM L-Glutamine, 100 ⁇ g/ml Streptomycin and 100 U/ml Penicillin at 37°C and 10% CO 2 .
- All other cell lines used in this study were from the NCI60 cell panel which are cultured in RPMI medium, supplemented with 10% Fetal Bovine Serum (FBS), 2% bicarbonate, 2 mM L-Glutamine, 100 ⁇ g/ml Streptomycin and 100 U/ml Penicillin at 37°C and 5% CO 2 .
- siRNA (25nM) / DharmaFectl (both from Dharmacon) transfection mixture was pipetted before adding 4.5 X lO 3 of HCT-116 cells per well of a 96 well plate or 3 X 10 5 of HCTl 16 cells per well of a 6 well plate in antibiotic-free media. Cells were either processed for analysis or drug-treated 48 hours after transfection.
- HCT-116 cells were plated at 6000 cells/well in 96-well plates pre-treated with poly- L lysine. HCT-116 cells underwent reverse transfection with 25nM siRNA and Dharmafect 1 transfection reagent (Dharmacon) according to manufacturer's instructions. Scrambled non-targeting and RISC-free controls were used for each experiment. Forty-eight hours post transfection, cells were prepared for analysis in the Acumen Explorer laser cytometer. Medium was aspirated from the cells and lOO ⁇ l 80% ethanol in PBS at -20°C was added to each well and cells were incubated at -20°C for 30 minutes.
- Dharmafect 1 transfection reagent Dharmacon
- RNAse solution was then aspirated and lOO ⁇ l of lO ⁇ M propidium iodide was added to each well.
- the plate was incubated in the dark for 15 minutes prior to analysis on the Acumen Explorer for quantification of cell number and cell cycle profile.
- the plates were scanned using a 488nm laser at a sampling resolution of lum X direction and 8um in the Y direction. The whole well was selected for scanning. Cells were identified on the basis of size measurements to exclude debris and large clusters of cells from analysis.
- This cell population was then sub divided into subGl, Gl, S, G2/M, >4n, and 8n sub-populations based on the Total Intensity readout from each cell.
- the data was exported to give the percentage of cells in each phase of the cell cycle within a well.
- RNA extraction and cDNA synthesis Total RNA was extracted using the RNeasy system (Qiagen) following the manufacturer's guidelines. The High- capacity cDNA RT kit (Applied Biosystems) was used to synthesize cDNA from 1 ⁇ g of total RNA.
- Real-time RT-PCR quantification of mRNA silencing Total RNA and cDNA were extracted and synthesized as described above. Real-time PCR was performed using the Fast SYBR Green assay (Applied Biosystems) to measure relative transcript levels of target genes, normalised to 18S or RPS 18 RNA levels. Target-specific QuantiTect primer assays were purchased from Qiagen.
- the tumors were classified as belonging to three groups: (i) diploid cases with a distinct peak in the normal 2c region and no cells exceeding 5c, (ii) aneuploid cases with a main peak different from 2c and a stemline scatter index (SSI) below or equal 8.8, and (iii) aneuploid samples with a varying numbers of cells (>5%) exceeding 5c (SSI above 8.8).
- This novel classification system adheres to the parameters established by Kronenwett and colleagues (Kronenwett, et al., (2004) Cancer Res, 64:904-909), who defined the stemline scatter index (SSI) as a measurement of clonal heterogeneity in the tumor cell population.
- a common MTS gene expression signature was derived by meta-analysis of published microarray datasets from four cancer cell lines and one ovarian cancer xenograft model treated with taxanes or epothilone.
- the datasets used to derive the MTS response signature are shown in Table Ia.
- Figure Sl shows the most significant repressed and expressed genes following MTS exposure in the 5 datasets.
- the above results functionally characterized the role of genes overexpressed in CIN tumors that are consistently repressed by MTS agents.
- the above examples identified 22 "CIN-survival" genes that are overexpressed in CIN tumors, repressed by MTS treatment and impair cancer cell survival when depleted from three cancer cell lines of different tumor origin (flowchart Figure 2d). Conceivably, repression of these genes may contribute to the cytotoxic response following MTS exposure.
- CIN can be used as a measure of cell-to-cell variability in chromosome number (Geigl, et al., (2008) Trends Genet, 24:64-69). Published SKY data from NCI60 colorectal and breast cancer cell lines were used to define the fraction of normal chromosomes displaying numerical heterogeneity from cell-to-cell as a measure of CIN (Roschke, et al., (2003) Cancer Res, 63 : 8634-8647).
- NCI60 colon cancer cell lines with various degrees of CIN were chosen. Each cell line was treated with a paclitaxel concentration equal to half its Gi50 (drug concentration required for 50% growth inhibition, Table 5) for 24 hours and measured gene expression by qPCR. Cell lines with the lowest frequency of CIN elicited repression of genes identified in the MTS signature, including several CESf-survival genes ( Figure 3a). In contrast, CIN high cell lines (SW620 and COLO205) elicited significantly less repression of the CIN-survival genes compared to near diploid CIN low HCT-116 cells.
- Gi50 drug concentration required for 50% growth inhibition
- CIN defined by expression of the CIN signature
- CIN signature may predict subsequent resistance to paclitaxel and sensitivity to carboplatin in vivo. This provides clinical evidence implicating CIN in pre-treatment tumors as a marker of taxane resistance in vivo and indicates that the efficacy of two common chemotherapy drugs may be differentially influenced by tumor karyotype.
- Tests were performed to address the relationship between clinical and pathological variables in breast cancer, for which taxanes form a major component of treatment regimens, with expression of the CIN signature and CIN-survival genes in order to better identify patient cohorts that might selectively benefit from taxane schedules.
- DNA image cytometry methods were used to assess CIN directly in 44 primaiy breast cancers for which gene expression data were available (GSEl 1901) (Habermann, et al., (2009) Int J Cancer, 124:1552-1564).
- This technique is applied to the measurement of the nuclear DNA content in clinical samples, including fine needle aspirate cytology and allows assessment of tumor ploidy status and tumor classification into genomically stable and unstable subtypes (Kronenwett, et al., (2004) Cancer Res, 64:904-909).
- the 44 breast cancers were classified into three groups; Aneuploid, genomically unstable breast cancers (aGU) which show a larger distribution in their image analysis-quantified DNA content relative to aneuploid, genomically stable (aGS) or diploid, genomically stable (dGS) tumors (clinical data Table 3).
- aGU Aneuploid, genomically unstable breast cancers
- aGS genomically stable
- dGS genomically stable tumors
- CIN-survival gene expression is highly correlated both with the CIN signature in vivo and CIN determined by DNA image cytometry.
- the CESf signature (Carter, et al., (2006) Nat Genet, 38:1043-1048) and CIN-survival gene expression carry prognostic power in breast cancer, and the CIN signature carries predictive power and may serve as a surrogate marker for taxane resistance and carboplatin sensitivity in ovarian cancer.
- compositions are described as having, including, or comprising specific components, or where processes are described as having, including or comprising specific process steps, it is contemplated that compositions of the present teachings also consist essentially of, or consist of, the recited components, and that the processes of the present teachings also consist essentially of, or consist of, the recited process steps.
Landscapes
- Chemical & Material Sciences (AREA)
- Life Sciences & Earth Sciences (AREA)
- Health & Medical Sciences (AREA)
- Organic Chemistry (AREA)
- Proteomics, Peptides & Aminoacids (AREA)
- Engineering & Computer Science (AREA)
- Immunology (AREA)
- Pathology (AREA)
- Analytical Chemistry (AREA)
- Zoology (AREA)
- Genetics & Genomics (AREA)
- Wood Science & Technology (AREA)
- Physics & Mathematics (AREA)
- Biotechnology (AREA)
- Microbiology (AREA)
- Molecular Biology (AREA)
- Hospice & Palliative Care (AREA)
- Biophysics (AREA)
- Oncology (AREA)
- Biochemistry (AREA)
- Bioinformatics & Cheminformatics (AREA)
- General Engineering & Computer Science (AREA)
- General Health & Medical Sciences (AREA)
- Pharmaceuticals Containing Other Organic And Inorganic Compounds (AREA)
- Measuring Or Testing Involving Enzymes Or Micro-Organisms (AREA)
Abstract
Methods for predicting the clinical outcome of treating a human solid tumor using one or more taxanes are provided. The method includes measuring in the cells of a tumor the expression level of a set of genes whose change is related to chromosomal instability; taking a statistical measure of the expression level of the set of measured genes; and if the statistical measure of the expression level of the set of measured genes is elevated, determining that the prognosis is poor. The sets of genes which are useful in predicting the outcome of treatment of solid tumors using one or more taxanes are indicated. Methods and sets of genes can be used to determine whether a solid tumor is likely to exhibit drug resistance to one or more taxanes in vivo.
Description
PROGNOSIS INDICATORS FOR SOLID HUMAN TUMORS
REFERENCE TO RELATED APPLICATIONS
[0001] This application claims priority to and the benefit of U.S. Provisional Application No. 61/175,781, filed on May 5, 2009, the entire disclosure of which is incorporated by reference herein.
GOVERNMENT SUPPORT
[0002] The United States government has certain rights to this invention pursuant to Grant Nos. NCI SPORE P50 CA 89393, R21LM008823-01 Al from the National Institute of Health.
FIELD
[0003] The present teachings relate generally to the field of cancer diagnostics and treatment, and more specifically to the determination of a likelihood that the outcome of a treatment using microtubule stabilizing drags and/or carboplatin will be successful.
BACKGROUND
[0004] The treatment options for solid human tumors are multifold. Solid tumors can be treated chemotherapeutically, radiologically, surgically, or with a combination of these therapies. Each therapy produces undesirable side effects, which may be extensive enough that some patients cannot complete the course of treatment. The side effects of cancer therapy also have a severe impact on the quality of life of these patients.
[0005] As a result, if the clinician can determine prior to treatment how refractory the tumor will respond to treatment, an appropriate treatment can be selected having the least side effects for the patient. The present teachings provide a method for determining likelihood of clinical outcome based on the malignancy of the tumor.
SUMMARY
[0006] The present teachings relate to methods for predicting the outcome of the treatment of solid human tumors. In various embodiments, the methods generally include measuring in a particular solid tumor cancer type the degree of chromosomal
abnormalities and/or the expression levels of a large number of genes; identifying a subset of the measured genes characteristic of chromosomal instability (CIN); and determining in clinical samples whether the CIN signature accurately predicts the outcome of the treatment of the solid tumor. The methods can include the use of the CIN signature to analyze a tumor of a patient to determine the prognosis of the cancer and whether treatment is likely to be successful. In certain embodiments, the treatment can involve administration of microtubule stabilizing (MTS) agents, such as taxanes, or carboplatin.
[0007] The present teachings also relate to optimizing therapeutic efficacy for treatment of a tumor. In various embodiments, the methods can include measuring in a particular solid tumor cancer type the expression levels of a set of genes characteristic of chromosomal instability (CIN), and determining whether one or more microtubule stabilizing (MTS) agents or carboplatin should be administered to a patient for treatment of a tumor in the patient. For example, the results of the CIN signature analysis may predict that taxane treatment is unlikely to be successful in treating a tumor. Accordingly, the methods may include administering one or more non-taxane drugs, e.g., DNA alkylating agents, to the patient in the treatment of the tumor.
[0008] In some embodiments, the present teachings provide a method of predicting the clinical outcome of treating a patient having a tumor using one or more microtubule stabilizing (MTS) drugs. The method can include the steps of measuring, in a sample comprising a tumor cell from a patient, the mRNA expression levels of at least 10 of the following genes:
taking a statistical measure of the mRNA expression level of the measured genes; and if the statistical measure of the mRNA expression level of the measured genes is elevated, determining that the patient is a non-responder to MTS drug treatment and that the prognosis is poor.
[0009] Gene expression levels can be measured using any suitable methods, including, for example, using a microarray or polymerase chain reaction (PCR) (e.g., quantitative PCR, such as real-time PCR). In various embodiments, the mRNA expression levels of more than 10 genes are measured. For example, the mRNA expression levels of 10, 15, 20, or all 22 genes can be measured. In some embodiments, the method can include the step of administering a suitable MTS drug to the patient. The method also can include the step of measuring mRNA expression levels at one or more times after administration of the MTS drug to the patient. The present teachings can be used with any MTS drug or drugs, such as taxanes (e.g., paclitaxel or docetaxel) and epothilones.
[0010] In various embodiments, the statistical measure of the mRNA expression level of the measured genes is a linear combination of the mRNA expression level of the genes. In some embodiments, the linear combination of the mRNA expression level of the genes is the mean of logarithms of the mRNA expression levels. In particular embodiments, the linear combination of the mRNA expression level in the set of genes is a combination of weighted mRNA expression levels.
[0011] In various embodiments, the tumor is a solid tumor, including, by non- limiting example, breast cancer, ovarian cancer, colorectal cancer, lung cancer, prostate cancer, medulloblastoma, glioma, and lymphoma.
[0012] In some embodiments, the present teachings also provide a method of selecting a treatment for a patient having a tumor. The method can include the steps of measuring, in a sample comprising a tumor cell from a patient, the mRNA expression levels of at least 15 genes of the following set of genes:

[0013] In various embodiments, gene expression levels are measured before onset of paclitaxel or carboplatin drug treatment. In some embodiments, the method can include the step of administering carboplatin or recommending administration of carboplatin to the patient.
[0014] In various embodiments, the statistical measure of the mRNA expression level of the measured genes is a linear combination of the mRNA expression level of the genes. In some embodiments, the linear combination of the mRNA expression level of the genes is the mean of logarithms of the mRNA expression levels. In
particular embodiments, the linear combination of the mRNA expression level in the set of genes is a combination of weighted mRNA expression levels.
[0015] In certain embodiments, the method comprises measuring, in a sample comprising a tumor cell from a patient, the mRNA expression level of at least 25 genes in the following set of genes:
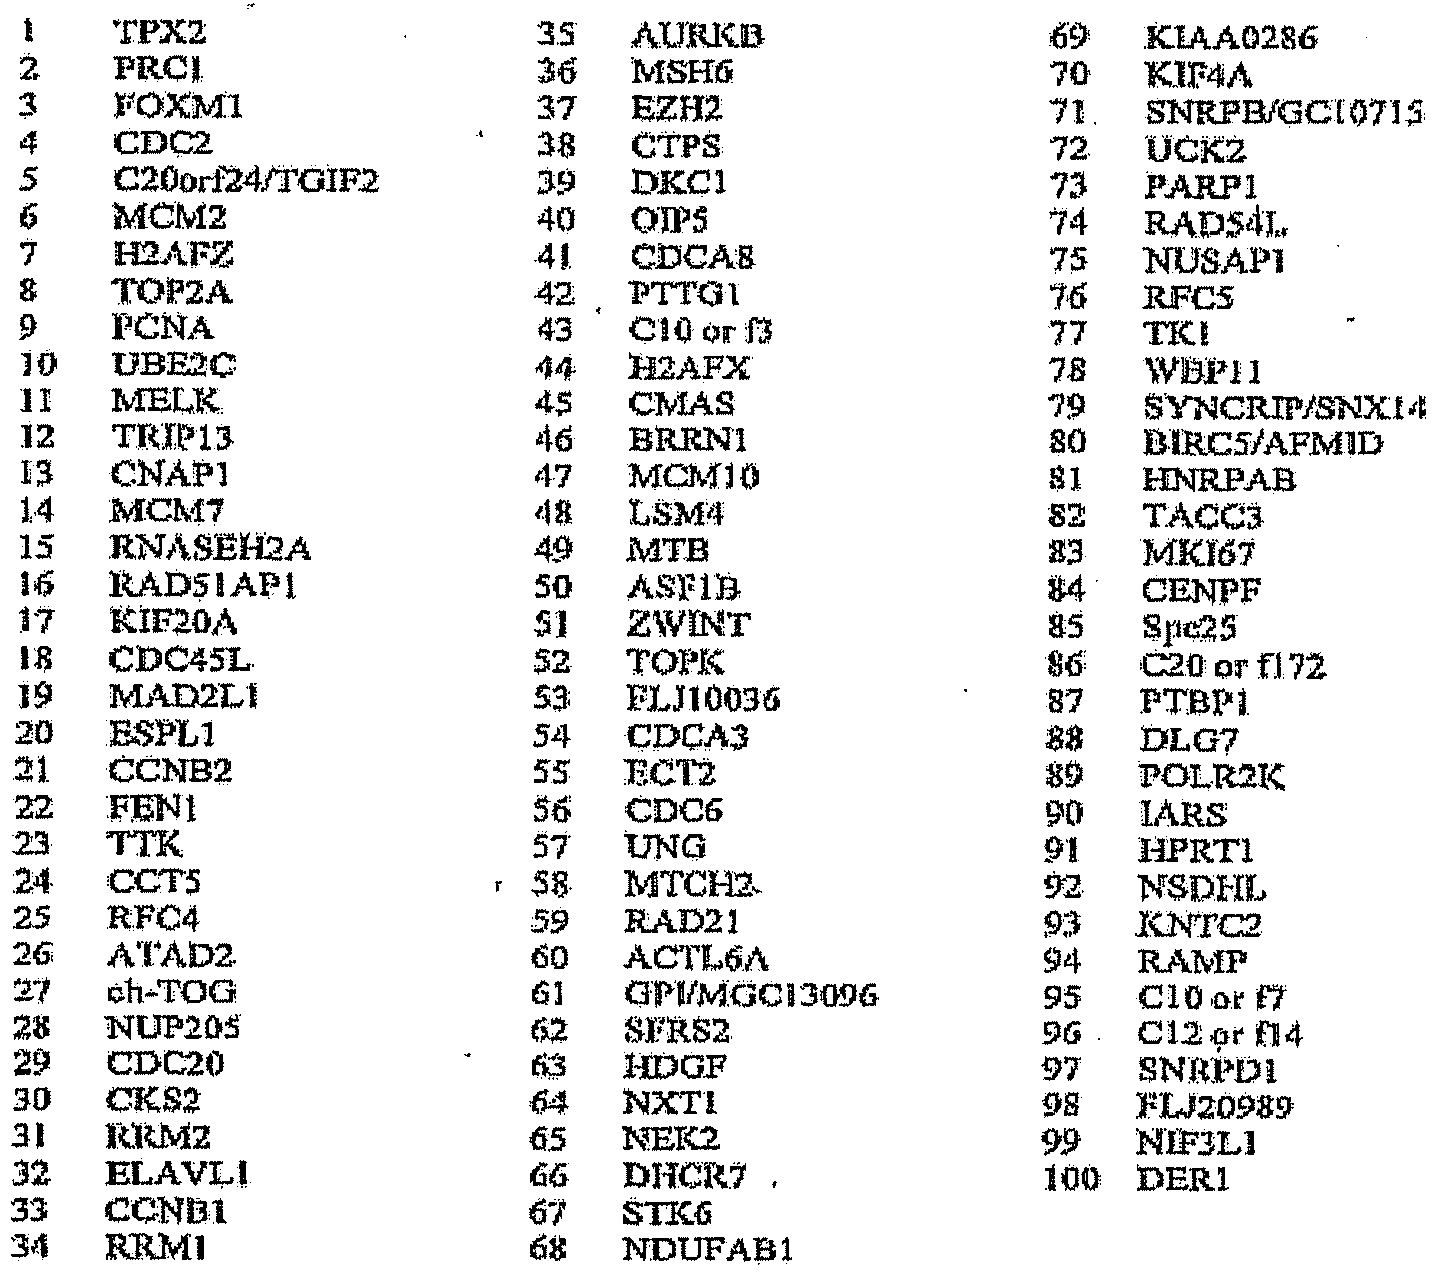
[0016] In certain embodiments, the solid tumor is of a cancer selected from lung cancer, prostate cancer, medulloblastoma, glioma, breast cancer, and lymphoma. In certain embodiments, the solid tumor is of a cancer selected from breast cancer, ovarian cancer, and colorectal cancer.
[0017] In some embodiments, the statistical measure of the mKNA expression level of the measured genes is a linear combination of the mRNA expression level of the genes in the set of genes. In particular embodiments, the linear combination of the mRNA expression level in the set of genes is a combination of weighted mRNA expression levels. In various embodiments, the linear combination of the mRNA expression level in the set of genes is the mean of the logarithm of each of the mRNA expression levels. In certain embodiments, the statistical measure of the mRNA expression level of the measured genes is elevated relative to the mRNA expression level of the measured genes from a tumor whose prognosis is good.
[0018] In some embodiments, the present teachings relate to a method for predicting outcome of the treatment of the human solid tumors. In these embodiments, the method generally includes the steps of measuring, in a sample comprising the cells of a tumor from a patient, the mRNA expression level of a set of genes (or subset of a gene set) whose change is related to chromosomal instability; taking a statistical measure of the mRNA expression level of the set of measured genes; and if the statistical measure of the mRNA expression level of the set of measured genes is elevated, determining that the prognosis for treatment with a MTS drug is poor.
[0019] In some embodiments, the present teachings relate to a method for predicting the outcome of the treatment of human solid tumors with taxanes such as paclitaxel. In such embodiments, the method can include measuring, in a sample comprising the cells of a tumor from a patient, the mRNA expression level of the followin enes or a subset thereof):

[0020] Analytical results and/or measurements described herein, including expression level data, can be displayed, transmitted, or outputted to a user interface device, a computer readable storage medium, or a local or remote computer system. Displaying or outputting a result or measurement means that the results of any of the analyses described herein are communicated to a user using any medium, such as for example, orally, writing, visual display etc., computer readable medium or computer system. It will be clear to one skilled in the art that outputting the result is not limited to outputting to a user or a linked external component(s), such as a computer system or computer memory, but may alternatively or additionally be outputted to internal components, such as any computer readable medium. Computer readable media may include, but are not limited to hard drives, floppy disks, CD-ROMs, DVDs3 and DATs. Computer readable media does not include carrier waves or other wave forms for data transmission. It will be clear to one skilled in the art that the taking of a statistical measure as disclosed and claimed herein generally is computer-implemented, but the displaying or outputting step can include communicating to a person orally or in writing.
[0021] Another aspect of the present teachings is a set of genes or data from a set of genes, e.g., expression level data, useful in determining the outcome of treatment of solid tumors. In some embodiments, the set of genes comprises or consists essentially of:
or
or
 or
or


[0023] The foregoing, and other features and advantages of the present teachings, will be more fully understood from the following figures, description, examples, and claims.
BRIEF DESCRIPTION OF DRAWINGS
[0024] It should be understood that the drawings described below are for illustration purpose only. The drawings are not necessarily to scale, with emphasis generally being placed upon illustrating the principles of the present teachings. The drawings are not intended to limit the scope of the present teachings in any way.
[0025] Figure 1 shows that genes over-expressed in tumors with CIN are repressed by MTS treatment in vitro and in vivo: (a) The CIN27wp gene expression signature, which correlates with total functional aneuploidy in several cancer types (Carter, et al., (2006) Nat Genet, 38:1043-1048), was analyzed in five gene expression data sets measuring response to MTS treatment. The distribution of changes induced by MTS was lower in CIN27WP genes (red) than in the set of all measured genes (black) (P = 3.3e-7). (b-e) As part of the OVOl clinical trial, expression profiling was performed on ovarian carcinomas before and after 3 cycles of paclitaxel (Px) treatment, (b) For each gene in the CIN70 signature, the median expression amongst patients is compared between the pre-treatment and post- treatment tumors, with the straight line indicating equivalence, (c) To quantify tumor response, an exponential model was fitted for each patient to the CA125 tumor marker over three cycles of treatment. The resulting coefficient is concordant with the response criteria defined by Rustin et. al. ( (2004) J Natl Cancer Inst, 96:487-488) and was used to identify the most paclitaxel-sensitive patients (box). (d) The median expression of the CIN70 genes is decreased in post-treatment tumors relative to pre-treatment tumors, (e) especially in those patients with the most paclitaxel-sensitive disease (boxed in (c)). Statistics shown are one-sided t-tests. Horizontal bars indicate mean values.
[0026] Figures 2a-b show that siRNA silencing of MTS repressed genes impairs cell viability and promotes cell death: (a) Genes repressed within the two MTS expression signatures that are over-expressed in CIN tumors significantly alter HCT- 116 cell viability when targeted by siRNA. The Acumen eX3 cytometer (Acumen TTP Labtech) was used to quantify viable cells 72 hours after siRNA transfection. SDs are displayed for 3 independent experiments. P values shown for Student two sided T Test in all cases: * p<0.05, ** p<0.005, ***p<0.0005; (b) Genes repressed within the two MTS expression signatures which are over-expressed in CIN tumors
significantly alter cell subGl fraction in HCT-116 cells when targeted by siRNA. FACS analysis was used to quantify the mean subGl fraction 72 hours after transfection of siRNA. SDs and p values are displayed for 3 independent experiments.
[0027] Figures 2c-d describe the identification of 22 CEST survival genes and provide a flowchart of analysis resulting in the derivation of the 22 CIN-survival genes: (c) Cells were transfected with siRNA targeting the 50 genes overexpressed in CIN rumors and repressed by MTS agents. Cell viability was quantified by cell titer blue assay 4 days after siRNA transfection in triplicate. Shown are the 22 genes which significantly impair viability in MDA-MB-468, A549 and HCT- 116 cell lines; (d) the binomial test with probability correction (BTPC) and rank methods were used to derive two MTS expression signatures. 50 genes were repressed in the MTS signatures and overexpressed in CIN tumors. 22/50 genes impaired cancer cell viability and/or induced apoptosis when silenced by RNA interference in 3 cancer cell lines: HCT-116 (colon), A549 (NSCLC) and MDA-MB-468 (breast).
[0028] Figure 3a describes the quantification of gene repression following paclitaxel treatment of cell lines with increasing chromosomal numerical heterogeneity. Fold change in gene expression post-paclitaxel treatment (24hrs) relative to expression in vehicle control treated cells was determined by qPCR analysis (normalization to 18S and GAPDH) following 24hrs of paclitaxel treatment (50% of the Gi50 concentration) in 3 biological replicate experiments in cell lines with increasing CIN. Colour coding represents the mean fold change in gene expression of 3 biological replicates relative to cells treated with vehicle alone +1SD. MTS repressed genes inducing a significant reduction in cell viability when silenced by siRNA compared to control transfected cells are highlighted in grey. Gene expression following paclitaxel treatment is compared to the HCT-116 cell line displaying the lowest CIN. The significance of the differences in gene expression determined using the unpaired two-sided Student T test: * P value <0.05, ** P value <0.005.
[0029] Figure 3b shows that CIN-survival genes are relatively over-expressed in CIN high CQLO205 and SW620 cells compared to near diploid CINlow HCT-116.
Relative quantification of gene expression normalised to 18S and GAPDH in COLO205 and SW620 cells compared to near diploid HCT-116 cells. Graph shows the mean fold change in gene expression compared to HCT-116 cells of 3 biological replicates (+ ISD).
[0030] Figure 3c shows that colorectal cancer cell lines with increasing chromosomal numerical heterogeneity uncouple mitotic arrest from cell death. Cell lines were treated with paclitaxel relative to the Gi50, Gi50/2 and Gi50/4 concentrations. Quantification of dying cells (SubGl fraction) and cells arrested in mitosis (MPM2 positive fraction) were assessed by FACS analysis. The MPM2/SubGl ratio was calculated by assessing the percentage change in MPM2 and SubGl cells relative to vehicle control treated cells 24 hours following paclitaxel treatment. The mean ratio of 3 independent experiments is presented (+1SD). Cell lines are represented in ascending order of CIN status (Roschke, et al, (2003) Cancer Res, 63:8634-8647).
[0031] Figure 3d shows that silencing CIN-survival genes in the S W620 CINhigh cell line promotes cell death following 24 hours of paclitaxel Gi50 treatment. Forty- eight hours following transfection of CIN-survival siRNAs, SW620 cells were treated with paclitaxel for 24 hours and cells prepared and analyzed as for Figure 3c. The mean MPM2/SubGl ratio of two independent experiments is presented (+1SD).
[0032] Figure 3e shows impaired repression of CIN-survival genes following paclitaxel treatment in an isogenic models of CIN: Quantification of gene repression by qPCR analysis of 21 CIN survival genes following treatment of HCT-116 wild type parental cells and isogenic Mad2+/- cells following 24 hours of paclitaxel treatment (5OnM) normalised to 18s. Colour coding represents the mean fold repression + 1 SD from 3 biological replicates. P values indicate significantly greater gene repression in the HCT-116 parental cell line (Student one sided T-test).
[0033] Figure 3f shows that CIN survival gene repression correlates with cytotoxic response and stable tumor karyotype.
[0034] Figure 4a shows that expression of CIN70 genes determines sensitivity to paclitaxel and carboplatin. Figure contrasts basal median gene expression for each CIN70 gene amongst tumors with differing response to paclitaxel and carboplatin. Paclitaxel-resistant tumors have higher median log intensity of the CIN70 signature compared to paclitaxel-sensitive tumors (p=0.043). CIN70 gene expression differs significantly between tumors subsequently resistant to paclitaxel and tumors resistant to carboplatin (p = 0.044). Statistical tests: Student two-sided T-tests.
[0035] Figure 4b shows that residual CIN expression post-treatment is higher in paclitaxel-resistant compared to paclitaxel-sensitive tumors. (Top) Sensitivity defined by the Rustin criteria: The distribution of Iog2 intensities of CIN70 genes in residual tumors following paclitaxel across all Rustin-resistant (black line) and Rustin-sensitive (red line) patients. (Kolmogorov-Smirnov test, D = 0.11, p = 0.01). (Bottom) Sensitivity defined by the CA 125 coefficient: The same analysis was applied to taxane-resistant (black line: CA 125 coefficient >-0.5) and patients most sensitive to paclitaxel (red line: CA125 coefficient <-l, see Figure Ic) (Kolmogorov-Smirnov test, D = 0.22, p = 8.30e-8).
[0036] Figure 4c shows that expression of CIN and CIN-survival genes is greater in aneuploid, genomically unstable breast cancers. DNA image cytometry was used to classify breast cancers as diploid, genomically stable (dGS), aneuploid, genomically stable (aGS) or aneuploid, genomically unstable (aGU). Box plots summarize the expression of the CIN70, CIN27wp and CIN-survival signatures within each group. P values were calculated using the Student two-tailed T test.
[0037] Figure Sl shows the results of binomial test with probability correction MTS expression signature demonstrating the most significant repressed and expressed genes following MTS exposure in the 5 datasets. Shown are heatmaps reflecting gene expression changes with Iog2 fold change values of significantly up (red)- or down (green)-regulated genes in the rows and tumor cell line datasets in the columns, both sorted by hierarchical clustering with euclidean distance (www.bioconductor.org). White cells indicate that this gene was not included on the microarray or removed in the filtering step prior to the meta-analysis.
[0038] Figure S2 shows the results of binomial test with probability correction MTS expression signature demonstrating the most significant repressed and expressed genes following 5-FU exposure in the 3 datasets. Shown are heatmaps reflecting gene expression changes with Iog2 fold change values of significantly up (red)- or down (green)-regulated genes in the rows and tumor cell line datasets in the columns, both sorted by hierarchical clustering with euclidean distance (www.bioconductor.org). White cells indicate that this gene was not included on the microarray or removed in the filtering step prior to the meta-analysis.
[0039] Figure S3a summarizes repression of genes by MTS using two meta- analysis methods which are over-expressed in the top 15% of genes expressed in CIN tumors with proliferation genes removed (10). List of 50 genes repressed in the MTS expression signatures derived from the two methods that are over-expressed in CIN tumors as part of the CESf signature were chosen for further functional analysis using RNA interference.
[0040] Figure S3b describes the validation of MTS expression signature repressed genes in HCT-116 colorectal cancer cell line. Fold change in gene expression (+/- ISD) determined by TLDA qPCR analysis of genes normalised to 18s RNA expression derived from the two MTS expression signatures following 24hrs of Paclitaxel treatment (5OnM) in 3 biological replicate experiments compared to gene expression in vehicle (DMSO) control treated HCT- 116 cells. BBC3/Puma, a known taxane induced gene derived from our meta-signature and LAMP2 and WDFYl (genes whose expression is not influenced by taxane exposure Swanton and Downward unpublished data) were used as controls.
[0041] Figure S4a shows that MTS repressed genes promote aneuploidy and cell death when silenced by siRNA. Genes repressed within the two MTS expression signatures that are over-expressed in CIN tumors significantly increase the fraction of aneuploid cells assessed by Acumen and flow cytometry when silenced using RNAi. CIN survival genes are highlighted in grey. Colour coding: Lower limit of SD of mean percentage of aneuploid cells from 3 independent experiments is greater than mean aneuploid population in control transfected cells +2 SDs (light grey) or +3 SDs (dark grey) from 3 independent experiments.
[0042] Figure S4b shows deconvolution of siKNA smartpools and assessment of cell viability. In particular, experiments in Figure 2b were repeated with the deconvoluted siRNA sequences from the smartpool. The Acumen Explorer laser cytometer was used to quantify viable cells 72 hours after transfection of the smartpool siRNA targeting the gene of interest. Standard deviations are displayed for 2 independent experiments.
[0043] Figure S4c assesses target silencing. Fast SYBR green real-time PCR quantification of target silencing (+1SD from 3 independent transfections) was confirmed 72 hours following transfection of HCT-116 cells with siRNAs conferring an effect on cell viability, cell death or aneuploidy compared to gene expression in non-targeting control siRNA transfected cells.
[0044] Figure S5a illustrates quantification of gene repression following paclitaxel treatment of MCF-7 and BT549 cell lines. Fold change in gene expression post-paclitaxel treatment (24hrs) relative to expression in vehicle control treated cells was determined by TaqMan qPCR analysis (normalization to GAPDH) following 24hrs of paclitaxel treatment (concentration 50% of the Gi50 dose) in 3 biological replicate experiments in the MCF-7 (CTNlow) and the BT549 (CINhiBh) breast cancer cell lines. Colour coding represents the mean fold change in gene expression of 3 biological replicates relative to cells treated with vehicle alone (+1 standard deviation). CESF survival genes are highlighted in grey. Significance of differential gene repression compared to the MCF-7 cell line following paclitaxel treatment is determined by the 2 tailed Student T test: * P value <0.05, ** P value <0.005.
[0045] Figure S5b shows that silencing CIN-survival genes in the SW620 CINhigh cell line promotes a synergistic increase in cell death following 24 hours of paclitaxel Gi50 treatment compared to DMSO treated cells. Forty-eight hours following transfection of CIN-survival siRNAs, SW620 cells were treated with paclitaxel for 24 hours and cells prepared and analyzed for SUBGl content by FACS analysis as for Figure 3c. Results of two biological replicates are shown with standard deviation. Silencing BRCAl, TOP2A, CDC6, H2AFX and NUP205
promotes a significant increase in SUBGl cells following Paclitaxel exposure compared to DMSO treated cells (p<0.05 Student's T Test).
[0046] Figure S5c shows impaired repression of CIN-survival genes following paclitaxel treatment in an isogenic model of CIN, specifically quantification of gene repression following treatment of HCT-116 wild type parental cells compared to HCT-116 isogenic hSecurin (-/-)following 24 hours of paclitaxel treatment (5OnM) normalised to 18s. Colour coding represents the mean fold repression + ISD from 3 biological replicates. P values (* PO.05) indicate significantly greater gene repression in the HCT-116 parental cell line (one sided Student T-test).
[0047] Figure S5d shows how expression of CIN-survival genes correlates with poorer survival in breast cancer. The mean of the logged expression levels of CIN- survival genes was taken as a single prognostic factor and tested as a predictor of outcome in 4 cancer cohorts. Similar to what was reported by Carter et al. (10), patients were divided into two groups with above or below median expression of the CIN-survival gene signature expression and the prognostic effects examined with Kaplan-Meier survival analysis and Cox proportional hazard model.
[0048] Table Ia provides the datasets used to derive the MTS response signature. Cell lines treated with the MTS and author of the study are shown. The type of array used to derive each gene expression signature (cDNA or Affymetrix) together with the number of genes on the platform, the duration and concentration of drug exposure and the number of biological replicates for each experiment are demonstrated.
[0049] Table Ib shows that genes over-expressed in CIN tumors are significantly repressed following MTS treatment across all datasets. Cell cycle regulated genes were removed from the CIN70 signature and the signature of the top 5%
(CIN382WP), 10% (CIN826WP) and 15% (CIN1264WP) of over-expressed genes in CIN tumors. The empirical frequency distribution of CIN27wp, CIN382WP, CIN826WP and CIN1264WP signature genes was compared to the gene expression changes across all datasets following MTS exposure using the one sided bootstrap Kolmogorov-Smirnov test. The test statistic and the p-value for the Kolmogorov-
Smirnov test reveals a significant left shift of the empirical frequency distribution of the CIN genes indicating that genes in the CIN signatures are more likely to be repressed following MTS treatment.
[0050] Table 1c shows that genes over-expressed in CIN tumors are significantly repressed in MTS expression signatures but not in a 5-FU signature. Genes whose expression is influenced by cell cycle phase (20) were removed from the CIN70 signature and the signature of the top 5% (CDNF382WP) of over-expressed genes in CIN tumors. Repression of genes in the CIN signature derived from two MTS metaanalysis signature methods (Rank and Binomial Test with Probability Correction, BTPC) with the number of repressed genes after filtering demonstrated for each meta-analysis method are shown. Three published datasets were used to derive a 5- FU signature using the BTPC method. Table demonstrates the level of significance for the representation of MTS or 5-FU-repressed genes in the CIN signature. P values indicate the significance of the association of the CIN signature genes within the MTS or 5-FU expression signatures of repressed genes using the one-sided fisher's exact test with the number of genes overlapping with each CIN dataset shown in parenthesis.
[0051] Table 1d shows that repression of CIN genes occurs preferentially in taxane-sensitive xenografts. Publicly available expression data deriving from paclitaxel-treated human ovarian cancer xenografts in nude mice (19) were analyzed for repression of genes over-expressed in CIN tumors following paclitaxel treatment. The sensitive ovarian cancer cell line (1A9) and its paclitaxel resistant derivative (1A9PTX22) were treated with 60mg/kg of paclitaxel which resulted in tumor responses in 1A9 tumors but not in 1 A9PTX22 xenografts. P-values are given for the Kolmogorov-Smirnov test comparing the distribution of genes over-expressed in the CIN signature (with proliferation genes excluded) with the distribution of genes having a negative fold change in ovarian cancer xenografts following paclitaxel treatment of nude mice. CIN genes are significantly repressed in taxane sensitive ovarian cancer xenografts, but not in the paclitaxel-resistant xenograft model.
[0052] Table 2 demonstrates the Gi50 for each cell line and the concentrations of paclitaxel used in each cell line (nM) relative to the cell line Gi50.
[0053] Table 3 summarizes clinical and experimental parameters in 14 diploid genomic stable (dGS), 14 aneuploid genomic stable (aGS), and 16 aneuploid genomic unstable(aGU) breast carcinomas. ER, estrogen receptor; PR, progesterone receptor; pos, positive; neg, negative; ND, not determined.
DETAILED DESCRIPTION
[0054] Human solid tumors exhibit differences in outcome even for the same tumor type. Thus, if a clinician can determine which outcome is probable for a specific tumor, the clinician would know if a more or less aggressive treatment regimen can be used. One possibility is to consider the amount of chromosomal aberrations that exists in the specific tumor. It is known for those trained in the art that there is a strong correlation between the total number of chromosomal aberrations in a given tumor and its malignancy. High numbers of chromosomal aberrations are usually associated with a more malignant phenotype.
[0055] With respect to the chromosomal complement of a solid human tumor, the tumor exhibits various aberrations such as multiple trisomies, tetrasomy, and multiple translocations and deletions. These aberrations in chromosomal stability are found in solid tumors of the lung, prostate, breast, brain (both medulloblastoma and glioma), ovaries, colon, and lymph nodes (lymphoma). To quantify the amount of chromosomal aberrations, one may apply any of the following three methods: 1) counting the number of morphologically visible chromosomal aberrations by the application chromosome visualization methods such as spectral karyotyping; 2) quantifying the amount of chromosomal aberrations obtained by array comparative genomic hybridization (aCGH); and 3) quantifying chromosomal aberrations by their effect on the expression level of the genes contained in a given chromosomal region. The latter method, which is an integral part of the present teachings, produces a measure called "functional aneuploidy."
[0056] The numerical and structural chromosomal aberrations seen in malignancies are a consequence of the aberrant functioning of the cell's mechanism to maintain genomic integrity. This cellular aberration is called "chromosomal instability" (CESf). Similarly to aneuploidy, its causative mechanism, CIN is also associated with malignancies. High levels of CIN are expected to confer a more
malignant phenotype. Despite the obvious utility of quantifying CIN for clinical diagnostics, its application has been hindered by technical difficulties. The present teachings provide a readily applicable quantification method of CIN in clinical tumor samples.
[0057] The expression "level" of a gene can be determined by any method known in the art which measures gene expression products, including, but not limited to, mRNA transcripts and proteins. It should be understood that the amount of gene expression levels need not be determined in absolute terms, but can be determined in relative terms.
[0058] A gene expression signature of CIN is derived by the identification of genes with the highest level of correlation between a gene's expression level and the overall level of chromosomal aberrations across a given set of cancer samples.
[0059] The overall level of chromosomal aberrations in a given clinical sample can be derived by any of the three techniques described herein.
[0060] In cancer cells chromosomes can be visualized by spectral karyotyping (SKY) that allows counting the total number of chromosomes and morphological aberrations of chromosomes such as deletions, insertions, translocations, and inversions of various chromosomal regions. In one embodiment the total number of such numerical and morphological aberrations in a cancer cell is used to estimate the overall level of chromosomal aberrations.
[0061] In cancer cells the copy number of each chromosomal region can be measured by array comparative genomic hybridization using microarrays by containing either long cDNA clones targeting the individual chromosomal regions or short DNA probes, such as those used on the so-called single nucleotide polymorphism (SNP) chips. In one embodiment the total number of chromosomal aberrations in a cancer sample is calculated by adding up the deviation of each chromosomal region from the normal chromosomal copy number across the entire genome.
[0062] In cancer cells chromosomal copy number changes have a direct impact on the RNA expression level of the genes contained in a given chromosomal region. Therefore, chromosomal copy number changes can be estimated by calculating the net deviation of the expression level of all genes contained in a given chromosomal region relative to the remainder of the sampled transcriptome.
[0063] First a tumor sample from each of the solid tumors of interest was obtained. A microarray was then used to quantify the expression level of a large number, typically 10,000-20,000 genes in each tumor sample. For a given microarray, each probe or probe set was first mapped to its corresponding transcriptome by sequence mapping and then, through this transcript, the microarray probes were mapped to their respective chromosomal cytobands.
[0064] For each chromosomal cytoband, all of the genes present in the microarray measurement that map to that region are grouped into a set designated B (short for band). In one embodiment, if less than ten genes were mapped to a band, the group was disregarded as statistically unreliable. Although in this embodiment the mapping of genes to the cytobands of the chromosome was used to group the genes, it is contemplated that the grouping of genes into statistically meaningful sets can be accomplished by using windows of equal linear length along the chromosome (5-30 IvIb long) or genes can be grouped by neighborhood criteria (20 to 100 genes that are located next to each other on the same chromosome would form a set of genes for further analysis). Also, although ten genes were considered the minimum number of genes necessary to form a group, it is contemplated that other numbers of genes can be used to determine statistical reliability.
[0065] The rest of the genes, i.e., the rest of the transcriptome that is localized somewhere else on the chromosomes and which are measured on the same microarray, are grouped into a set G (short for genome). The sets B and G are disjoint. The distributions of the genes in B and G are then compared using an appropriate statistical metric, such as the t-statistic. In one embodiment, the statistical significance of the group of genes was determined by taking the mean of the log to the base ten of the expression level of each gene in the group B and comparing it with the expression level of the genes from group G. In general, the
statistical metric is formed on a linear combination of the expression level of the genes in the set of genes. The expression levels can be weighted. Other statistical tests, which can be used include: Wilcoxon-Rank test, Signal to Noise ratio, Kolmogorov-Smirnov test and Kruskal-Wallis test
[0066] This process is iterated for each gene expression profile in a given cohort such that upon termination, a matrix of t-statistics for each of approximately 350 cytobands per hybridization was obtained. The thus created statistical measures will provide an estimate of the level of aberrant gene expression of a given gene set contained within a given chromosomal region. This is a basis of functional aneuploidy, a measure of the impact of chromosomal aberrations on the transcriptome.
[0067] In addition to the measures outlined above, the overall level of chromosomal aberrations can be characterized by summing up the level of functional aneuploidy across all chromosomal regions. This novel measure is termed total functional aneuploidy.
[0068] For a given set of cancer samples the following measures are obtained: (a) gene expression measurements at the RNA level for typically 10,000-20,000 genes, usually but not exclusively obtained by microarray measurements. In addition to these measurements, the following measures may also be obtained (b) array comparative genomic hybridization across the entire genome and/or (c) a detailed morphological characterization of all chromosomal aberrations.
[0069] For each gene in a given cancer data the gene's expression level across all samples will form a gene expression vector. The total number of chromosomal aberrations in the individual cancer samples as determined by the total number of morphological aberrations, total number of aCGH based chromosomal copy number deviations and total functional aneuploidy will form three additional vectors. Correlation between each gene expression vector and the three vectors characterizing the overall level of chromosomal aberrations is calculated for all genes. The genes with the highest level of correlation to the overall level of chromosomal aberrations will form the CTN gene expression signature.
[0070] A group of expressed genes in a tumor which was difficult to treat showed increased expression relative to tumors which were easier to treat. These genes included:


[0072] Therefore, by determining that these sets of tumor genes or an appropriate subset thereof have an elevated expression level, the clinician can determine that the tumor is difficult to treat.
[0073] In certain embodiments, the cell population gene expression approaches described herein can be used to predict in advance of treatment in vivo how a tumor may respond to specific cytotoxic drugs, in particular, MTS agents such as taxanes and epothilones, and/or carboplatin. In some embodiments, the methods described herein also can be used after commencement of treatment with taxanes, epothilones, or carboplatin, to monitor the tumor's responsiveness to the drugs. Taxanes include, for example, docetaxel and paclitaxel. Epothilones include, for example, epothilone A, epothilone B, patupilone (EPO906), sagopilone (SH-Y03757A, ZK-EPO), ixabepilone (aza-epothilone B, BMS-247550), epothilone C, KOS-862 (epothilone D), epothilone E, epothilone F, BMS-310705, and KOS-1584 as well as compounds with related microtuble stabilizing activity such as discodermolide, laulimalide, isolaulimalide, taccalonolides and others.
[0074] For example, the application of the present method to multiple datasets indicates that the following genes consistently have increased expression in tumors exhibiting drug resistance to taxanes: 1 BRCAl 9 H2AFX 17 RFC3

The above genes, referred herein as "CIN-survival" genes, were found to be significantly over-expressed in CESI tumors (Carter, et al., (2006) Nat Genet, 38:1043-1048). Data included hereinbelow indicate that cell lines with a high level of CIN (CINhlgh) fail to repress these CIN-survival genes following paclitaxel exposure as efficiently as cell lines with a low level of CIN (CINlow), despite an efficient mitotic arrest in response to paclitaxel treatment, suggesting an uncoupling of mitotic arrest from cell death in CIN lg tumor cells that is associated with an attenuated cytotoxic gene expression program. The data below support the "robust" mitotic arrest observed in chromosomally unstable cell lines following spindle disruption (Tighe, et al., (2001) EMBO Rep, 2:609-614.) and the lack of correlation between cell fate and the duration of mitotic arrest in time-lapse light microscopy studies (Gascoigne, et al., (2008) Cancer Cell, 14:1-12; Orth, et al., (2008) MoI Cancer Ther, 7:3480-3489; Shi, et al., (2008) Cancer Res, 68:3269-3276). These data also illustrate how MTS agents promote either a cytostatic or cytotoxic response that can correlate with the CIN status of the tumor (model in Figure 3f). In particular, CIN signature expression was found to correlate with resistance to paclitaxel and sensitivity to carboplatin in ovarian cancer and the CIN signature is relatively overexpressed in residual, paclitaxel-resistant tumor.
[0075] Thus although cell fate in response to anti-mitotics at the single cell level appears unpredictable and is not genetically predetermined (Gascoigne, et al., (2008) Cancer Cell, 14:1-12), this may not be the case when studying drug response at the population level. Tumor karyotype therefore can be an important determinant of cytotoxic sensitivity in solid human tumors as described herein.
[0076] Functional annotation of CIN-survival genes within the MTS expression signature can shed light on the mechanisms triggering cell death in response to MTS agents. Transcriptional inhibition during mitosis can alter the balance of short-lived compared to long-lived mRNAs, initiating the degradation of mRNAs encoding proteins which promote cell survival (Blagosklonny (2007) Cell Cycle, 6:70-74). In agreement with this hypothesis, it was found that several CIN-survival genes are also repressed following treatment with a transcription inhibitor, Flavopiridol (TOPBPl, CDC2, TOP2A, RFC3 and XPOl) indicating that cell death associated with MTS agents and transcriptional inhibitors may share similar mechanisms.
[0077] Recently it has been shown that mitotic arrest in response to paclitaxel triggers DNA damage (Dalton, et al, (2007) Cancer Res, 67:11487-11492) which can accumulate during a lengthened mitosis contributing to apoptosis due to inefficient DNA repair (Gascoigne, et al., (2008) Cancer Cell, 14:1-12). Intriguingly, 9 of the 22 genes in the CIN survival signature have roles in DNA repair. Repression of CIN-survival genes following taxane exposure, such as
BRCAl, CHEKl, DCLRElA, H2AFX, MSH6, RPAl, RFC3, SAE2, and TOPBPl suggest that failure to initiate efficient mismatch repair or homologous recombination (HR) can contribute to MTS cytotoxicity. It is noteworthy that these genes are overexpressed in CIN tumors and that MMR deficiency is infrequent in CIN colorectal cancers, supporting the potential dependence of CIN on heightened DNA repair activity and a rational basis for their therapeutic resistance to MTS agents. Such a concept is supported by ploidy-specifϊc lethal mutations in genes involved in HR in polyploid yeast models Storchova, et al., (2006) Nature, 443:541- 547).
[0078] Using DNA image cytometry combined with gene expression analysis to classify cancers by genomic instability status, the examples below suggest that the CESf signature can be a surrogate marker of CIN in vivo and that CIN-survival genes are over-expressed in aneuploid, genomically unstable breast cancer. Furthermore, CIN signature expression appears to be greater in residual paclitaxel resistant compared to sensitive tumors, suggesting that there can be a selection pressure for sustaining CIN in paclitaxel resistant tumors.
[0079] Intriguingly, aGU tumors are almost exclusively basal-like or Her2-positive breast cancers and analogous to clinical trial data in ovarian cancer described below, might be predicted to be taxane-resistant but platinum-sensitive. Her2 expression confers resistance to taxanes that can be reversed by trastuzumab exposure (Yu, et al, (1998) MoI Cell, 2:581-591; Tan, et al., (2002) MoI Cell, 9:993-1004; Lee, et al., (2002) Cancer Res, 62:5703-5710), and in vitro studies of BRCAl associated breast cancers (frequently associated with basal-like phenotype) have demonstrated sensitivity to platinum drugs and taxane resistance (Bhattacharyya, et al., (2000) J Biol Chem, 275:23899-23903; Quinn, et al., (2003) Cancer Res, 63:6221-6228). This has led to clinical trials assessing the efficacy of a taxane or a platinum agent in patients with Her2 negative, ER negative, PR negative ("triple-negative" breast cancers which histologically often form basal-like tumors) or BRCA carrier metastatic breast cancer.
[0080] Accordingly, not only is unstable aneuploidy associated with poor prognosis in cancer (Carter, et al., (2006) Nat Genet, 38:1043-1048; Kronenwett, et al., (2004) Cancer Res, 64:904-909), CIN also can provide a "catalyst" promoting acquired drug resistance (Duesberg, et al., (2000) Proc Natl Acad Sci U S A, 97:14295-14300; Duesberg, et al., (2001) Proc Natl Acad Sci U S A, 98:11283- 11288; Farabegoli, et al., (2001) Cytometry, 46:50-56). For example, it was found that paclitaxel causes repression of CIN-survival genes followed by cell death in diploid cells but not in chromosomally unstable cells. As further demonstrated below using a combination of functional genomic and microarray expression datasets, CESf appears to be functionally associated with altered intrinsic tumor sensitivity to at least two distinct chemotherapy agents (namely, paclitaxel and carboplatin). These results suggest that pre-therapeutic assessment of CIN status can optimize treatment stratification and to clinical trial design using these agents.
[0081] In various embodiments, the expression levels (e.g., mRNA or protein) of a set of genes are utilized to identify patients who potentially will respond favorably to a specific drug treatment and/or patients who potentially will not respond favorably to a specific drug treatment. One or more genes in the set of genes is differentially
expressed (e.g., overexpressed) in difficult to treat cancers. For example, in some embodiments, the set of genes comprises or consists essentiall of:
or or
 or
or


[0082] It will be appreciated that the accuracy and reliability of a prognosis generally will increase as the number of measured genes in the statistical measure increases. However, it also will be appreciated that the expression of less than all (i.e., a subset) of genes in a given gene set can be measured while still obtaining a clinically acceptable prognosis. For example, in some embodiments, the expression levels of between about 10 and about 25 genes (e.g., 10, 12, 14, 16, 18, 20, 22, 24 or
25 genes) in a given gene set are measured and, more preferably, between about 22 and about 25 genes in a given gene set are measured.
[0083] According to various embodiments, a determination is made, for example, a statistical measure, based on the measured gene expressions levels, as to whether a patient is likely to respond to treatment. Information about the likelihood of a favorable (or unfavorable) response to drug treatment can be displayed or outputted to a user interface device, a computer readable storage medium, or a local or remote computer system. Such information can include, for example, the measured levels of one or more genes, the statistical measure of one or more genes, the likely outcome or prognosis, or an equivalent thereof (e.g., a graph, figure, symbol, etc.). Displaying or outputting information means that the information is communicated to a user using any medium, for example, orally, in writing, by visual display computer readable medium, computer system, or other electronic device (e.g., smart phone, personal digital assistant (PDA), laptop, etc.). It will be clear to one skilled in the art that outputting information is not limited to outputting to a user or a linked external component(s), such as a computer system or computer memory, but can alternatively or additionally be outputted to internal components, such as any computer readable medium. Computer readable media can include, but are not limited to hard drives, floppy disks, CD-ROMs, DVDs, and DATs. Computer readable media does not include carrier waves or other wave forms for data transmission. It will be clear to one skilled in the art that the various sample evaluation and diagnosis methods disclosed and claimed herein, can, but need not be, computer-implemented, and that, for example, the displaying or outputting step can be done by, for example, by communicating to a person orally or in writing (e.g., in handwriting). [0084] According to various embodiments, the measured expression levels of one or more genes, the statistical measure of one or more genes, the likely outcome or prognosis, or an equivalent thereof can be displayed on a screen or a tangible medium or can be transmitted to a person in a medical industry, a medical insurance provider, a health care provider, or to a physician.
[0085] The following examples are provided to illustrate further and to facilitate the understanding of the present teachings and are not in any way intended to limit the invention.
[0086] METHODS
[0087] Datasets: Two MTS expression signatures were derived from publicly available datasets using two meta-analysis methods, namely, MCF-7 and MDA-MB- 231 breast cancer cell lines treated with docetaxel (Hernandez- Vargas, et al., (2006). Molecular profiling of docetaxel cytotoxicity in breast cancer cells: uncoupling of aberrant mitosis and apoptosis. Oncogene), ovarian cancer 1A9 xenografts treated with paclitaxel (Bani, et al., (2004). MoI Cancer Ther, 3:111-121), H460 non-small- cell lung carcinoma cell line treated with paclitaxel (GSE 2182) and A549 non- small-cell lung carcinoma cell line treated with epothilone 906 or docetaxel (Chen, et al., (2003) Cancer Res, 63:7891-7899).
[0088] Gene annotation and Preprocessing: The gene-identifier IMAGE ID and GB_ACC number, attached by the manufacturer to each probe on the chips, was translated to Entrez Gene ID using the publicly available software MatchMiner (www.discover.nci.nih.gov/matchminer). In cases where in one dataset there were multiple Entrez Gene IDs matching one identifier, the first matching EntrezGenelD was used based on the 'chain of responsibility' in MatchMiner. This translation was also used across datasets. In cases where there were multiple Entrez Gene IDs matching one identifier across datasets, the first one was selected and applied across datasets.
[0089] Meta-analysis Methods:
[0090] A) Binomial test and Binomial Test with Probability Correction (BTPC) Method
[0091] The binomial test with probability correction (BTPC) method was used following the application of Entrez Gene IDs to each of the publicly available datasets. The BTPC method delivers a number of genes which are differentially expressed across experiments in one direction and which show a significant difference in the expression level compared to control samples. In the first step the ordinary binomial test was calculated for each gene by using the dichotomized fold change values ("-1" for negative fold change and "1" one positive fold change) and
a significance threshold of p < 0.05. Each gene was assessed for differential expression with the moderated t-test, implemented in the lirnma-package in Bioconductor. The moderated t-test uses a nonparametric empirical Bayes method to shrink the estimated sample variances towards a pooled estimate, resulting in more stable inference when the number of replicates is small. Based on the moderated t-test the p values for each gene were calculated and adjusted for multiple testing by calculating a q value (Storey, et al., (2003) Proc Natl Acad Sci U S A, 100:9440-9445). To account for the quality of the datasets the q values were weighted based on a measure of the spread (the inter quartile range). To filter the genes in a second step, a threshold of the weighted mean q values was used, delivering the signature.
[0092] Following this, a permutation-based false discovery rate (FDR) was calculated to control the genes identified by chance alone. To perform the experiment-wise label permutation simulation, the gene identifiers within one dataset were separated from the values and randomly assigned again. In each permutation a number of genes appear, tagged to be significantly differentially expressed although they are identified by chance alone. Ten permutations were performed and for each permutation the FDR was calculated. The arithmetic mean across all FDRs delivers the overall FDR and therefore the percentage of false positives within the significant genes. Three other meta-analysis methods were calculated and validated by the FDR, but the BTPC method delivered the lowest FDR for up- and down-regulated genes. The standard deviation and the 95% confidence interval for the FDRs were also calculated for each meta-analysis method.
[0093] B) Rank method
[0094] The Rank method delivers a number of genes which are regulated with a specific difference to control samples. The genes within each experiment were sorted by the fold change values and a rank was calculated for each gene. Genes were selected based on a rank threshold of 30. Genes were selected for the signature if they appeared in half or more of the datasets and if in all of those datasets genes
were consistently regulated in one direction with no assessment of significance level.
[0095] CIN Signature: The published CIN signature (CIN70 and CIN27wp) and an extended gene list incorporating the top 5%, 10% and 15% of genes over- expressed in the CIN signature were used in this analysis (Carter, et al., (2006) Nat Genet, 38:1043-1048). Genes were excluded from the final signature (WP) if they were identified as cell cycle regulated transcripts rendering a final gene list: CIN382wp, CIN826wp and CIN1264wp (Whitfield, et al., (2002) MoI Biol Cell, 13:1977-2000).
[0096] TaqMan low-density arrays (TLDA): HCTl 16 hSecurin +/+ and hSecurin -Λ, A549, HCC-2998, SW620, COLO205, HCT-15, KM12, MCF7, MDA- MB-231, HS578T and BT549 cells were plated at 3xlO6 cells per 10cm plate. Twenty-four hours later, cells were treated for additional 24 hours with 0.5x of the cell specific GI50 of paclitaxel. Total RNA was extracted and cDNA synthesized as described above. The TLDAs (Applied Biosystems) used allowed 8 samples to be simultaneously quantified against 47 pre-loaded specifically designed TaqMan assays with the additional 18S RNA and GAPDH TaqMan assay detecting the endogenous controls. For each port, 100 μl reaction mixture was added which contained 2 μl of the 20 μl RT reaction and 2x TaqMan Universal PCR MasterMix. The cards were run on the TLDA block of the 7900 HT Real-Time PCR System (Applied Biosystems). Data analysis was performed using the SDS Relative Quantification software (Applied Biosystems).
[0097] Cell culture and siRNA transfection: HCT-116 wild-type and isogenic hSecurin 1- isogenic cells (Jallepalli, et al., (2001). Securin is required for chromosomal stability in human cells. Cell, 105:445-457) were cultured in
Dulbecco's Modified Eagle's Medium, supplemented with 10% Fetal Bovine Serum (FBS), 2 mM L-Glutamine, 100 μg/ml Streptomycin and 100 U/ml Penicillin at 37°C and 10% CO2. All other cell lines used in this study were from the NCI60 cell panel which are cultured in RPMI medium, supplemented with 10% Fetal Bovine
Serum (FBS), 2% bicarbonate, 2 mM L-Glutamine, 100 μg/ml Streptomycin and 100 U/ml Penicillin at 37°C and 5% CO2.
[0098] The siRNA (25nM) / DharmaFectl (both from Dharmacon) transfection mixture was pipetted before adding 4.5 X lO3 of HCT-116 cells per well of a 96 well plate or 3 X 10⁵ of HCTl 16 cells per well of a 6 well plate in antibiotic-free media. Cells were either processed for analysis or drug-treated 48 hours after transfection.
[0099] Quantification of siKNA cytotoxicity and Acumen Explorer analysis: HCT-116 cells were plated at 6000 cells/well in 96-well plates pre-treated with poly- L lysine. HCT-116 cells underwent reverse transfection with 25nM siRNA and Dharmafect 1 transfection reagent (Dharmacon) according to manufacturer's instructions. Scrambled non-targeting and RISC-free controls were used for each experiment. Forty-eight hours post transfection, cells were prepared for analysis in the Acumen Explorer laser cytometer. Medium was aspirated from the cells and lOOμl 80% ethanol in PBS at -20°C was added to each well and cells were incubated at -20°C for 30 minutes. Each well was then washed twice in PBS and lOOμl of 0.2mg/ml RNAse in PBS was added to each well and incubated for 1 hour at 37°C. The RNAse solution was then aspirated and lOOμl of lOμM propidium iodide was added to each well. The plate was incubated in the dark for 15 minutes prior to analysis on the Acumen Explorer for quantification of cell number and cell cycle profile. The plates were scanned using a 488nm laser at a sampling resolution of lum X direction and 8um in the Y direction. The whole well was selected for scanning. Cells were identified on the basis of size measurements to exclude debris and large clusters of cells from analysis. This cell population was then sub divided into subGl, Gl, S, G2/M, >4n, and 8n sub-populations based on the Total Intensity readout from each cell. The data was exported to give the percentage of cells in each phase of the cell cycle within a well.
[0100] Determination of sub Gl cells and polyploidy by flow cytometry: Cells were fixed with 70% ethanol and incubated with 6μg/ml anti-MPM-2 antibody (Upstate) diluted in PBS/0.2%BSA for Ih. Cells were then washed and incubated with Alexa Fluor® 488 conjugated antibody (Invitrogen) diluted in PBS containing
50 μg/ml RNaseA and 50 μg/ml propidium iodide and analyzed on a LSRII (Becton Dickinson). Cell doublets and debris were excluded from analysis on the basis of their pulse height and area and at least 3x10⁴ events were recorded.
[0101] RNA extraction and cDNA synthesis: Total RNA was extracted using the RNeasy system (Qiagen) following the manufacturer's guidelines. The High- capacity cDNA RT kit (Applied Biosystems) was used to synthesize cDNA from 1 μg of total RNA.
[0102] Real-time RT-PCR quantification of mRNA silencing: Total RNA and cDNA were extracted and synthesized as described above. Real-time PCR was performed using the Fast SYBR Green assay (Applied Biosystems) to measure relative transcript levels of target genes, normalised to 18S or RPS 18 RNA levels. Target-specific QuantiTect primer assays were purchased from Qiagen.
[0103] Survival analysis: The mean of the logged expression levels of CIN survival or MTS repressed genes as a single prognostic factor was tested as a predictor of long term outcome in 9 published datasets (BiId, et al., (2006) Nature, 439:353-357; Chin, et al., (2006) Cancer Cell, 10:529-541; Ivshina, et al., (2006) Cancer Res, 66:10292-10301; Miller, et al., (2005) Proc Natl Acad Sci U S A, 102:13550-13555; Naderi, et al., (2007) Oncogene, 26:1507-1516; van 't Veer, et al., (2002) Nature, 415:530-536; van de Vijver, et al., (2002) N Engl J Med, 347:1999- 2009; Wang, et al., (2005) Lancet, 365:671-679.) Similarly to Carter et al. ((2006) Nat Genet, 38:1043-1048), patients were divided into two groups having above or below median of this average of the CIN survival or MTS expression signature gene expression. For each cohort the prognostic effects of these MTS repressed genes were examined with Kaplan-Meier survival analysis (Kaplan, et al., (1958) J of the American Statistical Association, 53:437-481) and Cox proportional hazard model (Cox, et al., (1984). Analysis of survival data: Chapman and Hall.).
[0104] DNA Image Cytometry: Tissue from 44 surgically removed tumors (Cancer Center Karolinska Institute!, adhering to the guidelines of the local ethical review board) was used for touch preparation slides for quantitative measurement of the nuclear DNA content before it was snap frozen until further processing with
TRIzol reagent (Invitrogen, Carlsbad, CA) for DNA and KNA extraction. The staining procedure on Feulgen-stained touch preparation slides, internal standardization, tumor cell selection and classification of genomic instability status were based on published methods (Kronenwett, et al., (2004) Cancer Res, 64:904- 909; Auer, et al., (1984) Cancer Res, 44:394-396). The tumors were classified as belonging to three groups: (i) diploid cases with a distinct peak in the normal 2c region and no cells exceeding 5c, (ii) aneuploid cases with a main peak different from 2c and a stemline scatter index (SSI) below or equal 8.8, and (iii) aneuploid samples with a varying numbers of cells (>5%) exceeding 5c (SSI above 8.8). This novel classification system adheres to the parameters established by Kronenwett and colleagues (Kronenwett, et al., (2004) Cancer Res, 64:904-909), who defined the stemline scatter index (SSI) as a measurement of clonal heterogeneity in the tumor cell population.
[0105] RESULTS
[0106] Genes repressed by MTS are over-expressed in CIN tumors
[0107] A common MTS gene expression signature was derived by meta-analysis of published microarray datasets from four cancer cell lines and one ovarian cancer xenograft model treated with taxanes or epothilone. The datasets used to derive the MTS response signature are shown in Table Ia. Figure Sl shows the most significant repressed and expressed genes following MTS exposure in the 5 datasets. (See Chen, et al., (2003) Cancer Res, 63:7891-7899; Hernandez-Vargas, et al., (2006). Molecular profiling of docetaxel cytotoxicity in breast cancer cells: uncoupling of aberrant mitosis and apoptosis. Oncogene; Bani, et al., (2004) MoI Cancer Ther, 3 : 111 - 121 ) and GSE2182.
[0108] Using a list of genes with elevated expression in high CIN tumors (Carter, et al., (2006) Nat Genet, 38:1043-1048), it was tested whether genes repressed by MTS treatment tend to be overexpressed in tumors with high levels of CIN. To avoid non-specific gene expression changes caused by the inhibition of cellular proliferation by MTS treatment, cell cycle regulated genes from the CIN70 signature were excluded, leaving a signature of 27 genes (CIN27wp) (Whitfield, et al., (2002)
MoI Biol Cell, 13:1977-2000). The empirical frequency distribution of CIN27wp genes was compared to the gene expression changes across all datasets following MTS exposure using the one sided bootstrap Kolmogorov-Smirnov test (Table Ib and Figure Ia). A significant left shift of the empirical frequency distribution of the CHSf27wp genes (p=3.3e-07) was observed, indicating that genes in the CIN27wp are more likely to be repressed following MTS treatment. Furthermore, it was noted that CIN genes were enriched significantly in the MTS expression signature.
[0109] Comparative data obtained with a different cytotoxic agent, 5-FU, indicate that CIN gene repression is not a general response to cytotoxic agents. Specifically, the enrichment observed with MTS treatment was not evident in the expression signature induced by 5-FU derived by similar methods (Table Ic and Figure S2).
[0110] Furthermore, it was observed that genes over-expressed in CIN tumors are significantly repressed in taxane-sensitive ovarian cancer xenografts, but less repressed in a paclitaxel-resistant xenograft model 24 hours after treatment with 60mg/kg of paclitaxel (Table Id) (Bani, et al., (2004) MoI Cancer Ther, 3:111-121). In addition, ovarian carcinoma data obtained from a CTCR-OVOl stage III/IV ovarian cancer clinical trial show that the majority of the CIN70 and CIN27wp genes were repressed following 3 cycles of paclitaxel chemotherapy (Figure Ib). These results demonstrate that repression of genes associated with CIN occurs following taxane treatment in vivo. Consistent with the ovarian xenograft data, significant repression of the median expression values of the CIN70 signature was observed following paclitaxel therapy (Figure lc-e), with a trend towards greater repression in the most paclitaxel sensitive tumors (Figure Ie). These data suggest that the repression of genes overexpressed in CIN tumors following taxane treatment may be functionally implicated in drug response.
[0111] Validation of MTS repressed genes by real-time PCR
[0112] To test whether the gene expression changes derived from the meta- signature above can be observed following MTS exposure of a cell line not used in the meta-analysis, 50 MTS-repressed genes were identified from the meta-analysis that were also over-expressed in CIN tumors (Figure S3a) (Carter, et al., (2006) Nat
Genet, 38:1043-1048), and among them, 36 of these genes (a number suitable for measurement by qPCR array) were randomly chosen. The near diploid HCT-116 colorectal cancer cell line was exposed to 5OnM paclitaxel and the response was measured by qPCR. The 36 genes tested were consistently repressed following paclitaxel exposure, indicating that the meta-analysis methods reliably detected common MTS-induced gene expression changes independent of tumor type (Figure S3b).
[0113] Identification of CIN-survival genes
[0114] In three independent experiments (Figures 2a-b), it was found that the siRNA induced silencing of 22 of the 50 MTS repressed genes significantly impaired cell viability and/or promoted a greater-than-two-fold increase in subGl DNA content following gene silencing in the HCT-116 cell line. Additionally, silencing all 22 of these genes significantly reduced cell viability in the A549 and MDA-MB-468 cancer cell lines, confirming a role for the expression of these genes in cancer cell survival in multiple tumor types (Figure 2c). Consistent with the contribution of aneuploidy induction following MTS treatment to cell death, 7/22 of these cell viability genes induced aneuploidy following RNAi mediated silencing (Chen, et al, (2002) Cancer Res, 62:1935-1938) (Figure S4a). The viability effects of 7 genes selected for follow-up were validated by siRNA pool deconvolution (Figure S4b), suggesting that these were not off-target effects and confirmed gene silencing by qPCR (Figure S4c).
[0115] In summary, the above results functionally characterized the role of genes overexpressed in CIN tumors that are consistently repressed by MTS agents. The above examples identified 22 "CIN-survival" genes that are overexpressed in CIN tumors, repressed by MTS treatment and impair cancer cell survival when depleted from three cancer cell lines of different tumor origin (flowchart Figure 2d). Conceivably, repression of these genes may contribute to the cytotoxic response following MTS exposure.
[0116] Repression of CIN-survival genes in CINlow but not CINhigh cell lines correlates with paclitaxel cytotoxicity
[0117] As described herein, CIN can be used as a measure of cell-to-cell variability in chromosome number (Geigl, et al., (2008) Trends Genet, 24:64-69). Published SKY data from NCI60 colorectal and breast cancer cell lines were used to define the fraction of normal chromosomes displaying numerical heterogeneity from cell-to-cell as a measure of CIN (Roschke, et al., (2003) Cancer Res, 63 : 8634-8647). In this study, cell lines are categorized as CINlow if <15% of chromosomes displayed numerical heterogeneity and CIN lgh if >40% chromosomes exhibited numerical heterogeneity (Roschke, et al., (2003) Cancer Res, 63:8634-8647).
[0118] To investigate whether the CIN status of a cell line correlates with the gene expression response following MTS treatment, six NCI60 colon cancer cell lines with various degrees of CIN were chosen. Each cell line was treated with a paclitaxel concentration equal to half its Gi50 (drug concentration required for 50% growth inhibition, Table 5) for 24 hours and measured gene expression by qPCR. Cell lines with the lowest frequency of CIN elicited repression of genes identified in the MTS signature, including several CESf-survival genes (Figure 3a). In contrast, CINhigh cell lines (SW620 and COLO205) elicited significantly less repression of the CIN-survival genes compared to near diploid CINlow HCT-116 cells. In agreement, greater repression of CIN-survival genes was observed in the CINlow MCF-7 compared to the CINh'8h BT549 breast cancer cell lines (Figure 85a). The majority of the CIN-survival genes exhibit increased basal expression in CINhlBh cells compared to the CINlow HCT-116 cell line (Figure 3b) in agreement with the published CIN signature (Carter, et al., (2006) Nat Genet, 38:1043-1048).
[0119] It was suspected that the relative resistance of CINh'sh cell lines to paclitaxel-mediated cell death results from the failure of the drug to repress the CIN- survival genes. To address this, tests were performed to determine whether the CIN status of the cell correlates with reduced cell death (assessed by percentage of sub- Gl cells by FACS) in the six colorectal cancer cell lines at different paclitaxel concentrations (Gi50/4, Gi50/2, Gi50 concentration for each cell line; Table 2). It was observed that there is a correlation between increasing CIN status of the six cell lines and an increased proportion of cells arrested in mitosis relative to the percentage of dying cells (MPM2:SubGl ratio) following 24 hours of paclitaxel
treatment (Gi50/4, Gi50/2, Gi50 for each cell line, correlation coefficient 0.80, 95% confidence interval 0.77-0.86). The SW620 and COLO205 CINhigh cell lines that failed to efficiently repress the CIN-survival genes in Figure 3 a, displayed the highest MPM2/SubGl ratios consistent with a cytostatic rather than a cytotoxic response to drug exposure in CINhlsh cells (Figure 3c).
[0120] In addition, tests were performed to determine whether the silencing of CIN-survival genes increases paclitaxel-mediated cytotoxicity and lowers the MPM2/SubGl ratio in the CINhigh cell line, SW620 (Figure 3d). Following silencing of NUP205, H2AFX, CDC6, RPAl and TOP2A, a significant decrease in the MPM2/SubGl ratio (gene silencing was confirmed by qPCR, data not shown) was observed. Silencing of NUP205, H2AFX, CDC6 and RPAl promoted a significant increase in paclitaxel induced cytotoxicity relative to vehicle treated SW620 cells (Figure S5b), strengthening the model that the repression of CIN- survival genes contributes to cytotoxicity following MTS exposure.
[0121] To substantiate the impaired repression of CIN-survival genes in CESf cells following taxane exposure, the repression of these genes in isogenic models of chromosomal instability was investigated. The results showed significantly less repression of the majority of CIN-survival genes tested in the HCT-116 Mad2+/- and early passage HCT-116 hSecuriri ' following 24hrs 5OnM paclitaxel exposure compared to parental control cells (Figures 3e and S5c). These data support the impaired repression of CIN survival genes in CEST tumor cells compared to the diploid isogenic pair following MTS exposure.
[0122] In summary, upon taxane treatment, CDMhl6h cancer cell lines and isogenic CIN models do not repress CIN-survival genes as significantly as CINlow cell lines, and basal expression of these genes is also higher in CIN lgh cell lines. The cytotoxicity of paclitaxel is associated with robust repression of CIN-survival genes that occur in CIN ow cells (Figure 3f). These data indicate that CIN may attenuate the cytotoxic response to MTS exposure through impaired CIN-survival gene repression. Consistent with this hypothesis, cytotoxicity in a CINhlgh cell line can be partially restored by silencing CIN-survival genes.
[0123] CIN ovarian cancers display intrinsic paclitaxel resistance
[0124] The OVOl clinical trial dataset with objective response assessment was used to address whether CIN predicts sensitivity to paclitaxel in contrast to sensitivity to carboplatin in patients with ovarian cancer. Tests were designed to compare the median expression of each CIN70 gene in tumors prior to treatment with paclitaxel or carboplatin monotherapy, and established methods were used to define treatment response according to the fall in serum CA 125 level (Rustin, et al., (2004) J Natl Cancer Inst, 96:487-488). The results showed that the majority of the CIN70 genes are overexpressed in paclitaxel resistant and carboplatin sensitive tumors (Figure 4a). It was observed that high median CIN70 signature expression is associated with paclitaxel resistance and low median expression with paclitaxel sensitivity (p = 0.043). CIN70 signature expression was significantly greater in tumors subsequently resistant to paclitaxel compared to tumors resistant to carboplatin (p = 0.044), supporting the hypothesis that the efficacy of these two cytotoxic agents is differentially altered in CDSf tumors. There was no significant relationship between Ki-67 or ABCBl, ABCB4 and ABCBl 1 expression and response to paclitaxel, supporting the contribution of CIN rather than effects of tumor cell proliferation or drug efflux to paclitaxel resistance (data not shown). There was a strong correlation between the median CIN-survival gene expression and the CIN70 median expression (R=0.93, pO.OOOl) in ovarian cancers derived from this cohort.
[0125] Further tests were performed to investigate whether expression of the CIN signature is increased in residual paclitaxel resistant compared to sensitive tumors. Significant over-expression of CIN70 genes was observed in residual ovarian cancers classified using Rustin criteria as resistant (defined as Ca- 125 coefficient >- 0.5) compared to sensitive tumors (p=0.01, Figure 4b) that was of greater magnitude when taxane-resistant tumors were compared to tumors most sensitive to paclitaxel (defined as Ca-125 coefficient <-l, p = 8.30e-8, Figure 4b). These data suggest that there may be a selection pressure for sustaining CIN in paclitaxel resistant tumors.
[0126] These data indicate that CIN, defined by expression of the CIN signature, may predict subsequent resistance to paclitaxel and sensitivity to carboplatin in vivo.
This provides clinical evidence implicating CIN in pre-treatment tumors as a marker of taxane resistance in vivo and indicates that the efficacy of two common chemotherapy drugs may be differentially influenced by tumor karyotype.
[0127] Relationship of CIN-survival genes to breast cancer molecular subtype and prognosis
[0128] Tests were performed to address the relationship between clinical and pathological variables in breast cancer, for which taxanes form a major component of treatment regimens, with expression of the CIN signature and CIN-survival genes in order to better identify patient cohorts that might selectively benefit from taxane schedules. DNA image cytometry methods were used to assess CIN directly in 44 primaiy breast cancers for which gene expression data were available (GSEl 1901) (Habermann, et al., (2009) Int J Cancer, 124:1552-1564). This technique is applied to the measurement of the nuclear DNA content in clinical samples, including fine needle aspirate cytology and allows assessment of tumor ploidy status and tumor classification into genomically stable and unstable subtypes (Kronenwett, et al., (2004) Cancer Res, 64:904-909). The 44 breast cancers were classified into three groups; Aneuploid, genomically unstable breast cancers (aGU) which show a larger distribution in their image analysis-quantified DNA content relative to aneuploid, genomically stable (aGS) or diploid, genomically stable (dGS) tumors (clinical data Table 3). The expression levels of the CIN signature and CIN-survival genes in each of these tumors classified for genomic instability status and clinicopathological subtype were assessed by the median centroid method. aGU breast cancers displayed significantly higher expression of the CIN70 (p=4e-04), CIN27wp (p=0.027) and the CIN-survival gene (p=0.0024) signature set than aGS or dGS breast cancer samples (Figure 4c) confirming that expression of the CIN70 and CIN- survival signatures reflect CIN in vivo. The aGU tumors that displayed the highest expression of the CIN and CIN-survival gene signatures, incorporated 9/9 basal-like breast cancers and 6 of the 9 Her2-positive cancers in the 44 patient cohort.
[0129] It has been reported that CIN70 expression signature carries prognostic significance in breast cancer (Carter, et al., (2006) Nat Genet, 38:1043-1048). Consistent with these results, over-expression of CIN-survival genes correlated
significantly with poorer disease-free or disease-specific survival (P <0.05 log-rank test) with an increased hazard ratio for death or relapse in three of four untreated estrogen receptor positive breast cancer cohorts studied (Figure S5b and Sweave analysis).
[0130] In summary, CIN-survival gene expression is highly correlated both with the CIN signature in vivo and CIN determined by DNA image cytometry. The CESf signature (Carter, et al., (2006) Nat Genet, 38:1043-1048) and CIN-survival gene expression carry prognostic power in breast cancer, and the CIN signature carries predictive power and may serve as a surrogate marker for taxane resistance and carboplatin sensitivity in ovarian cancer.
[0131] The use of headings and sections in the application is not meant to limit the present teachings; each section can apply to any aspect, embodiment, or feature of the present teachings.
[0132] Throughout the application, where compositions are described as having, including, or comprising specific components, or where processes are described as having, including or comprising specific process steps, it is contemplated that compositions of the present teachings also consist essentially of, or consist of, the recited components, and that the processes of the present teachings also consist essentially of, or consist of, the recited process steps.
[0133] In the application, where an element or component is said to be included in and/or selected from a list of recited elements or components, it should be understood that the element or component can be any one of the recited elements or components, or can be selected from a group consisting of two or more of the recited elements or components. Further, it should be understood that elements and/or features of a composition, an apparatus, or a method described herein can be combined in a variety of ways without departing from the spirit and scope of the present teachings, whether explicit or implicit herein.
[0134] The use of the terms "include," "includes," "including," "have," "has," or "having" should be generally understood as open-ended and non-limiting unless specifically stated otherwise.
[0135] The use of the singular herein includes the plural (and vice versa) unless specifically stated otherwise. Moreover, the singular forms "a," "an," and "the" include plural forms unless the context clearly dictates otherwise. In addition, where the use of the term "about" is before a quantitative value, the present teachings also include the specific quantitative value itself, unless specifically stated otherwise. As used herein, the term "about" refers to a ±10% variation from the nominal value, unless otherwise indicated or inferred.
[0136] It should be understood that the order of steps or order for performing certain actions is immaterial so long as the present teachings remain operable. Moreover, two or more steps or actions may be conducted simultaneously.
[0137] Where a range or list of values is provided, each intervening value between the upper and lower limits of that range or list of values is individually contemplated and is encompassed within the present teachings as if each value were specifically enumerated herein. In addition, smaller ranges between and including the upper and lower limits of a given range are contemplated and encompassed within the present teachings. The listing of exemplary values or ranges is not a disclaimer of other values or ranges between and including the upper and lower limits of a given range.
[0138] The present teachings encompass embodiments in other specific foπns without departing from the spirit or essential characteristics thereof. The foregoing embodiments are therefore to be considered in all respects illustrative rather than limiting on the present teachings described herein. Scope of the present invention is thus indicated by the appended claims rather than by the foregoing description, and all changes that come within the meaning and range of equivalency of the claims are intended to be embraced therein.
[0139] What is claimed is:
Claims
1. A method of predicting the clinical outcome of treating a patient having a tumor using one or more microtubule stabilizing (MTS) drugs, the method comprising: measuring, in a sample comprising a tumor cell from a patient, the mRNA expression levels of at least 10 of the following genes:

2. The method of claim 1, wherein the mRNA expression levels of 10, 15, 20, or 22 of the following genes is measured.
3. The method of claim 1 or 2, comprising the step of administering a MTS drug to the patient.
4. The method of claim 3, comprising the step of measuring mRNA expression levels at one or more times after administration of the MTS drug to the patient.
5. The method of any one of the preceding claims, wherein the statistical measure of the mRNA expression level of the measured genes is a linear combination of the mRNA expression level of the genes.
6. The method of claim 5, wherein the linear combination of the mRNA expression level of the genes is the mean of logarithms of the mRNA expression levels.
7. The method of any one of the preceding claims, wherein measuring the mRNA expression levels comprises using a microarray or PCR.
8. The method of any one of the preceding claims, wherein the tumor is a solid tumor.
9. The method of claim 8, wherein the solid tumor is of a cancer selected from breast cancer, ovarian cancer, colorectal cancer, lung cancer, prostate cancer, medulloblastoma, glioma, and lymphoma.
10. The method of any one of the preceding claims, wherein the MTS drug is a taxane.
11. The method of claim 10, wherein the taxane is paclitaxel.
12. The method of claim 10, wherein the taxane is docetaxel.
13. The method of any one of claims 1-9, wherein the MTS drug is epothilone.
14. A method of selecting a treatment for a patient having a tumor, the method comprising: measuring, in a sample comprising a tumor cell from a patient, the mRNA expression levels of at least 15 genes of the following set of genes:  taking a statistical measure of the mKNA expression level of the measured genes; and if the statistical measure of the mRNA expression level of the measured genes is elevated, determining that the patient is a responder to carboplatin drug treatment.
15. The method of claim 14, wherein the mRNA expression levels of 20, 25, 30, 35, 40, or 50 or more of the following genes is measured.
16. The method of claim 14, wherein the mRNA expression levels are measured before onset of paclitaxel or carboplatin drug treatment.
17. The method of any one of claims 14-16, wherein the statistical measure of the mRNA expression level of the measured genes is a linear combination of the mRNA expression level of the genes.
18. The method of claim 17, wherein the linear combination of the mRNA expression level of the genes is the mean of logarithms of the mRNA expression levels.
19. The method of any one of claims 14-18, wherein measuring the mRNA expression levels comprises using a microarray or PCR.
20. The method of any one of claims 14-19, wherein the tumor is a solid tumor.
21. The method of claim 20 wherein the solid tumor is of a cancer selected from breast cancer, ovarian cancer, colorectal cancer, lung cancer, prostate cancer, medulloblastoma, glioma, and lymphoma.
22. The method of claim 14, comprising recommending administration of carboplatin to the patient.
23. The method of claim 14, comprising administering carboplatin.
Applications Claiming Priority (2)
| Application Number | Priority Date | Filing Date | Title |
|---|---|---|---|
| US17578109P | 2009-05-05 | 2009-05-05 | |
| US61/175,781 | 2009-05-05 |
Publications (1)
| Publication Number | Publication Date |
|---|---|
| WO2010144192A1 true WO2010144192A1 (en) | 2010-12-16 |
Family
ID=43309154
Family Applications (1)
| Application Number | Title | Priority Date | Filing Date |
|---|---|---|---|
| PCT/US2010/033755 Ceased WO2010144192A1 (en) | 2009-05-05 | 2010-05-05 | Prognosis indicators for solid human tumors |
Country Status (1)
| Country | Link |
|---|---|
| WO (1) | WO2010144192A1 (en) |
Cited By (8)
| Publication number | Priority date | Publication date | Assignee | Title |
|---|---|---|---|---|
| WO2012095448A1 (en) * | 2011-01-11 | 2012-07-19 | INSERM (Institut National de la Santé et de la Recherche Médicale) | Methods for predicting the outcome of a cancer in a patient by analysing gene expression |
| WO2014009535A3 (en) * | 2012-07-12 | 2014-04-17 | INSERM (Institut National de la Santé et de la Recherche Médicale) | Methods for predicting the survival time and treatment responsiveness of a patient suffering from a solid cancer with a signature of at least 7 genes |
| RU2740576C1 (en) * | 2019-11-06 | 2021-01-15 | федеральное государственное бюджетное учреждение "Национальный медицинский исследовательский центр онкологии" Министерства здравоохранения Российской Федерации | Minimally invasive method for detecting sensitivity of rectal tumour to radiation therapy based on change in abundance of n2ax and rbbp8 genes |
| US11098121B2 (en) | 2015-09-10 | 2021-08-24 | Cancer Research Technology Limited | “Immune checkpoint intervention” in cancer |
| WO2021164492A1 (en) * | 2020-02-19 | 2021-08-26 | 伯克利南京医学研究有限责任公司 | Application of a group of genes related to colon cancer prognosis |
| CN118506851A (en) * | 2024-05-22 | 2024-08-16 | 北京壹永科技有限公司 | Method for constructing tumor malignant cell gene prognosis risk model |
| WO2024213483A1 (en) * | 2023-04-13 | 2024-10-17 | Pregenerate Gmbh | Evaluation of treatment efficacy |
| WO2024213484A1 (en) * | 2023-04-13 | 2024-10-17 | Pregenerate Gmbh | Analysis of treatment efficacy |
Citations (2)
| Publication number | Priority date | Publication date | Assignee | Title |
|---|---|---|---|---|
| WO2007070621A2 (en) * | 2005-12-13 | 2007-06-21 | Children's Medical Center Corporation | Prognosis indicators for solid human tumors |
| US20090023149A1 (en) * | 2005-12-01 | 2009-01-22 | Steen Knudsen | Methods, kits and devices for identifying biomarkers of treatment response and use thereof to predict treatment efficacy |
-
2010
- 2010-05-05 WO PCT/US2010/033755 patent/WO2010144192A1/en not_active Ceased
Patent Citations (2)
| Publication number | Priority date | Publication date | Assignee | Title |
|---|---|---|---|---|
| US20090023149A1 (en) * | 2005-12-01 | 2009-01-22 | Steen Knudsen | Methods, kits and devices for identifying biomarkers of treatment response and use thereof to predict treatment efficacy |
| WO2007070621A2 (en) * | 2005-12-13 | 2007-06-21 | Children's Medical Center Corporation | Prognosis indicators for solid human tumors |
Cited By (14)
| Publication number | Priority date | Publication date | Assignee | Title |
|---|---|---|---|---|
| EP3141617A3 (en) * | 2011-01-11 | 2017-04-19 | INSERM (Institut National de la Santé et de la Recherche Médicale) | Methods for predicting the outcome of a cancer in a patient by analysing gene expression |
| WO2012095448A1 (en) * | 2011-01-11 | 2012-07-19 | INSERM (Institut National de la Santé et de la Recherche Médicale) | Methods for predicting the outcome of a cancer in a patient by analysing gene expression |
| US11242564B2 (en) | 2012-07-12 | 2022-02-08 | Inserm (Institut National De La Sante Et De La Recherche Medicale) | Methods for predicting the survival time and treatment responsiveness of a patient suffering from a solid cancer with a signature of at least 7 genes |
| JP2015528698A (en) * | 2012-07-12 | 2015-10-01 | アンスティチュ ナショナル ドゥ ラ サンテ エ ドゥ ラ ルシェルシュ メディカル | Method for predicting survival and responsiveness to treatment of a patient with solid cancer using a signature of at least 7 genes |
| JP2019162138A (en) * | 2012-07-12 | 2019-09-26 | アンスティチュ ナショナル ドゥ ラ サンテ エ ドゥ ラ ルシェルシュ メディカル | Methods for predicting survival time and treatment responsiveness of a patient suffering from a solid tumor using a signature of at least seven genes |
| JP2021166539A (en) * | 2012-07-12 | 2021-10-21 | アンスティチュ ナショナル ドゥ ラ サンテ エ ドゥ ラ ルシェルシュ メディカル | Methods for predicting survival time and treatment responsiveness of a patient suffering from a solid tumor using a signature of at least seven genes |
| WO2014009535A3 (en) * | 2012-07-12 | 2014-04-17 | INSERM (Institut National de la Santé et de la Recherche Médicale) | Methods for predicting the survival time and treatment responsiveness of a patient suffering from a solid cancer with a signature of at least 7 genes |
| JP7378443B2 (en) | 2012-07-12 | 2023-11-13 | アンスティチュ ナショナル ドゥ ラ サンテ エ ドゥ ラ ルシェルシュ メディカル | A method for predicting survival and response to treatment in patients with solid tumors using a signature of at least seven genes. |
| US11098121B2 (en) | 2015-09-10 | 2021-08-24 | Cancer Research Technology Limited | “Immune checkpoint intervention” in cancer |
| RU2740576C1 (en) * | 2019-11-06 | 2021-01-15 | федеральное государственное бюджетное учреждение "Национальный медицинский исследовательский центр онкологии" Министерства здравоохранения Российской Федерации | Minimally invasive method for detecting sensitivity of rectal tumour to radiation therapy based on change in abundance of n2ax and rbbp8 genes |
| WO2021164492A1 (en) * | 2020-02-19 | 2021-08-26 | 伯克利南京医学研究有限责任公司 | Application of a group of genes related to colon cancer prognosis |
| WO2024213483A1 (en) * | 2023-04-13 | 2024-10-17 | Pregenerate Gmbh | Evaluation of treatment efficacy |
| WO2024213484A1 (en) * | 2023-04-13 | 2024-10-17 | Pregenerate Gmbh | Analysis of treatment efficacy |
| CN118506851A (en) * | 2024-05-22 | 2024-08-16 | 北京壹永科技有限公司 | Method for constructing tumor malignant cell gene prognosis risk model |
Similar Documents
| Publication | Publication Date | Title |
|---|---|---|
| Resnick et al. | The detection of differentially expressed microRNAs from the serum of ovarian cancer patients using a novel real-time PCR platform | |
| Eitan et al. | Tumor microRNA expression patterns associated with resistance to platinum based chemotherapy and survival in ovarian cancer patients | |
| Han et al. | miRNAs as biomarkers and for the early detection of non-small cell lung cancer (NSCLC) | |
| Singh et al. | Global changes in processing of mRNA 3′ untranslated regions characterize clinically distinct cancer subtypes | |
| JP5230619B2 (en) | MicroRNA-based methods and compositions for the diagnosis and treatment of colon cancer-related diseases | |
| WO2010144192A1 (en) | Prognosis indicators for solid human tumors | |
| Wang et al. | MicroRNA-143-3p, up-regulated in H. pylori-positive gastric cancer, suppresses tumor growth, migration and invasion by directly targeting AKT2 | |
| Chong et al. | Differential microRNA expression profiles in primary and recurrent epithelial ovarian cancer | |
| Díaz-García et al. | DICER1, DROSHA and miRNAs in patients with non-small cell lung cancer: implications for outcomes and histologic classification | |
| US20120214679A1 (en) | Methods and systems for evaluating the sensitivity or resistance of tumor specimens to chemotherapeutic agents | |
| Dong et al. | The clinical significance of MiR-429 as a predictive biomarker in colorectal cancer patients receiving 5-fluorouracil treatment | |
| Wu et al. | Long noncoding RNA HOTTIP expression predicts tumor recurrence in hepatocellular carcinoma patients following liver transplantation | |
| WO2013133876A1 (en) | Biomarkers for prediction of response to parp inhibition in breast cancer | |
| US11993816B2 (en) | Circulating microRNA as biomarkers for endometriosis | |
| WO2007070621A2 (en) | Prognosis indicators for solid human tumors | |
| Liu et al. | Signature of seven cuproptosis-related lncRNAs as a novel biomarker to predict prognosis and therapeutic response in cervical cancer | |
| US20160376661A1 (en) | A method for predicting responsiveness to a treatment with an egfr inhibitor | |
| Yin et al. | Peripheral blood circulating microRNA‐4636/− 143 for the prognosis of cervical cancer | |
| Tian et al. | LINC01614 is a promising diagnostic and prognostic marker in HNSC linked to the tumor microenvironment and oncogenic function | |
| WO2013072465A1 (en) | Dual gene expression signature to predict clinical outcome and therapeutic response of a patient affected with a cancer | |
| Seputra et al. | miRNA-21 Serum evaluation in BPH, hormone sensitive prostate cancer, and castrate resistant prostate cancer: attempt for diagnostic biomarker evaluation | |
| Condello et al. | Alterations in gene expression associated with invasion of RAS-mutant thyroid tumors and their potential diagnostic and therapeutic utility | |
| US9771618B2 (en) | Methods for treating breast cancer | |
| CN110592223B (en) | Application of a diagnostic and prognostic marker hsa_circRNA_012515 for NSCLC | |
| Zhang et al. | Hsa_circ_0023642 promotes proliferation, invasion, and migration of gastric cancer by sponging microRNA‐223 |
Legal Events
| Date | Code | Title | Description |
|---|---|---|---|
| 121 | Ep: the epo has been informed by wipo that ep was designated in this application |
Ref document number: 10786538 Country of ref document: EP Kind code of ref document: A1 |
|
| NENP | Non-entry into the national phase |
Ref country code: DE |
|
| 122 | Ep: pct application non-entry in european phase |
Ref document number: 10786538 Country of ref document: EP Kind code of ref document: A1 |