TUMOR-INITIATING CELLS AND METHODS FOR USING SAME
RELATED APPLICATION
Priority is claimed to U.S. Provisional Application No. 61/164,272, filed 27 March 2009, which is hereby incorporated herein by reference in its entirety.
FIELD OF THE INVENTION
The present invention generally relates to highly tumorigenic cells, also called cancer stem cells or tumor-initiating cells, methods for isolating same and tumor-initiating cell markers for use in said methods. More particularly, the present invention relates to tumor-initiating cells having high levels of 5T4 expression (5T4high), optionally with no or low levels of CD24 expression (CD24- /low) and with CD44 expression (CD44+). The disclosed tumor-initiating cell populations are useful for identification of new drugs and targets for cancer therapy, and for testing the efficacy of existing cancer drugs.
BACKGROUND OF THE INVENTION
Signaling pathways that regulate self-renewal and differentiation contribute to the cellular heterogeneity within tumors. The varying states of self- renewal and differentiation are evidenced by tumor subpopulations and individual tumor cells that exhibit disparate levels of in vivo tumorigenicity and in vitro clonogenicity. See Lobo et al., Annυ. Rev. Cell Dev. Biol., 2007 23: 675-699; Reya et al, Nature, 2001 , 414: 105-111. The development of new tumor models has begun to enable the characterization of tumor heterogeneity at cellular levels. Implants of solid tumors in immunocompromised mice exhibit a rich architecture that reflects the histology of the original sample but that is not recapitulated in xenografts from cell lines cultured in serum. The culturing of cancer cells in defined serum-free media and/or three-dimensional matrices preserves the physiological characteristics of the cells more than culturing in media with serum (Lee et al., Cancer Cell, 2006, 9: 391-403). Fluorescence-
activated cell sorting (FACS) of cells from tumors, xenografts, and cell lines has facilitated the molecular characterization of specific tumor sub-populations.
In many tumors, cells defined by specific surface markers form tumors more efficiently than other cells in the same tumor. These cells are alternately referred to as multipotent tumor-initiating cells, cancer stem cells, tumor-initiating cells, and cancer-initiating cells. Tumor-initiating cells were first identified in the hematopoietic system (Bonnet & Dick, Nat. Med., 1997, 3(7): 730-737) and have since been identified in solid tumors, including tumors of the brain, breast, colon, head and neck, lung, melanoma, pancreas, and prostate. See Visvader & Lindeman, Nat Rev. Cancer, 2008, 8: 755-768 and reference cited therein. In a particular tumor type, the same set of cell surface markers can be used to isolate tumor-initiating cells from fresh tumor samples, xenografts, and cell lines. See e.g., Al-Hajj et al., Proc. Natl. Acad. Sci. USA, 2003, 100: 3983-3988; Filmore & Kuperwasser, Breast Cancer Res., 2008, 10: R25; Hermann et al., Cell Stem Cell, 2007, 1 : 313-323; Matsui et al., Bl∞d, 2004, 103: 2332-2336. CD44, a marker of tumor-initiating cells in several tumor types, was recently shown to have a direct role in tumorigenesis and to be repressed by p53 (Godar et al., Ce//, 2008, 134: 62-73).
Tumor-initiating cells show resistance to standard therapies. For example, tumor-initiating cells were highly enriched in samples from breast cancer patients that had received chemotherapy, suggesting an explanation for disease relapse following treatment (Yu et al., Cell, 2007, 131 : 1109-1123). Similarly, CD133+ tumor-initiating cells in glioblastoma were resistant to irradiation that eradicated the more prevalent CD133" cells (Bao et al., Cancer Res., 2006, 68: 6043-6048). Thus, in the context of therapy, eliminating tumor-initiating cells might require targeting mechanisms other than those used to target the bulk of the tumor.
To develop treatments that significantly increase long-term patient survival in cancer, tumor-initiating cells responsible for tumor recurrence and metastasis represent an important therapeutic target for this disease. To meet this need, the present invention provides isolated and enriched populations of tumor-initiating cells that can be used to test the efficacy of new and existing cancer drugs.
SUMMARY OF THE INVENTION
The present invention provides isolated and enriched tumor-initiating cell populations. In one aspect of the invention, an isolated tumor-initiating cell population is derived from a tumor cell population comprising at least 90% tumor- initiating cells, wherein the tumor-initiating cells (i) express 5T4 at a level that is at least 2-fold higher than non-tumorigenic cells of the same origin, (ii) are tumorigenic, (iii) are capable of migration, (iv) are capable of self-renewal, and (v) generate tumors comprising non-tumorigenic cells. In another aspect of the invention, an enriched tumor-initiating cell population is provided, which is derived from a tumor cell population comprising tumor-initiating cells and non- tumorigenic cells, and wherein the tumor-initiating cells (i) express 5T4 at a level that is at least 2-fold higher than non-tumorigenic cells of the same origin, (ii) are tumorigenic, (iii) are capable of migration, (iv) are capable of self-renewal, (v) generate tumors comprising non-tumorigenic cells, and (vi) are enriched at least 2-fold compared to the tumor cell population. The isolated or enriched tumor- initiating populations may also express CD24 at a level that is at least 2-fold lower than non-tumorigenic cells of the same origin, and/or express CD44.
Also provided are methods of preparing isolated and enriched tumor- initiating cell populations. For example, a representative method of isolating or enriching a tumor-initiating cell population includes the steps of (a) providing dissociated tumor cells, wherein a majority of the cells express 5T4 at a low level and a minority of the cells express 5T4 at a high level; (b) contacting the dissociated tumor cells with an agent that specifically binds to 5T4; and (c) selecting cells that specifically bind to the agent of (b) to an extent that shows a high level of 5T4 expression that is at least about 2-fold greater than the low level; whereby a tumor-initiating cell population is isolated or enriched. Optionally, the methods for preparing an isolated or enriched 5T4 expressing tunor initiating cell population include the additional steps of contacting the dissociated tumor cells with an agent that specifically binds to CD44; and selecting cells that specifically bind to the agent of to an extent that shows
expression of CD44. Optionally, the methods for preparing an isolated or enriched 5T4 expressing tunor initiating cell population may also include the steps of contacting the dissociated tumor cells with an agent that specifically binds to CD24; and selecting cells that specifically bind to the agent of to an extent that shows a low level of CD24 expression that is at least about 5-fold lower than non-tumorigenic cells of the same origin. Alternatively, the tumor initiating cell population can be enriched through culturing the primrary tumor cells in serum free conditions. In yet another representative method of the invention, isolating or enriching a 5T4 expressing tumor-initiating cell population can include contacting the dissociated tumor cells with an agent that specifically binds to CD24; and depleting cells that specifically bind to the agent of to an extent that shows a high level of CD24 expression that is at least about 5-fold greater than non-tumorigenic cells of the same origin.
Still further are provided methods of testing efficacy of a cancer drug or candidate cancer drug using the disclosed isolated or enriched tumor-initiating cell populations. For example, such methods can include the steps of (a) providing an isolated or enriched tumor-initiating cell population; (b) contacting the tumor-initiating cells with a cancer drug or a candidate cancer drug; (c) observing a change in tumorigenic potential of the tumor-initiating cells following contacting the tumor-initiating cells with the cancer drug or candidate cancer drug.
BRIEF DESCRIPTION OF THE DRAWINGS
Figures 1A-1H show that the CD24-/lowCD44+ cell phenotype marks tumor- initiating cells in the H460T non-small cell lung cancer line (NSCLC). CD24" -/lowCD44+ cells are labeled "CD24-/low" and CD24highCD44+ cells are labeled "CD24high".
Figure 1A shows the results of flow cytometric analysis using expression of CD24 and CD44. Distinct populations of H460T were revealed by flow cytometry and labeling with anti-CD24 and anti-CD44 antibodies.
Figure 1 B shows mice that received subcutaneous implants of CD24- /lowCD44+ cells or CD24highCD44+ cells. Arrows, sites of implantation.
Figure 1C is a line graph showing a quantitative analysis results of the observation in Figure 1 B. Values indicate the average tumor measurement ±SEM (standard error of the mean).
Figure 1D is a line graph showing CD44 tumorigenesis based uon CD44 expression in H460T cells. CD24-/lowCD44high and CD24--/low CD44l0W cells were sorted and implanted subcutaneously into mice. Values indicate the average tumor measurement ±SEM. Figure 1 E a line graph showing spheroid growth of sorted populations.
FACS-isolated CD24-/low CD44+ or CD24highCD44+ cells were cultured in suspension for 5 days to promote spheroid formation. Spheroids of 0.2mm diameter were transferred to individual wells of a 24-well plate and measured over a two-week time course. Values indicate the average spheroid volume ±SD (standard deviation of the mean).
Figure 1 F a line graph showing the differential response of CD24- /lowCD44high and CD24--/lowCD44low populations to mTOR inhibitor CCI-779.
Figure 1 G is a bar graph showing the results of a transwell migration assay. CD24-/lowCD44+ cells migrated efficiently in response to serum. The CD24--/lowCD44+ value shows the average cell number normalized to CD24highCD44+ for each experiment (±SD (n=4)).
Figure 1H shows micrographs depicting efficient migration on fibronectin of CD24~/lowCD44+ spheroids 72 hours after spheroids were placed on fibronectin- coated slides. Figures 2A-2E show the multipotency of C D24-/lowC D44+ cells in H460T.
CD24"-/lowCD44+ cells are labeled "CD24 -/low and CD24highCD44+ cells are labeled "CD24high".
Figure 2A shows the results of flow cytometric analysis of CD24-/lowCD44+ cells and CD24hιghCD44+ following a three week culture. Distinct populations are revealed based upon CD24 and CD44 expression.
Figure 2B shows the results of flow cytometric analysis of CD24 and CD44 expression in a representative tumor from sorted CD24-/lowCD44+ cells.
Figure 2C shows the results of flow cytometric analysis of CD24 and
CD44 expression in clonal lines established from single sorted CD24-/lowCD44+ or CD24highCD44+ cells. The proportion of CD24high cells in the transitioning CD24-
/low clones ranged from 10-70% depending on the clone. The CD24 distribution in each clone was steady over months in culture.
Figure 2D a line graph showing tumor growth from clonal lines presented in Figure 2C. CD24-/low cells were sorted from CD24-"OW clones and CD24high cells were sorted from CD24hιgh clones. Values indicate the average tumor measurement ±SEM. Tr, transitioning clone; St, stable clone.
Figure 2E a line graph showing tumor growth of CD24- /low and CD24high cells FACS-isolated from transitioning CD24--/low clones. Values indicate the average tumor measurement ±SEM. Figures 3A-3C show the multipotency of H460T cells sorted based upon
CD24 expression.
Figure 3A is a schematic drawing of the experimental design. Sorted cells were labeled with 2.5 μM CFSE (Invitrogen of Carlsbad, California, USA), washed extensively, and then plated with another sorted population in the ratio of the parent population (1 CD24--/lowCD44+ to 3 CD24highCD44+). CFSE at 2.5 μM had little or no effect on the growth of H460T cells over the time course of this experiment. After three days, cultures were analyzed for CD24, and the initial populations could be distinguished based on CFSE.
Figure 3B shows the results of flow cytometric analysis of labeled and unlabeled populations cultured individually or in combination.
Figure 3C is a histogram of replicate experiments shown in Figure 3B. The transition of CD24- /lowCD44+ cells to CD24highCD44+ was comparable when the cells were cultured alone or co-cultured with CD24highCD44+ or CD24" /lowCD44+ cells. The stability of the CD24highCD44+ phenotype was observed when CD24highCD44+ cells were cultured alone or co-cultured with CD24" -/lowCD44+ or CD24highCD44+ cells.
Figures 4A-4C show CD24-/low identifies tumor-initiating cells in cultured HCC2429 cells.
Figure 4A shows the results of flow cytometric analysis of HCC2429 based on CD24 expression. Figure 4B is a line graph showing differential tumorigenicity of CD24- -/lowCD44+ or CD24highCD44+ HCC2429 populations. Values indicate the average tumor measurement ±SEM.
Figure 4C shows the results of flow cytometric analysis of CD24-/lowCD44+ or CD24highCD44* populations 2 weeks after sorting. Cultured CD24 /lowCD44+ cells can transition to CD24highCD44+, but CD24highCD44+ do not transition to CD24-/low CD44+ cells.
Figure 5 is a bar graph showing CD24 mRNA levels on Affymetrix GENECHIP® oligonucleotide arrays hybridized with triplicate samples of mRNA transcripts prepared from CD24-/lowCD44+ and CD24highCD44+ cells. Figures 6A-6B show that the oncofetal protein 5T4 (TPBG) is expressed in
H460T multipotent tumor-initiating cells.
Figure 6A is a bar graph showing 5T4 (TPBG) mRNA levels on Affymetrix GENECHIP® oligonucleotide arrays hybridized with mRNA transcripts prepared from CD24--/lowCD44+ and CD24highCD44+ cells. Values indicate the average of triplicate samples ± SD.
Figure 6B shows the results of immunoblot analysis to detect 5T4 expression in CD24VlowCD44+ and CD24highCD44+ cells grown in media or treated with vehicle or all-trans retinoic acid.
Figures 7A-7G show gene expression profiles associated with undifferentiated and differientiated 87426 primary culture cells.
Figure 7A shows micrographs of the 87426 primary culture of NSCLC under conditions that promote growth (left) and differentiation at the air-liquid interface (right). Scale bars, 200 μM.
Figure 7B shows the results of immunoblot analysis to detect 5T4 expression at the indicated time points during differentiation.
Figure 7C shows mRNA levels on Affymetrix GENECHIP® oligonucleotide arrays hybridized with mRNA transcripts prepared from primary culture lung cancer cells under conditions of growth or differentiation. Values represent averages ±SD. FN1 , fibronectin; VIM, vimentin. Figure 7D shows the results of gene profiling experiments to compare gene expression in the cell line culture (H460T) and primary culture (87426A1) tumor models. See Example 3. The expression difference for genes that are above noise level in the H460T data set were compared. Statistical analysis yielded the False Discovery Rate of 0.0015. Figure 7E is a bar graph showing mRNA levels of CD24 and CD44 in serum-free primary culture of 87426 cells at days 0, 12, and 24 of differentiation. Cultures were maintained in BEBM growth medium or differentiated for 12 and 24 days in CnT-23 medium containing 5OnM retinoic acid and 1mM CaCI2, without exposing cells to the air-liquid interface. Figure 7F shows the distribution of CD24 and CD44 expression in duplicate samples from the experiment presented in in Figure 7D. After 12 days of differentiation as a monolayer culture, the levels of cell surface CD24 expression increased and were retained up to 24 days. Cell surface levels of CD44 expression were decreased by 12 days and declined further by 24 days of differentiation.
Figure 7G is a bar graph showing mRNA levels of angiogenesis factors in serum-free primary culture of 87426 cells at day 0, 12, and 24 of differentiation. The levels of mRNA were determined using gene expression profiling as described in Example 6. Figures 8A-8B show heterogeneous 5T4 expression in NSCLC primary implant xenografts.
Figure 8A shows flow cytometric analysis of 5T4 expression in dissociated xenografts from the 37622 line (left panel), cultured cells established from 37622 xenografts in serum-free medium (middle panel; shown after five weeks in culture), and in xenografts of implanted cells of the serum-free culture (right panel).
Figure 8B is a table showing tumor incidence in animals that were implanted with 5T4high or 5T4low cells from dissociated 37622 or 60257 xenografts (#1 , #2 indicate replicate experiments).
Figures 9A-9D show that Sox-2 induces differentiation of CD24-/low cells. Figure 9A is a bar graph showing Sox-2 mRNA levels from Affymetrix
GENECHIP® oligonucleotide arrays hybridized with transcripts prepared from CD24-ΛOW dones
Figure 9B shows the results of immunoblot analysis to detect Sox-2 and Sox-11 transcripts in stable CD24-/low clones transfected with Sox-2-Flag, Sox-11- Flag, empty vector, or no DNA. Cells were harvested 24 hours after transfection and subjected to immunoblot with anti-Flag (top) or anti-β-actin antibody.
Figure 9C shows the results of flow cytometric analysis of CD24 in stable CD24-/low clones transfected with Sox-2-Flag, Sox-11-Flag, empty vector, or no DNA after three weeks in culture. Figure 9D is a histogram of the data presented in Figure 9C showing the percentage of CD24hιgh cells in each sample.
Figures 10A-10B show sensitivity of CD24-/lowCD44+ cells to an anti-5T4- calicheamicin conjugate. CD24-/lowCD44+ cells are labeled "CD24-/low " and CD24highCD44+ cells are labeled «CD24high". Figure 1OA is a line graph showing the results of a four-day MTS assay.
Crosshairs indicate the sensitivity to free calicheamicin.
Figure 10B is a line graph showing the results of a clonogenic assay. Crosshairs indicate the sensitivity to free calicheamicin.
Figure 11 is a line graph that showstumor growth of 5T4high and 5T4low cells in H460T clonal line 24N-26, which showed higher expression than in the
H460T parental cell line. Cells were sorted based upon 5T4 expression and implanted subcutaneously into mice. Values indicate the average tumor measurement ±SEM.
Figures 12A-12C show tumor volume regression of primary implant xenografts treated with an anti-5T4 antibody-calicheamicin conjugate. Diamond,
vehicle; square, anti-5T4-calicheamicin conjugate; circle, anti-CD33- calicheamicin conjugate; triangle, cisplatin; asterisk (*), p<0.05.
Figure 12A is a line graph showing tumor volume regression of 37622 xenografts following treatment with anti-5T4 antibody-calicheamicin conjugate. Animals were administered anti-5T4 antibody-calicheamicin conjugate on days 1 , 5, and 9 after staging. Values indicate average tumor volume ±SEM.
Figure 12B a line graph showing tumor volume regression of 60274 xenografts following treatment with anti-5T4 antibody-calicheamicin conjugate. Animals were administered anti-5T4 antibody-calicheamicin conjugate on days 1 , 5, and 9 after staging. Values indicate average tumor volume ±SEM.
Figure 12C a line graph showing tumor volume regression of 60274 xenografts following treatment with anti-5T4 antibody-calicheamicin conjugate. Animals were administered anti-5T4 antibody-calicheamicin conjugate on days 1 , 5, and 9 after staging. Values indicate average tumor volume ±SEM. Figure 13 is a bar graph showing 5T4 (TPBG) mRNA levels on an
Affymetrix GENECHIP® oligonucleotide arrays hybridized with transcripts from multiple tumors (T1 , T2, T3) of NSCLC primary implant lines 37622, 60274, and 60257. The 37622 xenografts were from nude mice and the 60274 and 60257 xenografts were from nod-scid mice.
DETAILED DESCRIPTION OF THE INVENTION
The present invention provides methods for the prospective identification of tumor-initiating cells that express the oncofetal antigen 5T4 and optionally, also express CD44 and low levels of CD24. These cells are highly tumorigenic in vitro and in vivo, are self-renewing, are capable of migration, and have the ability to differentiate. The disclosed tumor-initiating cell populations may also show apoptosis resistance and contribute to cancer relapse and metastasis. Also provided are methods for isolating tumor-initiating cell populations and for enriching tumor-initiating cells within a population. Still further are provided novel tumor-initiating cell markers.
The tumor-initiating cell populations disclosed herein are useful for studying the effects of therapeutic agents on tumor growth, relapse, and metastasis. Isolated tumor-initiating cells can be used to identify unique therapeutic targets, which can be used to generate antibodies that target tumor- initiating cells. The isolated tumor-initiating cells can also be used in screening assays to improve the probability that drugs selected based upon in vitro activity, or based upon cytotoxicity of tumor populations that include non-tumorigenic cells, will successfully eradicate disease and prevent relapse in vivo. Tumor- initiating cells isolated from patients may also be used to predict disease outcome and/or sensitivity to known therapies.
I. Tumor-Initiating Cells
A tumor-initiating cell is known in the art to mean a cell (1) that is capable of generating one or more kinds of progeny with reduced proliferative or developmental potential (e.g., differentiated cells); (2) that has extensive proliferative capacity; and (3) that is capable of self-renewal or self-maintenance. See e.g., Potten et al., Development, 1990, 110: 1001-1020. Thus, tumor- initiating cells share properties of stem cells found in adult tissues, (including cells of the blood, gut, breast ductal system, and skin) that constantly replenish cells lost during normal tissue functions. The best-known example of adult cell renewal by the differentiation of stem cells is the hematopoietic system. Developmentally immature precursors such as hematopoietic stem cells and progenitor cells respond to molecular signals gradually forming the varied blood and lymphoid cell types. Stem cells are also found in other tissues, including epithelial tissues (Slack, Science, 2000, 287: 1431-1433) and mesenchymal tissues (U.S. Patent No. 5,942,225). Cancer stem cells may arise from any of these cell types, for example, because of genetic damage in normal stem cells or by the dysregulated proliferation of stem cells and/or differentiated cells.
Tumor-initiating cells of the present invention may be derived from any cancer comprising tumorigenic stem cells, i.e., multipotent cells having an ability
to proliferate extensively or indefinitely, and which give rise to the majority of cancer cells. Within an established tumor, most cells have lost the ability to proliferate extensively and form new tumors, and a small subset of tumor- initiating cells proliferate to thereby regenerate the tumor-initiating cells as well as give rise to tumor cells lacking tumorigenic potential. Tumor-initiating cells may divide asymmetrically and symmetrically and may show variable rates of proliferation.
In contrast to tumor-initiating cells, non-tumorigenic tumor cells fail to form a palpable tumor upon transplantation into an immunocompromised host, wherein if the same number of non-fractionated, dissociated cancer cells were transplanted under the same circumstances, the tumor-initiating cells would form a palpable tumor in the same period. A palpable tumor is known to those in the medical arts as a tumor that is capable of being handled, touched, or felt. Non- tumorigenic cells also show decreased migration as compared to tumor-initiating cells, an inability to generate tumor-initiating cells, and increased expression of differentiation markers.
Representative cancers from which tumor-initiating cells may be isolated include cancers characterized by solid tumors, including 5T4-expressing tumors such as lung, ovarian, colorectal, and gastric tumors. Additional representative cancers from which tumor-initiating cells may be isolated include acoustic neuroma, acute lymphoblastic leukemia, acute myelogenous leukemia, acute myeloid leukemia, adenocarcinoma, adenosqaumous carcinoma, adrenocortical carcinoma, AIDS-related lymphoma, anal cancer, angiosarcoma, astrocytoma, B cell lymphomas and leukemias, basal cell carcinoma, basaloid carcinoma, bile duct cancer, bile duct carcinoma, bladder cancer, bladder carcinoma, brain tumor, breast cancer, bronchogenic carcinoma, bulky disease NHL and Waldenstrom's Macroglobulinemia, carcinosarcoma, cerebellar astrocytoma, cerebral astrocytoma, cervical cancer, chondrosarcoma, chordoma, choriocarcinoma, chronic leukocytic leukemia, chronic lymphocytic leukemia, chronic myelogenous leukemia, clear cell carcinoma, colon cancer, colorectal cancer, craniopharyngioma, cutaneous T-cell lymphoma, cystadenocarcinoma,
embryonal carcinoma, endometrial cancer, endotheliosarcoma, ependymoma, epithelial carcinoma, esophageal cancer, Ewing's sarcoma, Ewing's tumor, fibrosarcoma, gallbladder cancer, gestational trophoblastic tumor, giant cell carcinoma, glioma, hairy cell leukemia, hemangioblastoma, hemangiomas of infancy and childhood, hematopoietic malignancies, hematopoietic malignancies including acute lymphoblastic leukemia, hepatoma, high grade immunoblastic NHL, high grade lymphoblastic NHL, high grade small non-cleaved cell NHL, Hodgkin's lymphoma, hypopharyngeal cancer, including but not limited to low grade/follicular non-Hodgkin's lymphoma (NHL), intermediate grade diffuse NHL, intermediate grade/follicular NHL, islet cell carcinoma, Kaposi's sarcoma, kidney cancer, large cell carcinoma with rhabdoid phenotype, large cell lung carcinoma, laryngeal cancer, leiomyosarcoma, liposarcoma, liver cancer, lung cancer, lung carcinoma, lymphangioendotheliosarcoma, lymphangiosarcoma, lymphoblastic leukemia, lymphocytic leukemia, lymphoepitheliomalike carcinoma, malignant melanoma, malignant mesothelioma, malignant thymoma, medullary carcinoma, medulloblastoma, melanoma, meningioma, mesothelioma, monocytic leukemia, multiple myeloma, mycosis funoides, myelogenous leukemia, myxosarcoma, nasopharyngeal cancer, neuroblastoma, non-Hodgkin's lymphoma, non-small cell lung carcinoma, oligodendroglioma, oral cancer, oropharyngeal cancer, osteogenic sarcoma, osteosarcoma, ovarian cancer, ovarian epithelial cancer, ovarian germ cell tumor, pancreatic cancer, pancreatic carcinoma, papillary adenocarcinomas, papillary carcinoma, parathyroid cancer, penile cancer, pinealoma, pituitary tumor, promyelocytic leukemia, prostate cancer, prostate cancer, pulmonary blastoma, rectal cancer, renal cell carcinoma, retinoblastoma, rhabdomyosarcoma, salivary gland cancer, sarcomas, sebaceous gland carcinoma, seminoma, skin cancer, small cell lung cancer, small cell lung carcinoma, small intestine cancer, small lymphocytic (SL) NHL, soft tissue sarcoma, squamous cell carcinoma, squamous cell lung carcinoma, stomach cancer, sweat gland carcinoma, synovioma, testicular cancer, thyroid cancer, uterine cancer, uterine sarcoma, vaginal cancer, vulvar cancer, and Wilm's tumor.
Tumor-initiating cells may also be derived from cells associated with a proliferative disease, i.e., a class of diverse disorders and diseases characterized by a lack of control or poorly controlled cell division or proliferation. Proliferative diseases include disorders associated with an overgrowth of connective tissues, such as various fibrotic conditions, including scleroderma, arthritis, juvenile arthritis, gouty arthritis, and liver cirrhosis, and conditions such as restenosis, arteriosclerosis, and proliferative diabetic retinopathy.
LA. Tumor-Initiating Cell Markers
Tumor-initiating cells may be selected using positive and negative molecular markers. A reagent that binds to a tumor-initiating cell positive marker {i.e., a marker expressed by tumor-initiating cells at elevated levels compared to non-tumorigenic or differentiated cells) can be used for the selection of tumor- initiating cells. Positive markers for tumor-initiating cells may also be present on non-tumorigenic cancer cells, i.e., cancer cells other than tumor-initiating cells, but at reduced levels. Markers that are widely expressed may show a measurable change in expression level in tumor-initiating cells and/or may provide for resolution of tumor-initiating cells when used in combination with additional positive or negative markers. A reagent that binds to a tumor-initiating cell negative marker {i.e., a marker not expressed or expressed at measurably reduced levels by tumor-initiating cells can be used for the elimination of those tumor cells in the population that are not tumor-initiating cells. For selection using positive and negative molecular markers, useful markers include those that are expressed on the cell surface such that live cells are amenable to sorting and tracking. When assessing expression levels using techniques such as immunoblot, tumor-initiating cell positive markers are typically expressed at a level that is at least about 2-fold greater than differentiated cells of the same origin or non- tumorigenic cells, for example, at least about 4-fold greater, or at least about 5- fold greater, or at least about 8-fold greater, or at least about 10-fold greater, or at least about 15-fold greater, or at least about 20-fold greater, or at least about
50-fold greater, or at least about 100-fold greater. When assessing expression levels using flow cytometry, tumor-initiating cell positive markers are typically expressed at a level that is at least about 0.5 log greater than differentiated cells of the same origin or non-tumorigenic cells, for example, at least about 1 log greater, at least about 1.5 logs greater, at least about 2 logs greater, or at least about 3 logs greater. Conversely, when assessing expression levels using techniques such as immunoblot, tumor-initiating cell negative markers are typically expressed at a level that is at least about 2-fold less than differentiated cells of the same origin or non-tumorigenic cells, for example, at least about A- fold less, or at least about δ-fold less, or at least about 10-fold less, or at least about 15-fold less, or at least about 20-fold less, or at least about 50-fold less, or at least about 100-fold less. When assessing expression levels using flow cytometry, tumor-initiating cell negative markers are typically expressed at a level that is at least about 0.5 log less than differentiated cells of the same origin or non-tumorigenic cells, for example, at lease about 1 log less, at least about 1.5 logs less, at least about 2 logs less, or at least about 3 logs less.
Disclosed herein are 5T4, CD44, and CD24 markers that can be used alone or in combination for the prospective identification and isolation of tumor- initiating cells from lung. Expression of 5T4 and CD44 are positive markers, whereas expression of CD24 is a negative marker. Thus, tumor-initiating cells of the invention include those expressing high levels of 5T4 (5T4hl), moderate to high levels of CD44 (CD44+), and/or little or no expression of CD24 (CD24"/|0).
5T4 oncofetal antigen is a 72 kDa highly glycosylated transmembrane glycoprotein comprising a 42 kDa non-glycosylated core (Hole et al., Br. J. Cancer, 1988, 57: 239-46; Hole et al., Int. J. Cancer, 1990, 45: 179-84; PCT International Publication No. WO89/07947; U.S. Patent No. 5,869,053). Human 5T4 is expressed in numerous cancer types, including carcinomas of the bladder, breast, cervix, endometrium, lung, esophagus, ovary, pancreas, stomach, and testes, and is substantially absent from normal tissues, except for syncytiotrophoblast in placenta (see, e.g., Southall et al., Br. J. Cancer, 1990, 61 : 89-95 (immunohistological distribution of 5T4 antigen in normal and malignant
tissues); Mieke et al., Clin. Cancer Res., 1997, 3: 1923-1930 (low intercellular adhesion molecule 1 and high 5T4 expression on tumor cells correlate with reduced disease-free survival in colorectal carcinoma patients); Starzynska et al. Br. J. Cancer, 1994, 69: 899-902 (prognostic significance of 5T4 oncofetal antigen expression in colorectal carcinoma); Starzynska et al., Br. J. Cancer, 1992, 66: 867-869 (expression of 5T4 antigen in colorectal and gastric carcinoma); Jones et al., Br. J. Cancer, 1990, 61: 96-100 (expression of 5T4 antigen in cervical cancer); Connor & Stern, Int. J. Cancer, 1990, 46: 1029-1034 (loss of MHC class-l expression in cervical carcinomas); AIi et al., Oral Oncology, 2001 , 37: 57-64 (pattern of expression of the 5T4 oncofetal antigen on normal, dysplastic and malignant oral mucosa); PCT International Publication No. WO89/07947; U.S. Patent No. 5,869,053). For example, tissues reported to have no expression of 5T4 include the liver, skin, spleen, thymus, central nervous system (CNS), adrenal gland, and ovary. Tissues reported to have focal or low expression of 5T4 include the liver, skin, spleen, lymph node, tonsil, thyroid, prostate, and seminal vesicles. Weak-moderate diffuse expression of 5T4 has been reported in the kidney, lung, pancreas, pharynx, and gastrointestinal tract. The only tissue reported to have high expression of 5T4 is syncytiotrophoblast, and 5T4 was also absent from normal serum or the serum of pregnant women (i.e., levels < 10 ng/ml). Overexpression of 5T4 in tumors has been correlated with disease progression, and assessment of 5T4 expression has been suggested as a useful approach for identifying patients with poor prognosis. See, e.g., Mulder et al., CHn. Cancer Res., 1997, 3: 1923-1930; Naganuma et al., Anticancer Res., 200, 22: 1033-1038; Starzynska et al., Br. J. Cancer, 1994, 69: 899-902; Starzynska et al., Eur. J. Gastroenterol. Hepatol., 1998, 10: 479-484; Wrigley et al., Int. J. Gyne∞l. Cancer, 1995, 5: 269-274.
CD44 is a transmembrane glycoprotein that participates in cancer metastasis by modulating cell adhesiveness, motility, matrix degradation, proliferation, and/or cell survival. See e.g., Marhaba & Zoller, J. MoI. Histol., 2004, 35(3): 211-231. CD24 antigen is a cell surface glycoprotein marker of differentiation that is used as a negative marker, i.e., tumor-initiating cells show
little or no CD24 expression (CD24--/low). Alone or in combination, cells expressing CD44 and CD24"-/low have been used to identify tumor-initiating cells in many tumor types, including tumors of the breast, colon, head and neck, and pancreas. See e.g., Al-Hajj et al., Proc. Natl. Acad. Sci. USA, 2003, 100: 3983- 3988; Yu et al., Ce//, 2007, 131 : 1109-1123; Dalerba et al., Proc. Natl. Acad. Sci. USA, 2007, 104: 10158-10163; Prince et al., Proc. Natl. Acad. Sci. USA, 2007, 104: 973-978; and Li et al., Cancer Res., 2007, 67: 1030-1037.
In addition to the 5T4 and CD44+ markers described herein, other potential tumor-initiating cell positive markers in lung cancer include SLUG, fibronectin (FN1), and vimentin (VIM) (see Figure 7C); vascular endothelial growth factor A (VEGF-A), vascular endothelial growth factor B (VEGF-B); vascular endothelial growth factor C (VEGF-C); platelet derived growth factor (PDGF), and insulin-like growth factor-l (PIGF) (see Figure 7F); CD133 (see Eramo et al., Cell Death Differ, 2008, 15: 504-514); and CD117 (Donnenberg et al., J. Control Release, 2007, 122(3): 385-391). Representative additional potential positive tumor-initiating cell markers in lung cancer include transforming growth factor β type III receptor (TGFβRIII), netrin receptor UNC5D (UncδD), patatin-like phospholipase domain-containing protein 4 (PNPLA4), inward rectifier potassium channel 2 (KCNJ2), gamma-am inobutyric acid (GABA) A receptor, beta 3 (GABRB3), dihydropyrimidine dehydrogenase (DPYD), sperm associated antigen 1 (SPAG1 ), intestinal cell (MAK-like) kinase (ICK), stanniocalcin 2 (STC2), defensinβi (Defβi), and FLJ38736. See Example 5.
Still additional positive tumor-initiating cell markers include CD133 (Bao et al., Nature, 2006, 444: 756-760; O'Brien et al., Nature, 2007, 445: 106-110; Ricci-Vitiani et al., Nature, 2007, 445: 111-115; and Hermann et al., Cell Stem Cell, 2007, 1 : 313-323), ALDH1 (Yu et al., Cell 2007, 131 : 1109-1123), EpCAMhigh (Dalerba et al., Proc. Natl. Acad. Sci. USA, 2007, 104: 10158-10163); epithelial-specific antigen (ESA, Li et al., Cancer Res., 2007, 67: 1030-1037); CD90 (Li et al., Cancer Res., 2007, 67: 1030-1037); ABCG5 (Schatton et al., Nature, 2008, 451 : 345-349); ABCG2 (Patrawala et al., Cancer Res., 2005, 65(14): 6207-6219; Kondo et al., Proc. Natl. Acad. Sci. U.S.A., 2004, 101(3):
781-786); VEGF receptor-1 (VEGFR-1), VEGFR-2, VEGFR-3, and platelet derived growth factor (PDGF) (see Figure 7F and Andersen et al., J. Thorac. Oncol., 2009, [Epub ahead of print]); neuron-specific enolase (NSE), cytokeratin 19 fragment (CYFRA), Carcinoembryonic antigen (CEA), squamous cell carcinoma antigen (SCC), CA 125, CA 15.3 and TAG-72.3 (see Molina et al., Tumour Biol., 2008, 29(6): 371-380); VLA-2, Tweak (TNF-like weak inducer of apoptosis), EphB2, EphB3, human Sca-1 (BIG1 ), CD34, β1 integrin (CD29), CD150, CXCR4, and members of gene sets that are inversely correlated with differentiated primary culture as set forh in Tables 1 and 2. See Examples 3 and 5.
Markers that may be used for selection of tumor-initiating cells based upon low or negative expression include any gene expressed in differentiated or non- tumorigientic cells. Numerous such molecules are known in the art. In addition to the CD24""0W marker described herein, additional lung cancer tumor-initiating cell negative markers include MUC1/CD227 and cytokeratin 4 (KRT4) (see Figure 7C and Kuemmel et al., Lung Cancer, 2009, 63(1): 98-105). Still additional makers useful for isolation or enrichment of lung cancer tumor-initiating cells include CEA, SLX, CYFRA, SCC, pro-gastrin-releasing peptide (ProGRP). See Komagata & Yondea, Gan To Kagaku Ryoho, 2004, 31(10): 1609-1613. Additional representative markers that may be used for selection of tumor- initiating cells based upon low or negative expression include members of gene sets that are correlated with differentiated primary culture as set forh in Tables 1 and 2. See Examples 3 and 5.
The above-noted markers can also be use for identification of tumor- initiating cells in cancers other than lung cancer.
In the case of colon or colorectal cancer or other cancers, additional positive markers that may be useful for identification of tumor-initiating cells include prostaglandin F2 receptor regulatory protein (PTGFRN), CD166 (or activated leukocyte adhesion molecule, ALCAM), CD164, CD82, transforming growth factor beta receptor 1 (TGFBR1), MET, ephrin-B2 (EFNB2), integrin alpha 6 (ITGA6; CD49f), teratocarcinoma-derived growth factor 1 (TDGFI)1 heparin-
binding EGF-like growth factor (HBEGF), ABC family transporter ABCC4, ABC family transporter ABCD3, tumor-differentially-expressed gene 2 (TDE2), integrin beta 1 (ITGB1), tumor necrosis factor receptor superfamily 21 (TNFRSF21), CD81 and CD9 (members of the transmembrane-4 superfamily (TM4SF or tetraspanins)), KIAA1324, carcinoembryonic antigen-related cell adhesion molecule 6 (CEACAM6), FZD6 and FZD7 (Wnt receptors), BMPR1A, JAG1 , integrin alpha V (ITGAV), N0TCH2, S0X4, HES1 , HES6, atonal homolog 1 (AT0H1), E-cadherin (CDH1 ), Eph receptor B2 (EPHB2), v-myb myeloblastosis viral oncogene homolog (MYB)1 MYC, SOX9, PCGF1, PCGF4, PCGF5, ALDH1A1 , and STRAP. An additional negative marker useful for identification of tumor-initiating cells in colon or colorectal cancer is T cell factor 4 (TCF4). See e.g., PCT International Publication No. WO 07/053648.
In a particular aspect of the invention, isolated tumor-initiating cell population comprises a majority of cells expressing 5T4 at a level that is at least about 2-fold higher than non-tumorigenic cells of the same origin. Tumor- initiating cells may also express 5T4 at a level that is at least about 4-fold higher than non-tumorigenic cells of the same origin, for example, at least about 5-fold higher, or at least about 8-fold higher, or at least about 10-fold higher, or at least about 15-fold higher, or at least about 20-fold higher, or at least about 50-fold higher, or at least about 100-fold higher. When 5T4 expression is assessed using flow cytometry, tumor-initiating cells may also express 5T4 at a level that is at least about 0.5 log higher than non-tumorigenic cells of the same origin, for example, at least about 1 log higher, or at least about 1.5 logs higher, or at least about 2 logs higher, or at least about 3 logs higher. In another aspect of the invention, the tumor-initiating cell population comprises a majority of cells that express CD24 at a level that is at least about 2- fold lower than CD24+ non-tumorigenic cells of the same origin. Tumor-initiating cells may also express CD24 at a level that is at least about 4-fold lower than non-tumorigenic cells of the same origin, for example, at least about 5-fold lower, or at least about 8-fold lower, or at least about 10-fold lower, or at least about 15- fold lower, or at least about 20-fold lower, or at least about 50-fold lower, or at
least about 100-fold lower. When CD24 expression is assessed using flow cytometry, tumor-initiating cells may also express CD24 at a level that is at least about 0.5 log lower than CD24+ non-tumorigenic cells of the same origin, for example, at least about 1 log lower, or at least about 1.5 logs lower, or at least about 2 logs lower, or at least about 3 logs lower.
The tumor-initiating cell population can also comprise a majority of cells that express CD44 at a level that is at least about 2-fold higher than non- tumorigenic cells of the same origin. Tumor-initiating cells may also express CD44 at a level that is at least about 4-fold higher than non-tumorigenic cells of the same origin, for example, at least about 5-fold higher, or at least about 8-fold higher, or at least about 10-fold higher, or at least about 15-fold higher, or at least about 20-fold higher, or at least about 50-fold higher, or at least about 100-fold higher. When CD44 expression is assessed using flow cytometry, tumor- initiating cells may also express CD44 at a level that is at least about 0.5 log higher than non-tumorigenic cells of the same origin, for example, at least about 1 log higher, or at least about 1.5 logs higher, or at least about 2 logs higher, or at least about 3 logs higher.
An isolated tumor-initiating cell population is removed from its natural environment (such as in a solid tumor) and is at least about 75% free of other cells with which it is naturally present, but which lack the marker based on which the cells were isolated. For example, isolated tumor-initiating cell populations as disclosed herein are at least about 90%, or at least about 95%, free of non- tumorigenic cells. When referring to a tumor-initiating cell population that is described as a percentage purity, or a percentage free of non-tumorigenic cells, the cell stem cell subpopulation and total cancer cell population are typically quantified as live cells.
An enriched population of cells can be defined based upon the increased number of cells having a particular marker in a fractionated tumor-initiating cell population as compared with the number of cells having the marker in the non- fractionated cancer cell population. It may also be defined based upon tumorigenic function as the minimum number of cells that form tumors at limiting
dilution frequency. An enriched tumor-initiating cell population can be enriched about 2-fold in the number of stem cells as compared to the non-fractioned tumor cell population, or enriched about 5-fold or more, such as enriched about 10-fold or more, or enriched about 25-fold or more, or enriched about 50-fold or more, or enriched about 100-fold or more. Enrichment can be measured with using any one of the tumor-initiating cell properties noted herein above, e.g., levels of marker expression or tumorigenicity.
The present invention provides methods for isolation of the disclosed tumor-initiating cell populations. For example, the method can comprise (a) providing dissociated tumor cells; (b) contacting the dissociated tumor cells with an agent that specifically binds to 5T4; (c) selecting cells that specifically bind to the agent of (b) at a level that is at least about 5-fold greater than cells that either do not express 5T4 or express 5T4 at a low level. The method can also comprise further selection based upon any of the positive or negative tumor- initiating cell markers disclosed herein or otherwise known in the art. When performing selection using a negative marker, e.g., excluding cells that express one or more negative markers, tumor-initiating cells may be identified as cells that show reduced expression of the marker as compared to differentiated cells or non-tumorigenic cells. Representative methods for isolation or enrichment of 5T4hiQh, 0024""0^ and/or CD44+ tumor-initiating cell populations are described in Examples 1-4.
Tumor-initiating cells can be isolated or enriched by any suitable means known in the art, including FACS using a fluorochrome conjugated marker- binding reagent and primary culture using serum free conditions. Any other suitable method including attachment to and disattachment from solid phase, is also within the scope of the invention. Procedures for separation may include magnetic separation, using antibody-coated magnetic beads, affinity chromatography and panning with antibody attached to a solid matrix, e.g., a plate or other convenient support. Techniques providing accurate separation include fluorescence activated cell sorters, which can have varying degrees of sophistication, such as multiple color channels, low angle and obtuse light
scattering detecting channels, impedance channels, etc. Dead cells may be eliminated by selection with dyes that bind dead cells (such as propidium iodide (Pl), or 7-AAD). Any technique may be employed that is not unduly detrimental to the viability of the selected cells.
I.B. Functional Properties of Tumor-Initiating Cells
As described herein, tumor-initiating cells of the invention are tumorigenic in vitro and in vivo, have characteristics of tumorigenic cells such as clonogenicity, and a highly proliferative nature. Subpopulations of lung tumor cell lines were identified that express 5T4high, CD44+, and/or CD24/low and that are significantly enriched for colony formation and proliferation. See Examples 1-4. The injection of tumor-initiating cells into a host animal consistently results in the successful establishment of tumors more than 75% of the time, such as more than 80% of the time, or more than 85%, or more than 90%, or more than 95% of the time, or 100% of the time. Cancer stem cells of the invention give rise to tumors with the same differentiation state of the tumor of origin. For example, tumor-initiating cells isolated from poorly and moderately differentiated tumors give rise to poorly and moderately differentiated tumors in vivo, respectively. The molecular profile of the resultant tumors is also similar to the tumor of origin, notwithstanding the prior selection of tumor-initiating cells. Thus, the tumor-initiating cells show a capacity to differentiate or give rise to non-tumorigenic cells that make up the majority of mature cancer populations.
The tumor-initiating cells of the invention have a capacity for self-renewal, as demonstrated by the ability of 5T4high and/or CD24"-/lowCD44+ cells but not 5T4low and/or CD24+/highCD44+ cells to form tumors consistently. This feature allows tumor-initiating cells to retain multipotency and high proliferative potential throughout repeated cell divisions.
The tumor-initiating cells of the invention have a capacity for migration, as demonstrated by the ability of 5T4high and/or CD24--/lowCD44+ cells to migrate. In a transwell assay, 5T4high and/or CD24"-/lowCD44+ cells migrated in a serum-
dependent manner more efficiently than 5T4l0W and/or CD24+/highCD44+ cells. In another assay, spheroids of 5T4high and/or CD24--/lowCD44+ cells migrated across fibronectin coated slides, but no little or migration of cells in 5T4low and/or CD24+/hιghCD44+ cells spheroids was observed after twenty-four hours.
II. Applications
The tumor-initiating cell populations disclosed herein are useful for studying the effects of therapeutic agents on tumor growth, relapse, and metastasis. When isolated from a cancer patient, the efficacy of particular therapies can be tested and/or predicted based upon the unique genetic and molecular profile of the isolated population. Thus, the disclosed tumor-initiating cell populations provide means for developing personalized cancer therapies.
In one aspect of the invention, the genetic and molecular features of tumor-initiating cells are described to identify target molecules and/or signaling pathways. Accordingly, the present invention also provides arrays or microarrays containing a solid phase, e.g., a surface, to which are bound, either directly or indirectly, tumor-initiating cells (enriched populations of or isolated), polynucleotides extracted from tumor-initiating cells, or proteins extracted from the tumor-initiating cells. Monoclonal and polyclonal antibodies that are raised against the disclosed tumor-initiating cell populations may be generated using standard techniques. The identification of tumor-initiating cell target molecules, and agents that specifically bind tumor-initiating cells, will complement and improve current strategies that target the majority non-tumorigenic cells.
Microarrays of genomic DNA from tumor-initiating cells can also be probed for single nucleotide polymorphisms (SNP) to localize the sites of genetic mutations that cause cells to become precancerous or tumorigenic. The genetic and/or molecular profile of tumor-initiating cells may also be used in patient prognosis. See e.g., Glinsky et al., J.Clin. Invest, 2005, 115(6): 1503-1521 , which describes a death-from-cancer signature predictive of therapy failure.
In another aspect of the invention, the efficacy of cancer drugs or candidate cancer drugs can be tested by contacting isolated tumor-initiating cells
with a test compound and then assaying for a change in tumor-initiating cell properties as described herein. For example, therapeutic compositions can be applied to tumor-initiating cells In culture at varying dosages, and the response of these cells is monitored for various time periods. Physical characteristics of these cells can be analyzed by observing cells by microscopy. Induced or otherwise altered expression of nucleic acids and proteins can be assessed as is known in the art, for example, using hybridization techniques and Polymerase Chain Reaction (PCR) amplification to assay levels of nucleic acids, immunohistochemistry, enzymatic assays, receptor binding assays, enzyme- linked immunosorbant assays (ELISA), electrophoretic analysis, analysis with high performance liquid chromatography (HPLC), Western blots, radioimmunoassays (RIA), fluorescence activated cell sorting (FACs)1 etc.
The ability of therapeutic compounds to inhibit or decrease the tumorigenic potential of tumor-initiating cells can be tested by contacting tumor- initiating cells and a test compound, allowing a sufficient temporal period for response, and then assessing tumor-initiating cell growth in vitro. Following exposure to the test compound, the tumor-initiating cells can alternatively be transplanted into a host animal (i.e., preparation of a xenograft model, which is then monitored for tumor growth, cancer cell apoptosis, animal survival, etc.). In yet another screening format, test compounds are administered to a xenograft host animal {i.e., an animal bearing tumor-initiating cells and/or a resultant tumor). Additional phenotypes that may be assayed include cell viability, proliferation rate, regenerative capacity, and cell cycle distribution of tumor- initiating cells or resultant non-tumorigenic cancer cells, or any other phenotype relevant to therapeutic outcome.
Test compounds include known drugs and candidate drugs, for example, viruses, proteins, peptides, amino acids, lipids, carbohydrates, nucleic acids, antibodies, prodrugs, small molecules (e.g., chemical compounds), or any other substance that may have an effect on tumor cells whether such effect is harmful, beneficial, or otherwise. Test compounds include but are not limited to 2 2' 2"- trichlorotriethylamine, 2-ethylhydrazide, 2-pyrrolino-doxorubicin, 5-FU (5-
fluorouracil), 6-azauridine, 6-diazo-5-oxo-L-norleucine, 6-mercaptopurine, 6- thioguanine, a camptothecin, a sarcodictyin, ABRAXANE®, ABT-510 (Abbott Labs), aceglatone, acetogenins, aclacinomysins, actinomycin, ADRIAMYCIN®, AG1478, AG1571 (SU 5271; Sugen), aldophosphamide glycoside, altretamine, aminoglutethimide, aminolevulinic acid, aminopterin, amsacrine, ancitabine, androgens, Angiostatin (EntreMed), Angizyme (AstraZeneca), anguidine, antimetabolites, arabinoside ("Ara-C"), authramycin, azacitidine, azaserine, aziridines, benzodopa, bestrabucil, bevacizumab, bevacizumab (AVASTIN® Genentech), bexarotene, bisantrene, bleomycin, BMS-275291 (Bristol Myers Squib), Bortezomib (VELCADE® Millenium Pharm.), bryostatin, busulfan, cactinomycin, callystatin, calusterone, capecitabine, carabicin, carboplatin, carboquone, carminomycin, carmofur, carmustine, carzinophilin, CC-1065, chlorambucil, chloranbucil, chlornaphazine, chlorozotocin, cholophosphamide, chromomycinis, cisplatin, Combrestatin (Oxigene), CPT-11, cryptophycins, cyanomorpholino-doxorubicin, cyclooxygenase-2 (COX-2) inhibitors exisulind, cyclophosphamide, cyclosphosphamide, cytarabine, CYTOXAN®, dacarbazine, dactinomycin, daunomycin, daunorubicin, defofamine, demecolcine, deoxydoxorubicin, detorubicih, diaziquone, dideoxyuridine, difluorometlhylomithine (DMFO), docetaxel, dolastatin, doxifluridine, doxorubicin, dromostanolone propionate, duocarmycin, edatraxate, edatrexate, eleutherobin, elformithine, elliptinium acetate, enediyne antibiotics, eniluracil, enocitabine, epirubicin, epitiostanol, erlotinib (tarceva), Erlotinib (TARCEVA® Genentech/OSI Pharm.), esorubicin, estramustine, ethylenimines, etoglucid, etoposide, etoposide (VP-16), floxuridine, fludarabine, folic acid analogues such as denopterin, folic acid replenisher such as frolinic acid, fotemustine, France), Fulvestrant (FASLODEX® AstraZeneca), gacytosine, gallium nitrate, Gefitinib (IRESSA® AstraZeneca), GEMZAR® (gemcitabine), hydroxyurea, ibandronate, idarubicin, ifosfamide, lmatinib mesylate (GLEEVEC® Novartis), improsulfan and piposulfan, irinotecan, Lapatinib (GSK572016, lentinan, Letrozole (FEMARA® Novartis), Leucovorin, lomustine, Lonafarnib (SCH 66336), lonidainine, losoxantrone, mannomustine, marcellomycin, marimastate (British Biotech),
maytansinoids such as maytansine and ansamitocins, mechlorethamine, mechlorethamine oxide hydrochloride, melphalan, mepitiostane, mercaptopurine, methotrexate, methotrexate and 5-fluorouracil (5-FU), methylamelamines, meturedopa, mitobronitol, mitoguazone, mitolactol, mitomycin C, mitomycins, mitotane, mitoxantrone, mopidanmol, morpholino-doxorubicin, mycophenolic acid, MYLOTARG® (gemtuzumab ozogamicin, Wyeth), NAVELBINE® (vinorelbine), Neovastat (Aeterna Zentaris), nimustine, nitraerine, nitrogen mustards, nogalamycin, novantrone, novembichin, olivomycins, or vinorelbine, ELOXATIN® (Oxaliplatin Sanofi), paclitaxel, pancratistatin, pemetrexed disodium (ALIMTA®, pentostatin, peplomycin, phenamet, phenesterine, pipobroman, pirarubicin, podophyllinic acid, potfiromycin, prednimustine, procarbazine, proteasome inhibitors, pteropterin, PTK787/ZK 222584 (Novartis), puromycin, quelamycin, ranimnustine, Rapamycin (Sirolimus, RAPAMUNE®, Wyeth), razoxane, retinoic acid, retinoids, rhizoxin, rodorubicin, roridin A, sizofuran, Sorafenib (BAY43 9006, Bayer), spirogermanium, spongistatin, streptonigrin, streptozocin, SU5416, SU6668 (Sugen), Sunitinib (Pfizer), SUTENT® (SU11248 Pfizer), T-2 toxin, TAXOL® (paclitaxel; Bristol-Myers Squibb), TAXOTERE® (doxetaxel; Rhone-Poulenc Rorer), temsirolimus (TORISEL®, Wyeth), teniposide, tenuazonic acid, testolactone; anti-adrenals, thalidomide (Celgene), thiamiprine, thioguanine, thiotepa, topoisomerase inhibitor RFS 2000, topotecan, triaziquone, trichothecenes, triethylenemelamine, triethylenephosphoramide, triethylenethiophosphoramide, trilostane, trimethylomelamine, trimetrexate, trofosfamide, tubercidin, ubenimex, uracil mustard, uredopa, urethane, vaccines, VEGF-Trap (Regeneron Pharm), verracurin A1 vinblastine, vincristine, vindesine, vinorelbine, Vitaxin Il (Medlmmune) and Cilengitide (Merck KgaA), xeloda, ZD6474 (ZACTIMA® AstraZeneca), zinostatin, zorubicin and pharmaceutically acceptable salts, acids derivatives and antibody conjugates of any of the above.
For use in any of the above-noted applications, or other applications, tumor-initiating cells of the invention may be cryopreserved until needed for use. For example, the cells can be suspended in an isotonic solution, preferably a cell culture medium, containing a particular cryopreservant. Such cryopreservants
include dimethyl sulfoxide (DMSO), glycerol and the like. These cryopreservants are used at a concentration of 5-15%, such as 8-10%. Cells are frozen gradually to a temperature of -1O0C to -1500C, such as -2O0C to -1000C, or at -1500C.
EXAMPLES
The following examples have been included to illustrate modes of the invention. Certain aspects of the following examples are described in terms of techniques and procedures found or contemplated by the present co-inventors to work well in the practice of the invention. These examples illustrate standard laboratory practices of the co-inventors. In light of the present disclosure and the general level of skill in the art, those of skill will appreciate that the following examples are intended to be exemplary only and that numerous changes, modifications, and alterations may be employed without departing from the scope of the invention.
EXAMPLE 1 Isolation of CD24--/lowCD44+ Tumor Initiating Cells
Using Non Small Cell Lung Cancer Cell Lines
H460 cells were obtained from the American Type Culture Collection (ATCC) in Manassas, Virginia, United States of America. The H460 cell line was derived from the pleural fluid of a patient with large cell cancer of the lung (Gazdar et al., Science, 1989, 246: 491 -494). HCC2429 cells were obtained from J. Minna. See Haruki et al., J. Med. Genet, 2005, 42(7):558-64. All experiments with H460T cells were performed with cells between passage numbers 37-51, because these cells were observed to have more robust phenotypes than lower passage cells. Higher-passage cells are referred to as H460T to distinguish them from the low-passage H460 that were originally obtained from ATCC. All cells were incubated at 37°Celsius with 5.0% carbon dioxide (CO2). H460T cells were cultured in RPMM 640 (GIBCO®, available from Invitrogen of Carlsbad, California, USA). See Moore et al., JAMA, 1967, 199: 519-524, 10% fetal bovine serum (FBS1 GIBCO®, available from Invitrogen
of Carlsbad, California, USA), 2m M additional glutamine, 100 Ill/ml penicillin, 100 μg/ml streptomycin, 1 mM sodium pyruvate, 0.1 % sodium bicarbonate, 0.45% additional glucose, and 1OmM 4-(2-hydroxyethyl)-1-piperazineethanesulfonic acid (HEPES). HCC2429 cells were cultured in RPMM 640, 10% FBS1 2mM additional glutamine, 100 IU/ml penicillin, 100 μg/ml streptomycin. Karyotyping and short tandem repeat (STR) analysis of H460T confirmed its H460 origin, however the Y chromosome was absent in H460T cells and present in most H460 cells.
For flow cytometry analysis, cells were harvested with GIBCO® TRYPLE ™, washed in Hanks Balanced Salt Solution without calcium and magnesium (HBSS) with 3% heat-inactivated calf serum (HICS), incubated with 100 μg/ml DNase, 5 mM MgCI2 and 50 μg/ml human immunoglobulin (IgG), incubated with antibodies or isotype controls, washed, and resuspended in HBSS with 3% HICS1 25 μg/ml DNase, 1 mM MgCI2, and 25 mM HEPES. Xenografts were minced to a paste-like consistency, incubated in Collagenase/Hyaluronidase (Stem Cell Technologies of Vancouver, British Columbia, Canada) for 1 hour with frequent mixing in a 370C water bath, and filtered through a 40-micron filter. The cell suspension was treated with Red Blood Cell Lysis Buffer (Roche Diagnostics Corporation of Indianapolis, Indiana, USA) followed by ACCU-PREP® (Axis of Oslo, Norway), both according to manufacturer's instructions. Anti-human CD24 (#555428) and CD44 (#559942) monoclonal antibodies were obtained from BD Biosciences of San Jose, California, USA). Anti-5T4 antibody clone H8 (Hole & Stern, Br. J. Cancer, 1988, 57(3): 239-46) was obtained from Oxford Biomedica of Oxford, United Kingdom. Labeling the H460T NSCLC cell line with anti-CD24 and anti-CD44 antibodies revealed distinct populations with a stable distribution over long periods in culture (Figure 1A). When these populations were separated by fluorescence-activated cell sorting and implanted subcutaneously into immunocompromised nu/nu mice, the CD24--/lowCD44+ cells formed large tumors rapidly, whereas the CD24h'9hCD44+ cells slowly formed small tumors (p < 0.001 ; Figures 1 B-1 C). CD24"-/lowCD44+ cells also formed larger tumors than the third
population, CD24--/lowCD44low (p < 0.02; Figure 1D). These studies demonstrated that CD24--/low and CD44+ enrich for tumorigenic potential in H460T.
The CD24"-/lowCD44+ cells were phenotypically distinct from the CD24highCD44+ cells in several additional assays. First, the CD24-/lowCD44+ cells grew more rapidly than the CD24hιghCD44+ cells in three-dimensional culture as spheroids (p < 0.001 ; Figure 1E). No difference in proliferation rate, cell cycle profile, or cell size was detected between the populations in two-dimensional culture.
Second, the populations exhibited a differential response to the mTOR inhibitor CCI-779, a rapamycin analog that was recently approved for treatment of advanced renal cell carcinoma (Faivre et al., Nat Rev. Drug Discov., 2006, 5: 671-688). The CD24--/lowCD44+ cells were 5- to 10-fold more resistant to CCI-779 than CD24highCD44+ cells (Figure 1F). In contrast, the populations responded equally to camptothecin, 5-fluoruracil, and ionizing radiation, indicating that the differential response to CCI-779 was specific.
Third, CD24-/lowCD44+ cells migrated more efficiently than CD24highCD44+ cells, as shown using a transwell migration assay and a spheroid growth assay. To perform a transwell migration assay, sorted cells that were cultured overnight in growth medium and then serum-starved for 24 hours. 500,000 cells per well were plated in serum-free media in 8.0-micron pore 24mm-diameter transwells. Media with or without serum was added to the outer chamber and cells were incubated for 16-18 hours. Cells were fixed with formaldehyde and stained with crystal violet. Cells were carefully scraped from the inner chamber with wet and dry Q-tips such that cells that had migrated to the outer chamber could be counted under the microscope. Eight to ten fields per well were counted. Using this assay, CD24-/lowCD44+ cells migrated 2.5-fold more efficiently than CD24hιghCD44+ cells in a serum-dependent manner (n=4; Figure 1 G). To perform a spheroid growth assay, 100,000 sorted cells in 5ml of culture medium were seeded on 60mm polystyrene cell culture dishes previously coated with 5ml of tissue culture grade agar (0.7%) in culture medium. The dishes were incubated for 5 days at 37°C. Spheroids with a diameter of 0.2mm were selected
and placed on fibronectin-coated slides (BD Biosciences). Migration of cells in CD24"-/lowCD44+ spheroids across the fibronectin-coated slides was evident after 24 hours and at subsequent timepoints, but little or no migration of cells in CD24hιghCD44+ spheroids was observed (Figure 1 H). There was no difference in growth rate of the spheroids over the 3-day period of this experiment.
To determine whether the tumor-initiating population of H460T also possessed stem cell-like characteristics, sorted cells were maintained in culture and monitored regularly by flow cytometry. CD24"/lowCD44+ cells always gave rise to a significant population of CD24hιghCD44+ cells evident as early as three days after the sort (Figure 2A). In contrast, CD24highCD44+ cells remained CD24h'9hCD44+ through the latest time point of two months post-sort (Figure 2A). These results indicated a multipotency phenotype of the tumor-initiating cells. To determine whether the observed transition occurs in the context of the parental line, labeled and unlabeled populations were co-cultured. When co-cultured with CD24highCD44+ cells, CD24-/lowCD44+ cells were also multipotent (Figures 3A- 3C), which implied that the mutlipotency phenotype exists in culture of parental H460T. Multipotency was also observed in vivo: xenografts grown from CD24" -/lowCD44+ cells typically contained -50% CD24high cells (Figure 2B).
Clonal analysis was performed to verify that the multipotency could be followed at the single cell level. Colonies from single CD24--/lowCD44+ or CD24highCD44+ cells were expanded into clonal lines. Most (23/31 ) of the CD24" /iowCD44+ derjvθd C|ona| |jnθS contained >10% CD24high cells ("transitioning clones"), but some (8/31 ) contained <1% CD24high cells ("stable clones"). All (6/6) CD24highCD44+ derived clonal lines contained 100% CD24high cells (Figure 2C). Consistent with the above results from the sorted parental line, sorted CD24"-/lowCD44+ cells from all tested CD24"-/lowCD44+ clonal lines were highly tumorigenic, while sorted CD24highCD44+ cells from all tested CD24highCD44+ clonal lines formed small or no tumors (Figure 2D).
To test whether CD24hιghCD44* cells show reduced tumorigenic potential as compared to CD24-;lowCD44+ cells, transitioning CD24-"0WCD44+ clonal lines were sorted into CD24--/lowCD44+ and CD24highCD44+ cells, and the sorted cells
were implanted into animals. In three clonal lines, the CD24"-/lowCD44+ cells formed larger tumors than the CD24highCD44+ cells (p < 0.005 in clone 24N-4; p = 0.01 in clone 24N-10; p < 0.05 in clone 24N-25; Figure 2E). No significant difference was observed in three other clonal lines. Thus CD24"-/lowCD44+ cells from H460T can give rise to less tumorigenic, functionally distinct CD24highCD44+ cells. These results demonstrate the existence of multipotent tumor-initiating cells in H460T.
Other NSCLC cell lines were assessed for heterogeneity with respect to CD24 and CD44. The HCC2429 line (Dang et al., J. Natl. Cancer Inst, 2000, 92, 1355-1357) contained two distinct CD24 populations, CD24-"0W and CD24high (Figures 4A). FACS-isolated CD24--/low cells formed significantly larger tumors than CD24high cells (p < 0.05; Figure 4B). In addition, CD24"-/low cells gave rise to CD24high cells in culture, whereas CD24high cells remained CD24high (Figure 4C).
EXAMPLE 2 Identification of 5T4* Tumor Initiating Cells
In Non Small Cell Lung Cancer Cell Lines
To identify genes that might underlie the phenotypic differences between CD24--/lowCD44+ and CD24highCD44+ cells, gene expression profiles were generated from triplicate samples of FACS-isolated populations. As expected, the mRNA levels of CD24 were consistently high in CD24hιghCD44+ cells and low in CD24--/lowCD44+ cells (Figure 5). Levels of 5T4 (also known as TPBG) were 4.5-fold higher in CD24--/lowCD44+ cells compared to CD24highCD44+ cells (Figure 6A).
To determine 5T4 expression under conditions of growth and differentiation, cells were harvested at several time points, and protein extracts were subjected to immunoblot analysis. Cells were washed with PBS and lysed in 0.5% v/v NP40 in 25mM Tris-buffered saline pH 7.4 (TBS). After protein estimation (MICROBCA™ Protein Assay Kit, Pierce of Rockford, Illinois, USA), the lysates were mixed with non-reducing Laemmli sample buffer (Biorad of Hercules, California, USA) and 10μg samples were loaded in each well of a non-
reducing 4-20% polyacrylamide gradient gel (NOVEX®, available from Invitrogen of Carlsbad, California, USA). The samples were run for two to three hours at 125 volts and transferred to a PVDF (polyvinylidene fluoride) membrane by means of a Novex® electrophoresis transfer system. The membrane was blocked overnight with 5% milk in Tris-buffered saline Tween-20 (TBST) with 1% goat serum, probed with anti-5T4 antibody H8 at 1μg/ml in 5% milk in TBST, washed and probed with HRP conjugated goat anti-mulgG at 1:5,000 dilution. The ECL detection system was used (Amersham of Burlington, Massachusetts, USA), lmmunoblot analysis with anti-5T4 antibody showed expression of 5T4 protein in CD24"-/lowCD44+ but not CD24highCD44+ cells (Figure 6B).
Immunofluorescence of parental H460T with anti-5T4 and anti-CD24 antibodies demonstrated that 5T4 and CD24 stainings were exclusive and that nearly all of the CD24-/lowCD44+ cells also expressed 5T4. 5T4 was expressed in all of the CD24--/lowCD44+ clonal lines described in Example 1. To further assess 5T4 expression in tumor cell lines, sorted cells were treated with all-trans retinoic acid to induce differentiation and then subjected to immunoblot analysis. Sorted cells were obtained by FACS and 2.3x10⁵ cells of each immunophenotype were plated in 6-well dishes in complete growth medium. After 24 hours, medium was removed, cells were washed 2 times with PBS and re-fed with 0.5% FBS growth medium. Medium was removed 24 hours later and replaced with 0.5% FBS growth medium supplemented with vehicle control or 10μM all-trans retinoic acid (Sigma of St. Louis, Missouri, USA). Cells were cultured for 72 hours, washed in PBS and lysed directly in 1x Laemmli buffer (Bio-Rad of Hercules, California, USA) for anti-5T4 western blot analysis. 5T4 expression was dramatically reduced in the treated CD24"-/lowCD44+ cells (Figure 6B)1 which indicated that 5T4 was associated with the undifferentiated state in cancer cells.
EXAMPLE 3
A Differentiation Model for Tumor Initiating Cells In Non Small Cell Lung Cancer Primary Cultures
Primary serum-free cultures were established from freshly resected NSCLC samples. The cells were cultured under conditions to promote self- renewal, or induced to differentiate by exposure to the air-liquid interface in the presence of retinoic acid. The air-liquid interface is considered to be a physiological environment for lung cells and has been used to study fetal lung development (Vaughan et al, Differentiation, 2006, 74: 141-148). To induce differentiation using this model, cultures were prepared and treated as follows. Millicell 1 μM PET hanging cell culture inserts (Millipore of Billehca, Massachusetts, USA) were placed inside 6-well dishes. Membranes were pre- wet with phosphate buffered saline (PBS), 2.5x10⁵ primary cells obtained from 87426A1 tumor tissue were plated onto each insert and filled with BEBM medium. After 1-2 days, medium was removed from upper and lower chambers, rinsed with PBS and CnT-23 medium containing 5OnM retinoic acid and 1 mM CaCb (Millipore of Billerica, Massachusetts, USA) was added back to lower chamber leaving cells in upper chamber exposed to the air. Lifted cultures were fed every 2 days with fresh medium or harvested at indicated time points in Buffer RLT (QIAGEN of Valencia, California, USA) for RNA isolation or TBS (Tris-buffered saline)/0.5%NP40 (Tergitol-type NP-40, Sigma-Aldrich of St. Louis, Missouri, USA) for anti-5T4 Western blot analysis. For gene expression profiling, replicate growth samples were analyzed together, and due to limited sample, differentiation samples from days 8, 16, and 24 were pooled and analyzed together. Live cell imaging revealed that monolayer cultures efficiently formed 3D-stratified epithelium upon exposure to the air-liquid interface and 50 nM retinoic acid for 18 days (Figure 7A).
To determine 5T4 expression under conditions of growth and differentiation, cells were harvested at several timepoints, and protein extracts were subjected to immunoblot analysis as described in Example 2. 5T4 levels
were high under growth conditions and decreased quickly and dramatically upon differentiation (Figure 7B).
To obtain a global view of this differentiation model, the experiment was repeated and gene expression profiles were generated from cells under conditions of growth and differentiation. See Examples 5 and 6. Consistent with the above results, 5T4 expression decreased and CD24 expression increased during differentiation (Figure 7C). The gene expression profiles of the primary culture in growth and differentiation were also compared to those of the H460T CD24-/iowCD44+ and cD24highCD44+ populations (see Example 5). A significant fraction of the genes that were expressed at higher levels during differentiation of the primary culture were also expressed at higher levels in the CD24h'9hCD44+ cells (FDR = 0.0015). For statistical comparison of the H460T and 87426 data sets, the top 250 upregulated genes in the differentiated 87426 culture were compared in the H460T populations. Figure 7D shows the expression difference for genes that are above noise level in the H460T data set. Statistical analysis yielded the False Discovery Rate of 0.0015. This analysis indicates that these very different experimental systems are physiological models of the differentiation hierarchy in NSCLC. The microarray data were confirmed by flow cytometry (Figures 7E-7F). The expression profiles also revealed striking patterns of genes involved in epithelial-mesenchymal transition and angiogenesis. The epithelial- mesenchymal transition markers vimentin, fibronectin, Slug, and Twist were expressed at high levels under growth conditions compared to the differentiated state (Figure 7C). In contrast, the epithelial markers mucin and several cytokeratins were expressed at high levels during differentiation compared to growth conditions (Figure 7C). The angiogenesis factors VEGF-A, -B, -C, PDGF- A and -C, and PIGF, were expressed at significantly higher levels under growth conditions compared to differentiation (Figure 7G).
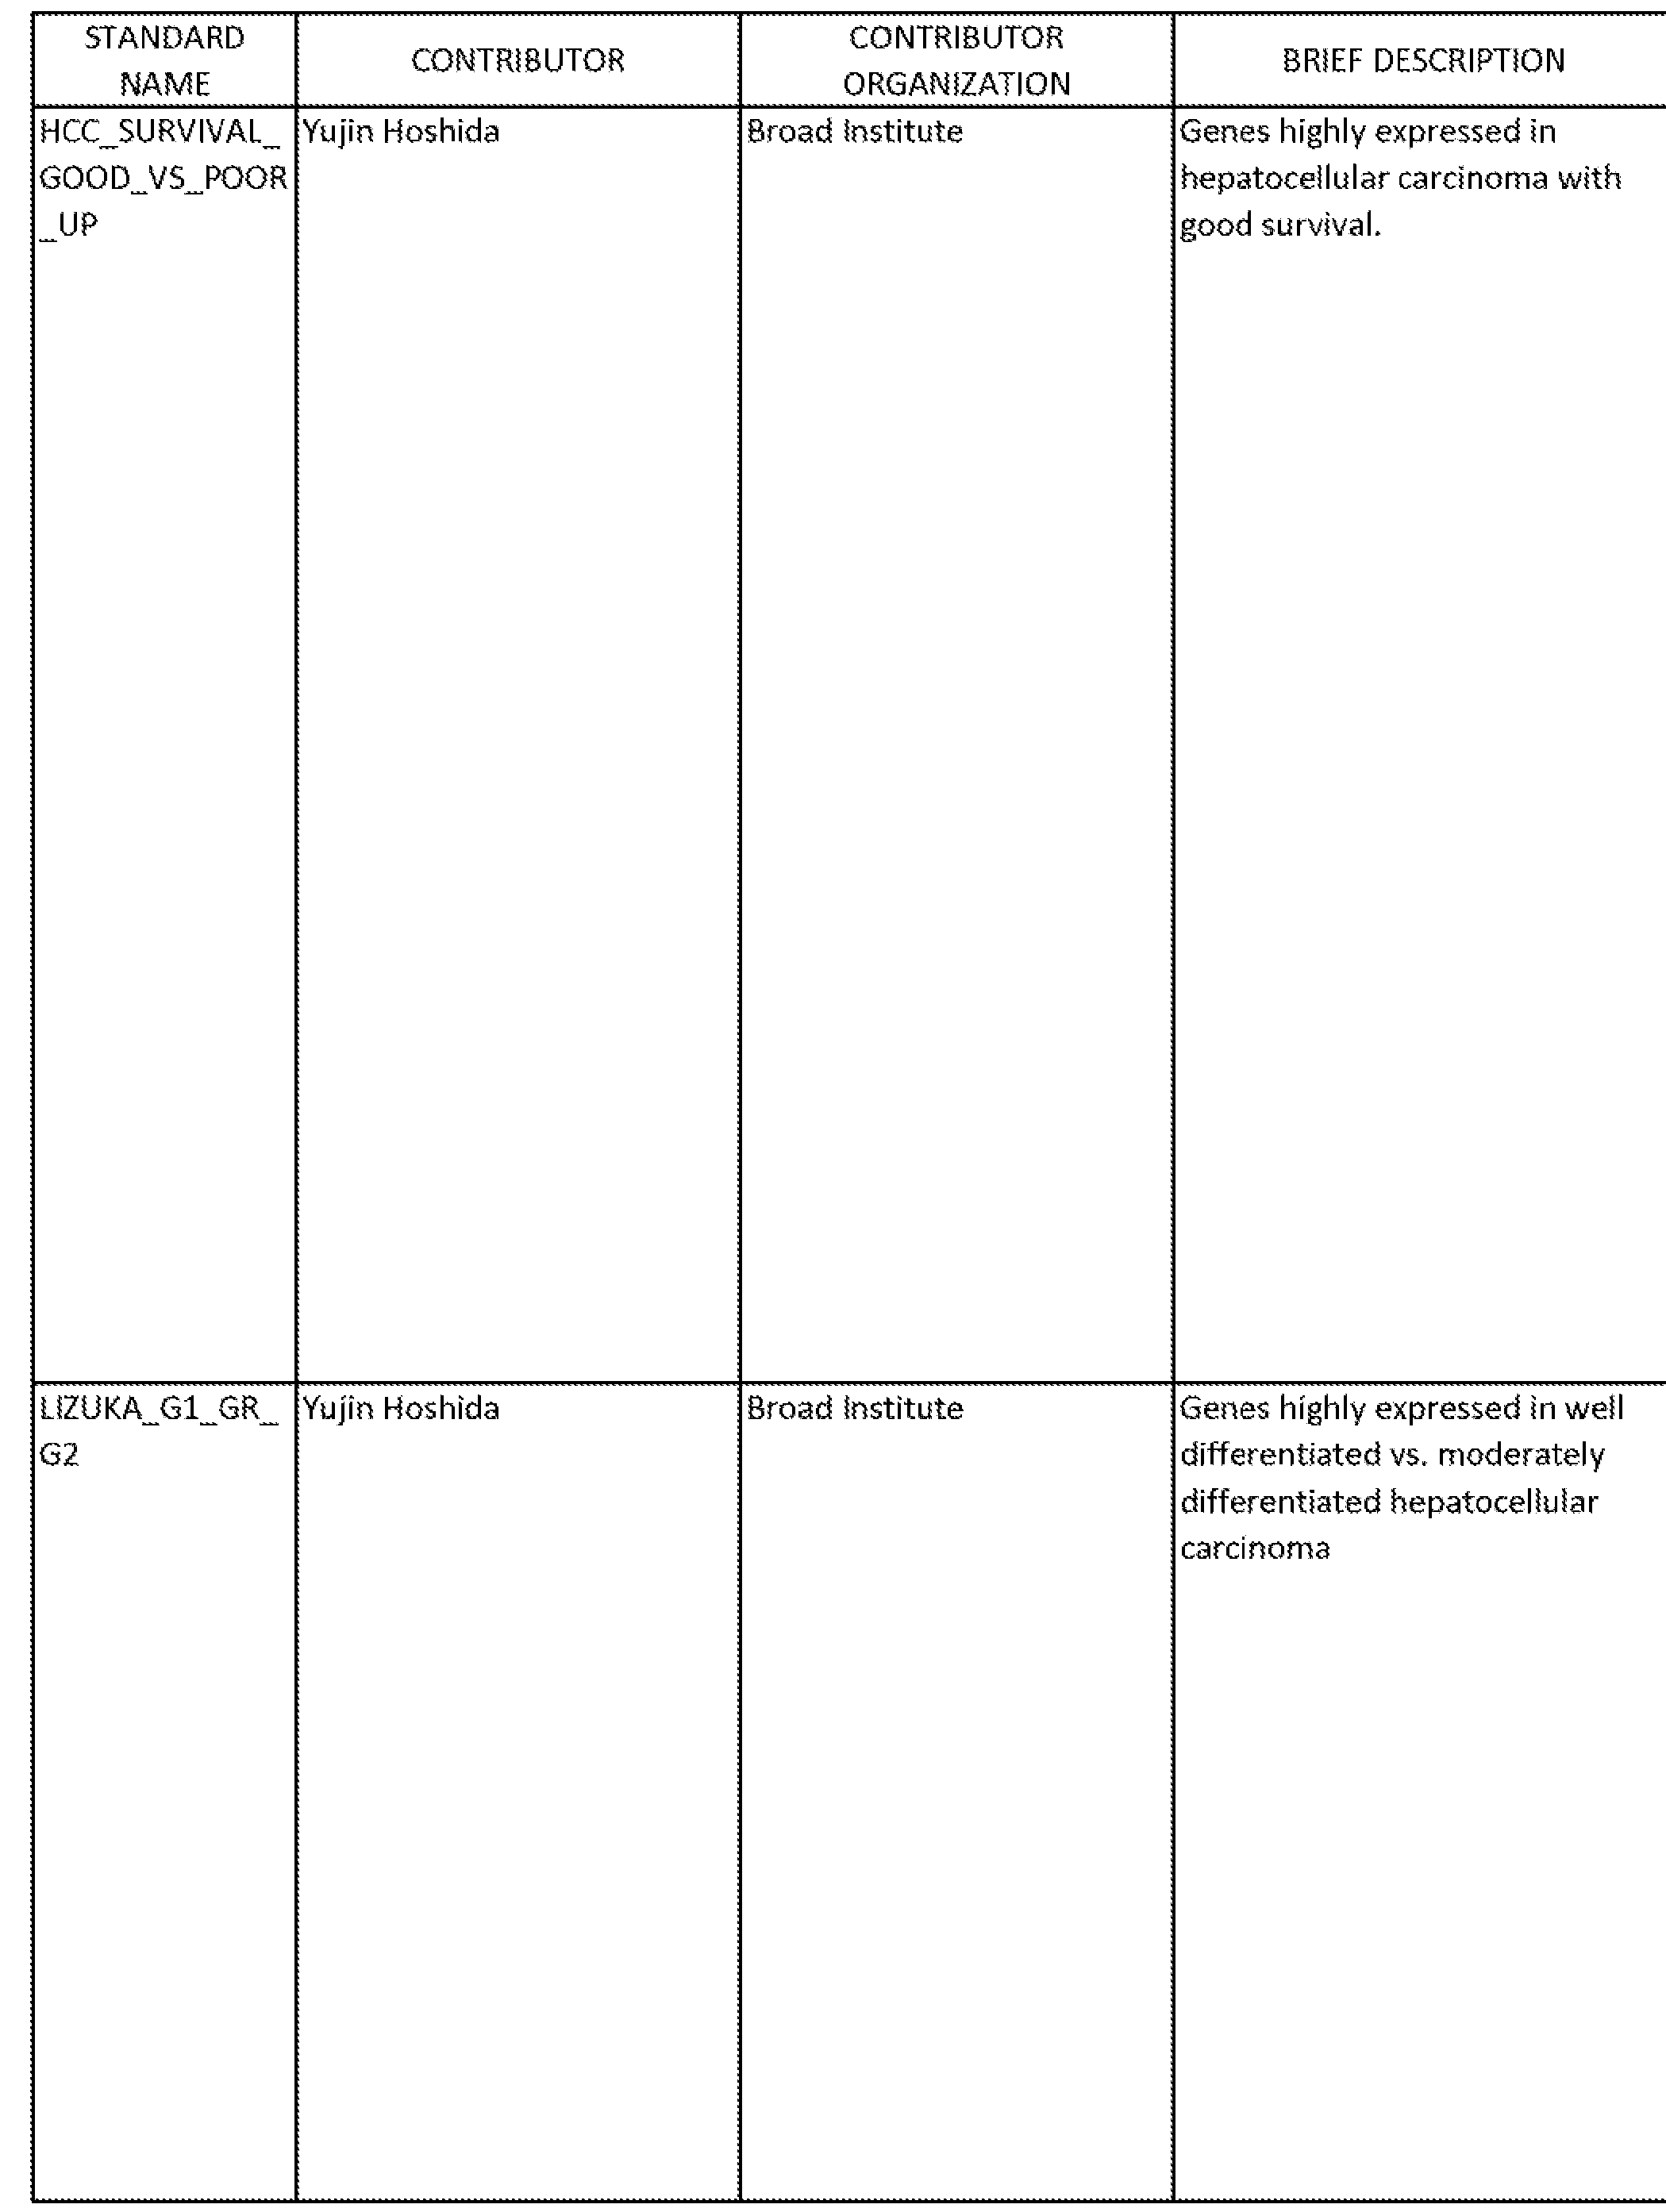
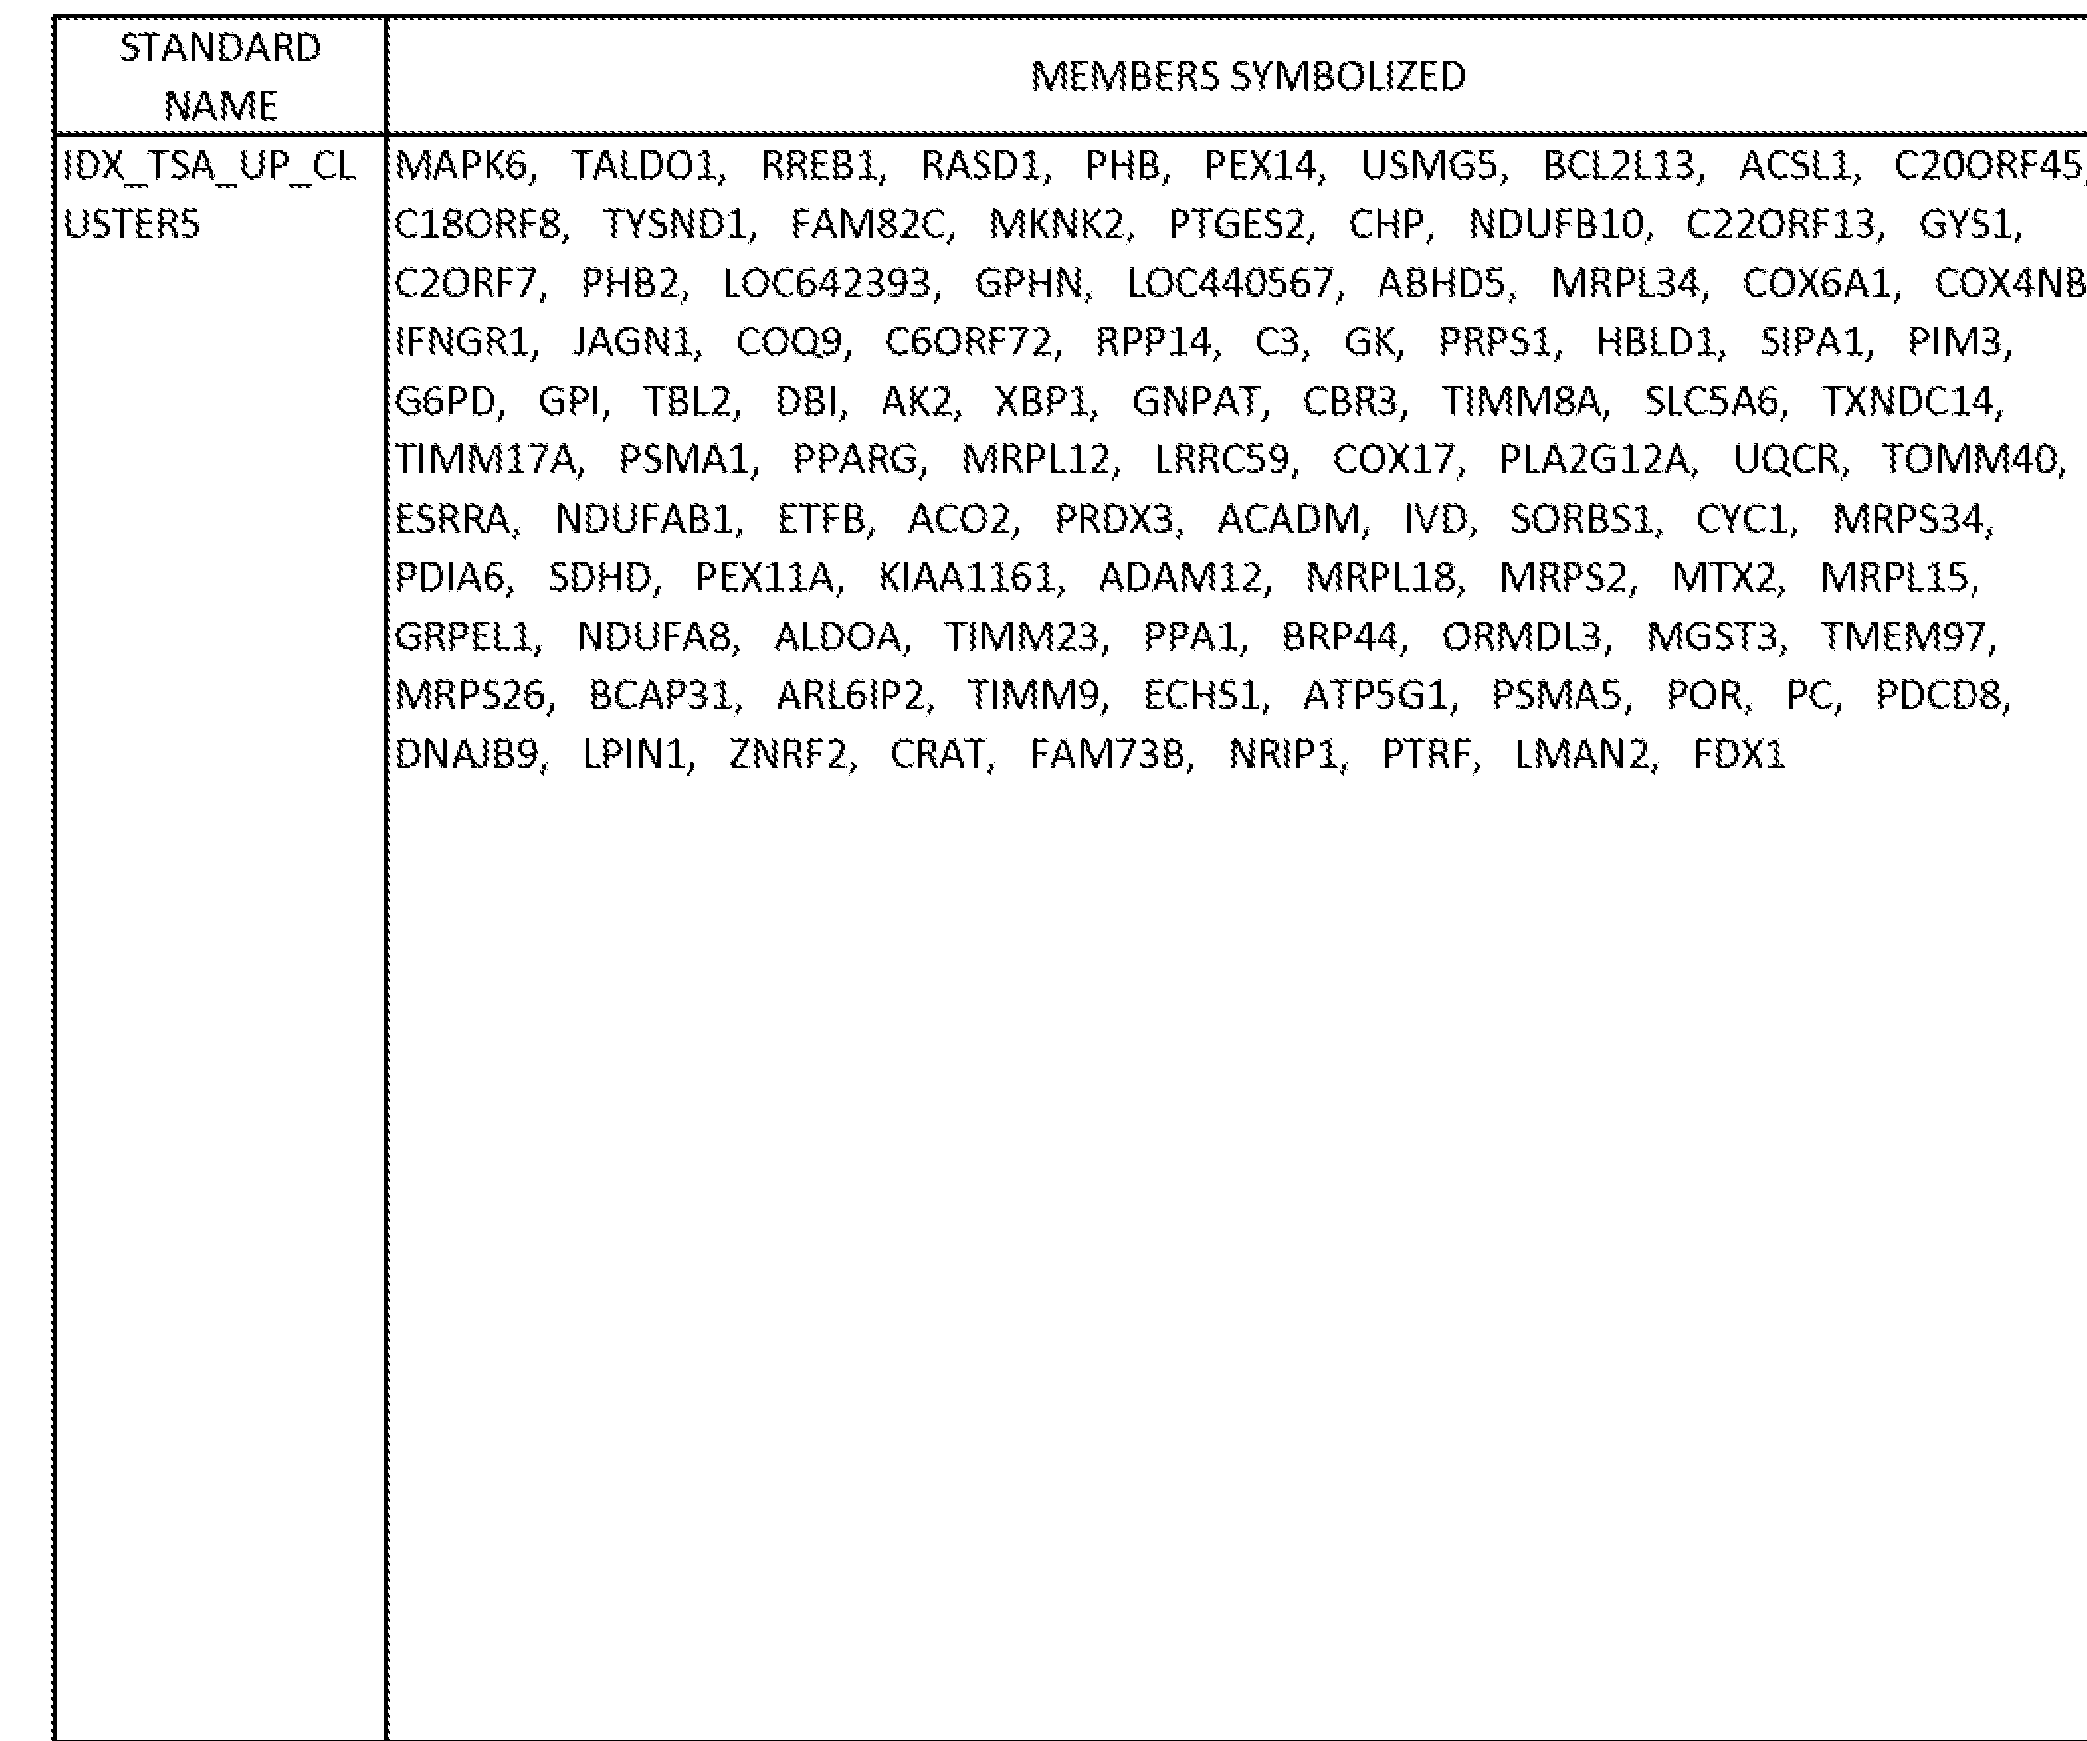
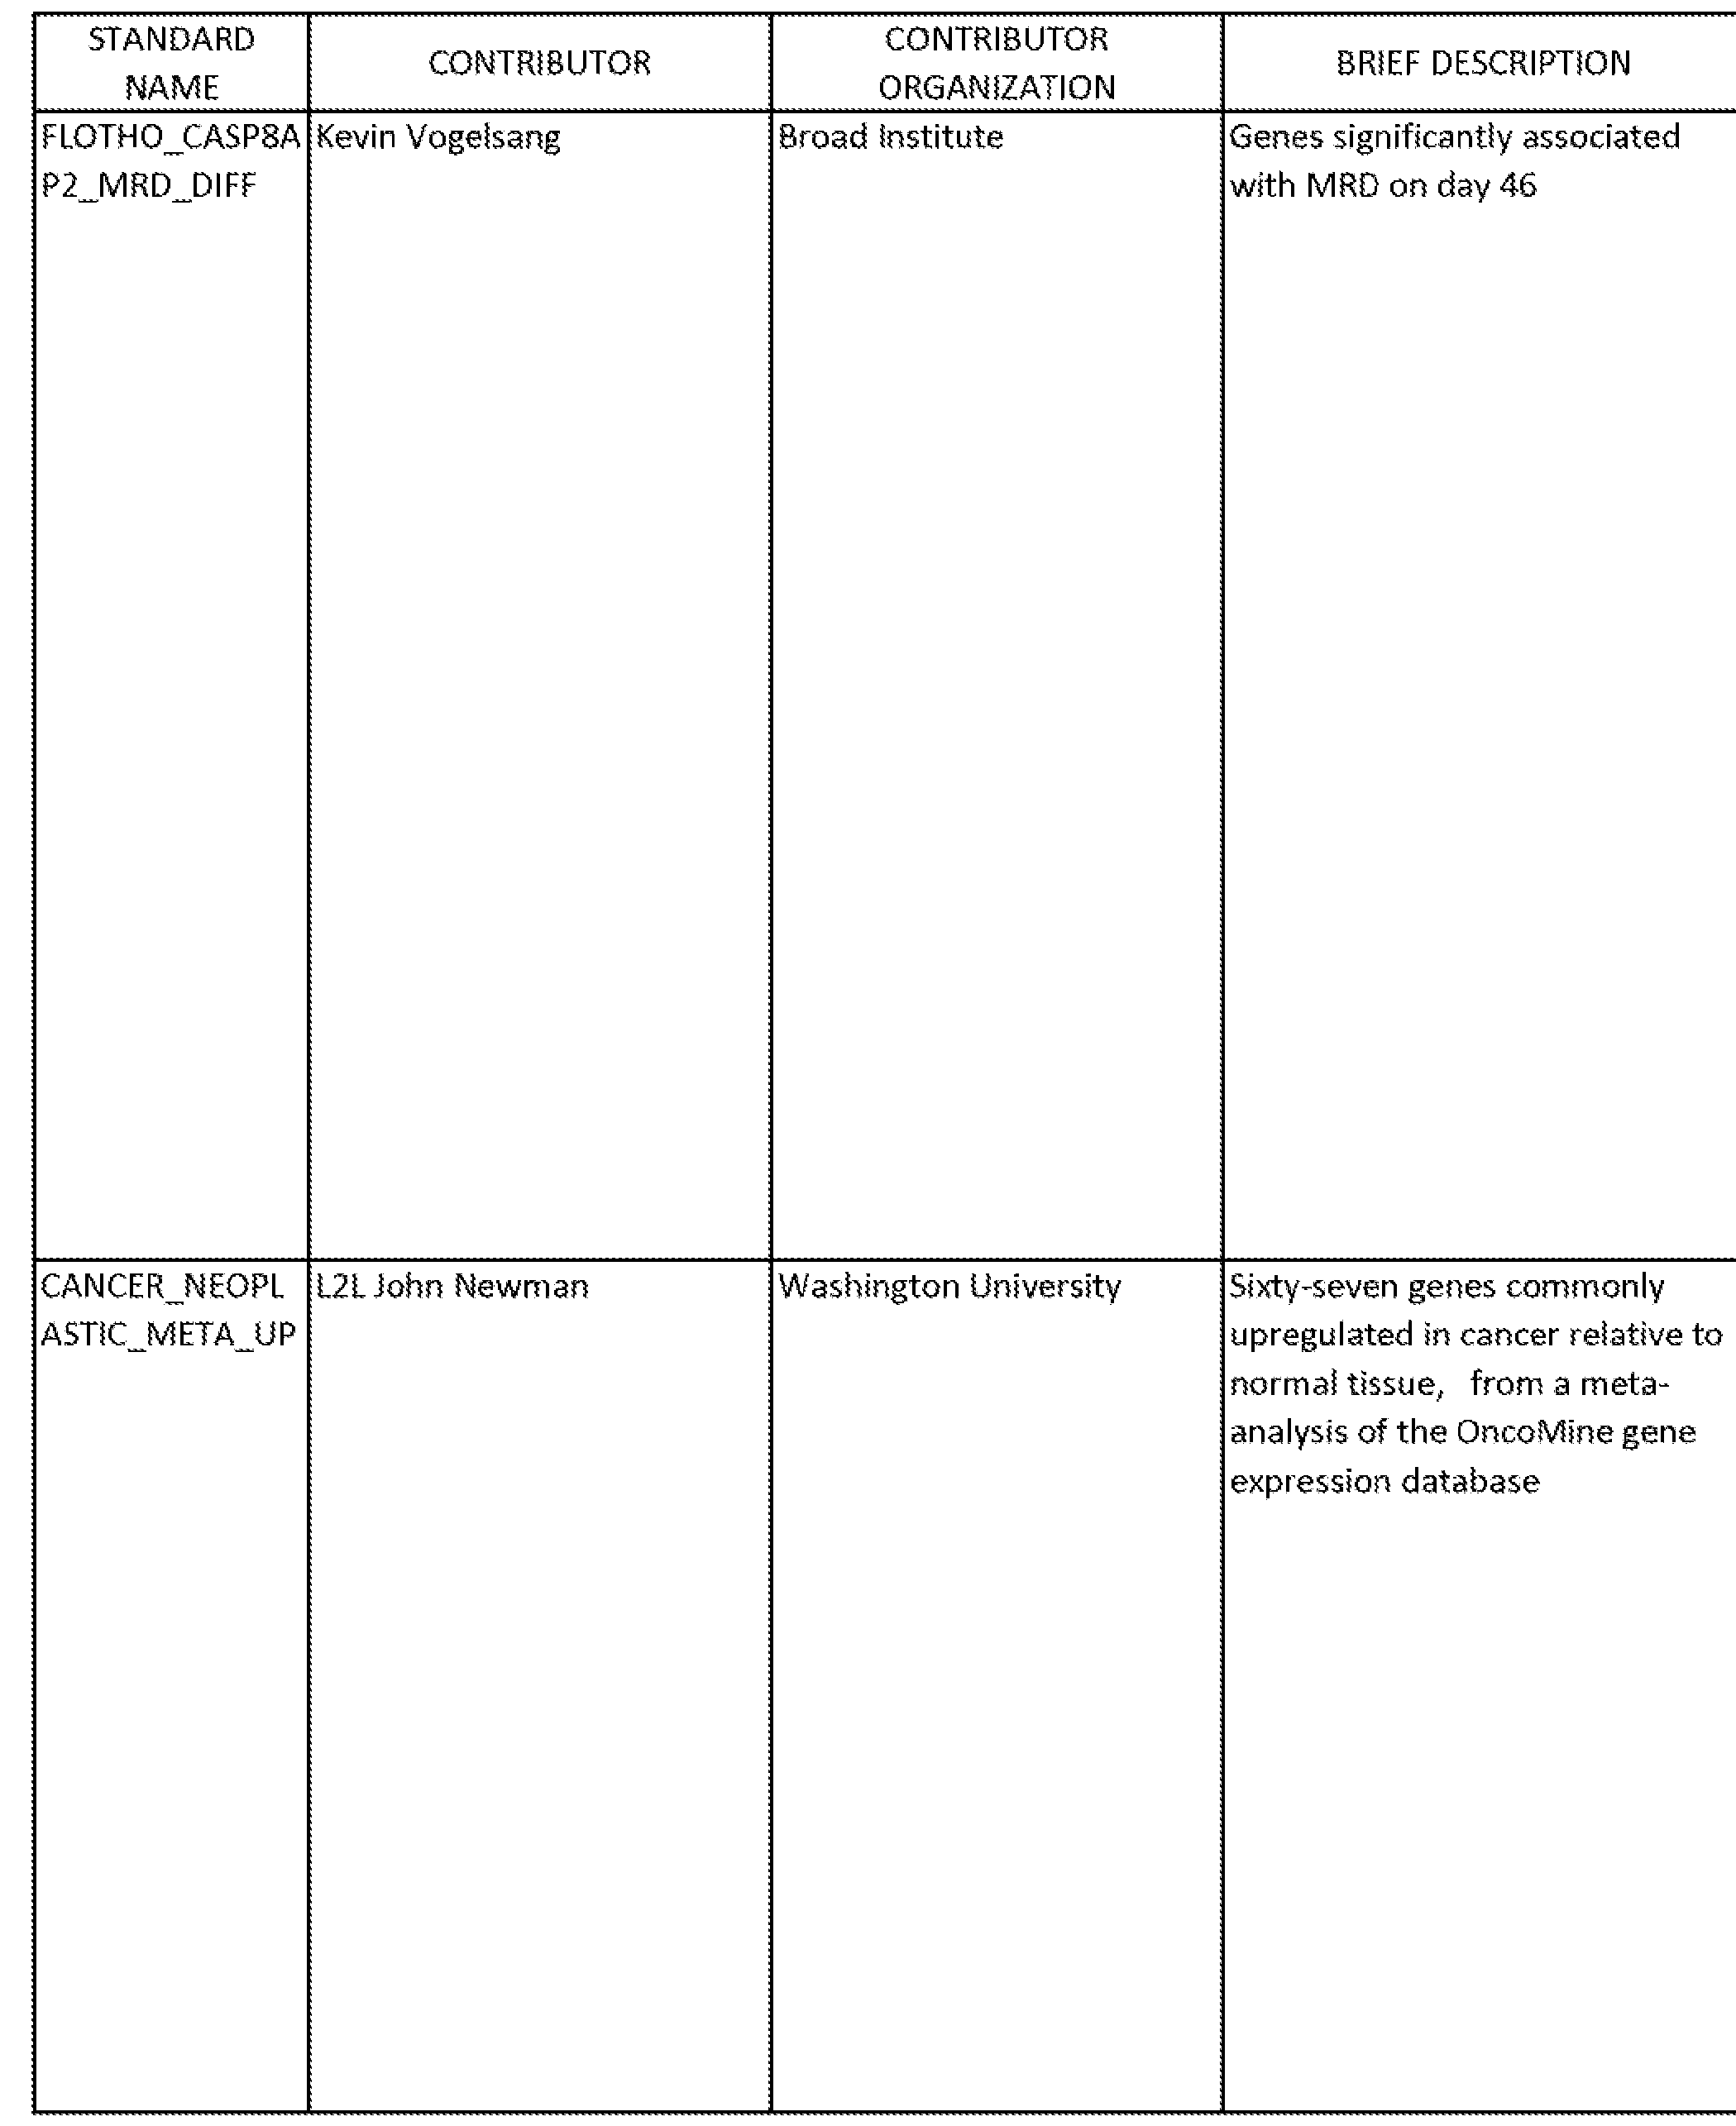
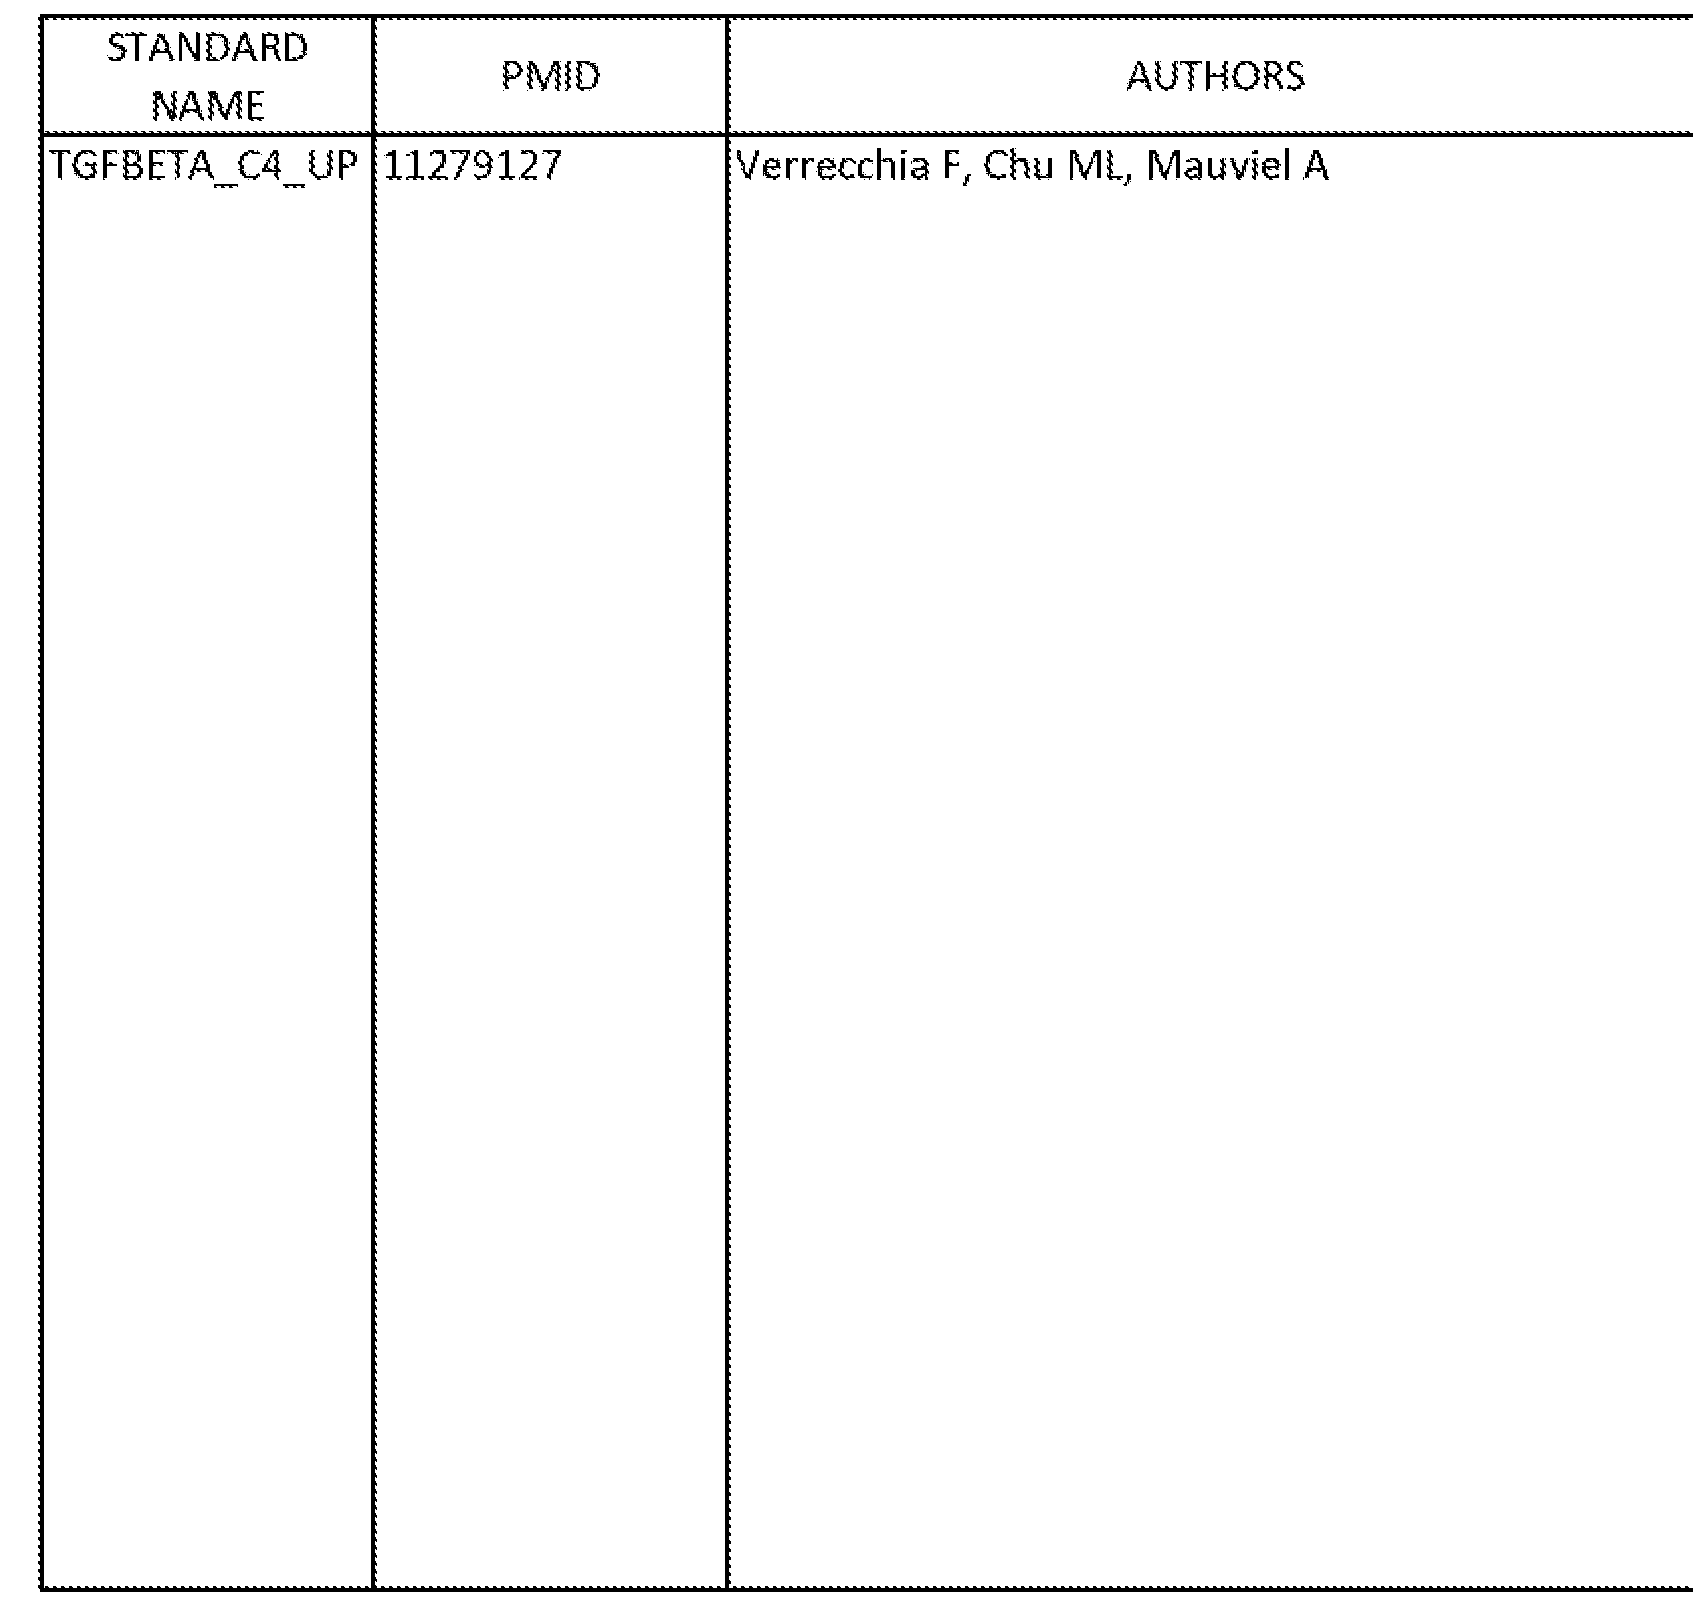
An unbiased meta-analysis of the expression data revealed several gene signatures with significant expression changes during differentiation (Table 1). Gene sets with higher expression in undifferentiated cells included signatures of
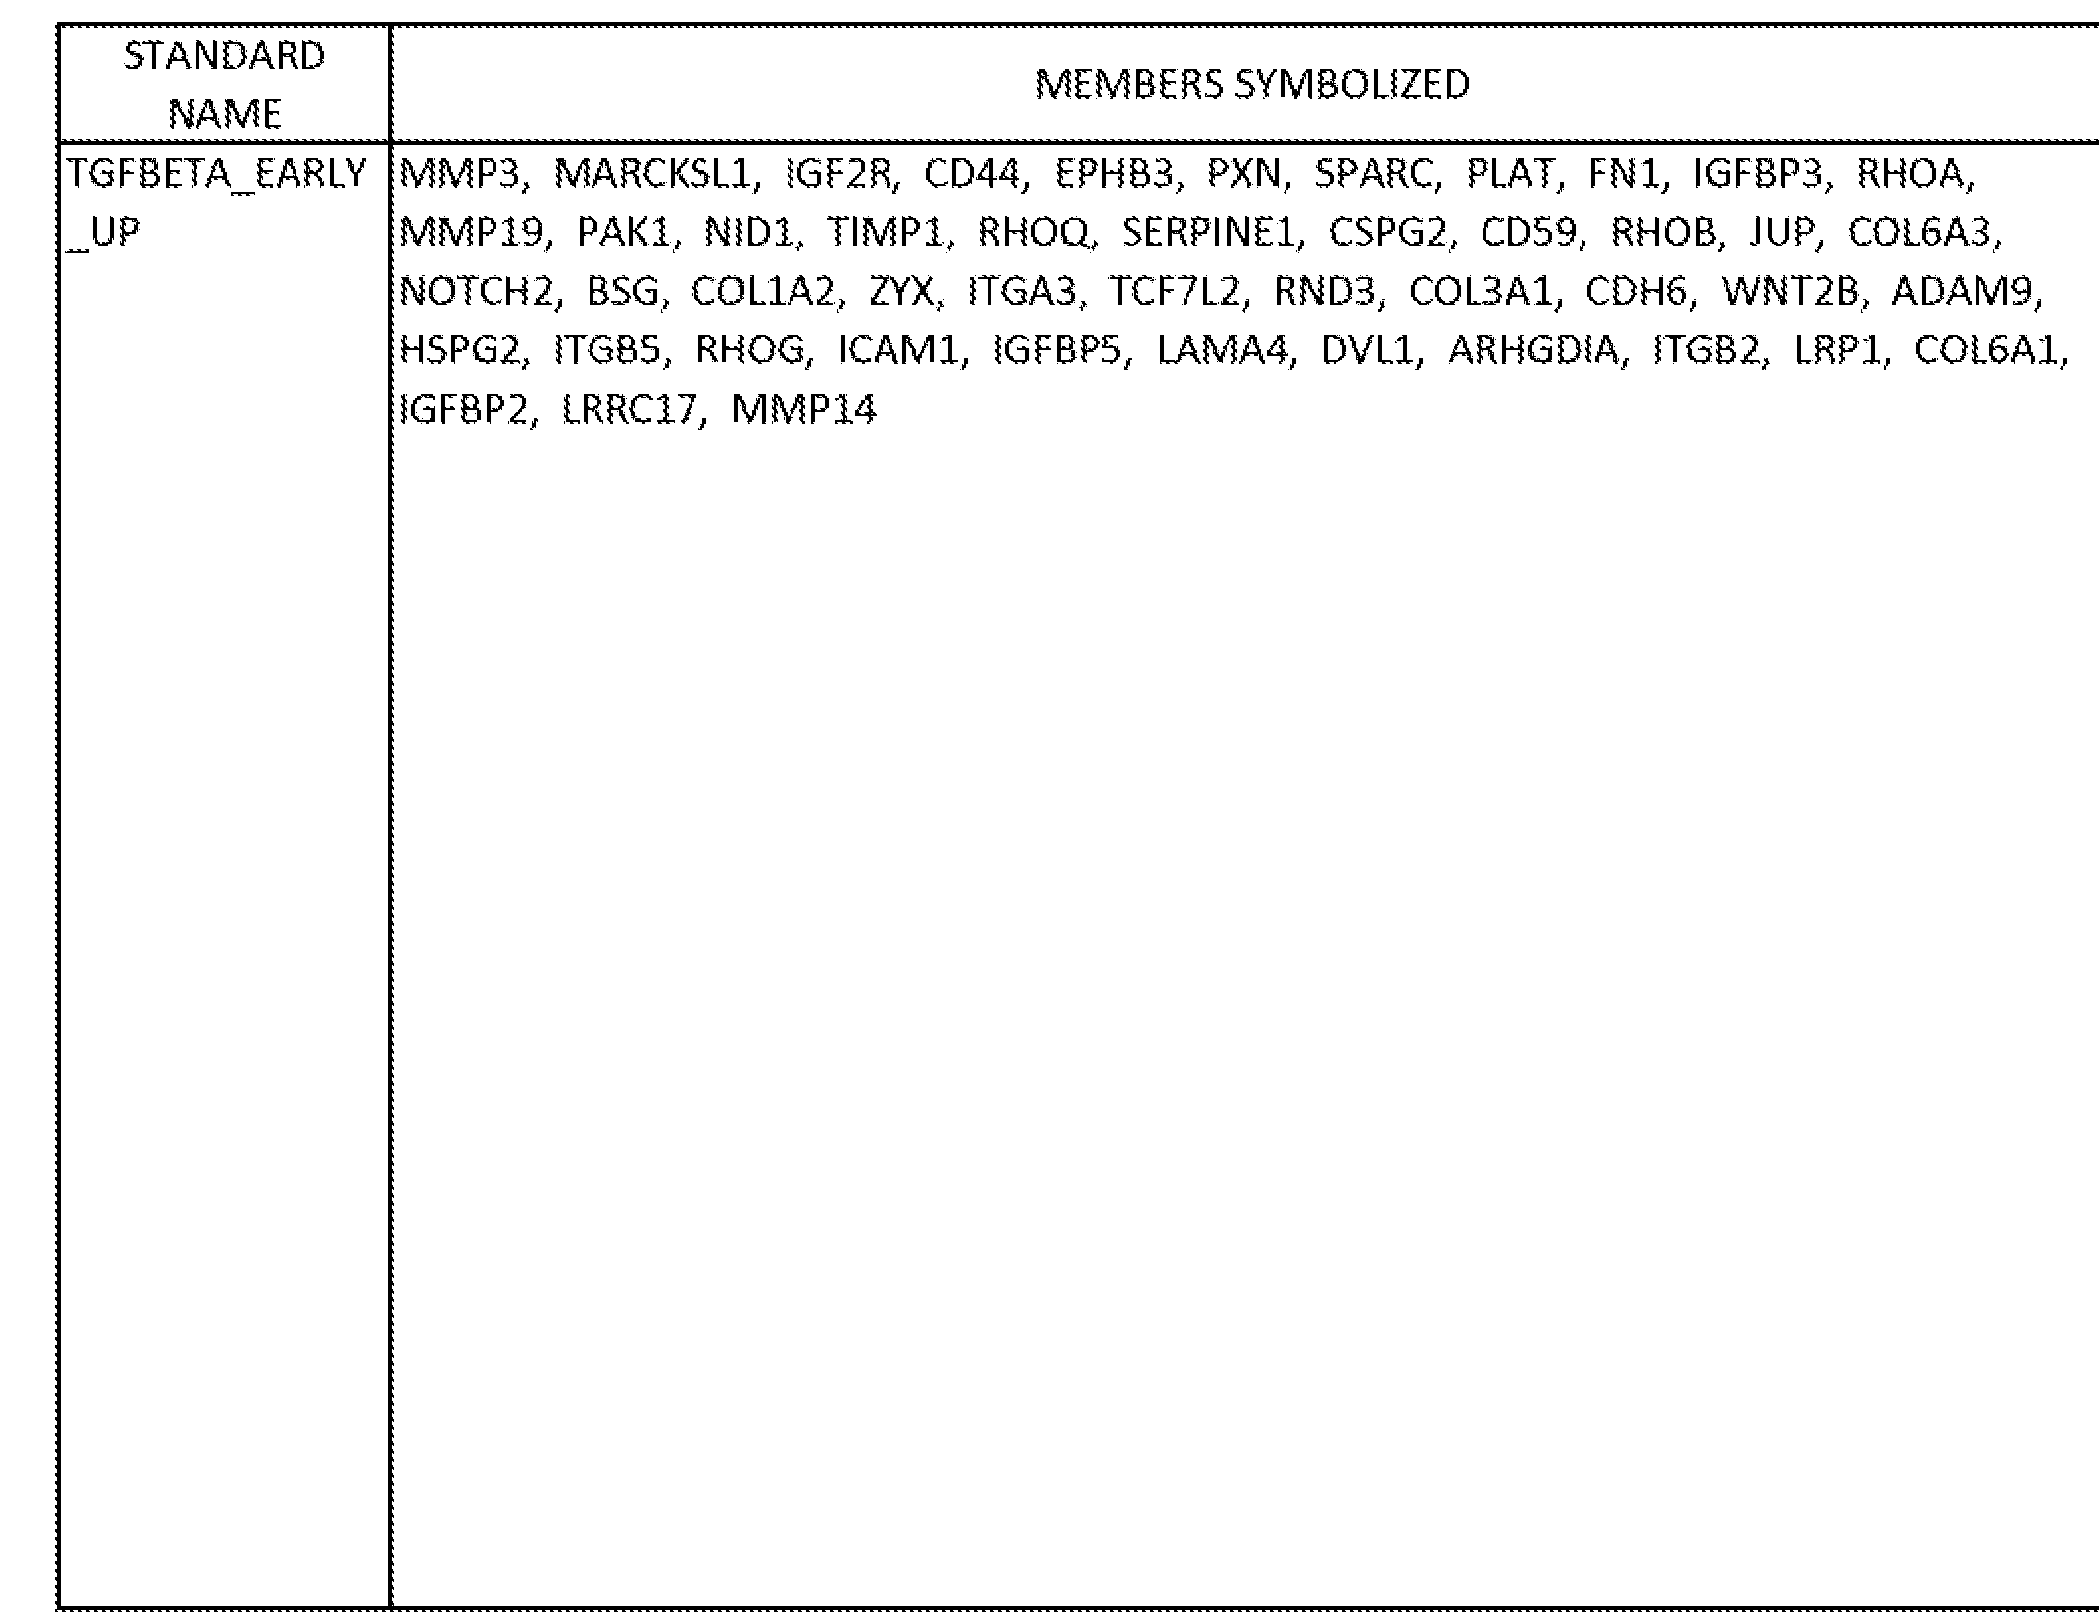
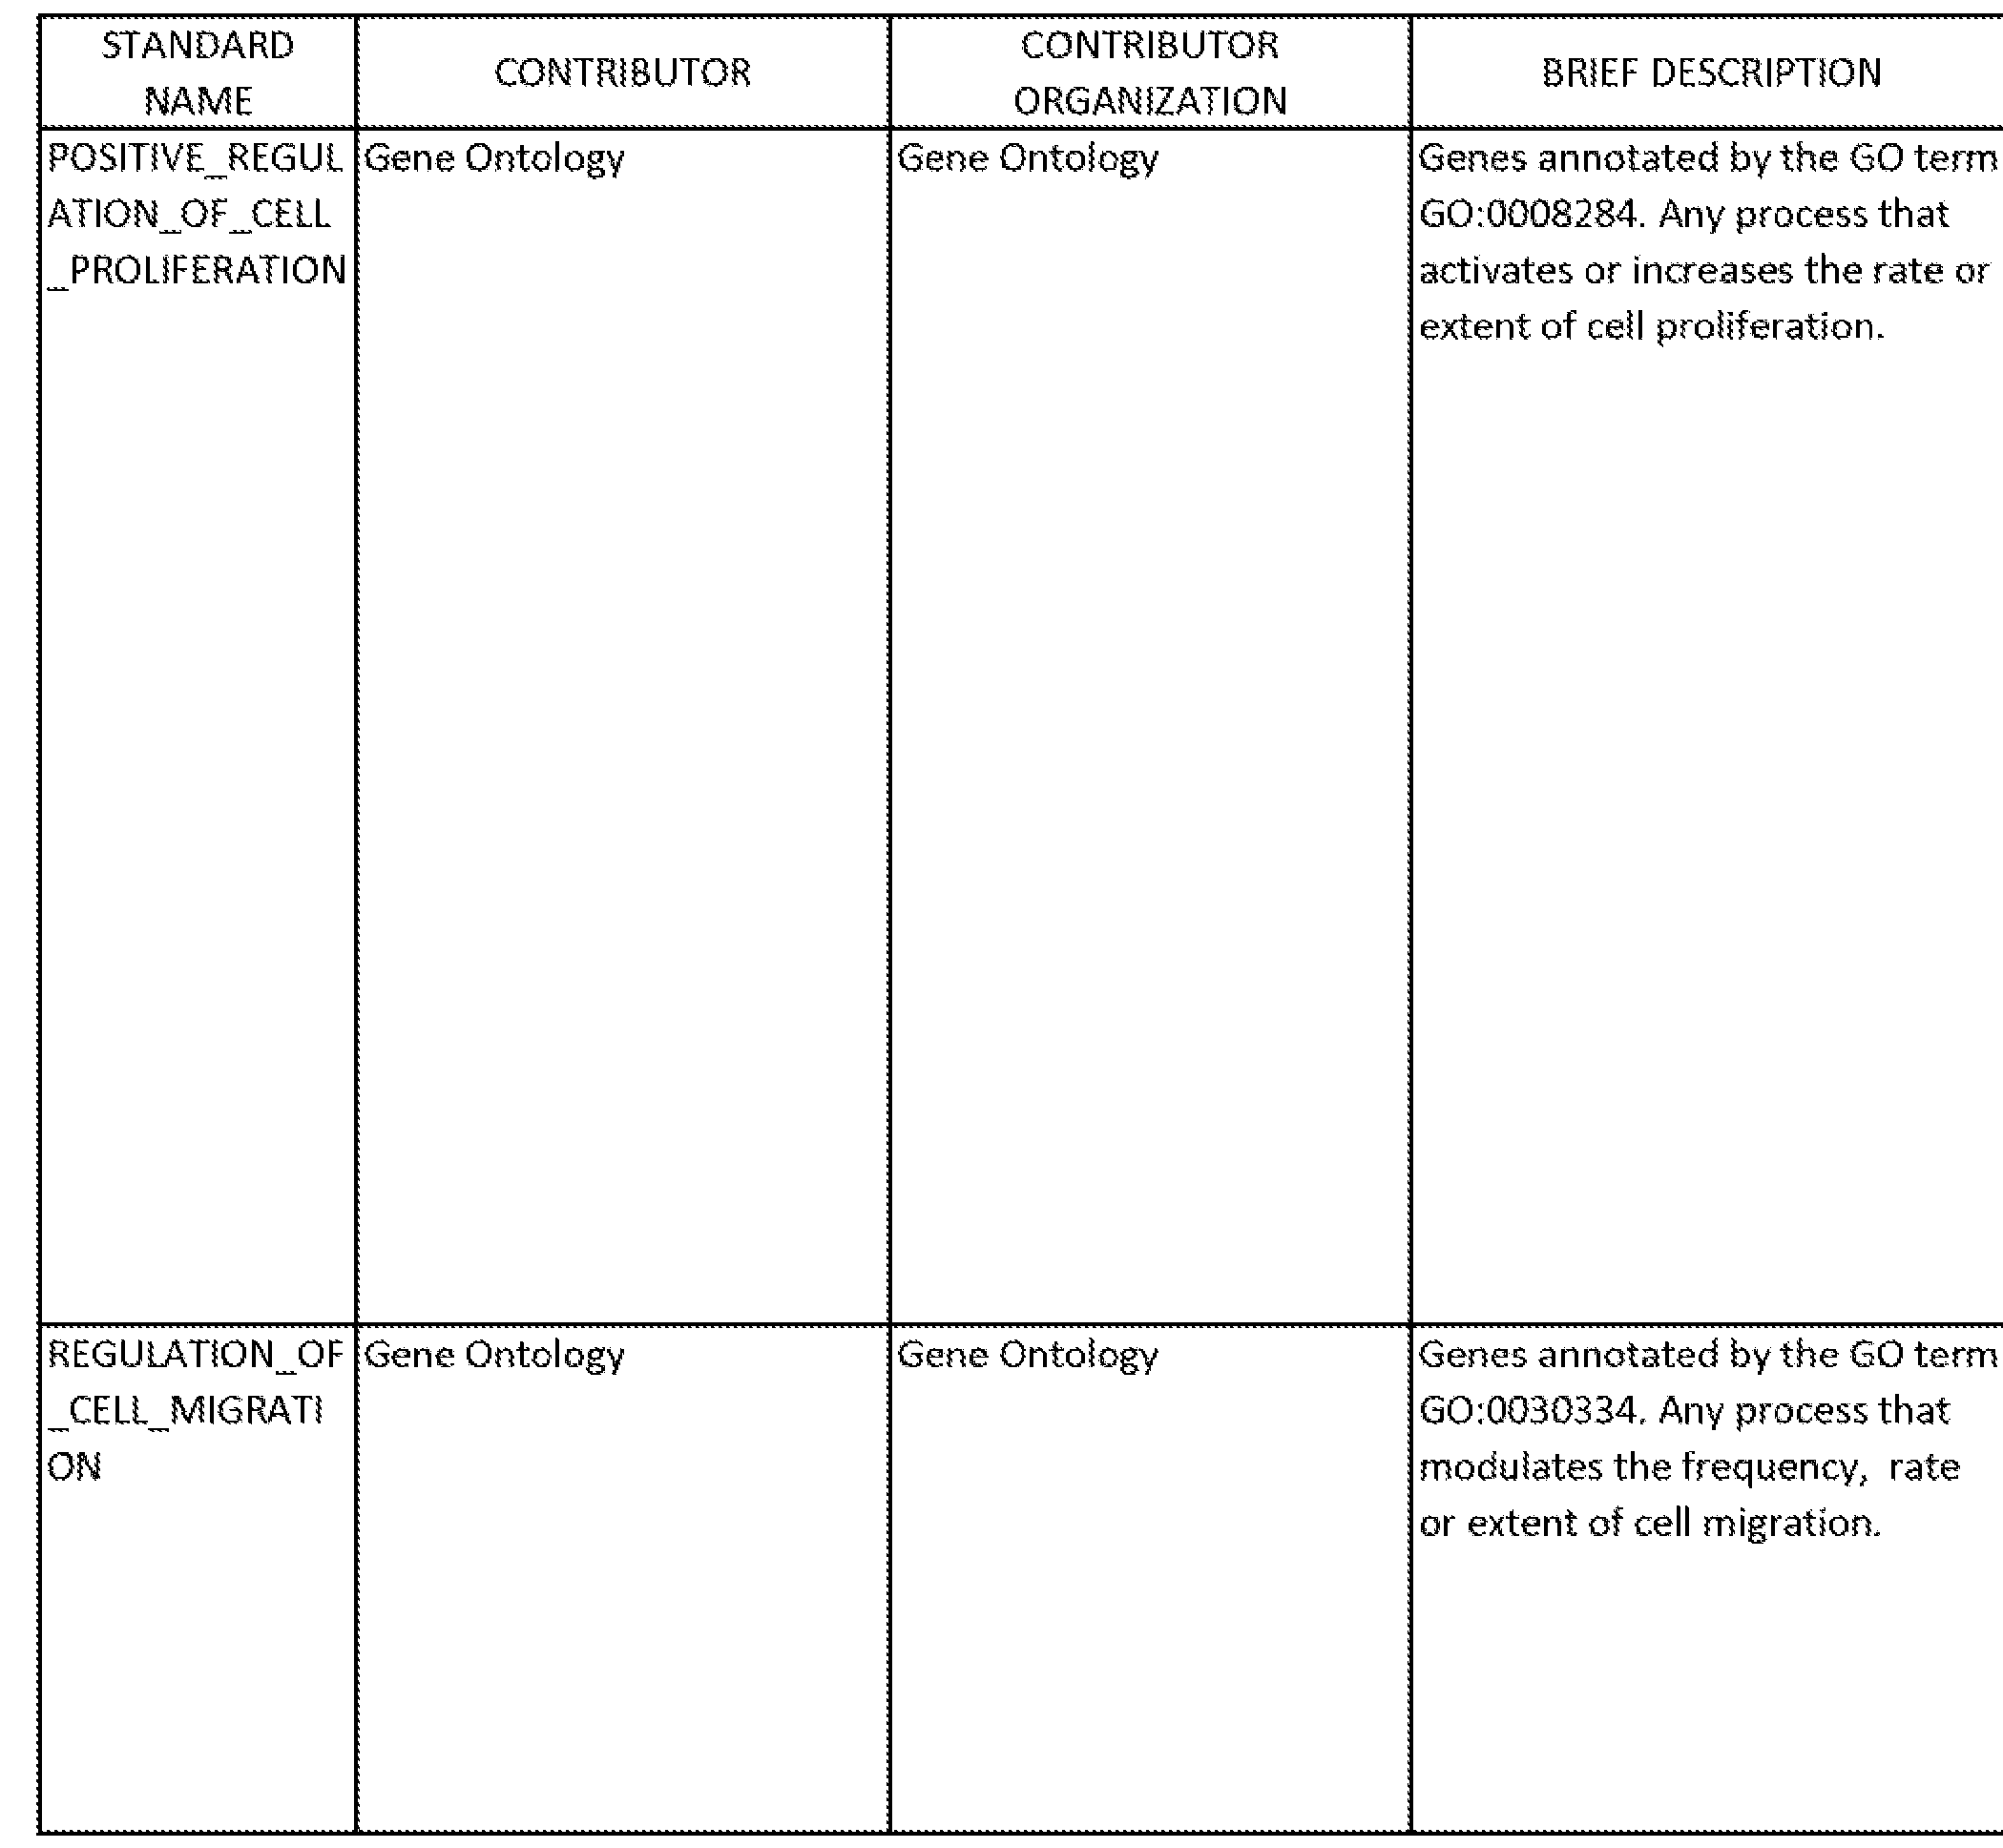
poor clinical prognosis, stem cells, oncogenic signaling, and developmental signaling. Gene sets with higher expression in differentiated cells included signatures of better clinical prognosis, differentiated tumors, and differentiated cells. Information from the Broad Institute's Molecular Signatures Database used in this analysis is presented in Table 2, including a list of genes (members) for each of the gene sets identified in Table 1. All NTk's in Table 1 have a false discovery rate (FDR) <= 0.01. NTk > 0 indicates direct correspondence with differentiated primary culture. NTk < 0 indicates inverse correspondence with differentiated primary culture.
TABLE 1
Gene Sets With Significant Changes During Differentiation of a Primary Serum-Free Culture of NSCLC
GENE SET- STANDARD NAME1 Additional notes NTk2
TABLE 2
-224-
-225-
227
229
Taken together, the foregoing results define a differentiation hierarchy in a primary NSCLC culture and indicate that retinoic acid differentiation can partially reverse the tumorigenic profile.
EXAMPLE 4 Identification of Tumor Initiating Cells
In Non Small Cell Lung Cancer Cell Xenografts
Primary xenograft lines were prepared using female, athymic nu/nu (nude) and NOD-SCID mice (18-23 g) obtained from Charles River of Wilmington, Massachusetts, USA. To assess tumorigenic potential of sorted cells, the cells were implanted in 50% Matrigel (BD Biosciences) subcutaneously between the shoulder blades. Typically, for H460T and HCC2429, 100 sorted cells were implanted per nude mouse. For the 37622 line, 2500 cells were implanted per nude mouse. For the 60257 line, 5000 cells were implanted per nod-scid mouse. Tumors were measured at least once a week with tumor volume = 0.5 x (tumor width^) x (tumor length). Each implant line was propagated by explanting a fragment of the resulting xenograft into new animals and thus was maintained exclusively in vivo. In each line, the histology of the xenografts resembled that of the original tumor. Samples were cryopreserved so that experiments could be performed and repeated in low-passage xenografts. lmmunohistochemical analysis of primary implants was performed using standard techniques and revealed heterogeneous expression of 5T4. In multiple implant lines the highest 5T4 expression was observed at the tumor-stroma interface. In xenografts prepared using 37622 cells, a similar staining pattern was observed for vimentin, a marker of the epithelial-mesenchymal transition of differentiation. Vimentin was not detected in xenografts prepared using 60274 cells.
Heterogeneous 5T4 expression in xenografts was also observed by flow cytometry. Dissociated 37622 implants showed distinct 5T4high and 5T4low populations were evident among the viable human cells (Figure 8A). When a serum-free culture was established from 37622 xenografts, all cells expressed
high 5T4 (Figure 8A), which was consistent with the culture conditions that promote stem cell growth. When these cells were re-implanted into animals, the resulting tumors were heterogeneous for 5T4 expression (Figure 8A).
To determine whether 5T4 expression was associated with higher tumorigenicity, as in H460T, primary implant xenografts were dissociated and FACS-isolated cells were implanted into animals. 5T4hιgh cells were more tumorigenic than 5T4l0W cells in 37622 and 60257 implant lines (Figure 8B).
EXAMPLE 5 Additional Biomarkers of Tumor Initiating Cells
Cells harvested from cultured cell lines (as described in Examples 1 and
2) were resuspended in lysis buffer (QIAGEN of Valencia, California, USA) and total RNA was purified using QIAGEN RNEASY® columns following the manufacturer's instructions. For xenograft tumors (as described in Example 4), tumor samples were first disrupted by sonication in 3ml ice-cold 4M guanidinium/10% sodium acetate buffer (RNAGENTS®, Promega of Madison, Wisconsin, USA), extracted 2X with phenol-chloroform-isoamyl alcohol (50:48:2) and RNA precipitated from aqueous phase using an equal volume of isopropanol. The precipitate was subsequently resuspended in lysis buffer (QIAGEN) and total RNA purified using QIAGEN RNEASY® columns following the manufacturer's instructions. cDNA was synthesized from 10μg of total RNA using the SUPERSCRIPT® Kit (Gibco BRL of Gaithersburg, Maryland, USA) essentially as described by Byrne et al., in F. e. a. Ausubel, ed., Current Protocols in Molecular Biology. 2000, New York: John Wiley and Sons, Inc. First strand synthesis was carried out at 5O0C to prevent mispriming from ribosomal RNA and utilized a T7 RNA polymerase promoter containing poly-T primer (T7T24) for subsequent in vitro antisense RNA (cRNA) amplification and biotin labeling. cDNA was purified using GENECHIP® sample cleanup module (Affymetrix of Santa Clara California, USA) following the manufacturer's instructions. In vitro T7 polymerase driven transcription reactions for synthesis and biotin labeling of antisense cRNA
utilized GENECHIP® Expression 3'-Amplification Reagent kit (Affymetrix of Santa Clara California, USA) following the manufacturer's instructions. Synthesized cRNA was purified using QIAGEN RNEASY® columns.
For each sample, 10μg of biotin-labeled cRNA was fragmented and hybridized to Human Genome U133+2 GENECHIP® oligonucleotide arrays (Affymetrix of Santa Clara, California, USA) using buffers and conditions recommended by manufacturer. GENECHIP® oligonucleotide arrays were washed and stained with Streptavidin R-phycoerythrin (Molecular Probes of Eugene, Oregon, USA) using the GENECHIP® Fluidics Station 450 and scanned with a Affymetrix GENECHIP® Scanner 3000 (Affymetrix of Santa Clara, California, USA) following the manufacturer's instructions. Fluorescent data were collected and converted to gene specific signal intensities using MicroArray Suite 5.0 (MAS5) software where mean fluorescence difference between perfect match and single mismatch probe sets containing gene-specific oligonucleotides are used to determine mRNA signal intensity. For analysis, mean mRNA signal intensity of replicate samples was determined for each of the experimental groups. Genes were initially filtered to remove those probes where either all samples were called Absent by the MASS software. Mean signal intensity values were subsequently compared between experimental groups to identify genes with average fold change typically greater than 2-fold.
A number of genes were differentially expressed in tumor-initiating cells, including the following genes, which showed elevated expression in CD24- -/lowCD44+ tumor-initiating cells: TGFβRIII, Unc5D, PNPLA4, KCNJ2, GABRB3, DPYD1 SPAG1, ICK, STC2, DEFβi, and predicted gene FLJ38736. The gene expression profiles of the primary culture in growth and differentiation (see Example 3) were also compared to those of the H460T CD24" -/lowCD44+ and CD24highCD44+ populations. A significant fraction of the genes that were expressed at higher levels during differentiation of the primary culture were also expressed at higher levels in the CD24highCD44+ cells (FDR = 0.0015). For statistical comparison of the H460T and 87426 data sets, the top 250 upregulated genes in the differentiated 87426 culture were compared in the
H460T populations. Figure 7D shows the expression difference for genes that are above noise level in the H460T data set. Statistical analysis yielded the False Discovery Rate of 0.0015. This analysis indicates that these very different experimental systems are physiological models of the differentiation hierarchy in NSCLC. The microarray data were confirmed by flow cytometry (Figures 7E-7F). Accordingly, additional markers for enrichment or isolation of tumor initiating cells, either by positive selection, by low level expression, or by depletion of differentiated cells, include those set forth in Tables 1 and 2 (see Example 3).
EXAMPLE 6 Sox2 Regulates Differentiation of Lung Cancer Tumor Initiating Cells
Gene expression profiling was performed on a panel of CD24"-/lowCD44+ clones to compare the clones that transitioned to CD24hιgh with the clones that were stable (>99% CD24--/low). CD24-"OWCD44+ cells were sorted from each clone and RNA was extracted for microarray analysis as described in Example 5. Gene expression profiles for stable CD24-/l0wCD44+ clones and transitioning CD24/lowCD44+ clones were similar overall, but mRNA levels of some genes correlated with the transition efficiency. For example, Sox2 mRNA levels were higher in the transitioning clones than in the stable clones (Figure 9A). Sox2 is a transcription factor that is required for pluripotency and self- renewal in stem cells (Avilion et al., Genes Dev., 2003, 17: 126-140; Boyer et al., Ce//, 2005, 122: 947-956) and can contribute to the induction of pluripotency in differentiated cells (Takahashi & Yamanaka, Cell, 2006, 126: 663-676). In parental H460T cells, Sox2 was expressed in the CD24""0WCD44+ tumor-initiating cells but not in the CD24highCD44+ cells. To test whether Sox2 could regulate the transition from CD24"-/low to
CD24high expression, exogenous Sox2 was introduced into stable CD24"-/lowCD44+ clones. Expression vectors EX-T2547-M46 (Sox-2) and EX-M0425-M46 (Sox- 11) from GeneCopoeia (Germantown, Maryland, USA) were introduced into H460T clones with the Amaxa nucleofector solution V, program T-020 (2 μg DNA per 106 cells). Stable clones were transfected with Sox2-Flag, Sox11-Flag,
empty vector, or no DNA. Forty-eight hours after transfection, G418 was added to 400 μg/ml. Cells were incubated in G418 for six days and subsequently without G418. lmmunoblot analysis was performed as described in Example 2, which confirmed expression of the indicated transgenes (Figure 9B). After a 6- day selection in G418 and two additional weeks in culture, all three stable CD24- -/lowCD44+ clones exhibited large fractions of CD24highCD44+ cells after transfection with Sox2-Flag but not Sox11-Flag or empty vector (Figures 9C-9D). These data indicated that Sox2 was sufficient to drive the transition from CD24" /low to CD24hιgh, indicating a role in the differentiation of multipotent tumor- initiating cells.
EXAMPLE 7 Inhibition of Tumor Cell Growth Using Anti-5T4 Antibody/Drug Conjugates
The CD24"-/lowCD44+ population was more sensitive to an anti-5T4 antibody-drug conjugate than the CD24hιghCD44+ population in an cell viability assay and a colony growth assay. For each assay, antibody-calicheamicin AcBut-linked (AcBut - AcBut-[4-(4-acetylphenoxy) butanoic acid]) conjugates were prepared as described (Hamann et al., Bioconjug. Chem., 2002, 13: 47-58). The effect of anti-5T4 huH8 antibody-drug conjugate or anti-CD22 antibody-drug conjugate on sorted cells was assessed using a cellular viability indicator ((3- (4,5-dimethylthiazol-2-yl)-5(3-carboxymethonyphenol)-2-(4-sulfophenyl)-2H- tetrazolium (MTS) (Promega of Madison, Wisconsin, USA) to determine the number of surviving cells following exposure to the drug treatment. Cells were sorted 18 hours prior to start of assay. Cells were seeded in 96-well microtiter plates at a density of 10,000 cells per well and exposed to various concentrations of the drug. Following determination of the number of viable cells surviving 96 hours of drug exposure, the IC50 of each treatment was calculated based on the logistic regression parameters derived from the dose-response curves. IC50 values were calculated by logistic non-linear regression and are reported as the calicheamicin dimethyl hydrazide (CalichDMH) concentration from each treatment group that causes 50% loss of cell viability. CD24--/lowCD44+ cells were
more than ten-fold more sensitive to the anti-5T4-calicheamicin conjugate (Figure 10A). No difference between the two populations was observed when treated with anti-CD22-calicheamicin conjugate or calicheamicin alone (Figure 10A).
To perform a colony formation assay, cells were seeded in 24 well plate at a density of 5,000 cells per well. Twenty-four hours after seeding the cells were exposed to various concentrations of (0.000097, 0.000390, 0.00156, 0.00625, 0.025, 0.1 , 0.4 ng calicheamicin equivalents/ml) of anti-5T4 H8-AcBut conjugate, anti-CD22 AcBut conjugate, or calicheamicin alone. Seventy-two hours after the drug exposure, cells were trypsinized, counted and 200 cells were plated in 6 well plates. After δ days, the colonies were fixed and stained with methylene blue. The number of colonies per well was counted using a Stereoscope. CD24- -/lowCD44+ cells were more than ten-fold more sensitive to the conjugate (Figure 10B). No difference between the two populations was observed when treated with anti-CD22-calicheamicin conjugate or calicheamicin alone (Figure 10B). To test whether 5T4 expression was directly associated with tumorigenic potential, H460T cells were sorted based upon 5T4hιgh and 5T4IOW expression and implanted subcutaneous Iy into mice. Tumors from 5T4hl3h cells were larger than tumors from the 5T4low cells (p<0.03; Figure 11). For this experiment, H460T clonal line 24N-26 was used, which shows higher levels of 5T4 expression and increased resolution of 5T4hιgh and 5T4low expression as compared to the parental line.
EXAMPLE 8 Tumor Regression Using Anti-5T4 Antibody/Drug Conjugate
Nude (for 37622) or nod-scid (for 60274) mice were injected subcutaneously between the shoulder blades with fragments of low-passage primary implants. When the tumors reached the mass of 0.2 to 0.5 g, the tumors were staged to ensure uniformity of the tumor mass between various treatment groups prior to the administration of therapy. Anti-5T4 huH8 antibody and anti-
CD33 p67.6 antibody were conjugated to calicheamicin via an amide linker as described (Hamann et al., Bioconug. Chem., 2002, 13: 40-46). The "amide"
linker restricts the release of calicheamicin to cells that internalize the antibody- drug conjugate (Hamann et al., Bioconυg. Chem., 2002, 13: 40-46). Antibody- drug conjugates or vehicle were each administered intraperitoneal^ in sterile saline (0.2 ml/mouse) on day 1 and the same treatment was repeated twice four days apart (Q4Dx3). The calicheamicin conjugates were administered at a dose of 160 μg/kg of CalichDMH. Tumors were measured at least once a week and their mass was as volume = 0.5 x (tumor width2)(tumor length). Mean tumor volume (± SEM) for each treatment group was calculated and compared to the vehicle-treated group for statistical significance using a one-sided t-test, with the error term for the t-test based on the pooled variance across all treatment groups. Tumor values for each treatment group were recorded up to 120 days after the initiation of treatment or until either tumor-bearing mice died or the tumors grew to 15% of the body weight at which time these mice were euthanized according to institutional regulations. The anti-CD33 conjugate served as control because these xenografts do not express CD33.
Treatment with anti-5T4-calicheamicin conjugate completely eradicated the 37622 xenografts, and no regrowth was observed through the end of the study, 120 days after the last dose (Figure 12A). Xenografts treated with vehicle or anti-CD33-calicheamicin conjugate grew into large tumors. Similarly, treatment of 60274 xenografts with the anti-5T4-calicheamicin conjugate regressed the tumors significantly (Figure 12B). In contrast, treatment of 60274 tumors with cisplatin at the maximum tolerable dose reduced tumor size transiently, and the tumors quickly regrew after completion of the dosing regimen (Figure 12C). 60274 cells express 5T4 at lower levels when compared to 37622 cells (Figure 13). These results demonstrated a specific effect of an anti-5T4 antibody-calicheamicin conjugate on growth inhibition of NSCLC primary implants with heterogeneous 5T4 expression.