WO2010065348A2 - Anisotropic parameter determination - Google Patents
Anisotropic parameter determination Download PDFInfo
- Publication number
- WO2010065348A2 WO2010065348A2 PCT/US2009/065397 US2009065397W WO2010065348A2 WO 2010065348 A2 WO2010065348 A2 WO 2010065348A2 US 2009065397 W US2009065397 W US 2009065397W WO 2010065348 A2 WO2010065348 A2 WO 2010065348A2
- Authority
- WO
- WIPO (PCT)
- Prior art keywords
- seismic
- receivers
- intervals
- earth
- anisotropy parameters
- Prior art date
- Legal status (The legal status is an assumption and is not a legal conclusion. Google has not performed a legal analysis and makes no representation as to the accuracy of the status listed.)
- Ceased
Links
Classifications
-
- G—PHYSICS
- G01—MEASURING; TESTING
- G01V—GEOPHYSICS; GRAVITATIONAL MEASUREMENTS; DETECTING MASSES OR OBJECTS; TAGS
- G01V1/00—Seismology; Seismic or acoustic prospecting or detecting
- G01V1/28—Processing seismic data, e.g. for interpretation or for event detection
- G01V1/30—Analysis
- G01V1/303—Analysis for determining velocity profiles or travel times
-
- G—PHYSICS
- G01—MEASURING; TESTING
- G01V—GEOPHYSICS; GRAVITATIONAL MEASUREMENTS; DETECTING MASSES OR OBJECTS; TAGS
- G01V1/00—Seismology; Seismic or acoustic prospecting or detecting
- G01V1/40—Seismology; Seismic or acoustic prospecting or detecting specially adapted for well-logging
- G01V1/42—Seismology; Seismic or acoustic prospecting or detecting specially adapted for well-logging using generators in one well and receivers elsewhere or vice versa
-
- G—PHYSICS
- G01—MEASURING; TESTING
- G01V—GEOPHYSICS; GRAVITATIONAL MEASUREMENTS; DETECTING MASSES OR OBJECTS; TAGS
- G01V2210/00—Details of seismic processing or analysis
- G01V2210/60—Analysis
- G01V2210/62—Physical property of subsurface
- G01V2210/626—Physical property of subsurface with anisotropy
-
- G—PHYSICS
- G01—MEASURING; TESTING
- G01V—GEOPHYSICS; GRAVITATIONAL MEASUREMENTS; DETECTING MASSES OR OBJECTS; TAGS
- G01V2210/00—Details of seismic processing or analysis
- G01V2210/60—Analysis
- G01V2210/66—Subsurface modeling
Definitions
- This disclosure relates to a method of geophysical prospecting which improves the accuracy of seismic migration and depth velocity model building. Specifically, the disclosure uses a walkaway, multi-azimuthal walkaway or 3D VSP survey for determination of anisotropy parameters characterizing subsurface velocities that may be used for imaging of reflections.
- Description of the Related Art [0002] In surface seismic exploration, energy imparted into the earth by a seismic source reflects from subsurface geophysical features and is recorded by a multiplicity of receivers. This process is repeated numerous times, using source and receiver configurations which may either form a line (2-D acquisition) or cover an area (3-D acquisition). The data which results is processed to produce an image of the reflectors using a procedure known as migration. [0003] Conventional reflection seismology utilizes surface sources and receivers to detect reflections from subsurface impedance contrasts. The obtained image often suffers in spatial accuracy, resolution and coherence due to the long and complicated travel paths between source, reflector, and receiver.
- VSP Walkaway Vertical Seismic Profile
- 3D VSP surveys to estimate formation velocities.
- VSP walkaway Vertical Seismic Profile
- Common to the prior art methods is an assumption that the earth is isotropic. It has been recognized for several years that the earth is anisotropic, i.e., that the velocity of compressio ⁇ al waves depends upon the direction of propagation.
- P-wave anisotropy is manifested by a change in the compressional wave velocity with direction of propagation in earth formations due to combined effects of sedimentary layering and the intrinsic anisotropy of the rock. Shales, in REPLACEMENT SHEET
- a walkaway VSP survey measurements are made using a plurality of receivers in a borehole responsive to excitation of one or more seismic sources at a plurality of distances from the wellbore.
- the estimated velocities and two VTI interval parameters e and ⁇ may then be used for migration of the walkaway VSP data or of surface seismic data and for interpretation purpose.
- One embodiment of the disclosure is a method of evaluating an earth formation.
- the method includes deploying an array of seismic receivers in a borehole and recording seismic signals in the array of receivers responsive to an activation of a seismic source at a plurality of positions on the surface of the earth.
- the method further includes estimating, from travel times of seismic waves from the plurality of source positions to the plurality of receivers, velocities of vertically propagating seismic waves in a plurality of intervals, and two anisotropy parameters ⁇ and ⁇ related to a normal moveout curve of compression ⁇ waves for the plurality of intervals.
- the estimated vertical velocities and the estimated interval anisotropy parameters may be used to further process surface seismic data to give a seismic image in depth for the purpose of interpretation.
- the method may further include estimating, from travel times of seismic waves from the plurality of source positions around the well to the plurality of receivers, velocities of vertically propagating seismic waves in a plurality of intervals, and five orthorhombic anisotropy parameter and related to a normal moveout velocity of compressional waves for the plurality of intervals.
- the estimated vertical velocities and the estimated anisotropy parameters may be used to further process surface seismic data to give a seismic image in depth for the purpose of interpretation.
- Another embodiment of the disclosure is a system for evaluating an earth formation.
- the system includes an array of seismic receivers configured to be deployed in a bo ⁇ ehole and record seismic signals responsive to an activation of a seismic source at a plurality of positions near the surface of the earth.
- the system further includes a processor configured to estimate, from travel-times of seismic waves from the plurality of source positions to the plurality of receivers, velocities of vertically propagating seismic waves in a plurality of intervals, and two anisotropy parameters e and 5 related to a normal moveout curve of compressional waves for the plurality of interval.;, hi case of multi-azimut ⁇ al walkaway survey or 3D VSP data, the system may further include a processor configured to estimate, from travel-times of seismic waves from the plurality of source positions around the well to the plurality of receivers, velocities of vertically propagating seismic waves in a plurality of intervals, and five orthorhombic anisotropy parameters and related to azimuthally-depende ⁇ t normal moveout curves of compressional waves for the plurality of intervals.
- Another embodiment of the disclosure is a computer-readable medium accessible to at least one processor.
- the medium includes instructions which enable the at least one processor to estimate, using travel-times of seismic downgoing direct P waves from a plurality of source positions (walkaway geometry) to a plurality of receivers in a borehole, velocities of vertically propagating seismic P waves in ⁇ x plurality of intervals, and two anisotropy parameters related to a normal moveout curve of compressional waves for tine plurality of intervals.
- the medium may include instructions which enable the at least one processor to estimate, using travel-times of seismic downgoing direct P waves from a plurality of source positions (walkaway geometry) to a plurality of receivers in a borehole, velocities of vertically propagating seismic P waves in a plurality of intervals, and five orthorhombic anisotropy parameters related to azimuthally-dependent normal moveout curves of compressional waves for the plurality of intervals.
- FIG. 1 illustrates the geometry of data acquisition of a walkaway VSP according to the present disclosure
- FIG. 2 illustrates the simulated geometry of a surface seismic reflection survey using a walkaway VSP survey
- FIG. 3 shows a flow chart illustrating how the method of the present disclosure may be used for processing seismic data
- FIG. 4 shows sectors creaied from 3D VSP geometry to determine VTI parameters in each sector.
- FIG. 1 Shown therein is the surface of the earth 123 with a rig 121 thereon. This may be a drilling rig or it may be a mast rig which conveys a wireline into a borehole 101.
- the borehole 101 penetrates layers 103, 105...
- seismic sensors Positioned in the borehole 101 are seismic sensors denoted by Ilia, IHb 3 ⁇ llc, H id...
- Each of the sensors may include a hydrophone, a single-component geophone or a multi-component geophone.
- Data for a single offset VSP is typically acquired using a single seismic source such as 125a at the surface (or within a body of water at the surface).
- a single seismic source such as 125a at the surface (or within a body of water at the surface).
- Exemplary raypath which depicts the propagation of seismic energy from the source 125a to the detectors Ilia and
- FIG. 2 shows the simulated geometry of a surface seismic survey derived from the walkaway VSP survey of FlG.l.
- a vertical borehole has been assumed, the sources have been "reflected" in the borehole to simulated receiver locations on the surface 225a, 225b, 225c... similarly, the raypaths have also been reflected to give simulated raypaths on the left side of the borehole.
- t(x,z) be first break time (time arrival for downgoing P wave) where x is the offset and z is a receiver depth. Then we can find the reflected traveltimes t ⁇ (x) and t 2 (x) for two virtual boundaries at the depth Z 1 and z 2 of two receivers:
- VTI vertically transversely isotropic
- eqn (3) is correct only when is estimated using short offsets.
- ⁇ an anisotropy parameter related to the NMO velocity
- ⁇ an anisotropy parameter related to the horizontal velocity.
- ⁇ is estimated within the receiver array depth interval. For each pair of the receivers with some minimum distance (about 50- 100m), ⁇ is estimated. The estimated ⁇ is smoothed to give a smoothed 8 as a function of depth. If there are boundaries in the formation within the array where the subsurface property changes significantly (e.g., lithology changes), we ⁇ may be determined between these boundaries. Parameter ⁇ is important because knowing ⁇ and velocity calculated diorough Dix formula from surface seismic data, it is possible to estimate the vertical velocity that is needed for time- to-depth conversion of seismic post -stack data. This is discussed with reference to FIG. 3.
- Walkaway VSP data are recorded 301 as discussed above. From the walkaway VSP data, is estimated for a layered model 303 using methods discussed in paragraph [0016]. From the estimates, X is calculated 305 using eqn (2). A layered model of ⁇ is calculated 307 using eqn. (3). This may be repeated for additional arrays in the borehole. Surface seismic data are recorded 311 at or near the location of the walkaway VSP acquisition. is estimated for a plurality of depths 313. X is calculated 315 and using the model of ⁇ estimated from walkaway VSP data, an estimate of is derived from the surface seismic data.
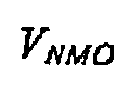
- VNM O cannot be determined for a plurality of depths from surface seismic, but o.ily for a plurality of times. To convert times to depths, a vertical velocity or a tie of surface seismic events to VSP reflections is needed. This may not be possible. This model of VVERT may then be used for time to depth conversion of stacked seismic data away from the well where the VSP data are acquired,
- the moveout function is approximated by a shifted parabola.
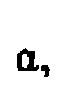
- n is the number of a layer between the first and second receivers, Lc, there are n layers above the second receiver, is the vertical velocity in layer is the ratio of the shear velocity Vs to the compressional wave velocity in layer
- walkaway survey includes one position of a multichannel receiver array.
- the multi -channel receiver array may be deployed at additional depths. It is then possible to determine the two anisotropic parameters ⁇ and ⁇ for the anisotropic depth migration of the surface seismic data for the entire subsurface above total well depth.
- One embodiment of the disclosure extends the method described above to an orthorhombic horizontally layered medium. Such an orthorhombic horizontally-layered medium results from introducing, for example, vertical fractures in a VTI medium.
- Tsvankin's notation includes vertical velocity and five dimcnsionless parameters: the VTI Thomsen's parameters ⁇ 2 and ⁇ 2 for [x 1 , X 3 ] symmetry plane, ⁇ i and ⁇ i for [ ] symmetry plane and parameter ⁇ 3 for in the horizontal symmetry plane
- VTI Thomsen's parameters ⁇ 2 and ⁇ 2 for [x 1 , X 3 ] symmetry plane, ⁇ i and ⁇ i for [ ] symmetry plane and parameter ⁇ 3 for in the horizontal symmetry plane Knowing vertical velocity from zero-offset VSP, we can estimate anisotropic coefficients ⁇
- Coefficients ⁇ , ⁇ 2 , and ⁇ 3 can be estimated through first breaks non- hyperbolic approximations assuming weak anisotropy with respect to these parameters.
- each vertical plane with azimuth ⁇ can be considered as VTI plane (Tsvankin, 1997).
- Coeficiends and in the vertical plane with azimuth ⁇ are estimated using Dix type inversion described for VTI layered model.
- Dix type inversion described for VTI layered model.
- Multi-azimuthal walkaway geometry may include at least 6 walkaway lines through the well, at 30o increment. For stable estimates, it's better to have 9 walkaway lines with 20o increment.
- 3D VSP data provides azimuthal estimates with many sectors. Modeling shows that 12 sectors with 15 degrees each provide stable estimates of five anisotropic orthorhombic parameters and FIG. 4 demonstrates the division the circle into 12 azimuths and added times with symmetrical oftsets and to eliminate influence of velocity gradient. We also stack opposite (symmetrical) offsets to simulate surface seismic NMO curve T(x) for further Dix-type inversion for interval anisotropic parameters.
- LLR Baker Hughes' multi level receiver
- 3D VSP data we can use 300-chan ⁇ el SERCEL equipment with three-component hundred level borehole tool (one vertical and two horizontal components). This greatly speeds up the data acquisition.
- the downhole receivers can be run in combination with other logging services, either wireline or pipe-conveyed, reducing the number of trips into the well and saving rig time.
- the downhole receiver can be conveyed on drill pipe or coiled tubing and also run in combination with a variety of openhole logging services greatly reducing rig time.
- the present disclosure addresses the problem of determining orthorhombic anisotropic formation velocities and five orthorhombic anisotropy parameters using a 3D VSP survey.
- a 3D VSP survey measurements are made using a plurality of receivers in a borehole responsive to excitation of one or more seismic sources at a plurality of points covering some area around the well.
- the estimated velocities and orthorhombic anisotropic may then be used for migration of the 3D-VSP data or of 3D surface seismic data to produce an image of the earth formation and for interpretation purpose.
- the produced image maybe used for drilling operations in the earth formation.
- the inversion and migration methodology described above may be implemented on a general purpose digital computer.
- instructions for the computer reside on a machine readable memory device such as ROMs, EPJlOMs, EAROMs, Flash Memories and Optical disks. These may be part of the computer or may be linked to the computer by suitable communication channels, and may be even at a remote location. Similarly, seismic data of the type discussed above may be stored on the computer or may be linked through suitable communication channels to the computer.
- the communication channels may include the Internet, enabling a user to access data from one remote location and get the instructions from another remote location to process the data.
- the instructions on the machine readable memory device enable the computer to access the VSP data and process the data according to the method described above.
Landscapes
- Physics & Mathematics (AREA)
- Life Sciences & Earth Sciences (AREA)
- Engineering & Computer Science (AREA)
- Remote Sensing (AREA)
- Acoustics & Sound (AREA)
- Environmental & Geological Engineering (AREA)
- Geology (AREA)
- General Life Sciences & Earth Sciences (AREA)
- General Physics & Mathematics (AREA)
- Geophysics (AREA)
- Geophysics And Detection Of Objects (AREA)
Abstract
Description






Claims
Priority Applications (2)
| Application Number | Priority Date | Filing Date | Title |
|---|---|---|---|
| GB1109106.3A GB2477259B (en) | 2008-11-25 | 2009-11-20 | Anisotropic parameter determination |
| CA2744044A CA2744044A1 (en) | 2008-11-25 | 2009-11-20 | Anisotropic parameter determination |
Applications Claiming Priority (4)
| Application Number | Priority Date | Filing Date | Title |
|---|---|---|---|
| US11761308P | 2008-11-25 | 2008-11-25 | |
| US61/117,613 | 2008-11-25 | ||
| US12/621,972 | 2009-11-19 | ||
| US12/621,972 US8750074B2 (en) | 2008-11-25 | 2009-11-19 | Anisotropic parameter determination |
Publications (2)
| Publication Number | Publication Date |
|---|---|
| WO2010065348A2 true WO2010065348A2 (en) | 2010-06-10 |
| WO2010065348A3 WO2010065348A3 (en) | 2010-08-26 |
Family
ID=42196129
Family Applications (1)
| Application Number | Title | Priority Date | Filing Date |
|---|---|---|---|
| PCT/US2009/065397 Ceased WO2010065348A2 (en) | 2008-11-25 | 2009-11-20 | Anisotropic parameter determination |
Country Status (4)
| Country | Link |
|---|---|
| US (1) | US8750074B2 (en) |
| CA (1) | CA2744044A1 (en) |
| GB (1) | GB2477259B (en) |
| WO (1) | WO2010065348A2 (en) |
Cited By (1)
| Publication number | Priority date | Publication date | Assignee | Title |
|---|---|---|---|---|
| CN110954941A (en) * | 2018-09-26 | 2020-04-03 | 中国石油化工股份有限公司 | Automatic first arrival picking method and system |
Families Citing this family (22)
| Publication number | Priority date | Publication date | Assignee | Title |
|---|---|---|---|---|
| US20100135115A1 (en) * | 2008-12-03 | 2010-06-03 | Chevron U.S.A. Inc. | Multiple anisotropic parameter inversion for a tti earth model |
| EP2506039A3 (en) * | 2011-03-28 | 2013-08-14 | Conocophillips Company | Methods for Seismic Fracture Parameter Estimation and Gas Filled Fracture Identification From Vertical Well Log Data |
| RU2471206C1 (en) * | 2011-05-12 | 2012-12-27 | Государственное образовательное учреждение высшего профессионального образования Российский государственный университет нефти и газа имени И.М. Губкина | Investigation method of geological section of oil-and-gas wells |
| US9207342B2 (en) * | 2012-03-09 | 2015-12-08 | Chevron U.S.A. Inc. | Correction of shear log for elastic anisotropy |
| WO2014164354A1 (en) * | 2013-04-02 | 2014-10-09 | Halliburton Energy Services, Inc. | Anisotropy analysis using direct and reflected arrivals in seismic survey data |
| WO2016178654A1 (en) * | 2015-05-01 | 2016-11-10 | Padhi Amit | Anisotropic parameter estimation from walkaway vsp data using differential evolution |
| WO2017048285A1 (en) * | 2015-09-18 | 2017-03-23 | Halliburton Energy Services, Inc. | Global inversion based estimation of anisotropy parameters for orthorhombic media |
| US10087733B2 (en) * | 2015-10-29 | 2018-10-02 | Baker Hughes, A Ge Company, Llc | Fracture mapping using vertical seismic profiling wave data |
| WO2017087100A2 (en) * | 2015-11-18 | 2017-05-26 | Schlumberger Technology Corporation | Horizon-based splitting intensity inversion for anisotropic characterization of a target volume |
| US10444063B2 (en) | 2016-09-23 | 2019-10-15 | Baker Hughes, A Ge Company, Llc | Downhole fiber optic hydrophone |
| US11467305B2 (en) | 2017-06-09 | 2022-10-11 | Baker Hughes, A Ge Company, Llc | Anisotropic NMO correction and its application to attenuate noises in VSP data |
| US11073629B2 (en) | 2018-10-16 | 2021-07-27 | Halliburton Energy Services, Inc. | Method to improve DAS channel location accuracy using global inversion |
| CN112558154B (en) * | 2019-09-25 | 2023-10-13 | 中国石油化工股份有限公司 | Orthogonal anisotropic medium speed modeling method and system |
| US11867855B2 (en) | 2019-12-10 | 2024-01-09 | Baker Hughes Oilfield Operations Llc | Downhole fiber optic hydrophone |
| CN112946755B (en) * | 2019-12-11 | 2024-04-30 | 中国石油天然气集团有限公司 | Investigation method and device for near-surface layer |
| CN111596355B (en) * | 2020-06-02 | 2022-04-01 | 中国石油集团东方地球物理勘探有限责任公司 | Zero offset VSP time frequency analysis stratum division and layer velocity determination method |
| US11320554B2 (en) | 2020-08-31 | 2022-05-03 | China Petroleum & Chemical Corporation | Method and system that uses an anisotropy parameter to generate high-resolution time-migrated image gathers for reservoir characterization, and interpretation |
| US11921247B2 (en) * | 2021-02-02 | 2024-03-05 | Schlumberger Technology Corporation | Full automation of high-resolution interval velocity estimation for check-shot and other vertical seismic profile-type datasets |
| US12312933B2 (en) | 2021-03-03 | 2025-05-27 | Schlumberger Technology Corporation | Approaches to directional drilling |
| CN115857005B (en) * | 2022-12-22 | 2025-11-14 | 中油奥博(成都)科技有限公司 | A method and apparatus for obtaining full-depth VTI anisotropy. |
| CN116068625B (en) * | 2023-03-03 | 2025-04-04 | 电子科技大学 | A method for obtaining anisotropic parameters in VSP drive processing while drilling |
| US12560073B2 (en) | 2024-02-23 | 2026-02-24 | Schlumberger Technology Corporation | Systems and methods for determining downhole tool status |
Family Cites Families (9)
| Publication number | Priority date | Publication date | Assignee | Title |
|---|---|---|---|---|
| US5596548A (en) * | 1994-05-12 | 1997-01-21 | Exxon Production Research Company | Seismic imaging using wave equation extrapolation |
| GB9607764D0 (en) | 1996-04-15 | 1996-06-19 | Geco As | Inversion method for seismic data |
| US6714873B2 (en) | 2001-12-17 | 2004-03-30 | Schlumberger Technology Corporation | System and method for estimating subsurface principal stresses from seismic reflection data |
| US6864890B2 (en) | 2002-08-27 | 2005-03-08 | Comoco Phillips Company | Method of building and updating an anisotropic velocity model for depth imaging of seismic data |
| US6894949B2 (en) * | 2002-10-04 | 2005-05-17 | Baker Hughes Incorporated | Walkaway tomographic monitoring |
| US6985405B2 (en) | 2003-10-23 | 2006-01-10 | Pgs Americas, Inc. | Method for stable estimation of anisotropic parameters for P-wave prestack imaging |
| US7751279B2 (en) * | 2006-05-03 | 2010-07-06 | Baker Hughes Incorporated | Sub-salt reflection tomography and imaging by walkaway VSP survey |
| US7508735B2 (en) * | 2006-09-21 | 2009-03-24 | Shell Oil Company | Method of analyzing vertical seismic profile data, method of producing a hydrocarbon fluid, and a computer readable medium |
| US8576663B2 (en) * | 2010-04-30 | 2013-11-05 | Schlumberger Technology Corporation | Multicomponent seismic inversion of VSP data |
-
2009
- 2009-11-19 US US12/621,972 patent/US8750074B2/en not_active Expired - Fee Related
- 2009-11-20 GB GB1109106.3A patent/GB2477259B/en not_active Expired - Fee Related
- 2009-11-20 CA CA2744044A patent/CA2744044A1/en not_active Abandoned
- 2009-11-20 WO PCT/US2009/065397 patent/WO2010065348A2/en not_active Ceased
Cited By (2)
| Publication number | Priority date | Publication date | Assignee | Title |
|---|---|---|---|---|
| CN110954941A (en) * | 2018-09-26 | 2020-04-03 | 中国石油化工股份有限公司 | Automatic first arrival picking method and system |
| CN110954941B (en) * | 2018-09-26 | 2021-08-24 | 中国石油化工股份有限公司 | Automatic first arrival picking method and system |
Also Published As
| Publication number | Publication date |
|---|---|
| GB2477259B (en) | 2013-07-10 |
| GB201109106D0 (en) | 2011-07-13 |
| US20100128562A1 (en) | 2010-05-27 |
| CA2744044A1 (en) | 2010-06-10 |
| WO2010065348A3 (en) | 2010-08-26 |
| GB2477259A (en) | 2011-07-27 |
| US8750074B2 (en) | 2014-06-10 |
Similar Documents
| Publication | Publication Date | Title |
|---|---|---|
| US8750074B2 (en) | Anisotropic parameter determination | |
| US8407007B2 (en) | Anisotropic depth velocity model estimation above the receiver array in walkaway or 3D VSP data | |
| EP0796441B1 (en) | Processing surface-reflected shear-wave signatures from an azimuthally-anisotropic geological formation | |
| US7764571B2 (en) | Vector 3-component 3-dimensional Kirchhoff prestack migration | |
| US8547794B2 (en) | Extending the coverage of VSP/CDP imaging by using first-order downgoing multiples | |
| CA2651209C (en) | Sub-salt reflection tomography and imaging by walkaway vsp survey | |
| US8395967B2 (en) | Vector migration of virtual source VSP data | |
| US9784863B2 (en) | S-wave anisotropy estimate by automated image registration | |
| US6067275A (en) | Method of analyzing pre-stack seismic data | |
| US20080221796A1 (en) | Vector Migration of 1st Order Free-Surface Related Downgoing Multiples from VSP Data | |
| CA2676123A1 (en) | Imaging near-borehole reflectors using shear wave reflections from a multi-component acoustic tool | |
| Bush et al. | Paris Basin VSPs: case history establishing combinations of fine-layer (or lithologic) anisotropy and crack anisotropy from modelling shear wavefields near point singularities | |
| Leaney et al. | Analysis of multiazimuthal VSP data for anisotropy and AVO | |
| Menanno et al. | Borehole receiver orientation using a 3D velocity model | |
| Tsvankin et al. | Special section on azimuthal dependence of P-wave seismic signatures—Introduction | |
| Peng et al. | Pressure in a fluid-filled borehole caused by a seismic source in stratified media | |
| US20250377473A1 (en) | Cross-well seismic tomography and structural imaging leveraging full waveform inversion | |
| MacBeth et al. | Processing of a nine-component near-offset VSP for seismic anisotropy | |
| Zeng et al. | A case example of near‐surface correction for multicomponent VSPS | |
| Nebrija et al. | Fracture characterization using transmitted shear waves in a 3C azimuthal offset VSP | |
| Lesnikov et al. | AVO and Anisotropy Analysis of Walkaway VSP Data from the Oselvar Discovery | |
| Johns et al. | Multicomponent OBC (4C) imaging over Pamberi, offshore Trinidad |
Legal Events
| Date | Code | Title | Description |
|---|---|---|---|
| 121 | Ep: the epo has been informed by wipo that ep was designated in this application |
Ref document number: 09830876 Country of ref document: EP Kind code of ref document: A2 |
|
| WWE | Wipo information: entry into national phase |
Ref document number: 2744044 Country of ref document: CA |
|
| ENP | Entry into the national phase |
Ref document number: 1109106 Country of ref document: GB Kind code of ref document: A Free format text: PCT FILING DATE = 20091120 |
|
| WWE | Wipo information: entry into national phase |
Ref document number: 1109106.3 Country of ref document: GB |
|
| 122 | Ep: pct application non-entry in european phase |
Ref document number: 09830876 Country of ref document: EP Kind code of ref document: A2 |
|
| NENP | Non-entry into the national phase |
Ref country code: DE |