WO2008124428A1 - Blood biomarkers for mood disorders - Google Patents
Blood biomarkers for mood disorders Download PDFInfo
- Publication number
- WO2008124428A1 WO2008124428A1 PCT/US2008/059120 US2008059120W WO2008124428A1 WO 2008124428 A1 WO2008124428 A1 WO 2008124428A1 US 2008059120 W US2008059120 W US 2008059120W WO 2008124428 A1 WO2008124428 A1 WO 2008124428A1
- Authority
- WO
- WIPO (PCT)
- Prior art keywords
- mood
- biomarkers
- mood disorder
- markers
- blood
- Prior art date
- Legal status (The legal status is an assumption and is not a legal conclusion. Google has not performed a legal analysis and makes no representation as to the accuracy of the status listed.)
- Ceased
Links
Classifications
-
- C—CHEMISTRY; METALLURGY
- C12—BIOCHEMISTRY; BEER; SPIRITS; WINE; VINEGAR; MICROBIOLOGY; ENZYMOLOGY; MUTATION OR GENETIC ENGINEERING
- C12Q—MEASURING OR TESTING PROCESSES INVOLVING ENZYMES, NUCLEIC ACIDS OR MICROORGANISMS; COMPOSITIONS OR TEST PAPERS THEREFOR; PROCESSES OF PREPARING SUCH COMPOSITIONS; CONDITION-RESPONSIVE CONTROL IN MICROBIOLOGICAL OR ENZYMOLOGICAL PROCESSES
- C12Q1/00—Measuring or testing processes involving enzymes, nucleic acids or microorganisms; Compositions therefor; Processes of preparing such compositions
- C12Q1/68—Measuring or testing processes involving enzymes, nucleic acids or microorganisms; Compositions therefor; Processes of preparing such compositions involving nucleic acids
- C12Q1/6876—Nucleic acid products used in the analysis of nucleic acids, e.g. primers or probes
- C12Q1/6883—Nucleic acid products used in the analysis of nucleic acids, e.g. primers or probes for diseases caused by alterations of genetic material
-
- G—PHYSICS
- G01—MEASURING; TESTING
- G01N—INVESTIGATING OR ANALYSING MATERIALS BY DETERMINING THEIR CHEMICAL OR PHYSICAL PROPERTIES
- G01N33/00—Investigating or analysing materials by specific methods not covered by groups G01N1/00 - G01N31/00
- G01N33/48—Biological material, e.g. blood, urine; Haemocytometers
- G01N33/50—Chemical analysis of biological material, e.g. blood, urine; Testing involving biospecific ligand binding methods; Immunological testing
- G01N33/68—Chemical analysis of biological material, e.g. blood, urine; Testing involving biospecific ligand binding methods; Immunological testing involving proteins, peptides or amino acids
- G01N33/6893—Chemical analysis of biological material, e.g. blood, urine; Testing involving biospecific ligand binding methods; Immunological testing involving proteins, peptides or amino acids related to diseases not provided for elsewhere
- G01N33/6896—Neurological disorders, e.g. Alzheimer's disease
-
- C—CHEMISTRY; METALLURGY
- C12—BIOCHEMISTRY; BEER; SPIRITS; WINE; VINEGAR; MICROBIOLOGY; ENZYMOLOGY; MUTATION OR GENETIC ENGINEERING
- C12Q—MEASURING OR TESTING PROCESSES INVOLVING ENZYMES, NUCLEIC ACIDS OR MICROORGANISMS; COMPOSITIONS OR TEST PAPERS THEREFOR; PROCESSES OF PREPARING SUCH COMPOSITIONS; CONDITION-RESPONSIVE CONTROL IN MICROBIOLOGICAL OR ENZYMOLOGICAL PROCESSES
- C12Q2600/00—Oligonucleotides characterized by their use
- C12Q2600/106—Pharmacogenomics, i.e. genetic variability in individual responses to drugs and drug metabolism
-
- C—CHEMISTRY; METALLURGY
- C12—BIOCHEMISTRY; BEER; SPIRITS; WINE; VINEGAR; MICROBIOLOGY; ENZYMOLOGY; MUTATION OR GENETIC ENGINEERING
- C12Q—MEASURING OR TESTING PROCESSES INVOLVING ENZYMES, NUCLEIC ACIDS OR MICROORGANISMS; COMPOSITIONS OR TEST PAPERS THEREFOR; PROCESSES OF PREPARING SUCH COMPOSITIONS; CONDITION-RESPONSIVE CONTROL IN MICROBIOLOGICAL OR ENZYMOLOGICAL PROCESSES
- C12Q2600/00—Oligonucleotides characterized by their use
- C12Q2600/112—Disease subtyping, staging or classification
-
- C—CHEMISTRY; METALLURGY
- C12—BIOCHEMISTRY; BEER; SPIRITS; WINE; VINEGAR; MICROBIOLOGY; ENZYMOLOGY; MUTATION OR GENETIC ENGINEERING
- C12Q—MEASURING OR TESTING PROCESSES INVOLVING ENZYMES, NUCLEIC ACIDS OR MICROORGANISMS; COMPOSITIONS OR TEST PAPERS THEREFOR; PROCESSES OF PREPARING SUCH COMPOSITIONS; CONDITION-RESPONSIVE CONTROL IN MICROBIOLOGICAL OR ENZYMOLOGICAL PROCESSES
- C12Q2600/00—Oligonucleotides characterized by their use
- C12Q2600/136—Screening for pharmacological compounds
-
- C—CHEMISTRY; METALLURGY
- C12—BIOCHEMISTRY; BEER; SPIRITS; WINE; VINEGAR; MICROBIOLOGY; ENZYMOLOGY; MUTATION OR GENETIC ENGINEERING
- C12Q—MEASURING OR TESTING PROCESSES INVOLVING ENZYMES, NUCLEIC ACIDS OR MICROORGANISMS; COMPOSITIONS OR TEST PAPERS THEREFOR; PROCESSES OF PREPARING SUCH COMPOSITIONS; CONDITION-RESPONSIVE CONTROL IN MICROBIOLOGICAL OR ENZYMOLOGICAL PROCESSES
- C12Q2600/00—Oligonucleotides characterized by their use
- C12Q2600/158—Expression markers
-
- G—PHYSICS
- G01—MEASURING; TESTING
- G01N—INVESTIGATING OR ANALYSING MATERIALS BY DETERMINING THEIR CHEMICAL OR PHYSICAL PROPERTIES
- G01N2800/00—Detection or diagnosis of diseases
- G01N2800/30—Psychoses; Psychiatry
- G01N2800/304—Mood disorders, e.g. bipolar, depression
-
- G—PHYSICS
- G01—MEASURING; TESTING
- G01N—INVESTIGATING OR ANALYSING MATERIALS BY DETERMINING THEIR CHEMICAL OR PHYSICAL PROPERTIES
- G01N2800/00—Detection or diagnosis of diseases
- G01N2800/52—Predicting or monitoring the response to treatment, e.g. for selection of therapy based on assay results in personalised medicine; Prognosis
Definitions
- lymphoblastoid cell lines provide a self -renewable source of material, and are purported to avoid the effects of environmental exposure of cells from fresh blood. Fresh blood, however, with phenotypic state information gathered at time of harvesting, may be more informative than immortalized lymphocytes, and may avoid some of the caveats of Epstein- Barr virus (EBV) immortalization and cell culture passaging.
- EBV Epstein- Barr virus
- Convergent functional genomics is an approach that translationally cross-matches animal model gene expression data with human genetic linkage data and human tissue data (blood, postmortem brain), as a Bayesian strategy of cross validating findings and identifying candidate genes, pathways and mechanisms for neuropsychiatric disorders.
- Predictive biomarkers for mood disorders are desired for clinical diagnosis and treatment purposes.
- the present disclosure provides several biomarkers that are predictive of mood disorders in clinical settings.
- a panel of biomarkers may include 1 to about 100 or more biomarkers.
- the panel of biomarkers includes one or more biomarkers for high and low mood disorders.
- Blood is a suitable sample for measuring the levels or presence of one or more of the biomarkers provided herein.
- psychiatric symptoms measured in a quantitative fashion at time of blood draw in human subjects focus on all or nothing phenomena (genes turned on and off in low symptom states vs. high symptom states).
- Some of the biomarkers have cross-matched animal and human data, using a convergent functional genomics approach including blood datasets from animal models.
- the disclosure also provides various methods of assigning prediction scores for mood state based on the ratio of biomarkers for high mood vs. biomarkers for low mood in the blood of individual subjects, termed as BioM Mood Prediction Score.
- BioM-10 Mood Panel a panel of about 10 biomarkers, designated as BioM-10 Mood Panel, demonstrated good accuracy in predicting actual measured mood (high and low) in an enlarged cohort of subjects.
- a plurality of biomarkers includes a subset of about 20 biomarkers designated as Mbp, Edg2, Fzd3, Atxnl, Ednrb, Pde9a, Plxndl, Camk2d, Dio2, Lepr for high mood and Fgfrl, Mag, Pmp22, Ugt8, Erbb3 , Igfbp4, Igfbp ⁇ , Pde ⁇ d, Ptprm, Nefh for low mood.
- a mood disorder is a Bipolar disorder and the sample is a bodily fluid.
- a suitable sample is blood.
- the level of the biomarker may be determined in a blood sample of the individual.
- the level of the biomarker is determined by analyzing the expression level of
- RNA transcripts In an aspect, the expression level of the biomarker is determined by analyzing the level of protein or peptides or fragments thereof. Suitable detection techniques include microarray gene expression analysis, polymerase chain reaction (PCR), real-time PCR, quantitative PCR, immunohistochemistry, enzyme-linked immunosorbent assays (ELISA), and antibody arrays.
- PCR polymerase chain reaction
- ELISA enzyme-linked immunosorbent assays
- the determination of the level of the plurality of biomarkers is performed by an analysis of the presence or absence of the biomarkers.
- a treatment plan for a high mood disorder includes administering a pharmaceutical composition selected from a group that includes Depakote (divalproex), Lithobid (lithium), Lamictal (lamotrigene), Tegretol (carbamazepine), Topomax (topiramate).
- a pharmaceutical composition selected from a group that includes Depakote (divalproex), Lithobid (lithium), Lamictal (lamotrigene), Tegretol (carbamazepine), Topomax (topiramate).
- a clinicopathological data is selected from a group that includes patient age, previous personal and/or familial history of the mood disorder, previous personal and/or familial history of response to treatment, and any genetic or biochemical predisposition to psychiatric illness.
- a suitable test sample includes fresh blood, stored blood, fixed, paraffin-embedded tissue, tissue biopsy, tissue microarray, fine needle aspirates, peritoneal fluid, ductal lavage and pleural fluid or a derivative thereof.
- a treatment plan may be a personalized plan for the patient.
- a method for clinical screening of agents capable of affecting a mood disorder includes the steps of:
- a mood disorder microarray includes a plurality of nucleic acid molecules representing genes selected from the group of genes listed in Tables 3 and 7.
- a diagnostic microarray includes a panel of about 10 biomarkers that are predictive of a mood disorder, wherein the microarray includes nucleic acid fragments representing biomarkers designated as Mbp, Edg2, Fzd3, Atxnl, Ednrb for high mood and Fgfrl, Mag, Pmp22, Ugt8, Erbb3 for low mood.
- a diagnostic antibody array includes a plurality of antibodies that recognize one or more epitopes corresponding to the protein products of the biomarkers designated as Mbp, Edg2, Fzd3, Atxnl, Ednrb for high mood and Fgfrl, Mag, Pmp22, Ugt8, Erbb3 for low mood.
- BioM Mood Prediction Score is based on the ratio of the sum of the scores for high mood biomarkers and sum of scores for low mood biomarkers, multiplied by 100.A cutoff score of 100 and above was used for high mood, inf- infinity- denominator is 0.
- FIG. 6 shows Connectivity Map interrogation of drugs that have similar gene expression signatures to that of high mood.
- a score of 1 indicates a maximal similarity with the gene expression effects of high mood, and a score of -1 indicates a maximal opposite effects to high mood.
- BP- bipolar Mood scores are based on subject self -report on mood VAS scale administered at time of blood draw.
- A is scored as 0, M as 0.5 and P as 1.
- BioM Mood Prediction Score is based on the ratio of the sum of the scores for high mood biomarkers and sum of scores for low mood biomarkers, multiplied by 100. A cutoff score of 100 and above was used for high mood.
- Patterns of changes in the blood that reflect whether a person has low mood (depression) or high mood (mania) are disclosed.
- these changes are analyzed at the level of gene expression, and involved genes that generally are expressed in the brain.
- Blood-based screening is clinically easier to perform than a cerebro-spinal fluid (CSF) analysis or a nasal epithelium bipopsy.
- CSF cerebro-spinal fluid
- an antidepressant medication may be started only initially, and if bipolar, will be flipped by the antidepressant into a mixed state or frank mood elevation- hypomania or mania.
- a panel of mood state markers such unclear patients are monitored by repeated lab tests after the antidepressant is started, and if the markers indicate a shift beyond normal mood, to high mood, then medications can be systematically changed, a mood stabilizer added, and a potentially dangerous and certainly dangerous episode for the patient averted. This approach is useful, especially in children and adolescents, who are hard to diagnose using traditional clinical criteria only, and in whom mood states rapidly change.
- Biomarkers disclosed herein may be personalized and tailored to the individual, based on their biomarker profiles.
- the biomarkers disclosed herein are (i) derived from fresh blood, not immortalized cell lines; (ii) capable of providing quantitative mood state information obtained at the time of the blood draw; (iii) were derived from comparisons of extremes of low mood and high mood in patients, as opposed to patients vs. normal controls (where the differences could be due to a lot of other environmental factors, medication (side) effects vs.
- Pharmacogenomic mouse model of relevance to bipolar disorder includes treatments with an agonist of the illness/bipolar disorder-mimicking drug (methamphetamine) and an antagonist of the illness/ bipolar disorder-treating drug (valproate).
- the pharmacogenomic approach is a tool for tagging genes that may have pathophysiological relevance. As an added advantage, some of these genes may be involved in potential medication effects present in human blood data (FIG. 2).
- a focused approach was used to analyze discrete quantitative phenotypic item (phene) — a Visual-Analog Scale (VAS) for mood.
- phene a Visual-Analog Scale
- This approach avoids the issue of corrections for multiple comparisons that would arise if one were to look in a discovery fashion at multiple phenes in a comprehensive phenotypic battery (PhenoChipping) changed in relationship with all genes on a GeneChip microarray. Larger sample cohorts would be needed for the latter approach.
- a panel of a subset of top candidate biomarker genes for mood state identified by the approach described herein was then used to generate a prediction score for mood state (low mood vs. high mood). This prediction score was compared to the actual self-reported mood scores from bipolar subjects in the primary cohort (FIG. 4). This panel of mood biomarkers and prediction score were also examined in a separate independent cohort of psychotic disorders patients for which gene expression data and mood state data (FIG.5) were obtained, as well as in a second independent bipolar cohort (FIG.6).
- Sample size for human subjects is comparable to the size of cohorts for human postmortem brain gene expression studies in the field. Live donor blood samples instead of postmortem donor brains were studied, with the advantage of better phenotypic characterization, more quantitative state information, and less technical variability. This approach also permits repeated intra-subject measures when the subject is in different mood states.
- biomarker genes for mood will show this complete induction related to state, but rather some will show modulation in gene expression levels, and are thus missed by a stringent filtering approach.
- biomarker genes for mood will show this complete induction related to state, but rather some will show modulation in gene expression levels, and are thus missed by a stringent filtering approach.
- a validation of the novel and non-obvious approach described herein is the fact that the biomarker panel showed sensitivity and specificity, of a comparable nature, in both independent replication cohorts (psychotic disorder cohort and secondary bipolar cohort).
- the approach of using a visual analog scale phene reflecting an internal subjective experience of well being or distress (as opposed to more complex and disease specific state/trait clinical instruments), and looking at extremes of state combined with robust differential expression based on A/P calls, and Convergent Functional Genomics prioritization is able to identify state biomarkers for mood, that are, at least in part, independent of specific diagnoses or medications. Nevertheless, a comparison with existing clinical rating scales (FIG.
- actimetry and functional neuroimaging as well as analysis of biomarker data using such instruments may be of interest, as a way of delineating state vs. trait issues, diagnostic boundaries or lack thereof, and informing the design of clinical trials that may incorporate clinical and biomarker measures of response to treatment.
- a subset of top candidate biomarker genes include five genes involved in myelination (
- genes which have a well-established role in brain functioning may show changes in blood in relationship to psychiatric symptoms state (FIG. 3, Table 3 and Table 7), and moreover that the direction of change may be concordant with that found in human postmortem brain studies. It is possible that trait promoter sequence mutations or epigenetic modifications influence expression in both tissues (brain and blood), and that state dependent transcription factor changes that modulate the expression of these genes may be contributory as well.
- myelin, growth factors are prominent players in mood disorders, and are reflected in the blood profile. Myelin abnormalities have emerged as a common if perhaps non-specific denominator across a variety of neuropsychiatric disorders. For exmaple, Mbp, is a top scoring candidate biomarker (FIG. 3), associated with high mood state.
- Mbp is a top scoring candidate biomarker (FIG. 3), associated with high mood state.
- the data provided herein regarding insulin growth factor signaling changes may provide an underpinning for the co-morbidity with diabetes and metabolic syndrome often encountered in mood disorder patients. These changes may be etiopathogenic, compensatory mechanisms, side-effects of medications, or results of illness - induced lifestyle changes (FIG. 2B).
- depression as opposed to high mood state (FIG. 3 and Table 3) indicates that depression may have more of an impact on blood gene expression changes, perhaps through a neuro-endocrine- immunological axis, as part of a whole-body reaction to a perceived hostile environment.
- biomarker genes identified herein have no previous evidence for involvement in mood disorders (Tables 3 and 7). They merit further exploration in genetic candidate gene association studies, as well as comparison with emerging results from whole -genome association studies of bipolar disorder and depression. If needed, the composition of biomarker panels for mood can be refined or changed for different sub-populations, depending upon the availability of additional evidence. Panels containing different number of biomarkers and different biomarkers can be developed using the guidelines described herein and from the biomarkers identified herein. A large number of the biomarkers that would be of use in different panels and permutations are already present in the complete list of candidate biomarker genes identified (Tables 3 and 7).
- the mood stabilizer drug valproate also a HDAC inhibitor, as well as sodium phenylbutirate and another HDAC inhibitor, trichostatin A, were shown to induce alpha-synuclein in neurons through inhibition of HDAC and that this alpha-synuclein induction was critically involved in neuroprotection against glutamate excitotoxicity.
- Human postmortem brain studies, as well as animal model and clinical studies have implicated glutamate abnormalities and histone deacetylase modulation as therapeutic targets in mood disorders.
- Novobiocin is an antibiotic drug that also has anti-tumor activity and apoptosis- inducing properties, through Hsp90 inhibition of Akt kinase an effect opposite to that of the valproate, trichostatin A and sodium phenylbutyrate (Table 6).
- This connectivity map analysis with a mood panel genes provides an interesting external biological cross-validation for the internal consistency of the biomarker approach, as well as illustrates the utility of the connectivity map for non-hypothesis driven identification of novel drug treatments and interventions.
- the data presented herein has not found reliable blood evidence for some of the top candidate genes derived from postmortem work, such as: Grial(glutamate receptor, ionotropic, AMPAl (alpha I)), Grikl (glutamate receptor, ionotropic, kainate 1), Gsk3b (glycogen synthase kinase 3 beta) and Arntl aryl hydrocarbon receptor nuclear translocator-like.
- BioM-10 A predictive score developed based on a panel of 10 top candidate biomarkers, designated herein as BioM-10 (5 for high mood, 5 for low mood) shows specificity and sensitivity for high mood and low mood states.
- a panel of candidate biomarker genes identified by this approach was then used to generate a prediction score for mood state (low mood/depression vs. high mood/mania). This prediction score was compared to the actual self -reported mood scores from human subjects. The prediction score developed by the analysis of convergent data provided a highly correlative basis for the diagnosis of mood state.
- a panel of biomarkers illustrated in Table 3 is suitable. These biomarkers include Mbp, Edg2, Fgfrl, Fzd3, Mag, Pmp22, Ugt8, Erbb3, Igfbp4, Igfbp ⁇ , Pde ⁇ d , Ptprm, Nefh, Atp2cl, Atxnl, Btgl, C6orfl82, Dicer 1, Dnajc ⁇ , Ednrb, Elovl5, Gnal, Klf5, Lin7a, Manea, Nupll, Pde ⁇ b, Slc25a23, Synpo, Tgm2, Tjp3, Tpd52, Trpcl, Bclafl, Gosr2, Rdx, Wdr34, Bic, C8orf42, Dock9, Hrasls, Ibrdc2, P2ryl2, Speed, Vil2.
- Pmp22, Ugt8, Erbb3, Igfbp4, and Igfbp ⁇ is suitable for diagnosing or predicting mood disorder.
- a panel of biomarkers include for example, Mbp, Edg2, Fzd3, Atxnl, and Ednrb that are increased in high mood (mania) condition.
- An embodiment of a first sub-group of markers that are used for analysis include for example: Mbp, Edg2, Fzd3, Atxnl, Ednrb (markers for high mood) and Fgfrl, Mag, Pmp22, Ugt8, Erbb3 (markers for low mood).
- An embodiment includes a second sub-group e.g., Pde9a, Plxndl, Camk2d, Dio2, Lepr (markers for high mood) and Igfbp4, Igfbp ⁇ , Pde ⁇ d, Ptprm, Nefh Atp2cl (markers for low mood).
- An embodiment includes a fifth sub-group e.g., Usp7, Zdhhc4, Znfl69, Cuedcl, Bivm (markers for high mood) and Pde ⁇ b, Slc25a23, Synpo, Tgm2, Tjp3 (markers for low mood).
- An embodiment includes a sixth sub-group e.g., Hla-dqal, C20orf94, C21orf56, F1J10986, Loc91431 (markers for high mood), Tpd52, Trpcl, Phldal, Znf502, Amn (markers for low mood) or a combination of one or more of the sub-goups 1-6 disclosed herein.
- Sub-groups 1-5 constitute a representative example and any number of sub-groups that has about 5, 10, 15, 20, 25, 30, 35, 40, 45, 50, 55, 60, 65, 70, 75, 80, 85, 90, 95, 100, 200, 300, 400, 500, 600, or more markers selected from Table 7.
- An embodiment of a first sub-group of markers that are used for analysis include for example: Mbp, Edg2, Fzd3, Atxnl, Ednrb (markers for high mood), Fgfrl, Mag, Pmp22, Ugt8, Erbb3 (markers for low mood);
- second subgroup includes for example: Pde9a, Plxndl, Camk2d, Dio2, Lepr (markers for high mood), Igfbp4, Igfbp ⁇ , Pde ⁇ d, Ptprm, Nefh, (markers for low mood);
- third subgroup includes for example: Myom2, Nfix, Nt5m, Or7el04p, Rrpl (markers for high mood), Btgl, Elov5, Lrrc ⁇ b, Dicerl, Atp2cl, (markers for low mood);
- fourth subgroup includes for example: Sept2, Sfrs4, Sla2, Tex261, Ube2i (markers for high mood), Gnal
- Sub-groups 1-5 constitute a representative example and any number of sub-groups that has about 5, 10, 15, 20, 25, 30, 35, 40, 45, 50, 55, 60, 65, 70, 75, 80, 85, 90, 95, 100, 200, 300, 400, 500, 600, or more markers selected from Tables 3 and 7.
- a panel of 36 biomarkers is a suitable subset that is useful in diagnosing a mood disorder. Larger subsets that includes for example, 150, 200, 250, 300, 350, 400, 450, 500, 600 or about 700 markers are also suitable. Smaller subsets that include high-value markers including about 2, 5, 10, 15, 20, 25, 50, 75, and 100 are also suitable.
- a variable quantitative scoring scheme can be designed using any standard algorithm, such as a variable selection or a subset feature selection algorithms can be used. Both statistical and machine learning algorithms are suitable in devising a frame work to identify, rank, and analyze association between marker data and phenotypic data (e.g., mood disorders).
- a prediction score for each subject is derived based on the presence or absence of e.g., 10 biomarkers of the panel in their blood.
- Each of the 10 biomarkers gets a score of 1 if it is detected as “present” (P) in the blood form that subject, 0.5 if it is detected as “marginally present” (M), and 0 if it is called “absent” (A).
- P present
- M marginally present
- A absent
- the predictive score was compared with actual self-reported mood scores in a primary cohort of subjects with a diagnosis of bipolar mood disorder.
- a prediction score of 100 and above had a 84.6 % sensitivity and a 68.8 % specificity for predicting high mood.
- a prediction score below 100 had a 76.9 % sensitivity and 81.3 % specificity for predicting low mood.
- the term "present” indicates that a particular biomarker is expressed to a detectable level, as determined by the technique used. For example, in an experiment involving a microarray or gene chip obtained from a commercial vendor Affymetrix (Santa Clara, CA), the embedded software rendered a "present” call for that biomarker.
- present refers to a detectable presence of the transcript or its translated protein/peptide and not necessarily reflects a relative comparion to for example, a sample from a normal subject. In other words, the mere presence or absence of a biomarker is assigned a value, e.g., 1 and a prediction score is calculated as described herein.
- marginally present refers to border line expression level that may be less intense than the "present” but statistically different from being marked as "absent” (above background noise), as determined by the methodology used.
- absent is used. For example, if a subject has a plurality of markers for high or low mood are differentially expressed, a prediction based on the differential expression of markers is determined. Differential expression of about 1.2 fold or 1.3 or 1.5 or 2 or 3 or 4 or 5-fold or higher for either increased or decreased levels can be used. Any standard statistical tool such as ANOVA is suitable for analysis of differential expression and association with high or low mood diagnosis or prediction.
- a prediction based on the analysis of either high or low mood markers alone may also be practiced. If a plurality of high mood markers (e.g., about 6 out of 10 tested) are differentially expressed to a higher level compared to the low mood markers (e.g., 4 out of 10 tested), then a prediction or diagnosis of high mood status can be made by analyzing the expression levels of the high mood markers alone without factoring the expression levels of the low mood markers as a ratio.
- a detection algorithm uses probe pair intensities to generate a detection p-value and assign a Present, Marginal, or Absent call.
- Each probe pair in a probe set is considered as having a potential vote in determining whether the measured transcript is detected (Present) or not detected (Absent). The vote is described by a value called the Discrimination score [R].
- the score is calculated for each probe pair and is compared to a predefined threshold Tau. Probe pairs with scores higher than Tau vote for the presence of the transcript. Probe pairs with scores lower than Tau vote for the absence of the transcript.
- the voting result is summarized as a p-value. The greater the number of discrimination scores calculated for a given probe set that are above Tau, the smaller the p-value and the more likely the given transcript is truly Present in the sample. The p-value associated with this test reflects the confidence of the Detection call.
- a two-step procedure determines the Detection p-value for a given probe set.
- the Discrimination score [R] is calculated for each probe pair and the discrimination scores are tested against the user-definable threshold Tau.
- the detection Algorithm assesses probe pair saturation, calculates a Detection p-value, and assigns a Present, Marginal, or Absent call.
- the default thresholds of the Affymetrix MAS 5 software were used.
- characteristics that determine the prediction include one or more of the biomarkers for the mood disorder disclosed herein.
- clinical outcome refers to biological or biochemical or physical or physiological responses to treatments or therapeutic agents that are generally prescribed for that condition compared to a condition would occur in the absence of any treatment.
- a “clinically positive outcome” does not necessarily indicate a cure, but could indicate a lessening of symptoms experienced by a subject.
- biomarker and “biomarker” are synonymous and as used herein, refer to the presence or absence or the levels of nucleic acid sequences or proteins or polypeptides or fragments thereof to be used for associating or correlating a phenotypic state.
- a biomarker includes any indicia of the level of expression of an indicated marker gene. The indicia can be direct or indirect and measure over- or under-expression of the gene given the physiologic parameters and in comparison to an internal control, normal tissue or another phenotype.
- Nucleic acids or proteins or polypeptides or portions thereof used as markers are contemplated to include any fragments thereof, in particular, fragments that can specifically hybridize with their intended targets under stringent conditions and immunologically detectable fragments.
- markers may be related. Marker may also refer to a gene or DNA sequence having a known location on a chromosome and associated with a particular gene or trait. Genetic markers associated with certain diseases or for pre-disposing disease states can be detected in the blood and used to determine whether an individual is at risk for developing a disease. Levels of gene expression and protein levels are quantifiable and the variation in quantification or the mere presence or absence of the expression may also serve as markers. Using proteins/peptides as biomarkers can include any method known in the art including, without limitation, measuring amount, activity, modifications such as glycosylation, phosphorylation, ADP- ribosylation, ubiquitination, etc., imunohistochemistry (IHC).
- IHC imunohistochemistry
- array refers to an array of distinct polynulceotides, oligonucleotides, polypeptides, or oligopeptides synthesized on a substrate, such as paper, nylon, or other type of membrane, filter, chip, glass slide, or any other suitable solid support. Arrays also include a plurality of antibodies immobilized on a support for detecting specific protein products. There are several microarrays that are commercially available. A microarray may include one or more biomarkers disclosed herein. A panel of about 20 biomarkers as nucleic acid fragments can be included in an array.
- the nucleic acid fragments may include oligonucleotides or amplified partial or complete nucleotide sequences of the biomarkers.
- a microarray consists essentially of markers from Table 3. [00097]
- the microarray is prepared and used according to the methods described in U.S. Pat. No. 5,837,832, Chee et al.; PCT application WO95/11995, Chee et al.; Lockhart et al., 1996. Nat Biotech., 14:1675-80; and Schena et al., 1996. Proc. Natl.
- condition refers to any disease, disorder or any biological or physiological effect that produces unwanted biological effects in a subject.
- the term "subject" refers to an animal, or to one or more cells derived from an animal.
- the animal may be a mammal including humans.
- Cells may be in any form, including but not limited to cells retained in tissue, cell clusters, immortalized cells, transfected or transformed cells, and cells derived from an animal that have been physically or phenotypically altered.
- Suitable body fluids include a blood sample (e.g., whole blood, serum or plasma), urine, saliva, cerebrospinal fluid, tears, semen, and vaginal secretions. Also, lavages, tissue homogenates and cell lysates can be utilized.
- Mass-spectrometry, chromatography, real-time PCR, quantitative PCR, probe hybridization, or any other analytical method to determine expression levels or protein levels of the markers are suitable. Such analysis can be quantitative and may also be performed in a high-through put fashion.
- Cellular imaging systems are commercially available that combine conventional light microscopes with digital image processing systems to perform quantitative analysis on cells and tissues, including immunostained samples. (See e.g. the CAS-200 System (Becton, Dickinson & Co.))- Some other examples of methods that can be used to determine the levels of markers include immunohistochemistry, automated systems, quantitative IHC, semiquantitative IHC and manual methods.
- Other analytical systems include western blotting, immunoprecipitation, fluorescence in situ hybridization (FISH), and enzyme immunoassays.
- diagnosis refers to evaluating the type of disease or condition from a set of marker values and/or patient symptoms where the subject is suspected of having a disorder. This is in contrast to disease predisposition, which relates to predicting the occurrence of disease before it occurs, and the term “prognosis”, which is predicting disease progression in the future based on the marker levels/patterns.
- correlation refers to a process by which one or more biomarkers are associated to a particular disease state, e.g., mood disorder.
- identifying such correlation or association involves conducting analyses that establish a statistically significant association- and/or a statistically significant correlation between the presence (or a particular level) of a marker or a combination of markers and the phenotypic trait in the subject.
- An analysis that identifies a statistical association (e.g., a significant association) between the marker or combination of markers and the phenotype establishes a correlation between the presence of the marker or combination of markers in a subject and the particular phenotype being analyzed.
- This relationship or association can be determined by comparing biomarker levels in a subject to levels obtained from a control population, e.g., positive control— diseased (with symptoms) population and negative control— disease-free (symptom-free) population.
- the biomarkers disclosed herein provide a statistically significant correlation to diagnosis at varying levels of probability.
- Subsets of markers for example a panel of about 20 markers, each at a certain level range which are a simple threshold, are said to be correlative or associative with one of the disease states. Such a panel of correlated markers can be then be used for disease detection, diagnosis, prognosis and/or treatment outcome.
- Preferred methods of correlating markers is by performing marker selection by any appropriate scoring method or by using a standard feature selection algorithm and classification by known mapping functions.
- a suitable probability level is a 5% chance, a 10% chance, a 20% chance, a 25% chance, a 30% chance, a 40% chance, a 50% chance, a 60% chance, a 70% chance, a 75% chance, a 80% chance, a 90% chance, a 95% chance, and a 100% chance.
- Each of these values of probability is plus or minus 2% or less.
- a suitable threshold level for markers of the present invention is about 25 pg/mL, about 50 pg/mL, about 75 pg/mL, about 100 pg/mL, about 150 pg/mL, about 200 pg/mL, about 400 pg/mL, about 500 pg/mL, about 750 pg/mL, about 1000 pg/mL, and about 2500 pg/mL.
- Prognosis methods disclosed herein that improve the outcome of a disease by reducing the increased disposition for an adverse outcome associated with the diagnosis. Such methods may also be used to screen pharmacological compounds for agents capable of improving the patient's prognosis, e.g., test agents for mood disorders.
- the analysis of a plurality of markers for example, a panel of about 20 or 10 markers may be carried out separately or simultaneously with one test sample. Several markers may be combined into one test for efficient processing of a multiple of samples. In addition, one skilled in the art would recognize the value of testing multiple samples (for example, at successive time points) from the same individual. Such testing of serial samples may allow the identification of changes in marker levels over time, within a period of interest, or in response to a certain treatment.
- kits for the analysis of markers includes for example, devises and reagents for the analysis of at least one test sample and instructions for performing the assay.
- the kits may contain one or more means for using information obtained from marker assays performed for a marker panel to diagnose mood disorders.
- Probes for markers, marker antibodies or antigens may be incorporated into diagnostic assay kits depending upon which markers are being measured.
- a plurality of probes may be placed in to separate containers, or alternatively, a chip may contain immobilized probes.
- another container may include a composition that includes an antigen or antibody preparation. Both antibody and antigen preparations may preferably be provided in a suitable titrated form, with antigen concentrations and/or antibody titers given for easy reference in quantitative applications.
- kits may also include a detection reagent or label for the detection of specific reaction between the probes provided in the array or the antibody in the preparation for immunodetection.
- Suitable detection reagents are well known in the art as exemplified by fluorescent, radioactive, enzymatic or otherwise chromogenic ligands, which are typically employed in association with the nucleic acid, antigen and/or antibody, or in association with a secondary antibody having specificity for first antibody.
- the reaction is detected or quantified by means of detecting or quantifying the label.
- Immunodetection reagents and processes suitable for application in connection with the novel methods of the present invention are generally well known in the art.
- the reagents may also include ancillary agents such as buffering agents and protein stabilizing agents, e.g., polysaccharides and the like.
- the diagnostic kit may further include where necessary agents for reducing background interference in a test, agents for increasing signal, software and algorithms for combining and interpolating marker values to produce a prediction of clinical outcome of interest, apparatus for conducting a test, calibration curves and charts, standardization curves and charts, and the like.
- the methods of correlating biomarkers with treatment regimens can be carried out using a computer database.
- Computer-assisted methods of identifying a proposed treatment for mood disorders are suitable. The method involves the steps of (a) storing a database of biological data for a plurality of patients, the biological data that is being stored including for each of said plurality of patients (i) a treatment type, (ii) at least one marker associated with a mood disorder and (iii) at least one disease progression measure for the mood disorder from which treatment efficacy can be determined; and then (b) querying the database to determine the dependence on the marker of the effectiveness of a treatment type in treating the mood disorder, to thereby identify a proposed treatment as an effective treatment for a subject carrying the marker correlated with the mood disorder.
- treatment information for a patient is entered into the database (through any suitable means such as a window or text interface), marker information for that patient is entered into the database, and disease progression information is entered into the database. These steps are then repeated until the desired number of patients has been entered into the database.
- the database can then be queried to determine whether a particular treatment is effective for patients carrying a particular marker, not effective for patients carrying a particular marker, and the like. Such querying can be carried out prospectively or retrospectively on the database by any suitable means, but is generally done by statistical analysis in accordance with known techniques, as described herein.
- Pharmacogenomic mouse model of relevance to bipolar disorder consists of treatments with an agonist of the illness/bipolar disorder-mimicking drug (methamphetamine) and an antagonist of the illness/ bipolar disorder-treating drug (valproate).
- methamphetamine an agonist of the illness/bipolar disorder-mimicking drug
- valproate an antagonist of the illness/ bipolar disorder-treating drug
- the human subjects used in this example included those who were directly recruited, and data collected in other procedures/settings. Blood samples were collected.
- Subjects included men and women over 18 years of age. A demographic breakdown is shown in Table 1. Initial studies were focused primarily on a male population, due to the demographics of the catchment area (primarily male in a VA Medical Center), and to minimize any potential gender-related state effects on gene expression, which would have decreased the discriminative power of the analysis for the sample size used. Subjects were recruited from the general population, the patient population at the IU school of Medicine, the Indianapolis VA Medical Center, as well as various facilities that serve people with mental illnesses in Indiana. The subjects were recruited largely through referrals from care providers, the use of brochures left in plain sight in public places and mental health clinics, and through word of mouth. Subjects were excluded if they had significant medical or neurological illness or had evidence of active substance abuse or dependence.
- RNA extraction 2.5-5 ml of whole blood was collected into each PaxGene tube by routine venipuncture.
- PaxGene tubes contain proprietary reagents for the stabilization of RNA.
- the cells from whole blood will be concentrated by centrifugation, the pellet washed, resuspended and incubated in buffers containing Proteinase K for protein digestion. A second centrifugation step will be done to remove residual cell debris.
- the lysate is applied to a silica-gel membrane/column.
- the RNA bound to the membrane as the column is centrifuged and contaminants are removed in three wash steps.
- the RNA is then eluted using DEPC-treated water.
- Globin reduction To remove globin mRNA, total RNA from whole blood is mixed with a biotinylated Capture Oligo Mix that is specific for human globin mRNA. The mixture is then incubated for 15 min to allow the biotinylated oligonucleotides to hybridize with the globin mRNA. Streptavidin Magnetic Beads are then added, and the mixture is incubated for 30 min. During this incubation, streptavidin binds the biotinylated oligonucleotides, thereby capturing the globin mRNA on the magnetic beads.
- RNA binding Bead suspension is added to the samples, and using magnetic capture to wash and elute the GLOBINclear RNA.
- Second Strand cDNA Synthesis converts the single-stranded cDNA into a double- stranded DNA (dsDNA) template for transcription.
- the reaction employs DNA Polymerase and RNase H to simultaneously degrade the RNA and synthesize second strand cDNA.
- cDNA Purification removes RNA, primers, enzymes, and salts that would inhibit in vitro transcription.
- aRNA Purification removes unincorporated NTPs, salts, enzymes, and inorganic phosphate to improve the stability of the biotin-modified aRNA.
- Microarrays Biotin labeled aRNA are hybridized to Affymetrix HG-U133 Plus 2.0
- GeneChips according to manufacturer's protocols (Affymetrix Inc., Santa Clara, CA). All GAPDH 375' ratios should be less than 2.0 and backgrounds under 50. Arrays are stained using standard Affymetrix protocols for antibody signal amplification and scanned on an Affymetrix Gene Array 2500 scanner with a target intensity set at 250. Present/ Absent calls are determined using GCOS software with thresholds set at default values.
- mice were treated by intraperitoneal injection with either single-dose saline, methamphetamine (10 mg/kg), valproate (200 mg/kg), or a combination of methamphetamine and valproate (10 mg/kg and 200 mg/kg respectively).
- Three independent de novo biological experiments were performed at different times. Each experiment included three mice per treatment condition, for a total of 9 mice per condition across the three experiments.
- RNA 22 gauge syringe homogenization in RLT buffer
- RNA RNeasy mini kit, Qiagen, Valencia, CA
- PAXgene blood RNA extraction kit PreAnalytiX, a QIAGEN/BD company
- GLOBINclearTM-Human or GLOBINclearTM-Mouse/Rat Ambion/ Applied Biosystems Inc., Austin, TX
- the quality of the total RNA was confirmed using an Agilent 2100 Bioanalyzer (Agilent Technologies, Palo Alto, CA). The quantity and quality of total RNA was also independently assessed by 260 nm UV absorption and by 260/280 ratios, respectively (Nanodrop spectrophotometer). Starting material of total RNA labeling reactions was kept consistent within each independent microarray experiment.
- Mouse Genome 430 2.0 arrays (Affymetrix, Santa Clara, CA) were used.
- the GeneChipTM Mouse Genome 430 2.0 Array contain over 45,000 probe sets that analyze the expression level of over 39,000 transcripts and variants from over 34,000 well- characterized mouse genes.
- Affymetrix Human Genome U133 Plus 2.0 GeneChip with over 40,000 genes and ESTs were used. Standard manufacturer's protocols were used to reverse transcribe the messenger RNA and generate biotinlylated cRNA.
- the amount of cRNA used to prepare the hybridization cocktail was kept constant intra-experiment. Samples were hybridized at 45°C for 17 hours under constant rotation. Arrays were washed and stained using the Affymetrix Fluidics Station 400 and scanned using the Affymetrix Model 3000 Scanner controlled by GCOS software. All sample labeling, hybridization, staining and scanning procedures were carried out as per manufacturer's recommendations.
- Microarray data analysis Data analysis was performed using Affymetrix Microarray Suite
- transcripts were called Present in at least one of the two samples (saline or drug) intra-experiment, and that were reproducibly changed in the same direction in at least two out of three independent experiments, were analyzed further.
- a high threshold was used, with at least 75% of subjects in a cohort showing a change in expression from Absent to Present between low and high mood ( reflecting an at least 3 fold mood state related enrichment of the genes thus filtered)
- a low threshold was also used, with at least 60% of subjects in a cohort showing a change in expression from Absent to Present between low and high mood ( reflecting an at least 1.5 fold mood state related enrichment of the genes thus filtered).
- the high threshold identified candidate biomarker genes that are more common for all subjects, with a lower risk of false positives, whereas the lower threshold identified genes that are present in more restricted subgroups of subjects, with a lower risk of false negatives.
- the high threshold candidate biomarker genes have, as an advantage, a higher degree of reliability, as they are present in at least 75% of all subjects with a certain mood state (high or low) tested. They may reflect common aspects related to mood disorders across a diverse subject population, but may also be a reflection of the effects of common medications used in the population tested, such as mood stabilizers.
- the low threshold genes may have lower reliability compared to the high threshold, being present in at least 60% of the subject population tested, but, nevertheless, captures more of the diversity of genes and biological mechanisms present in a genetically diverse human subject population.
- Affymetrix Human Genome U133 Plus 2.0 GeneChip by using the high threshold, in an embodiment, about 21 novel candidate biomarker genes (13 genes with known functions and 7 ESTs) (Table 3), of which 8 had at least one line of prior independent evidence for potential involvement in mood disorders (i.e. CFG score of 3 or above).
- a larger list totaling 661 genes (539 genes and 122 ESTs) (Table 7), of which an additional 24 had at least two lines of prior independent evidence for potential involvement in mood disorders (i.e. CFG score of 3 or above).
- four of the low threshold candidate biomarker genes (Bclafl and Rdx8, Gosr2 and Wdr3413) are changed in expression in the same direction, in lymphoblastoid cell lines (LCLs) from bipolar subjects.
- a panel e.g, the BioM-10 Mood panel
- a cohort of 29 bipolar disorder subjects containing the 26 subjects (13 low mood, 13 high mood) from which the candidate biomarker data was derived, as well as 3 additional subjects with mood in the intermediate range (self -reported mood scores between 40 and 60) was used.
- a prediction score for each subject based on the presence or absence of the 10 biomarkers of the panel in the blood GeneChip data.
- Each of the 10 biomarkers gets a score of 1 if it is detected as Present (P) in the blood form that subject, 0.5 if it is detected as Marginally Present (M), and 0 if it is called Absent (A).
- the primary and secondary bipolar mood disorder cohorts are apriori more related and germane to mood state biomarkers identification, but may have blood gene expression changes due at least in part to the common pharmacological agents used to treat bipolar mood disorders.
- the psychotic disorders cohort may have blood gene expression changes related to mood state irrespective of the diagnosis and the different medication classes subjects with different diagnoses are on (Table 1 and FIG. 2B).
- the psychosis cohort was also notably different in terms of the ethnic distribution (see Table Ib).
- biomarkers identified herein provide quantitative tools for predicting disease states/conditions in subjects suspected of having a mood disorder or in any individual for psychiatric evaluation.
- BLAST analysis identified the closest (most similar) known gene existing in the database (the highest known gene at the top of the BLAST list of homologues) which then could be used to search the GeneCards database (Weizmann Institute, Rehovot, Israel). Probe-sets that did not have a known gene were labeled "EST" and their accession numbers were kept as identifiers.
- Postmortem convergence was deemed to occur for a gene (or a biomarker) if there were human postmortem data showing changes in expression of that gene in brains from patients with mood disorders (bipolar disorder, depression), or secondarily of other major neuropsychiatric disorders that impact mood (schizophrenia, anxiety, alcoholism).
- the gene may have positive reports from candidate gene association studies, or map within lOcM of a microsatellite marker for which at least one study demosntrated evidence for genetic linkage to mood disorders (bipolar disorder or depression) or secondarily to another neuropsychiatric disorder.
- the University of Southampton's sequence-based integrated map of the human genome The Genetic Epidemiological Group, Human Genetics Division, was used to obtain cM locations for both genes and markers. The sex-averaged cM value was calculated and used to determine convergence to a particular marker.
- the Marshfield database Center for Medical Genetics, Marshfield, WI, USA was used with the NCBI Map Viewer web-site to evaluate linkage convergence.
- Biomarkers were given the maximum score of 2 points if changed in the human blood samples with high threshold analysis, and only 1 point if changed with low threshold.
- Biomarkers received 1 point for each external cross-validating line of evidence human postmortem brain data, human genetic data, animal model brain data, and animal model blood data.
- Biomarkers received additional bonus points if changed in human brain and blood, as follows:
- Biomarkers also received additional bonus points if changed in brain and blood of the animal model, as follows:
- the scoring pattern described herein is biased more towards awarding additional points for live subject human blood data (if it made the high threshold cut) than literature-derived human postmortem brain data, human genetic data, or the animal model data.
- the human blood-brain concordance is weighted more favorably than the animal model blood-brain concordance.
- the scoring analysis presented herein is just one example of assigning quantifiable values to prioritizing biomarkers for mood disorder analysis. Other ways of weighing the scores of line of evidence may give slightly different results in terms of prioritization, if not in terms of the list of genes per se.
- weightage given to a particular evidence may be varied. Additional scoring matrices may also be included to account for additional variables.
- One such example would be the temporal aspect — how long a particular biomarker is turned on.
- RNA is isolated from the blood using standard protocols, for example with PAXgene blood RNA extraction kit (PreAnalytiX, a QIAGEN/BD company), followed by GLOBINclearTM-Human or GLOBINclearTM-Mouse/Rat (Ambion/ Applied Biosystems Inc., Austin, TX) to remove the globin mRNA.
- PAXgene blood RNA extraction kit PreAnalytiX, a QIAGEN/BD company
- GLOBINclearTM-Human or GLOBINclearTM-Mouse/Rat Ambion/ Applied Biosystems Inc., Austin, TX
- the labeled RNA is then quantified for the presence of one or more of the biomarkers disclosed herein.
- gene expression analysis is performed using a panel of about 10 biomarkers (e.g., BioM 10 panel) by any standard technique, for example microarray analysis or quantitative PCR or an equivalent thereof.
- the gene expression levels are analyzed and the absent/present state or fold changes (either increased, decreased, or no change) are determined and a score is established
- Biomarkers disclosed herein are used in the form of panels of biomarkers, as exemplified by a BioM-10 Mood panel, for clinical laboratory tests for mood disorders. Such tests can be: 1) at an mRNA level, quantitation of gene expression through polymerase chain reaction, 2) at a protein level, quantitation of protein levels through immunological approaches such as enzyme-linked immunosorbent assays (ELISA).
- ELISA enzyme-linked immunosorbent assays
- CSF urine
- urine may play a desirable part of personalizing treatment to increase effectiveness and avoid adverse reactions- personalized medicine in psychiatry.
- Biomarker-based tests for mood disorders help: 1) Diagnosis, early intervention and prevention efforts; 2) Prognosis and monitoring response to various treatments; 3) New neuropsychiatric drug development efforts by pharmaceutical companies, at both a pre-clinical and clinical (Phase I, II and III) stages of the process; 4) Identifying vulnerability to mood problems for people in high stress occupations (for example, military, police, homeland security).
- Example 4A Diagnosis, early intervention and prevention efforts.
- a patient with no previous history of mood disorders presents to a primary care doctor or internist complaining of non-specific symptoms: low energy, fatigue, general malaise, aches and pains.
- Such symptoms are reported in conditions such as stress after a job loss, bereavement, mononucleosis, fibromyalgia, and postpartum in the general population, as well as Gulf War syndrome in veterans.
- a panel of mood biomarkers can substantiate that the patient is showing objective changes in the blood consistent with a low mood/depressive state.
- anti-depressant medications such as Prozac (fluoxetine), Zolof (sertraline), Celexa (citalopram), Cymbalta (duloxetine), Effexor (venlafaxine) or Wellbutrin (buproprion).
- Example 4B Clinical diagnosis of a young patient.
- a young patient child, adolescent, young adult
- mood biomarkers panels of mood biomarkers
- Example 4C Monitoring mood biomarkers over an extended period. Many patients with bipolar disorder may present initially with a depressive episode to their primary care doctor or psychiatrist. Monitoring mood biomarkers over time may also help to differentiate depression vs. bipolar disorder (manic-depression). This distinction is helpful because the first-line treatments for the two disorders are different: anti-depressants for depression, mood stabilizers for bipolar. If patients are miss-diagnosed as depressives instead of bipolars, and started on anti-depressant medications only, this can lead to activation and flip into manic states.
- Example 4D Prognosis and monitoring response to various treatments.
- depression initiating medication treatment with current anti-depressants medications is a trial-and -error endeavor. It takes up to 6-8 weeks to see if a medication truly works.
- a baseline biomarker panel test and then a repeat test early one in treatment (after 1 week, for example), there would be an early objective indication if an anti-depressant is starting to work or not, and if a switch to another medication is indicated. This would save time and avoid needles suffering for patients, with the attendant socio-economic losses.
- Example 4F Determining adequacy of treatment plan. Objective monitoring with blood biomarker panels of the effect of less reliable or evidence-based interventions: psychotherapy, lifestyle changes, diet and exercise programs for improving mood health. This will show whether the particular intervention works, is sufficient, or medications may need to be added to the regimen.
- Example 4G Identifying vulnerability to developing mood problems for people in high stress occupations.
- Military personnel (recruits in boot-camp, active duty soldiers), other people in high-stress jobs (police, homeland security, astronauts), can be monitored on a regular basis to detect early objective changes in mood biomarker profile that would indicate the need for preventive intervention and/or the temporary removal from a high-stress environment.
- Biomarker testing may provide an objective signature of the genetic and biological make-up of the responders, which can inform recruitment for subsequent validatory clinical trials with higher likelihood of success, as well as inform which patients should be getting the medication, once it is
- Table 5 Biological Roles. Ingenuity pathway analysis (IPA) of biological functions categories among our top blood candidate biomarker genes for mood. Genes from Table 3. Top categories, over- represented with a significance of p ⁇ 0.05, are shown.
- IPA Ingenuity pathway analysis
- Table 6 Targets of existing drugs. Complete list of the blood candidate biomarker genes for mood that are the direct target of existing drugs.
- the nucleic acid sequences provided herein represent a region or a segment of the genes listed in one or more of the tables.
- the completed nucleic acid sequences for the genes listed in the tables are readily obtained from a public database (e.g., NCBI) using the gene identification (Gene ID) number and the gene names provided in the tables.
- Expression profiles of the genes listed in the tables are performed using either oligos, regions or segments of the genes or full or partial cDNA sequences, ESTs in a microarray format.
- the presence or absence of the protein products or peptide fragments thereof of the genes listed in the tables are also analyzed for predictive and dignostic purposes.
- Antibodies to the protein or peptides are placed in an array format for serial or parallel expression profiling.
- Ugt8 UDP glycosyltransferase 8 (UDP-galactose ceramide galactosyltransferase)
- Atp2cl ATPase Ca++-sequeste ⁇ ng Entrez Gene ID No. 27032 (SEQ ID NO: 13) tttttctcttctggcttcataaatgccttgctgtataaattgaaatattgatactgaactgtctttttaatgatgaccta actttattcaacccatcggaatttacttttttccctgaaataagatcttttccactggtctactacctgaccataaacatg tctgcatttgaattctctaaaccctaaatctgtgtctatg
- Atxnl Ataxin Entrez Gene ID No. 16310 (SEQ ID NO: 14) aaacagagcagccacgggctcgaaccgaatccccgccgtccttagaaacggattttttttgtttttgttttctgg cagagtctcgatcaccaccctactnccacccccactaaggttcttgctcaatctccctagaaaacctgaattgttttcatc cctttcagtcagcccctacgtggtctgaaacaaatgaaagcacaagccacggagtttaagaaggcagcctgaaggcgg ggctgaagaggggcgg ggctgctgcagagtcagccaagtagccaaggaagggcccctctctctc
- Ednrb endothelin receptor type B Entrez Gene ID No. 1910 (SEQ ID NO: 19) aactgctttaagtcatgcttatgctgctggtgccagtcatttgaagaaaaacagtccttggaggaaaagcagtcgtgctt aaagttcaaagctaatgatcacggatatgacaacttccgttccagtaataaatacagctcatcttgaaaa
- Elovl5 ELOVL family member 5 Elovl5 ELOVL family member 5, elongation of long chain fatty acids (yeast)
- Gnal guanine nucleotide binding protein, alpha stimulating, olfactory type Gnal guanine nucleotide binding protein, alpha stimulating, olfactory type
- Nupll nucleoporin like 19818 (SEQ ID NO: 25) aaaataggcattgcatacacatatgcacacgtatgtgcacgtgccacacattttttgtataatgttgggtttgattataa aagtgttgtcaaatgtttttatttatctgcatntagcagtggttggctttttgaattgaaattttttgcgcattgatgcat tgaaataaggaaaattatttatctctgagcactaaacttattttttgcatatttctgtaatattgcagtccccagatccag aacatgggaagttagggaaaatgtgtgattttgtgttttgaattactgtcagaattacatacacaattacaacaaactttttttaaa
- Slc25a23 solute carrier family 25 (mitochondrial carrier; phosphate carrier), member Entrez Gene ID No. 2379085 (SEQ ID NO: 27) ctcccaccttctaggcgaatagtccccagagctgtgttcctccaaggggtccgaggaatcactcactcctggaggctggc aaggagacagtctgaggccagggacacatgaagggatgtccccaccccagcactatcagggcctccccaggcttccagag ttgaaagccaggagaaaatcggcaaagaccaccacccttccctaaacccaagcacccaatgatgcaaaaaaacaaaaaaccaccaccaatccccaaattcattccagatctatttttctaccagagagaggagcaaaagtcattccagatctt
- Tjp3 tight junction protein 3 (zona occludens 3) Entrez Gene ID No. 27134 (SEQ ID NO: 30) acacggatgtggatgatgagcccccggctccagccctggcccggtcctcggagcccgtgcaggcagatgagtcccagagc ccgagggatcgtgggagaatctcggctcatcagggggcccaggtggacagccgcacccccagggacagtggcgacagga cagcatgcgaacctatgaacgggaagccctgaagaaaaagtttangcgagtncatgatgcggagtcctcgatgaag
- Trpcl transient receptor potential cation channel subfamily C, member Entrez
- Wdr34 WD repeat domain Entrez Gene ID No. 3489891 (SEQ ID NO: 36) cgctgggactgacgggcatgtccacctgtactccatgetgcaggcccctccttgacttcgctgcagctctcctcaagt atctgtttgctgtgcgctggtccccagtgcggccccttggtttttgcagctgcctctgggaaaggtgacgtgtttt gatctccagaaaagctcccagaacccacagttttgatcaagcaaacccaggatgaaagccctgtctactgtctggagtt caacagccagcagactcagctcttggctgcgggcgatgggcacagtgtgaggt
- Nefh neurofilament, heavy polypeptide 20OkDa Entrez Gene ID No. 4744 (SEQ ID NO: 37) ccccaggcgatggacaattatgatagcttatgtagctgaatgtgatacatgccgaatgccacacgtaaacactt gactataaaaactgcccccctcctttccaaataagtgcatttattgcctctatgtgcaactgacagatgaccgcaataat gaatgagcagttagaaatacattatgcttgagatgtctttaacctattcccaaatgccttctgtttccaaaggagtggtc aagcccttgcccagagcttcttggaaggagtggtc aagcccttgcccagagctctctattggaaga
- Bic BIC transcript (SEQ ID NO: 38) gggtaaataacatctgacagctaatgagatattttttccatacaagataaaagatttaatcaaaaatttcat atttgaaatgaagtcccaaatctangttcaagttcaatagcttagccacataatacggttgtgcgagcagagaatctacc tttccacttctaagcctgtttctcctccatnnnatggggataatacttttacaaggttgtgtgtgaggcttagatgagata gagaattattccataagataatcaagtgetacattaatgttatagttagattaatccaagaactagtcaccctactttat tagagaagagaaaaagctaatgattttttgcagaatatttaa
- Histlh3b histone cluster 1, H3b Entrez Gene ID No. 8358 (SEQ ID NO: 45 ) atggctcgtactaaacagacagctcggaaatccaccggcggtaaagcgccacgcaagcagctggctaccaaggc tgctcgcaagagcgcgccggctaccggcggtgtgaaaaagcctcaccgttaccgtccgggtactgtggctctgcgtgaga tccgcgctaccaaaagtcgaccgagttgctgattcggaagctgccgttccagcgcctggtgcgagaaatcgcccaagac ttcaagaccgatcttcgcttccagagctctgcggtaatggcgctgcaggaggcttg
- Hrasls HRAS-like suppressor Entrez Gene ID No. 57110 (SEQ ID NO: 46) agagcaggccaaccgagcgataagtaccgttgagtttgtgacagctgctgttggtgtcttctcattcctgggct tgtttccaaaaggacaaagagcaaatactattaacaatttaccaaagagatattgatattgaaggaatttgggaggagg aaaagaaacctggggtgaatacttattttcagtgcatcattactgttccagattcctatgatggatggc
- Kiaal729 KIAA1729 protein Entrez Gene ID No. 85460 (SEQ ID NO: 48) gattccagaatctctacctttaaacactatgttaccacttacttacttctcttcaaattttattgagcattagatgtt t tccagtatttagaagtcaaatgcttcgtttttaataggaacttacacagtcttttatgttttttttatagccctcaatgtc actgatgtggattctcccaaactcgatacttttgttttttatgtccccataataagtcttttaagaaaacagggcaagt gagctcaaaatcaaagaaaacccaccaacagtgaatgcattcagggctattttcttttgaagaaagataaagataagact
- P2ryl2 purinergic receptor P2Y G-protein coupled Entrez Gene ID No. 12 64805 (SEQ ID NO: 57) aaatgtatatatatcctagtcccctaaccaaatcctgacctattgggatacttataaaaatttaagtagtggg atacacaaagaataataactattaacttttcattattagcaaaaacctaagggatttaaactaattgaaactgtatttga ttggacttaatttttatgttttagaagataaagattttaaagaagacctttacaataaagagaagaaatatcgaagt cattaaaataaggagacttacttttatgacattctaatactaaaaaatatagaaatatttctagagaaacta gttttactaattttttt
- Apobec4 apolipoprotein B mRNA editing enzyme catalytic polypeptide-like 4 (putative) Entrez Gene ID No. 403314 (SEQ ID NO: 70) aaatccaagttcctcttactggctttcaaggatcctcctttaacttcctgttgccttgtctcatcagcaagatc ataagtacctacaggtcaagcactgtctctcccttctcttttagctttttcccttaggatctagcacattacccagcaaaat gtgagtagcaaggctgaaatgacatctcaataacttcaccaatgattgtaactcagcatcccttctccatcccagctgaa agcctgcaccatcctgcaagagatgttttttttttgttagcatcca
- Fbxol5 F-box protein 15 Entrez Gene ID No. 201456 (SEQ ID NO: 86) gagaacacctacctcttattggaaaagttggcctctcgtggaaaactgatatttttgatggctgtataaagagt tgttccatgatggacgtaactcttttggatgaacatgggaaacccttttggtgttttcagttcccccggtgtgcctgagatc gcctgccacaccctctgacagctctagcttcttgggacagacatacaacgtggactacgttgatgcggaaggaagagtgc acgtggtggtggatcagagagaccgaagaataccttattgtcaacctggtcctttatcttagtatcgcaaaaaatc
- Gins4 GINS complex subunit 4 (Sld5 homolog) Entrez Gene ID No. 84296 (SEQ ID NO: 87) gccaggctttgtggtatgtacctttagtcccagctactctggaggctgaggcaggaggatcacttaagccttgg aggtcaagaatgcagtgagccattatcatgccactgtgtgaccagaaaccagatgtagccatttcaagcataaaacatga tatttttgttttccttggactgaaacatagtctgggtcctcaacgttgccggtgatgatggttgaacatcatgttttttta taaccttaatttctcattttaataggaagaaaatctcaggagagccaaaagggaggacctgaaggtcagcatccaccaccacca
- Herpud2 HERPUD family member 2 Entrez Gene ID No. 64224 (SEQ ID NO: 91) aaactaaacatcatatgttctcatatgtccctaagctatgaggatgcaaaggcataagaatgatacaatggact ttggggactttcagggaaagggtgagaagggcgtaagggataaagactacaaattgggttcagtatatactgctcgggt gatgggtgcnccaaaatcttaaaaatcgccaaagaacttatgtaactaaataccncctgttccccaaaaaaaactatggaaaaaattaaaaaataagtataatttctgctttagcgatattaactattcagtacncaataagtgagtttagcaattca gtgatt
- IgI immunoglobulin lambda chain variable 1 Entrez Gene ID No. 3535 (SEQ ID NO: 93) tctggatccaaagacgcttcggccaatgcagggattttactcatctctggcctccagtctgaggatgaggctga ctattactgtatgatttggcgcggcaccgctgtggtatttggcggagggac
- Kcnmb4 potassium large conductance calcium-activated channel, subfamily M, beta member 4 Entrez Gene ID No. 27345 (SEQ ID NO: 100) agatgagattggttcccagccatttacttgctattttaatcaacatcaaagaccagatgatgtgcttctgcatc gcactcatgatgagattgtcctcctgcattgcttcctctggtgacatttgtggtgggcgttctcattgtggtc ctgaccatctgtgccaagagcttggcgatcaaggcggaagccatgaagaagcgcaagttctcttaaaggggaaggaggct tgtagaaagcaaagtacagaagctgtactcatcggcacgcgtccacctgcggaacctgtgtgtgtg
- Lrrc37a leucine rich repeat containing 37A Entrez Gene ID No. 9884 (SEQ ID NO: 107) ggctttgggagtgagcagctagacaccaatgacgagagtgatgttatcagtgcactaagttacatttgccatat ttctcagcagtaaacctagatgtggaatcaatgttactaccgttcattaaactgccaaccacaggaaacagcctggcaaa gattcaaactgtaggccaaaaccggcaaaaagtgaatagagtcctcatgggcccaatgagcatccagaaaaggcacttca aagaggtgggaaggcagagcatcaggagggaacagggtgcccaggcatctgtggagaacgctgcgaagaaaaaaggctcgggaagaaaaaagg
- Mrpl30 mitochondrial ⁇ bosomal protein L30 Entrez Gene ID No. 51263 (SEQ ID NO: 108) ttatggctgggattttgcgcttagtagttcaatggcccccaggcagactacagaccgtgacaaaggtgtggag tctcttatttgtacagattggattcgtcacaattcaccagatcaagaattccagaaaagtgtttcaggcctcacctgaa gatcatgaaaatacggtggggatccacagaaccctcataaactgcatattgttaccagaataaaaagtacaagaagacg tccatattgggaaaagatataataaagatgcttggattagaaaaagcacatacccctcaagttcacaagaatatccctt cagtg
- Nipsnap3 bnipsnap homolog 3B (C. elegans) Entrez Gene ID No. 55335 (SEQ ID NO: 109) gttaatttgctgtgcttcttgcatttttgaaagttacatattctccactgcttttaagaaataattcagttcact ttcaccttggcatttcagtatctgttacacattagaagtagttgtcactatttcatc
- Parp2 poly (ADP- ⁇ bose) polymerase family member 2 Entrez Gene ID No. 10038 (SEQ ID NO: 110) gccatgggcttcgaattgcccaccctgaagctcccatcacaggttacatgtttgggaaaggaatctactttgct gacatgtcttccaagagtgccaattactgctttgcctctcgctaaagaatacaggactgctgctcttatcagaggtagc tctaggtcagtgtaatgaactactagaggccaatcctaaggccgaaggattgcttcaaggtaacatagcaccaaggggc tgggccacttctgtcaccctgaatgggagtacagtgccattaggaccagcaagcaagcaagcaagtggctct
- Pol3s polyserase 3 Entrez Gene ID No. 339105 (SEQ ID NO: 114) cagaccctgttccttcgaggaatggggagggagggagggaccaaagccgtgaggatgaggacaactccaccctc cttccttcccacaggccaaccaaccagctgctgacaggggacctggccattctcaggacaagagaatgcaggcaggcaa anngcattactgcccctgtcctnccccaccctgtcatgtgtgattccaggcaccagggcaggcccagaagcccagcagct gtgggaaggaacctgcctggggggccacaggtgcccact gtgggaaggaacctgcctggggggccacaggtgcccactcccaccctgcaggacaggggtg
- Prkd2 protein kinase D2 Entrez Gene ID No. 25865 SEQ ID NO: 116 gggagagggaggagtaatggaggaggagttggaaactggggagagatggaaggaatgtgactggagggtagaga acttggagaa
- Prr7 proline rich 7 (synaptic) Entrez Gene ID No. 80758 (SEQ ID NO: 117) gaatcggacatgtccaaaccaccgtgttacgaagaggcggtgctgatggcagagccgccgcccctatagcga ggtgctcacggacacgcgcggcctctaccgcaagatcgtcacgcccttcctgagtcgcgcgacagcgcggagaagcagg agcagccgctcccagctacaagccgctcttcctggaccggggctacacctcggcgctgcacctgcccagcgcccctcgg ccgcgcctgcccagcccctcgg ccgcgccctgcccagcccctctgcccagcc
- Slc2al3 solute carrier family 2 (facilitated glucose transporter), member 13 Entrez Gene ID No. 114134 (SEQ ID NO: 126) aacaacattattccatctcatttaaaggttnaaaaagaagagacaactctagccnaagtagaaatttatattct acacgtccaaactgtctcctagcagcttttggactatatatcacttgatgttaaagtatcttttttgtaataatatt caaatttctatttagaagctctaatgtatacctagattaaatcaaatcacacagtttttatgctttttaaaatatatgtatttc aaactgtatatttttttgagtgcatgttatatagtattttggcaaattcaatataagtattattctgagtgtt
- Wdr20 WD repeat domain 20 Entrez Gene ID No. 91833 (SEQ ID NO: 133) ggagactgtctcactgatgttgatttctttattcatttccgcatctgttacacgaacttcgtgtcataaattgc tatccttttgaaagtgtaaaaatttcctgcattttttatcattttgtatacttgagtttattagagattgtttatg ttaggcgacactgtataaaattgtatggatattttgagtgaaaatcaaagtaaattcacatgtatttccttttttttata ttttcatccaatttcttgacaacttgaataaatttcataaagagccttcctaaaaagagccttctaaa
- Wdr55 WD repeat domain 55 Entrez Gene ID No. 54853 (SEQ ID NO: 134) gcaagctctcattggctctgagcgcgaccccgcctcccaggggggtggaggtatccactgcacgtgcgcccc gggcttcgctcagaccttcaggtgaaagctgcaaagtcgcgggtgcgtatgtacgggggctgcctccgaggaggagctc ccaagccgcagggtggacgctggagacaagaacctcagggtcacaagtttactgtttttctcccttttccatccctacat tggtctgctggggaaggcggggctaggcatcactgacacacgcagactcccgtggttgaggcatttt
Landscapes
- Life Sciences & Earth Sciences (AREA)
- Health & Medical Sciences (AREA)
- Chemical & Material Sciences (AREA)
- Engineering & Computer Science (AREA)
- Proteomics, Peptides & Aminoacids (AREA)
- Immunology (AREA)
- Biomedical Technology (AREA)
- Organic Chemistry (AREA)
- Analytical Chemistry (AREA)
- Molecular Biology (AREA)
- Biotechnology (AREA)
- Pathology (AREA)
- Hematology (AREA)
- Urology & Nephrology (AREA)
- Zoology (AREA)
- Wood Science & Technology (AREA)
- Microbiology (AREA)
- Physics & Mathematics (AREA)
- Genetics & Genomics (AREA)
- Biochemistry (AREA)
- General Health & Medical Sciences (AREA)
- Medicinal Chemistry (AREA)
- General Physics & Mathematics (AREA)
- Neurosurgery (AREA)
- Biophysics (AREA)
- Neurology (AREA)
- Food Science & Technology (AREA)
- Cell Biology (AREA)
- Bioinformatics & Cheminformatics (AREA)
- General Engineering & Computer Science (AREA)
- Measuring Or Testing Involving Enzymes Or Micro-Organisms (AREA)
Abstract
A plurality of markers determine the diagnosis of a mood disorder based on their expression in a sample such as blood. Subsets of biomarkers predict the diagnosis of high or low mood disorders. The biomarkers are identified using a convergent functional genomics approach based on animal and human data. Methods and compositions for clinical diagnosis of mood disorders are provided.
Description
BLOOD BIOMARKERS FOR MOOD DISORDERS
CROSS REFERENCE TO RELATED APPLICATIONS
[0001 ] This application claims priority to U.S. provisional application Ser. No. 60/909,859, filed
April 2, 2007, the disclosure of which is hereby incorporated by reference in its entirety.
[0002] Part of the work during the development of this invention was made with government support from the National Institutes of Health under grant NIMH ROl MH071912-01. The U.S. Government has certain rights in the invention.
BACKGROUND
[0003] Research into the biological basis of mood disorders (e.g., bipolar disorders, depression) has been primarily focused in human and animal studies mostly independently. The two avenues of research have complementary strengths and weaknesses. In human genetic studies, for example, in samples of patients with mood disorders and their family members, positional cloning methods such as linkage analysis, linkage-disequilibrium mapping, and candidate-gene association analysis are narrowing the search for the chromosomal regions harboring risk genes for the illness and, in some cases, identifying plausible candidate genes and polymorphisms that will require further validation. Human postmortem brain gene expression studies have also been employed as a way of trying to identify candidate genes for mood and other neuropsychiatric disorders. In general, human studies suffer from issues of sensitivity- the signal is often difficult to detect due to the noise generated by the genetic heterogeneity of individuals and the effects of diverse environmental exposures on gene expression and phenotypic penetrance.
[0004] In animal studies, carried out in isogenic strains with controlled environmental exposure, the identification of putative neurobiological substrates of mood disorders is typically accomplished by modeling human mood disorders through pharmacological or genetic manipulations. Animal model studies suffer from issues of specificity- questions regarding direct relevance to the human disorder modeled. Each independent line of investigation (i.e., human and animal studies) is contributing to the incremental gains in knowledge of mood disorders etiology witnessed in the last decade.
[0005] However, a lack of integration between these two lines of investigation, hinders scientific understanding and slows the pace of discovery. Psychiatric phenotypes, as currently defined, are primarily the result of clinical consensus criteria rather than empirical determination. The present disclosure provides methods and compositions that empirically determine disease states for diagnosis and treatment.
[0006] Objective biomarkers of illness and treatment response would make a significant difference in the ability to diagnose and treat patients with psychiatric disorders, eliminating subjectivity and reliance of patient's self -report of symptoms. Blood gene expression profiling has emerged as a particularly interesting area of research in the search for peripheral biomarkers. Most of the studies to date have focused on human 1 lymphoblastoid cell lines (LCLs) gene expression profiling,
comparison between illness groups and normal controls. They suffer from one of both of the following limitations: 1) the sample size used is often small. Given the genetic heterogeneity in human samples and the effects of illness state and environmental history, including medications and drugs, on gene expression, it may not be reliable to extract bona fide findings. 2) Use of lymphoblastoid cell lines — passaged lymphoblastoid cell lines provide a self -renewable source of material, and are purported to avoid the effects of environmental exposure of cells from fresh blood. Fresh blood, however, with phenotypic state information gathered at time of harvesting, may be more informative than immortalized lymphocytes, and may avoid some of the caveats of Epstein- Barr virus (EBV) immortalization and cell culture passaging.
[0007] The current state of the understanding of the genetic and neurobiological basis for mood disorders (such as bipolar disorder and depression) in general, and of peripheral molecular biomarkers of the illness in particular, is still inadequate. Almost all of the fundamental genetic, environmental, and biological elements needed to delineate the etiology and pathophysiology of mood disorders are yet to be completely identified, understood and validated. One of the rate- limiting steps has been the lack of concerted integration across disciplines and methodologies. The use of a multidisciplinary, integrative research framework as in the present disclosure provided herein, should lead to a reduction in the historically high rate of inferential errors committed in studies of complex diseases like bipolar disorder and depression.
[0008] Identification and validation of peripheral biomarkers for bipolar mood disorders has proven arduous, despite recent large-scale efforts. Human genomic studies are susceptible to the issue of being underpowered, due to genetic heterogeneity, the effect of variable environmental exposure on gene expression, and difficulty of accrual of large samples. Animal model gene expression studies, in a genetically homogeneous and experimentally tractable setting, can avoid artifacts and provide sensitivity of detection. Subsequent comparisons of the animal datasets with human genetic and genomic datasets can ensure cross-validatory power and specificity.
[0009] Convergent functional genomics (CFG), is an approach that translationally cross-matches animal model gene expression data with human genetic linkage data and human tissue data (blood, postmortem brain), as a Bayesian strategy of cross validating findings and identifying candidate genes, pathways and mechanisms for neuropsychiatric disorders. Predictive biomarkers for mood disorders are desired for clinical diagnosis and treatment purposes. The present disclosure provides several biomarkers that are predictive of mood disorders in clinical settings.
SUMMARY [00010] Methods and compositions to clinically diagnose mood disorders using a panel of biomarkers are disclosed. A panel of biomarkers may include 1 to about 100 or more biomarkers. The panel of biomarkers includes one or more biomarkers for high and low mood disorders. Blood is a suitable sample for measuring the levels or presence of one or more of the biomarkers provided herein.
[00011 ] In an aspect, psychiatric symptoms measured in a quantitative fashion at time of blood draw in human subjects focus on all or nothing phenomena (genes turned on and off in low symptom states vs. high symptom states). Some of the biomarkers have cross-matched animal and human data, using a convergent functional genomics approach including blood datasets from animal models.
[00012] Prioritized list of high probability blood biomarkers, provided herein, for mood state using cross-matching of animal and human data, provide a unique predictive power of the biomarkers, which have been experimentally tested.
[00013] The disclosure also provides various methods of assigning prediction scores for mood state based on the ratio of biomarkers for high mood vs. biomarkers for low mood in the blood of individual subjects, termed as BioM Mood Prediction Score. In an aspect, a panel of about 10 biomarkers, designated as BioM-10 Mood Panel, demonstrated good accuracy in predicting actual measured mood (high and low) in an enlarged cohort of subjects.
[00014] In an aspect, the present disclosure provides methods and compositions for developing clinical blood tests to quantify gene expression for diagnosis and quantitation of protein levels through immunological approaches such as enzyme-linked immunosorbent assays (ELISA).
[00015] A method of diagnosing a mood disorder in an individual includes the steps of:
(a) determining the level of a plurality of biomarkers for the mood disorder in an isolated sample from the individual, the plurality of biomarkers selected from the group of biomarkers listed in Tables 3 and 7; and
(b) diagnosing the mood state (high mood-mania, low mood- depression) in the individual based on the level of the plurality of biomarkers.
[00016] A plurality of biomarkers, in an aspect, includes a subset of about 10 markers designated as
Mbp, Edg2, Fzd3, Atxnl, Ednrb for high mood and Fgfrl, Mag, Pmp22, Ugt8, Erbb3 for low mood.
[00017] A plurality of biomarkers, in an aspect, includes a subset of about 20 biomarkers designated as Mbp, Edg2, Fzd3, Atxnl, Ednrb, Pde9a, Plxndl, Camk2d, Dio2, Lepr for high mood and Fgfrl, Mag, Pmp22, Ugt8, Erbb3 , Igfbp4, Igfbpό, Pdeόd, Ptprm, Nefh for low mood.
[00018] A mood disorder is a Bipolar disorder and the sample is a bodily fluid. A suitable sample is blood. The level of the biomarker may be determined in a blood sample of the individual.
[00019] In an aspect, the level of the biomarker is determined by analyzing the expression level of
RNA transcripts. In an aspect, the expression level of the biomarker is determined by analyzing the level of protein or peptides or fragments thereof. Suitable detection techniques include microarray gene expression analysis, polymerase chain reaction (PCR), real-time PCR, quantitative PCR, immunohistochemistry, enzyme-linked immunosorbent assays (ELISA), and antibody arrays.
[00020] In an aspect, the determination of the level of the plurality of biomarkers is performed by an analysis of the presence or absence of the biomarkers.
[00021 ] A method of diagnosing mood disorder in an individual includes the steps of:
(a) performing a quantitative determination of the level of a panel of at least 10 biomarkers selected from Tables 3 and 7 in a bodily fluid sample isolated from the individual, wherein the panel comprises at least one biomarker for high mood disorder;
(b) assigning a predictive value or score to the level of the biomarkers; and
(c) diagnosing the mood disorder based on the assigned value or score. [00022] A method of predicting the probable course and outcome (prognosis) of a mood disorder includes the steps of:
(a) obtaining a test sample from a subject, wherein the subject is suspected of having a mood disorder;
(b) analyzing the test sample for the presence or level of a plurality of biomarkers of the mood disorder, the markers selected from the group consisting of biomarkers listed in Tables 3 and 7; and
(c) determining the prognosis of the subject based on the presence or level of the biomarkers and one or more clinicopathological data to implement a particular treatment plan for the subject.
[00023] A treatment plan for a high mood disorder includes administering a pharmaceutical composition selected from a group that includes Depakote (divalproex), Lithobid (lithium), Lamictal (lamotrigene), Tegretol (carbamazepine), Topomax (topiramate).
[00024] A treatment plan for a low mood disorder includes administering a pharmaceutical composition selected from the group consisting of Prozac (fluoxetine), Zolof (sertraline), Celexa (citalopram), Cymbalta (duloxetine), Effexor (venlafaxine) or Wellbutrin (buproprion).
[00025] A clinicopathological data is selected from a group that includes patient age, previous personal and/or familial history of the mood disorder, previous personal and/or familial history of response to treatment, and any genetic or biochemical predisposition to psychiatric illness.
[00026] A suitable test sample includes fresh blood, stored blood, fixed, paraffin-embedded tissue, tissue biopsy, tissue microarray, fine needle aspirates, peritoneal fluid, ductal lavage and pleural fluid or a derivative thereof.
[00027] A method of predicting the likelihood of a successful treatment for a mood disorder in a patient includes the steps of:
(a) determining the expression level of at least 10 biomarkers, wherein the biomarkers comprise a subset of about 10 markers designated as Mbp, Edg2, Fzd3, Atxnl, Ednrb for high mood and Fgfrl, Mag, Pmp22, Ugt8, Erbb3 for low mood; and
(b) predicting the likelihood of successful treatment for the mood disorder by determining whether the sample from the patient expresses biomarkers for a high mood disorder or a low mood disorder.
[00028] A method of treating a patient suspected of suffering a mood disorder, the method includes the steps of:
(a) diagnosing whether the patient suffers from a high mood or a low mood disorder by determining the expression level of one or more of the biomarkers listed in Tables 3 and 7 in a sample obtained from the patient;
(b) selecting a treatment for the mood disorder based on the determination whether the patient suffers from a high mood or a low mood disorder; and
(c) administering to the patient a therapeutic agent capable of treating the high or the low mood disorder.
[00029] A treatment plan may be a personalized plan for the patient.
[00030] A method for clinical screening of agents capable of affecting a mood disorder, the method includes the steps of:
(a) administering a candidate agent to a population of individuals suspected of suffering from a mood disorder or induced to suffer a mood disorder;
(b) monitoring the expression profile of one or more of the biomarkers listed in Tables
3 and 7 in blood samples obtained from the individuals receiving the candidate agent compared to a control group; and
(c) determining that the candidate agent is capable of affecting the mood disorder based on the expression profile of one or more of the biomarkers in the blood samples obtained from the individuals receiving the candidate drug compared to the control.
[00031 ] A mood disorder microarray includes a plurality of nucleic acid molecules representing genes selected from the group of genes listed in Tables 3 and 7.
[00032] A kit for diagnosing a mood disorder includes a component selected from the group consisting of (i) oligonucleotides for amplification of one or more genes listed in Table s 3 and 7, (ii) immunohistochemical agents capable of identifying the protein products of one or more biomarkers listed in Table 7, (iii) a microarray to detect the plurality of markers listed in Tables 3 and 7, and (iv) a biomarker expression index representing the genes listed in Tables 3 and 7 for correlation.
[00033] A diagnostic microarray includes a panel of about 10 biomarkers that are predictive of a mood disorder, wherein the microarray includes nucleic acid fragments representing biomarkers designated as Mbp, Edg2, Fzd3, Atxnl, Ednrb for high mood and Fgfrl, Mag, Pmp22, Ugt8, Erbb3 for low mood.
[00034] A diagnostic antibody array includes a plurality of antibodies that recognize one or more epitopes corresponding to the protein products of the biomarkers designated as Mbp, Edg2, Fzd3, Atxnl, Ednrb for high mood and Fgfrl, Mag, Pmp22, Ugt8, Erbb3 for low mood.
[00035] A diagnostic microarray consists essentially of the top candidate markers from tables 3 and
7.
BRIEF DESCRIPTION OF THE DRAWINGS
[00036] FIG. 1 shows Visual- Analog Mood Scale (VAS) scoring for some of the biomarkers used herein.
[00037] FIG. 2 shows prioritization (A) and conceptualization (B) of results. A: convergent functional genomics approach for candidate biomarker prioritization. Scoring of independent lines of evidence yields (maximum score= 9 points). B: Conceptualization of blood candidate biomarker genes.
[00038] FIG. 3 illustrates some of the candidate biomarker genes for mood. Prioritization was based on integration of multiple lines of evidence. On the right side of the pyramid is their CFG score.
[00039] FIG. 4 is a comparison of BioM-10 Mood Prediction Score and actual mood scores in the primary cohort of bipolar subjects (n=29). BP- bipolar. Mood scores are based on subject self-report on mood VAS scale administered at time of blood draw. For biomarkers: A - called Absent by MAS5 analysis. P - called Present by MAS5 analysis. M - called Marginally Present by MAS5 analysis. A is scored as 0, M as 0.5 and P as 1. BioM Mood Prediction Score is based on the ratio of the sum of the scores for high mood biomarkers and sum of scores for low mood biomarkers, multiplied by 100.A cutoff score of 100 and above was used for high mood, inf- infinity- denominator is 0.
[00040] FIG. 5 is a comparison of BioM-10 Mood Prediction Score and actual mood scores in an independent cohort of psychotic disorders subjects (n=30). SZ- schizophrenia; SZA- schizoaffective disorder; SubPD- substance induced psychosis. Mood scores are based on subject self -report on mood VAS scale administered at time of blood draw. For biomarkers: A - called Absent by MAS5 analysis. P - called Present by MAS5 analysis. M- called Marginally Present by MAS5 analysis. A is scored as 0, M as 0.5 and P as 1. BioM Mood Prediction Score is based on the ratio of the sum of the scores for high mood biomarkers and sum of scores for low mood biomarkers, multiplied by 100. A cutoff score of 100 and above was used for high mood, inf- infinity-denominator is 0.
[00041 ] FIG. 6 shows Connectivity Map interrogation of drugs that have similar gene expression signatures to that of high mood. A score of 1 indicates a maximal similarity with the gene expression effects of high mood, and a score of -1 indicates a maximal opposite effects to high mood.
[00042] FIG. 7 shows Comparison of BioM-10 Mood Prediction Score and actual mood scores in a secondary independent cohort of bipolar subjects (n=19). BP- bipolar. Mood scores are based on subject self -report on mood VAS scale administered at time of blood draw. For biomarkers: A - called Absent by MAS5 analysis. P - called Present by MAS5 analysis. M - called Marginally Present by MAS5 analysis. A is scored as 0, M as 0.5 and P as 1. BioM Mood Prediction Score is
based on the ratio of the sum of the scores for high mood biomarkers and sum of scores for low mood biomarkers, multiplied by 100. A cutoff score of 100 and above was used for high mood.
DETAILED DESCRIPTION
[00043] Patterns of changes in the blood that reflect whether a person has low mood (depression) or high mood (mania) are disclosed. In an embodiment, these changes are analyzed at the level of gene expression, and involved genes that generally are expressed in the brain.
[00044] Unlike cancer, in psychiatric disorders, one cannot perform a biopsy the target organ (brain).
Therefore, implementing a readily accessible peripheral readout in blood or any other non-brain tissue is highly useful. Blood-based screening is clinically easier to perform than a cerebro-spinal fluid (CSF) analysis or a nasal epithelium bipopsy.
[00045] Relying on the patients' self-report of symptoms and the clinician's impression of how ill the patient is alone do not necessarily provide an accurate diagnosis. Because patients' mind itself is affected in a mood disorder, their reporting of symptoms of how they feel may not be accurate or may not predict the nature of disease outcome. For example, patients aren't sure how ill they really are, and neither is the clinician- sometimes dismissing their symptoms, sometimes overestimating them. Therefore, an objective test for disease state, disease severity, and to measure response to treatment is highly desirable.
[00046] For example, for depression in general, a patient gets started on an antidepressant, and it may take weeks or months before it is known if the medication is working or if something else needs to be tried. A blood test for mood state for the biomarkers disclosed herein is able to objectively reflect whether a treatment works.
[00047] For example, for someone diagnosed as depressed but is in reality bipolar (manic- depressive), an antidepressant medication may be started only initially, and if bipolar, will be flipped by the antidepressant into a mixed state or frank mood elevation- hypomania or mania. With a panel of mood state markers, such unclear patients are monitored by repeated lab tests after the antidepressant is started, and if the markers indicate a shift beyond normal mood, to high mood, then medications can be systematically changed, a mood stabilizer added, and a potentially dangerous and certainly miserable episode for the patient averted. This approach is useful, especially in children and adolescents, who are hard to diagnose using traditional clinical criteria only, and in whom mood states rapidly change.
[00048] Sub-groups of biomarkers can be identified for different subpopulations, potential gender differences, age related differences, response to different medications. Biomarkers disclosed herein may be personalized and tailored to the individual, based on their biomarker profiles.
[00049] In an aspect, the biomarkers disclosed herein are (i) derived from fresh blood, not immortalized cell lines; (ii) capable of providing quantitative mood state information obtained at the time of the blood draw; (iii) were derived from comparisons of extremes of low mood and high mood in patients, as opposed to patients vs. normal controls (where the differences could be due to a
lot of other environmental factors, medication (side) effects vs. no medications; (iv) scored based on an all or nothing (Absent/Present) call for gene expression changes, not incremental changes in expression — statistically more robust and avoids false positives; (v) based on integration of multiple independent lines of evidence that permits extraction of signal from noise (large lists of genes), and prioritization of top candidates; and (vi) used to form the basis of prediction score algorithm based.
[00050] Integration of animal model and human data was used as a way of reducing the false- positives inherent in each approach and helping identify true biomarker molecules. Gene expression differences were measured in fresh blood samples from patients with bipolar disorder (manic- depressive illness) that have low mood vs. those that have high mood at the time of the blood draw. Separately, changes in gene expression were measured in the brains and bloods of a mouse pharmacogenomic model of bipolar disorder. Human blood gene expression data was integrated with animal model gene expression data, human genetic linkage/association data, and human postmortem data for cross-validating and prioritizing findings.
[00051 ] Gene expression changes in specific brain regions and blood from a pharmacogenomic animal model were used as cross-validators to identify human blood biomarkers for mood disorders. Pharmacogenomic mouse model of relevance to bipolar disorder includes treatments with an agonist of the illness/bipolar disorder-mimicking drug (methamphetamine) and an antagonist of the illness/ bipolar disorder-treating drug (valproate). The pharmacogenomic approach is a tool for tagging genes that may have pathophysiological relevance. As an added advantage, some of these genes may be involved in potential medication effects present in human blood data (FIG. 2).
[00052] In an aspect, human whole blood gene expression studies were initially performed in a primary cohort of bipolar subjects. Whole blood was used as a way of minimizing potential artifacts related to sample handling and separation of individual cell types, and also as a way of having a streamlined approach that lends itself well to scalability, future large scale studies in the field, and easy applicability in clinical laboratory settings and doctor's offices. Genes that were differentially expressed in low mood vs. high mood subjects were compared with: 1) the results of animal model brain and blood data, as well as 2) human genetic linkage/association data, and 3) human postmortem brain data, as a way of cross-validating the findings, prioritizing them, and identifying a short list of high probability biomarker genes (FIGS. 2A and 3).
[00053] A focused approach was used to analyze discrete quantitative phenotypic item (phene) — a Visual-Analog Scale (VAS) for mood. This approach avoids the issue of corrections for multiple comparisons that would arise if one were to look in a discovery fashion at multiple phenes in a comprehensive phenotypic battery (PhenoChipping) changed in relationship with all genes on a GeneChip microarray. Larger sample cohorts would be needed for the latter approach.
[00054] A panel of a subset of top candidate biomarker genes for mood state identified by the approach described herein was then used to generate a prediction score for mood state (low mood vs. high mood). This prediction score was compared to the actual self-reported mood scores from
bipolar subjects in the primary cohort (FIG. 4). This panel of mood biomarkers and prediction score were also examined in a separate independent cohort of psychotic disorders patients for which gene expression data and mood state data (FIG.5) were obtained, as well as in a second independent bipolar cohort (FIG.6).
[00055] Sample size for human subjects (n=29 for the primary bipolar cohort, n= 30 for the psychotic disorders cohort, n= 19 for the secondary bipolar cohort) is comparable to the size of cohorts for human postmortem brain gene expression studies in the field. Live donor blood samples instead of postmortem donor brains were studied, with the advantage of better phenotypic characterization, more quantitative state information, and less technical variability. This approach also permits repeated intra-subject measures when the subject is in different mood states.
[00056] The experimental approach for detecting gene expression changes relies on a well- established methodology — oligonucleotide microarrays. To avoid the possibility that some of the gene expression changes detected from a single biological experiment are biological or technical artifacts, the analyses described herein were designed to minimize the likelihood of having false positives, even at the expense of potentially having false negatives, due to the high cost in time and resources of pursuing false leads.
[00057] For the animal model work, using isogenic mouse strain affords a suitable control baseline of saline injected animals for the drug-injected animals. Three independent de novo biological experiments were performed, at different times, with different batches of mice. This overall design is geared to factor out both biological and technical variability. It is to be noted that the concordance between reproducible microarray experiments using the latest generations of oligonucleotide microarrays and other methodologies such as quantitative PCR, with their own attendant technical limitations, is estimated to be over 90%. For the human blood samples differential gene expression analyses, which are the results of single biological experiments, it has to be noted that the approach described herein used a very restrictive and technically robust, all or nothing induction of gene expression (change from Absent Call (A) to Present Call (P)). It is possible that not all biomarker genes for mood will show this complete induction related to state, but rather some will show modulation in gene expression levels, and are thus missed by a stringent filtering approach. Moreover, given the genetic heterogeneity and variable environmental exposure, it is possible, indeed likely, that not all subjects will show changes in all the biomarker genes.
[00058] To identify candidate biomarker genes, two stringency thresholds were used: changes in
75% of subjects, and in 60% of subjects with low mood vs. high mood. Moreover, the approach, as described herein, is predicated on the existence of multiple cross-validators for each gene that is called a candidate biomarker (FIG. 2A): 1) is it changed in human blood, 2) is it changed in animal model brain, 3) is it changed in animal model blood, 4) is it changed in postmortem human brain, and 5) does it map to a human genetic linkage locus. All these lines of evidence are the result of independent experiments. The virtues of this networked Bayesian approach are that, if one or
another of the nodes (lines of evidence) becomes questionable/non-functional upon further evidence in the field, the network is resilient and maintains functionality. Additional lines of evidence may move certain genes in the prioritization scoring. Using approaches described herein, a small number of genes were identified and prioritized as top biomarkers, out of the over 40,000 transcripts (about half of which are detected as Present in each subject) measured by the microarrays that were used.
[00059] A validation of the novel and non-obvious approach described herein is the fact that the biomarker panel showed sensitivity and specificity, of a comparable nature, in both independent replication cohorts (psychotic disorder cohort and secondary bipolar cohort). Thus, the approach of using a visual analog scale phene reflecting an internal subjective experience of well being or distress (as opposed to more complex and disease specific state/trait clinical instruments), and looking at extremes of state combined with robust differential expression based on A/P calls, and Convergent Functional Genomics prioritization, is able to identify state biomarkers for mood, that are, at least in part, independent of specific diagnoses or medications. Nevertheless, a comparison with existing clinical rating scales (FIG. 6), actimetry and functional neuroimaging, as well as analysis of biomarker data using such instruments may be of interest, as a way of delineating state vs. trait issues, diagnostic boundaries or lack thereof, and informing the design of clinical trials that may incorporate clinical and biomarker measures of response to treatment.
[00060] Human blood gene expression changes may be influenced by the presence or absence of both medications and drugs of abuse. While access to the subject's medical records was available and clinical information as part of the informed consent for the study, medication non-compliance, on the one hand, and substance abuse, on the other hand, are not infrequent occurrences in psychiatric patients. That medications and drugs of abuse may have effects on mood state and gene expression is in fact being partially modeled in the mouse pharmacogenomic model, with valproate and methamphetamine treatments respectively. The association of blood biomarkers with mood state is analyzed, regardless of the proximal causes, which could be diverse (see FIG. 2B). The performance the biomarkers identified herein can also be analyzed at a protein level, in larger cohorts of both genders, in different age groups, and in theragnostic settings- measuring responses to specific treatments/medications.
[00061 ] A subset of top candidate biomarker genes include five genes involved in myelination (
Mbp, Edg2, Mag, Pmp22 and Ugt8), six genes involved in growth factor signaling ( Fgfrl, Fzd3, Erbb3, Igfbp4, Igfbpό), one gene involved in light transduction (PDE6D), and one gene involved in neurofilaments (Nefh). These genes were selected as having a line of evidence (CFG) score of 4 or higher (Table 3). That means, in addition to the human blood data, these genes have at least two other independent lines of evidence implicating them in mood disorders and/or concordance of expression in human brain and blood. Using this cutoff score, about 13 genes (FIG. 3), all of which have evidence of differential expression in human postmortem brains from mood disorder patients.
[00062] It is intriguing that genes which have a well-established role in brain functioning may show changes in blood in relationship to psychiatric symptoms state (FIG. 3, Table 3 and Table 7), and moreover that the direction of change may be concordant with that found in human postmortem brain studies. It is possible that trait promoter sequence mutations or epigenetic modifications influence expression in both tissues (brain and blood), and that state dependent transcription factor changes that modulate the expression of these genes may be contributory as well.
[00063] The data provided herein demonstrate that genes involved in brain infrastructure changes
(myelin, growth factors) are prominent players in mood disorders, and are reflected in the blood profile. Myelin abnormalities have emerged as a common if perhaps non-specific denominator across a variety of neuropsychiatric disorders. For exmaple, Mbp, is a top scoring candidate biomarker (FIG. 3), associated with high mood state. The data provided herein regarding insulin growth factor signaling changes may provide an underpinning for the co-morbidity with diabetes and metabolic syndrome often encountered in mood disorder patients. These changes may be etiopathogenic, compensatory mechanisms, side-effects of medications, or results of illness - induced lifestyle changes (FIG. 2B).
[00064] The fact that many of the biomarkers identified are associated with a low mood state
(depression) as opposed to high mood state (FIG. 3 and Table 3) indicates that depression may have more of an impact on blood gene expression changes, perhaps through a neuro-endocrine- immunological axis, as part of a whole-body reaction to a perceived hostile environment.
[00065] Some of the candidate biomarker genes identified herein have no previous evidence for involvement in mood disorders (Tables 3 and 7). They merit further exploration in genetic candidate gene association studies, as well as comparison with emerging results from whole -genome association studies of bipolar disorder and depression. If needed, the composition of biomarker panels for mood can be refined or changed for different sub-populations, depending upon the availability of additional evidence. Panels containing different number of biomarkers and different biomarkers can be developed using the guidelines described herein and from the biomarkers identified herein. A large number of the biomarkers that would be of use in different panels and permutations are already present in the complete list of candidate biomarker genes identified (Tables 3 and 7).
[00066] An interrogation of a connectivity map with a signature query composed of the genes in a panel of top biomarkers for low mood and high mood revealed that sodium phenylbutyrate exerts the most similar effects to high mood, and novobiocin the most similar effects to low mood (FIG. 5). Sodium phenylbutirate is a medication used to treat hyperammonemia that also has histone deacetylase (HDAC) properties, cell survival and anti-apoptotic effects. The mood stabilizer drug valproate, also a HDAC inhibitor, as well as sodium phenylbutirate and another HDAC inhibitor, trichostatin A, were shown to induce alpha-synuclein in neurons through inhibition of HDAC and that this alpha-synuclein induction was critically involved in neuroprotection against glutamate
excitotoxicity. Human postmortem brain studies, as well as animal model and clinical studies have implicated glutamate abnormalities and histone deacetylase modulation as therapeutic targets in mood disorders. Novobiocin is an antibiotic drug that also has anti-tumor activity and apoptosis- inducing properties, through Hsp90 inhibition of Akt kinase an effect opposite to that of the valproate, trichostatin A and sodium phenylbutyrate (Table 6).
[00067] This connectivity map analysis with a mood panel genes provides an interesting external biological cross-validation for the internal consistency of the biomarker approach, as well as illustrates the utility of the connectivity map for non-hypothesis driven identification of novel drug treatments and interventions.
[00068] The results provided herein are consistent with a trophicity model for genes involved in mood regulation: cell survival and proliferation associated with high mood, and cell shrinkage and death associated with low mood. This perspective is both of evolutionary interest and pragmatic clinical importance. Nature may have selected primitive cellular mechanisms for analogous higher organism level-functions: survival and expansion in favorable, mood-elevating environments, withdrawal and death (apoptosis) in unfavorable, depressogenic environments. In this view, suicide is the organismal equivalent of cellular apoptosis (programmed cell death). Pragmatically, the results point to an unappreciated molecular and therapeutic overlap between two broad areas of medicine: mood disorders and cancer. This overlap is relevant for the clinical co-morbidity of mood disorders and cancer, as well as for empirical studies to evaluate the use of mood-regulating drugs in cancer, and of cancer drugs in mood disorders.
[00069] In clinical practice there is a high degree of overlap and co-morbidity between mood disorders, psychosis and substance abuse.The data in bipolar and psychotic disorder cohorts point to the issue of heterogeneity, overlap and interdependence of major psychiatric syndromes as currently defined by DSM-IV, and the need for a move towards comprehensive empirical profiling and away from categorical diagnostic classifications.
[00070] There are to date no reliable clinical laboratory blood tests for mood disorders. A translational convergent approach is disclosed herein to identify and prioritize blood biomarkers of mood state. Data demonstrate that blood biomarkers are effective in offering an unexpectedly informative window into brain functioning and disease state. Panels of such biomarkers may serve as a basis for objective clinical laboratory tests, a longstanding unmet need for psychiatry. Biomarker-based tests are extremely valuable for early intervention and prevention efforts, as well as monitoring response to various treatments. In conjunction with other relevant clinical information, biomarker tests play a desirable part of personalizing treatment to increase effectiveness and avoid adverse reactions- personalized medicine in psychiatry. Moreover, the biomarkers identified herein are useful for identifying or screening new neuropsychiatric drugs, at both a pre-clinical and clinical (Phase I, II and III) stages of the process.
[00071 ] Because brain is a highly specialized organ, it is not expected that the genes expressed in the brain would be present in the blood. Expression products of genes (e.g., RNA and protein) are generally tissue specific and are not expected or predicted to be expressed in an unrelated tissue., e.g., blood. Therefore, the finding that certain markers are expressed in blood and are predictable for mood disorder in patients is surprising and non-obvious. Not all markers differentially expressed in blood and are associated with predicting/diagnosing mood disorder are expressed in the brain. Similarly, not all genes that are differentially expressed in brain are expressed in blood for predicting/diagnosing mood disorder.
[00072] Human postmortem brain gene expression studies are generally susceptible to the issue of being underpowered, due to uncertainty of diagnosis and difficulty of accrual of large well- characterized cohorts, as well as due to genetic heterogeneity and the effect of variable environmental exposure on gene expression. Moreover, postmortem work artifacts (agonal interval, pH and tissue degradation) may influence gene expression changes.
[00073] For example, the data presented herein has not found reliable blood evidence for some of the top candidate genes derived from postmortem work, such as: Grial(glutamate receptor, ionotropic, AMPAl (alpha I)), Grikl (glutamate receptor, ionotropic, kainate 1), Gsk3b (glycogen synthase kinase 3 beta) and Arntl aryl hydrocarbon receptor nuclear translocator-like. Conversely, some of the top blood biomarkers identified herein do not appear to have reliable human postmortem brain evidence to date: Btgl (B -cell translocation gene 1, anti-proliferative), Ednrb (endothelin receptor type B), EIo vl5 (ELOVL family member 5, elongation of long chain fatty acids), and Trpcl (transient receptor potential cation channel, subfamily C, member 1).
[00074] A plurality of high probability blood candidate biomarker genes for mood state is identified.
In an aspect, a select panel of biomarkers include for example, five genes involved in myelination ( Mbp, Edg2, Mag, Pmp22 and Ugt8), six genes involved in growth factor signaling ( Fgfrl, Fzd3, Erbb3, Igfbp4, Igfbpό), one gene involved in light transduction (PDE6D), and one gene involved in neurofilaments (Nefh). . These genes have evidence of differential expression in human postmortem brains from mood disorder patients.
[00075] A predictive score developed based on a panel of 10 top candidate biomarkers, designated herein as BioM-10 (5 for high mood, 5 for low mood) shows specificity and sensitivity for high mood and low mood states.
[00076] A parallel profiling of cognitive and affective state was performed to investigate: (i) relationships between phenotypic items ("phenes"), including with objective motor measures, and (ii) relationships between subjects. This approach is useful in advancing current diagnostic classifications, and indicates that a combinatorial building-block structure underlies many psychiatric syndromes. The adaptation of microarray-based informatic tools for phenotypic analysis facilitates direct integration with gene expression profiling of blood in the same individuals, a strategy for molecular biomarker identification. Empirically derived clusterings of (endo)phenotypes
and of patients provide a basis for genetic, pharmacological, and imaging research, as well as clinical practice.
[00077] In an aspect, some of the candidate genes included in a panel of biomarkers used herein, have no previous evidence for involvement in mood disorders other than being mapped to bipolar genetic linkage loci (Table 3). These genes constitute novel candidate genes for bipolar disorder and depression. The composition of biomarker panels for mood can be refined or changed for different sub-populations. Panels containing different number of biomarkers and different biomarkers can be developed using the guidelines described herein and from the complete list of more than 600 biomarkers identified (Tables 3 and 7).
[00078] Any number of biomarkers can be used as a panel for diagnosis. The panel may contain equal number of biomarkers for high and low mood, or different number of biomarkers associated with low mood than high mood. The panel may be tested as a microarray or as any form of diagnostic analysis.
[00079] In the present disclosure, gene expression changes in specific brain regions and blood of animal models developed were studied to identify one or more of the biomarkers disclosed herein. Data were obtained from a pharmacogenomic mouse model of bipolar (involving treatments with a stimulant — methamphetamine, and a mood stabilizer — valproate) as a discovery engine and cross- validator for the identification of potential peripheral blood biomarkers (see Ogden et al., (2004), Candidate genes, pathways and mechanisms for bipolar (manic-depressive) and related disorders: an expanded convergent functional genomics approach. MoI Psychiatry 9(11): 1007-29.). Data from other animal models of bipolar disorder, such as genetic models, can be used (see Le-Niculescu et al. (2008) Phenomic, convergent functional genomic and biomarker studies in a stress-reactive genetic animal model of bipolar disorder and co-morbid alcoholism. American Journal of Medical Genetics Part B (Neuropsychiatric Genetics) 147(2): 134-66.
[00080] In an embodiment, a comprehensive analysis of: (i) fresh human blood gene expression data tied to illness state (quantitative measures of symptoms), (ii) cross-validation of blood gene expression profiling in conjunction with brain gene expression studies in animal models presenting key features of bipolar disorder, and (iii) integration of the results in the context of the available human genetic linkage/association and postmortem brain findings in the field is provided.
[00081 ] In an aspect, human blood gene expression studies were carried out in a primary group of bipolar subjects with low mood states and high mood states, as well as in a group of subjects with psychotic disorders (schizoaffective disorder, schizophrenia, and substance induced psychotic disorder), and in a second, independent, group of subjects with bipolar disorder. Genes that were differentially expressed in low mood vs. high mood subjects were compared with (i) the results of animal model data, (ii) human genetic linkage/association data and (iii) human postmortem brain data to cross-validate the results, prioritizing the genes, and identifying a short list of high
probability candidate biomarker genes. A panel of candidate biomarker genes identified by this approach was then used to generate a prediction score for mood state (low mood/depression vs. high mood/mania). This prediction score was compared to the actual self -reported mood scores from human subjects. The prediction score developed by the analysis of convergent data provided a highly correlative basis for the diagnosis of mood state.
[00082] In an embodiment, a panel of biomarkers illustrated in Table 3 is suitable. These biomarkers include Mbp, Edg2, Fgfrl, Fzd3, Mag, Pmp22, Ugt8, Erbb3, Igfbp4, Igfbpό, Pdeόd , Ptprm, Nefh, Atp2cl, Atxnl, Btgl, C6orfl82, Dicer 1, Dnajcό, Ednrb, Elovl5, Gnal, Klf5, Lin7a, Manea, Nupll, Pdeόb, Slc25a23, Synpo, Tgm2, Tjp3, Tpd52, Trpcl, Bclafl, Gosr2, Rdx, Wdr34, Bic, C8orf42, Dock9, Hrasls, Ibrdc2, P2ryl2, Speed, Vil2.
[00083] In an embodiment, a panel of about 10 biomarkers, e.g., Mbp, Edg2, Fgfrl, Fzd3, Mag,
Pmp22, Ugt8, Erbb3, Igfbp4, and Igfbpό, is suitable for diagnosing or predicting mood disorder.
[00084] In an embodiment, a panel of biomarkers include for example, Mbp, Edg2, Fzd3, Atxnl, and Ednrb that are increased in high mood (mania) condition.
[00085] An embodiment of a first sub-group of markers that are used for analysis include for example: Mbp, Edg2, Fzd3, Atxnl, Ednrb (markers for high mood) and Fgfrl, Mag, Pmp22, Ugt8, Erbb3 (markers for low mood). An embodiment includes a second sub-group e.g., Pde9a, Plxndl, Camk2d, Dio2, Lepr (markers for high mood) and Igfbp4, Igfbpό, Pdeόd, Ptprm, Nefh Atp2cl (markers for low mood). An embodiment includes a third sub-group e.g., Myom2, Nfix, Nt5m, Or7el04p, Rrpl (markers for high mood) and Atp2cl, Btgl, Elov5, Lrrcδb, Dicerl, Dnajcό (markers for low mood). An embodiment includes a fourth sub-group e.g., Sept2, Sfrs4, Sla2, Tex261, Ube2i (markers for high mood) and Gnal, Klf5, Lin7a, Manea, Nupll (markers for low mood). An embodiment includes a fifth sub-group e.g., Usp7, Zdhhc4, Znfl69, Cuedcl, Bivm (markers for high mood) and Pdeόb, Slc25a23, Synpo, Tgm2, Tjp3 (markers for low mood). An embodiment includes a sixth sub-group e.g., Hla-dqal, C20orf94, C21orf56, F1J10986, Loc91431 (markers for high mood), Tpd52, Trpcl, Phldal, Znf502, Amn (markers for low mood) or a combination of one or more of the sub-goups 1-6 disclosed herein. Sub-groups 1-5 constitute a representative example and any number of sub-groups that has about 5, 10, 15, 20, 25, 30, 35, 40, 45, 50, 55, 60, 65, 70, 75, 80, 85, 90, 95, 100, 200, 300, 400, 500, 600, or more markers selected from Table 7.
[00086] An embodiment of a first sub-group of markers that are used for analysis include for example: Mbp, Edg2, Fzd3, Atxnl, Ednrb (markers for high mood), Fgfrl, Mag, Pmp22, Ugt8, Erbb3 (markers for low mood); second subgroup includes for example: Pde9a, Plxndl, Camk2d, Dio2, Lepr (markers for high mood), Igfbp4, Igfbpό, Pdeόd, Ptprm, Nefh, (markers for low mood); third subgroup includes for example: Myom2, Nfix, Nt5m, Or7el04p, Rrpl (markers for high mood), Btgl, Elov5, Lrrcδb, Dicerl, Atp2cl, (markers for low mood); fourth subgroup includes for example: Sept2, Sfrs4, Sla2, Tex261, Ube2i (markers for high mood), Gnal, Klf5, Lin7a, Manea,
Dnajcό (markers for low mood); fifth subgroup includes for example: Usp7, Zdhhc4, Znfl69, Cuedcl, Bivm (markers for high mood), Pdeόb, Slc25a23, Synpo, Tgm2, Nupll (markers for low mood); and sixthy subgroup includes for example: Hla-dqal, C20orf94, C21orf56, Vil2, Loc91431 (markers for high mood), Tpd52, Trpcl, Phldal, Tjp3, Amn (markers for low mood) or a combination of one or more of the sub-goups 1-6 disclosed herein. Sub-groups 1-5 constitute a representative example and any number of sub-groups that has about 5, 10, 15, 20, 25, 30, 35, 40, 45, 50, 55, 60, 65, 70, 75, 80, 85, 90, 95, 100, 200, 300, 400, 500, 600, or more markers selected from Tables 3 and 7.
[00087] A panel of 36 biomarkers, as illustrated in an example described herein, is a suitable subset that is useful in diagnosing a mood disorder. Larger subsets that includes for example, 150, 200, 250, 300, 350, 400, 450, 500, 600 or about 700 markers are also suitable. Smaller subsets that include high-value markers including about 2, 5, 10, 15, 20, 25, 50, 75, and 100 are also suitable. A variable quantitative scoring scheme can be designed using any standard algorithm, such as a variable selection or a subset feature selection algorithms can be used. Both statistical and machine learning algorithms are suitable in devising a frame work to identify, rank, and analyze association between marker data and phenotypic data (e.g., mood disorders).
[00088] In an embodiment, a prediction score for each subject is derived based on the presence or absence of e.g., 10 biomarkers of the panel in their blood. Each of the 10 biomarkers gets a score of 1 if it is detected as "present" (P) in the blood form that subject, 0.5 if it is detected as "marginally present" (M), and 0 if it is called "absent" (A). The ratio of the sum of the high mood biomarker scores divided by the sum of the low mood biomarker scores is multiplied by 100, and provides a prediction score. If the ratio of high biomarker genes to low mood biomarker genes is 1 , i.e. the two sets of genes are equally represented, the mood prediction score is 1x100=100. The higher this score, the higher the predicted likelihood that the subject will have high mood. The predictive score was compared with actual self-reported mood scores in a primary cohort of subjects with a diagnosis of bipolar mood disorder. A prediction score of 100 and above had a 84.6 % sensitivity and a 68.8 % specificity for predicting high mood. A prediction score below 100 had a 76.9 % sensitivity and 81.3 % specificity for predicting low mood. The term "present" indicates that a particular biomarker is expressed to a detectable level, as determined by the technique used. For example, in an experiment involving a microarray or gene chip obtained from a commercial vendor Affymetrix (Santa Clara, CA), the embedded software rendered a "present" call for that biomarker. The term "present" refers to a detectable presence of the transcript or its translated protein/peptide and not necessarily reflects a relative comparion to for example, a sample from a normal subject. In other words, the mere presence or absence of a biomarker is assigned a value, e.g., 1 and a prediction score is calculated as described herein. The term "marginally present: refers to border line
expression level that may be less intense than the "present" but statistically different from being marked as "absent" (above background noise), as determined by the methodology used.
[00089] In an embodiment, a prediction score based on differential expression (instead of "present",
"absent") is used. For example, if a subject has a plurality of markers for high or low mood are differentially expressed, a prediction based on the differential expression of markers is determined. Differential expression of about 1.2 fold or 1.3 or 1.5 or 2 or 3 or 4 or 5-fold or higher for either increased or decreased levels can be used. Any standard statistical tool such as ANOVA is suitable for analysis of differential expression and association with high or low mood diagnosis or prediction.
[00090] A prediction based on the analysis of either high or low mood markers alone (instead of a ratio of high versus low mood markers) may also be practiced. If a plurality of high mood markers (e.g., about 6 out of 10 tested) are differentially expressed to a higher level compared to the low mood markers (e.g., 4 out of 10 tested), then a prediction or diagnosis of high mood status can be made by analyzing the expression levels of the high mood markers alone without factoring the expression levels of the low mood markers as a ratio.
[00091 ] In an embodiment, a detection algorithm uses probe pair intensities to generate a detection p-value and assign a Present, Marginal, or Absent call. Each probe pair in a probe set is considered as having a potential vote in determining whether the measured transcript is detected (Present) or not detected (Absent). The vote is described by a value called the Discrimination score [R]. The score is calculated for each probe pair and is compared to a predefined threshold Tau. Probe pairs with scores higher than Tau vote for the presence of the transcript. Probe pairs with scores lower than Tau vote for the absence of the transcript. The voting result is summarized as a p-value. The greater the number of discrimination scores calculated for a given probe set that are above Tau, the smaller the p-value and the more likely the given transcript is truly Present in the sample. The p-value associated with this test reflects the confidence of the Detection call.
[00092] Regarding detection p-value, a two-step procedure determines the Detection p-value for a given probe set. The Discrimination score [R] is calculated for each probe pair and the discrimination scores are tested against the user-definable threshold Tau. The detection Algorithm assesses probe pair saturation, calculates a Detection p-value, and assigns a Present, Marginal, or Absent call. In an embodiment, the default thresholds of the Affymetrix MAS 5 software were used.
[00093] In spiking experiments by the manufacturer to establish default thresholds (adding of known quantities of test transcripts to a mixture, to measure the sensitivity of the Affymetrix MAS 5 detection algorithm) 80% of spiked transcripts are called Present at a concentration of 1.5 pM. This concentration corresponds to approximately one transcript in 100,000 or 3.5 copies per cell. The false positive rate of making a Present call was roughly 10%, as noted by 90% of the transcripts being called Absent when not spiked into the sample (0 pM concentration).
[00094] The term "predictive" or the term "prognostic" does not imply 100% predictive ability. The use of these terms indicates that subjects with certain characteristics are more likely to experience a particular mood state or clinical outcome than subjects who do not have such characteristics. For example, characteristics that determine the prediction include one or more of the biomarkers for the mood disorder disclosed herein. The phrase "clinical outcome" refers to biological or biochemical or physical or physiological responses to treatments or therapeutic agents that are generally prescribed for that condition compared to a condition would occur in the absence of any treatment. A "clinically positive outcome" does not necessarily indicate a cure, but could indicate a lessening of symptoms experienced by a subject.
[00095] The terms "marker" and "biomarker" are synonymous and as used herein, refer to the presence or absence or the levels of nucleic acid sequences or proteins or polypeptides or fragments thereof to be used for associating or correlating a phenotypic state. A biomarker includes any indicia of the level of expression of an indicated marker gene. The indicia can be direct or indirect and measure over- or under-expression of the gene given the physiologic parameters and in comparison to an internal control, normal tissue or another phenotype. Nucleic acids or proteins or polypeptides or portions thereof used as markers are contemplated to include any fragments thereof, in particular, fragments that can specifically hybridize with their intended targets under stringent conditions and immunologically detectable fragments. One or more markers may be related. Marker may also refer to a gene or DNA sequence having a known location on a chromosome and associated with a particular gene or trait. Genetic markers associated with certain diseases or for pre-disposing disease states can be detected in the blood and used to determine whether an individual is at risk for developing a disease. Levels of gene expression and protein levels are quantifiable and the variation in quantification or the mere presence or absence of the expression may also serve as markers. Using proteins/peptides as biomarkers can include any method known in the art including, without limitation, measuring amount, activity, modifications such as glycosylation, phosphorylation, ADP- ribosylation, ubiquitination, etc., imunohistochemistry (IHC).
[00096] As used herein, "array" or "microarray" refers to an array of distinct polynulceotides, oligonucleotides, polypeptides, or oligopeptides synthesized on a substrate, such as paper, nylon, or other type of membrane, filter, chip, glass slide, or any other suitable solid support. Arrays also include a plurality of antibodies immobilized on a support for detecting specific protein products. There are several microarrays that are commercially available. A microarray may include one or more biomarkers disclosed herein. A panel of about 20 biomarkers as nucleic acid fragments can be included in an array. The nucleic acid fragments may include oligonucleotides or amplified partial or complete nucleotide sequences of the biomarkers. The term "consisting essentially of generally refers to a collection of markers that substantially affects the determination of the disorder and may include other components such as controls. For example, a microarray consists essentially of markers from Table 3.
[00097] In an embodiment, the microarray is prepared and used according to the methods described in U.S. Pat. No. 5,837,832, Chee et al.; PCT application WO95/11995, Chee et al.; Lockhart et al., 1996. Nat Biotech., 14:1675-80; and Schena et al., 1996. Proc. Natl. Acad. Sci. 93:10614-619, all of which are herein incorporated by reference to the extent they relate to methods of making a microarray. Arrays can also be produced by the methods described in Brown et al., U.S. Pat. No. 5,807,522. Arrays and microarrays may be referred to as "DNA chips" or "protein chips." [00098] A variety of clustering methods are available for microarray-based gene expression analysis.
See for example, Shamir & Sharan (2002) Algorithmic approaches to clustering gene expression data. In Current Topics In Computational Molecular Biology (Edited by: Jiang T, Xu Y, Smith T). 2002, 269-300; Tamames et al., (2002): Bioinformatics methods for the analysis of expression arrays: data clustering and information extraction, J Biotechnol, 98:269-283.
[00099] "Therapeutic agent" means any agent or compound useful in the treatment, prevention or inhibition of mood disorder or a mood-related disorder.
[000100] The term "condition" refers to any disease, disorder or any biological or physiological effect that produces unwanted biological effects in a subject.
[000101 ] The term "subject" refers to an animal, or to one or more cells derived from an animal. The animal may be a mammal including humans. Cells may be in any form, including but not limited to cells retained in tissue, cell clusters, immortalized cells, transfected or transformed cells, and cells derived from an animal that have been physically or phenotypically altered.
[000102] Any body fluid of an animal can be used in the methods of the invention. Suitable body fluids include a blood sample (e.g., whole blood, serum or plasma), urine, saliva, cerebrospinal fluid, tears, semen, and vaginal secretions. Also, lavages, tissue homogenates and cell lysates can be utilized.
[000103] Many different methods can be used to determine the levels of markers. For example, protein arrays, protein chips, cDNA microarrays or RNA microarrays are suitable. More specifically, one of ordinary skill in the art will appreciate that in one example, a microarray may comprise the nucleic acid sequences representing genes listed in Table 1. For example, functionality, expression and activity levels may be determined by immunohistochemistry, a staining method based on immunoenzymatic reactions uses monoclonal or polyclonal antibodies to detect cells or specific proteins. Typically, immunohistochemistry protocols include detection systems that make the presence of markers visible (to either the human eye or an automated scanning system), for qualitative or quantitative analyses. Mass-spectrometry, chromatography, real-time PCR, quantitative PCR, probe hybridization, or any other analytical method to determine expression levels or protein levels of the markers are suitable. Such analysis can be quantitative and may also be performed in a high-through put fashion. Cellular imaging systems are commercially available that combine conventional light microscopes with digital image processing systems to perform quantitative analysis on cells and tissues, including immunostained samples. (See e.g. the CAS-200
System (Becton, Dickinson & Co.))- Some other examples of methods that can be used to determine the levels of markers include immunohistochemistry, automated systems, quantitative IHC, semiquantitative IHC and manual methods. Other analytical systems include western blotting, immunoprecipitation, fluorescence in situ hybridization (FISH), and enzyme immunoassays.
[000104] The term "diagnosis", as used in this specification refers to evaluating the type of disease or condition from a set of marker values and/or patient symptoms where the subject is suspected of having a disorder. This is in contrast to disease predisposition, which relates to predicting the occurrence of disease before it occurs, and the term "prognosis", which is predicting disease progression in the future based on the marker levels/patterns.
[000105] The term "correlating," as used in this specification refers to a process by which one or more biomarkers are associated to a particular disease state, e.g., mood disorder. In general, identifying such correlation or association involves conducting analyses that establish a statistically significant association- and/or a statistically significant correlation between the presence (or a particular level) of a marker or a combination of markers and the phenotypic trait in the subject. An analysis that identifies a statistical association (e.g., a significant association) between the marker or combination of markers and the phenotype establishes a correlation between the presence of the marker or combination of markers in a subject and the particular phenotype being analyzed.
[000106] This relationship or association can be determined by comparing biomarker levels in a subject to levels obtained from a control population, e.g., positive control— diseased (with symptoms) population and negative control— disease-free (symptom-free) population. The biomarkers disclosed herein provide a statistically significant correlation to diagnosis at varying levels of probability. Subsets of markers, for example a panel of about 20 markers, each at a certain level range which are a simple threshold, are said to be correlative or associative with one of the disease states. Such a panel of correlated markers can be then be used for disease detection, diagnosis, prognosis and/or treatment outcome. Preferred methods of correlating markers is by performing marker selection by any appropriate scoring method or by using a standard feature selection algorithm and classification by known mapping functions. A suitable probability level is a 5% chance, a 10% chance, a 20% chance, a 25% chance, a 30% chance, a 40% chance, a 50% chance, a 60% chance, a 70% chance, a 75% chance, a 80% chance, a 90% chance, a 95% chance, and a 100% chance. Each of these values of probability is plus or minus 2% or less. A suitable threshold level for markers of the present invention is about 25 pg/mL, about 50 pg/mL, about 75 pg/mL, about 100 pg/mL, about 150 pg/mL, about 200 pg/mL, about 400 pg/mL, about 500 pg/mL, about 750 pg/mL, about 1000 pg/mL, and about 2500 pg/mL.
[000107] Prognosis methods disclosed herein that improve the outcome of a disease by reducing the increased disposition for an adverse outcome associated with the diagnosis. Such methods may also be used to screen pharmacological compounds for agents capable of improving the patient's prognosis, e.g., test agents for mood disorders.
[000108] The analysis of a plurality of markers, for example, a panel of about 20 or 10 markers may be carried out separately or simultaneously with one test sample. Several markers may be combined into one test for efficient processing of a multiple of samples. In addition, one skilled in the art would recognize the value of testing multiple samples (for example, at successive time points) from the same individual. Such testing of serial samples may allow the identification of changes in marker levels over time, within a period of interest, or in response to a certain treatment.
[000109] In another embodiment, a kit for the analysis of markers includes for example, devises and reagents for the analysis of at least one test sample and instructions for performing the assay. Optionally, the kits may contain one or more means for using information obtained from marker assays performed for a marker panel to diagnose mood disorders. Probes for markers, marker antibodies or antigens may be incorporated into diagnostic assay kits depending upon which markers are being measured. A plurality of probes may be placed in to separate containers, or alternatively, a chip may contain immobilized probes. In an embodiment, another container may include a composition that includes an antigen or antibody preparation. Both antibody and antigen preparations may preferably be provided in a suitable titrated form, with antigen concentrations and/or antibody titers given for easy reference in quantitative applications.
[000110] The kits may also include a detection reagent or label for the detection of specific reaction between the probes provided in the array or the antibody in the preparation for immunodetection. Suitable detection reagents are well known in the art as exemplified by fluorescent, radioactive, enzymatic or otherwise chromogenic ligands, which are typically employed in association with the nucleic acid, antigen and/or antibody, or in association with a secondary antibody having specificity for first antibody. Thus, the reaction is detected or quantified by means of detecting or quantifying the label. Immunodetection reagents and processes suitable for application in connection with the novel methods of the present invention are generally well known in the art.
[000111] The reagents may also include ancillary agents such as buffering agents and protein stabilizing agents, e.g., polysaccharides and the like. The diagnostic kit may further include where necessary agents for reducing background interference in a test, agents for increasing signal, software and algorithms for combining and interpolating marker values to produce a prediction of clinical outcome of interest, apparatus for conducting a test, calibration curves and charts, standardization curves and charts, and the like.
[000112] In some embodiments, the methods of correlating biomarkers with treatment regimens can be carried out using a computer database. Computer-assisted methods of identifying a proposed treatment for mood disorders are suitable. The method involves the steps of (a) storing a database of biological data for a plurality of patients, the biological data that is being stored including for each of said plurality of patients (i) a treatment type, (ii) at least one marker associated with a mood disorder and (iii) at least one disease progression measure for the mood disorder from which treatment efficacy can be determined; and then (b) querying the database to determine the
dependence on the marker of the effectiveness of a treatment type in treating the mood disorder, to thereby identify a proposed treatment as an effective treatment for a subject carrying the marker correlated with the mood disorder.
[000113] In an embodiment, treatment information for a patient is entered into the database (through any suitable means such as a window or text interface), marker information for that patient is entered into the database, and disease progression information is entered into the database. These steps are then repeated until the desired number of patients has been entered into the database. The database can then be queried to determine whether a particular treatment is effective for patients carrying a particular marker, not effective for patients carrying a particular marker, and the like. Such querying can be carried out prospectively or retrospectively on the database by any suitable means, but is generally done by statistical analysis in accordance with known techniques, as described herein.
EXAMPLES
[000114] The following examples are to be considered as exemplary and not restrictive or limiting in character and that all changes and modifications that come within the spirit of the disclosure are desired to be protected.
EXAMPLE 1 Experimental framework for identification of biomarkers used in diagnosis of mood disorders
[000115] Gene expression changes in specific brain regions and blood from a pharmacogenomic animal model were used as cross-validators for identification of potential human blood biomarkers. Pharmacogenomic mouse model of relevance to bipolar disorder consists of treatments with an agonist of the illness/bipolar disorder-mimicking drug (methamphetamine) and an antagonist of the illness/ bipolar disorder-treating drug (valproate). The pharmacogenomic approach is a tool for tagging genes that may have pathophysiological relevance.
[000116] Human blood gene expression studies were carried out in a cohort of bipolar subjects.
Genes that were differentially expressed in low mood vs. high mood subjects were compared with: 1) the results of the animal model brain and blood data, as well as 2) published human genetic linkage/association data, and 3) human postmortem brain data, as a way of cross-validating the findings, prioritizing them, and coming up with a short list of high probability candidate biomarker genes (FIGS. 2A and 3).
[000117] A Visual-Analog Scale (VAS) for mood was used for the scoring analysis. This approach avoids the issue of corrections for multiple comparisons that would arise if multiple symptom (phenotypic) socres (i.e. "phenes") were analyzed in a comprehensive phenotypic battery changed in relationship with all genes on a GeneChip microarray. Larger sample cohorts would be needed for the latter approach.
[000118] A panel of top candidate biomarker genes for mood state identified was then used to generate a prediction score for mood state (low mood vs. high mood). This prediction score was
compared to the actual self-reported mood scores from bipolar subjects (FIG. 4). This panel of mood biomarkers and prediction score were examined in a separate independent cohort of psychotic disorders patients for which gene expression data and mood state data is available (FIG. 5), and in a second independent cohort of bipolar disorder subjects (FIG.6).
[000119] Sample size for human subjects (n=29 for the bipolar cohort, n= 30 for the psychotic disorders cohort) is comparable to the size of cohorts for human postmortem brain gene expression studies. Live donor blood samples were used instead of postmortem donor brains, with the advantage of better phenotypic characterization, more quantitative state information, and less technical variability.
[000120] For the animal model work, isogenic mouse strain was used. Three independent de novo biological experiments were performed, at different times, with different batches of mice. This overall design is geared to factor out both biological and technical variability. Concordance between reproducible microarray experiments using the latest generations of oligonucleotide microarrays and other methodologies such as quantitative PCR, with their own attendant technical limitations, is estimated to be over 90%. For the human blood samples gene expression analyses, which are the results of single biological experiments, a very restrictive, all or nothing induction of gene expression (change from Absent Call to Present Call). It is possible that not all biomarker genes for mood may show this complete induction related to state, but rather some may show modulation in gene expression levels, and are thus missed by this filtering. Moreover, given the genetic heterogeneity and variable environmental exposure, it is possible, indeed likely, that not all subjects may show changes in all the biomarker genes. Hence two stringency thresholds were used: changes in 75% of subjects, and in 60% of subjects with low mood vs. high mood. This approach is predicated on the existence of multiple cross-validators for each gene that is called a candidate biomarker (FIG. 2B): 1) is it changed in human blood, 2) is it changed in animal model brain, 3) is it changed in animal model blood, 4) is it changed in postmortem human brain, and 5) does it map to a human genetic linkage locus. All these lines of evidence are the result of independent experiments.
[000121 ] Human blood gene expression changes may be influenced by the presence or absence of both medications and drugs of abuse. That medications and drugs of abuse may have effects on mood state and gene expression is in fact being partially modeled in the mouse pharmacogenomic model, with valproate and methamphetamine treatments respectively. It is the association of blood biomarkers with mood state that is the primary purpose of this analysis, regardless of the proximal causes, which could be diverse (see FIG. 2B).
[000122] The human subjects used in this example included those who were directly recruited, and data collected in other procedures/settings. Blood samples were collected.
[000123] Human data from three independent cohorts of patients are presented. One cohort consists of 29 subjects with bipolar I disorder. The second cohort consists of 30 subjects with psychotic disorders (schizophrenia, schizoaffective disorder, and substance induced psychosis). The third
cohort consists of 19 subjects with bipolar I disorder. The diagnosis is established by a structured clinical interview- Diagnostic Interview for Genetic Studies (DIGS), which has details on the course of illness and phenomenology, and is the scale used by the Genetics Initiative Consortia for both Bipolar Disorder and Schizophrenia.
[000124] Subjects included men and women over 18 years of age. A demographic breakdown is shown in Table 1. Initial studies were focused primarily on a male population, due to the demographics of the catchment area (primarily male in a VA Medical Center), and to minimize any potential gender-related state effects on gene expression, which would have decreased the discriminative power of the analysis for the sample size used. Subjects were recruited from the general population, the patient population at the IU school of Medicine, the Indianapolis VA Medical Center, as well as various facilities that serve people with mental illnesses in Indiana. The subjects were recruited largely through referrals from care providers, the use of brochures left in plain sight in public places and mental health clinics, and through word of mouth. Subjects were excluded if they had significant medical or neurological illness or had evidence of active substance abuse or dependence. All subjects understood and signed informed consent forms before assessments began. All subjects signed an informed consent form detailing the research goals, procedure, caveats and safeguards. Subjects completed diagnostic assessments (DIGS), and then a visual-analog scale for mood (VAS Mood) at the time of blood draw.
[000125] Human blood gene expression experiments and analysis:
[000126] RNA extraction: 2.5-5 ml of whole blood was collected into each PaxGene tube by routine venipuncture. PaxGene tubes contain proprietary reagents for the stabilization of RNA. The cells from whole blood will be concentrated by centrifugation, the pellet washed, resuspended and incubated in buffers containing Proteinase K for protein digestion. A second centrifugation step will be done to remove residual cell debris. After the addition of ethanol for an optimal binding condition the lysate is applied to a silica-gel membrane/column. The RNA bound to the membrane as the column is centrifuged and contaminants are removed in three wash steps. The RNA is then eluted using DEPC-treated water.
[000127] Globin reduction: To remove globin mRNA, total RNA from whole blood is mixed with a biotinylated Capture Oligo Mix that is specific for human globin mRNA. The mixture is then incubated for 15 min to allow the biotinylated oligonucleotides to hybridize with the globin mRNA. Streptavidin Magnetic Beads are then added, and the mixture is incubated for 30 min. During this incubation, streptavidin binds the biotinylated oligonucleotides, thereby capturing the globin mRNA on the magnetic beads. The Streptavidin Magnetic Beads are then pulled to the side of the tube with a magnet, and the RNA, depleted of the globin mRNA, is transferred to a fresh tube. The treated RNA is further purified using a rapid magnetic bead-based purification method. This consists of adding an RNA Binding Bead suspension to the samples, and using magnetic capture to wash and elute the GLOBINclear RNA.
[000128] Sample Labeling: Sample labeling is performed using the Ambion MessageAmp II-
BiotinEnhanced aRNA amplification kit. The procedure is briefly outlined herein and involves the following steps:
[000129] 1. Reverse Transcription to Synthesize First Strand cDNA is primed with the T7 Oligo(dT)
Primer to synthesize cDNA containing a T7 promoter sequence.
[000130] 2. Second Strand cDNA Synthesis converts the single-stranded cDNA into a double- stranded DNA (dsDNA) template for transcription. The reaction employs DNA Polymerase and RNase H to simultaneously degrade the RNA and synthesize second strand cDNA.
[000131 ] 3. cDNA Purification removes RNA, primers, enzymes, and salts that would inhibit in vitro transcription.
[000132] 4. In Vitro Transcription to Synthesize aRNA with Biotin-NTP Mix generates multiple copies of biotin-modified aRNA from the double- stranded cDNA templates; this is the amplification step.
[000133] 5. aRNA Purification removes unincorporated NTPs, salts, enzymes, and inorganic phosphate to improve the stability of the biotin-modified aRNA.
[000134] Microarrays: Biotin labeled aRNA are hybridized to Affymetrix HG-U133 Plus 2.0
GeneChips according to manufacturer's protocols (Affymetrix Inc., Santa Clara, CA). All GAPDH 375' ratios should be less than 2.0 and backgrounds under 50. Arrays are stained using standard Affymetrix protocols for antibody signal amplification and scanned on an Affymetrix Gene Array 2500 scanner with a target intensity set at 250. Present/ Absent calls are determined using GCOS software with thresholds set at default values.
[000135] The human blood gene expression experiments and analysis was performed at two levels: (i) high threshold >75%; 3x enrichment, and (ii) low threshold (>60%; 1.5x enrichment). The animal model data included pharmacogenomic models that involved DBP KO mouse.
[000136] The cross-validation and integration of data from human blood gene expression, mouse models and other mouse and human data were processed through a convergent functional genomics approach.
[000137] For generating the animal model data, standard pharmacogenomic testing methodologies were adopted. All experiments were performed with male C57/BL6 mice, 8 to 12 weeks of age, obtained from Jackson Laboratories (Bar Harbor, ME), and acclimated for at least two weeks in an animal facility prior to any experimental manipulation. The bipolar pharmacogenomic model included Methamphetamine and Valproate treatments in mice (see Ogden et al. (2004)). Briefly, mice were treated by intraperitoneal injection with either single-dose saline, methamphetamine (10 mg/kg), valproate (200 mg/kg), or a combination of methamphetamine and valproate (10 mg/kg and 200 mg/kg respectively). Three independent de novo biological experiments were performed at different times. Each experiment included three mice per treatment condition, for a total of 9 mice per condition across the three experiments.
[000138] RNA extraction and microarray analysis: Standard techniques were used to obtain total
RNA (22 gauge syringe homogenization in RLT buffer) and to purify the RNA (RNeasy mini kit, Qiagen, Valencia, CA) from micro-dissected mouse brain regions. For the human and whole mouse blood RNA extraction, PAXgene blood RNA extraction kit (PreAnalytiX, a QIAGEN/BD company) was used, followed by GLOBINclear™-Human or GLOBINclear™-Mouse/Rat (Ambion/ Applied Biosystems Inc., Austin, TX) to remove the globin mRNA. All the methods and procedures were carried out as per manufacturer's instructions. The quality of the total RNA was confirmed using an Agilent 2100 Bioanalyzer (Agilent Technologies, Palo Alto, CA). The quantity and quality of total RNA was also independently assessed by 260 nm UV absorption and by 260/280 ratios, respectively (Nanodrop spectrophotometer). Starting material of total RNA labeling reactions was kept consistent within each independent microarray experiment.
[000139] For the mouse analysis, blood or brain tissue regions from 3 mice were pooled for each experimental condition, and equal amounts of total RNA extracted from tissue samples or blood was used for labeling and microarray assays. Mouse Genome 430 2.0 arrays (Affymetrix, Santa Clara, CA) were used. The GeneChip™ Mouse Genome 430 2.0 Array contain over 45,000 probe sets that analyze the expression level of over 39,000 transcripts and variants from over 34,000 well- characterized mouse genes. For the human analysis, Affymetrix Human Genome U133 Plus 2.0 GeneChip with over 40,000 genes and ESTs were used. Standard manufacturer's protocols were used to reverse transcribe the messenger RNA and generate biotinlylated cRNA. The amount of cRNA used to prepare the hybridization cocktail was kept constant intra-experiment. Samples were hybridized at 45°C for 17 hours under constant rotation. Arrays were washed and stained using the Affymetrix Fluidics Station 400 and scanned using the Affymetrix Model 3000 Scanner controlled by GCOS software. All sample labeling, hybridization, staining and scanning procedures were carried out as per manufacturer's recommendations.
[000140] Quality control: All arrays were scaled to a target intensity of 1000 using Affymetrix MASv
5.0 array analysis software. Quality control measures including 375' ratios for GAPDH and beta- actin, scaling factors, background, and Q values were within acceptable limits.
[000141 ] Microarray data analysis: Data analysis was performed using Affymetrix Microarray Suite
5.0 software (MAS v5.0). Default settings were used to define transcripts as present (P), marginal (M), or absent (A). For the pharmacogenomic mouse model, a comparison analysis was performed for each drug treatment, using its corresponding saline treatment as the baseline. "Signal," "Detection," "Signal Log Ratio," "Change," and "Change p-value," were obtained from this analysis. Only transcripts that were called Present in at least one of the two samples (saline or drug) intra-experiment, and that were reproducibly changed in the same direction in at least two out of three independent experiments, were analyzed further. For the DBP knock-out mice, a comparison analysis was performed for each KO saline and KO Meth mouse, using WT saline mice as the baseline "Signal," "Detection," "Signal Log Ratio," "Change," and "Change p-value," were
obtained from this analysis. Only transcripts that were called Present in at least one of the two samples in a comparison pair, and that were reproducibly changed in the same direction in at least six out of 9 comparisons, were analyzed further.
EXAMPLE 2 Analysis and identification of biomarkers
[000142] Gene expression profiling studies were performed with peripheral whole blood samples from a primary cohort of 29 human subjects with bipolar I disorder (27 males, 2 females) (Table 1).13 had low self-reported mood scores (below 40) on the Visual-Analog (VAS) Mood Scale (Figure 1), and 13 had high self-reported mood scores (above 60). 3 of them had intermediate mood scores (between 40 and 60). Their mood scores at time of blood collection were used as a way of narrowing the field and identifying candidate biomarker genes for mood. Only t all or nothing gene expression differences were identified by Absent (A) vs. Present (P) Calls in the Affymetrix MAS software. Genes whose expression is detected as Absent in the Low Mood subjects and detected as Present in the High Mood subjects were classified, as being candidate biomarker genes for elevated mood state (mania). Conversely, genes whose expression is detected as Present in the Low Mood subjects and Absent in the High Mood subjects are being classified as candidate biomarker genes for low mood state (depression) (Tables 2 and 3 ). It is possible that some of the genes associated with high mood state or low mood state may not necessarily be involved in the induction of that state, but rather in its suppression as part of a homeostatic regulatory networks or treatment response mechanisms ( similar conceptually to oncogenes and tumor-suppressor genes).
[000143] Two thresholds for analysis of gene expression differences between low mood and high mood (Table 2) were undertaken. First, a high threshold was used, with at least 75% of subjects in a cohort showing a change in expression from Absent to Present between low and high mood ( reflecting an at least 3 fold mood state related enrichment of the genes thus filtered) As psychiatric disorders are clinically and (likely) genetically heterogeneous, with different combinations of genes and biomarkers present in different subgroups, a low threshold was also used, with at least 60% of subjects in a cohort showing a change in expression from Absent to Present between low and high mood ( reflecting an at least 1.5 fold mood state related enrichment of the genes thus filtered). The high threshold identified candidate biomarker genes that are more common for all subjects, with a lower risk of false positives, whereas the lower threshold identified genes that are present in more restricted subgroups of subjects, with a lower risk of false negatives. The high threshold candidate biomarker genes have, as an advantage, a higher degree of reliability, as they are present in at least 75% of all subjects with a certain mood state (high or low) tested. They may reflect common aspects related to mood disorders across a diverse subject population, but may also be a reflection of the effects of common medications used in the population tested, such as mood stabilizers. The low threshold genes may have lower reliability compared to the high threshold, being present in at least
60% of the subject population tested, but, nevertheless, captures more of the diversity of genes and biological mechanisms present in a genetically diverse human subject population.
[000144] By cross-validating with animal model and other human datasets (FIG. 2A) using CFG, a shorter list of genes was identified for which there are external corroborating line of evidence (e.g., human genetic evidence, human postmortem brain data, animal model brain and blood data) linking them to mood disorders (bipolar disorder, depression), thus reducing the risk of false positives. This cross-validation identifies candidate biomarkers that are more likely directly related to the relevant neuropathology, as opposed to being potential artifactual effects or indirect effects of lifestyle, environment, etc.
[000145] Using the approach described herein, out of over 40,000 genes and ESTs on the
Affymetrix Human Genome U133 Plus 2.0 GeneChip, by using the high threshold, in an embodiment, about 21 novel candidate biomarker genes (13 genes with known functions and 7 ESTs) (Table 3), of which 8 had at least one line of prior independent evidence for potential involvement in mood disorders (i.e. CFG score of 3 or above). In addition to the high threshold genes, by using the low threshold, a larger list totaling 661 genes (539 genes and 122 ESTs) (Table 7), of which an additional 24 had at least two lines of prior independent evidence for potential involvement in mood disorders (i.e. CFG score of 3 or above). Of interest, four of the low threshold candidate biomarker genes (Bclafl and Rdx8, Gosr2 and Wdr3413) are changed in expression in the same direction, in lymphoblastoid cell lines (LCLs) from bipolar subjects.
[000146] Making a combined list of all the high value candidate biomarker genes identified as described above- including the high threshold genes with at least on other external line of evidence (8) and of the additional low threshold genes with at least two other external lines of evidence (24), and the low threshold genes with prior LCL evidence (4), a list of 36 candidate biomarker genes for mood, prioritized based on CFG score (Table 3) was developed.
[000147] In an embodiment, selecting the 5 top scoring candidate biomarkers for high mood
(MBP, EDG2, FZD3, ATXNl, EDNRB) and the 5 top scoring candidate biomarkers for low mood (FGFRl, MAG, PMP22, UGT8, ERBB3), a panel of 10 biomarkers for mood disorder was developed that has diagnostic and predictive value.
[000148] To test the predictive value of a panel (e.g, the BioM-10 Mood panel), a cohort of 29 bipolar disorder subjects, containing the 26 subjects (13 low mood, 13 high mood) from which the candidate biomarker data was derived, as well as 3 additional subjects with mood in the intermediate range (self -reported mood scores between 40 and 60) was used. A prediction score for each subject, based on the presence or absence of the 10 biomarkers of the panel in the blood GeneChip data. Each of the 10 biomarkers gets a score of 1 if it is detected as Present (P) in the blood form that subject, 0.5 if it is detected as Marginally Present (M), and 0 if it is called Absent (A). The ratio of the sum of the high mood biomarker scores divided by the sum of the low mood biomarker scores is multiplied by 100, and provides a prediction score. If the ratio of high biomarker genes to low mood biomarker
genes is 1 , i.e. the two sets of genes are equally represented, the mood prediction score is 1x100=100. The higher this score, the higher the predicted likelihood that the subject will have high mood. The predictive score was compared with actual self -reported mood scores in the primary cohort of subjects with a diagnosis of bipolar mood disorder (n=29). A prediction score of 100 and above had a 84.6 % sensitivity and a 68.8 % specificity for predicting high mood. A prediction score below 100 had a 76.9 % sensitivity and 81.3 % specificity for predicting low mood (Table 4A and FIG. 4).
[000149] Table 5 shows a representative sample of biological roles based on ingenuity pathway analysis (IPA) of biological roles categories among the top blood candidate biomarker genes for mood.
[000150] Human blood gene expression analysis was conducted in an independent cohort consisting of 30 subjects with other psychotic disorders (schizophrenia, schizoaffective disorder, substance induced psychosis), who also had mood state scores obtained at the time of the blood draw. The subjects in the psychosis cohort also had a distribution of low (n=9), intermediate (n=7) and high (n=14) mood scores. This cohort was used as a way to verify the predictive power of the mood state biomarker panel, independent of a bipolar disorder diagnosis.
[000151 ] In the psychotic disorders cohort (n=30), with various psychotic disorders diagnoses, a prediction score of 100 and above had a 71.4 % sensitivity and a 62.5 % specificity for predicting high mood. A prediction score below 100 had a 66.7 % sensitivity and 61.9 % specificity for predicting low mood (Table 4B and FIG. 5).
[000152] Human blood gene expression analysis was also conducted in a second independent bipolar disorder cohort, subsequently collected, consisting of 19 subjects. The subjects in the secondary bipolar cohort had a distribution of low (n=6), intermediate (n=3) and high (n=10) mood scores. The second bipolar cohort was used as a replication cohort, to verify the predictive power of the mood state biomarker panel identified by analysis of data from the primary bipolar cohort.
[000153] In the second bipolar cohort (n=19), a prediction score of 100 and above had a 70.0 % sensitivity and a 66.7 % specificity for predicting high mood. A prediction score below 100 had a 66.7 % sensitivity and 61.5 % specificity for predicting low mood (Table 4C and FIG. 6).
[000154] The primary and secondary bipolar mood disorder cohorts are apriori more related and germane to mood state biomarkers identification, but may have blood gene expression changes due at least in part to the common pharmacological agents used to treat bipolar mood disorders. The psychotic disorders cohort may have blood gene expression changes related to mood state irrespective of the diagnosis and the different medication classes subjects with different diagnoses are on (Table 1 and FIG. 2B). The psychosis cohort was also notably different in terms of the ethnic distribution (see Table Ib).
[000155] The MIT/Broad Institute connectivity map was interrogated with a signature query composed of the genes in the BioM -10 Mood panel of top biomarkers for low mood and high mood
(FIG. 5). The effects of drugs in the Connectivity Map database and their effects on gene expression as the effects of high mood or low mood on gene expression. As such, as part of the signature query, the 5 biomarkers for high mood were considered as genes "Increased " by high mood, the 5 biomarkers for low mood were genes "Decreased " by high mood. The analysis revealed that sodium phenylbutyrate exerts the most similar effects to high mood, and novobiocin the most similar effects to low mood. Conventional gene expression analysis may not result in the same set of biomarkers.
[000156] By selecting 5 candidate biomarkers for high mood and 5 candidate biomarkers for low mood, a panel of 10 biomarkers for mood disorder that has diagnostic and predictive value was developed based on the scores of the biomarkers for low and high mood sections. [000157] Thus, the biomarkers identified herein provide quantitative tools for predicting disease states/conditions in subjects suspected of having a mood disorder or in any individual for psychiatric evaluation.
[000158] A meta-analysis of the two bipolar subject cohorts was also conducted. A panel of
10 top biomarkers identified by the meta-analysis was tested for sensitivity and specificity for low and high mood in the two bipolar cohorts (Table 4D). The panel included Edg2, Ednrb, Vil2, Bivm, Camk2d (high mood markers) and Trpcl, Elovl5, Ugt8, Btgl, Nefh (low mood markers). A number of new biomarker genes revealed only in the meta-anlysis were identified (see Table 3).
EXAMPLE 3
Cross-validation and integration using convergent functional genomics approaches to identify and prioritize biomarkers for mood disorders
[000159] The identities of transcripts were established using NetAFFX™ to correlate the GeneChip® array results with array design and annotation information (Affymetrix, Santa Clara, CA), and confirmed by cross-checking the target mRNA sequences that had been used for probe design in the Mouse Genome 430 2.0 Array GeneChip® or the Affymetrix Human Genome Ul 33 Plus 2.0 GeneChip® with the GenBank database. Where possible, identities of ESTs were established by BLAST searches of the nucleotide database. A National Center for Biotechnology Information (NCBI) (Bethesda, MD) BLAST analysis of the accession number of each probe-set was done to identify each gene name. BLAST analysis identified the closest (most similar) known gene existing in the database (the highest known gene at the top of the BLAST list of homologues) which then could be used to search the GeneCards database (Weizmann Institute, Rehovot, Israel). Probe-sets that did not have a known gene were labeled "EST" and their accession numbers were kept as identifiers.
[000160] Human Postmortem Brain Convergence: Information about the candidate genes was obtained using GeneCards, the Online Mendelian Inheritance of Man database at the NCBI database, as well as database searches using PubMed and various combinations of keywords (gene
name, bipolar, depression, psychosis, schizophrenia, alcoholism, suicide, dementia, Alzheimer, opiates, cocaine, marijuana, hallucinogens, amphetamines, benzodiazepines, human, brain, postmortem, lymphocytes, fibroblasts). Postmortem convergence was deemed to occur for a gene (or a biomarker) if there were human postmortem data showing changes in expression of that gene in brains from patients with mood disorders (bipolar disorder, depression), or secondarily of other major neuropsychiatric disorders that impact mood (schizophrenia, anxiety, alcoholism).
[000161 ] Human Genetic Data Convergence: To designate convergence for a particular gene, the gene may have positive reports from candidate gene association studies, or map within lOcM of a microsatellite marker for which at least one study demosntrated evidence for genetic linkage to mood disorders (bipolar disorder or depression) or secondarily to another neuropsychiatric disorder. The University of Southampton's sequence-based integrated map of the human genome (The Genetic Epidemiological Group, Human Genetics Division, was used to obtain cM locations for both genes and markers. The sex-averaged cM value was calculated and used to determine convergence to a particular marker. For markers that were not present in the Southampton database, the Marshfield database (Center for Medical Genetics, Marshfield, WI, USA) was used with the NCBI Map Viewer web-site to evaluate linkage convergence.
[000162] Gene Ontology (GO) analysis: The NetAffx™ Gene Ontology Mining Tool (Affymetrix,
Santa Clara, CA) was employed to categorize the genes in the datasets into functional categories, using the Biological Process ontology branch.
[000163] Ingenuity analysis: Ingenuity Pathway Analysis 5.1 software(Ingenuity Systems, Redwood
City, CA) was used to analyze the direct interactions of the top candidate genes resulting from the CFG analysis, biological roles, as well as employed to identify genes in the datasets that are the target of existing drugs.
[000164] Convergent Functional Genomics (CFG) Analysis Scoring (see FIG. 2A) is presented as folows:
(i) Biomarkers were given the maximum score of 2 points if changed in the human blood samples with high threshold analysis, and only 1 point if changed with low threshold.
(ii) Biomarkers received 1 point for each external cross-validating line of evidence (human postmortem brain data, human genetic data, animal model brain data, and animal model blood data).
(iii) Biomarkers received additional bonus points if changed in human brain and blood, as follows:
(a) 2 points if changed in the same direction;
(b) 1 point if changed in opposite direction;
(iv) Biomarkers also received additional bonus points if changed in brain and blood of the animal model, as follows:
(a) 1 point if changed in the same direction in the brain and blood;
(b) 0.5 points if changed in opposite direction.
[000165] Thus the total maximum CFG score that a candidate biomarker gene can have is 9 (2 + 4 +2
+1). To identify blood biomarkers the scoring pattern described herein is biased more towards awarding additional points for live subject human blood data (if it made the high threshold cut) than literature-derived human postmortem brain data, human genetic data, or the animal model data. The human blood-brain concordance is weighted more favorably than the animal model blood-brain concordance. The scoring analysis presented herein is just one example of assigning quantifiable values to prioritizing biomarkers for mood disorder analysis. Other ways of weighing the scores of line of evidence may give slightly different results in terms of prioritization, if not in terms of the list of genes per se.
[000166] The weightage given to a particular evidence, e.g., post-mortem data or blood expression may be varied. Additional scoring matrices may also be included to account for additional variables. One such example would be the temporal aspect — how long a particular biomarker is turned on.
EXAMPLE 4 Clinical Applications
[000167] A sample, such as, 5-10 ml of blood is obtained from a patient suspected of having a mood disorder. RNA is isolated from the blood using standard protocols, for example with PAXgene blood RNA extraction kit (PreAnalytiX, a QIAGEN/BD company), followed by GLOBINclear™-Human or GLOBINclear™-Mouse/Rat (Ambion/ Applied Biosystems Inc., Austin, TX) to remove the globin mRNA.. Isolated RNA is labeled using any suitable detectable label if necessary for the gene expression analysis.
[000168] The labeled RNA is then quantified for the presence of one or more of the biomarkers disclosed herein. For example, gene expression analysis is performed using a panel of about 10 biomarkers (e.g., BioM 10 panel) by any standard technique, for example microarray analysis or quantitative PCR or an equivalent thereof. The gene expression levels are analyzed and the absent/present state or fold changes (either increased, decreased, or no change) are determined and a score is established
[000169] Applications of biomarkers for mood disorders: There are no reliable clinical laboratory blood tests for mood disorders. Given the complex nature of mood disorders, the current reliance on patient self -report of symptoms and the clinician's impression on interview of patient is a rate limiting step in delivering the best possible care with existing treatment modalities, as well as in developing new and improved treatment approaches, including new medications.
[000170] Biomarkers disclosed herein are used in the form of panels of biomarkers, as exemplified by a BioM-10 Mood panel, for clinical laboratory tests for mood disorders. Such tests can be: 1) at an mRNA level, quantitation of gene expression through polymerase chain reaction, 2) at a protein level, quantitation of protein levels through immunological approaches such as enzyme-linked immunosorbent assays (ELISA).
[000171 ] In conjunction with other clinical information, biomarker testing of blood and other fluids
(CSF, urine) may play a desirable part of personalizing treatment to increase effectiveness and avoid adverse reactions- personalized medicine in psychiatry.
[000172] Biomarker-based tests for mood disorders help: 1) Diagnosis, early intervention and prevention efforts; 2) Prognosis and monitoring response to various treatments; 3) New neuropsychiatric drug development efforts by pharmaceutical companies, at both a pre-clinical and clinical (Phase I, II and III) stages of the process; 4) Identifying vulnerability to mood problems for people in high stress occupations (for example, military, police, homeland security).
[000173] Example 4A: Diagnosis, early intervention and prevention efforts. A patient with no previous history of mood disorders presents to a primary care doctor or internist complaining of non-specific symptoms: low energy, fatigue, general malaise, aches and pains. Such symptoms are reported in conditions such as stress after a job loss, bereavement, mononucleosis, fibromyalgia, and postpartum in the general population, as well as Gulf War syndrome in veterans. A panel of mood biomarkers can substantiate that the patient is showing objective changes in the blood consistent with a low mood/depressive state. This will direct treatment towards, and substantiate the need to use, anti-depressant medications such as Prozac (fluoxetine), Zolof (sertraline), Celexa (citalopram), Cymbalta (duloxetine), Effexor (venlafaxine) or Wellbutrin (buproprion).
[000174] Example 4B : Clinical diagnosis of a young patient. A young patient (child, adolescent, young adult) with no previous history of mood disorders, but coming from a family where one or more blood relatives suffer from depression may be monitored with regular laboratory tests by their primary care doctor/pediatrician using panels of mood biomarkers,. These tests may detect early on a change towards decreased mood (depression) or towards increased mood (mania). This indicates and substantiates the need for initiation of medication treatment with anti-depressants (mentioned above), or mood stabilizers for mania- medication such as Depakote (divalproex), Lithobid (lithium), Lamictal (lamotrigene), Tegretol (carbamazepine), Topomax (topiramate). This early intervention may be helpful to prevent full-blown illness and hospitalizations, with their attendant negative medical and social consequences. The decision to start medications in children and adolescents is particularly difficult without objective proof, due to the potential side-effects of medications in that age group (agitation, suicidality, weigh-gain, sexual side-effects).
[000175] Example 4C: Monitoring mood biomarkers over an extended period. Many patients with bipolar disorder may present initially with a depressive episode to their primary care doctor or psychiatrist. Monitoring mood biomarkers over time may also help to differentiate depression vs. bipolar disorder (manic-depression). This distinction is helpful because the first-line treatments for the two disorders are different: anti-depressants for depression, mood stabilizers for bipolar. If patients are miss-diagnosed as depressives instead of bipolars, and started on anti-depressant medications only, this can lead to activation and flip into manic states. If prior objective substantiation through biomarker testing of mood cyclicity (going up and down) existed, or early
detection of mania in patients put on anti-depressants by seeing a change in biomarker profile towards a high mood state profile before full blown illness and clinical symptoms, an appropriate addition or change to a mood stabilizer medication can be implemented, preventing clinical decompensation, needles suffering and socio-economic loss (employment, relationships).
[000176] Example 4D: Prognosis and monitoring response to various treatments. In depression, initiating medication treatment with current anti-depressants medications is a trial-and -error endeavor. It takes up to 6-8 weeks to see if a medication truly works. By doing a baseline biomarker panel test, and then a repeat test early one in treatment (after 1 week, for example), there would be an early objective indication if an anti-depressant is starting to work or not, and if a switch to another medication is indicated. This would save time and avoid needles suffering for patients, with the attendant socio-economic losses.
[000177] Example 4E: Detecting loss of efficacy of an existing treatment. When a patient has been stable for a while on a medication for depression or bipolar disorder, regular biomarker testing may detect early loss of efficacy of the medication or recurrence of the illness, which would indicate the dose needs to be increased, medication changed, or another medication added, to prevent full blown clinical symptoms.
[000178] Example 4F: Determining adequacy of treatment plan. Objective monitoring with blood biomarker panels of the effect of less reliable or evidence-based interventions: psychotherapy, lifestyle changes, diet and exercise programs for improving mood health. This will show whether the particular intervention works, is sufficient, or medications may need to be added to the regimen.
[000179] Example 4G: Identifying vulnerability to developing mood problems for people in high stress occupations. Military personnel (recruits in boot-camp, active duty soldiers), other people in high-stress jobs (police, homeland security, astronauts), can be monitored on a regular basis to detect early objective changes in mood biomarker profile that would indicate the need for preventive intervention and/or the temporary removal from a high-stress environment.
EXAMPLE 5
New neuropsychiatric drug development
[000180] Early-stage pre-clinical work and clinical trials of new neuropsychiatric medications for treating mood disorders may benefit from biomarker monitoring to help make a decision early on whether the compound is working. This will speed up the drug-development process and avoid unnecessary costs. Depending on the expression profile of the biomarkers, the results of clinical trials may be obtained earlier than usual.
[000181 ] In later-stage large clinical trials, a new compound being tested may show an overall statistically non-significant positive effect, despite working well in a sub-group of people in the study. Biomarker testing may provide an objective signature of the genetic and biological make-up of the responders, which can inform recruitment for subsequent validatory clinical trials with higher
likelihood of success, as well as inform which patients should be getting the medication, once it is
FDA approved and on the market.
[000182] Table 1. Demographics: (a) individual (b) aggregate
[000183] Diagnosis established by DIGS comprehensive structured clinical interview. BP- bipolar,
SubPD-substance induced psychosis, SZ-schizophrenia, SZA-schizoaffective disorder. VAS Mood score at time of blood draw, on a scale 0 (lowest mood) to 100 (highest mood). [000184] (a) Individual demographic data.


[000185] (b) Aggregate demographic data

[000186] Table 2. High threshold and low threshold analysis in primary bipolar cohort and in metaanalysis of both bipolar cohorts. Genes are considered candidate biomarkers for high mood if they are called by the Affymetrix MAS5 software as Absent (A) in the blood of low mood subjects and detected as Present (P) in the blood of high mood subjects. Conversely, genes are considered candidate biomarkers for low mood if they are detected as Present (P) in low mood subjects and Absent (A) in high mood subjects.


[000190] Table 6: Targets of existing drugs. Complete list of the blood candidate biomarker genes for mood that are the direct target of existing drugs.

[000191 ] Table 7. Complete list of blood candidate biomarker genes for mood derived from primary bipolar cohort analysis. All-low and high threshold candidate genes. Known genes shown only. For human blood data: I -increased in high mood (mania); D-decreased in high mood (mania)/ increased in low mood (depression). (HT) -High threshold.


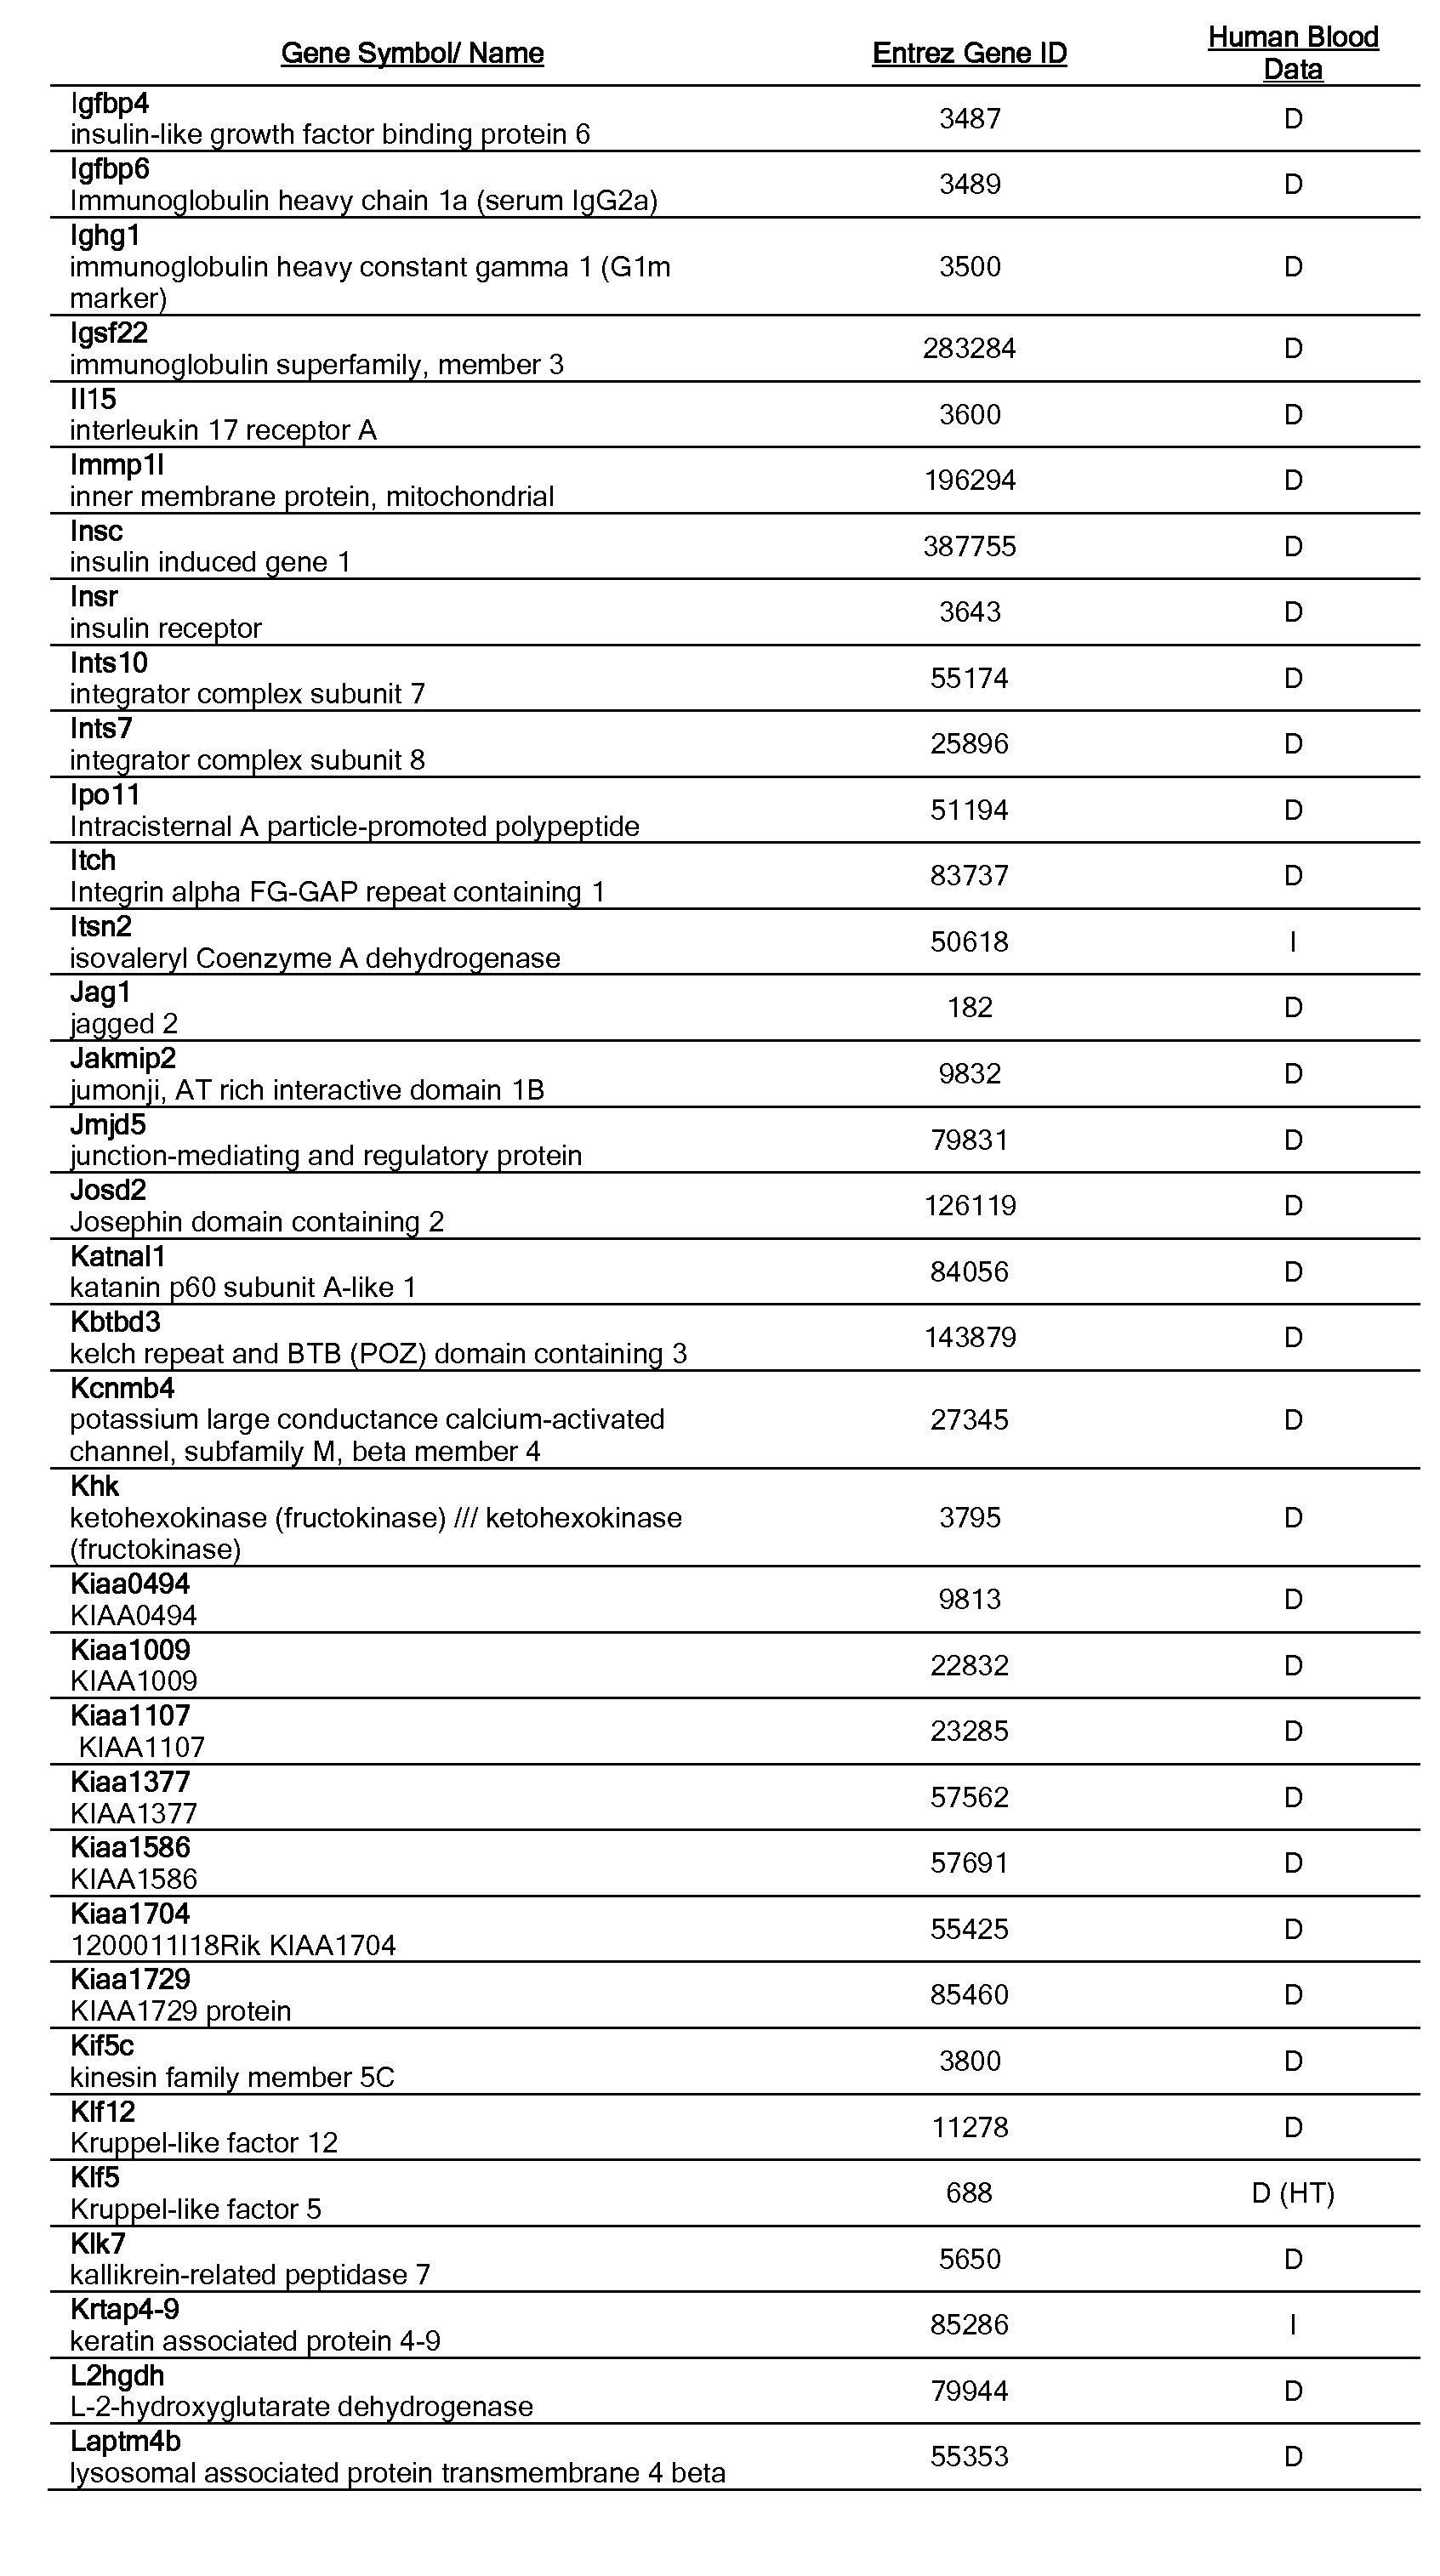


Mbp myelin basic protein Entrez Gene ID No. 4155 (SEQ ID NO: 1) gaagataaccggctcattcacttcctcccagaagacgcgtggtagcgagtaggcacaggcgtgcacctgctcccgaatta ctcaccgagacacacgggctgagcagacggcccctgtgatggagacaaagagctcttctgaccatatccttcttaacacc cgctggcatctcctttcgcgcctccctccctaacctactgacccaccttttgattttagcgcacctgtgattgataggcc ttccaaagagtcccacgctggcatcaccctccccgaggacggagatgaggagtagtcagcgtgatgccaaaacgcgtctt cttaatccaattctaattctgaatgtttcgtgtgggcttaataccatgtctattaatatatagcctcgatgatgagagag
ttacaaagaacaaaactccagacacaaacctccaaatttttcagcagaagcactctgcgtcgctgagctgaggtcggctc tgcgatccatacgtggccgcacccacacagcacgtgctgtgacgatggctgaac
Edg2 Endothelial differentiation, lysophosphatidic acid G-protein-coupled receptor, 2 Entrez Gene ID No. 1902, (SEQ ID NO: 2) aatgagcgccacctttaggcagatcctctgctgccagcgcagtgagaaccccaccggccccacagaaagctcagaccgct cggcttcctccctcaaccacaccatcttggctggagttcacagcaatgaccactctgtggtttagaacggaaactgagat gaggaaccagccgtcctctcttggaggataaacagcctccccctacccaattgccagggcaaggtggggtgtgagagagg agaaaagtcaactcatgtacttaaacactaaccaatgacagtatttgttcctggaccccacaagacttgatatatattga aaattagcttatgtgacaaccctcatcttgatccccatcccttctgaaagtaggaagttggagctcttgcaatggaattc aagaacagactctggagtgtccattta
Fgfrl fibroblast growth factor receptor 1 Entrez Gene ID No. 2260, (SEQ ID NO:
3) ctcctctccacctgctggtgagaggtgcaaagaggcagatctttgctgccagccacttcatcccctcccagatgttggac caacacccctccctgccaccaggcactgcctgagggcagggagtgggagccaatgaacaggcatgcaagtgagagcttec tgagctttctcctgtcggtttggtctgttttgccttcacccataagcccctcgcactctggtggcaggtgcttgtcctca gggctacagcagtagggaggtcagtgcttcgagccacgattgaaggtgacctctgccccagataggtggtgccagtggct tattaattccgatactagtttgctttgctgaccaaatgcctggtaccagaggatggtgaggcgaaggcaggttgggggca gtgttgtggcctggggccagccaacactggggctctgtatatagctatgaagaaaacacaaagttgataaatctgagtat atatttacatgtctttttaaaagggtcgttaccagagatttacccatcg
Fzd3 frizzled homolog 3 (Drosophila) Entrez Gene ID No. 7976 (SEQ ID NO: 4) aatcctaaatgtgtggtgactgctttgtagtgaactttcatatactataaactagttgtgagataacattctggtagctc agttaataaaacaatttcagaattaaagaaattttctatgcaaggtttacttctcagatgaacagtaggactttgtagtt ttatttccactaagtgaaaaaagaactgtgtttttaaactgtaggagaatttaataaatcagcaagggtattttagctaa tagaataaaagtgcaacagaagaatttgattagtctatgaaaggttctcttaaaattctatcgaaataatcttcatgcag agatattcagggtttggattagcagtggaataaagagatgggcattgtttcccctataattgtgctgtttttataacttt tgtaaatattactttttctggctgtgtttttataacttatccatatgcatgatggaaaaattttaatttgtagccatctt ttcccat
Mag myelin-associated glycoprotein Entrez Gene ID No. 4099 (SEQ ID NO: 5) tttggcgtcgtcctcaagttatattagaatcgtgtcctcccggctttggccaacttactattctaggacttgattccttc attcagtcacaatttattgagcaccgactttgcatcaacctcttgctgaagataacagtgctgacaatatacagccctgc cctcagagcttatatagtagaggagaaaaagtgaacccataatatacagtcagtagcgagtatttactaagtactttcta tttgcgaggccctgataaaagtactgtcctggccaggcgcggtggctcacgcctgtaattccagcactttgggaggtcga ggtgggcagatcacctaaggtcaggagttcgagatcagcctggctaacatggggaaaccccgtctctactaaaaatggaa aaattagctgggcatggtggcgggcgcctgtaatcccagctactcgggaggctgagacaggagaatgacttgaacccagg agttgcagtggccaagataagatagcgccattgtactcc
Pmp22 peripheral myelin protein Entrez Gene ID No. 225376 (SEQ ID NO: 6) tgtgaagctttacgcgcacacggacaaaatgcccaaactggagcccttgcaaaaacacggcttgtggcattggcatactt gcccttacaggtggagtatcttcgtcacacatctaaatgagaaatcagtgacaacaagtctttgaaatggtgctatggat ttaccattccttattatcactaatcatctaaacaactcactggaaatccaattaacaattttacaacataagatagaatg gagacctgaataattctgtgtaatataaatggtttataactgcttttgtacctagctaggctgctattattactataatg agtaaatcataaagccttcatcactcccacatttttcttacggtcggagcatcagaacaagcgtctagactccttgggac cgtgagttcctagagcttggctgggtctaggctgttctgtgcctccaaggactgtctggcaatgacttgtattggccacc aactgtagatgtatatatggtgcccttctgatgctaagactccagaccttttgt
Ugt8 UDP glycosyltransferase 8 (UDP-galactose ceramide galactosyltransferase)
Entrez Gene ID No. 7368 (SEQ ID NO: 7) attccatgtcattctgtttacttagcacttgcactacccttgtnggttgagtgtatgctttatttgtttctagtttgaaa tcccacatctgatagctgagagtaggcaaatacaacatttacctaatgtcattcactaacatggaagagttgtgaaaatt ctagagtgctgtaaatccttggcatacactatgacaaacaacttcattactctcccaccaggagctgctctcctgcactt agaaataatgtcacaagtagttttctaatgtacaatgcagacaaatgtactgctctctgaatacttgaagaaatggtatt atacatacatagaaacttattagttataccttttcacaatcttattacgatgttgccgttaaaagggaaaaaagacacag gcaatgaatggtgggatagtaagaggacttagagtgtatgaatgagttgattttacttttttggaatttgattaagttga cagtaggcactgattggatgattaaacataagttaatctccactgtgat
Erbb3 Neuregulin receptor ( v-erb-a erythroblastic leukemia viral oncogene homolog 4 (avian)) Entrez Gene ID No. 2065 (SEQ ID NO: 8) cttatggtatgtagccagctgtgcactttcttctctttcccaaccccaggaaaggttttccttattttgtgtgctttccc agtcccattcctcagcttcttcacaggcactcctggagatatgaaggattactctccatatcccttcctctcaggctctt gactacttggaactaggctcttatgtgtgcctttgtttcccatcagactgtcaagaagaggaaagggaggaaacctagca gaggaaagtgtaattttggtttatgactcttaaccccctagaaagacagaagcttaaaatctgtgaagaaagaggttagg agtagatattgattactatcataattcagcacttaactatgagccaggcatcatactaaacttcacctacattatctcac t
Igfbp4 insulin-like growth factor binding protein Entrez Gene ID No. 43487 (SEQ ID NO: 9) agagacatgtaccttgaccatcgtccttcctctcaagctagcccagagggtgggagcctaaggaagcgtggggtagcaga tggagtaatggtcacgaggtccagacccactcccaaagctcagacttgccaggctccctttctcttcttccccaggtcct tcctttaggtctggttgttgcaccatctgcttggttggctggcagctgagagccctgctgtgggagagcgaagggggtca aaggaagacttgaagcacagagggctagggaggtggggtacatttctctgagcagtcagggtgggaagaaagaatgcaag agtggactgaatgtgcctaatggagaagacccacgtgetaggggatgaggggcttcctgggtcctgttcccctaccccat ttgtggtcacagccatgaagtcaccgggatgaacctatccttccagtggctcgctccctgtagctctgcctccctctcca tatctccttcccctacacctccctccccacacctccctactcccctgggcatcttctggcttgactggatgg
Igfbpβ insulin-like growth factor binding protein Entrez Gene ID No. 63489 (SEQ
ID NO: 10) gcgcgcctgctgttgcagaggagaatcctaaggagagtaaaccccaagcaggcactgcccgcccacaggatgtgaaccgc agagaccaacagaggaatccaggcacctctaccacgccctcccagcccaattctgcgggtgtccaagacactgagatggg cccatgccgtagacatctggactcagtgctgcagcaactccagactgaggtctaccgaggggctcaaacactctacgtgc ccaattgtgaccatcgaggcttctaccggaagcggcagtgccgctcctcccaggggcagcgccgaggtccctgctggtgt gtggatcggatgggcaagtccctgccagggtctccagatggcaatggaagctcctcctgccccactgggagtagcggcta aagctgggggatagaggggctgcagggccactggaaggaacatggagctgtcatcactcaac
Pdeβ dphosphodiesterase 6D, cGMP-specific, rod, delta Entrez Gene ID No. 5147 (SEQ IDNO: 11) gaagcaacgttttcatctgattggaaataccgtattgctgaaaagaagaaaggcctttttaatggcttttgaacaaagca gaaaagtttgagcttctcaccttcagtcttagctcttgaacctgttgagaaagaggataagagacaaatacggaaaagag tttcagaaagcagaatctgtgtcagcccactggaaggaaaagcgaatcaaccgattcagtgatgttagtgcatccagaaa caggcttttgggaaaagcttgacctgagctgattaaatcctgaagcacaanggaagcagccacatcaaaaagttagcatg agagcagtggcgtgetcatcctctggtagcctttactgggcatttgtggagtaagagagaaaagaaaagcaggaatgtta agatatgctactaccttcaggaaa
Ptprm protein tyrosine phosphatase, receptor type, M Entrez Gene ID No. 5797 (SEQ ID NO: 12) gagcagcgtagacagctggtaaactgaagagcacaactatattcttatgaaggaatttgtacctttggggtattattttg tggcccgtgaccctcgttattgttacagctgagtgtatgtttttgttctgtggagaatgctatctggcattatggtaata tattattttaggtaatatttgtactttaacatgttgcataatatatgcttatgtagctttccaggactaacagataaatg tgtaatgaacaaagatatgttgtatgagtcgtcgtttctgtcagatttgtattgtttccaagggaaaagcttgggggagg actcagttcacaaaatgcaaaactcaacgatcagattcacggacccagagcttttccatgtgt
Atp2cl ATPase, Ca++-sequesteπng Entrez Gene ID No. 27032 (SEQ ID NO: 13) tttttctcttctggcttcataaatgccttgctgtataaattgaaatattgatactgaactgtctttttaatgatgaccta actttattcaacccatcggaatttactttttccctgaaataagatcttttccactggtctactacctgaccataaacatg tctgcatttgaattctctaaaccctaaatctgtgtctatg
Atxnl Ataxin Entrez Gene ID No. 16310 (SEQ ID NO: 14) aaacagagcagccacgggctcgaaccgaatccccgccgtccttagaaacggatttttttttgttttgttttgttttctgg cagagtctcgatcaccaccctactnccacccccactaaggttcttgctcaatctccctagaaaacctgaattgtttcatc cctttcagtcagccccctacgtggtctgaaacaaaatgaaagcacaagccacggagtttaagaaggcagcctgaaggcgg ggggctgaagaggggtcggggcgctgcagagtcagccaagtagccaaggaagggccccctccgcgtcgcgacggccctcg ccccccgcccggcgcgcgcgcgcacaaatacacacacacagtcactcacacactcactcacactcacgccgcgctccgac accgcctcacctctcgctccgcccgtccggcccccttccctgccccctgcgggaccggcctgcgcgcagcactggaacca cgtaggaggaggcggcgg
Btgl B-cell translocation gene 1, anti-proliferative Entrez Gene ID No. 694 (SEQ
ID NO: 15) gaaggtatacagactgccaacattttagacttatctctcagtctctgccactgaacttttatatatggctgctatcaaaa tataaccggtttattttcatatttggaactaatataacagtatcacaaaatcttttacagtaagatagtttgtaatacca gccgacccagctgcttaactgagtccttaaatcatttaatatatgggactgtaaatagagaaatctgtacattannagat ctgatttctggttatgcctatagatctttattttctttatccctatagatcattttcttctgatgttaagtgttatattt ttgaaatgctcctaaacaagtaagccttagattgtattaatcctgaggattgataccatttcctcaacactttgtggagt atgattgacaccagtttttttttgactgcaggtttaacttggcttatcacttttcgtattgctcagtatgtccaag
C6orfl82 chromosome 6 open reading frame Entrez Gene ID No. 182285753 (SEQ ID
NO: 16) cacagttttgtgaagaagcctttaatccaagttttatgagacagtaggaacctatagctacttaatttttaggagacagt aattcagttgcagaagctttcctctgctattcccattctcttttacaaaactagttttttttaaaaaatcaatgatcaat tttatcttactactttataacttttgctgacttttattctttgcattgtatgtaatgtccatcagtataaattgagactg tgaatttctaggacccacaaaagtggtattttttttttgtacaagaaagtatagaggaagaggaagctgggcattaaatt acctcatccagcag
Dicerl Dicerl, Dcr-1 homolog (Drosophila) Entrez Gene ID No. 23405 (SEQ ID NO: 17)
tatcactggtaaggagcccacgaccagacttcatttctgggaaaatgagactttgtgttgatctcatcgtgttggccttg taaaagtgatctatgcatgtacagtgttcatgcttaatattcaagggatggggcggggaacaaaaggaatagaaagaatt cttttccttgttatttggggagcacgtattgctttataactttggttgttgggagtatggctatcatataccctcatcag tgtcattttatatctgcctaattagagaaattttaaccttagtattttgatgtgttttccccattttatcctccgcaaat atctttctcttgcccattcagtgctgcttttggtttttgatttagttgtatattctggatgtatttccacagccttttat tgttcttcc
Dnajcβ DnaJ (Hsp40) homolog, subfamily C, member Entrez Gene ID No. 69829 (SEQ
ID NO: 18) gatccagtatgtgcttgtcttatttaaaattggaatgtgagacatgttgctgtgacctgtttttctttctcattcacatt tgtagatattgtgtgaactacagtatataatgataacaattaaaaggatattctgtggatgtcacgtattttgaaatgat agaactacattagctttgtatcatgtttggataattcatcaatgttcacagtttaaaacatcattaaacattatgtaatt acaatgagaaagaatcttacttaaatttggagattttcccccacatctcttttccggatacattataattctggacccct atttatctcaaaactcttaatatatgcagaccaacaggtctttgcattccttttaaataactggttgtgacaaagcttgt tgttgatcagattcactg
Ednrb endothelin receptor type B Entrez Gene ID No. 1910 (SEQ ID NO: 19) aactgctttaagtcatgcttatgctgctggtgccagtcatttgaagaaaaacagtccttggaggaaaagcagtcgtgctt aaagttcaaagctaatgatcacggatatgacaacttccgttccagtaataaatacagctcatcttgaaa
Elovl5 ELOVL family member 5, elongation of long chain fatty acids (yeast)
Entrez Gene ID No. 60481 (SEQ ID NO: 20) tcgaggtatcagcagctctgtcctcagaatgggtcccccacttcacacagttgtaggatggctacagcagctccaagcag cacattcagaggaagaagaaaaaatgtttcatttgtgtggttttaagcataaagaagttgtttcccagagctctttgcca getgtcatccctcaaaactcactggccacaattgettcacatgcccctgcctgaaccagccaccagagggggttaggacc accacagattgactagatcctaaggattctctacctggggctggagttcgggtcaggtgcccgggaagcactgtgcggtg tgggaggatg
Gnal guanine nucleotide binding protein, alpha stimulating, olfactory type
Entrez Gene ID No. 2774 (SEQ ID NO: 21) tgttgttgtccctattgctggtttattacactgtacagaccacaaaatgtaatattcttttgtataactactaaagaaaa atccttgtagancnnnnnnccttcaccatggctatctatacctgtacatgaaatgtgtttgtattgtgctgaagngctta atgtcaacattacctgctgnttactctgaaaaaaggaatgaatggtagctntagaatttaggatattttatcaggttggc actttataaaatactccctgatttaaaaaattgtaagttatacacgttaatcatccacattctatcgacaatgtaccaac atcacaagctgttgcaaccacctgnctgttacttctctgagctgttaaaancctggaacttcaatttcaggggggcacaa at
Klf5 Kruppel-like factor Entrez Gene ID No. 5688 (SEQ ID NO: 22) ttacagtgcagtttagttaatctattaatactgactcagtgtctgcctttaaatataaatgatatgttgaaaacttaagg aagcaaatgctacatatatgcaatataaaatagtaatgtgatgctgatgctgttaaccaaagggcagaataaataagcaa aatgccaaaaggggtcttaattgaaatgaaaatttaattttgtttttaaaatattgtttatctttatttatttgggggta atattgtaagttttttagaagacaattttcataacttgataaattatagttttgtttgttagaaaagtagctcttaaaag atgtaaatagatgacaaacgatgtaaataattttgtaagaggcttcaaaatgtttatacgtggaaacacacctacatgaa aagcagaaatcggttgctgttttgcttctttttccctcttatttttgtattgtggtcatttcctatgcaaataatggagc aaacagctgtatagttgtagaat
Lin7a lin 7 homolog a (C. elegans) Entrez Gene ID No. 8825 (SEQ ID NO: 23) aatggaccaattttagctcaacttttagtttgttagaagcaagtgtaggaactctagcactgtagtttttaattattgct tgtatctattattattaattccaacagagtataatgtatatttattctataaaatatatattatcagagtgcatttgtta caacttaggttcttttcttaccaagtattaagnaatctagtaagagnaatactagncaaaggacctagnccctgtgnaac agnntctcgtatgttatatacataaacccactctgc
Manea mannosidase, endo-alpha Entrez Gene ID No.79694 (SEQ ID NO: 24) gtgtttctgctttacagtgctgaattccatattttagaagctatgaaagtccttttatgaaaaagttactgattgcttct cagttattaggaaaacagttgtttcacaattattatgtagatatgatgcccaaatatcatttttagtatatcttgtcgat ctttaagttgttactattgtgttattcatgtctttaaatcagataccaaatattttttaggaaagaaaaatgttattact gtcattaggttgtcttttaatactttaagttattttgacgaaaagtaatagagaaaatttacttagcattttagattcta gagacatggaaatgaaaattattttatgtctagagtaggtcctgaagtttggctttacattaagtttagcactgtatcag aatgaagaaactaatattttacataaaaactaatactttcaattttttatatagtaatatccccattttgtaaatgttag acttttatcatacctgtaa
Nupll nucleoporin like 19818 (SEQ ID NO: 25) aaaataggcattgcatacacatatgcacacgtatgtgcacgtgccacacattttttgtataatgttgggtttgattataa aagtgttgtcaaatgttttatttatctgcatntagcagtggttggcttttttgaattgaaatttttgcgcattgatgcat tgaaataaggaaaattatttatctctgagcactaaacttatttttgcatatttctgtaatattgcagtccccagatccag aacatgggaagttagggaaaatgtgtgattttgtgttttgaattactgtcagaattacatacacaattacaacaaacttt ttttaaaagacatttcattgtactgcaaaaatctgaatatttatatttcttgtttttttctttatatgttttgcatttta atatgttgagccactgg
Pdeβb phosphodiesterase 6B, cGMP-specific, rod, beta (congenital stationary night blindness 3, autosomal dominant) Entrez Gene ID No. 5158 (SEQ ID NO: 26) tcttttgaaaatgctggcctgctgcacctgttctcagaggggcatgagaaaagaggattctcttcctagggctgtgggaa gccccttgagatgttggaagcagggcagggcaggagaacccagggagggcacagagctgtggacgagggctgggaaagcc atcccgcctccccagggggtctccgaggagtgctgctgtggccaaaccaggggggccactttgtgctttctgtttaggtg atgggatgcttctatctcctcagcaccccacaccaaatcccctgttattgccagatgatgtgcctaatgatcaaattgct t
Slc25a23 solute carrier family 25 (mitochondrial carrier; phosphate carrier), member Entrez Gene ID No. 2379085 (SEQ ID NO: 27) ctcccaccttctaggcgaatagtccccagagctgtgttcctccaaggggtccgaggaatcactcactcctggaggctggc aaggagacagtctgaggccagggacacatgaagggatgtccccaccccagcactatcagggcctccccaggcttccagag ttgaaagccaggagaaaatcggcaaagaccacccttccctaaacccaagcacccaatgatgcaaaaaacaaaaacaaaaa aaaaccaccaaatccccaaattcattccagatctatttttctaccagagagaggagcaaagtcctcctcccctgcgccct tacattctgcacttcatagttggattctgagcttaggatcatctggagaccccatggagggacttgga
Synpo synaptopodin Entrez Gene ID No. 11346 (SEQ ID NO: 28) ggtgatgttagatctggaacccccaagtgaggctggagggagttaaggtcagtatggaagatagggttgggacagggtgc tttggaatgaaagagtgaccttagagggctccttgggcctcaggaatgctcctgctgctgtgaagatgagaaggtgctct tactcagttaatgatgagtgactatatttaccaaagcccctacctgctgctgggtcccttgtagcacaggagactggggc taagggcccctcccagggaagggacaccatcaggcctctggctgaggcagtagcatagaggatccatttctacctgcatt tcccagaggactagcaggaggcagccttgagaaaccggcagttcccaagccagcgcctggctgttctctcattgtcactg ccctctccccaacctctcctctaacccactagagattgcctgtgtcctgcc
Tgm2 transglutaminase 2, C polypeptide Entrez Gene ID No. 7052 (SEQ ID NO: 29) ccttcagaccccagttctaggggagaagagccctggacacccctgctctacccatgagcctgcccgctgcaatgcctaga cttcccaacagccttagctgccagtgctggtcactaaccaacaaggttggncaccccagctaccccttctttgcagggct aaggcccccaaacatagcccctgccccggaggaagcttggggaacccatgagttgtcagctttgactttatctcctgctc tttctacatgactgggcctcccttgggctggaagaattggggattctctattggaggtgagatcacagcctccagggccc cccaaatcccagggaaggacttggagagaatcatgctgttgcatttagaactttctgctttgcacaggaaagagtcacac aattaatcaacatgtatattttctctatacatagagctctatttctctacggtttta
Tjp3 tight junction protein 3 (zona occludens 3) Entrez Gene ID No. 27134 (SEQ ID NO: 30) acacggatgtggatgatgagcccccggctccagccctggcccggtcctcggagcccgtgcaggcagatgagtcccagagc ccgagggatcgtgggagaatctcggctcatcagggggcccaggtggacagccgccacccccagggacagtggcgacagga cagcatgcgaacctatgaacgggaagccctgaagaaaaagtttangcgagtncatgatgcggagtcctccgatgaag
Tpd52 tumor protein D Entrez Gene ID No. 527163 (SEQ ID NO: 31) agatgtgtccaaagagatccttacattaaggtcatttgtcagaatgatgtttgngtttgtttagagttggctgacctcca actcctggggtcaaggaatcctactgccttagcttcccaaatagctaggactataggcatgcacccggccatgtgtttta tttatagctcttaaagcccagatgaagaaatcacatttttgcccatagtgaagaaacatttggccattgattagtcctta ttttcagtgactgtcctgttttcattagattagagagaccctgtgtgggccacagttaatataaaccattatcactttta agtaaacctgcacatcttagatttcataatttccttattgttctgactcaaaatgaactaagagcttttcactttttgtt tgtaagttctcagagagtcgggtctgcaagtgcttt
Trpcl transient receptor potential cation channel, subfamily C, member Entrez
Gene ID No.17220 (SEQ ID NO: 32) gggtgcaggtaacccttggtctgtaagcaccaccgatccagggatcattgtctaaataggttactattgtttgtttcatc ttgcttttgcatttttattttttaatttccaaattttaagtgttccctctttggggcaaattcttataaaaatgtttatt gtaaagttatatattttgtctacgatgggattatgcacttcccaattgggattttacatctggatttttagtcattctaa aaaacacctaattattaaaacatttatagagtgcctactgtatgcatgagttgagttgcttctgaggtacattttga
Bclafl BCL2-associated transcription factor Entrez Gene ID No. 19774 (SEQ ID NO:
33) gttactagactataccttggcctttaaaaatgaatctcactgattaaagagaacaggcattattaggatagcattccacc acaactagaaacattcaaataatgtgtcttaattgtaatctgtatataggaaaatttttcctatggatatttttggtgtt ttaccacagtgaactgatttgtagcacttatgaagtgcagaaggtaatattcttgaaaatagaaaaaggttgggtgagca ggctttaatgcctttcccccaagaatatacatcgaatttttcttaatcttttggggttggccagcttccagatttcatta ataatgagctctgcctttaataaaagtacatgatcatagctacactgtatgtttaggtggtgtgaaatgatttataatca cagcttgaactgtgtttgcttggtactgtca
Gosr2 golgi SNAP receptor complex member Entrez Gene ID No. 29570 (SEQ ID NO:
34) ccctgtgcctcagtgacatgtagatgactgactgccaatacttgtcaccattccctggaagcagctacctaggggaaaca agatgtagtgctattgccgataacaagtaagattttccacactanannnnggtgtttctcttttctaaagtgaggccagt gttatttcccgggagtgttcagtcttgaccctagtcactgattttttctagttgttaatagagtggttggcttttaaggt tcagagactgtggcttggcacctgcgcccaggctttgtgggcctttgccccttagaaagtagctgtaggcaaagatttgt gattttccaattacagtctcagctctagttttagtatctctaattctttggttcccttctcttccctgaaatatattagc
acctgccagccaggccctcattttgcccagccagtgtgggcagatcccaccgtggagacatctgtagtgtgtatgtcctt gtaacactctgttttcagggactacaacctttttccttctgtgaccagccccggattcaggctgtac
Rdx radixin Entrez Gene ID No. 5962 (SEQ ID NO: 35) ttaacactaattatcacgtctgacaaatgtgtatgtgtggtttcagttctgtgtacattttaaaggataatggtgaacat tttaatgggtttcccttgccctttccatatttaacctatttccacattctctctcactcacattttctcagtgtgccctt ctcttatctgccatgtccatagccataattccaccatcatacagatcaggcagtgtttaaaatgatggtaggtagcacag tggacagtctttgatcatcatgtagaatatggctatgaatcaggaaagagattagaacatttaataatgtatgtacagct ggtgcttagtttttttttaatctaaatttaattaccttattggatatttgatatttggttatttaatcacagtcatcttt aacagcttacactgattggtgttttatctcctgtgatcctttgatggctttttttgcctaccatttcacagaggtt
Wdr34 WD repeat domain Entrez Gene ID No. 3489891 (SEQ ID NO: 36) cgctgggactgacgggcatgtccacctgtactccatgetgcaggcccctcccttgacttcgctgcagctctccctcaagt atctgtttgctgtgcgctggtccccagtgcggcccttggtttttgcagctgcctctgggaaaggtgacgtgcagctgttt gatctccagaaaagctcccagaaacccacagttttgatcaagcaaacccaggatgaaagccctgtctactgtctggagtt caacagccagcagactcagctcttggctgcgggcgatgcccagggcacagtgaaggtgtggcagctgagcacagagttca cggaacaagggccccgggaagctgaggacctggactgcctggcagcagaggtggcggcctgaggggtcccgggaggcggg tgcaagccttcgctgtgccgagccttgtgtttctgacgcaagcca
Nefh neurofilament, heavy polypeptide 20OkDa Entrez Gene ID No. 4744 (SEQ ID NO: 37) ccccaggcgatggacaattatgatagcttatgtagctgaatgtgatacatgccgaatgccacacgtaaacactt gactataaaaactgcccccctcctttccaaataagtgcatttattgcctctatgtgcaactgacagatgaccgcaataat gaatgagcagttagaaatacattatgcttgagatgtcttaacctattcccaaatgccttctgttttccaaaggagtggtc aagcccttgcccagagctctctattctggaagagcggtccaggtggggccgggcactggccactgaattatgccagggcg cactttccactggagttcactttcaattgcttctgtgcaataaaaccaagtg
Bic BIC transcript (SEQ ID NO: 38) gggtaaataacatctgacagctaatgagatattttttccatacaagataaaaagatttaatcaaaaaatttcat atttgaaatgaagtcccaaatctangttcaagttcaatagcttagccacataatacggttgtgcgagcagagaatctacc tttccacttctaagcctgtttcttcctccatnnnatggggataatactttacaaggttgttgtgaggcttagatgagata gagaattattccataagataatcaagtgetacattaatgttatagttagattaatccaagaactagtcaccctactttat tagagaagagaaaagctaatgatttgatttgcagaatatttaaggtttggatttctatgcagtttttctaaataaccatc acttacaaatatgtaaccaaacgtaattgttagtatatttaatgtaaacttgttttaacaactcttctcaacattttgtc caggttattcactgtaaccaaataaatctcatgagtctttagttgattta
Bivm basic, lmmunoglobulin-like variable motif containing Entrez Gene ID No.
54841 (SEQ ID NO: 39) atcatcatgatcgctcgacatcgatnnnnnnnnnnnnnttttttttttttttttttttttttnttnnaagtaga aaacaaaactttatttgatgaaatctttttaaaagttccagtatgaantaacaaaatcaacaacctacaaatctctttca gtcctttgcatttcaagcaaaatattctcttcagaaaaatgaccatttcataatatatatccccttctgtcg
BniplBCL2/adenovirus ElB 19kDa interacting protein 1 Entrez Gene ID No. 662 (SEQ ID NO: 40 ) aaaccaccaaagagagcctggcccagacatccagtaccatcactgagagcctcatggggatcagcaggatgatg gcccagcaggtccagcagagcgaggaggccatgcagtctctagtcacttcttcacgaacgatcctggatgcaaatgaaga atttaagtccatgtcgggcaccatccagctgggccggaagcttatcacaaaatacaatcgccgggagctgacggacaagc ttctcatcttccttgcgctacgcctgtttcttgctacggtcctctatattgtgaaaaagcggctctttccatttttgtga gatcccaaaggtgccagttctggccctttcagctcctgtttcaggatctgtcctggttcctgagctctaggctgctaagc tgagccacacacc
C8orf42 chromosome 8 open reading frame 42 Entrez Gene ID No. 157695 (SEQ ID NO: 41) gaaactctggaaatcacgtgtgtggggagatggggacgcttcccatgttgtggggagctctgtggctgtgatgg ctgcagttgccgtgcctctgttggaacgcnaagtgcctgcaactcacgtcaatcatagaattgtgacgcacagttggcaa aatagttctttatgctatttctcaaaantttgaggacaaacccagattgggattggaatatgcactgtaaatcaaatttt tcttatctacaaagactaatgtaaaaatgattttttcttctgtgcctgattaaattaactgtggtttttaatataaatat ttattggtgtgctttgggagaaaaattatcttttcttgaaagaanttatcaaagcaaatttattatcttcacaagttaat gggagaatgtggttttgattctgggtgtttgaattgtgtaaacacacagcttccttgtg
Camk2d calcium/calmodulin-dependent protein kinase II, delta Entrez Gene ID No. 817 (SEQ ID NO: 42 ) atttcccttttacattcattatgcaaattcacnttctattcntttctcacacactactagccagcctccccaaa naaggaaaagggaaaaaagtaagaaaagaatggaacaaaagaaaaataagaaagcaaacgaaaggaacaaagaaacagga
taaagaaaagagatcacagatttgagaaagaaaaacaattcaattcagcaaattcaccaaaacaatgtgaatatatccta aagtgattaaactcagaaatgatgtgaatttttccagtttacacagtttgaccaaaaacagcatggctttatgtggtagc aaaccaactgattcttgcttctactttcataagtgattttgcccacatatcatcccactttaattgttaatcagcaaaac tttcaatgaaaaatcatccattttaaccaggatcacacca
Dock9 Dedicator of cytokinesis 9 Entrez Gene ID No. 23348 (SEQ ID NO: 43 ) tctttgatcactgcctcttgattttttcctggatcattaagaggcttgaagaatactatgtagttgaaccagag gagtagtgtatgtcacatcctcacttactccttaagccctttctcatggtcttggccctaaaacatattttcagggcttg tgacccagtgatcagtggtcacccttaaagtattacagatacgtgcctgttttacatgagaggtaactgtttatgtgtat aagtcatcttaataaaataacatgaaatttattagctgaattgggtagatactgcttttctaagttgaacctaacttaag ctgatgcagaaactgagtcagaaaagttgctataattttaaaatataagaagtaaaagtgaaatcttatgtagcatcttt atctcattttggtttgtcagtataagtttctgatttcctttaagctctttacttttagaaacgtgaatttacaatccctt atccaaaactgctg
Faml3al family with sequence similarity 13, member Al Entrez Gene ID No. 10144 (SEQ ID NO: 44) gttagtggagttttactgttaatatcatcatgtccccctttgtgtttactactgtctgaaattactgggatgta gaagcatatttcagtctgaaaattcagccagcttattttggagaagttgtatcttgttcttgggcatgttagccttgttt ttcatcccaatttga
Histlh3b histone cluster 1, H3b Entrez Gene ID No. 8358 (SEQ ID NO: 45 ) atggctcgtactaaacagacagctcggaaatccaccggcggtaaagcgccacgcaagcagctggctaccaaggc tgctcgcaagagcgcgccggctaccggcggtgtgaaaaagcctcaccgttaccgtccgggtactgtggctctgcgtgaga tccgccgctaccaaaagtcgaccgagttgctgattcggaagctgccgttccagcgcctggtgcgagaaatcgcccaagac ttcaagaccgatcttcgcttccagagctctgcggtaatggcgctgcaggaggcttgtgaggcctacttggtagggctctt tgaggacacaaacctttgcgccatccatgctaagcgagtgactattatgcccaaagaca
Hrasls HRAS-like suppressor Entrez Gene ID No. 57110 (SEQ ID NO: 46) agagcaggccaaccgagcgataagtaccgttgagtttgtgacagctgctgttggtgtcttctcattcctgggct tgtttccaaaaggacaaagagcaaaatactattaacaatttaccaaagagatattgatattgaaggaatttgggaggagg aaaagaaacctggggtgaatacttattttcagtgcatcattactgttccagattcctatgatggatggc
Ibrdc2 IBR domain containing 3 (SEQ ID NO: 47) cagccagtggctgtggtctacagaattgtttcatataaaatacgggtagagtggtagagtttcaaaactttcgt catagatatctgggacctttctcaggatctgtgttcacacagccaatagatttggaatcaggcctaagagtacacatgga gggtaaatattaaagtgcgtattatgtacatctagaatccatgtgacttgcagcctacctgtaatttctatccattgagc atgcatggatatacccaatagtacacacaaaataaatgtttacttaagagccattctaaaaaannnnnannnaaatggtt tattgtaaatctgcctaaagattttttgcatattatatatgtgaattttggttgtaagttcataacttacccaagggtat agactcataactcttttaaaacagtgcttagtacaatatcctgccatctctgtaaaaacgctaattgataaccgagtcat ttacatgttttcgaacacagaatagctcttttctcagcatcattattgctctttcagcatc
Kiaal729 KIAA1729 protein Entrez Gene ID No. 85460 (SEQ ID NO: 48) gattccagaatctctacctttaaacactatgttaccacttacttctcttcaaattttattgagcattagatgtt tccagtatttagaagtcaaatgcttcgtttttaataggaacttacacagtcttttatgtttttttatagccctcaatgtc actgatgtggattctcccaaactcgatactttgtttgtttttatgtccccataataagtctttaagaaaacagggcaagt gagctcaaaatcaaaagaaaacccaccaacagtgaatgcattcagggctatttccaggtctttcttttgaagaaagataa gactcagtccagagagcacatctgtgacacaccgtgcctcttgcctttggtgcgtggcagtcatctttggctcatgctgt acattattctac
Klfl2 Kruppel-like factor 12 Entrez Gene ID No. 11278 (SEQ ID NO: 49) gtttcgattctgttttgttcatctgttcgagcagaggggcagttgaagtctcgtcctggtctctgccctggcat ggactggcacagaggtgttctgtagttgaataggaagagcctgtctaaaaaactactgccccacttcaaattgcagtgtt ctgtcacctaggcatcatctcttcctgcccctagtatttgattacaaggaaccaggggaaaaaaactttcttagacacac tggcaccaaggtaagaggtggggctgcccaggcaaagtcagtgaacatgaaaactcagacaaagcagagatggaaataat gcgcctcttgaggagaaaagcaataatgaataaaaggactttcctacaataacttcactgaggactcacgttaccaattt tcatacttactaaagggattgtaaaaaacaccccagcattttaggtgtcttggttccatttacagcactgaggtaatctt tctgctgtttgttgtcctgcttggttgagtacc
Loc253012 hypothetical protein LOC253012 Entrez Gene ID No. 253012 (SEQ ID NO: 50) ctcattattcctttacatgcagaatagaggcatttatgcaaattgaactgcagtttttcagcatatacacaatg tcttgtgcaacagaaaaacatgttggggaaatattcctcagtggagagtcgttctcatgctgacggggagaacgaaagtg acaggggtttcctcataagttttgtatgaaatatctctacaaacctcaattagttctactctacactttcactatcatca acactgagactatcctgtctcacctacaaatgtggaaactttacattgttcgatttttcagcagact
Loc253039 hypothetical protein LOC253039 Entrez Gene ID No. 253039 (SEQ ID NO: 51) gaacttaagttcacacacccttgtactgcaggacggggaatggaacctaggtcttcttatttttggttcagtgt taactcccattctctaagcagactgggcctgttattcaaactgccttcccataggtgcttccctgcttctctcctcaccc agagaaggacttacaaacagcttatcttncagaggttttgtgcctgatagttatggaatgtgctggtttgagcagggagg atgtaaggggagggaatgctaaaaggctgtctacttagagtcaggtttcctgggtaagtccctggaaccccatccccttc ccctttcttgagaccccaggacttgctccagtaactgccaccctgtgcctttgcttcagggccatgctggataaggagct ggctgcctctgtgaacatcctactcaaggcatcttcactgtgagttttgctgttgccattggaggggnngtggggggagt gtggggagtgctagggtcaggtcctggctggtgtaaagaac
Loc91431 prematurely terminated mRNA decay factor-like Entrez Gene ID No. 91431 (SEQ ID NO: 52) gactttcaccatcctgatattaaaactgtgcaggtgtccacagtagatgcttttcagggagctgaaaaggagat cattattctgtcctgtgtaaggacaagacaagtaggattcattgattcagaaaaaagaatgaatgttgcattgactagag gaaagaggcatttgttgattgtgggaaatttagcctgtttgaggaaaaatcaactttggggacgagtgatccaacactgc gaaggaagggaagatggattgcaacatgcaaaccagtatgaaccacagctgaaccatctccttaaagattatttt
Lrplβ LRP16 protein Entrez Gene ID No. 28992 (SEQ ID NO: 53) gtaagactggcaaggccaagatcaccggcggctatcggctcccggccaagtacgtcatccacacagtggggccc atcgcctacggggagcccagcgccagccaggctgccgagctccgcagctgctacctgagcagtctggacctgctgctgga gcaccggctccgctcggtggcgttcccctgcatctccaccggcgtgtttggctacccctgtgaggcggccgccgagatcg tgctggccacgctgcgagagtggctggagcagcacaaggacaaggtggaccggctgatcatctgcgtgttcctcgagaag gacgaggacatctaccggagccggctcccccactacttccccgtggcctgaggctcccgcagcccaccctgaccgggact gacccgccttcgggaccccgctcccagctctgagaggtcgccaaagcctgcagcctggcctgggcctggccaccccttct ttccctccgcgccccgcccccgaggagcctaataaagatctcgttgtggcaaaaa
Mical3 microtubule associated monoxygenase, calponin and LIM domain containing 3
Entrez Gene ID No. 57553 (SEQ ID NO: 54) gggccccaagagcagactaggaacgcagggggctgctgctgccaggacnccacggagagccgggcacccgcctc acatgtctcctgtctggctccactgagttagccgtttgagcccactcctatcttttggtggttagtgcatcttcagctct tttctgcaagacactggaacattcctaggctgtcccaaaaggagttccaccatagcctttaaggtccgagcagggcacca aggggttcacttttctcccgagccattcagcttggggtgcctgcgggaggggcggacagccnagccggcttcccggcggc ggtacgagagcccaacaggagaggattagctgtgccaaggaacacgccactgctgcctgtctactgcccgccttctctcc acttccatttttgcctttgtttttaacttgtgctcttgtgagttcttggtgtgtttctttgt
Mtap methylthioadenosine phosphorylase Entrez Gene ID No. 4507 (SEQ ID NO: 55) acaggactatttgccacgacatttcaaaggattccaagagagaatattggtgtccatgctgtgatgattcctca gctcctctcatctgatctccgtcctggcccccatgactttctttgcggtagttagggtgtggtatgtgccactgaggccc acacctattggcaatttatagcactgatctgtcatcaataccacttgctgtcttggatgtgaagatgatttttcctgcag ggattccctctacaaaattaaaaacactgggcatgtggaaataatattcacgctttaaattgtcttttctattcactaca ccaggggtccccgacccctaggcaacagactgtggccctagtgtagtgaatagaaaagacaatttaaagcatgaatatta tttcctcatgcccagtgtttttaattttggtactggtctgtggcttgttagaaa
Mtmr3 myotubulaπn related protein 3 Entrez Gene ID No. 8897 (SEQ ID NO: 56) agccgtcagctgtctgctatgagctgcagctctgcccacttacactcaaggaacttgcaccacaagtggctgca tagccactcaggaaggccatctgcaaccagcagccccgaccagccttcccgcagccacctggacgatgatggcatgtcag tgtacacagacacgatccaacagcgcctgcgtcagattgagtcaggccaccagcaggaagtagaaactttgaagaaacaa gtccaggagctgaagagtcgcctggagagccagtacctgaccagctccctacactttaatggagactttggggatgaggt gatgacccgttggcttcctgaccacctggccgcccactgctatgcgtgcgacagtgccttctggcttgccagcaggaagc accactgcaggaattgtgggaacgtattctgctccagttgttgtaaccagaaggttccagttcccagccagcagctcttt gaacccagtcgagtatgcaagtcttgctatagcagcctacatcccacaagctccagcattgaccttgaactg
P2ryl2 purinergic receptor P2Y, G-protein coupled Entrez Gene ID No. 12 64805 (SEQ ID NO: 57) aaatgtatatatatcctagtcccctaaccaaatcctgacctattgggatacttataaaaatttaagtaagtggg atacacaaagaataataactattaacttttcattattagcaaaaacctaagggatttaaactaattgaaactgtatttga ttggacttaattttttatgtttatttagaagataaagatttaaagaagacctttacaataaagagaagaaatatcgaagt cattaaaataaggagacttacttttatgacattctaatactaaaaaatatagaaatatttccttaattctagagaaacta gttttactaattttttacaacttcaataataccatcactgacacttacctttattaattagcttctagaaaatagctgct aattaggttaatgaacattttaccttagtgnaaaaaaattaattaaatatgattacaaagttgcacagcataactactga gaggaaagtgattgatctgtttgtaattacttgt
Rad54b RAD54 homolog B (S. cerevisiae) Entrez Gene ID No. 25788 (SEQ ID NO: 58) gtaagcaaggtctttgtggggcagttgtcgacctcaccaagacatctgaacatattcagttttcagtagaagaa cttaaaaatttgttcacattacatgaaagttcagattgtgttactcatgatctgcttgactgtgagtgtacaggagaaga agttcatacaggtgattcgttggaaaaattcattgtctctagagattgtcagcttggtccacatcaccagaaatctaact ccctgaaacctctttctatgtcccagctgaagcaatggaaacatttttctggagatcatttaaatcttacagatcctttt cttgaaagaataacagaaaatgtgtcattcatttttcagaatataaccactcaagctactggcacatagtgaaagattac ttctgacattcca
Ralgps2 RaI GEF with PH domain and SH3 binding motif 2 Entrez Gene ID No. 55103 (SEQ ID NO: 59) acaataattagatctttttccaagttaattgggttttcccttctcccagtcataggtggtttttatcatcaaga cagactgatattttgtcaggatattttcttttacagtgtttgatgtgcataatgccagagttatttttttattattcatt ttctctctttttgttcaatatgagattcaggatcatatttgtttaaaaggtaacacatagagatgtatgtatatattttg ttataagacatacaaaataattttaagagggataaaggtgaaaatatcagattctggaaattttaagtatctaaacttta tacttgtatgatttaccataaacataccaaaacatttttctgaaaatttactgtcggtctctgacatgaaaccgtatttt gtcagtagttgaccaagcagttttatgagaactcttctatgcaatgatgca
Rttn rotatin Entrez Gene ID No. 25914 (SEQ ID NO: 60) cttgctgcctgtctggaaagtgagaatcaaaatgctcagaggattggagcagctgcccttgggctctgatttac aattatcagaaggcaaaaacagctttgaaaagcccatcagtaaaaagaagagtggatgaagcatactccttagcaaagaa aactttcccaaactcagaagcaaaccctctaaatgcctattatttgaaatgtcttgaaaacctcgtgcagctccttaatt cttcctgagtgccatgggatgctacaccttgaagctgacagtcatcaacaggggagctaaagttgaagccagctgtgtgt agcagctgttacctgaagacgtgctacctctctacaaagtgttgatccccttctttcccatgagagagagaactggtgat actccaacaccgtccagttgtggcagc
Scoc short coiled-coil protein Entrez Gene ID No. 60592 (SEQ ID NO: 61) caagagtagatgcagttaaggaagaaaatctgaagctaaaatcagaaaaccaagttcttggacaatatatagaa aatctcatgtcagcttctagtgtttttcaaacaactgacacaaaaagcaaaagaaagtaagggattgacacccttctgtt ttatggaattgctgctgatcattttttctttaaaacttggatagattccaaaagttacagtacctttgtggcttcattga atatttatgaagataatgtcagatgtagacaaaaataacacaataacaggagacttccataagtttgtgtattatgttag tctatgaaaacgtgcaaatgtattgtagagactttatg
Speccl spectrin domain with coiled-coils 1 Entrez Gene ID No. 92521 (SEQ ID NO: 62) agctgaagactctgaccaagcagatgaaggaggagaccgaggaatggaggcggttccaggcggatctgcagacc gcagtggtggtggccaatgacatcaagtgtgaggcccagcaggagctgcgcaccgtgaagaggaaactgctggaggagga ggagaagaatgcccggttgcagaaggagctgggggatgtgcagggccacggcagggtggtcaccagcagagccgcccctc cctccctgggctctgtcagctagcagagcatttggtggaagaaagacagcccagctcttgccatgattgggagccgcagc ccatctctagatgaaagggggaatgtgtagaggagaaattgcctctttataaagagcccagttgtctccttgtgacattc tctgttctcagagtcattgccgtcgagtctctgctttttgtccacattttgggatcagcttactgca
Tpp2 tπpeptidyl peptidase II Entrez Gene ID No. 7174 (SEQ ID NO: 63) gaagagtgcttaaggttgaagtacaatggcacaatctcggctcacctcgacctctgcttcctgtattcaagtga ttcttctgcctcagcctcccgagtagctgggattacaggcatgcgccatgacacttggctaattttttngtgtgttttta gtagagatggaattttgccatgttggccaggctggtctcaaactcctgacctcaagtgatccacccacctcgacctccca aagtgctggtattataggcatgagccaccatgcctggcctcatttatttttaaatagctgcagtaatcccggctttagat naaancacatgaactaataatatcactagtgttca
Vil2 villin 2 (ezrin) Entrez Gene ID No. 7430 (SEQ ID NO: 64) agagctgagtcatcctagagcaaacctctggagtggagagcgaactacttcattcccctcccttagcctgggcc agagagactccagctctgccttctccagccaaaaaatcaaaggcagatgggagaacagccttcagctttggataacgatg aaatatctggcaccactgatgaatattaaactttctataacc
Znf204 zinc finger protein 204 Entrez Gene ID No. 7754 (SEQ ID NO: 65) gagcacatatcttacaaaacaccaaaaaattcatagtgaagagaaatcaaatatacatactgagtgtggggaan ccattagacaaaactcttctttttnacaacaataaaancctcacactggagagnttctctgaatgccttaagaatttggt taatatggagacccttcccagggaaacagaaggaggatcgtgaaaactgttgactacttagaatgatcacatggtttagt ggagagagcatgattctgggttttaaaagtcatggatctcaatctcagctcctattactaactagatcttttactttggg gtaagtcacttcatatctttaggccttaatttcctcatctgaaaaactggaaggcctgacttgttgagcttta
Znf24 zinc finger protein 24 Entrez Gene ID No. 7572 (SEQ ID NO: 66) ggcactgtgtaatcattccttgaagtagttggagatggtgctggtatgccactgaatgaggtctgagcaggttt tcttcacatctgaggggacagtgccagccagtcaacttttggggtggggctgaagtctgctgaaaatctgcagttttaca tgtttcatgggacattcttctgtgcaataaagtttgaga
Amn amnionless Entrez Gene ID No. 81693 (SEQ ID NO: 67) tactggtgacacttcatggctgcgacccagaatgaacttaatgcacacagggacgcagggtgtcactggtcctg ggcctttgtccatgactaggtggtcagcaggacttctgcagctgactgtgcaatggctaaatgaaaagaaggccacagac taacctccactttcctgtcttcaaaattctagtgacactgggaatgctataggacctcctactattctcttaaggtccta ggaaagtttcaggaactagggaaaagactgggtactgaggctgtgtccccagatgtctgcttccgaagcagccgcgtcat gacgggtttctgctgaggaagtggtgttggcagggccccatatgccctctcgggttgtcaggggtgggagacaggctgta tgggggtccttcatgtgcagatggaacagcatcgcctcacagctgtgcagacgaacagatgtggtctactgccacgaaca atgcgg
Ankrdl3 bankyrin repeat domain 13B Entrez Gene ID No. 124930 (SEQ ID NO: 68) cctcatggtgcctcggagagtggggagcatattgggctgnggtaagcactagacccaagtagactggacacaaa gggctcgcccagggccntggcgccacccccaccccttcccaccagctgctgctagcctctgtggttgtacatcccacttg cccccacacggagactgactctaaaacccttcatccaatggtgntaacccccggctntcccctgccccacctcacccacc cagagaagcacagaccccgccaggggcaggggcccaccgcacacccttgtcccgggcctgtctgggactggccttcccgg ntcagcnagnnnnnnncagaagggacacaaagagggatggaagaaaagaacaaagagaaactgttcctcccacccccttc cctgatgccaggggcaccagactgattctgagg
Ankrd57 ankyrin repeat domain 57 Entrez Gene ID No. 65124 (SEQ ID NO: 69) gtcatttaccatggttttcccactgaaggctttaacttttctgataaaataatattttaaattttcaaaaaccc attcctgaggagaactacttctagcattccttttcatgatgtgcttttgtgcagtaagtagcattttcggctacttaact ttacattcctcttatttttcagtttccagtcaagattataaaaagcaaatgattgatataatttgatattcatagagttg tgcctacctttaatggaaaaatacatgtcagatacttagatgtttattgatatgagactatgtggttaaaaaacccaagt atgtccatgtgtttcttataaggtacacttgaaactagtgagtgtttgtcacatttcactttcatggtatataaaatgca gtttgcatatataacttgaatatctggtactagttttttcacgcctgcaatcttggagtctaggttgccttgtctct
Apobec4 apolipoprotein B mRNA editing enzyme, catalytic polypeptide-like 4 (putative) Entrez Gene ID No. 403314 (SEQ ID NO: 70) aaatccaagttcctcttactggctttcaaggatcctcctttaacttcctgttgccttgtctcatcagcaagatc ataagtacctacaggtcaagcactgtctctcccttctctttagcttttcccttaggatctagcacattacccagcaaaat gtgagtagcaaggctgaaatgacatctcaataacttcaccaatgattgtaactcagcatcccttctccatcccagctgaa agcctgcttcaccatcctgcaagagatgttttttctttttgttagcatccattcccctttctaatgcagctcccaatgca taatgtgtg
Btnl9 butyrophilin-like 9 Entrez Gene ID No. 153579 (SEQ ID NO: 71) ggtcatcgaatctgcatgcatccctcatacatctggagacttcgtgaaggttccagagttactgactgagattt ctgagcttttttccccttttctgtttggtttcagagtggagagcagcccaaaaatatgcaggtaactgaagccaggaaac tgatttgtgttttggtttggnccggatncttnaaacagaagggaggtggagagatctgagattagaggacggggctttat aggagnccaagtatggggcctgcacacacaagacacacacgcacacttgcaaacacgccacacgacacatatgcctgcat gtgtatgcacacacatgcacacgtgagctcccaaacacatcgctccttggggttacactaggtttgtttccatctggctt gaggctatttgcaggcgagagtgcagagtctgtaatgaacctcccagattctctgacgaaggggtcccc
Cllorf71 chromosome 11 open reading frame 71 Entrez Gene ID No. 54494 (SEQ ID NO: 72) ttcctgtgtgcttagtcatcgggtccgacacaggctggactgatctggggagccgcgaagggcctgccttcaca aagggacgtaacgcaagtactgcgggcagtgtttgaatatggccctgaacaatgtgtccctgtcctccggtgatcagagg agcagggtggcctaccgctcttcccatggcgacctcagaccgcgggcgtcagcgttggcgatggtctccggagacggctt cctcgtttccaggcctgaagcgattcatctaggacctcggcaggcggtgcgaccaagcgttcgggccgagagccgtcgag tggatggtggcggccggagcccaagggaaccagatggccggggccggagccgccaagccagattctcaccttacccaatc cctgccgttgaacccgatctcctaagaagtgtgctgcaacagcgtttgattgcattaggaggtgttatcgcagctcgaat ttcagtttaaacgaacacctttcctctggccctcacttagcttgtgaacag
C14orfl45 chromosome 14 open reading frame 145 Entrez Gene ID No. 145508 (SEQ ID NO: 73) gaaatgcatgggacaggtgactgacatgactgcatcgtggtttagatgtatagataacacggggaggtgcttta cattttaagactttgttcataattcttttatttatggtttctctgaatcattcttttggaacattctaaaagagccagag ga
Clorf89 chromosome 1 open reading frame Entrez Gene ID No. 8979363 (SEQ ID NO: 74) cgggtgaagagtgtgccggggcggcggctggctgatgggcgcacactggacgggcgggctgggctggccgacgt tgcccacatactcaatggccttgctgagcagctgtggcaccaggaccaggtggcggctggcctgcttcccaaccccccag agagtgctcctgaatgagtcacgagtggttgcctgtgatcccacccccaaccctcaggtctcgacatagggctggaggct ggggcaggaacatggatcctatctggaggactggccagcatggcctgatcagggaggatgtggccagagaaggcccaccc gcgagcagcgctttccttgcagaattcatggcagggaggtggggaccaaggccctgagctcgaacatctcccgtggcctt tccccctttggcagcaccgatggaggatgactgggagagggggtgcctctcaagttacttcaatcaagaacctgtattgg ttgaggtgacaccatctgttgtaacag
C20orf7 chromosome 20 open reading frame Entrez Gene ID No. 779133 (SEQ ID NO: 75) tgaatgaccttcctagagcacttgagcagattcattatattttaaaaccagatggagtgtttatcggtgcaatg tttggaggcgacacactctatgaacttcggtgttccttacagttagcggaaacggaaagggaaggaggattttctccaca catttctcctttcactgctgtcaatgacctgggacatctgcttgggagagctggctttaatactctgactgtggacactg atgaaattcaagttaactatcctggaatgtttgaattgatggaagatttacaaggtatgggtgagagtaactgtgcttgg aatagaaaagccctgctgcatcgagacacaatgctggcagctgcggcagtgtacagagaaatgtacagaaatgaagatgg ttcagtacctgctacataccagatctattacatgataggatggaaatatcatgagtcacaggcaagaccagctgaaagag gttccgcaactgtgtcattt
Ccdc88a coiled-coil domain containing 88A Entrez Gene ID No. 55704 (SEQ ID NO: 76) acatatgtacagtatcagtagggaaaatgtaaaaagatgttgttttcttttgtcatttaattaggccatctgtc ctgttttaaagaaatagttaataattcaacactttatataacaaatattaactaatacccatatttataaaacatttttc agatttaaaagattgttaatacttataaacttagtgttattcttagaaaaccccatcaaatttaaatgtgatttacacag tgactaggaacatttgtatttattgtttcttctctgcacttttcatcatctgataaatacaagagctcaagtaactgtct tttcttcaagatggcttctatacttgaaatcagttaatacaatagtttttccagt
Ccne2 cyclin E2 Entrez Gene ID No. 9134 (SEQ ID NO: 77) gaggaagtcactttactactctaagatatccctaaggaatttttttttttaatttagtgtgactaaggctttat ttatgtttgtgaaactgttaaggtcctttctaaattcctccattgtgagataaggacagtgtcaaagtgataaagcttaa cacttgacctaaacttctattttcttaaggaagaagagtattaaatatatactgactcctagaaatctatttattaaaaa aagacatgaaaacttgctgtacataggctagctatttctaaatattttaaattagcttttctaaaaaaaaaatccagcct cataaagtagattagaaaactagattgctagtttattttgttatcagatatgtgaatctcttctccctttgaagaaacta tacatttattgttacggtatgaagtcttctgtatagtttgtttttaaactaatatttgtttcagtattttgtctgaaaag aaaacaccactaattgtgtacatatgtattatataaacttaaccttttaatactgtttatttttagcccattgtt
Ceacamβ carcinoembryonic antigen-related cell adhesion molecule 6 (non-specific cross reacting antigen) Entrez Gene ID No. 4680 (SEQ ID NO: 78) gttttaattcaacccagccatgcaatgccaaataatagaattgctccctaccagctgaacagggaggagtctgt gcagtttctgacacttgttgttgaacatggctaaatacaatgggtatcgctgagactaagttgtagaaattaacaaatgt gctgcttggttaaaatggctacactcatctgactcattctttattctattttagttggtttgtatcttgcctaaggtgcg tagtccaactcttggtattaccctcctaatagtcatactagtagtcatactccctggtgtagtgtattctctaaaagctt taaatgtctgcatgcagccagccatcaaatagtgaatggtctctctttggctggaattacaaaactcagagaaatgtgtc atcaggagaacatcataacccatgaaggataaaagccccaaatggtggtaactgataatagcactaatgctttaagattt ggtcacactctcacctaggtgagcgcattgagccagtggtg
Chrnb3 cholinergic receptor, nicotinic, beta 3 Entrez Gene ID No. 1142 (SEQ ID NO: 79) tgatttttgtgaccctgtccatcattgttaccgtgtttgtcattaacgttcaccacagatcttcttccacgtac caccccatggccccctgggttaagaggctctttctgcagaaacttccaaaattactttgcatgaaagatcatgtggatcg ctactcatccccagagaaagaggagagtcaaccagtagtgaaaggcaaagtcctcgaaaaaaagaaacagaaacagctta gtgatggagaaaaagttctagttgcttttttggaaaaagctgctgattccattagatacatttcgagacatgtgaagaaa gaacattttatcagccaggtagtacaagactggaaatttgtagctcaagttcttgaccgaatcttcctgtggctctttct gatagtgtcagtaacaggctcggttctgatttttacccctgctttgaagatgtggctacatagttaccattaggaattta aaagacataagactaaattacaccttagacctgacatctggcta
Cllul chronic lymphocytic leukemia up-regulated 1 Entrez Gene ID No. 574028 (SEQ ID NO: 80) cagacacatatacaggaaagaccatgcgaagaagacacagagaggaaacggccatctacaatccaaggagagag gcctcagaacaagccaaccctgcagataccttgatctaggcatccagaattgtatgaaaatac
Cnnml cyclin Ml Entrez Gene ID No. 26507 (SEQ ID NO: 81) agacaggagggccacagcgtgtggaagtaaagactttggagctagagatgccttttccagcaatgattattgac ttcaccacaccccttgcctggcctggcctgaggctcagcagtgcatgacttctcgtagataacttcacagtcatccagtc ccaacacctgctcttgcctggtaggaacaggcgaagtgtcagccctcaatgttgggtacttagacccaaaccaataaatg gtgagttttgaacaagaactaccatcatgcaggcttcttgcccagctgaccactggccccggggtgcctgcctggctggt cttcatcacctgaggccaccaggctcaagccactgctgttgcattacacccatccctttgcaaaatccctatggagcctg tcaccactcccctccctatatacccccaccccacaaagattttcttcag
Cnot2 CCR4-NOT transcription complex, subunit 2 Entrez Gene ID No. 4848 (SEQ ID NO: 82) gtgacgttggtaggaaagcatttctttacatggaggtttattttgtgggacattacctcctctggatgttactt cctcagtttacaagtagtgtaaatnctcattgattctnttatgaattgtaanggatttnctcttagcttttgagaattta gaatctganatttgaataaaaagtaaatatattcagtataattntncaaaatgctctagtttcaagatanttaaaanatt atgtggaatttacataattaattcnaaatatagtttgtatttagttccnttatcaaataatgcaaatagttggnagatac ctcaatttcttttgagtgttaagnaagnagncaagnaaaggnagtgaagtttttgcaacacattgtgtctttatttggtc tgcctatgtttttatcacattgcttataaaacttttaaaatccttgtttgtataaaaagtttctttagttaaataaaagt gtgtgtattaattagtgtgccttctggacaaattaagaaatattttttctatatttcaatgcggttgtatt
Dhfr dihydrofolate reductase Entrez Gene ID No. 1719 (SEQ ID NO: 83) tcagatatttccagagaatgaccacaacctcttcagtagaaggtaaacagaatctggtgattatgggtaagaag acctggttctccattcctgagaagaatcgacctttaaagggtagaattaatttagttctcagcagagaactcaaggaacc tccacaaggagctcattttctttccagaagtctagatgatgccttaaaacttactgaacaaccagaattagcaaataaag tagacatggtctggatagttggtggcagttctgtttataaggaagccatgaatcacccaggccatcttaaactatttgtg acaaggatcatgcaagactttgaaagtgacacgttttttccagaaattgatttggagaaatataaacttctgccagaata cccaggtgttctctctgatgtccaggagga
Ξif4a2 eukaryotic translation initiation factor 4A, isoform 2 Entrez Gene ID No. 1974 (SEQ ID NO: 84) ataccacttagtatagttcgctactattttgtggcctacatgacaggtgtcaagntttttttgaatcaattttt aaaacatgccattgtgtttcaggctcgcgggattgatgtgcaacaagtgtctttggttataaattatnatcnnnctanca gtcgttgaaaactatanttcacaggtgnagaagccagcatcttggctgtattgaaaaaacttcatacgtttttctactgt gatttgtatgaaaggtaacatcaaatcaaggaatagattcagtaaagtcagtagtgttcagtaagatgatgtaattaaat ttgtactagggaaggttgatgagaacaaagtgggaaaacttgtaaacattgcccagattgtggacatagggttnttttcc acnaattgttggtcttaccttatgcttgagcttttagtgatgttcttgtgtccatgtgtttttcttggtgattttttnct atangttgggattttcnttggtgtcgnctggtagnnnnnnnantgaaccctggtttagttatagtggctttatccctaaa ta
Fa2h fatty acid 2-hydroxylase Entrez Gene ID No. 79152 (SEQ ID NO: 85) ctactcgggcgctcccagaaggagccacctctcagtgcctcacctccccctgcctcccagcctccgcagatgag gttcctgccccttcctcctcgtaaccaaaaccctcactgctcccaggacggtcttatttataaaccagatacatgttctt agtctggtcccagaccaaggagctggtcagacggccctttctaatcctacatgttgagcttatgtaaaaaatgttgtttc ctcctgtttttggttcctttcttacccacaaaccattactacttgaaacttaaaaaactcgccaagtgtaaaggctaaag agaagcagtttgacggaccttgtgatttgtactgtttgctgcggagctattta
Fbxol5 F-box protein 15 Entrez Gene ID No. 201456 (SEQ ID NO: 86) gagaacacctacctcttattggaaaagttggcctctcgtggaaaactgatatttttgatggctgtataaagagt tgttccatgatggacgtaactcttttggatgaacatgggaaacccttttggtgtttcagttccccggtgtgcctgagatc gcctgccacaccctctgacagctctagcttcttgggacagacatacaacgtggactacgttgatgcggaaggaagagtgc acgtggagctggtgtggatcagagagaccgaagaataccttattgtcaacctggtcctttatcttagtatcgcaaaaatc aaccattggtttgggactgaatattagcagtaggtggcaaattattgttgttatttagttgtttatttttgactggcttt gttcttg
Gins4 GINS complex subunit 4 (Sld5 homolog) Entrez Gene ID No. 84296 (SEQ ID NO: 87) gccaggctttgtggtatgtacctttagtcccagctactctggaggctgaggcaggaggatcacttaagccttgg aggtcaagaatgcagtgagccattatcatgccactgtgtgaccagaaaccagatgtagccatttcaagcataaaacatga tatttttgttttccttggactgaaacatagtctgggtcctcaacgttgccggtgatgatggttgaacatcatgtttttta taaaccttaatttctcatttaataggaagaaaatctcaggagagccaaaagggaggacctgaaggtcagcatccaccaaa tggagatggagaggatccgctacgtcctcagcagctacttgcggtgtcgcctcatgaaggtttgacgtggagatacctca aagtctccgacct
Grhll grainyhead-like 1 (Drosophila) Entrez Gene ID No. 29841 (SEQ ID NO:
aaaacactactgcaatcacgtctttngttatgctagtatcagtcagatgcacttagagtgaagaaacactgtaa ttacagcacacagattgcaagtattgcgtaccaagtgatacaactcgaaatgcagttctcatcttcctgttttgagaaat gattattttatcacgcatcagagccttcgtgctttgattatcttgtatgttaacaattctagaaaacattcatgaattca cnaaaatangttactatggcaggggaacattttgtacacatttaagtatataaaaatactaaaatatgtaattttataac aaagtcacgggtatctttaggttcagggaactagactaggtcattcgtgtaaatggactggtagttacagtcttaggtta aagtattctaatgaagtatgggaactaaattgctggttttctaag
Gtpbpδ GTP-binding protein 8 (putative) Entrez Gene ID No. 29083 (SEQ ID NO: 89) ttctcttgccctttacaaattagttttctcacttaaagctatttttgttttttgctttttcactagtgaaaatg ttacttcccccatgannnnanntnnnntntnntanatctacctgtgaattttgctatatttctttgttggtttggcttta caaatatgtagctgtcttctcacatgttacctgctgtaaaaccattcatttgaatcttaatagctttcacgtttacagta acaaatgaatttccgagaaatcaagtaagttgcccaagatccaacatatataataaacatcagaactagaacttgaattc tgttctttcggttgtttccaacatggactaacacattttatcaagaatgttttcaatattcaaataaggactcgaaaaaa taggcttacatagtaacttttatccatcaacttacctatcgatgct
Heatrβ HEAT repeat containing Entrez Gene ID No. 663897 (SEQ ID NO: 90) agggagatgacactggagcaccccacagcccacaggaaagagaccagatggtcagaatggcccttaaacacatg ggcagcatccaggcaccaactggagacacagccagaagggccatcatgggctttttagaagagatcctggccgtttgttt tgactcatctggatcacaaggggcactcccagggttaacaaatcagtgaagatcccaccatactttctagatgtcgaagg cggcagtaggaagacctgagcttgagcataagatctgtgggatttcatcttaggggcagaaacaatccgttcactattta tttagaatgacttagcagccatttaaattttcacagagggctcaaccacctttggagtgactccatagcactggccatgg tcagggttgttggaacatctgacctgtgcatccaggagccgaggagtcaggttgtaatacaggccaagcagacgggcttt gagggcattta
Herpud2 HERPUD family member 2 Entrez Gene ID No. 64224 (SEQ ID NO: 91) aaactaaacatcatatgttctcatatgtccctaagctatgaggatgcaaaggcataagaatgatacaatggact ttggggactttcagggaaagggtgagaagggcgtaagggataaaagactacaaattgggttcagtatatactgctcgggt gatgggtgcnccaaaatcttaaaaatcgccaaagaacttatgtaactaaataccncctgttccccaaaaaactatggaaa ttaaaaattaaaaaataagtataatttctgctttagcgatattaactattcagtacncaataagtgagtttagcaattca gtgatt
leal intestinal cell kinase Entrez Gene ID No. 3382 (SEQ ID NO: 92) catactgcatgctcaggacccatagatgaactattagacatgaaatctgaggaaggtgcttgcctgggaccagt ggcagggaccccggaacctgaaggtgctgacaaagatgacctgctgctgttgagtgagatcttcaatgcttcctccttgg aagagggcgagttcagcaaagagtgggccgctgtgtttggagacggccaagtgaaggagccagtgcccactatggccctg ggagagccagaccccaaggcccagacaggctcaggtttccttccttcgcagcttttagaccaaaatatgaaagacttaca ggcctcgctacaagaacctgctaaggctgcctcagacctgactgcctggttcagcctcttcgctgacctcgacccactct caaatcctgatgctgttgggaaaaccgataaagaacacgaattgctcaatgcatgaatctgtacccttcggagggcactc acat
IgI immunoglobulin lambda chain, variable 1 Entrez Gene ID No. 3535 (SEQ ID NO: 93) tctggatccaaagacgcttcggccaatgcagggattttactcatctctggcctccagtctgaggatgaggctga ctattactgtatgatttggcgcggcaccgctgtggtatttggcggagggac
1115 interleukin 17 receptor A Entrez Gene ID No. 3600 (SEQ ID NO: 94) gaagatcttattcaatctatgcatattgatgctactttatatacggaaagtgatgttcaccccagttgcaaagt aacagcaatgaagtgctttctcttggagttacaagttatttcacttgagtccggagatgcaagtattcatgatacagtag aaaatctgatcatcctagcaaacaacagtttgtcttctaatgggaatgtaacagaatctggatgcaaagaatgtgaggaa ctggaggaaaaaaatattaaagaatttttgcagagttttgtacata
I117rc interleukin 17 receptor C Entrez Gene ID No. 84818 (SEQ ID NO: 95) gctgcccgcagaagcgcacatgtgcnnnnnggctncnggtngggacccctnncanncantgnnccnnncgcttt cctgggagaangtcactgtggacnaggttctcgagttnccattgntgaaaggncncccnnnnnnnnntntnnnncaggtg aannnnnnnnnnnnnnngcagctgcaggagtgcttgtgggctgactccctggggcctctcaaagacgatgtgctactgtt ggagacacgaggcccccaggacaacagatccctctgtgccttggaacccagtggctgtacttcactacccagcaaagcct ccacgagggcagctcgccttggagagtacttactacaagacctgcagtcaggccagtgtctgcagctatgggacgatgac ttgggagcgctatgggcctgccccatggacaaatacatccacaagcgctgggccctcgtgtggctggcctgcctactctt tnnngctgcgctttccctcatcctccttctcaaaaaggatcacgcgaaagggtggctgaggctcttgaaacaggac
Insc insulin induced gene 1 Entrez Gene ID No. 387755 (SEQ ID NO: 96) tccttcttactctgcagcaacatggaggagagttttgtgtagtgagtgtgggngaagaaatacatttggctgtt ctcacaccccctctgactatgcaccagtgaacacatctgagtacataccagctctcctcatcttcttatttatacttaac ttatttttgtgtgaaataaatggaggacgaaatcttagagcaacatcatcaaacagtctttggtccttgagaatcttctt tgtgttttattttttgatttctgtagcttttcagttgcagatgttgaaattcgtaatgacaaatatgacaaattgtcatg ggtgattccacttcatcttattttttctactctcactatacaatcttgcctcattttttaaaactttggaaccagaggat ttcaactgcctagca
Ipoll Intracisternal A particle-promoted polypeptide Entrez Gene ID No. 51194 (SEQ ID NO: 97) gagactacagcagtgttacctgtgcaaatacaacttactacttctgttaccttgaacttggaaaaaaacagtgc tctaccgaatgatgctgcttcaatgtcagggaaaacatctctaatttgtacacaagaagttgagaagttgaatgaggcnt ttgacattttgctagcttttttcatcttagcttgtgttttaatcanttttttgatctacaaagttgttcagtttaaacaa aaactaaaggcatcagaaaactcaagggaaaatagacttgaatactacagcttttatcagtcagcaaggtataatgtaac tgcctcaatttgtaacacttccccaaattctctagaaagtcctggcttggagcagattcgacttcataaacaaantgttc ctgaaaatgaggcacaggtcattctttttgaacattctgctttataactcaactaaatattgtctataagaaacttcagt gccatggacatgatt
Itch Integπn alpha FG-GAP repeat containing 1 Entrez Gene ID No. 83737 (SEQ ID NO: 98) gatcattggtatgtcaatctcttgatgaaaaatcagtacctgaatatgtctttttgtttttttaagagacaggg tcttgctatgttgcccaggcaggatttgaactcctgggatcctcccacctcagcctcccgagtacaatacctgaatttta aatagagttattgtaagtcttatgaaatgagattttgctgcactctgacataagataataaaagacagagcaggaattca ttattatgagctgcttgatcagttttaaaccactccatttgatgaaacaagtgaggtccttccctcctgaccaggctgtg gaatgctgtcttccccaacccccaccccctgcaaaagagcagaacaataaggcaattgctcatttt
Itfgl integrin alpha 2b Entrez Gene ID No. 81533 (SEQ ID NO: 99) gcagggaaaacacagtccactccccaccaccactccgctccttccacagcaaatggggactgctcagaaaaccc tgtcctttcttttcctctcttcaaaggcaggcatgtgattgaggatgtgatggtgacttctggcctgttttattttgtgg taacttcactttagtcagggaaataattggaatatctttaatctgatgtagtttgacctttagaaattgaaagtgaaaca gctattgttgataattcacaaagtattaataaaacttctattacctgtaaaaannnnnnacttaatctgcgagaaaacta tttagaatattatggaattgtgccatagcttctttatttgttcttaattctatattagatttttttttctctgcttcatg aacaagttcagattttaaaacattatgcctgaagacatgtccaactttattttttatatgttatattctggtccaatata ctagagtaataatactctggtatttaggatatctgtcattgaacctcagttacaaattaaacaatagtagctaccatatc taagtgat
Kcnmb4 potassium large conductance calcium-activated channel, subfamily M, beta member 4 Entrez Gene ID No. 27345 (SEQ ID NO: 100) agatgagattggttcccagccatttacttgctattttaatcaacatcaaagaccagatgatgtgcttctgcatc gcactcatgatgagattgtcctcctgcattgcttcctctggcccctggtgacatttgtggtgggcgttctcattgtggtc ctgaccatctgtgccaagagcttggcgatcaaggcggaagccatgaagaagcgcaagttctcttaaaggggaaggaggct tgtagaaagcaaagtacagaagctgtactcatcggcacgcgtccacctgcggaacctgtgtttcctggcgcaggagatgg acagggccacgacagggctctgagaggctcatccctcagtggcaacagaaacaggcacaactggaagacttggaacctca aagcttgtattccatctgctgtagcaatggc
Kifl4 kinesin family member 14 Entrez Gene ID No. 9928 (SEQ ID NO: 101) ggatgtttatggtgaaatggcctgtacaagtttaactaagacaacttaacttgcattgttaatcaaaaattctt ttctcaaagggttaactggttgccattttgaatagtatgttcaagggtgtagcttcctgtttctttccaaattataagta gctacctaaatatagtataattatatattaataatatggcttgctggcacagtagtttaccctgttatctgtgtttcata atgggggctgtatgaatattatttaaaactaataaaatgttgccagaattatactaaactgttggatgagattaggagat cagaggctggaccttctcttgataatgcttgttttgttaaaggtataatgaaataatttgtatatgatttgatgaagatt aaagacccttattttccacagctttaaaaaaaaacctttatttatgatcaagtaataaagataatattctacttgtggga tcttacattatggaaatagtttgacgtttttgacctcaagagtatgtataatttgaagagatactttgtaactatgcttg ggtg
Loc388692 hypothetical gene supported by AK Entrez Gene ID No. 123662 388692 (SEQ ID NO: 102) ctcaacatcataaggaatcagacggatgcggaaaccnagncgggntggatagnaaantctttccaggaaggctc cggggcactcaactggtctccaaccntcccntgcaacntgtgacgcctgccatnttncccatntttaggcgantggcaac gcaanccctccgtttgctctgggcaaaacttcgagagttccctctgaagctggagctttttcctcagatccaagatccaa ttggtcaccaattcgtgatttc
Loc401913 hypothetical LOC401913 Entrez Gene ID No. 401913 (SEQ ID NO: 103) caagcccattttcctgagggtgaaggggacttttattatataggggccttatttggtgggtcagtgctggaggt ttacaggctgatcatggcctgtcaccaggtgatgatgattgaccaagccaaccacatcgaggccctgtggcatgacgaaa gcctcttaaacaagtacctgcttaaccacaaacccactctcccttgagtacatgtgggattaaaaagtcgatggagtata cgttggatgaatacctggtgggtttgtgcaccatgataaactgcaagagatctgtggtcttggtaaataacaatgnggaa atgtgaactgatgagggaagcttccagaaagagaccagagagggggtgattgccagtcagcccgnatcttcctcctgaaa tgctaccctgattta
Loc619208 Entrez Gene ID No. 619208 (SEQ ID NO: 104) ccttgtcaacatcttcgagcatcggcagctccggangccggggtaactggcagcaggtaggaaactatgtgaaa gaatctcctgatgtcataatttccgggtgtcaccggaacatttgatcatcattcctttggcaattccagccttctgtgga aaggccagtagaaagcattgatttattcacctctacaggaatcagactcagcctcttttggttttcagtgaagtatgcct tttcaatttggaacccagccaaggaggtttccagtggaaggaggagattcttcaattgagctggaacctgggctgagctc cagtgctgcctgtaatgggaaggagatgtcaccaaccaggcaactccggaggtgccctggaagtcattgcctgacaataa ctgatgttcccgtcactgtttatgcaacaacgagaaagccacctgcacaa
Loc645513 Similar to septin 7 Entrez Gene ID No. 645513 (SEQ ID NO: 105) tgaacagagtaacaggactatatttctgaaaaaggatgaacttactggaaacaggattgcgtgcctgaaatata cccaaatggatataaatgtcaactcagttctgggctggagatatagatttggaatgcaccaacaatgcagatggtaatcc tggcatgcgagtag
Loc654342 Similar to lymphocyte-specific protein 1 Entrez Gene ID No. 654342 (SEQ ID NO: 106) ttctagaatctcagcttcttaaatcaagaaattgtgtcttgttcatgtctgaattccccaagtgaacacagtga gtgggtgcttgacaaatctttgntggtnangngcnaaaaaaggggattctgtgcccaataccatgaaatcaatgcacaga agattcantcaatcaagaaaggtgcacagacactggccacacacactgacatttgtttgcagatgttccagtccccctga cttccaccaatccattcattcattccacaagcatttttgctggggtggaagcagggccatacagggtgtgtacatcacag atagggtgggtttgtataatgagtataaaaaacttctagcagaagatgacaaagtatatcaagaaagggctctcttcgaa atcaca
Lrrc37a leucine rich repeat containing 37A Entrez Gene ID No. 9884 (SEQ ID NO: 107) ggctttgggagtgagcagctagacaccaatgacgagagtgatgttatcagtgcactaagttacatttgccatat ttctcagcagtaaacctagatgtggaatcaatgttactaccgttcattaaactgccaaccacaggaaacagcctggcaaa gattcaaactgtaggccaaaaccggcaaaaagtgaatagagtcctcatgggcccaatgagcatccagaaaaggcacttca aagaggtgggaaggcagagcatcaggagggaacagggtgcccaggcatctgtggagaacgctgccgaagaaaaaaggctc gggagtccagccccaagggagctggaacagcctcacacacagcaggggcctgagaagttagcgggaaacgccatctacac caagccttcgttcagccaagagcataaggcagcagtctctgtgctgacacccttctccaagggcgcgccttctacctcca gccctgcaaaagccctaccacaggtgagagacag
Mrpl30 mitochondrial πbosomal protein L30 Entrez Gene ID No. 51263 (SEQ ID NO: 108) ttatggctgggattttgcgcttagtagttcaatggcccccaggcagactacagaccgtgacaaaaggtgtggag tctcttatttgtacagattggattcgtcacaattcaccagatcaagaattccagaaaaagtgtttcaggcctcacctgaa gatcatgaaaaatacggtggggatccacagaaccctcataaactgcatattgttaccagaataaaaagtacaagaagacg tccatattgggaaaaagatataataaagatgcttggattagaaaaagcacatacccctcaagttcacaagaatatccctt cagtg
Nipsnap3 bnipsnap homolog 3B (C. elegans) Entrez Gene ID No. 55335 (SEQ ID NO: 109) gttaatttgctgtgcttcttgcatttttgaaagttacatattctccactgctttaagaaataattcagttcact ttcaccttggcatttcagtatctgttacacattagaagtagttgtcactatttcatc
Parp2 poly (ADP-πbose) polymerase family, member 2 Entrez Gene ID No. 10038 (SEQ ID NO: 110) gccatgggcttcgaattgcccaccctgaagctcccatcacaggttacatgtttgggaaaggaatctactttgct gacatgtcttccaagagtgccaattactgctttgcctctcgcctaaagaatacaggactgctgctcttatcagaggtagc tctaggtcagtgtaatgaactactagaggccaatcctaaggccgaaggattgcttcaaggtaaacatagcaccaaggggc tgggcaagatggctcccagttctgcccacttcgtcaccctgaatgggagtacagtgccattaggaccagcaagtgacaca ggaattctgaatccagatggttataccctcaactacaatgaatatattgtatataaccccaaccaggtccgtatgcggta cctt
Pbrml polybromo 1 Entrez Gene ID No. 55193 (SEQ ID NO: 111) gtcagcagtcagcaaattaacatcatcatactcttccatttttagtttctgttggattttcatcaagtcaatgg gctgagaaaccacttcataatagtctggttgatttcttcgctttggtgccctaatgaagagctcacagagaagtctgccc tgttcatccttatagtctcggatggtattatagagttcatggcacacggcaataggatctacagttggaagattggaaag tctcctccttttcctgcttgggcctggtgttgacacagaatggtgcccatcatcaaagtccccgctgacactgctggaag gggaggtagctcttcttctct
Pexl3 peroxisome biogenesis factor 13 Entrez Gene ID No. 5194 (SEQ ID NO: 112) ggatgaccatgtagttgccagagcagaatatgattttgctgccgtatctgaagaagaaatttctttccgggctg gtgatatgctgaacttagctctcaaagaacaacaacccaaagtgcgtggttggcttctggctagccttgatggccaaaca acaggacttatacctgcgaattatgtcaaaattcttggcaaaagaaaaggtaggaaaacggtggaatcaagtaaagtttc caagcagcaacaatcttttaccaacccaacactaactaaaggagccacggttgctgattctttggatgaacaggaagctg cctttgaatctgtttttgttgaaactaataaggttccagttgcacctgattccattgggaaagatggagaaaagcaagat ctttgatatctttcatgtttgcctgc
Phldal pleckstrin homology-like domain, family A, member Entrez Gene ID No. 122822 (SEQ ID NO: 113) gaagtgggacgagcacatttctattgtcttcacttggatcaaaagcaaaacagtctctccgccccgcaccagat caagtagtttggacatcaccctactgaaaacttgcgattcttcttagttttctgcatacttttcatcacgatgcaggaaa cgatttcgagtcaagaagacttttatttatgaacctttgaaaggatcgtcttgtatggtgaattttctaggagcgatgat gtactgtaattttattttaatgtattttgatttatgattatttattagttttttttaaatgcttgttctaagacatttct gaatgtagaccattttccaaaaaggaaactttattttcaaaaacctaatccgtagtaattcctaatcttggagaataaaa aagggcggtggaggggaaaacattaagaatttattcattatttctcgagtactttcagaaagtctgacactttcattgtt gtgccagctggtt
Pol3s polyserase 3 Entrez Gene ID No. 339105 (SEQ ID NO: 114) cagaccctgttccttcgaggaatggggagggagggagggaccaaagccgtgaggatgaggacaactccaccctc cttccttccccacaggccaaccaaccagctgctgacaggggacctggccattctcaggacaagagaatgcaggcaggcaa anngcattactgcccctgtcctnccccaccctgtcatgtgtgattccaggcaccagggcaggcccagaagcccagcagct gtgggaaggaacctgcctggggccacaggtgcccactccccaccctgcaggacaggggtgtctgtggacactcccacacc caactctgctaccaagcaggcgtctcagctttcctcctcctttaccctttcagatacaatcacgccagccacgttgtttt gaaa
Pparbp PPAR binding protein Entrez Gene ID No. 5469 (SEQ ID NO: 115) ggcttaggcctcaaatggcttcttctaaaaactatggctctccactcatcagtggttccactccaaagcatgag cgtggctctcccagccatagtaagtcaccagcatataccccccagaatctggacagtgaaagtgagtcaggctcctccat agcagagaaatcttatcagaatagtcccagctcagacgatggtatccgaccacttccagaatacagcacagagaaacata agaagcacaaaaaggaaaagaagaaagtaaaagacaaagatagggaccgagaccgggacaaagaccgagacaagaaaaaa tctcatagcatcaagccagagagttggtccaaatcacccatctcttcagaccagtccttgtctatgacaagtaacacaat cttatctgcagacagaccctcaaggctcagcccagactttatgatt
Prkd2 protein kinase D2 Entrez Gene ID No. 25865 (SEQ ID NO: 116) gggagagggaggagtaatggaggaggagttggaaactggggagagatggaaggaatgtgactggagggtagaga acttggagaa
Prr7 proline rich 7 (synaptic) Entrez Gene ID No. 80758 (SEQ ID NO: 117) gaatcggacatgtccaaaccaccgtgttacgaagaggcggtgctgatggcagagccgccgccgccctatagcga ggtgctcacggacacgcgcggcctctaccgcaagatcgtcacgcccttcctgagtcgccgcgacagcgcggagaagcagg agcagccgcctcccagctacaagccgctcttcctggaccggggctacacctcggcgctgcacctgcccagcgcccctcgg cccgcgccgccctgcccagccctctgcctgcaggccgaccgtggccgccgggtcttccccagctggaccgactcagagct cagcagccgcgagcccctggagcacggagcttggcgtctgccggtctccatccccttgttcgggaggactacagccgtat agaggggcgcccggcgccccgggccccaccggcggactcctggcctgactgcggggctttttaaatgcttccctggactg cggggaggggcggggggagggagggatttcttatcccgtttgttacatt
Psph phosphoserine phosphatase Entrez Gene ID No. 5723 (SEQ ID NO: 118) ttttctactcagcagatgctgtgtgttttgatgttgacagcacggtcatcagtgaagaaggaatcggatgcttt cattggatttggaggaaatgtgatcaggcaacaagtcaaggataacgccaaatggtatatcactgattttgtagagctgc tgggagaaccggaagaataacatccattgtcatacagctccaaacaacttcagatgaatttttacaagttacacagattg atactgtttgcttacaattgcctattacaacttgctataaaaagttggtacagatgatctgcactgtcaagtaaactaca gttaggaatcctcaaagattggtttgtttgtttttaactgtagttccagtattatatgatcactatcgatttcctggaga gttttgtaatctgaattctttatgtatattcctagctatatttcatacaaagtgttttaagagtggagagtcaattaaac acctttactcttaggaatatagattcggcagccttcagtgaatatt
Rfx3 regulatory factor X, 3 (influences HLA class II expression) Entrez Gene ID No. 5991 (SEQ ID NO: 119) tagagctgaatattacttgattacaaatcagattgcttaagggtgtggaatagcaggctagttttaataccaac ttgttaacataaaatcatatatgttttaganccattcttatttagttacaattttagaaagttaacaaagtaagcaggta cttatcgaagtgcatcttttcagtctaaatgtttgtctgtgtgtctaggtgctggtgagtccacatggacacatgnagnn nccatggggcaggagtctgctataaagtcagaaggtgagatcctagagagttacacccagccccattttaatttgcatga aaagccaaggttcttttaagcactcaaattatttaatgnttaaaacacaagaaaggcacatctgttcatttaaat
Rpslβ πbosomal protein S16 Entrez Gene ID No. 6217 (SEQ ID NO: 120) agagggccttggagtgacaccctgacccccatccactagtacttganggccagtggtggcagaagccacagaaa caagaagcccagtgagatggctaagctgcccagcatgtaacttaaatccctgttcattccccattcctttagctgetgga gccagttctgcttctcggcnaggagcgatttgctggtgtagacatccgtgtccgtgtaaagggtggtggtcacgtgggcc cngatttatnnnagtcccanaactgggcgcatggaggaggtggctctgggagggaggccttcacagcgctcctgtaccct ttaattgtgtgtctttctcacagctatcc
Samd4 asteπle alpha motif domain containing 4A Entrez Gene ID No. 23034 (SEQ ID NO: 121) ggtgaatgtgtattcctctgggaggaataggaagaaaacaggaatgttaataatgtcgaacagaaaacttcctc ccttattaatatataatcctcatgtatttatgcctaatgtaagctgacttttaaaaagctttcttttgttgcatgccctg tgcaggcatctgtattgtacatgcatgcctttcgtcctgttttcctgtataaagttagtgaacaaagaaatatttttgcc tagttcatgttgccaagcaatgcatattttttaaatttgtcatatatggaaagagcatgtttgttacatgtaaaagcttt actgatatacagatatactaatgtttgaagatgctgttctttgcaagtgtacagttttcaaatgttgttaccagtgaaac acccttgtggtttaaacttgctacaatgtatttattattcatttcctcccatgtaactaagaa
Scampi secretory carrier membrane protein 1 Entrez Gene ID No. 9522 (SEQ ID NO: 122) tcagttcatatctttctgggcttgacatggctgatggtgtagctgaaaccctcctaacactaaaagccatttaa tcttttctgtaataggagcagaaaatagttaatcatccacctagtaatataagattactgtgaatattatcttctataca ttaaaacagttctagtttgtagaataataccatacaagttttatttttaaattctagttattttcagtgcttacttaaat gtaattctagaattcctccacaacttttaatattttgtatgccagtgattctcaagataaatcatgattgtagtagttgt tactgttggcagtttgtagtagtattcaggtattttggggatgggggaaaacaccaaaaatcagtgtcttttatctggtg atcactgtggtatctacagtattctagtctcctgcacaaaaactgaacccactgggcc
Scnlla sodium channel, voltage-gated, type XI, alpha Entrez Gene ID No. 11280 (SEQ ID NO: 123) ccaaccatgatgaaactccgtctctactaaaatacaaaaattagctgggcatggttgcgtgcgcctgtagtccc agctacttgggaggctgaggcaggagaatcgcttaaacctgggagacggaggttgcagtgagccaagatcgtgtcactgc actccagcctggtgacagagtgagactctgtttcaaaaaagaaaagaaaagaaacatggttcaaattatatctaaacaaa aaagaataagaaacaaaaaacacattaaaattttaagttgtattttctatgtttctagatacatcatttttgtttgatat tttcctgatgcaagtatgtggtttatcacatgtagctcttttgcatgctaaatgaaaattcaagacttgccaataaatga atagcttattgcagacattttttaccaacattaattattttgggtttgtttaaaacctagaggcacaatcttgacttgtc aattactaccctttcacaagctaccatctcagatatatatatatatataaattcaataaagctttctgtttgtgttc
Sdccagδ serologically defined colon cancer antigen 8 Entrez Gene ID No. 10806 (SEQ ID NO: 124) cttcacaatagcaaacgtaaacgatggaattgatggaatcaaccgaaattgacggaatcaatctaaatgttcat cactgacagattgtgtaaagaaaatgtggaacatggacaccatggaatagtatgcagccataaaaagaatgagatccgat cttttgcaggaacatgcatggagccggagacagttatccttagcaaactaacgcaggaagagaaagccaaatactgcata ttcttacgtataagtgggagctaaatgataagaacttatgagcacaaagtaggaaaccacagacagtggcatctccttga ggatatagggtgggagcagggagaggagcagaagagatcactattgggtactgggcttaatacctgggtgataaaataat ctgtataacaaaaccccgtgacatga
Sephsl selenophosphate synthetase 1 Entrez Gene ID No. 22929 (SEQ ID NO: 125) aaaggtgttctctgtgttatgtaaagtggaggcttccttatattttaacctactaagcaatgaggagggattcc tgtcattaagcacaagggcgctggatcctcaagtgcccatcttcgtgagagaaaaagcagcacatcctgcccatttctgg tgctttctgctcacaggcaccaaagctgcacatgtaaactgacttcttgccaaaggaaatgacccctgggaagttcaagc tcctggaagaggctttaactcggacgcgccctcctccaggaaccagtgggcagggcagccttcatgcatgtgtaactgga cctccagccataagcatggtgtgcagtatggaagagcctgctacggaactgaaagtgattggacattttataggaattga tagagatgttggtcctcaaaagctaca
Slc2al3 solute carrier family 2 (facilitated glucose transporter), member 13 Entrez Gene ID No. 114134 (SEQ ID NO: 126)
aacaacattattccatctcatttaaaggttnaaaaagaagagacaactctagccnaagtagaaatttatattct acacgtccaaactgtctcctagcagcttttggactatatatcacttgatgttaaagtatcttttatttgtaataaatatt caaatttctatttagaagctctaatgtatacctagattaaatcaaatcacagttttatgcttttaaaatatatgtatttc aaactgtatattttaatttctgagtgcatgttatatagtatttaatacttcagatgtcttggcaaattcaatataagtat ttattcccacaagcgatatatgggatatctcttaaaaattatgaatatgtaccatttccttcaaagtcatcctagcctat gctgtatcaaaagtattgtatattttatggagatttagtgatatacatgtaaatgttttttaagttattttattgaagtt caatctttacataaaattaaaatctttttttaaaaaaagtgtcagtgccagaactgtaa
Slc30a5 solute carrier family 30 (zinc transporter), member Entrez Gene ID No. 564924 (SEQ ID NO: 127) tgttcataaacatttgagcaccatgaaatcaaaataccctataactactttctatagtcatatctaatttatat ttttttcatttccanttgtaactagatatgtagtaaagtctgaaaagactttaccatagacaataacatgcagttttatc agcaccaaagaatgttgtccaaaagaaactttttaatacctgtctttctatttataacatctgaatattttcattcttat attaagaattttgataagtagattgaatttagtatgagtactattttcttatatataccacaatggcaaacatgtattat aaatcatatttttgtcttaccaattttaatatatgaggggttttagaaatttgttgtaagttatttttatattccttgtc ttttgcatattttttggccaaaatcttcaatacat
Spal7 sperm autoantigenic protein 17 Entrez Gene ID No. 53340 (SEQ ID NO: 128) ttcgaggagcaagaaccacctgagaaaagtgatcctaaacaagaagagtctcagatatctgggaaggaggaaga gacatcagtcaccatcttagactcttctgaggaagataaggaaaaagaagaggttgctgctgtcaaaatccaagctgcct tccggggacacatagccagagaggaggcaaagaaaatgaaaacaaatagtcttcaaaatgaggaaaaagaggaaaacaag tgaggacactggttttacctccaggaaacatgaaaaataatccaaatccatcaaccttcttattaatgtcatttctcctt gaggaaggaagatttgatgttgtgaaataacattcgttactgttgtgaaaatctgtcatgagcatttgtttaataagcat accattgaaacatgccacttgaagatttctctgagatcatgagtttgtttacacttgtctcaagcctatctatagagacc cttggatttagaattatagaactaaagtatctgagattacagagatctcagaggttatgtgttctaactattatc
Tcf712 transcription factor 7-like 2, T-cell specific, HMG-box Entrez Gene ID No. 6934 (SEQ ID NO: 129) gaaatggccactgcttgatgtccaggcagggagcctccagagtagacaagccctcaaggatgcccggtccccat caccggcacacattgtctctaacaaagtgccagtggtgcagcaccctcaccatgtccaccccctcacgcctcttatcacg tacagcaatgaacacttcacgccgggaaacccacctccacacttaccagccgacgtagaccccaaaacaggaatcccacg gcctccgcaccctccagatatatccccgtattacccactatcgcctggcaccgtaggacaaatcccccatccgctaggat ggttagtaccacagcaaggtcaaccagtgtacccaatcacgacaggaggattcagacacccctaccccacagctctgacc gtcaatgcttccatgtccaggttccctccccatatggtcccaccacatcatacgctacacacgacgggcattccgcatcc ggccatagtcacaccaacagtcaaacaggaatcgtcccagagtgatgtcggc
Tmem30b transmembrane protein 3OB Entrez Gene ID No. 161291 (SEQ ID NO: 130) tatactcactcaaggcagtgcaagatcttgaagtactttttagcagttaagtaatattgaattgtattgaatag tttacatagtttattctagtctttgaaaattactgaacatggacaatgtgcatgtcattgacatctgccttagaacttct gggacaatcctgattcgagagattctatcccattatttacatataccaaaaatactttgttaatttaatgtgttggcttc ccaactcctgaacacgacacaattttattattagattttgtatggtgattttaggctatgaaaacatgatcattatatgt atatagatacatttttatttgttacaaatgtttgagcagctcactagcccacccctcctctattttgggtaagagaattt actaccttttttaactatgtagttgagagcaacatgtattttgttatttttagaatggtcagtatattgctataaaattt taaatgagactatgaaagttaaagtattctgattctggttaaattaacgaatatggttccaggccctgt
Trpm7 transient receptor potential cation channel, subfamily M, member 7
Entrez Gene ID No. 54822 (SEQ ID NO: 131) gttgcagtgatgacttttgtgaaacaaaaacttatgtatcattttagtgatactcttaagattatttgtttttt ggcagtaaatgtgaaaattctttgttgttctactttatgaatagaacttaaggaaataactccaaaacaatgtaatttgt ataagaaggttcataaaaatcctgtaaggtttaaattagtttagaagaaaaataatagtttgctgtaactttttctccct aaagaaacaaggtccaactaatccaatgctgtttcatcttgttcgagacgtcaaacaggtaagagattattttttgcttt tga
Wbscrlβ Williams-Beuren syndrome chromosome region 16 Entrez Gene ID No. 81554 (SEQ ID NO: 132) agagctgagtcatcctagagcaaacctctggagtggagagcgaactacttcattcccctcccttagcctgggcc agagagactccagctctgccttctccagccaaaaaatcaaaggcagatgggagaacagccttcagctttggataacgatg aaatatctggcaccactgatgaatattaaactttctataacc
Wdr20 WD repeat domain 20 Entrez Gene ID No. 91833 (SEQ ID NO: 133) ggagactgtctcactgatgttgatttctttattcatttccgcatctgttacacgaacttcgtgtcataaattgc tatcctttcatttgaaagtgtaaaaaatttcctgcatttttatcatttctgtatacttgagtttattagagattgttatg ttaggcgacactgtataaaattgtatggatattttgagtgaaaatcaaaagtaaaattcacatgtatttccttttttata ttttcatccaatttcttgacaacttgaataaatttcataaagagccttcctaa
Wdr55 WD repeat domain 55 Entrez Gene ID No. 54853 (SEQ ID NO: 134) gcaagctctcattggctctgagcgcgaccccgcctcccaggggggtggaggtatccactgcacgtgcgccgccc
gggcttcgctcagaccttcaggtgaaagctgcaaagtcgcgggtgcgtatgtacgggggctgcctcccgaggaggagctc ccaagccgcagggtggacgctggagacaagaacctcagggtcacaagtttactgtttttctcccttttccatccctacat tggtctgctggggaaggcggggctaggcatcactgacacacgcagactccgtggttgaggcattttattggacctttggc aattggtggtggggaggcatctgctccaactggtgcggggccctgcagatgggaccatctcaggctgggtccttgtagcc caggagcacagactggactaagcctcctgggccttgtatgaaaaaggtgttgtacctggccgtttttgccagt
Znf492 zinc finger protein 492 Entrez Gene ID No. 57615 (SEQ ID NO: 135) actccgtcctgggtgacaaagtgagactccctctcaaaaantaaatangtaaataaantaaatggtggtaacna tacnctatttggtaaannnnnncnctaacatctgtagtactaatcttttttccagtggctttaaactgcaaataaggaat gttgtttctgtaggtaaaatttttatttattttttcccatttaaatttacttttgttagttttttcaggcatataatatt tatgttatatatggcatattctgataagaggcatacaatatgtaataatcacattagggtaaatgaggtatccatcacct ttagaatttattttttgtattatgaacagttcaattgtacagttttagtttttttaaaatatacgattgttattgactac agggt
Znf502 zinc finger protein 502 Entrez Gene ID No. 91392 (SEQ ID NO: 136) tgataagactcagaacaggaagcctgcatgtgactgagcaagtcacctacataaccctgcctgtactaaggtgt acacctgtctattgtaagtttgcctaggctgttggtgtacagagaccagaggagagagacacactaggactaacaatgtc ctaacaaaatggtacttagtttgttggtctttaggagaaagcattagtaatgaaagaagaaagaattttcacttggttgg acattggggctgcttaagaaagttgacatttgtcgtggaatgactttggaaagacttctaaaagaatctttttcaaatcc ctgaaaatcaggatagcacattttgctactgactgtgacagtgttttattcttttgagagaaatgacatagttttccctt tatttcccaaattcctttcatgttcttaactgctacccagaaattgagcttcagaagattgaggatagcctttgattggt attta
Znf557 zinc finger protein 557 Entrez Gene ID No. 79230 (SEQ ID NO: 137) agtagatcttaccttgctgttcataagagaatccacaatggggagaaaccctatgaatgcaatgactgtgggaa aaccttcagcagcagatcttaccttactgttcataagagaatccacaatggggagaaaccctacgaatgcagtgactgtg ggaaaaccttcagcaattcctcatacctcagaccgcacttgagaattcacactggagaaaaaccgtacaaatgtaaccag tgttttcgtgagttccgcactcagtcaatcttcacaaggcacaagagagttcatacgggggagggtcattatgtatgtaa tcagtgtggaaaggctttcggcacgaggtcatctctttcttcgcactatagcattcatacaggggagtacccttacgaat gccacgattgtgggagaaccttcaggaggaggtcgaatctgacacagcacataagaactcatact
Znf576 zinc finger protein 576 Entrez Gene ID No. 79177 (SEQ ID NO: 138) aagctgttgacagggctgcttttctttttggaggctctaggggagcgtctttctttgcccttccagcttctaga agctgcccaaattctgtggtttggggcctcctttcaaaaccagcaatggccaatcagtcttacatcactcaaacacttga gtgttctgtctccctcttccatgtttgaggacccttgtgattacactgtgaaaacccagataagccaggataatctccct atcttattatgaggcaagtatgttaagattttattctataatcagagaatcttatgctatgattgttatatgtgagcatt atagatgctcttgaaatgttaaaatcacatcagcactggaaaataactcctaaatgtccaaaaagaacatgagatttatg gtgcttgaaatgttgctaaacgtaaatttgtatctattctgaaattatataaattaacctacctggccaggca
Claims
1. A method of diagnosing a mood disorder, the method comprising:
(a) determining the expression of a plurality of biomarkers for the mood disorder in an isolated sample from the individual, the plurality of markers selected from the group of biomarkers listed in Tables 3 and 7; and
(b) diagnosing the presence or absence of the mood disorder based on the expression of the plurality of biomarkers.
2. The method of claim 1, wherein the plurality of biomarkers comprise a subset of about 10 markers designated as Mbp, Edg2, Fzd3, Atxnl, Ednrb for high mood and Fgfrl, Mag, Pmp22, Ugt8, Erbb3 for low mood.
3. The method of claim 1, wherein the plurality of biomarkers comprise a subset of about 10 markers designated as Edg2, Ednrb, Vil2, Bivm, Camk2d for high mood and Trpcl, Elovl5, Ugt8, Btgl, Nefh for low mood. This panel is derived from the meta-analysis.
4. The method of claim 1 , wherein the plurality of markers comprise a subset of about 20 biomarkers designated as Mbp, Edg2, Fgfrl, Fzd3, Mag, Pmp22, Ugt8, Erbb3, Igfbp4, Igfbpό, Pdeόd, Ptprm, Nefh, Atp2cl, Atxnl, Btgl, C6orfl82, Dicerl, Dnajcό, and Ednrb..
5. The method of claim 1 , wherein the plurality of markers comprise a subset of about 10 markers for high mood designated as Mbp, Edg2, Fzd3, Atxnl, Ednrb, Pde9a, Plxndl, Camk2d, Dio2, Lepr, and a subset of about 10 markers for low mood designated as Fgfrl, Mag, Pmp22, Ugt8, Erbb3, Igfbp4, Igfbpό, Pdeόd, Ptprm, and Nefh.
6. The method of claim 1, wherein the mood disorder is bipolar disorder or depression (major depressive disorder)
7. The method of claim 1, wherein the sample is a bodily fluid.
8. The method of claim 1, wherein the sample is blood.
9. The method of claim 1 , wherein the level of the marker is determined in a tissue biopsy sample of the individual.
10. The method of claim 1 , wherein the level of the marker is determined by analyzing the expression level of RNA transcripts.
11. The method of claim 1 , wherein the expression level of the marker is determined by analyzing the level of protein or peptides or fragments thereof.
12. The method of claim 1, wherein the expression level is determined by an analytical technique selected from the group consisting of microarray gene expression analysis, polymerase chain reaction (PCR), real-time PCR, quantitative PCR, immunohistochemistry, enzyme-linked immunosorbent assays (ELISA), and antibody arrays.
13. The method of claim 1 , wherein the determination of the level of the plurality of biomarkers is performed by an analysis of the presence or absence of the biomarkers.
14. The method of claim 2, where in a partial sequence representing the marker Mbp is gaagataaccggctcattcacttcctcccagaagacgcgtggtagcgagtaggcacaggcgtgcacctgctcccgaattactcaccgagacacacggg ctgagcagacggcccctgtgatggagacaaagagctcttctgaccatatccttcttaacacccgctggcatctcctttcgcgcctccctccctaacctactg acccaccttttgattttagcgcacctgtgattgataggccttccaaagagtcccacgctggcatcaccctccccgaggacggagatgaggagtagtcagc gtgatgccaaaacgcgtcttcttaatccaattctaattctgaatgtttcgtgtgggcttaataccatgtctattaatatatagcctcgatgatgagagagttacaa agaacaaaactccagacacaaacctccaaatttttcagcagaagcactctgcgtcgctgagctgaggtcggctctgcgatccatacgtggccgcaccca cacagcacgtgctgtgacgatggctgaac (SEQ ID NO: 1).
15. A method of diagnosing mood disorder, the method comprising:
(a) performing a quantitative determination of the level of a panel of at least 10 markers selected from Tables 3 and 7 in an isolated fluid sample;
(b) assigning a predictive value or score to the expression level of the markers; and
(c) diagnosing the mood disorder based on the assigned value or score.
16. A method of predicting the probable course and outcome (prognosis) of a mood disorder, the method comprising:
(a) obtaining a test sample from a subject, wherein the subject is suspected of having a mood disorder;
(b) analyzing the test sample for the presence or level of a plurality of markers of the mood disorder, the markers selected from the group consisting of markers listed in Tables 3 and 7; and
(c) determining the prognosis of the subject based on the presence or level of the markers and one or more clinicopathological data to implement a particular treatment plan for the subject.
17. The method of claim 15, wherein the treatment plan is for a high mood disorder if the molecular markers selected from the group consisting of Mbp, Edg2, Fzd3, Atxnl, and Ednrb are present.
18. The method of claim 15, wherein the treatment plan is for a low mood disorder if the molecular markers selected from the group consisting of Fgfrl, Mag, Pmp22, Ugt8, and Erbb3 are present.
19. The method of claim 15, wherein the treatment plan for a high mood disorder comprises administering a pharmaceutical composition selected from the group consisting of Depakote (divalproex), Lithobid (lithium), Lamictal (lamotrigene), Tegretol (carbamazepine), Topomax (topiramate).
20. The method of claim 15, wherein the treatment plan for a low mood disorder comprises administering a pharmaceutical composition selected from the group consisting of Prozac (fluoxetine), Zolof (sertraline), Celexa (citalopram), Cymbalta (duloxetine), Effexor (venlafaxine) or Wellbutrin (buproprion).
21. The method of claim 15, wherein the clinicopathological data is selected from the group consisting of patient age, previous personal and/or familial history of the mood disorder, previous personal and/or familial history of response to mood disorder, and any genetic or biochemical predisposition to psychiatric illness.
22. The method of claim 15, wherein the test sample from the subject is of a test sample selected from the group consisting of fresh blood, stored blood, fixed, paraffin-embedded tissue, tissue biopsy, tissue microarray, fine needle aspirates, peritoneal fluid, ductal lavage and pleural fluid or a derivative thereof.
23. A method of predicting the likelihood of a successful treatment for a mood disorder in a patient, the method comprising:
(a) determining the expression level of at least 10 biomarkers, wherein the biomarkers comprise a subset of about 10 biomarkers of claim 2; and
(b) predicting the likelihood of successful treatment for the mood disorder by determining whether the sample from the patient expresses biomarkers for a high mood disorder or a low mood disorder.
24. A method of treating a patient suspected of suffering a mood disorder, the method comprising:
(a) diagnosing whether the patient suffers from a high mood or a low mood disorder by determining the expression level of one or more of the biomarkers listed in Tables 3 and 7 in a sample obtained from the patient;
(b) selecting a treatment for the mood disorder based on the determination whether the patient suffers from a high mood or a low mood disorder; and
(c) administering to the patient a therapeutic agent capable of treating the high or the low mood disorder.
25. The method of claim 23, wherein the treatment plan is a personalized plan for the patient.
26. A method for clinical screening of agents capable of affecting a mood disorder, the method comprising:
(a) administering a candidate agent to a population of individuals suspected of suffering from a mood disorder or induced to suffer a mood disorder;
(b) monitoring the expression profile of one or more of the biomarkers listed in Tables 3 and 7 in blood samples obtained from the individuals receiving the candidate agent compared to a control group; and
(c) determining that the candidate agent is capable of affecting the mood disorder based on the expression profile of one or more of the biomarkers in the blood samples obtained from the individuals receiving the candidate drug compared to the control.
27. The method of claim 24, wherein the individuals are mice.
28. The method of claim 24, wherein the candidate agent is a pharmaceutical composition.
29. A mood disorder microarray comprising a plurality of nucleic acid molecules representing genes selected from the group of genes listed in Tables 3 and 7.
30. A kit for diagnosing a mood disorder comprising a component selected from the group consisting of (i) oligonucleotides for amplification of one or more markers listed in Tables 3 and 7, (ii) immunohistochemical agents capable of identifying the protein products of one or more biomarkers listed in Table 7, and (iii) a microarray as in claim 27 to detect the presence of one or more markers listed in Tables 3 and 7.
31. A diagnostic microarray comprising a panel of about 10 biomarkers that are predictive of a mood disorder, wherein the microarray comprises nucleic acid fragments representing biomarkers designated as Mbp, Edg2, Fzd3, Atxnl, and Ednrb for high mood and Fgfrl, Mag, Pmp22, Ugt8, and Erbb3 for low mood.
32. A diagnostic antibody array comprising a plurality of antibodies that recognize one or more epitopes corresponding to the protein products of the biomarkers listed in claim 2.
33. The diagnostic antibody array of claim 30 detects the protein levels of the biomarkers from a blood sample.
34. A diagnostic microarray consisting essentially of nucleic acid sequences to determine the expression of a plurality of markers listed in Tables 3 and 7.
Priority Applications (1)
| Application Number | Priority Date | Filing Date | Title |
|---|---|---|---|
| US12/594,378 US20100256001A1 (en) | 2007-04-03 | 2008-04-02 | Blood biomarkers for mood disorders |
Applications Claiming Priority (2)
| Application Number | Priority Date | Filing Date | Title |
|---|---|---|---|
| US90985907P | 2007-04-03 | 2007-04-03 | |
| US60/909,859 | 2007-04-03 |
Publications (1)
| Publication Number | Publication Date |
|---|---|
| WO2008124428A1 true WO2008124428A1 (en) | 2008-10-16 |
Family
ID=39831336
Family Applications (1)
| Application Number | Title | Priority Date | Filing Date |
|---|---|---|---|
| PCT/US2008/059120 Ceased WO2008124428A1 (en) | 2007-04-03 | 2008-04-02 | Blood biomarkers for mood disorders |
Country Status (2)
| Country | Link |
|---|---|
| US (1) | US20100256001A1 (en) |
| WO (1) | WO2008124428A1 (en) |
Cited By (7)
| Publication number | Priority date | Publication date | Assignee | Title |
|---|---|---|---|---|
| WO2010025216A1 (en) * | 2008-08-27 | 2010-03-04 | H. Lundbeck A/S | System and methods for measuring biomarker profiles |
| US20130164274A1 (en) * | 2010-09-07 | 2013-06-27 | Stephen G. Marx | Kit for monitoring, detecting and staging gvhd |
| CN103336914A (en) * | 2013-05-31 | 2013-10-02 | 中国人民解放军国防科学技术大学 | Method and device for extracting meta biomarkers |
| US9920357B2 (en) | 2012-06-06 | 2018-03-20 | The Procter & Gamble Company | Systems and methods for identifying cosmetic agents for hair/scalp care compositions |
| US10072293B2 (en) | 2011-03-31 | 2018-09-11 | The Procter And Gamble Company | Systems, models and methods for identifying and evaluating skin-active agents effective for treating dandruff/seborrheic dermatitis |
| US10865446B2 (en) | 2012-11-02 | 2020-12-15 | The Johns Hopkins University | DNA methylation biomarkers of post-partum depression risk |
| US11747337B2 (en) | 2010-09-07 | 2023-09-05 | Stephen G. Marx | Kit for monitoring, detecting and staging GVHD |
Families Citing this family (4)
| Publication number | Priority date | Publication date | Assignee | Title |
|---|---|---|---|---|
| US9834814B2 (en) * | 2013-11-22 | 2017-12-05 | Agilent Technologies, Inc. | Spatial molecular barcoding of in situ nucleic acids |
| US20230420110A1 (en) * | 2020-11-18 | 2023-12-28 | Indiana University Research And Technology Corporation | Methods for objective assessment, risk prediction, matching to existing medications and new methods of using drugs, and monitoring responses to treatments for mood disorders |
| CN116559451B (en) * | 2023-04-07 | 2023-12-05 | 山东大学 | Application of FBXL20 in diagnosis and treatment of depression |
| CN120505411A (en) * | 2025-06-20 | 2025-08-19 | 武汉市精神卫生中心 | Application of peripheral blood differential expression characteristic gene in preparation of major depressive disorder diagnostic agent |
Citations (7)
| Publication number | Priority date | Publication date | Assignee | Title |
|---|---|---|---|---|
| US20020137086A1 (en) * | 2001-03-01 | 2002-09-26 | Alexander Olek | Method for the development of gene panels for diagnostic and therapeutic purposes based on the expression and methylation status of the genes |
| US20030224450A1 (en) * | 2001-08-02 | 2003-12-04 | Ning Lee | Polynucleotide encoding a novel TRP channel family member, LTRPC3, and splice variants thereof |
| WO2004053157A2 (en) * | 2002-12-12 | 2004-06-24 | Novartis Ag | Methods for diagnosing and treating schizophrenia |
| WO2005026129A1 (en) * | 2003-09-15 | 2005-03-24 | Gpc Biotech Ag | Pharmaceutically active 4,6-disubstituted aminopyrimidine derivatives as modulators of protein kinases |
| US7038030B2 (en) * | 2002-04-16 | 2006-05-02 | University Of South Florida | BIVM (basic, immunoglobulin-like variable motif-containing) gene, transcriptional products, and uses thereof |
| US20070043108A1 (en) * | 2002-10-29 | 2007-02-22 | Lephart Edwin D | Use of equol for ameliorating or preventing neuropsychiatric and neurodegenerative diseases or disorders |
| US20070060550A1 (en) * | 2005-03-24 | 2007-03-15 | Mudge Anne P W | Methods of determining compounds useful in the treatment of bipolar disorder and methods of treating such disorders |
Family Cites Families (15)
| Publication number | Priority date | Publication date | Assignee | Title |
|---|---|---|---|---|
| US20050123938A1 (en) * | 1999-01-06 | 2005-06-09 | Chondrogene Limited | Method for the detection of osteoarthritis related gene transcripts in blood |
| US20040265868A1 (en) * | 1999-01-06 | 2004-12-30 | Chondrogene Limited | Method for the detection of depression related gene transcripts in blood |
| US20070031841A1 (en) * | 2001-02-28 | 2007-02-08 | Choong-Chin Liew | Method for the detection of gene transcripts in blood and uses thereof |
| US20030152972A1 (en) * | 2001-11-08 | 2003-08-14 | Whitehead Institute For Biomedical Research | Gene expression associated with psychiatric disorders |
| AU2003250033A1 (en) * | 2002-07-11 | 2004-02-02 | Novartis Ag | Genes associated with schizophrenia, adhd and bipolar disorders |
| JP2004208547A (en) * | 2002-12-27 | 2004-07-29 | Hitachi Ltd | How to evaluate depression |
| US20040248286A1 (en) * | 2003-03-21 | 2004-12-09 | Christine Konradi | Nucleic acid molecules that are differentially regulated in a bipolar disorder and uses thereof |
| US20050208519A1 (en) * | 2004-03-12 | 2005-09-22 | Genenews Inc. | Biomarkers for diagnosing schizophrenia and bipolar disorder |
| JP2005312435A (en) * | 2004-03-29 | 2005-11-10 | Kazuhito Rokutan | How to evaluate depression |
| DK1766077T3 (en) * | 2004-06-21 | 2012-07-16 | Univ Leland Stanford Junior | Differentially expressed genes and pathways in bipolar disorder and / or severe depressive disorder |
| GB0524110D0 (en) * | 2005-11-28 | 2006-01-04 | Univ Cambridge Tech | Biomarkers and methods for identification of agents useful in the treatment of affective disorders |
| US20080075789A1 (en) * | 2006-02-28 | 2008-03-27 | The Regents Of The University Of California | Genes differentially expressed in bipolar disorder and/or schizophrenia |
| US20080299125A1 (en) * | 2006-06-05 | 2008-12-04 | Perlegen Sciences, Inc. | Genetic basis of treatment response in depression patients |
| US20110098188A1 (en) * | 2007-05-14 | 2011-04-28 | The Scripps Research Institute | Blood biomarkers for psychosis |
| WO2009048747A2 (en) * | 2007-10-08 | 2009-04-16 | Indiana University Research And Technology Corporation | Candidate genes and blood biomarkers for bipolar mood disorder, alcoholism and stress disorder |
-
2008
- 2008-04-02 WO PCT/US2008/059120 patent/WO2008124428A1/en not_active Ceased
- 2008-04-02 US US12/594,378 patent/US20100256001A1/en not_active Abandoned
Patent Citations (7)
| Publication number | Priority date | Publication date | Assignee | Title |
|---|---|---|---|---|
| US20020137086A1 (en) * | 2001-03-01 | 2002-09-26 | Alexander Olek | Method for the development of gene panels for diagnostic and therapeutic purposes based on the expression and methylation status of the genes |
| US20030224450A1 (en) * | 2001-08-02 | 2003-12-04 | Ning Lee | Polynucleotide encoding a novel TRP channel family member, LTRPC3, and splice variants thereof |
| US7038030B2 (en) * | 2002-04-16 | 2006-05-02 | University Of South Florida | BIVM (basic, immunoglobulin-like variable motif-containing) gene, transcriptional products, and uses thereof |
| US20070043108A1 (en) * | 2002-10-29 | 2007-02-22 | Lephart Edwin D | Use of equol for ameliorating or preventing neuropsychiatric and neurodegenerative diseases or disorders |
| WO2004053157A2 (en) * | 2002-12-12 | 2004-06-24 | Novartis Ag | Methods for diagnosing and treating schizophrenia |
| WO2005026129A1 (en) * | 2003-09-15 | 2005-03-24 | Gpc Biotech Ag | Pharmaceutically active 4,6-disubstituted aminopyrimidine derivatives as modulators of protein kinases |
| US20070060550A1 (en) * | 2005-03-24 | 2007-03-15 | Mudge Anne P W | Methods of determining compounds useful in the treatment of bipolar disorder and methods of treating such disorders |
Non-Patent Citations (6)
Cited By (7)
| Publication number | Priority date | Publication date | Assignee | Title |
|---|---|---|---|---|
| WO2010025216A1 (en) * | 2008-08-27 | 2010-03-04 | H. Lundbeck A/S | System and methods for measuring biomarker profiles |
| US20130164274A1 (en) * | 2010-09-07 | 2013-06-27 | Stephen G. Marx | Kit for monitoring, detecting and staging gvhd |
| US11747337B2 (en) | 2010-09-07 | 2023-09-05 | Stephen G. Marx | Kit for monitoring, detecting and staging GVHD |
| US10072293B2 (en) | 2011-03-31 | 2018-09-11 | The Procter And Gamble Company | Systems, models and methods for identifying and evaluating skin-active agents effective for treating dandruff/seborrheic dermatitis |
| US9920357B2 (en) | 2012-06-06 | 2018-03-20 | The Procter & Gamble Company | Systems and methods for identifying cosmetic agents for hair/scalp care compositions |
| US10865446B2 (en) | 2012-11-02 | 2020-12-15 | The Johns Hopkins University | DNA methylation biomarkers of post-partum depression risk |
| CN103336914A (en) * | 2013-05-31 | 2013-10-02 | 中国人民解放军国防科学技术大学 | Method and device for extracting meta biomarkers |
Also Published As
| Publication number | Publication date |
|---|---|
| US20100256001A1 (en) | 2010-10-07 |
Similar Documents
| Publication | Publication Date | Title |
|---|---|---|
| Pineda et al. | Single-cell dissection of the human motor and prefrontal cortices in ALS and FTLD | |
| US20220325348A1 (en) | Biomarker signature method, and apparatus and kits therefor | |
| WO2008124428A1 (en) | Blood biomarkers for mood disorders | |
| Le-Niculescu et al. | Identifying blood biomarkers for mood disorders using convergent functional genomics | |
| US8148067B2 (en) | Methods for diagnosing and monitoring the status of systemic lupus erythematosus | |
| EP2240601B1 (en) | Biomarkers for the prediction of renal injury | |
| US20120295800A1 (en) | Oligonucleotides for cancer diagnosis | |
| WO2008144316A1 (en) | Blood biomarkers for psychosis | |
| JP2013066474A (en) | Gene expression signature in blood leukocyte permits differential diagnosis of acute infection | |
| JP2016526888A (en) | Sepsis biomarkers and their use | |
| JP2022095688A (en) | Gene-based diagnosis of inflammatory bowel disease | |
| KR20110057188A (en) | Biomarker Profile Measurement System and Method | |
| WO2011006119A2 (en) | Gene expression profiles associated with chronic allograft nephropathy | |
| WO2016109449A1 (en) | Methods of diagnosing autism spectrum disorders | |
| US20250101517A1 (en) | Identification of unique blood-based gene expression profiles in children with regressive autism spectrum disorder (asd) and ileocolitis | |
| US10428384B2 (en) | Biomarkers for post-traumatic stress states | |
| US20040067507A1 (en) | Liver inflammation predictive genes | |
| WO2010100633A1 (en) | Biomarkers for the prediction of renal injury | |
| US20130035240A1 (en) | Markers for Obesity and Methods of Use Thereof | |
| US8071307B2 (en) | Method of detecting relative risk for the onset of atopic dermatitis by gene single nucleotide polymorphism analysis | |
| US20140171371A1 (en) | Compositions And Methods For The Diagnosis of Schizophrenia | |
| US20120208718A1 (en) | Schizophrenia treatment response biomarkers | |
| WO2007137366A1 (en) | Diagnostic and prognostic indicators of cancer | |
| US20250180581A1 (en) | Compositions and methods for characterizing and treating psychiatric illness | |
| WO2025189251A1 (en) | Diagnostic and prognostic signatures for sepsis |
Legal Events
| Date | Code | Title | Description |
|---|---|---|---|
| 121 | Ep: the epo has been informed by wipo that ep was designated in this application |
Ref document number: 08744926 Country of ref document: EP Kind code of ref document: A1 |
|
| NENP | Non-entry into the national phase |
Ref country code: DE |
|
| 122 | Ep: pct application non-entry in european phase |
Ref document number: 08744926 Country of ref document: EP Kind code of ref document: A1 |
|
| WWE | Wipo information: entry into national phase |
Ref document number: 12594378 Country of ref document: US |