WO2007124117A1 - Methods and systems for reducing acoustic echoes in communication systems - Google Patents

Methods and systems for reducing acoustic echoes in communication systems Download PDF

Info

Publication number
WO2007124117A1
WO2007124117A1 PCT/US2007/009765 US2007009765W WO2007124117A1 WO 2007124117 A1 WO2007124117 A1 WO 2007124117A1 US 2007009765 W US2007009765 W US 2007009765W WO 2007124117 A1 WO2007124117 A1 WO 2007124117A1
Authority
WO
WIPO (PCT)
Prior art keywords
impulse
vector
response
shadow
approximate
Prior art date
Legal status (The legal status is an assumption and is not a legal conclusion. Google has not performed a legal analysis and makes no representation as to the accuracy of the status listed.)
Ceased
Application number
PCT/US2007/009765
Other languages
French (fr)
Inventor
Majid Fozunbal
Current Assignee (The listed assignees may be inaccurate. Google has not performed a legal analysis and makes no representation or warranty as to the accuracy of the list.)
Hewlett Packard Development Co LP
Original Assignee
Hewlett Packard Development Co LP
Priority date (The priority date is an assumption and is not a legal conclusion. Google has not performed a legal analysis and makes no representation as to the accuracy of the date listed.)
Filing date
Publication date
Priority claimed from US11/407,413 external-priority patent/US8045730B1/en
Application filed by Hewlett Packard Development Co LP filed Critical Hewlett Packard Development Co LP
Priority to DE112007000974.8T priority Critical patent/DE112007000974B4/en
Publication of WO2007124117A1 publication Critical patent/WO2007124117A1/en
Anticipated expiration legal-status Critical
Ceased legal-status Critical Current

Links

Classifications

    • HELECTRICITY
    • H04ELECTRIC COMMUNICATION TECHNIQUE
    • H04MTELEPHONIC COMMUNICATION
    • H04M9/00Arrangements for interconnection not involving centralised switching
    • H04M9/08Two-way loud-speaking telephone systems with means for conditioning the signal, e.g. for suppressing echoes for one or both directions of traffic
    • H04M9/082Two-way loud-speaking telephone systems with means for conditioning the signal, e.g. for suppressing echoes for one or both directions of traffic using echo cancellers

Definitions

  • the present invention is related to acoustic echo cancellation, and, in particular, to methods and systems for reducing acoustic echoes in communication systems.
  • audio-conference communication systems allow one or more individuals at a first location to simultaneously converse with one or more individuals at other locations through full-duplex communication lines in nearly real time, without wearing headsets or using handheld communication devices.
  • audio- conference communication systems include a number of microphones and loudspeakers, at each location, that can be used by multiple individuals for sending and receiving audio signals to and from other locations.
  • FIG. 1 shows a schematic diagram of an exemplary, two-location, audio- conference communication system.
  • the audio-conference communication system 100 includes a near room 102 and a far room 104.
  • Sounds, such as voices, produced in the near room 102 are detected by a microphone 106, and sounds produced in the far room 104 are detected by a microphone 108.
  • the microphones 106 and 108 are transducers that convert the sounds into continuous analog signals that are represented by x(t) and y(t) , respectively, where / is time.
  • the microphone 106 can detect many different sounds produced in the near room 102, including sounds output by the loudspeaker 1 14.
  • An analog signal produced by the microphone 106 is represented by: where
  • .$(/) is an analog signal representing sounds produced in the near room 102
  • v(t) is an analog signal representing noise, or extraneous signals created by disturbances in the microphone or communication channel 110, that, for example, may produces an annoying buzzing sound output from the loudspeaker 116
  • /(*(/)) is an analog signal that represents an acoustic echo.
  • the acoustic echo f[x (/)) is due to both acoustic propagation delay in the near room 102 and a round-trip transmission delay of the analog signal #(/) over the communication channels 1 10 and 112. Sounds generated by the analog signal y[t) are output from loudspeaker 116 in the far room 104. Depending on the amplification, or gain, in the amplitude of the signal y(t) and the magnitude of the acoustic echo /(*(/)), a person speaking into the microphone 108 in the far room 104 may also hear an annoying, high-pitched, howling sound emanating from loudspeaker 1 16 as a result of the sound generated by the acoustic echo f(x( ⁇ ) .
  • One compensation technique employs a filtering system that reduces the acoustic echo.
  • filtering systems employ adaptive filters that adapt to changing conditions at an audio-signal-receiving location.
  • stand alone adaptive filters either faii to account for, or are often slow to adapt to, the widely varying acoustic path between loudspeaker and microphone.
  • transmitted signals encoding conversations may be interrupted by numerous, brief periods of silence.
  • Various embodiments of the present invention are directed to methods and systems that reduce acoustic echoes in audio signals in accordance with changing conditions at first and second locations that are linked together in a communication system.
  • one embodiment of the present invention relates to a method for determining an approximate impulse-response vector for canceling an acoustic echo resulting from an audio signal transmitted from the first location to the second location. This method includes forming a trust region within a search space based on computing a recursive specification vector defining the trust region.
  • the method also includes computing a recursive shadow-impulse-response vector that lies substantially within the trust region, and computing the approximate impulse- response vector based on the recursive shadow-impulse-response vector and the recursive specification vector.
  • Figure 1 shows a schematic diagram of an exemplary, two-location, audio- conference communication system.
  • Figures 2A-2C illustrate conversion of an analog signal to a digital signal.
  • Figure 3 is a plot of an impulse excitation of a loudspeaker and a plot of an overall room impulse response resulting at the output of the microphone in response to the impulse excitation.
  • Figures 4A-4E illustrate an example of determining a digital signal output from a microphone by convolving an input digital signal with the microphone impulse response.
  • Figure 5 illustrates convolving a digital signal with a five-component impulse response in order to obtain a convolved digital signal.
  • Figure 6 shows a schematic diagram of an exemplary, two-location, audio- conference communication system that includes an adaptive filter to reduce the level of the acoustic echo in the far room signal at the near room.
  • Figure 7 illustrates convolving a digital signal with an impulse response in a frequency domain in order to obtain a time-domain, convolved digital signal.
  • Figure 8 is an example plot of decision periods and decision epochs that represents an embodiment of the present invention.
  • Figure 9 illustrates a two-location, audio-conference communication system that represents an embodiment of the present invention.
  • Figures 1 OA-I OB show a control-flow diagram that represents an embodiment of the present invention for reducing acoustic echoes in audio signals that are transmitted from a first location to a second location.
  • Figures lOC-lOD shows two plots of amplification energy versus time for the four types of control states that represents an embodiment of the present invention.
  • Figures 1 IA-1 1C is a control-flow diagram for a routine "determine control state" that is called in step 1008 of the control-flow diagram shown in Figure 1OA and that represents an embodiment of the present invention.
  • Figure 12 is a control-flow diagram for a routine "residual echo suppression" that is called in step 1009 of the control-flow diagram shown in Figure 1OA and that represents an embodiment of the present invention.
  • Figure 13A is a control-flow diagram for a routine "determine A ⁇ M" that is called in step 1018 of the control-flow diagram shown in Figure 1OB and that represents an embodiment of the present invention.
  • Figure 13B provides a two-dimensional representation of a hyper-elliptical region that represents an embodiment of the present invention.
  • Figure 14 is a control-flow diagram for a routine "determine ⁇ ⁇ '" that is called in step 1304 of the control-flow diagram shown in Figure 13 and that represents an embodiment of the present invention.
  • Figure 15 is a control-flow diagram for a routine "determine / ⁇ ," that is called in step 1306 of the control-flow diagram shown in Figure 13 and that represents an embodiment of the present invention.
  • Figure 16 is a control-flow diagram for a routine "determine ⁇ m " that is called in step 1307 of the control-flow diagram shown in Figure 13 and that represents an embodiment of the present invention.
  • Various embodiments of the present invention are directed to methods and systems that reduce acoustic echoes in audio signals in accordance with changing conditions at first and second locations that are linked together in a communication system.
  • the terms "first location” and “second location” are broad general terms that are associated with the different locations of the near room and the far room, respectively, which are used to describe below various method embodiments of the present invention.
  • the communication system can be the Internet, electronic presentations, voice mail, audio-conference communication systems or any other kind of communication system that transmits signals between a first location and a second location.
  • a first digital signal and a second digital signal are received as input at the first location.
  • the first digital signal encodes sounds produced at a first location.
  • the second digital signal encodes an acoustic echo and sounds produced at the second location.
  • the methods compute a control state that depends on the state of current signal transmission.
  • the control state represents one of the following: (1) sound transmitted from the first location only; (2) sound transmitted from the second location only; (3) sounds transmitted simultaneously between the first and second locations; and (4) no sound transmitted between the first and second locations.
  • the methods then compute an approximate acoustic echo based on the control state.
  • the methods generate an output digital signal at the first location by first subtracting the computed, approximate acoustic echo from the second digital signal, then adjusting the second digital signal for gain based on the control state. Finally, the output digital signal is transmitted to the first location.
  • an overview of digital signals, impulse responses, and convolution is provided in a first subsection.
  • An overview of acoustic echo cancellation is provided in a second subsection.
  • An overview of discrete Fourier transformations is provided in a third subsection.
  • Embodiments of the present invention are provided in a fourth subsection.
  • Audio received by a microphone are transformed into an analog signal comprising a time-dependent, continuously varying voltage.
  • the analog signal is first converted into a digital signal with minimal alteration of the essential information contained in the analog signal.
  • Digital signals can be stored electronically, magnetically, or optically and can be processed using logical operations encoded in computer programs.
  • Figures 2A-2C illustrate conversion of an analog signal into a digital signal.
  • horizontal axes such as horizontal axis 202
  • vertical axes such as vertical axis 204
  • analog signal amplitudes in volts represent analog signal amplitudes in volts.
  • Figure 2 A is a plot of a time-dependent, continuously-varying analog signal x ⁇ t)
  • the analog signal x(t) 206 is first sampled by measuring the amplitude of the analog signal x(t) at discrete sampling times. In order to prevent loss of essential information contained in the analog signal, the duration between sampling times is generally selected to be sufficiently short so that the analog signal varies little between consecutive sampling times.
  • Figure 2B is a plot of a sampled signal 208 obtained by sampling the analog signal 206 in Figure 2A. The sampling times are in tenths of a second, and the sampled signal 208 is approximated as a step function by assuming a constant-signal amplitude between sampling times. For example, a constant-amplitude region 210 represents a constant value of -1.9 volts between sampling times 0.2 and 0.3 seconds.
  • an integer-encoded, digital signal is produced by multiplying the value of each constant-amplitude region by a selected constant and by multiplying the sampling times by a selected constant in order to produce integer values that represent the amplitude and sampling times of each step in the step function.
  • An integer- valued sampling time is called a "time sample”
  • an integer-valued amplitude is called a "digital amplitude.”
  • the resulting digital signal can be functionally represented by x[n], where n, an independent variable, represents a time sample domain.
  • Figure 2C is a plot of a digital signal obtained from the sampled signal 208 in Figure 2B.
  • horizontal axis 212 is a time sample domain
  • vertical axis 214 is a digital signal axis.
  • Each point in the graph represents a quantized value representing the scaled amplitude of the digital signal at a scaled sampling time. For example, point x[2]
  • a digital signal x[n] can, in general, be thought of as a series of impulses, each impulse corresponding to a unique component.
  • the notation x[n], where n represents a particular time sample, can also be used to represent a single impulse of a digital signal that is called a "component" of a signal.
  • Each component is a signal comprising all zero sample values except for a single value representing the amplitude at a single time sample, and is mathematically represented by:
  • d is an integer scale factor that represents the amplitude, or strength, of the impulse
  • p is a time sample
  • is the delta function defined as:
  • the component x[ ⁇ ] 218 is equal to 10£[/>]
  • the component ⁇ [2] 216 is equal to -19 ⁇ 5[2-/?].
  • /? in the delta function ⁇ [n-p] represents a time sample shift
  • n -p represents a time sample relative to time sample n.
  • a digital impulse response, h[n] is a digital signal that is output from a microphone when the input to the microphone is a unit impulse ⁇ [n] , where p is "0" and d equals "1."
  • the impulse response of a microphone can be determined by applying an impulse of sound with a very short duration to the microphone and measuring the signal output by the microphone.
  • the impulse response can also be represented by a vector as follows:
  • FIG. 3 shows a plot of an impulse and a plot of an overall room impulse response ⁇ [»] produced in response to the impulse x[n] .
  • the impulse response includes the loudspeaker, room, and microphone.
  • impulse plot 302 represents an impulse x[n] input to a hypothetical microphone 304.
  • the impulse x[n] 302 comprises all zeros except for a single nonzero point 306 at n equal to 0 and is represented by d ⁇ [n- p] as described above. In this case, d equals "1" and p equals "0" so the impulse can be represented as ⁇ [n] .
  • the microphone 304 outputs an impulse response h[n] that is represented by an impulse-response plot 308.
  • the impulse response 308 comprises all zeros except for the three nonzero digital signals represented by points 310-312.
  • An actual digital impulse response to an impulse typically comprises a greater number of nonzero components than contained in the impulse, as shown in Figure 3.
  • the impulse response 308 includes 3 nonzero components while impulse 302 includes a single nonzero component.
  • Impulse response 308 can be represented by the 3-component vector:
  • the impulse used to determine an impulse response is output from a loudspeaker into a room and is detected by a microphone.
  • the loudspeaker, room, and microphone are referred to as a "system,” and an associated impulse response can be thought of as a system impulse response.
  • a digital signal transmitted from the system is determined by convolving a digital signal x[n] produced by the system with the impulse response h[n] of the system.
  • the convolved digital signal is represented by x c [ «] .
  • Figures 4A-4D provide a graphical example of convolving a three-component digital signal x[n] produced by a hypothetical system with an impulse response A[ «] in order to produce a digital signal x c [ «] output from the system.
  • Figure 4A is a plot of an example, two-component, impulse response ⁇ [ «]
  • the impulse response h[n] is assumed to be invariant with time.
  • Figure 4B is a plot of a first component of the digital signal x[n] that is input to the system at a time sample "0.”
  • the first component is represented by a scaled impulse 2 ⁇ 5[ ⁇ ] 404.
  • the system In response to the impulse 2 ⁇ [n] 404, the system outputs an impulse-response h[n] comprising a first component 406 at the time sample "0," and outputs a second component 408 at a later time sample "1.”
  • the impulse response to the impulse 2 ⁇ [n] 404 is essentially the impulse response in Figure 4A with the components multiplied by the impulse scale factor "2.”
  • Figure 4C is a plot of a second component of the digital signal x[n] that is input to the system at the later time sample "I .”
  • the second component is represented by an impulse £[ «- 1] 410.
  • the system In response to the impulse ⁇ [n - 1] 410, the system outputs an impulse-response comprising a third component 412 at the time sample "1," and outputs a fourth component 414 at a later time sample "2.”
  • the impulse response to the impulse £[H - 1] 410 is essentially the impulse response in
  • Figure 4A with the component time samples shifted by a factor of "1." Because the second and the third components 408 and 412 occur at the same time sample "1," the amplitudes of the components 408 and 412 ' are summed in order to obtain a fifth component 416, which is the output at the time sample "1.”
  • Figure 4D is a plot of a third component of the digital signal x[n ⁇ that is input to the system at the time sample "2.”
  • the second component is represented by an impulse -2£[M -2] 418.
  • the system outputs an impulse response comprising a sixth component 420 at the time sample "2," and a seventh component 422 at a later time sample “3.”
  • the impulse response to the impulse -2S[n ⁇ 2] 418 is essentially the impulse response in Figure 4A with the components multiplied by the scale factor "-2,” and the component time samples shifted by a factor of "2.” Because the fifth and the sixth components 414 and 420 occur at the same time sample "2,” the amplitudes of the component 414 and 420 are summed to give an eighth component 424, which is the output at the time sample "2.”
  • Components of the convolved digital signal x c [n] 426, in Figure 4D, can also be obtained by calculating the scalar product of a two-component vector representation of the impulse response and two-component vectors corresponding to each component of the digital signal x[n] that are given by:
  • the first component A[O] appears earlier in time than the second component A[I]
  • the first component x[n ⁇ appears later in time than the second ⁇ component jc[ «- lj .
  • components of the vector that correspond to negative valued time samples are assigned the value "0.”
  • the first component 406, in Figure 4D is calculated by:
  • the second, third, and fourth components 416, 424, and 422 are calculated by:
  • a component of a convolved digital signal x c [n] is mathematically determined by:
  • Figure 5 illustrates convolving a digital signal displayed in plot 502 with a five-component impulse response in order to obtain a convolved digital signal displayed in plot 504.
  • horizontal axes such as horizontal axis 506, are time sample axes
  • vertical axes such as vertical axis 508, are digital number axes.
  • the impulse response is assumed to remain constant at each time sample in the time domain.
  • the impulse response of a system often depends on the conditions of the room.
  • the impulse response of the system may change over time as conditions in the room change. For example, an impulse response of a system with no sound produced in the room is different from an impulse response of the same system at a later time when sounds are produced in the room.
  • Figure 6 shows a schematic diagram of the exemplary, two-location, audio- conference communication system shown in Figure 1 that includes an adaptive filter 602 to reduce the level of an acoustic echo in the far room 104 at the near room 102.
  • the digital signal x[n] is transmitted in the communication channel 1 12 from the far room 104 to the loudspeaker 1 14 in the near room 102.
  • the digital signal x[n] can be converted back into an analog signal x(t) and sound is output from the loudspeaker 114.
  • the microphone 106 detects the sound output from the loudspeaker 1 14 and any sounds produced in the near room 102.
  • the impulse response h[n] of the microphone 106 is not known with certainty.
  • an approximate acoustic echo is subtracted from the digital signal y ⁇ n ⁇ .
  • the approximate acoustic echo is produced by also transmitting the digital signal x[n] to an adaptive filter 602, which produces an approximate impulse response
  • the adaptive filter 602 convolves the approximate impulse response with the digital signal x[n], in order to produce the approximate acoustic echo which is subtracted from the digital signal y[n] at the summing junction 604. Subtracting the approximate acoustic echo at the summing junction 604 gives an output digital signal that is mathematically represented by:
  • the residual echo is a portion of the digital signal y[n] that is transmitted to the far room 104.
  • Acoustic echo cancellation methods and systems are directed to producing approximate acoustic echoes that make the residual echoes inaudible to individuals that are simultaneously producing sounds input to the microphone 108 and listening to the loudspeaker 1 16 in the far room 104.
  • the adaptive filter 602 is used to reduce the acoustic echo transmitted from the near room 102 to the far room 104. However, in practice, a second adaptive filter is needed to reduce an acoustic echo transmitted from the far room 104 to the near room 102.
  • Convolving a digital signal x[n] with an impulse response h[n] is often a computationally time-consuming step in the determination of an output digital signal r [n] .
  • the computational time devoted to convolution can often be reduced by first separately mapping the digital signals x[n] and h[n] to discrete frequency domain digital signals X [k] and H[A;], respectively, using a discrete Fourier transform ("DFT").
  • DFT discrete Fourier transform
  • k is an inverse time sample index with the units of inverse time or frequency
  • Figure 7 illustrates convolution of the digital signals x[n] and h[n] by first mapping the digital signals x[n ⁇ and ⁇ [n] to the frequency domain and mapping the product X [A:] H[A:] back to the time sample domain in order to obtain convolved digital signal X[M] * A[ «] .
  • directional arrow 702 represents applying a discrete Fourier transform ("DFT"). to the digital signal x[n] in order to obtain a digital signal X[A:], and directional arrow 704 represents applying the DFT to the impulse response h[n] in order to obtain a digital signal H[A:].
  • DFT discrete Fourier transform
  • the digital signals X[A:] and H[A:] are multiplied in the frequency domain in order to obtain the product X[Ar]H[A:] .
  • an IDFT 706 is applied the product X[A:]H[A:] in order to obtain the convolved digital signal JC[ «] * ⁇ [/ ⁇ ] .
  • IFFT Fourier transform
  • Embodiments of the Present Invention are directed to .methods and systems that reduce acoustic echoes in audio signals and in accordance with changing conditions at separate locations linked by an audio-conference communication systems.
  • embodiments of the present invention include methods for determining an approximate impulse-response vector corresponding to audio signals transmitted only from the far room to the near room, methods for canceling an acoustic echo produced during substantially simultaneous transmission of audio signals from the near room to the far room, and methods for updating a data structure used to store a number of approximate impulse-response vectors.
  • the various embodiments of the present invention are based on a decision- making framework comprising Markov decision processes, sequential optimization, and optimal control theory.
  • Two references for these fields are the books “Markov Decision Processes: Discrete Stochastic Dynamic Programming,” by M. L. Puterman, John Wiley and Sons, New York, 1994; and “Dynamic Programming and Optimal Control,” by D. P. Bertsekas, Athena Scientific vol. I and II, Belmont, MA, 1995.
  • the description below presents those elements of Markov decision processes and the elements of optimal control theory that relate to embodiments of the present invention. Additional details can be obtained from the above-referenced books, or from many other books, papers, and journal articles in these fields.
  • an impulse response A[M] of a microphone can be mathematically represented as an /.-component vecto A property of the impulse response is that:
  • D L is an /.-dimensional vector space
  • T s a set centered at the origin in with a radius of
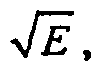
  • E represents the maximum amplification energy, or gain, produced by a microphone in response to an impulse.
  • the Euclidean norm of each impulse response output from a microphone satisfies the condition:
  • the average error can also be thought of as an expectation value of a random variable with an associated probability P h .
  • the method of the present invention produces approximate impulse responses Ti n that minimize the average error and satisfy the following condition:
  • U is a set centered at the origin i with a radius of and is called a "search space”
  • ⁇ n is a subjectively small positive real number, is the variance of the digital signal vector .
  • the symbol “inf means the "inflmum,” which is the maximum lower bound of a set.
  • the method of the present invention is also based on the assumption that an impulse respons exhibits little variation over N f time samples, and the maximum deviation between N c time samples is bounded by:
  • the parameter N c is called the "coherence time.”
  • an approximate impulse response is determined at the beginning of every N ⁇ time samples, where N d « N ⁇ and m is a positive integer.
  • An interval with N ⁇ time samples is called a “decision period,” and the beginning of a decision period is called a “decision epoch.”
  • Figure 8 is an example plot of decision periods and decision epochs associated with impulse-response vectors that represents an embodiment of the present invention.
  • horizontal axis 802 is a time sample axis
  • vertical axis 804 is digital number axis
  • dots, such as dot 806, represent a digital signal *[ «] .
  • the constant ⁇ in the minimum empirical equation is a smallest positive value that ensure is an element of the search space U.
  • using the minimum empirical equation to determine the approximate impulse response is computationally demanding.
  • the computational demand can be reduced by applying a stochastic approximation in the form of a recursive equation:
  • Equation (2) where is a matrix with elements determined as described below with reference to a control-flow diagram shown in Figure 14, and ⁇ m is a scalar quantity and is determined as described below with reference to a control-flow diagram shown in Figure 16.
  • the methods and systems of the present invention employ the recursive equation to determine the approximate impulse-response vector which also satisfies the following condition:
  • Figure 9 illustrates a two-location, audio-conference communication system, as shown in Figure 1 , including an echo-control unit that represents an embodiment of the present invention.
  • the system 900 includes DC offset removal units 902 and 904 and an echo-control unit 906.
  • DC offset is a low-frequency distortion often caused by electrical interference.
  • the electrical interference creates a constant voltage that can cause clicks and pops in the sound output from a loudspeaker.
  • the digital signal x[n] is output from the DC offset removal unit 902 and transmitted to the echo control unit 906.
  • the DC offset removal unit 904 corrects the DC offset in the digital signal y mic [ «] produced- in the near room 102 as follows:
  • the digital signal y[n] is output from the DC offset removal unit 904 and transmitted to the echo control unit 906.
  • the echo-control unit 906 includes a control 908, an impulse response correction 910, a summing junction 912, and an echo control suppressor 914.
  • the digital signal x[n] is transmitted to both the control 908 and the impulse response correction 910, and the digital signal y[n] is transmitted to both the control 908 and the summing junction 912.
  • the control 908 produces an approximate impulse-response vector that is input to impulse response correction 910 which, in turn, is used to produce an approximate acoustic echo.
  • the approximate acoustic echo is transmitted to the summing junction 912 and subtracted from the digital signal to produce an output digital signal . Operation of the control
  • the output digital signal is input to the echo control suppressor 914, which corrects for amplification, or gain, in the output digital signal and outputs a resultant digital signal r[n] that is transmitted to the loudspeaker 1 16 in the far room 104. Operation of the echo control unit 906 is described below with reference to Figures 10A- 1OB and Figure 12.
  • the echo control unit 906 is used to reduce the acoustic echo transmitted from the near room 102 to the far room 104, in Figure 9.
  • the echo control unit 906 can be located either inside or outside the near room 102.
  • a second echo control unit (not shown) is needed to reduce an acoustic echo transmitted from the far room 104 to the near room 102.
  • Figures 10A- 1OB show a control-flow diagram that represents an embodiment of the present invention for reducing acoustic echoes in audio signals that are transmitted from the near room 102 to the far room 104.
  • values for parameters are initialized as displayed below in Tables 1-3.
  • Table 1 displays parameters and example associated values that can be used in the equations described below with reference to Figures 10-16: Table 1
  • the parameter values displayed in Table 1 are example values that correspond to particular near room and far room conditions and configurations, and are not intended to restrictive. In other applications of the present invention, these parameters can be adjusted in order to accommodate different near room and far room conditions and different configurations of the near room and far room.
  • the parameter P is the number of digital signals j ⁇ m ' [ «] in the digital signal vector described below with reference to step 1004 in Figure 1OA.
  • N is the number of digital signals used to form the frequency domain vectors and .K 2 are values that are used to assign relative importance or weight to terms in equations described below with reference to Figures 10-14.
  • the parameters G max and G min are the maximum and minimum gain associated with the microphone 106.
  • Table 2 shows initial values for variable parameters that change during iterations of the methods described below with reference to Figures 11-12:
  • the parameters an are short-term energy variances associated with the digital signals x ⁇ [rt] and J ⁇ [H] , respectively.
  • the parameter is the short- term energy variance associated with the energy in the output signal
  • the parameters and are long-term energy variances associated with the digital signals ⁇ ' ⁇ [/ ⁇ ] and J ⁇ [ ⁇ ], respectively.
  • the parameter is a long- term energy variance associated with the noise v[n].
  • the parameters and are maximum square energies associated with the digital signals x ⁇ [nj and y [ «] .
  • the parameter G' 0 ' is an initial gain adaptation value described below with reference to Figure 12.
  • Table 3 shows initial values for components of vectors , and that change during iterations of the method described below with reference to Figures 13-14:
  • the vecto is an initial average spectrum associated with the vector and the vector is an initial average spectrum associated with a vector , which are described below with reference to step 1302 in Figure 13A.
  • the vecto defines an evolving hyper-elliptic gion described below with reference to step
  • the vector is an initial shadow- impulse-response vector described below with reference to step 1308 in Figure 13A.
  • the vector is an initial impulse-response vector described below with reference to step 1309 in Figure
  • steps 1003-1022 are repeated for each decision epoch m.
  • steps 1004-1012 are repeated for each time sample n.
  • step 1004 a digital signal x-" 1 ' [n ⁇ is output from the DC offset 902, and a digital signal y ⁇ [n] is output from the DC offset 904, in
  • step 1005 the digital signals jr ' [ «] are used to form an (Z + P)- component digital signal vector:
  • step 1006 a FFT is applied to the vectors in order to obtain frequency domain vectors:
  • step 1007 an output signal vector is computed as follows:
  • Tr ⁇ is a truncation operator of length N A
  • step 1008 the routine "determine control state” is called, which identifies four types of audio transmissions that can exist between the near room 102 and the far room 104, in Figure 9.
  • the four kinds of audio transmission are called “control states” ("CS") and are identified as follows: (1) an audio signal is output from the near end room 102 only and is represented by SNEO,' (2) an audio signal is output from the far end room 104 only and is represented by SFEOI (3) audio signals are simultaneously output from both the near end room 102 and the far end room 104, which is called “double-talk,” is represented by SDTI and (4) no audio signals output from the near end room 102 and the far end room 104 is represented by S ⁇ s-
  • the routine "residual echo suppression” is called in order to compute a gain- corrected output digital signal r' m ' [ «], as described above with reference to echo suppression 914, in Figure 9.
  • step 1010 the gain-corrected output digital signal r m ' [n] is transmitted to loudspeaker 1 16, in Figure 9.
  • step 1011 of Figure 1OB when n is less than mN d - ⁇ , control passes to step 1012, otherwise control passes to step 1013.
  • step 1012 the time sample n is incremented by "1," and steps 1004-1011 are repeated.
  • step 1013 when another decision epoch m is available, control passes to step 1014, otherwise the routine "determine r[n]" is terminated.
  • step 1014 -the decision epoch m is incremented by "1."
  • step 1015 when the CS is S NE o or S NS , control passes to step 1016, otherwise control passes to step 1017.
  • step 1016 the impulse-response vector is updated by assigning elements in the vector to corresponding values in the impulse response from the previous decision period, and the shadow-impulse- response vector is updated by assigning elements in the shadow-impulse-resp ' onse vector hS m ' to corresponding elements in the shadow-impulse-response vector from the previous decision period.
  • step 1017 when the CS is SFEO, control passes to step 1018, otherwise the CS is 5Or and control passes to step 1019.
  • step 1018 the routine "determine hr m> " is called and an approximate impulse-response vector h ⁇ is computed.
  • step 1019 when "count” does not equal “0,” control passes to step 1020, otherwise control passes to step 1021.
  • step 1020 the "count” is decremented by "1” and control passes to step 1016.
  • step 1021 the approximate impulse-response vector is selected form an impulse-response data structure represented by the set . This data structure includes the K most recent approximate impulse responses with the highest signal to noise ratio.
  • the approximate impulse-response vector is not updated during double talk because during double talk the signal-to-noise ratio decreases rapidly. The increased noise distorts the approximate impulse-response vector.
  • the approximate impulse-response vector is selected from the impulse-response data structure.
  • the subscripts on the decision epochs m correspond to the order in which the impulse response vectors have been added to the data structure. For example, the impulse response vector has been in the data structure the longest, and the impulse response vecto is the most recent addition to the data structure.
  • the approximate impulse- response vector can be selected based on any number of different criteria. For example, in one embodiment of the present invention, an approximate impulse- response vector can be selected in step 1021 according to which impulse-response vector has the largest corresponding In another embodiment of the present invention, in step 1021, the approximate impulse-response vector that has been in the data structure the longest is selected, which is .
  • the impulse- response data structure is updated in the routine "determine which is described below with reference to steps 1310 and 1312, in Figure 13A. The associated value of
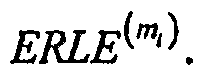
  • ERLE ⁇ " 1 ' is computed in the routine "determine control state.”
  • "count” is assigned a value " ⁇ f.”
  • the value Mean be 10, 12, 15, 18, or any other suitable value.
  • Figures 10C- 1OD shows two plots of amplification energy versus time for the four types of control states that represents an embodiment of the present invention.
  • vertical. axes such as vertical axis 1030
  • horizontal axes such as horizontal axis 1032
  • horizontal dashed lines such as dashed line 1034
  • Curves 1036 and 1038 represent the amplification energies associated with signals transmitted between the near room 102 and the far room 104.
  • Amplification energies below the double talk threshold 1034 are associated with an SFEO, S /V EO, or S ⁇ s control state.
  • Peak 1040 corresponds to amplification energy resulting from double talk, which exceeds the double talk threshold 1034.
  • peak 1042 corresponds to a noise produced in the near room 102 or the far room 104. This noise initially creates the appearance of double talk because the amplification energy exceeds the double talk threshold energy 1034, even though double talk is not actually taking place.
  • a countdown begins with the variable "count,” described in step 1019, set equal to M. This countdown takes place in steps 1019 and 1020, which avoids selecting an approximate impulse-response vector from the data structure in step 1021 until double talk can be confirmed for
  • the method of the present invention continues operating as if double talk has not occurred for M decision periods. If after M iterations the amplification energy has decreased, as indicated at time 1046 in Figure 1OC, inappropriate selection of an approximate impulse-response vector for double talk has been avoided. On the other hand, if after M iterations the amplification energy has increased, as indicated by time 1048 in Figure 10D, an approximate impulse-response for double talk is selected in step 1021.
  • FIGS 1 IA-11C show a control-flow diagram for the routine "determine control state" called in step 1008 in Figure 1OA and represents an embodiment of the present invention.
  • step 1101 average square energies associated with the vector rror vecto are:
  • step 1 102 long-term energy variances are recursively determined for the average square energies by
  • the coefficients 0.99 and 0.01 are weights that assign a higher relative importance to the variances an than to the average square energies and
  • steps 1 103-1107 a maximum square energy ssociated with the digital signal vector is determined.
  • step 1103 when the maximum square energy is less than the average square energy control passes to step 1 104, otherwise control passes to step 1 105.
  • step 1104 the maximum square energy is computed by:
  • step 1105 when the average square energy is greater than the maximum square energy control passes to step 1 106, otherwise control passes to step 1107.
  • step 1106 the maximum square energy is computed by: and control passes to step 1 108.
  • the coefficients 0.999 and 0.001 assign a higher relative importance to the maximum square energy than to the average square energy .
  • step 1107 the maximum square energy is assigned the value of In steps 1108-11 12, a maximum square energy associated with the digital signal vect determined.
  • step 1108 when the maximum square energy is less than the average square energy control passes to step 1109, otherwise control passes to step 1110. l ⁇ step 11 , the maximum square energy is computed by:
  • step 1110 when the average square energy is greater than the maximum square energy ontrol passes to step 1111, otherwise control passes to step 1112.
  • step 1 111 the maximum square energy is computed by:
  • step 1112 the maximum energy is assigned the value of
  • steps 1113-1 124 of Figure 1 IB the av re energies and long-term energy variances and , and maximum energie and are used to determine logic "TRUE" or
  • step 1113 when the average square energy is greater than or equal to , control passes to step 1114 and 71 is set to “TRUE,” otherwise control passes to step 1115 and 71 is set to "FALSE.”
  • step 1 116 when the average square energy is greater than or equal to control passes to step 1117 and 72 is set to "TRUE,” otherwise control passes to step 1118 and 72 is set to "FALSE.”
  • step 1119 when the long-term variance [ «] is less than control passes to step 1120 and 73 is set to "TRUE,” otherwise control passes to step 1121 and 73 is set to "FALSE.”
  • step 1122 when the long- term variance control passes to step 1 123 and TA is set to "TRUE,” otherwise control passes to step 1124 and TA is set to "FALSE.” .
  • step 1125 when 71 and 73 are "TRUE,” and 72 and TA are “FALSE,” control passes to step 1126 and CS is SNEO, otherwise control passes to step 1127.
  • step 1127 when 73 and TA are "TRUE,” and T2 is “FALSE,” control passes to step 1128, and CS is S NS , otherwise control passes to step 1 129.
  • step 1 129 when 72 is "TRUE" and T1, T3, and T4 are
  • step 1 130 control passes to step 1 130, and CS is S FEO , otherwise control passes to step 1131.
  • step 1131 when Tl and Tl are "TRUE,” and 73 and TA are “FALSE,” control passes to step 1 132, and CS is SDT, otherwise control passes to step 1 133.
  • step 1 133 short-term variances associated with the average square energies and are give
  • the ERLE can be used to gauge the performance of acoustic echo cancellation when the system is in the state S FE0 .
  • the value of ERLE ⁇ is larger during S FE o than during SOr- Figure 12 is a control-flow diagram for the routine "residual echo suppression" called in step 1009 in Figure 1OA and represents an embodiment of the present invention.
  • the CS of the audio transmission can be used to correct for gain in the output digital signa For example, during double-talk, or when an audio signal is produced in the near end room only, the gain acquired by the output digital signa is larger than when an audio signal is produced in the far end room only or when there is no audio signal.
  • Steps 1201-1204 adjust the gain in output digital signal in accordance with the current CS.
  • step 1201 when the CS is SDT or S N EO, control passes to step 1202, otherwise the CS is either SNS or SNEO and control passes to step 1203.
  • step 1202 the gam is computed as follows: G ⁇ ⁇ K 2 G ⁇ m - ⁇ ) +[X -K 2 )G ⁇ where Ki is a weight assigning a lower relative importance to ⁇ j' m ⁇ ' than to the maximum gain Gm 0x .
  • step 1203 the gain is computed as follows:
  • the residual signal is determined by:
  • Figure 13A is a control-flow diagram for the routine "determine called in step 1018 in Figure 1 OA and represents an embodiment of the present invention.
  • step 1301 the FFT is applied to the vector h ⁇ m ⁇ ⁇ in order to obtain a frequency domain dependent vector:
  • step 1302 a frequency domain, shadow-error vector is computed as follows:
  • Tr p is a truncation operator of length P
  • step 1303 an IFFT is applied to the frequency domain, shadow-error vector in order to obtain a shadow-error vector:
  • step 1304 the routine "determine s called.
  • step 1305 an evolving hyper- ellipsoid-specification vector is determined in accordance with the following recursive formula:
  • the parameter ⁇ is a weight that assigns greater importance to than to
  • the hyper-ellipsoid-specification vector is used to compute the shadow update step size ⁇ m in the routine "determine ⁇ m " called in step 1306.
  • the hyper-ellipsoid-specification vector is also used to compute and the adaptation step size ⁇ m in the routine "determine ⁇ m " called in step 1307.
  • step 1308 the shadow mismatch vector , determined in step 1304, and the shadow update step size ⁇ m , determined in step 1306, are used to recursively compute a shadow-impulse- response vector:
  • step 1309 the adaptatio step size ⁇ m , determined in step 1307, is used to recursively compute the approximate impulse-response vector as follows:
  • the parameter ⁇ m is used to weight the level of importance to the shadow-impulse- response vector
  • control passes to step 1311.
  • the threshold value C can be 10, 12, 15, or any other suitable value for weighting the approximate impulse-response vecto .
  • the impulse-response data structure described above with reference to step 1021 the impulse-response data structure described above with reference to step 1021 :
  • the impulse-response vectors are arranged in the impulse-response data structure in order of increasing decision epoch values as follows m ⁇ ⁇ m ⁇ - ⁇ ⁇ ⁇ • • ⁇ m 2 ⁇ m ⁇ » wnere the decision epoch m ⁇ corresponds to an approximate impulse-response vector that has been in the data structure for the longest period of time, and the decision epoch m x corresponds to the most recent approximate impulse-response vector added to the data structure.
  • the ucture can be updated in step 13 J 1 by removing the impulse-response vector from the data structure and adding the most
  • the data structure can be updated in step 131 1 according to the magnitude of the ERLE values associated with each approximate impulse-response vector. For example, the approximate impulse- ' response vector with the smallest associated ERLE value is removed from the data structure in order to accommodate addition of the most recently computed approximate impulse-response vector computed in step 1309 and satisfying the threshold condition in steps 1310.
  • the shadow update step size ⁇ m determined by the routine called in the step 1306 substantially ensures that the shadow-impulse-response vector etermined in the step 1308 lies within an evolving "trust region" that lies within the search space U.
  • This trust region can be a hype-spherical region, a hyper-elliptical region, a hyper- cubic region, or any other hyper-dimension region that lies within the search space. • In one embodiment of the present invention described with reference to Figure 13B, the trust region is assumed to be a hyper-elliptical region that lies within the search space.
  • Figure 13B provides a two-dimensional illustration of a hyper- elliptical region located within the search space U 1322 that represents an embodiment of the present invention ' .
  • the regions 1320 and 1322 are represented in two-dimensions, in practice these regions are actually L- dimensional vector subspaces o and are centered at the origin o .
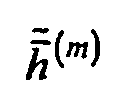
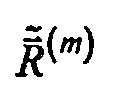
  • the shape of the hyper-elliptical region 1320 is determined by the hyper-ellipsoid-specification vecto computed in step 1305.
  • hyper-elliptical region 1320 which is associated with the hyper-ellipsoid- specification vector
  • the hyper-elliptical region 1320 is referred to as an "evolving" hyper-elliptical region because when a subsequent hyper-ellipsoid- specification vector s determined, the associated region changes orientation within the search space U 1322 but this newly oriented elliptical region retains a substantially elliptical shape.
  • a newly computed shadow-impulse-response vector computed according to the recursive formula falls within a newly oriented hyper-elliptical region because the shadow update step size ⁇ m is a function of the hyper-ellipsoid-specification vector as described below with reference to Figure 15.
  • the shadow update step size ⁇ m reduces the magnitude and changes the direction of the shadow mismatch vecto as indicated by vector 1326, so that the shadow- impulse-response vector lies within a newly oriented hyper-elliptical region 1328.
  • the magnitude of the shadow impulse-response vector can be changed so that it lies within the trust region by computing a vector that is added to the shadow impulse-response vector in order to adjust the individual components of the shadow impulse-response vector.
  • step 14 is a control-flow diagram for the routine "determine " called in step 1304 in Figure 13 and represents an embodiment of the present invention.
  • step 1401 an average spectrum of the frequency domain vector is computed as follows: and an average spectrum of the vector is computed as follows:
  • the parameter ⁇ is a weight nce to the vectors and than to the products I n step 1402, the energies computed in Figure 11 are used to determine:
  • steps 1403-1406 elements of an N-component, frequency domain, preconditioning vecto are determined. In thej ⁇ w-loop beginning in step 1403, steps 1404-1406 are repeated for each frequency domain index k. In step 1404, the elements of the preconditioning vector are calculated as follows:
  • step 1405 when k is less than N- 1 , control passes to step 1406, otherwise control passes to step 1407.
  • step 1406 the index k is incremented by the value "1.”
  • step 1407 the vecto is computed as follows:
  • Tr 1 is a truncation operator of size L
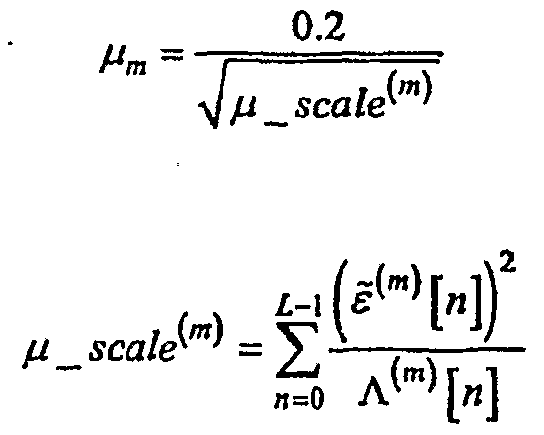
  • Figure 15 is a control-flow diagram for the routine "determine ⁇ m " called in step 1306 in Figure 13 that represents an embodiment of the present invention.
  • a parameter ⁇ __ scale ⁇ is computed as fol lows:
  • step 1502 when is greater than the value "1," control passes to step 1503, otherwise control passes to step 1504.
  • step 1503 ⁇ m is assigned the value .
  • step 1504, ⁇ m is assigned the value "0.2.”
  • Figure 16 is a control-flow diagram for the routine "determine ⁇ m " called in step 1307 in Figure 13 that represents an embodiment of the present invention.
  • a parameter ⁇ _scale ⁇ m ' is computed as follows:
  • step 1602 when E- ⁇ OSEJ for M decision periods, control passes to step 1603, otherwise, control passes to step 1604.
  • step 1603 a parameter c m is computed recursively as follows:
  • C 01 OIaX(C ⁇ 1 -4000,400 ⁇
  • ⁇ m is assigned a value according to:
  • step 1606 when ⁇ _scale jn ' is greater than "1," control passes to step 1607.
  • step 1607 ⁇ m is assigned the value:

Landscapes

  • Engineering & Computer Science (AREA)
  • Signal Processing (AREA)
  • Circuit For Audible Band Transducer (AREA)
  • Cable Transmission Systems, Equalization Of Radio And Reduction Of Echo (AREA)
  • Telephone Function (AREA)

Abstract

Various embodiments of the present invention are directed to methods and systems that reduce acoustic echoes in audio signals in accordance with changing conditions at first and second locations that are linked together in a communication system. In particular, one embodiment of the present invention relates to a method for determining an approximate impulse-response vector for canceling an acoustic echo in an audio signal transmitted from the first location (102) to the second location (104). This method includes forming a trust region within a search space based on computing a recursive specification vector defining the trust region. the method also includes computing a recursive shadow-impluse-response vector that lies substanially within the trust region, and comouting the approximate impulse-response vector based on the recursive shadow-impulse-response vector and the recursive specification vector.

Description

METHODS AND SYSTEMS FOR REDUCING ACOUSTIC ECHOES IN COMMUNICATION SYSTEMS
CROSS-REFERENCES TO RELATED APPLICATIONS This application is a continuation-in-part of U.S. Application No. 1 1/407,413, filed April 20, 2006.
TECHNICAL FIELD
The present invention is related to acoustic echo cancellation, and, in particular, to methods and systems for reducing acoustic echoes in communication systems.
BACKGROUND OF THE INVENTION
Increasing interest in communication media, such as the Internet, electronic presentations, voice mail, and audio-conference communication systems, is increasing the demand for high-fidelity audio and communication technologies. Currently, individuals and businesses are using these communication media to increase efficiency and productivity, while decreasing cost and complexity. For example, audio-conference communication systems allow one or more individuals at a first location to simultaneously converse with one or more individuals at other locations through full-duplex communication lines in nearly real time, without wearing headsets or using handheld communication devices. Typically, audio- conference communication systems include a number of microphones and loudspeakers, at each location, that can be used by multiple individuals for sending and receiving audio signals to and from other locations.
In many audio-conference communication systems, audio signals carry a large amount of data, and employ a broad range of frequencies. Modem audio-conference communication systems attempt to provide clear transmission of audio signals, free from perceivable distortion, background noise, and other undesired audio artifacts. One common type of undesired audio artifact is an acoustic echo. Acoustic echoes can occur when a transmitted audio signal loops through an audio-conference communication system due to the coupling of microphones and speakers at a location. Figure 1 shows a schematic diagram of an exemplary, two-location, audio- conference communication system. In Figure 1, the audio-conference communication system 100 includes a near room 102 and a far room 104. Sounds, such as voices, produced in the near room 102 are detected by a microphone 106, and sounds produced in the far room 104 are detected by a microphone 108. The microphones 106 and 108 are transducers that convert the sounds into continuous analog signals that are represented by x(t) and y(t) , respectively, where / is time.
The microphone 106 can detect many different sounds produced in the near room 102, including sounds output by the loudspeaker 1 14. An analog signal produced by the microphone 106 is represented by:
Figure imgf000003_0001
where
.$(/) is an analog signal representing sounds produced in the near room 102, v(t) is an analog signal representing noise, or extraneous signals created by disturbances in the microphone or communication channel 110, that, for example, may produces an annoying buzzing sound output from the loudspeaker 116, and /(*(/)) is an analog signal that represents an acoustic echo.
The acoustic echo f[x (/)) is due to both acoustic propagation delay in the near room 102 and a round-trip transmission delay of the analog signal #(/) over the communication channels 1 10 and 112. Sounds generated by the analog signal y[t) are output from loudspeaker 116 in the far room 104. Depending on the amplification, or gain, in the amplitude of the signal y(t) and the magnitude of the acoustic echo /(*(/)), a person speaking into the microphone 108 in the far room 104 may also hear an annoying, high-pitched, howling sound emanating from loudspeaker 1 16 as a result of the sound generated by the acoustic echo f(x(ή) .
Designers and manufacturers of audio-conference communication systems have attempted to compensate for acoustic echoes in various ways. One compensation technique employs a filtering system that reduces the acoustic echo. Typically, filtering systems employ adaptive filters that adapt to changing conditions at an audio-signal-receiving location. However, stand alone adaptive filters either faii to account for, or are often slow to adapt to, the widely varying acoustic path between loudspeaker and microphone. As a result, transmitted signals encoding conversations may be interrupted by numerous, brief periods of silence. Designers, manufacturers, and users of audio-conference communication systems have recognized a need for acoustic echo methods and systems that can reliably remove an acoustic echo from audio signals and that can rapidly adapt to the changing conditions at both audio- signal-receiving locations.
SUMMARY OF THE INVENTION
Various embodiments of the present invention are directed to methods and systems that reduce acoustic echoes in audio signals in accordance with changing conditions at first and second locations that are linked together in a communication system. In particular, one embodiment of the present invention relates to a method for determining an approximate impulse-response vector for canceling an acoustic echo resulting from an audio signal transmitted from the first location to the second location. This method includes forming a trust region within a search space based on computing a recursive specification vector defining the trust region. The method also includes computing a recursive shadow-impulse-response vector that lies substantially within the trust region, and computing the approximate impulse- response vector based on the recursive shadow-impulse-response vector and the recursive specification vector.
BRIEF DESCRIPTION OF THE DRAWINGS
Figure 1 shows a schematic diagram of an exemplary, two-location, audio- conference communication system.
Figures 2A-2C illustrate conversion of an analog signal to a digital signal. Figure 3 is a plot of an impulse excitation of a loudspeaker and a plot of an overall room impulse response resulting at the output of the microphone in response to the impulse excitation. Figures 4A-4E illustrate an example of determining a digital signal output from a microphone by convolving an input digital signal with the microphone impulse response.
Figure 5 illustrates convolving a digital signal with a five-component impulse response in order to obtain a convolved digital signal.
Figure 6 shows a schematic diagram of an exemplary, two-location, audio- conference communication system that includes an adaptive filter to reduce the level of the acoustic echo in the far room signal at the near room.
Figure 7 illustrates convolving a digital signal with an impulse response in a frequency domain in order to obtain a time-domain, convolved digital signal.
Figure 8 is an example plot of decision periods and decision epochs that represents an embodiment of the present invention.
Figure 9 illustrates a two-location, audio-conference communication system that represents an embodiment of the present invention. Figures 1 OA-I OB show a control-flow diagram that represents an embodiment of the present invention for reducing acoustic echoes in audio signals that are transmitted from a first location to a second location.
Figures lOC-lOD shows two plots of amplification energy versus time for the four types of control states that represents an embodiment of the present invention. Figures 1 IA-1 1C is a control-flow diagram for a routine "determine control state" that is called in step 1008 of the control-flow diagram shown in Figure 1OA and that represents an embodiment of the present invention.
Figure 12 is a control-flow diagram for a routine "residual echo suppression" that is called in step 1009 of the control-flow diagram shown in Figure 1OA and that represents an embodiment of the present invention.
Figure 13A is a control-flow diagram for a routine "determine A~M" that is called in step 1018 of the control-flow diagram shown in Figure 1OB and that represents an embodiment of the present invention.
Figure 13B provides a two-dimensional representation of a hyper-elliptical region that represents an embodiment of the present invention. Figure 14 is a control-flow diagram for a routine "determine εκ '" that is called in step 1304 of the control-flow diagram shown in Figure 13 and that represents an embodiment of the present invention.
Figure 15 is a control-flow diagram for a routine "determine /^," that is called in step 1306 of the control-flow diagram shown in Figure 13 and that represents an embodiment of the present invention.
Figure 16 is a control-flow diagram for a routine "determine χm" that is called in step 1307 of the control-flow diagram shown in Figure 13 and that represents an embodiment of the present invention.
DETAILED DESCRIPTION OF THE INVENTION
Various embodiments of the present invention are directed to methods and systems that reduce acoustic echoes in audio signals in accordance with changing conditions at first and second locations that are linked together in a communication system. The terms "first location" and "second location" are broad general terms that are associated with the different locations of the near room and the far room, respectively, which are used to describe below various method embodiments of the present invention. The communication system can be the Internet, electronic presentations, voice mail, audio-conference communication systems or any other kind of communication system that transmits signals between a first location and a second location. In various embodiments of the present invention, a first digital signal and a second digital signal are received as input at the first location. The first digital signal encodes sounds produced at a first location. The second digital signal encodes an acoustic echo and sounds produced at the second location. The methods compute a control state that depends on the state of current signal transmission. The control state represents one of the following: (1) sound transmitted from the first location only; (2) sound transmitted from the second location only; (3) sounds transmitted simultaneously between the first and second locations; and (4) no sound transmitted between the first and second locations. The methods then compute an approximate acoustic echo based on the control state. The methods generate an output digital signal at the first location by first subtracting the computed, approximate acoustic echo from the second digital signal, then adjusting the second digital signal for gain based on the control state. Finally, the output digital signal is transmitted to the first location.
In order to assist in understanding descriptions of various embodiments of the present invention, an overview of digital signals, impulse responses, and convolution is provided in a first subsection. An overview of acoustic echo cancellation is provided in a second subsection. An overview of discrete Fourier transformations is provided in a third subsection. Embodiments of the present invention are provided in a fourth subsection.
An Overview of Digital Signals. Impulse Responses, and Convolution
Sounds received by a microphone are transformed into an analog signal comprising a time-dependent, continuously varying voltage. In order to process an analog signal using a digital computer, the analog signal is first converted into a digital signal with minimal alteration of the essential information contained in the analog signal. Digital signals can be stored electronically, magnetically, or optically and can be processed using logical operations encoded in computer programs.
Figures 2A-2C illustrate conversion of an analog signal into a digital signal.
In Figures 2A-2B, horizontal axes, such as horizontal axis 202, represent time, and vertical axes,- such as vertical axis 204, represent analog signal amplitudes in volts.
Figure 2 A is a plot of a time-dependent, continuously-varying analog signal x{t)
206. The analog signal x(t) 206 is first sampled by measuring the amplitude of the analog signal x(t) at discrete sampling times. In order to prevent loss of essential information contained in the analog signal, the duration between sampling times is generally selected to be sufficiently short so that the analog signal varies little between consecutive sampling times. Figure 2B is a plot of a sampled signal 208 obtained by sampling the analog signal 206 in Figure 2A. The sampling times are in tenths of a second, and the sampled signal 208 is approximated as a step function by assuming a constant-signal amplitude between sampling times. For example, a constant-amplitude region 210 represents a constant value of -1.9 volts between sampling times 0.2 and 0.3 seconds. For efficient and convenient digital signal processing, it is desirable for both time and magnitude values to be integers. Therefore, an integer-encoded, digital signal is produced by multiplying the value of each constant-amplitude region by a selected constant and by multiplying the sampling times by a selected constant in order to produce integer values that represent the amplitude and sampling times of each step in the step function. An integer- valued sampling time is called a "time sample," and an integer-valued amplitude is called a "digital amplitude." The resulting digital signal can be functionally represented by x[n], where n, an independent variable, represents a time sample domain. Figure 2C is a plot of a digital signal obtained from the sampled signal 208 in Figure 2B. In Figure 2C, horizontal axis 212 is a time sample domain, vertical axis 214 is a digital signal axis.
Each point in the graph represents a quantized value representing the scaled amplitude of the digital signal at a scaled sampling time. For example, point x[2]
216 with coordinates (2,-19) represents step 210 in Figure 2B. A digital signal x[n] can, in general, be thought of as a series of impulses, each impulse corresponding to a unique component. The notation x[n], where n represents a particular time sample, can also be used to represent a single impulse of a digital signal that is called a "component" of a signal. Each component is a signal comprising all zero sample values except for a single value representing the amplitude at a single time sample, and is mathematically represented by:
*[«]== dδ[n- /?] where d is an integer scale factor that represents the amplitude, or strength, of the impulse, p is a time sample, and δ is the delta function defined as:
Figure imgf000008_0001
For example, in Figure 2C, the component x[θ] 218 is equal to 10£[/>], and the component Λ[2] 216 is equal to -19<5[2-/?]. In other words,/? in the delta function δ[n-p] represents a time sample shift, and n -p represents a time sample relative to time sample n.
A digital impulse response, h[n], is a digital signal that is output from a microphone when the input to the microphone is a unit impulse δ[n] , where p is "0" and d equals "1." The impulse response of a microphone can be determined by applying an impulse of sound with a very short duration to the microphone and measuring the signal output by the microphone. The impulse response can also be represented by a vector as follows:
Figure imgf000009_0001
where hn [•] is an impulse response component, and
L is the number of components that together compose the impulse response. Figure 3 shows a plot of an impulse
Figure imgf000009_0002
and a plot of an overall room impulse response Λ[»] produced in response to the impulse x[n] . The impulse response
Figure imgf000009_0003
includes the loudspeaker, room, and microphone. In Figure 3, impulse plot 302 represents an impulse x[n] input to a hypothetical microphone 304. The impulse x[n] 302 comprises all zeros except for a single nonzero point 306 at n equal to 0 and is represented by dδ[n- p] as described above. In this case, d equals "1" and p equals "0" so the impulse can be represented as δ[n] . In response to the impulse 302, the microphone 304 outputs an impulse response h[n] that is represented by an impulse-response plot 308. The impulse response 308 comprises all zeros except for the three nonzero digital signals represented by points 310-312. An actual digital impulse response to an impulse typically comprises a greater number of nonzero components than contained in the impulse, as shown in Figure 3. For example, the impulse response 308 includes 3 nonzero components while impulse 302 includes a single nonzero component. Impulse response 308 can be represented by the 3-component vector:
Figure imgf000010_0001
Typically, the impulse used to determine an impulse response is output from a loudspeaker into a room and is detected by a microphone. The loudspeaker, room, and microphone are referred to as a "system," and an associated impulse response can be thought of as a system impulse response. A digital signal transmitted from the system is determined by convolving a digital signal x[n] produced by the system with the impulse response h[n] of the system. The convolved digital signal is represented by xc[«] . Figures 4A-4D provide a graphical example of convolving a three-component digital signal x[n] produced by a hypothetical system with an impulse response A[«] in order to produce a digital signal xc [«] output from the system. Figure 4A is a plot of an example, two-component, impulse response Λ[«]
402 that is produced by the hypothetical system. The impulse response h[n] is assumed to be invariant with time.
Figure 4B is a plot of a first component of the digital signal x[n] that is input to the system at a time sample "0." The first component is represented by a scaled impulse 2<5[θ] 404. In response to the impulse 2δ[n] 404, the system outputs an impulse-response h[n] comprising a first component 406 at the time sample "0," and outputs a second component 408 at a later time sample "1." The impulse response to the impulse 2δ[n] 404 is essentially the impulse response in Figure 4A with the components multiplied by the impulse scale factor "2."
Figure 4C is a plot of a second component of the digital signal x[n] that is input to the system at the later time sample "I ." The second component is represented by an impulse £[«- 1] 410. In response to the impulse δ[n - 1] 410, the system outputs an impulse-response comprising a third component 412 at the time sample "1," and outputs a fourth component 414 at a later time sample "2." The impulse response to the impulse £[H - 1] 410 is essentially the impulse response in
Figure 4A with the component time samples shifted by a factor of "1." Because the second and the third components 408 and 412 occur at the same time sample "1," the amplitudes of the components 408 and 412' are summed in order to obtain a fifth component 416, which is the output at the time sample "1."
Figure 4D is a plot of a third component of the digital signal x[n\ that is input to the system at the time sample "2." The second component is represented by an impulse -2£[M -2] 418. In response to the impulse -2£[«-2], the system outputs an impulse response comprising a sixth component 420 at the time sample "2," and a seventh component 422 at a later time sample "3." The impulse response to the impulse -2S[n~2] 418 is essentially the impulse response in Figure 4A with the components multiplied by the scale factor "-2," and the component time samples shifted by a factor of "2." Because the fifth and the sixth components 414 and 420 occur at the same time sample "2," the amplitudes of the component 414 and 420 are summed to give an eighth component 424, which is the output at the time sample "2."
Note that convolving the three-component, input digital signal x[n] with the two-component impulse response h[n] outputs the four-component digital signal
#c[»] . In general, convolving an N component input digital signal *[«] with an L component impulse response h[n] gives an N + Z,~l component output signal
Components of the convolved digital signal xc[n] 426, in Figure 4D, can also be obtained by calculating the scalar product of a two-component vector representation of the impulse response and two-component vectors corresponding to each component of the digital signal x[n] that are given by:
Figure imgf000011_0001
Figure imgf000012_0001
The order of the components in the column vectors
Figure imgf000012_0009
and
Figure imgf000012_0005
are opposite in time ordering with respect to one another. For example, in the column vector the first
Figure imgf000012_0008
component A[O] appears earlier in time than the second component A[I], while, in the column vector
Figure imgf000012_0002
the first component x[n\ appears later in time than the second τ component jc[«- lj . Note that components of the vector that
Figure imgf000012_0006
correspond to negative valued time samples are assigned the value "0." For example, the first component 406, in Figure 4D, is calculated by:
Figure imgf000012_0003
where the component x[-\] is assigned the value "0." The second, third, and fourth components 416, 424, and 422 are calculated by:
Figure imgf000012_0004
respectively.
In general, a component of a convolved digital signal xc [n] is mathematically determined by:
Figure imgf000012_0007
where
"*»» i ;.s a symbol that represents convolution, and
Figure imgf000013_0001
In order to compute a convolved signal component xc[n], the ! previously obtain digital signal components of the digital signal x[n] are used, and the components of the vector that correspond to negative valued time samples are assigned the
Figure imgf000013_0003
value "0."
Figure 5 illustrates convolving a digital signal displayed in plot 502 with a five-component impulse response in order to obtain a convolved digital signal displayed in plot 504. In plots 502 and 504, horizontal axes, such as horizontal axis 506, are time sample axes, and vertical axes, such as vertical axis 508, are digital number axes. The convolved digital signal sample 510 in plot 504 is obtained as shown in Figure 5 and is mathematically represented by: xc [n] = x[n]*h[n]
Figure imgf000013_0002
where superscript T identifies the matrix transpose operation.
In the examples of convolution described above, the impulse response is assumed to remain constant at each time sample in the time domain. However, in practice, the impulse response of a system often depends on the conditions of the room. In other words, the impulse response of the system may change over time as conditions in the room change. For example, an impulse response of a system with no sound produced in the room is different from an impulse response of the same system at a later time when sounds are produced in the room. An Overview of Acoustic Echo Cancellation
Figure 6 shows a schematic diagram of the exemplary, two-location, audio- conference communication system shown in Figure 1 that includes an adaptive filter 602 to reduce the level of an acoustic echo in the far room 104 at the near room 102. In Figure 6, the digital signal x[n] is transmitted in the communication channel 1 12 from the far room 104 to the loudspeaker 1 14 in the near room 102. When the digital signal x[n] reaches the loudspeaker 1 14, the digital signal x[n] can be converted back into an analog signal x(t) and sound is output from the loudspeaker 114. The microphone 106 detects the sound output from the loudspeaker 1 14 and any sounds produced in the near room 102. The microphone outputs a digital signal in the communication channel 1 10 to the far room 104 that is mathematically represented by: y[n] = s[n]+xc[n] + v[n] where XC [H] = JC[/7] * /?[W] is a convolved digital signal that represents an acoustic echo and is produced by convolving the digital signal x[n] with the impulse response h[n] of the microphone 106, s[n] is a digital signal that represents sounds produced in the near room 102, and v[n] is a digital signal that represents any noise produced by electrical disturbances in both the microphone 106 and the communications channel 1 10.
In practice, the impulse response h[n] of the microphone 106 is not known with certainty. In order to reduce the amount of the acoustic echo xc [n] present in the digital signal y[n] , an approximate acoustic echo is subtracted from the digital signal y\n\ . The approximate acoustic echo is produced by also transmitting the digital signal x[n] to an adaptive filter 602, which produces an approximate impulse response The adaptive filter 602 convolves the approximate impulse response
Figure imgf000014_0001
with the digital signal x[n], in order to produce the approximate acoustic echo
Figure imgf000015_0003
which is subtracted from the digital signal y[n] at the summing junction
Figure imgf000015_0004
604. Subtracting the approximate acoustic echo at the summing junction
Figure imgf000015_0005
604 gives an output digital signal that is mathematically represented by:
Figure imgf000015_0001
where x in] * ^ W ~ x W * ^ E"] is called the "residual echo." The residual echo is a portion of the digital signal y[n] that is transmitted to the far room 104. Acoustic echo cancellation methods and systems are directed to producing approximate acoustic echoes that make the residual echoes inaudible to individuals that are simultaneously producing sounds input to the microphone 108 and listening to the loudspeaker 1 16 in the far room 104. The adaptive filter 602 is used to reduce the acoustic echo transmitted from the near room 102 to the far room 104. However, in practice, a second adaptive filter is needed to reduce an acoustic echo transmitted from the far room 104 to the near room 102.
An Overview of Discrete Fourier Transforms
Convolving a digital signal x[n] with an impulse response h[n] is often a computationally time-consuming step in the determination of an output digital signal r [n] . However, the computational time devoted to convolution can often be reduced by first separately mapping the digital signals x[n] and h[n] to discrete frequency domain digital signals X [k] and H[A;], respectively, using a discrete Fourier transform ("DFT"). The DFT is given by:
Figure imgf000015_0002
where k is an inverse time sample index with the units of inverse time or frequency, and
Figure imgf000016_0002
Next, the digital signals X[A:] and H[A:] are multiplied in the frequency domain and an inverse discrete Fourier transformation ("IDFT") is applied to the product
JiT[Jk]H[A;] , in order to obtain the convolved digital signal *[n]*A[/ι] . The IDFT applied to the product X[A:] H[A:] is:
Figure imgf000016_0001
where N is the number of digital signals in the inverse time sample domain. Figure 7 illustrates convolution of the digital signals x[n] and h[n] by first mapping the digital signals x[n\ and Λ[n] to the frequency domain and mapping the product X [A:] H[A:] back to the time sample domain in order to obtain convolved digital signal X[M] * A[«] . In Figure 7, directional arrow 702 represents applying a discrete Fourier transform ("DFT"). to the digital signal x[n] in order to obtain a digital signal X[A:], and directional arrow 704 represents applying the DFT to the impulse response h[n] in order to obtain a digital signal H[A:]. The digital signals X[A:] and H[A:] are multiplied in the frequency domain in order to obtain the product X[Ar]H[A:] . Next, an IDFT 706 is applied the product X[A:]H[A:] in order to obtain the convolved digital signal JC[«] * Λ[/Ϊ] . A fast Fourier transformation ("FFT") and a corresponding inverse fast
Fourier transform ("IFFT") are types of Fourier transformations that are often employed in order to avoid carrying out convolution in the time sample domain. Using the FFT and the IFFT can be hundreds or even thousands of times faster than convolving digital signals in the time domain. A number of different FFT and IFFT methods are described in the book "Discrete-Time Signal Processing (2nd Edition)," by A. Oppenhiemer, R. Schafer, and J. Buck, Prentice HaII, Inc., (1999-2000), which is just one of many references for the field of digital signal processing. Additional details can be obtained from the above-referenced book, or from many other textbooks, papers, and journal articles in this field.
Embodiments of the Present Invention Various . embodiments of the present invention are directed to .methods and systems that reduce acoustic echoes in audio signals and in accordance with changing conditions at separate locations linked by an audio-conference communication systems. In particular, embodiments of the present invention include methods for determining an approximate impulse-response vector corresponding to audio signals transmitted only from the far room to the near room, methods for canceling an acoustic echo produced during substantially simultaneous transmission of audio signals from the near room to the far room, and methods for updating a data structure used to store a number of approximate impulse-response vectors.
Various embodiments of the present invention are mathematical in nature.- For this reason, method embodiments of the present invention are described below with reference to numerous equations, and with reference to graphical illustrations and control-flow diagrams.
I. An Overview of Mathematical Foundations that relate to Embodiments of the Present Invention
The various embodiments of the present invention are based on a decision- making framework comprising Markov decision processes, sequential optimization, and optimal control theory. Two references for these fields are the books "Markov Decision Processes: Discrete Stochastic Dynamic Programming," by M. L. Puterman, John Wiley and Sons, New York, 1994; and "Dynamic Programming and Optimal Control," by D. P. Bertsekas, Athena Scientific vol. I and II, Belmont, MA, 1995. The description below presents those elements of Markov decision processes and the elements of optimal control theory that relate to embodiments of the present invention. Additional details can be obtained from the above-referenced books, or from many other books, papers, and journal articles in these fields. M
As described above with reference to Figure 3, an impulse response A[M] of a microphone can be mathematically represented as an /.-component vecto A
Figure imgf000018_0005
property of the impulse response is that:
Figure imgf000018_0004
where
D L is an /.-dimensional vector space,
Tϊs a set centered at the origin in
Figure imgf000018_0006
with a radius of
Figure imgf000018_0007
, and
E represents the maximum amplification energy, or gain, produced by a microphone in response to an impulse. In other words, the Euclidean norm of each impulse response output from a microphone satisfies the condition:
Figure imgf000018_0001
Although, in practice, an impulse response
Figure imgf000018_0008
is not known with certainty during acoustic echo cancellation, methods of the present invention are based on obtaining an approximate impulse response
Figure imgf000018_0009
that minimizes the average error:
Figure imgf000018_0002
where
is the error between the digital signal y[n] and the
Figure imgf000018_0010
acoustic ech and
Figure imgf000018_0011
Phn is a joint probability distribution function associated with the error
Figure imgf000018_0003
The average error can also be thought of as an expectation value of a random
Figure imgf000018_0012
variable with an associated probability Ph .
Figure imgf000018_0013
The method of the present invention produces approximate impulse responses Tin that minimize the average error and satisfy the following condition:
Figure imgf000019_0005
where
Figure imgf000019_0001
In the set , U is a set centered at the origin i
Figure imgf000019_0007
with a radius of
Figure imgf000019_0008
and
Figure imgf000019_0006
is called a "search space," εn is a subjectively small positive real number, is the variance of the digital signal
Figure imgf000019_0002
vector
Figure imgf000019_0003
. The symbol "inf means the "inflmum," which is the maximum lower bound of a set. For example, the infimum of the open interval (0,1) is the number "0" and" is represented by inf (0,1) = 0 even though the number "0" is not an element, of the open interval (0,1).
II. A Stochastic Approximation of the Approximate Impulse Response
Figure imgf000019_0009
The method of the present invention is also based on the assumption that an impulse respons exhibits little variation over Nf time samples, and the maximum
Figure imgf000019_0011
deviation between Nc time samples is bounded by:
Figure imgf000019_0004
The parameter Nc is called the "coherence time." As a result, rather than determine an approximate impulse response Tin for each time sample n, an approximate impulse response, is determined at the beginning of every N^ time samples, where Nd «
Figure imgf000019_0010
NΛ and m is a positive integer. An interval with N^ time samples is called a "decision period," and the beginning of a decision period is called a "decision epoch."
Figure 8 is an example plot of decision periods and decision epochs associated with impulse-response vectors that represents an embodiment of the present invention. In Figure 8, horizontal axis 802 is a time sample axis, vertical axis 804 is digital number axis, and dots, such as dot 806, represent a digital signal *[«] .
Decision periods 808, 810, and 812 are each comprised of six time samples (Nd = 6). Decision epochs occur at the beginning of the decision periods 808, 810, and 812. Embodiments of the present invention described below produce a new approximate impulse response
Figure imgf000020_0003
at each decision epoch. For example, at the beginning of the decision period 808, an initial approximate impulse response
Figure imgf000020_0004
is provided. At the
beginning of the decision period 810, a new approximate impulse response is
Figure imgf000020_0005
computed. In general, at the beginning of a decision period (m- Ϋ)Nd 812, an
approximate impulse respons is computed and is used for each time sample n in
Figure imgf000020_0006
the interval
Figure imgf000020_0001
In practice, the average error cannot be computed directly, because
Figure imgf000020_0007
the joint probability distribution function P^ associated with each impulse response
Hn is unknown. However, the average error can be approximated by an
Figure imgf000020_0008
empirical average error:
Figure imgf000020_0002
where wo is any decision epoch, m > mo, and the superscript (m) used in this and in subsequent equations identifies the decision epoch. An approximate impulse respons can be determined by minimizing the empirical
Figure imgf000021_0005
average error over the search space U to give a minimum empirical
Figure imgf000021_0004
equation:
Figure imgf000021_0001
where the overbar identifies a matrix,
Figure imgf000021_0002
7 is an w by OT identity matrix,
Figure imgf000021_0003
The constant Λπ in the minimum empirical equation is a smallest positive value that ensure is an element of the search space U. However, using the minimum
Figure imgf000021_0006
empirical equation to determine the approximate impulse response is
Figure imgf000021_0007
computationally demanding. The computational demand can be reduced by applying a stochastic approximation in the form of a recursive equation:
Equation (2):
Figure imgf000021_0009
where is a matrix with elements determined as described below with reference to
Figure imgf000021_0008
a control-flow diagram shown in Figure 14, and γm is a scalar quantity and is determined as described below with reference to a control-flow diagram shown in Figure 16. The methods and systems of the present invention employ the recursive equation to determine the approximate impulse-response vector which also
Figure imgf000022_0003
satisfies the following condition:
Figure imgf000022_0001
wher
Figure imgf000022_0004
Figure imgf000022_0002
«55,, is a subjectively small positive real number.
III. Implementation
Figure 9 illustrates a two-location, audio-conference communication system, as shown in Figure 1 , including an echo-control unit that represents an embodiment of the present invention. The system 900 includes DC offset removal units 902 and 904 and an echo-control unit 906. DC offset is a low-frequency distortion often caused by electrical interference. The electrical interference creates a constant voltage that can cause clicks and pops in the sound output from a loudspeaker. The DC offset removal unit 902 corrects the DC offset in the digital signal xrec[«] produced in the far room 104 as follows: x[n] = ax[n-l] + .5(\ + a)(xrec [n]~xrec [n-l]) where a is a constant ranging from about 0.9 to about 0.9999. The digital signal x[n] is output from the DC offset removal unit 902 and transmitted to the echo control unit 906. The DC offset removal unit 904 corrects the DC offset in the digital signal ymic [«] produced- in the near room 102 as follows:
. y[n] = ay[n-\]+.5(\+a)(ymic[n]~ymic[n- \)) The digital signal y[n] is output from the DC offset removal unit 904 and transmitted to the echo control unit 906. The echo-control unit 906 includes a control 908, an impulse response correction 910, a summing junction 912, and an echo control suppressor 914. The digital signal x[n] is transmitted to both the control 908 and the impulse response correction 910, and the digital signal y[n] is transmitted to both the control 908 and the summing junction 912. The control 908 produces an approximate impulse-response vector that is input to impulse response correction 910 which, in turn, is used to produce an approximate acoustic echo. The approximate acoustic echo is transmitted to the summing junction 912 and subtracted from the digital signal
Figure imgf000023_0002
to produce an output digital signal
Figure imgf000023_0001
. Operation of the control
908, impulse response correction 910, and summing juncti is described below with reference to Figures 10-16. The output digital signal is input to the echo
Figure imgf000023_0004
control suppressor 914, which corrects for amplification, or gain, in the output digital signal and outputs a resultant digital signal r[n] that is transmitted to the
Figure imgf000023_0003
loudspeaker 1 16 in the far room 104. Operation of the echo control unit 906 is described below with reference to Figures 10A- 1OB and Figure 12.
Note that in the above description the echo control unit 906 is used to reduce the acoustic echo transmitted from the near room 102 to the far room 104, in Figure 9. The echo control unit 906 can be located either inside or outside the near room 102. However, in practice, a second echo control unit (not shown) is needed to reduce an acoustic echo transmitted from the far room 104 to the near room 102.
Figures 10A- 1OB show a control-flow diagram that represents an embodiment of the present invention for reducing acoustic echoes in audio signals that are transmitted from the near room 102 to the far room 104. In step 1001 of Figure 1OA, values for parameters are initialized as displayed below in Tables 1-3. Table 1 displays parameters and example associated values that can be used in the equations described below with reference to Figures 10-16: Table 1
Figure imgf000023_0005
Figure imgf000024_0004
Note that the parameter values displayed in Table 1 are example values that correspond to particular near room and far room conditions and configurations, and are not intended to restrictive. In other applications of the present invention, these parameters can be adjusted in order to accommodate different near room and far room conditions and different configurations of the near room and far room. The parameter P is the number of digital signals jΛm' [«] in the digital signal vector described below with reference to step 1004 in Figure 1OA. The parameter
Figure imgf000024_0003
N is the number of digital signals used to form the frequency domain vectors
Figure imgf000024_0001
Figure imgf000024_0002
and .K2 are values that are used to assign relative importance or weight to terms in equations described below with reference to Figures 10-14. The parameters Gmax and Gmin are the maximum and minimum gain associated with the microphone 106. Table 2 shows initial values for variable parameters that change during iterations of the methods described below with reference to Figures 11-12:
Figure imgf000024_0005
Figure imgf000025_0014
The parameters an are short-term energy variances associated with the
Figure imgf000025_0002
Figure imgf000025_0003
digital signals x^ [rt] and J^ [H] , respectively. The parameter is the short-
Figure imgf000025_0013
term energy variance associated with the energy in the output signal
Figure imgf000025_0001
The parameters and are long-term energy variances associated with the
Figure imgf000025_0004
Figure imgf000025_0005
digital signals Λ'^[/Ϊ] and J^ [π], respectively. The parameter is a long-
Figure imgf000025_0006
term energy variance associated with the noise v[n]. The parameters and
Figure imgf000025_0007
Figure imgf000025_0008
are maximum square energies associated with the digital signals x^[nj and y [«] . The parameter G'0' is an initial gain adaptation value described below with reference to Figure 12. Table 3 shows initial values for components of vectors
Figure imgf000025_0009
,
Figure imgf000025_0012
Figure imgf000025_0011
and
Figure imgf000025_0010
that change during iterations of the method described below with reference to Figures 13-14:
bl
Figure imgf000025_0015
Figure imgf000026_0010
The vecto
Figure imgf000026_0003
is an initial average spectrum associated with the vector
Figure imgf000026_0006
and the vector
Figure imgf000026_0004
is an initial average spectrum associated with a vector
Figure imgf000026_0007
, which are described below with reference to step 1302 in Figure 13A. The vecto
Figure imgf000026_0009
defines an evolving hyper-elliptic gion described below with reference to step
1305 in Figure 13A. The vector
Figure imgf000026_0005
is an initial shadow- impulse-response vector described below with reference to step 1308 in Figure 13A. The vector
Figure imgf000026_0008
is an initial impulse-response vector described below with reference to step 1309 in Figure
13A. In thcfor-\oop beginning in step 1002, steps 1003-1022 are repeated for each decision epoch m. In the forAoop beginning in step 1003, steps 1004-1012 are repeated for each time sample n. In step 1004, a digital signal x-"1' [n\ is output from the DC offset 902, and a digital signal y^ [n] is output from the DC offset 904, in
Figure 9. In step 1005, the digital signals jr ' [«] are used to form an (Z + P)- component digital signal vector:
Figure imgf000026_0001
and the digital signals ^^^[/Ϊ] are used to form a P-component digital signal vector:
Figure imgf000026_0002
In step 1006, a FFT is applied to the vectors in order to
Figure imgf000027_0004
obtain frequency domain vectors:
Figure imgf000027_0001
In step 1007, an output signal vector is computed as follows:
Figure imgf000027_0002
where
Tr^ is a truncation operator of length NA
, "° " represents component-wise multiplication of two vectors,
Figure imgf000027_0003
s the output digital signal output from the summing junction 912, in
Figure imgf000027_0005
Figure 9. Component-wise multiplication of the 3-tupIes (1,2,3) and (3,1,2) is represented by: (l,2,3) ®(3,l,2) = (l-3,2- l,3- 2) = (3,2,6)
In step 1008, the routine "determine control state" is called, which identifies four types of audio transmissions that can exist between the near room 102 and the far room 104, in Figure 9. The four kinds of audio transmission are called "control states" ("CS") and are identified as follows: (1) an audio signal is output from the near end room 102 only and is represented by SNEO,' (2) an audio signal is output from the far end room 104 only and is represented by SFEOI (3) audio signals are simultaneously output from both the near end room 102 and the far end room 104, which is called "double-talk," is represented by SDTI and (4) no audio signals output from the near end room 102 and the far end room 104 is represented by S^s- In step 1009, the routine "residual echo suppression" is called in order to compute a gain- corrected output digital signal r'm' [«], as described above with reference to echo suppression 914, in Figure 9. In step 1010, the gain-corrected output digital signal rm' [n] is transmitted to loudspeaker 1 16, in Figure 9. In step 1011 of Figure 1OB, when n is less than mNd - \ , control passes to step 1012, otherwise control passes to step 1013. In step 1012, the time sample n is incremented by "1," and steps 1004-1011 are repeated. In step 1013, when another decision epoch m is available, control passes to step 1014, otherwise the routine "determine r[n]" is terminated. In step 1014, -the decision epoch m is incremented by "1." In step 1015, when the CS is SNEo or SNS, control passes to step 1016, otherwise control passes to step 1017. In step 1016, the impulse-response vector is updated by assigning elements in the vector
Figure imgf000028_0003
to corresponding values in the impulse response
Figure imgf000028_0001
from the previous decision period, and the shadow-impulse- response vector is updated by assigning elements in the shadow-impulse-resp'onse vector hSm' to corresponding elements in the shadow-impulse-response vector
Figure imgf000028_0002
from the previous decision period. In step 1017, when the CS is SFEO, control passes to step 1018, otherwise the CS is 5Or and control passes to step 1019. In step 1018, the routine "determine hrm>" is called and an approximate impulse-response vector h^ is computed. In step 1019, when "count" does not equal "0," control passes to step 1020, otherwise control passes to step 1021. In step 1020, the "count" is decremented by "1" and control passes to step 1016. In step 1021, the approximate impulse-response vector
Figure imgf000029_0004
is selected form an impulse-response data structure represented by the set . This data structure includes the K most
Figure imgf000029_0001
recent approximate impulse responses with the highest signal to noise ratio. Note that the approximate impulse-response vector is not updated during double talk because during double talk the signal-to-noise ratio decreases rapidly. The increased noise distorts the approximate impulse-response vector. In order to avoid this distortion, the approximate impulse-response vector is selected from the impulse-response data structure. The subscripts on the decision epochs m correspond to the order in which the impulse response vectors have been added to the data structure. For example, the impulse response vector
Figure imgf000029_0006
has been in the data structure the longest, and the impulse response vecto is the most recent addition to the data structure.
Figure imgf000029_0007
In various embodiments of the present invention, the approximate impulse- response vector can be selected based on any number of different criteria. For example, in one embodiment of the present invention, an approximate impulse- response vector can be selected in step 1021 according to which impulse-response vector has the largest corresponding
Figure imgf000029_0002
In another embodiment of the present invention, in step 1021, the approximate impulse-response vector that has been in the data structure the longest is selected, which is
Figure imgf000029_0005
. The impulse- response data structure is updated in the routine "determine
Figure imgf000029_0003
which is described below with reference to steps 1310 and 1312, in Figure 13A. The associated value of
ERLE^"1' is computed in the routine "determine control state." In step 1022, "count" is assigned a value "Λf." The value Mean be 10, 12, 15, 18, or any other suitable value.
Figures 10C- 1OD shows two plots of amplification energy versus time for the four types of control states that represents an embodiment of the present invention. In Figures 10C- 10D, vertical. axes, such as vertical axis 1030, represent amplification energy associated with signals transmitted between the near room 102 and the far room 104, horizontal axes, such as horizontal axis 1032, represent time, and horizontal dashed lines, such as dashed line 1034, correspond to a double talk threshold energy. Curves 1036 and 1038 represent the amplification energies associated with signals transmitted between the near room 102 and the far room 104. Amplification energies below the double talk threshold 1034 are associated with an SFEO, S/VEO, or Sμs control state. Peak 1040 corresponds to amplification energy resulting from double talk, which exceeds the double talk threshold 1034. However, peak 1042 corresponds to a noise produced in the near room 102 or the far room 104. This noise initially creates the appearance of double talk because the amplification energy exceeds the double talk threshold energy 1034, even though double talk is not actually taking place. In order to avoid short duration noises from being misinterpreted as double talk, at time 1044, a countdown begins with the variable "count," described in step 1019, set equal to M. This countdown takes place in steps 1019 and 1020, which avoids selecting an approximate impulse-response vector from the data structure in step 1021 until double talk can be confirmed for
Figure imgf000030_0001
M iterations. In other words, the method of the present invention continues operating as if double talk has not occurred for M decision periods. If after M iterations the amplification energy has decreased, as indicated at time 1046 in Figure 1OC, inappropriate selection of an approximate impulse-response vector for double talk has been avoided. On the other hand, if after M iterations the amplification energy has increased, as indicated by time 1048 in Figure 10D, an approximate impulse-response for double talk is selected in step 1021.
Figures 1 IA-11C show a control-flow diagram for the routine "determine control state" called in step 1008 in Figure 1OA and represents an embodiment of the present invention. In Figure 1 IA, step 1101, average square energies associated with the vector rror vecto
Figure imgf000030_0002
are:
Figure imgf000030_0003
Figure imgf000031_0006
In step 1 102, long-term energy variances are recursively determined for the average square energies by
Figure imgf000031_0007
The coefficients 0.99 and 0.01 are weights that assign a higher relative importance to the variances an than to the average square
Figure imgf000031_0008
Figure imgf000031_0009
energies
Figure imgf000031_0002
and
Figure imgf000031_0001
In steps 1 103-1107, a maximum square energy ssociated with the digital signal vector is determined. In step 1103,
Figure imgf000031_0016
Figure imgf000031_0017
when the maximum square energy is less than the average square energy
Figure imgf000031_0010
Figure imgf000031_0015
control passes to step 1 104, otherwise control passes to step 1 105. In step 1104, the maximum square energy is computed by:
Figure imgf000031_0003
and control passes to step 1 108. In step 1105, when the average square energy
Figure imgf000031_0018
is greater than the maximum square energy control passes to step 1 106,
Figure imgf000031_0011
otherwise control passes to step 1107. In step 1106, the maximum square energy is computed by:
Figure imgf000031_0004
and control passes to step 1 108. The coefficients 0.999 and 0.001 assign a higher relative importance to the maximum square energy
Figure imgf000031_0013
than to the average square energy
Figure imgf000031_0012
. In step 1107, the maximum square energy is assigned
Figure imgf000031_0014
the value of
Figure imgf000031_0005
In steps 1108-11 12, a maximum square energy associated with the digital signal vect determined. In step 1108, when
Figure imgf000032_0005
the maximum square energy is less than the average square energy
Figure imgf000032_0006
Figure imgf000032_0007
control passes to step 1109, otherwise control passes to step 1110. lή step 11 , the maximum square energy is computed by:
Figure imgf000032_0001
and control passes to step 1113, in Figure HB. In step 1110, when the average square energy is greater than the maximum square energy ontrol
Figure imgf000032_0008
Figure imgf000032_0009
passes to step 1111, otherwise control passes to step 1112. In step 1 111, the maximum square energy is computed by:
Figure imgf000032_0010
and control passes to step 1113. In step 1112, the maximum energy is
Figure imgf000032_0012
assigned the value of
Figure imgf000032_0011
In steps 1113-1 124 of Figure 1 IB, the av re energies
Figure imgf000032_0022
and
Figure imgf000032_0017
Figure imgf000032_0013
long-term energy variances and , and
Figure imgf000032_0014
Figure imgf000032_0015
maximum energie
Figure imgf000032_0018
and
Figure imgf000032_0016
are used to determine logic "TRUE" or
"FALSE" values of Boolean variables 71, 72, 73, and TA, which are subsequently used in the control-flow diagram in Figure HC to determine the CS. In step 1113, when the average square energy
Figure imgf000032_0002
is greater than or equal to , control passes to step 1114 and 71 is set to "TRUE,"
Figure imgf000032_0019
otherwise control passes to step 1115 and 71 is set to "FALSE." In step 1 116, when the average square energy
Figure imgf000032_0020
is greater than or equal to
Figure imgf000032_0003
control passes to step 1117 and 72 is set to "TRUE," otherwise control passes to step 1118 and 72 is set to "FALSE." In step 1119, when the long-term variance
Figure imgf000032_0004
[«] is less than
Figure imgf000032_0021
control passes to step 1120 and 73 is set to "TRUE," otherwise control passes to step 1121 and 73 is set to "FALSE." In step 1122, when the long- term variance
Figure imgf000033_0001
control passes to step 1 123 and TA is set to "TRUE," otherwise control passes to step 1124 and TA is set to "FALSE." .
In steps 1 125-1131 of Figure HC, the Boolean logic values determined in steps 1113-1124 are used to determine the CS. In step 1125, when 71 and 73 are "TRUE," and 72 and TA are "FALSE," control passes to step 1126 and CS is SNEO, otherwise control passes to step 1127. In step 1127, when 73 and TA are "TRUE," and T2 is "FALSE," control passes to step 1128, and CS is SNS, otherwise control passes to step 1 129. In step 1 129, when 72 is "TRUE" and T1, T3, and T4 are
"FALSE," control passes to step 1 130, and CS is SFEO, otherwise control passes to step 1131. In step 1131, when Tl and Tl are "TRUE," and 73 and TA are "FALSE," control passes to step 1 132, and CS is SDT, otherwise control passes to step 1 133. In step 1 133, short-term variances associated with the average square energies
Figure imgf000033_0008
and are give
Figure imgf000033_0009
' nd
Figure imgf000033_0003
The short-term variance coefficients 0.8 and 0.2 are weights that assign a higher relative importance to the variance nd than to the average
Figure imgf000033_0004
Figure imgf000033_0005
square energies
Figure imgf000033_0006
and
Figure imgf000033_0007
.. In step 1134, the short-term variances determined in step 1132 are used to calculate an echo return loss enhancement value ("ERLE") given by:
Figure imgf000033_0002
The ERLE can be used to gauge the performance of acoustic echo cancellation when the system is in the state SFE0. The value of ERLE^ is larger during SFEo than during SOr- Figure 12 is a control-flow diagram for the routine "residual echo suppression" called in step 1009 in Figure 1OA and represents an embodiment of the present invention. The CS of the audio transmission can be used to correct for gain in the output digital signa For example, during double-talk, or when an audio
Figure imgf000034_0002
signal is produced in the near end room only, the gain acquired by the output digital signa is larger than when an audio signal is produced in the far end room only
Figure imgf000034_0003
or when there is no audio signal. The maximum and minimum amounts of gain that the output digital signal can acquire are represented by the constants Gmax and Gmm, respectively. Steps 1201-1204 adjust the gain in output digital signal in
Figure imgf000034_0004
accordance with the current CS. In step 1201, when the CS is SDT or SNEO, control passes to step 1202, otherwise the CS is either SNS or SNEO and control passes to step 1203. In step 1202, the gam is computed as follows: G^ ^ K2G{m-χ) +[X -K2)G^ where Ki is a weight assigning a lower relative importance to <j'm~ ' than to the maximum gain Gm0x. In step 1203, the gain is computed as follows:
GW = K^-1K(I -K1)G^n where K\ is a weight assigning a higher relative importance to G^m~]' than to the minimum gain Gmm. In step 1204, the residual signal is determined by:
Figure imgf000034_0005
Figure 13A is a control-flow diagram for the routine "determine called
Figure imgf000034_0007
in step 1018 in Figure 1 OA and represents an embodiment of the present invention.
In step 1301, the FFT is applied to the vector h^m~^ in order to obtain a frequency domain dependent vector:
Figure imgf000034_0001
In step 1302, a frequency domain, shadow-error vector is computed as follows:
where
Figure imgf000034_0006
Tr p is a truncation operator of length P, and
Figure imgf000035_0001
In step 1303, an IFFT is applied to the frequency domain, shadow-error vector in order to obtain a shadow-error vector:
Figure imgf000035_0002
In step 1304, the routine "determine
Figure imgf000035_0012
s called. In step 1305, an evolving hyper- ellipsoid-specification vector is determined in accordance with the following recursive formula:
Figure imgf000035_0003
The parameter η is a weight that assigns greater importance to than to
Figure imgf000035_0005
Figure imgf000035_0004
The hyper-ellipsoid-specification vector
Figure imgf000035_0011
is used to compute the shadow update step size μm in the routine "determine μm" called in step 1306. The hyper-ellipsoid-specification vector
Figure imgf000035_0006
is also used to compute and the adaptation step size γm in the routine "determine γm" called in step 1307. In step 1308, the shadow mismatch vector
Figure imgf000035_0007
, determined in step 1304, and the shadow update step size μm, determined in step 1306, are used to recursively compute a shadow-impulse- response vector:
Figure imgf000035_0008
In step 1309, the adaptatio step size γm , determined in step 1307, is used to recursively compute the approximate impulse-response vector as follows:
Figure imgf000035_0009
The parameter γm is used to weight the level of importance to the shadow-impulse- response vector
Figure imgf000035_0010
In step 1310, when the ERLE ERLE^ is greater than a threshold value C, control passes to step 1311. The threshold value C can be 10, 12, 15, or any other suitable value for weighting the approximate impulse-response vecto
Figure imgf000036_0002
. In step 1311, the impulse-response data structure described above with reference to step 1021 :
Figure imgf000036_0001
is updated.
The impulse-response vectors are arranged in the impulse-response data structure in order of increasing decision epoch values as follows mκ < mκ-\ < ■ •• < m 2 < m \ » wnere the decision epoch mκ corresponds to an approximate impulse-response vector that has been in the data structure for the longest period of time, and the decision epoch mx corresponds to the most recent approximate impulse-response vector added to the data structure. In one embodiment of the present invention, the ucture can be updated in step 13 J 1 by removing
Figure imgf000036_0004
the impulse-response vector from the data structure and adding the most
' recently computed impulse-response vector
Figure imgf000036_0003
to the data structure computed in step 1309, which gives the impulse response data structure:
Figure imgf000036_0005
.
In. other embodiments of the present invention, the data structure can be updated in step 131 1 according to the magnitude of the ERLE values associated with each approximate impulse-response vector. For example, the approximate impulse- ' response vector with the smallest associated ERLE value is removed from the data structure in order to accommodate addition of the most recently computed approximate impulse-response vector computed in step 1309 and satisfying the threshold condition in steps 1310.
The shadow update step size μm determined by the routine called in the step 1306 substantially ensures that the shadow-impulse-response vector
Figure imgf000036_0006
etermined in the step 1308 lies within an evolving "trust region" that lies within the search space U. This trust region can be a hype-spherical region, a hyper-elliptical region, a hyper- cubic region, or any other hyper-dimension region that lies within the search space. • In one embodiment of the present invention described with reference to Figure 13B, the trust region is assumed to be a hyper-elliptical region that lies within the search space. Figure 13B provides a two-dimensional illustration of a hyper- elliptical region located within the search space U 1322 that represents an embodiment of the present invention'. Although in Figure 13B the regions 1320 and 1322 are represented in two-dimensions, in practice these regions are actually L- dimensional vector subspaces o and are centered at the origin o . The shape
Figure imgf000037_0010
Figure imgf000037_0006
of the hyper-elliptical region 1320 is determined by the hyper-ellipsoid-specification vecto computed in step 1305. In other words, as shown in Figure 13B, six
Figure imgf000037_0005
previously determined shadow-impulse-response vectors represented by dots lie within the hyper-elliptical region 1320 which is associated with the hyper-ellipsoid- specification vector
Figure imgf000037_0004
The hyper-elliptical region 1320 is referred to as an "evolving" hyper-elliptical region because when a subsequent hyper-ellipsoid- specification vector s determined, the associated region changes orientation
Figure imgf000037_0003
within the search space U 1322 but this newly oriented elliptical region retains a substantially elliptical shape. A newly computed shadow-impulse-response vector computed according to the recursive formula:
Figure imgf000037_0009
Figure imgf000037_0002
falls within a newly oriented hyper-elliptical region because the shadow update step size μm is a function of the hyper-ellipsoid-specification vector
Figure imgf000037_0001
as described below with reference to Figure 15. As shown in Figure 13B, when the magnitude and direction of the shadow mismatch vector
Figure imgf000037_0007
is large, as indicated by vector 1324, the shadow update step size μm reduces the magnitude and changes the direction of the shadow mismatch vecto
Figure imgf000037_0011
as indicated by vector 1326, so that the shadow- impulse-response vector
Figure imgf000037_0008
lies within a newly oriented hyper-elliptical region 1328.
Note that in other embodiments of the present invention, rather than computing a single shadow update step size μm to update the shadow impulse- response vector, the magnitude of the shadow impulse-response vector can be changed so that it lies within the trust region by computing a vector that is added to the shadow impulse-response vector in order to adjust the individual components of the shadow impulse-response vector.
- Figure 14 is a control-flow diagram for the routine "determine
Figure imgf000038_0007
" called in step 1304 in Figure 13 and represents an embodiment of the present invention. In step 1401, an average spectrum of the frequency domain vector
Figure imgf000038_0009
is computed as follows:
Figure imgf000038_0001
and an average spectrum of the vector
Figure imgf000038_0010
is computed as follows:
where
Figure imgf000038_0002
Figure imgf000038_0005
The parameter β is a weight nce to the vectors
Figure imgf000038_0003
and
Figure imgf000038_0008
Figure imgf000038_0006
than to the products In step 1402, the energies computed in Figure 11 are used to determine:
Figure imgf000038_0004
In steps 1403-1406, elements of an N-component, frequency domain, preconditioning vecto are determined. In thejϊw-loop beginning in step 1403, steps 1404-1406
Figure imgf000039_0005
are repeated for each frequency domain index k. In step 1404, the elements of the preconditioning vector are calculated as follows:
Figure imgf000039_0004
Figure imgf000039_0001
where k ranges from 0 to N - I . In step 1405, when k is less than N- 1 , control passes to step 1406, otherwise control passes to step 1407. In step 1406, the index k is incremented by the value "1." In step 1407, the vecto
Figure imgf000039_0008
is computed as follows:
Figure imgf000039_0006
where
Tr1 is a truncation operator of size L, and
Figure imgf000039_0007
Figure 15 is a control-flow diagram for the routine "determine μm" called in step 1306 in Figure 13 that represents an embodiment of the present invention. In step 1501 , a parameter μ __ scale^ is computed as fol lows:
Figure imgf000039_0002
In step 1502, when
Figure imgf000039_0003
is greater than the value "1," control passes to step 1503, otherwise control passes to step 1504. In step 1503, μm is assigned the value
Figure imgf000039_0009
. In step 1504, μm is assigned the value "0.2." Figure 16 is a control-flow diagram for the routine "determine γm" called in step 1307 in Figure 13 that represents an embodiment of the present invention. In step 1601, a parameter γ_scale^m' is computed as follows:
Figure imgf000040_0001
In step 1602, when E- ≤ OSEJ for M decision periods, control passes to step 1603, otherwise, control passes to step 1604. In step 1603, a parameter cm is computed recursively as follows:
C01 = OIaX(C^1 -4000,400} In step 1604, the parameter cm is computed recursively as follows: cm = max{c_, + 1,40000}
In step 1605, γm is assigned a value according to:
Figure imgf000040_0002
where am is computed in step 1402 of Figure 14. In step 1606, when γ _scalejn' is greater than "1," control passes to step 1607. In step 1607, γm is assigned the value:
Figure imgf000040_0003
The foregoing description, for purposes of explanation, used specific nomenclature to provide a thorough understanding of the invention. However, it will be apparent to one skilled in the art that the specific details are not required in order to practice the invention. The foregoing descriptions of specific embodiments of the present invention are presented for purposes of illustration and description. They are not intended to be exhaustive of or to limit the invention to the precise forms disclosed. Obviously, many modifications and variations are possible in view of the above teachings. The embodiments are shown and described in order to best explain the principles of the invention and its practical applications, to thereby enable others skilled in the art to best utilize the invention and various embodiments with various modifications as are suited to the particular use contemplated. It is intended that the scope of the invention be defined by the following claims and their equivalents:

Claims

FOREIGN CLAIMS
1. A method for determining an approximate impulse-response vector for canceling an acoustic echo in an audio signal transmitted from a first location (102) to a second location (104), the method comprising: forming a trust region within a search space based on computing a recursive specification vector defining the trust region; computing a recursive shadow-impulse-response vector that lies substantially within the trust region; and computing the approximate impulse-response vector based on the recursive shadow-impulse-response vector and the recursive specification vector
2. The method of claim 1 wherein the search space further comprise a set of all possible approximate impulse-response vectors centered at the origin in
Figure imgf000041_0003
with a radius of
Figure imgf000041_0001
where E represents the maximum amplification energy, or gain, produced by a' microphone located in the first location in response to an impulse, and the trust region further comprise a hyper-elliptical region, a hyper-spherical region, a hyper-cubic region, or any other type of hyper-dimensional geometric region within the search space.
3. The method of claim 1 wherein computing a recursive specification vector further comprises employing a recursive formula for the specification vector given by:
Figure imgf000041_0002
where integer associated with a decision period,
Figure imgf000041_0004
is the hyper-el lipsoid-specification vector 'associate with a previous decision period identified by m - 1 ,
Figure imgf000041_0005
js an impulse-response vector associated with a previous decision period identified by m-\ , o represents component wise multiplication, and η is a weighting factor.
4. The method of claim 1 wherein computing the recursive shadow-impulse- response vector further comprises employing a recursive formula for the shadow- impulse-response vector given by:
Figure imgf000042_0004
where
Figure imgf000042_0005
is a shadow-mismatch vector,
Figure imgf000042_0001
is a shadow-impulse-response vector associated with a previous decision period identified by m - 1 , μm is a shadow update step size,
Figure imgf000042_0002
m is an integer associated with a decision period, L is a number of vector components, IFFT is the inverse Fourier transform operator, Tr1 is a truncation operator of size L,
Figure imgf000042_0006
Js a frequency domain, preconditioning operator,
Figure imgf000042_0007
is a frequency domain vector corresponding to the audio signal, and is a frequency domain, shadow error vector.
Figure imgf000042_0008
5. The method of claim 4 wherein components of the frequency domain, preconditioning operator further comprise:
Figure imgf000042_0003
where of the frequency domain vector
Figure imgf000042_0009
is ponent ency domain
Figure imgf000043_0004
Figure imgf000043_0008
Figure imgf000043_0007
shadow error vector given b A is a stabilizing constant, and
Figure imgf000043_0001
6. The method of claim 4 wherein the shadow-update-step size μm further comprises setting
Mn = 0.2 when μ_scale^m' > 1 , otherwise
where
Figure imgf000043_0002
is the wth element of the shadow-mismatch vecto , and Λ^[«] is the
Figure imgf000043_0005
Figure imgf000043_0006
nth element of a hyper-ellipsoid-specification vector
Figure imgf000043_0009
7. The method of claim 1 wherein computing the approximate impulse-response vector based on the recursive shadow-impulse-response vector and the recursive specification vector further comprises employing a recursive formula given by:
Figure imgf000043_0003
where
Figure imgf000043_0010
is a shadow-impulse-response vector associated with a decision period identified by m,
Figure imgf000043_0011
Ji,s an approximate impulse-response vector associated with a previous decision period identified by m - 1 , and
Figure imgf000044_0003
where
Figure imgf000044_0001
for M decision periods and
Figure imgf000044_0004
cm = max {cm_, - 4000,400}) otherwise cm = max {cm_l +1,40000}
8. The method of claim 7 wherein the impulse response step size γm further comprises setting
Figure imgf000044_0002
when μ_scαle-m' > 1 , where
Figure imgf000044_0005
is the «th element of the shadow-impulse vector , and A^' [«] is the
Figure imgf000044_0006
Figure imgf000044_0007
«th element of a hyper-ellipsoid-specification vecto
9. A method of updating a data structure of approximate impulse-response vectors, the method comprising: providing a plurality of approximate impulse-response vectors each of which includes a corresponding echo-retum-loss-enhancement value; storing a first approximate impulse-response vector in the data structure when the corresponding echo-retum-loss-enhancement value is greater than a threshold value; and deleting a second approximate impulse-response vector in the data structure.
10. The method of claim 9 wherein deleting a second approximate impulse- response vector from the data structure further comprises one of: deleting an approximate impulse-response vector from the data structure with the smallest associated echo-return-loss-enhancement value; and deleting an approximate impulse-response vector from the data structure that has been stored in the data structure for the longest period of time.
PCT/US2007/009765 2006-04-20 2007-04-20 Methods and systems for reducing acoustic echoes in communication systems Ceased WO2007124117A1 (en)

Priority Applications (1)

Application Number Priority Date Filing Date Title
DE112007000974.8T DE112007000974B4 (en) 2006-04-20 2007-04-20 Method for reducing acoustic echoes in communication systems

Applications Claiming Priority (4)

Application Number Priority Date Filing Date Title
US11/407,413 2006-04-20
US11/407,413 US8045730B1 (en) 2006-04-20 2006-04-20 Methods and systems for reducing acoustic echoes in communication systems
US11/786,481 US8320574B2 (en) 2006-04-20 2007-04-12 Methods and systems for reducing acoustic echoes in communication systems
US11/786,481 2007-04-12

Publications (1)

Publication Number Publication Date
WO2007124117A1 true WO2007124117A1 (en) 2007-11-01

Family

ID=38512233

Family Applications (1)

Application Number Title Priority Date Filing Date
PCT/US2007/009765 Ceased WO2007124117A1 (en) 2006-04-20 2007-04-20 Methods and systems for reducing acoustic echoes in communication systems

Country Status (3)

Country Link
US (1) US8320574B2 (en)
DE (1) DE112007000974B4 (en)
WO (1) WO2007124117A1 (en)

Cited By (1)

* Cited by examiner, † Cited by third party
Publication number Priority date Publication date Assignee Title
JP2013538849A (en) * 2010-09-30 2013-10-17 アストラゼネカ・アクチエボラーグ Crystalline naloxol-PEG conjugate

Families Citing this family (8)

* Cited by examiner, † Cited by third party
Publication number Priority date Publication date Assignee Title
US8208649B2 (en) * 2009-04-28 2012-06-26 Hewlett-Packard Development Company, L.P. Methods and systems for robust approximations of impulse responses in multichannel audio-communication systems
US8483398B2 (en) * 2009-04-30 2013-07-09 Hewlett-Packard Development Company, L.P. Methods and systems for reducing acoustic echoes in multichannel communication systems by reducing the dimensionality of the space of impulse responses
US20110096699A1 (en) * 2009-10-27 2011-04-28 Sakhamuri Srinivasa Media pipeline for a conferencing session
US9538299B2 (en) * 2009-08-31 2017-01-03 Hewlett-Packard Development Company, L.P. Acoustic echo cancellation (AEC) with conferencing environment templates (CETs)
US20110099227A1 (en) * 2009-10-27 2011-04-28 Walls Jeffrey J Communication application with steady-state conferencing
JP5649488B2 (en) * 2011-03-11 2015-01-07 株式会社東芝 Voice discrimination device, voice discrimination method, and voice discrimination program
US20160094914A1 (en) * 2014-09-30 2016-03-31 Alcatel-Lucent Usa Inc. Systems and methods for localizing audio streams via acoustic large scale speaker arrays
US10122863B2 (en) * 2016-09-13 2018-11-06 Microsemi Semiconductor (U.S.) Inc. Full duplex voice communication system and method

Citations (2)

* Cited by examiner, † Cited by third party
Publication number Priority date Publication date Assignee Title
US20030219113A1 (en) * 2002-05-21 2003-11-27 Bershad Neil J. Echo canceller with double-talk and channel impulse response adaptation
US20060018460A1 (en) * 2004-06-25 2006-01-26 Mccree Alan V Acoustic echo devices and methods

Family Cites Families (6)

* Cited by examiner, † Cited by third party
Publication number Priority date Publication date Assignee Title
US6553122B1 (en) * 1998-03-05 2003-04-22 Nippon Telegraph And Telephone Corporation Method and apparatus for multi-channel acoustic echo cancellation and recording medium with the method recorded thereon
GB2344500B (en) 1998-12-02 2003-06-25 Mitel Corp Improved method of operating a full duplex speakerphone echo canceller
JP4734714B2 (en) * 2000-12-22 2011-07-27 ヤマハ株式会社 Sound collection and reproduction method and apparatus
GB2389286A (en) 2002-05-28 2003-12-03 Mitel Knowledge Corp Echo cancellation
US7471788B2 (en) 2002-11-25 2008-12-30 Intel Corporation Echo cancellers for sparse channels
GB2395878A (en) 2002-11-29 2004-06-02 Mitel Knowledge Corp Method of capturing constant echo path information using default coefficients

Patent Citations (2)

* Cited by examiner, † Cited by third party
Publication number Priority date Publication date Assignee Title
US20030219113A1 (en) * 2002-05-21 2003-11-27 Bershad Neil J. Echo canceller with double-talk and channel impulse response adaptation
US20060018460A1 (en) * 2004-06-25 2006-01-26 Mccree Alan V Acoustic echo devices and methods

Non-Patent Citations (1)

* Cited by examiner, † Cited by third party
Title
MADER A ET AL: "Step-size control for acoustic echo cancellation filters - an overview", SIGNAL PROCESSING, AMSTERDAM, NL, vol. 80, no. 9, September 2000 (2000-09-01), pages 1697 - 1719, XP004215534, ISSN: 0165-1684 *

Cited By (1)

* Cited by examiner, † Cited by third party
Publication number Priority date Publication date Assignee Title
JP2013538849A (en) * 2010-09-30 2013-10-17 アストラゼネカ・アクチエボラーグ Crystalline naloxol-PEG conjugate

Also Published As

Publication number Publication date
US20070253565A1 (en) 2007-11-01
US8320574B2 (en) 2012-11-27
DE112007000974T5 (en) 2009-02-19
DE112007000974B4 (en) 2019-06-27

Similar Documents

Publication Publication Date Title
WO2007124117A1 (en) Methods and systems for reducing acoustic echoes in communication systems
JP5288723B2 (en) Multi-channel echo compensation
CN101964670B (en) Echo suppression method and apparatus thereof
US8483398B2 (en) Methods and systems for reducing acoustic echoes in multichannel communication systems by reducing the dimensionality of the space of impulse responses
TWI682672B (en) Echo cancellation system and method with reduced residual echo
EP1287672B1 (en) Method and device for acoustic echo cancellation combined with adaptive beamforming
US9800734B2 (en) Echo cancellation
EP2048659A1 (en) Gain and spectral shape adjustment in audio signal processing
WO2017099728A1 (en) System and method for suppression of non-linear acoustic echoes
JP4897921B2 (en) Method and system for reducing acoustic echo in a multi-channel audio communication system
KR20220157475A (en) Echo Residual Suppression
US9020144B1 (en) Cross-domain processing for noise and echo suppression
EP3469591B1 (en) Echo estimation and management with adaptation of sparse prediction filter set
US8208649B2 (en) Methods and systems for robust approximations of impulse responses in multichannel audio-communication systems
US8144863B2 (en) Method and apparatus for echo cancellation
US8045730B1 (en) Methods and systems for reducing acoustic echoes in communication systems
Sudhir et al. Acoustic echo cancellation using adaptive algorithms
WO1997007624A1 (en) Echo cancelling using signal preprocessing in an acoustic environment
Gupta et al. Review paper on linear and nonlinear acoustic echo cancellation
Kotte Performance Analysis of Adaptive Algorithms based on different parameters Implemented for Acoustic Echo Cancellation in Speech Signals
박지환 Frequency-Domain Nonlinear Acoustic Echo Reduction Techniques Using Single-Channel and Multi-Channel Microphones
Lee et al. Non-linear acoustic echo cancellation based on mel-frequency domain volterra filtering
CN119360871A (en) Adaptive filtering method based on full range zero-attraction LMS algorithm
EP4205108A1 (en) Acoustic processing device for multichannel nonlinear acoustic echo cancellation
Yue et al. Application of Fast BLMS Algorithm in Acoustic Echo Cancellation

Legal Events

Date Code Title Description
121 Ep: the epo has been informed by wipo that ep was designated in this application

Ref document number: 07755871

Country of ref document: EP

Kind code of ref document: A1

WWE Wipo information: entry into national phase

Ref document number: 1120070009748

Country of ref document: DE

RET De translation (de og part 6b)

Ref document number: 112007000974

Country of ref document: DE

Date of ref document: 20090219

Kind code of ref document: P

122 Ep: pct application non-entry in european phase

Ref document number: 07755871

Country of ref document: EP

Kind code of ref document: A1