WO2005043161A2 - Method for distinguishing leukemia subtypes - Google Patents
Method for distinguishing leukemia subtypes Download PDFInfo
- Publication number
- WO2005043161A2 WO2005043161A2 PCT/EP2004/012463 EP2004012463W WO2005043161A2 WO 2005043161 A2 WO2005043161 A2 WO 2005043161A2 EP 2004012463 W EP2004012463 W EP 2004012463W WO 2005043161 A2 WO2005043161 A2 WO 2005043161A2
- Authority
- WO
- WIPO (PCT)
- Prior art keywords
- value
- polynucleotide defined
- ofthe numbers
- aml
- expression
- Prior art date
Links
Classifications
-
- G—PHYSICS
- G01—MEASURING; TESTING
- G01N—INVESTIGATING OR ANALYSING MATERIALS BY DETERMINING THEIR CHEMICAL OR PHYSICAL PROPERTIES
- G01N33/00—Investigating or analysing materials by specific methods not covered by groups G01N1/00 - G01N31/00
- G01N33/48—Biological material, e.g. blood, urine; Haemocytometers
- G01N33/50—Chemical analysis of biological material, e.g. blood, urine; Testing involving biospecific ligand binding methods; Immunological testing
- G01N33/53—Immunoassay; Biospecific binding assay; Materials therefor
- G01N33/574—Immunoassay; Biospecific binding assay; Materials therefor for cancer
- G01N33/57407—Specifically defined cancers
- G01N33/57426—Specifically defined cancers leukemia
-
- C—CHEMISTRY; METALLURGY
- C12—BIOCHEMISTRY; BEER; SPIRITS; WINE; VINEGAR; MICROBIOLOGY; ENZYMOLOGY; MUTATION OR GENETIC ENGINEERING
- C12Q—MEASURING OR TESTING PROCESSES INVOLVING ENZYMES, NUCLEIC ACIDS OR MICROORGANISMS; COMPOSITIONS OR TEST PAPERS THEREFOR; PROCESSES OF PREPARING SUCH COMPOSITIONS; CONDITION-RESPONSIVE CONTROL IN MICROBIOLOGICAL OR ENZYMOLOGICAL PROCESSES
- C12Q1/00—Measuring or testing processes involving enzymes, nucleic acids or microorganisms; Compositions therefor; Processes of preparing such compositions
- C12Q1/68—Measuring or testing processes involving enzymes, nucleic acids or microorganisms; Compositions therefor; Processes of preparing such compositions involving nucleic acids
- C12Q1/6876—Nucleic acid products used in the analysis of nucleic acids, e.g. primers or probes
- C12Q1/6883—Nucleic acid products used in the analysis of nucleic acids, e.g. primers or probes for diseases caused by alterations of genetic material
- C12Q1/6886—Nucleic acid products used in the analysis of nucleic acids, e.g. primers or probes for diseases caused by alterations of genetic material for cancer
-
- C—CHEMISTRY; METALLURGY
- C12—BIOCHEMISTRY; BEER; SPIRITS; WINE; VINEGAR; MICROBIOLOGY; ENZYMOLOGY; MUTATION OR GENETIC ENGINEERING
- C12Q—MEASURING OR TESTING PROCESSES INVOLVING ENZYMES, NUCLEIC ACIDS OR MICROORGANISMS; COMPOSITIONS OR TEST PAPERS THEREFOR; PROCESSES OF PREPARING SUCH COMPOSITIONS; CONDITION-RESPONSIVE CONTROL IN MICROBIOLOGICAL OR ENZYMOLOGICAL PROCESSES
- C12Q2600/00—Oligonucleotides characterized by their use
- C12Q2600/112—Disease subtyping, staging or classification
-
- C—CHEMISTRY; METALLURGY
- C12—BIOCHEMISTRY; BEER; SPIRITS; WINE; VINEGAR; MICROBIOLOGY; ENZYMOLOGY; MUTATION OR GENETIC ENGINEERING
- C12Q—MEASURING OR TESTING PROCESSES INVOLVING ENZYMES, NUCLEIC ACIDS OR MICROORGANISMS; COMPOSITIONS OR TEST PAPERS THEREFOR; PROCESSES OF PREPARING SUCH COMPOSITIONS; CONDITION-RESPONSIVE CONTROL IN MICROBIOLOGICAL OR ENZYMOLOGICAL PROCESSES
- C12Q2600/00—Oligonucleotides characterized by their use
- C12Q2600/158—Expression markers
Definitions
- the present invention is directed to a method for distinguishing leukemia subtypes, in particular leukemia subtypes AML with t(15;17), t(8;21), inv(16), inv(3), complex aberrant karyotype (CA), AML-MLL, normal karyotype (NK), AML- other, i.e.
- trisomy 8 trisomy 11, trisomy 13, monosomy 7, del(5q), del(9q), t(6;9); del(20q) and del(12p) and trisomy 4, ALL-MLL, ALL-Ph+, ALL-t(8;14), T-ALL, other B-lineage (OBL), CML, normal-BM (bone marrow), and or CLL, by determining the expression level of selected marker genes.
- AML acute myeloid
- ALL acute lymphatic
- CML chronic myeloid
- CML chronic lymphatic leukemia
- the FAB classification was proposed by the French-American-British co-operative group which was based on cytomorphology and cytochemistry in order to separate AML subgroups according to the morphological appearance of blasts in the blood and bone marrow.
- genetic abnormalities occurring in the leukemic blast had a major impact on the morphological picture and even more on the prognosis.
- the karyotype of the leukemic blasts is the most important independent prognostic factor regarding response to therapy as well as survival.
- leukemia diagnostics Analysis of the morphology and cytochemistry of bone marrow blasts and peripheral blood cells is necessary to establish the diagnosis.
- immunophenotyping is mandatory to separate very undifferentiated AML from acute lymphoblastic leukemia and CLL.
- Leukemia subtypes investigated can be diagnosed by cytomorphology alone, only if an expert reviews the smears.
- a genetic analysis based on chromosome analysis, fluorescence in situ hybridization or RT- PCR and immunophenotyping is required in order to assign all cases in to the right category. The aim of these techniques besides diagnosis is mainly to determine the prognosis ofthe leukemia.
- CML chronic myeloid leukemia
- CLL chronic lymphoid
- ALL acute lymphoblastic
- AML acute myeloid leukemia
- the new therapeutic drug inhibits the CML specific chimeric tyrosine kinase BCR-ABL generated from the genetic defect observed in CML, the BCR-ABL-rearrangement due to the translocation between chromosomes 9 and 22 (t(9;22) (q34; ql 1)).
- the therapy response is dramatically higher as compared to all other drugs that had been used so far.
- Another example is the subtype of acute myeloid leukemia AML M3 and its variant M3v both with karyotype t(15;17)(q22; ql l-12).
- the introduction of a new drug has improved the outcome in this subgroup of patient from about 50% to 85 % long-term survivors.
- diagnostics today must accomplish sub-classification with maximal precision. Not only for these subtypes but also for several other leukemia subtypes different treatment approaches could improve outcome. Therefore, rapid and precise identification of distinct leukemia subtypes is the future goal for diagnostics.
- the technical problem underlying the present invention was to provide means for leukemia diagnostics which overcome at least some ofthe disadvantages of the prior art diagnostic methods, in particular encompassing the time-consxuning and unreliable combination of different methods and which provides a rapid assay to unambigously distinguish one AML subtype from another, e.g. by genetic analysis.
- WO-A 03/039443 discloses marker genes the expression levels of which are characteristic for certain leukemia, e.g. AML subtypes and additionally discloses methods for differentiating between the subtype of AML cells by determining the expression profile of the disclosed marker genes.
- WO-A 03/039443 does not provide guidance which set of distinct genes discriminate between two subtypes and, as such, can be routineously taken in order to distinguish one leukemia subtype from another.
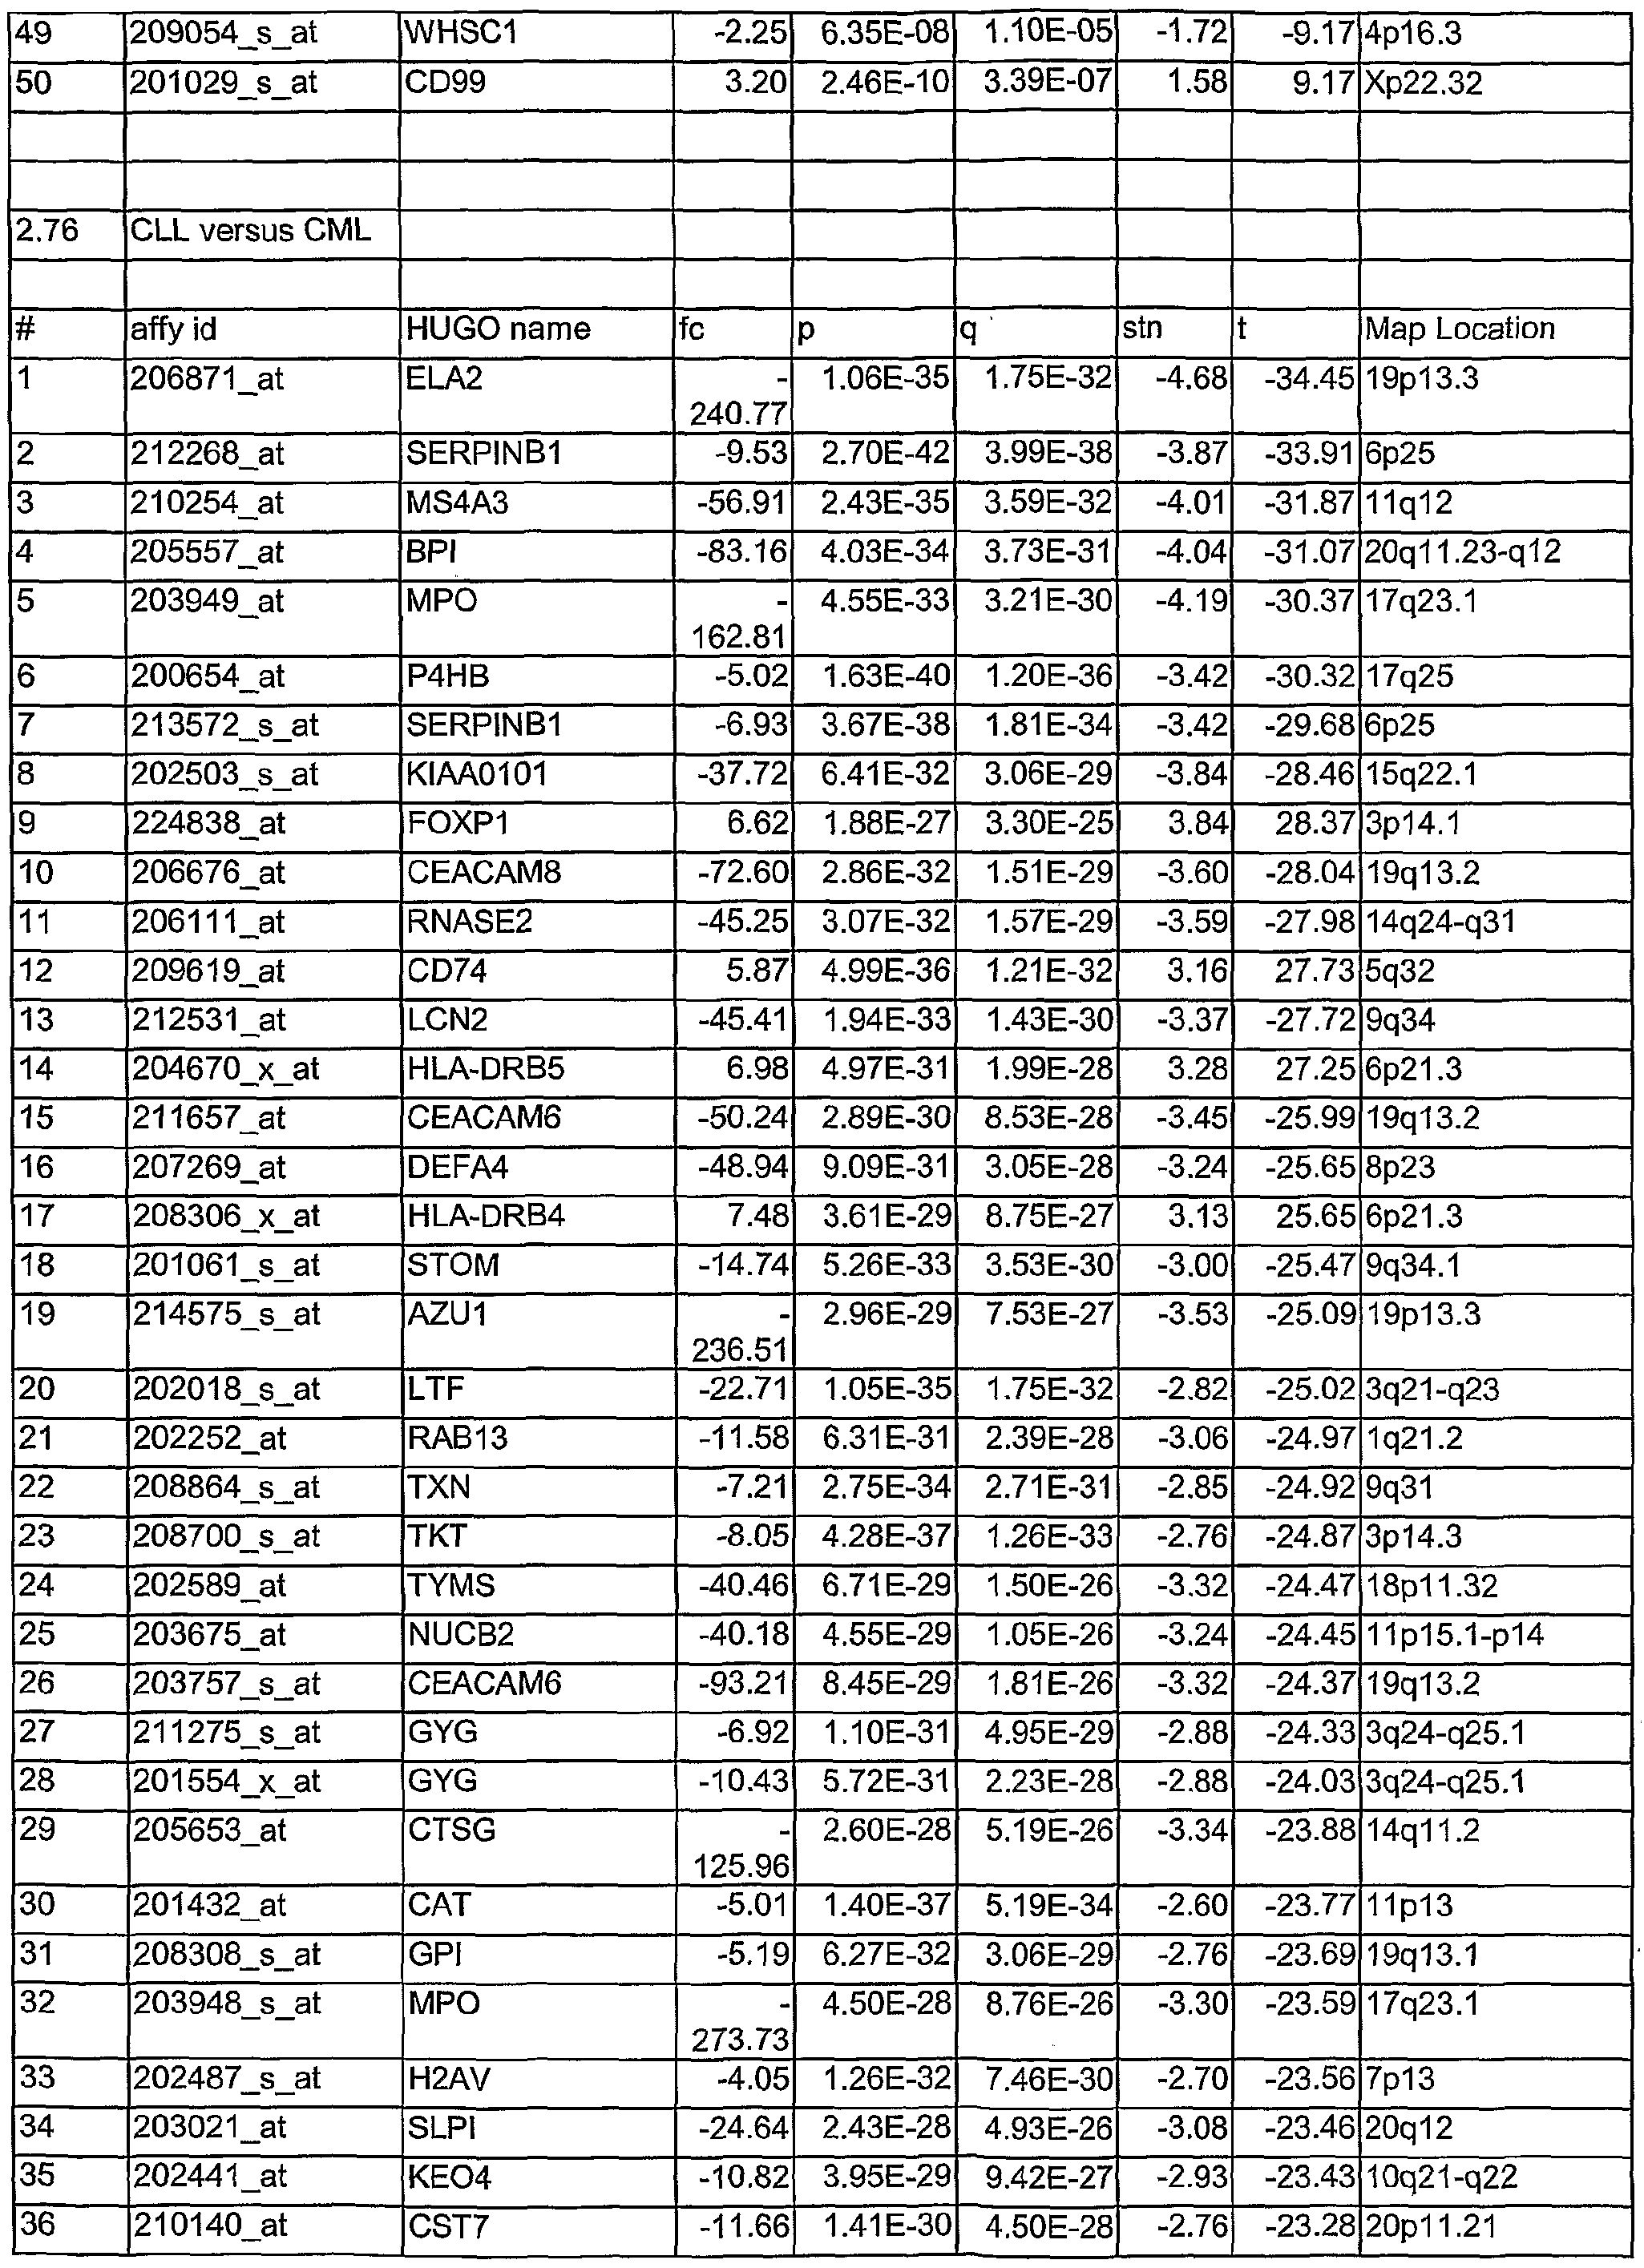
- the problem is solved by the present invention, which provides a method for distinguishing leukemia subtypes t(15;17), t(8;21), inv(16), inv(3) 5 complex aberrant karyotype (CA), AML-MLL, normal karyotype (NK), AML-other (trisomy 8, trisomy 11, trisomy 13, monosomy 7, del(5q), del(9q), t(6;9); del(20q) and del(12p) and trisomy A), ALL-MLL, ALL-Ph+, ALL-t(8;14), T-ALL, other B- lineage (OBL), CML, normal-BM, and/or CLL in a sample, the method comprising determining the expression level of markers selected from the markers identifiable by their Affymetrix Identification Numbers (affy id) as defined in Tables 1 and/or 2, wherein a lower expression of at least one polynucleotide defined by at least one ofthe numbers 1 to 50 of Table 1.1
- a lower expression of at least one polynucleotide defined by at least one ofthe numbers 1 to 50 of Table 2.26 having a negative fc value, and or a higher expression of at least one polynucleotide defined by at least one ofthe numbers 1 to 50 of Table 2.26 having a positive fc value is indicative for the presence ALL_T lineage when ALL_T lineage distinguished from AML_inv(l 6), and or wherein a lower expression of at least one polynucleotide defined by at least one ofthe numbers 1 to 50 of Table 2.27 having a negative fc value, and/or a higher expression of at least one polynucleotide defined by at least one ofthe numbers 1 to 50 of Table 2.27 having a positive fc value, is indicative for the presence ALL_T lineage when ALL_T lineage distinguished from AML_inv(3), and/or wherein a lower expression of at least one polynucleotide defined by at least one ofthe numbers 1 to 50 of
- t(15;17) AML with t(15;17) translocation
- t(8;21) AML with t(8;21) translocation inv(16): AML with inversion 16 inv(3): AML with inversion 3
- CA AML with complex aberrant karyotype
- AML-MLL AML with mutations on the mixed lineage leukaemia (MLL) gene normal karyotype (NK): AML with normal karyotype trisomy 8: AML with trisomy of chromosome 8 trisomy 11 : AML with trisomy of chromosome 11 trisomy 13: AML with trisomy of chromosome 13 monosomy 7: AML with monosomy of chromosome 7 del(5q): AML with 5q deletion del(9q): AML with 9q deletion t(6;9): AML with t(6;9) translocation del(20q): AML with 20 q deletion del(12p): AML with deletion 12 p deletion trisomy 4: AML with trisomy 4
- ALL-MLL acute lymphoblastic leukaemia with mutations on the mixed lineage leukemia (MLL) gene
- ALL-Ph+ acute lymphoblastic leukaemia with genetic aberration on the Philadelphia chromosome
- ALL-t(8;14) acute lymphoblastic leukemia with translocation t(8;21)
- T-ALL T cell acute lymphoblastic leukemia other B-lineage (OBL):
- CLL chronic lymphatic leukemia
- all other subtypes refer to the subtypes of the present invention, i.e. to all other subtypes except for the one being under investigation
- a sample means any biological material containing genetic information in the form of nucleic acids or proteins obtainable or obtained from an individual.
- the sample includes e.g. tissue samples, cell samples, bone marrow and/or body fluids such as blood, saliva, semen.
- the sample is blood or bone marrow, more preferably the sample is bone marrow.
- a general method for isolating and preparing nucleic acids from a sample is outlined in Example 3.
- the term "lower expression” is generally assigned to all by numbers and Affymetrix Id. definable polynucleotides the t- values and fold change (fc) values of which are negative, as indicated in the Tables. Accordingly, the term “higher expression” is generally assigned to all by numbers and Affymetrix Id. definable polynucleotides the t-values and fold change (fc) values of which are positive.
- the term "expression” refers to the process by which mRNA or a polypeptide is produced based on the nucleic acid sequence of a gene, i.e.illerexpression" also includes the formation of mRNA upon transcription.
- the term determining the expression level preferably refers to the determination of the level of expression, namely of the markers.
- marker refers to any genetically controlled difference which can be used in the genetic analysis of a test versus a control sample, for the purpose of assigning the sample to a defined genotype or phenotype.
- markers refer to genes which are differentially expressed in, e.g., different AML subtypes.
- the markers can be defined by their gene symbol name, their encoded protein name, their transcript identification number (cluster identification number), the data base accession number, public accession number or GenBank identifier or, as done in the present invention, Affymetrix identification number, chromosomal location, UniGene accession number and cluster type, LocusLink accession number (see Examples and Tables).
- the Affymetrix identification number (affy id) is accessible for anyone and the person skilled in the art by entering the "gene expression omnibus" internet page of the National Center for Biotechnology Information (NCBI) (http://www.ncbi.nlm.nih.gov/geo/).
- NCBI National Center for Biotechnology Information
- the affy id's of the polynucleotides used for the method of the present invention are derived from the so-called U133 chip.
- the expression level of a marker is determined by the determining the expression of its corresponding "polynucleotide" as described hereinafter.
- the term “bigpolynucleotide” refers, generally, to a DNA, in particular cDNA, or RNA, in particular a cRNA, or a portion thereof or a polypeptide or a portion thereof.
- the polynucleotide is formed upon transcription of a nucleotide sequence which is capable of expression.
- the polynucleotide fragments refer to fragments preferably of between at least 8, such as 10, 12, 15 or 18 nucleotides and at least 50, such as 60, 80, 100, 200 or 300 nucleotides in length, or a complementary sequence thereto, representing a consecutive stretch of nucleotides of a gene, cDNA or mRNA.
- polynucleotides include also any fragment (or complementary sequence thereto) of a sequence derived from any of the markers defined above as long as these fragments unambiguously identify the marker.
- the determination of the expression level may be effected at the transcriptional or translational level, i.e. at the level of mRNA or at the protein level.
- Protein fragments such as peptides or polypeptides advantageously comprise between at least 6 and at least 25, such as 30, 40, 80, 100 or 200 consecutive amino acids representative of the corresponding full length protein. Six amino acids are generally recognized as the lowest peptidic stretch giving rise to a linear epitope recognized by an antibody, fragment or derivative thereof.
- the proteins or fragments thereof may be analysed using nucleic acid molecules specifically binding to three-dimensional structures (aptamers).
- the determination of the expression levels may be effected by a variety of methods.
- the polynucleotide, in particular the cRNA is labelled.
- the labelling of the polynucleotide or a polypeptide can occur by a variety of methods known to the skilled artisan.
- the label can be fluorescent, chemiluminescent, bioluminescent, radioactive (such as 3 H or 32 P).
- the labelling compound can be any labelling compound being suitable for the labelling of polynucleotides and or polypeptides. Examples include fluorescent dyes, such as fluorescein, dichlorofluorescein, hexachlorofluorescein, BODIPY variants, ROX, tetramethylrhodamin, rhodamin X, Cyanine-2, Cyanine-3, Cyanine-5, Cyanine-7,
- IRD40 FluorX, Oregon Green, Alexa variants (available e.g. from Molecular Probes or Amersham Biosciences) and the like, biotin or biotinylated nucleotides, digoxigenin, radioisotopes, antibodies, enzymes and receptors.
- the detection is done via fluorescence measurements, conjugation to streptavidin and/or avidin, antigen-antibody- and/or antibody-antibody- interactions, radioactivity measurements, as well as catalytic and/or receptor/ligand interactions.
- Suitable methods include the direct labelling (incorporation) method, the amino-modified (amino-allyl) nucleotide method (available e.g.
- DNA dendrimer labelling as kit available e.g. from Genisphere
- biotin or biotinylated nucleotides for labelling are directly inco ⁇ orated into, e.g. the cRNA polynucleotide by in vitro transcription.
- cDNA may be prepared into which a detectable label, as exemplified above, is inco ⁇ orated. Said detectably labelled cDNA, in single-stranded form, may then be hybridised, preferably under stringent or highly stringent conditions to a panel of single-stranded oligonucleotides representing different genes and affixed to a solid support such as a chip. Upon applying appropriate washing steps, those cDNAs will be detected or quantitatively detected that have a counte ⁇ art in the oligonucleotide panel.
- the mRNA or the cDNA may be amplified e.g.
- the cDNAs are transcribed into cRNAs prior to the hybridisation step wherein only in the transcription step a label is inco ⁇ orated into the nucleic acid and wherein the cRNA is employed for hybridisation.
- the label may be attached subsequent to the transcription step.
- proteins from a cell or tissue under investigation may be contacted with a panel of aptamers or of antibodies or fragments or derivatives thereof.
- the antibodies etc. may be affixed to a solid support such as a chip. Binding of proteins indicative of an AML subtype may be verified by binding to a detectably labelled secondary antibody or aptamer.
- a detectably labelled secondary antibody or aptamer For the labelling of antibodies, it is referred to Harlow and Lane, "Antibodies, a laboratory manual", CSH Press, 1988, Cold
- a minimum set of proteins necessary for diagnosis of all leukemia subtypes may be selected for creation of a protein array system to make diagnosis on a protein lysate of a diagnostic bone marrow sample directly.
- Protein Array Systems for the detection of specific protein expression profiles already are available (for example: Bio-Plex, BIORAD, Munchen, Germany).
- antibodies against the proteins have to be produced and immobilized on a platform e.g. glasslides or microtite ⁇ lates.
- the immobilized antibodies can be labelled with a reactant specific for the certain target proteins as discussed above.
- the reactants can include enzyme substrates, DNA, receptors, antigens or antibodies to create for example a capture sandwich immunoassay.
- CA complex aberrant karyotype
- AML-MLL normal karyotype
- NK normal karyotype
- AML- other i.e. trisomy 8 trisomy 11, trisomy 13, monosomy 7, del(5q), del(9q), t(6
- the statistical significance of markers as expressed in q or p values based on the concept ofthe false discovery rate is determined.
- a measure of statistical significance called the q value is associated with each tested feature.
- the q value is similar to the p value, except it is a measure of significance in terms ofthe false discovery rate rather than the false positive rate (Storey JD and Tibsbirani R. Proc.Natl.Acad.Sci., 2003, Vol. 100:9440-5.
- the expression level of at least two, preferably of at least ten, more preferably of at least 25, most preferably of 50 of at least one ofthe Tables ofthe markers is determined.
- the expression level of at least 2, of at least 5, of at least 10 out of the markers having the numbers 1 - 10, 1-20, 1-40, 1-50 of at least one ofthe Tables are measured.
- the level of the expression of the handheldmarker i.e. the expression of the polynucleotide is indicative of the leukemia subtype of a cell or an organism.
- the level of expression of a marker or group of markers is measured and is compared with the level of expression ofthe same marker or the same group of markers from other cells or samples. The comparison may be effected in an actual experiment or in silico.
- expression level also referred to as expression pattern or expression signature (expression profile)
- the difference at least is 5 %, 10% or 20%, more preferred at least 50% or may even be as high as 75% or 100%. More preferred the difference in the level of expression is at least 200%, i.e. two fold, at least 500%, i.e. five fold, or at least 1000%, i.e. 10 fold.
- the expression level of markers expressed lower in a first subtype than in at least one second subtype, which differs from the first subtype is at least 5 %, 10% or 20%, more preferred at least 50% or may even be 75% or 100%, i.e. 2-fold lower, preferably at least 10-fold, more preferably at least 50-fold, and most preferably at least 100-fold lower in the first subtype.
- the expression level of markers expressed higher in a first subtype than in at least one second subtype, which differs from the first subtype is at least 5 %, 10% or 20%, more preferred at least 50% or may even be 75% or 100%, i.e. 2-fold higher, preferably at least 10-fold, more preferably at least 50-fold, and most preferably at least 100-fold higher in the first subtype.
- the sample is derived from an individual having leukemia.
- the polynucleotide the expression level of which is determined is in form of a transcribed polynucleotide.
- a particularly preferred transcribed polynucleotide is an mRNA, a cDNA and/or a cRNA, with the latter being preferred.
- Transcribed polynucleotides are isolated from a sample, reverse transcribed and/or amplified, and labelled, by employing methods well-known the person skilled in the art (see Example 3).
- the step of determining the expression profile further comprises amplifying the transcribed polynucleotide.
- the method comprises hybridizing the transcribed polynucleotide to a complementary polynucleotide, or a portion thereof, under stringent hybridization conditions, as described hereinafter.
- hybridizing means hybridization under conventional hybridization conditions, preferably under stringent conditions as described, for example, in Sambrook, J., et al., in "Molecular Cloning: A Laboratory Manual” (1989), Eds. J.
- Such conditions are, for example, hybridization in 6x SSC, pH 7.0 / 0.1% SDS at about 45°C for 18-23 hours, followed by a washing step with 2x SSC/0.1% SDS at 50°C.
- the salt concentration in the washing step can for example be chosen between 2x SSC/0.1% SDS at room temperature for low stringency and 0.2x SSC/0.1% SDS at 50°C for high stringency.
- the temperature ofthe washing step can be varied between room temperature, ca. 22°C, for low stringency, and 65°C to 70° C for high stringency.
- polynucleotides that hybridize at lower stringency hybridization conditions.
- Changes in the stringency of hybridization and signal detection are primarily accomplished through the manipulation, preferably of formamide concentration (lower percentages of formamide result in lowered stringency), salt conditions, or temperature.
- washes performed following stringent hybridization can be done at higher salt concentrations (e.g. 5x SSC).
- Variations in the above conditions may be accomplished through the inclusion and/or substitution of alternate blocking reagents used to suppress background in hybridization experiments. The inclusion of specific blocking reagents may require modification ofthe hybridization conditions described above, due to problems with compatibility.
- Complementary and “complementarity”, respectively, can be described by the percentage, i.e. proportion, of nucleotides which can form base pairs between two polynucleotide strands or within a specific region or domain of the two strands.
- complementary nucleotides are, according to the base pairing rules, adenine and thymine (or adenine and uracil), and cytosine and guanine.
- Complementarity may be partial, in which only some ofthe nucleic acids' bases are matched according to the base pairing rules. Or, there may be a complete or total complementarity between the nucleic acids. The degree of complementarity between nucleic acid strands has effects on the efficiency and strength of hybridization between nucleic acid strands.
- Two nucleic acid strands are considered to be 100% complementary to each other over a defined length if in a defined region all adenines of a first strand can pair with a thymine (or an uracil) of a second strand, all guanines of a first strand can pair with a cytosine of a second strand, all thymine (or uracils) of a first strand can pair with an adenine of a second strand, and all cytosines of a first strand can pair with a guanine of a second strand, and vice versa.
- the degree of complementarity is determined over a stretch of 20, preferably 25, nucleotides, i.e.
- a 60% complementarity means that within a region of 20 nucleotides of two nucleic acid strands 12 nucleotides of the first strand can base pair with 12 nucleotides of the second strand according to the above ruling, either as a stretch of 12 contiguous nucleotides or interspersed by non-pairing nucleotides, when the two strands are attached to each other over said region of 20 nucleotides.
- the degree of complementarity can range from at least about 50% to full, i.e. 100% complementarity.
- Two single nucleic acid strands are said to be "substantially complementary" when they are at least about 80% complementary, preferably about 90% or higher. For carrying out the method of the present invention substantial complementarity is preferred.
- Preferred methods for detection and quantification of the amount of polynucleotides i.e. for the methods according to the invention allowing the determination of the level of expression of a marker, are those described by Sambrook et al. (1989) or real time methods known in the art as the TaqMan® method disclosed in WO92/02638 and the corresponding U.S. 5,210,015, U.S. 5,804,375, U.S. 5,487,972. This method exploits the exonuclease activity of a polymerase to generate a signal.
- the (at least one) target nucleic acid component is detected by a process comprising contacting the sample with an oligonucleotide containing a sequence complementary to a region of the target nucleic acid component and a labeled oligonucleotide containing a sequence complementary to a second region of the same target nucleic acid component sequence strand, but not including the nucleic acid sequence defined by the first oligonucleotide, to create a mixture of duplexes during hybridization conditions, wherein the duplexes comprise the target nucleic acid annealed to the first oligonucleotide and to the labeled oligonucleotide such that the 3 '-end of the first oligonucleotide is adjacent to the 5 '-end of the labeled oligonucleotide.
- this mixture is treated with a template-dependent nucleic acid polymerase having a 5' to 3' nuclease activity under conditions sufficient to permit the 5' to 3' nuclease activity of the polymerase to cleave the annealed, labeled oligonucleotide and release labeled fragments.
- the signal generated by the hydrolysis of the labeled oligonucleotide is detected and/ or measured.
- TaqMan® technology eliminates the need for a solid phase bound reaction complex to be formed and made detectable.
- Other methods include e.g. fluorescence resoance energy transfer between two adjacenly hybridized probes as used in the LightCycler® format described in U.S.
- Example 3 A preferred protocol if the marker, i.e. the polynucleotide, is in form of a transcribed nucleotide, is described in Example 3, where total RNA is isolated, cDNA and, subsequently, cRNA is synthesized and biotin is inco ⁇ orated during the transcription reaction.
- the purified cRNA is applied to commercially available arrays which can be obtained e.g. from Affymetrix.
- the hybridized cRNA is detected according to the methods described in Example 3.
- the arrays are produced by photolithography or other methods known to experts skilled in the art e.g. from U.S. 5,445,934, U.S. 5,744,305, U.S. 5,700,637, U.S. 5,945,334 and EP 0 619 321 or EP 0 373 203, or as decribed hereinafter in greater detail.
- the polynucleotide or at least one of the polynucleotides is in form of a polypeptide.
- the expression level ofthe polynucleotides or polypeptides is detected using a compound which specifically binds to the polynucleotide ofthe polypeptide ofthe present invention.
- binding means that the compound is capable of discriminating between two or more polynucleotides or polypeptides, i.e. it binds to the desired polynucleotide or polypeptide, but essentially does not bind unspecifically to a different polynucleotide or polypeptide.
- the compound can be an antibody, or a fragment thereof, an enzyme, a so-called small molecule compound, a protein-scaffold, preferably an anticalin.
- the compound specifically binding to the polynucleotide or polypeptide is an antibody, or a fragment thereof.
- an "antibody” comprises monoclonal antibodies as first described by K ⁇ hler and Milstein in Nature 278 (1975), 495-497 as well as polyclonal antibodies, i.e. entibodies contained in a polyclonal antiserum.
- Monoclonal antibodies include those produced by transgenic mice. Fragments of antibodies include F(ab') 2 , Fab and Fv fragments. Derivatives of antibodies include scFvs, chimeric and humanized antibodies. See, for example Harlow and Lane, loc. cit.
- the person skilled in the art is aware of a variety of methods, all of which are included in the present invention.
- Examples include immunoprecipitation, Western blotting, Enzyme-linked immuno sorbent assay (ELISA), Enzyme-linked immuno sorbent assay (RIA), dissociation-enhanced lanthanide fluoro immuno assay (DELFIA), scintillation proximity assay (SPA).
- ELISA Enzyme-linked immuno sorbent assay
- RIA Enzyme-linked immuno sorbent assay
- DELFIA dissociation-enhanced lanthanide fluoro immuno assay
- SPA scintillation proximity assay
- an "array” or “microarray” refers to a linear or two- or three dimensional arrangement of preferably discrete nucleic acid or polypeptide probes which comprises an intentionally created collection of nucleic acid or polypeptide probes of any length spotted onto a substrate/solid support.
- a collection of nucleic acids or polypeptide spotted onto a substrate/solid support also under the term "array”.
- a microarray usually refers to a miniaturised array arrangement, with the probes being attached to a density of at least about 10, 20, 50, 100 nucleic acid molecules referring to different or the same genes per cm 2 .
- an array can be referred to as "gene chip”.
- the array itself can have different formats, e.g. libraries of soluble probes or libraries of probes tethered to resin beads, silica chips, or other solid supports.
- the process of array fabrication is well-known to the person skilled in the art.
- the process for preparing a nucleic acid array comprises preparing a glass (or other) slide (e.g. chemical treatment of the glass to enhance binding of the nucleic acid probes to the glass surface), obtaining DNA sequences representing genes of a genome of interest, and spotting sequences these sequences of interest onto glass slide.
- Sequences of interest can be obtained via creating a cDNA library from an mRNA source or by using publicly available databases, such as GeneBank, to annotate the sequence information of custom cDNA libraries or to identify cDNA clones from previously prepared libraries.
- the liquid containing the amplified probes can be deposited on the array by using a set of microspotting pins. Ideally, the amount deposited should be uniform.
- the process can further include UV-crosslinking in order to enhance immobilization of the probes on the array.
- the array is a high density oligonucleotide (oligo) array using a light-directed chemical synthesis process, employing the so-called photolithography technology.
- oligo arrays are a high density oligonucleotide (oligo) array using a light-directed chemical synthesis process, employing the so-called photolithography technology.
- oligo arrays are a high density oligonucleotide (oligo) array using a light-directed chemical synthesis process, employing the so-called photolithography technology.
- oligo arrays Unlike common cDNA arrays, oligo arrays
- the sequence can be synthesized directly onto the array, thus, bypassing the need for physical intermediates, such as PCR products, required for making cDNA arrays.
- the marker, or partial sequences thereof can be represented by 14 to 20 features, preferably by less than 14 features, more preferably less than 10 features, even more preferably by 6 features or less, with each feature being a short sequence of nucleotides (oligonucleotide), which is a perfect match (PM) to a segment of the respective gene.
- the PM oligonucleotide are paired with mismatch (MM) oligonucleotides which have a single mismatch at the central base of the nucleotide and are used as "controls".
- the chip exposure sites are defined by masks and are deprotected by the use of light, followed by a chemical coupling step resulting in the synthesis of one nucleotide. The masking, light deprotection, and coupling process can then be repeated to synthesize the next nucleotide, until the nucleotide chain is of the specified length.
- the method of the present invention is carried out in a robotics system including robotic plating and a robotic liquid transfer system, e.g. using microfluidics, i.e. channelled structured.
- a particular preferred method according to the present invention is as follows:
- RNA preferably mRNA
- the present invention is directed to the use of at least one marker selected from the markers identifiable by their Affymetrix Identification Numbers (affy id) as defined in Tables 1, and/or 2 for the manufacturing of a diagnostic for distinguishing Leukemia subtypes.
- the use of the present invention is particularly advantageous for distinguishing leukemia subtypes in an individual having leukemia.
- markers for diagnosis of leukemia subtypes preferably based on microarray technology, offers the following advantages: (1) more rapid and more precise diagnosis, (2) easy to use in laboratories without specialized experience, (3) abolishes the requirement for analyzing viable cells for chromosome analysis (transport problem), and (4) very experienced hematologists for cytomo ⁇ hology and cytochemistry, immunophenotyping as well as cytogeneticists and molecularbiologists are no longer required.
- the present invention refers to a diagnostic kit containing at least one marker selected from the markers identifiable by their Affymetrix Identification Numbers (affy id) as defined in Tables 1, and/or 2 for distinguishing leukemia subtypes, in combination with suitable auxiliaries.
- suitable auxiliaries include buffers, enzymes, labelling compounds, and the like.
- the marker contained in the kit is a nucleic acid molecule which is capable of hybridizing to the mRNA corresponding to at least one marker of the present invention.
- the at least one nucleic acid molecule is attached to a solid support, e.g. a polystyrene microtiter dish, nitrocellulose membrane, glass surface or to non-immobilized particles in solution.
- the diagnostic kit contains at least one reference for a t(15;17), t(8;21), inv(16), inv(3), complex aberrant karyotype (CA), AML- MLL, normal karyotype (NK), AML-other, i.e. trisomy 8, trisomy 11, trisomy 13, monosomy 7, del(5q), del(9q), t(6;9); del(20q) and del(12p) and trisomy 4, ALL-
- the reference can be a sample or a data bank.
- the present invention is directed to an apparatus for distinguishing leukemia subtypes t(15;17), t(8;21), inv(16), inv(3), complex aberrant karyotype (CA), AML-MLL, normal karyotype (NK), AML-other, i.e.
- a reference data bank obtainable by comprising (a) compiling a gene expression profile of a patient sample by determining the expression level at least one marker selected from the markers identifiable by their Affymetrix Identification Numbers (affy id) as defined in Tables 1 , and/or 2, and (b) classifying the gene expression profile by means of a machine learning algorithm.
- the "machine learning algorithm” is a computational-based prediction methodology, also known to the person skilled in the art as “classifier”, employed for characterizing a gene expression profile.
- the signals corresponding to a certain expression level which are obtained by the microarray hybridization are subjected to the algorithm in order to classify the expression profile.
- Supervised learning involves "training” a classifier to recognize the distinctions among classes and then “testing” the accuracy of the classifier on an independent test set. For new, unknown sample the classifier shall predict into which class the sample belongs.
- the machine learning algorithm is selected from the group consisting of Weighted Voting, K-Nearest Neighbors, Decision Tree Induction, Support Vector Machines (SVM), and Feed-Forward Neural Networks.
- the machine learning algorithm is Support Vector Machine, such as polynomial kernel and Gaussian Radial Basis Function-kernel SVM models.
- the classification accuracy of a given gene list for a set of microarray experiments is preferably estimated using Support Vector Machines (SVM), because there is evidence that SVM-based prediction slightly outperforms other classification techniques like k-Nearest Neighbors (k-NN).
- SVM Support Vector Machines
- the LIBSVM software package version 2.36 was used (SVM-type: C-SVC, linear kernel (http://www.csie.ntu.edu.tw/ ⁇ cjlin/libsvm/)).
- SVM-type C-SVC, linear kernel (http://www.csie.ntu.edu.tw/ ⁇ cjlin/libsvm/)).
- the skilled artisan is furthermore referred to Brown et al., Proc.Natl.Acad.Sci., 2000; 97: 262-267, Furey et al., Bioinformatics. 2000; 16: 906-914, and Vapnik V. Statistical Learning Theory.
- the classification accuracy of a given gene list for a set of microarray experiments can be estimated using Support Vector Machines (SVM) as supervised learning technique.
- SVMs are trained using differentially expressed genes which were identified on a subset of the data and then this trained model is employed to assign new samples to those trained groups from a second and different data set. Differentially expressed genes were identified applying ANOVA and t-test-statistics (Welch t-test). Based on identified distinct gene expression signatures respective training sets consisting of 2/3 of cases and test sets with 1/3 of cases to assess classification accuracies are designated. Assignment of cases to training and test set is randomized and balanced by diagnosis. Based on the training set a Support Vector Machine (SVM) model is built.
- SVM Support Vector Machine
- the apparent accuracy i.e. the overall rate of correct predictions of the complete data set was estimated by lOfold cross validation.
- SVM-model ofthe training set was built to predict diagnosis in the independent test set, thereby estimating true accuracy of the prediction model.
- the reference data bank is backed up on a computational data memory chip which can be inserted in as well as removed from the apparatus ofthe present invention, e.g. like an interchangeable module, in order to use another data memory chip containing a different reference data bank.
- the apparatus ofthe present invention containing a desired reference data bank can be used in a way such that an unknown sample is, first, subjected to gene expression profiling, e.g. by microarray analysis in a manner as described supra or in the art, and the expression level data obtained by the analysis are, second, fed into the apparatus and compared with the data ofthe reference data bank obtainable by the above method.
- the apparatus suitably contains a device for entering the expression level of the data, for example a control panel such as a keyboard.
- the results, whether and how the data ofthe unknown sample fit into the reference data bank can be made visible on a provided monitor or display screen and, if desired, printed out on an inco ⁇ orated of connected printer.
- the apparatus of the present invention is equipped with particular appliances suitable for detecting and measuring the expression profile data and, subsequently, proceeding with the comparison with the reference data bank.
- the apparatus of the present invention can contain a gripper arm and/or a tray which takes up the microarray containing the hybridized nucleic acids.
- the present invention refers to a reference data bank for extinguishing leukemia subtypes t(15;17), t(8;21), inv(16), inv(3), complex aberrant karyotype (CA), AML-MLL, normal karyotype (NK), AML-other, i.e.
- trisomy 8 trisomy 11, trisomy 13, monosomy 7, del(5q), del(9q), t(6;9); del(20q) and del(12p) and trisomy 4, ALL-MLL, ALL-Ph+, ALL-t(8;14), T-ALL, other B- lineage (OBL), CML, normal-BM, and/or CLL in a sample obtainable by comprising (a) compiling a gene expression profile of a patient sample by determining the expression level of at least one marker selected from the markers identifiable by their Affymetrix Identification Numbers (affy id) as defined in Tables 1, and/or 7, and (b) classifying the gene expression profile by means of a machine learning algorithm.
- affymetrix Identification Numbers as defined in Tables 1, and/or 7
- the reference data bank is backed up and/or contained in a computational memory data chip.
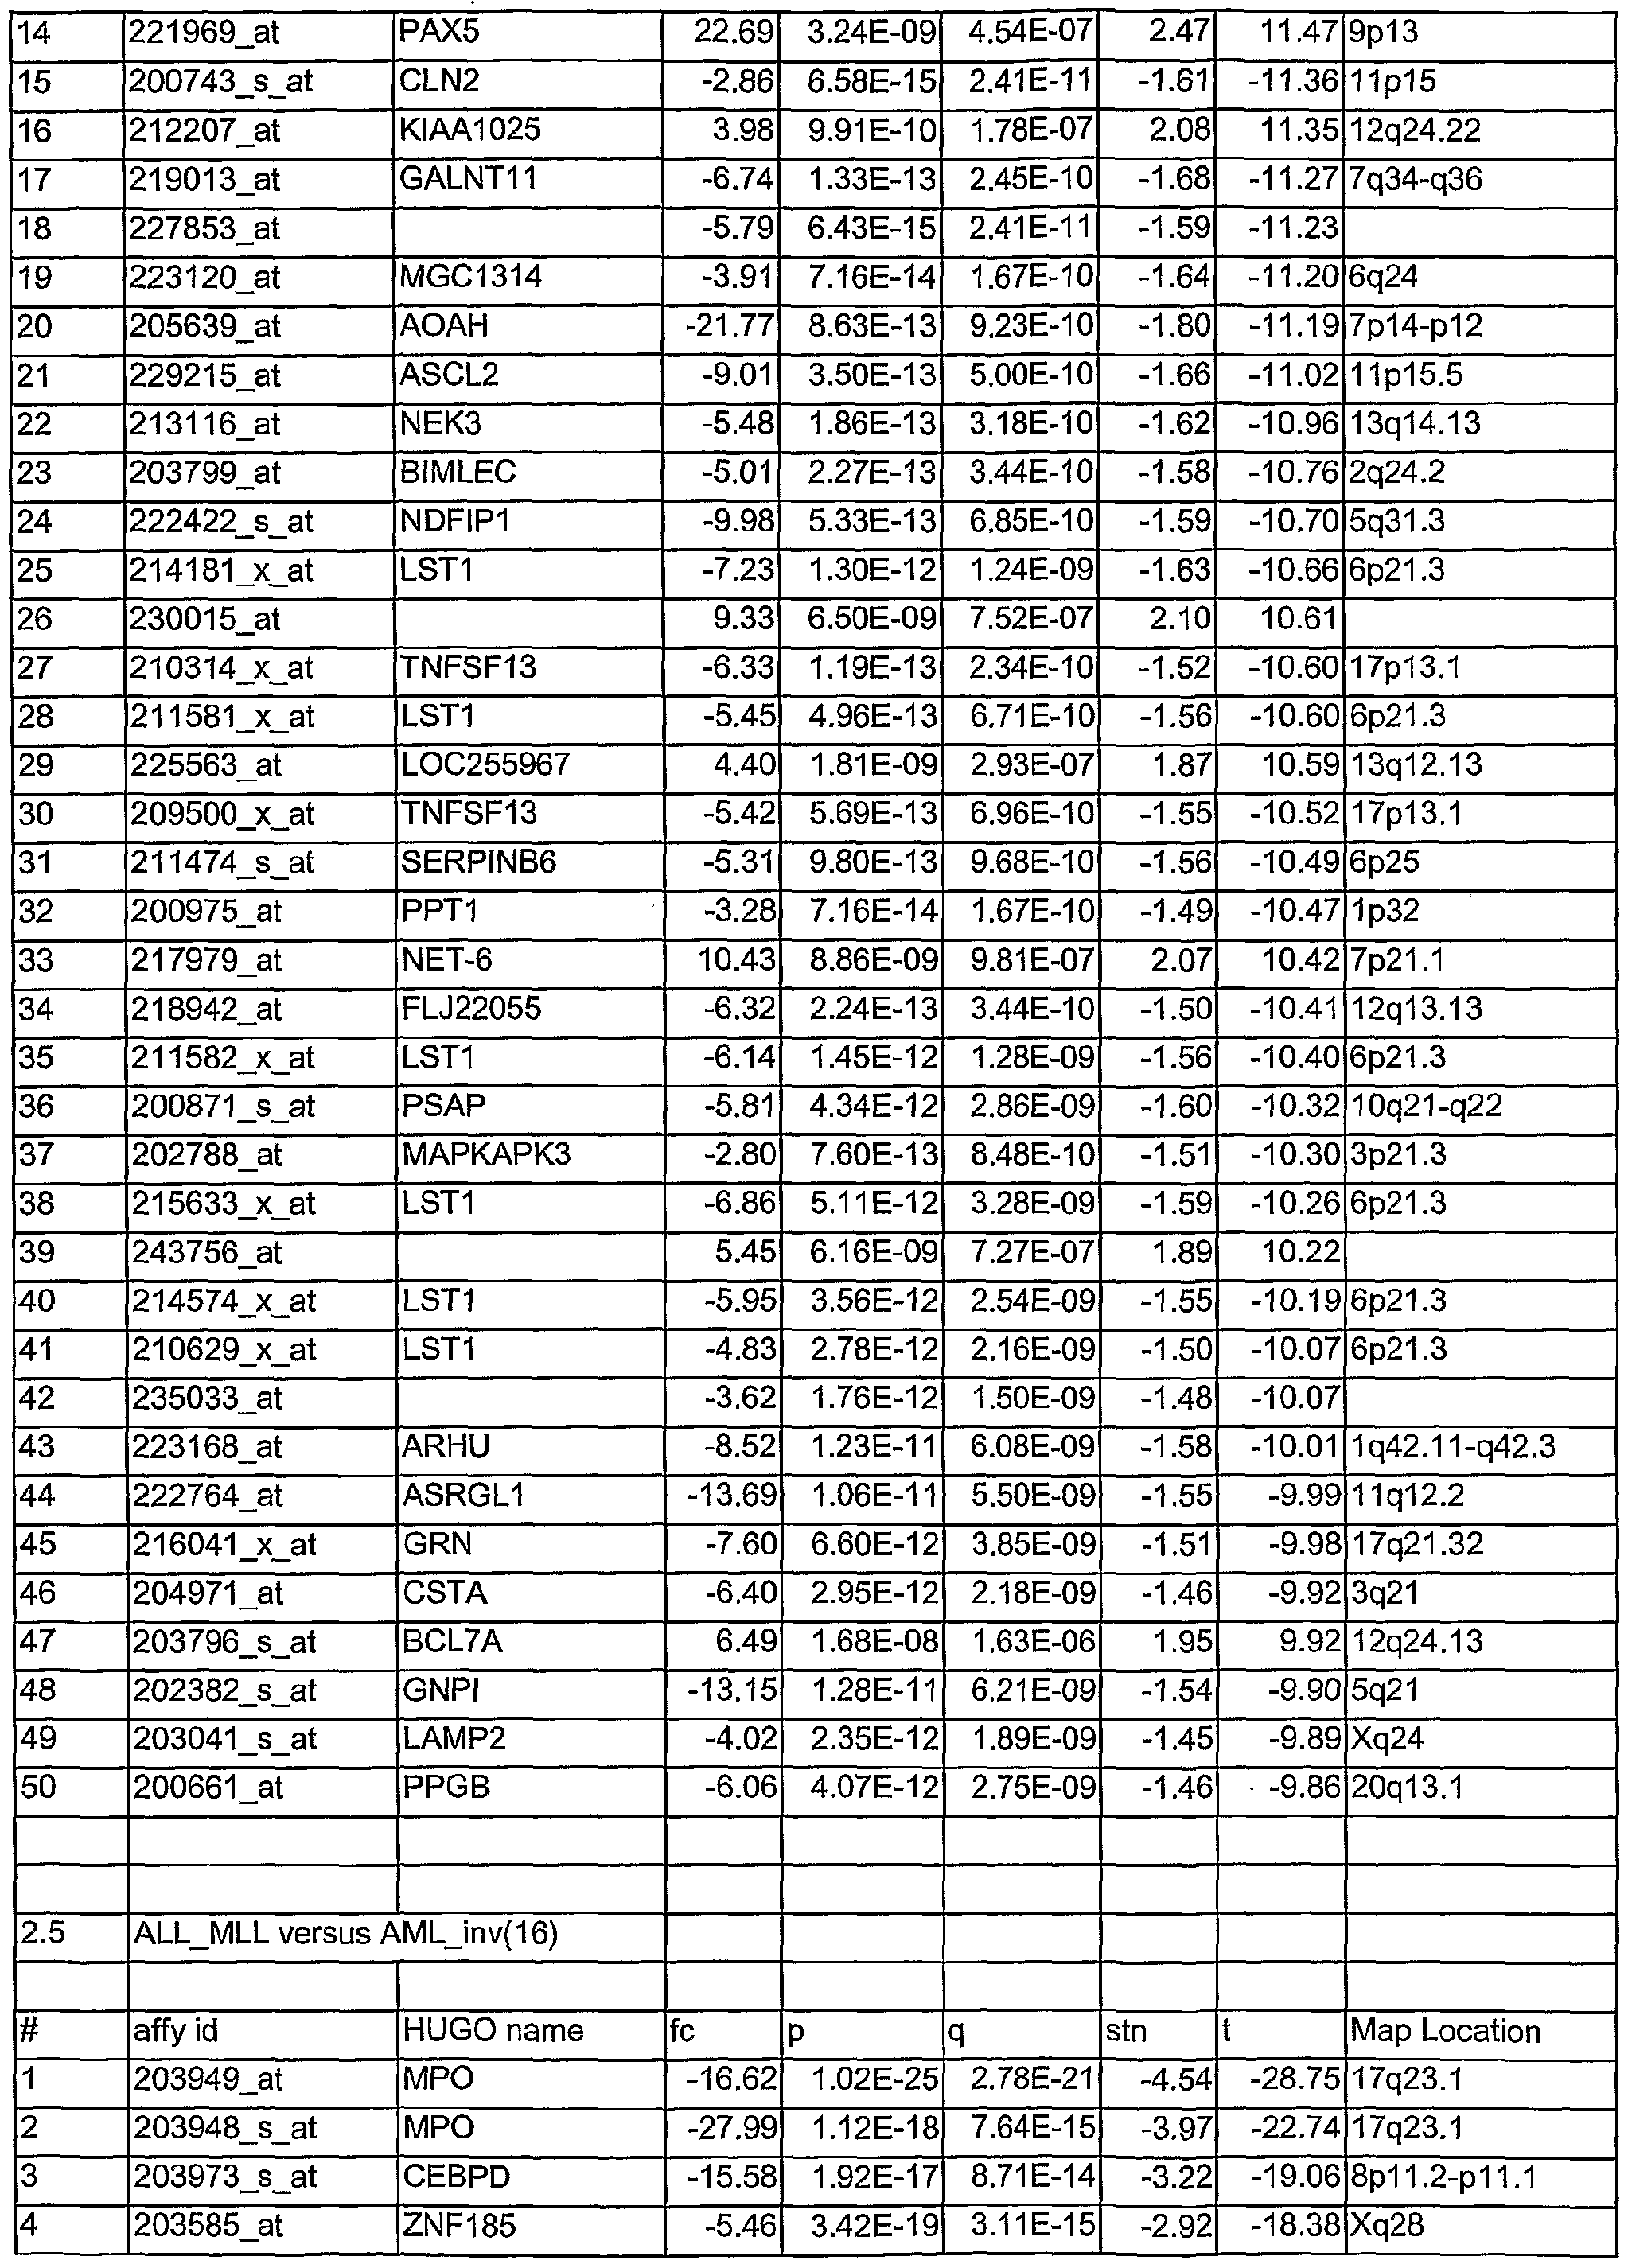
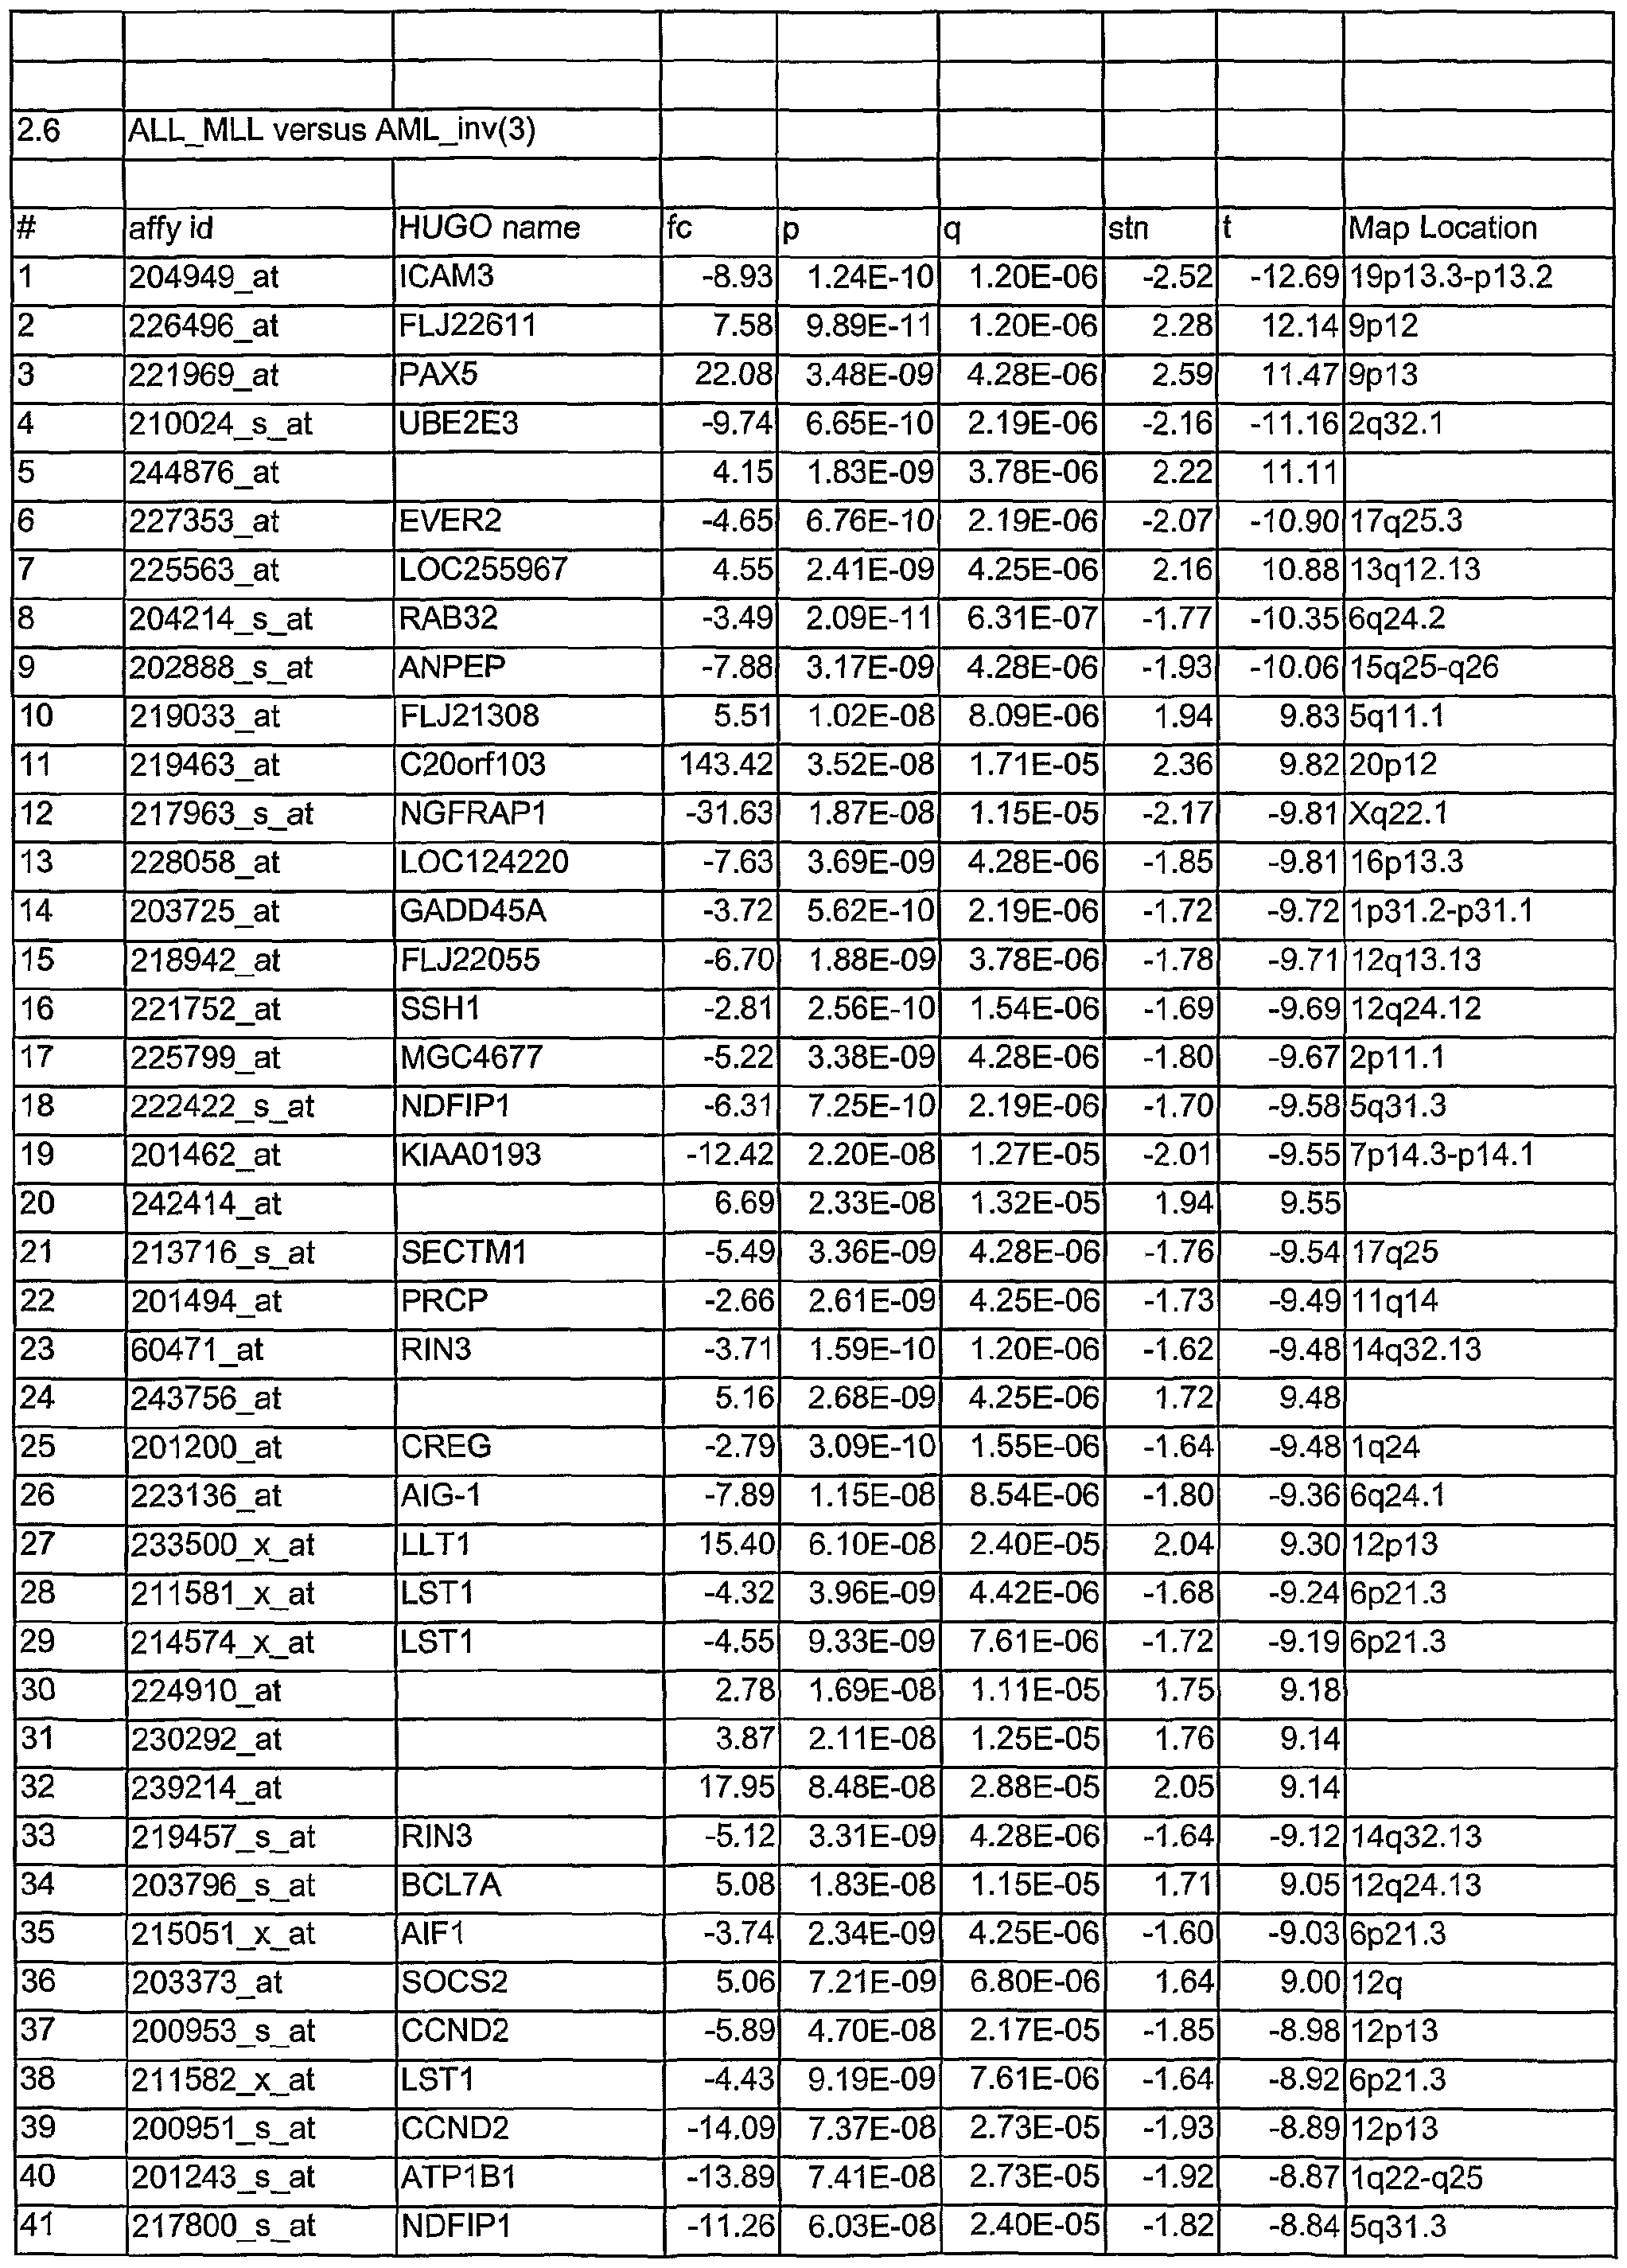
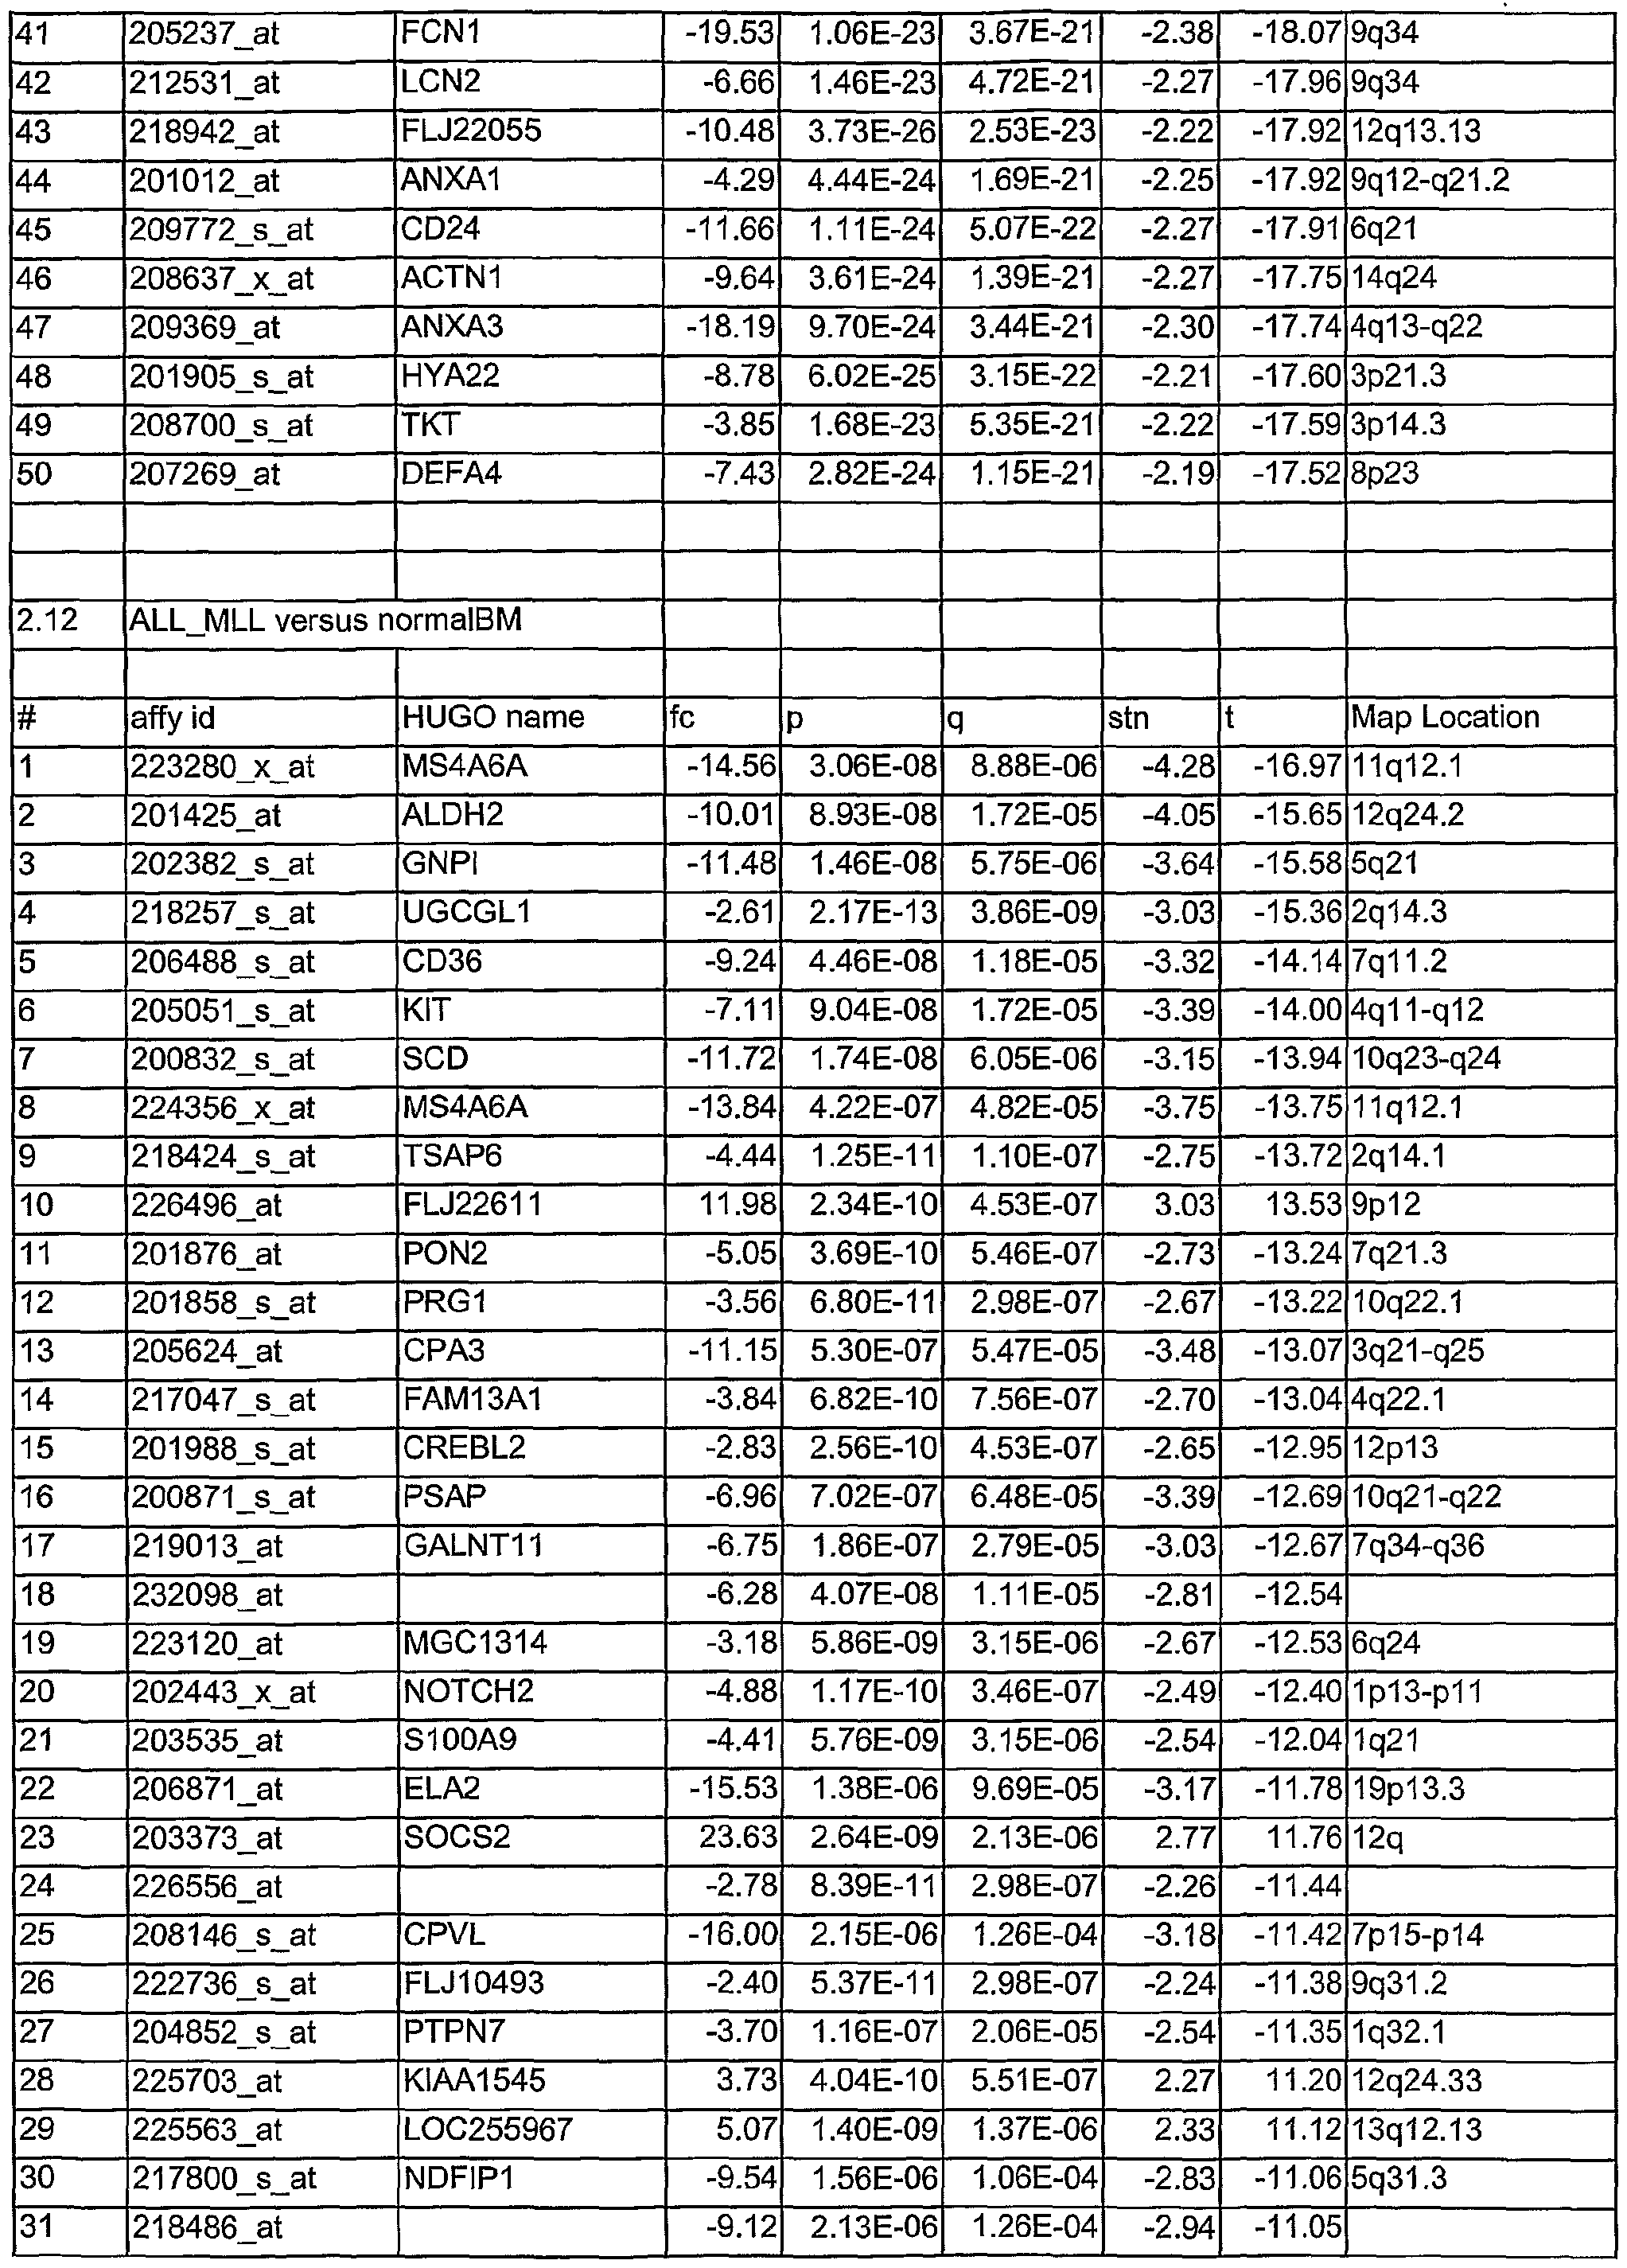
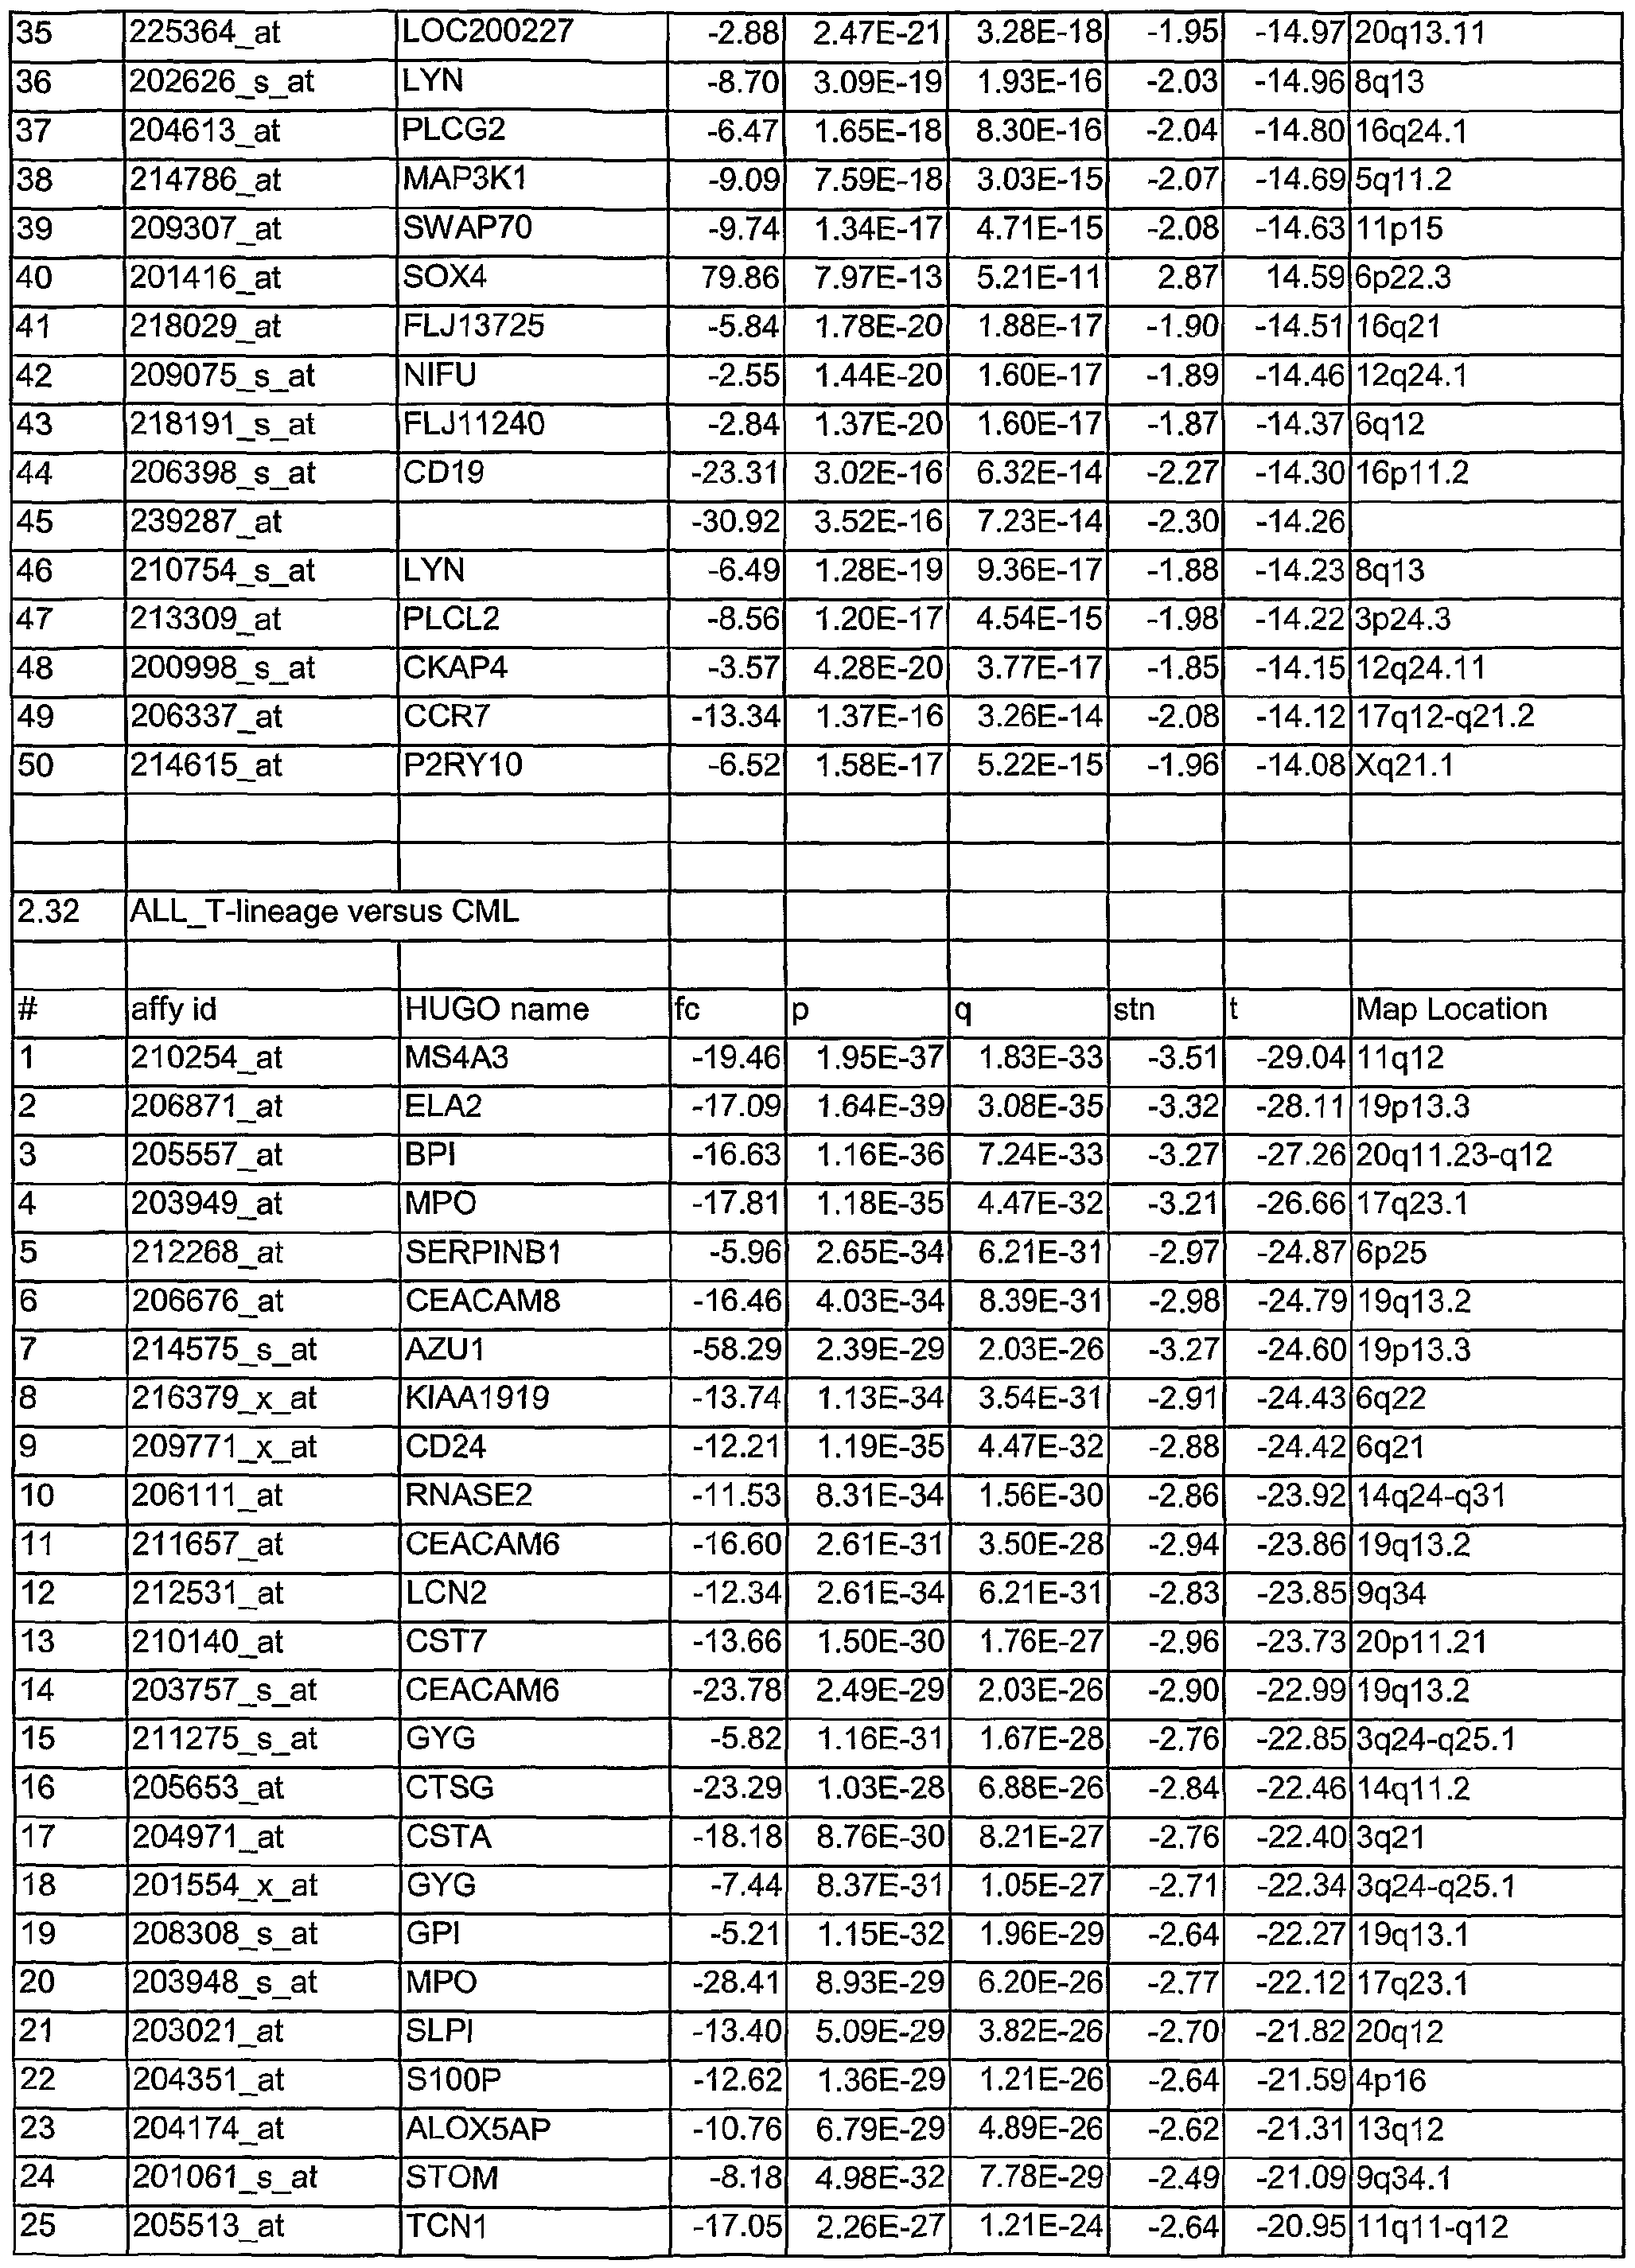
- Tables 1.1 to 2.78 show leukemia subtype analysis of t(15;17), t(8;21), inv(16), inv(3), complex aberrant karyotype (CA), AML-MLL, normal karyotype (NK), AML-other, i.e. trisomy 8, trisomy 11, trisomy 13, monosomy 7, del(5q), del(9q), t(6;9); del(20q) and del(12p) and trisomy 4, ALL-MLL, ALL-Ph+, ALL-t(8;14), T- ALL, other B-lineage (OBL), CML, normal-BM, and/or CLL.
- the analysed markers are ordered according to their q- values, beginning with the lowest q- values.
- Tables 1.1 to 2.78 are accompanied with explanatory tables (Table 1.1 A to 2.78A) where the numbering and the Affymetrix Id are further defined by other parameters, e.g. gene bank accession number
- Example 1 General experimental design of the invention and results So far comprehensive diagnosis of leukemia requires a combination of cytomo ⁇ hology, immunophenotyping, and genetic methods. We aimed at developing a diagnostic tool based only on gene expression profiling to accurately predict all clinically relevant subtypes of leukemia. Therefore, we analyzed samples from 540 patients at diagnosis using oligonucleotide microarrays representing 33,000 different genes (U133 set, Affymetrix).
- OBL B-lineage
- To identify differentially expressed genes we applied ANOVA and t-test-statistics (Welch t- test).
- To assess the false discovery rate we calculated q values according to Storey et al. (PNAS, 2003).
- To estimate diagnostic accuracy based on gene expression signatures we designated a training set consisting of 2/3 of cases and a test set with 1/3 of cases. Assignment of cases to training and test set was randomized and balanced by diagnosis. Based on the fraining set we built Support Vector Machine (SVM) models. Classification accuracy was assessed in the independent test set. In the first analysis five main categories AML, ALL, CML, CLL, and n-BM were distinguished in the test set with an accuracy of 96% (177/184 correctly assigned). In a second analysis the following 13 subtypes were
- the methods section contains both information on statistical analyses used for identification of differentially expressed genes and detailed annotation data of identified microarray probesets.
- sequence data are omitted due to their large size, and because they do not change, whereas the annotation data are updated periodically, for example new information on chromomal location and functional annotation of the respective gene products. Sequence data are available for download in the NetAffx Download Center (www.affymetrix.com)
- Microarray probesets for example found to be differentially expressed between different types of leukemia samples are further described by additional information.
- HG-U133 ProbeSet D describes the probe set identifier. Examples are:
- sequence Type indicates whether the sequence is an Exemplar, Consensus or Control sequence.
- An Exemplar is a single nucleotide sequence taken directly from a public database. This sequence could be an mRNA or EST.
- a Consensus sequence is a nucleotide sequence assembled by Affymetrix, based on one or more sequence taken from a public database. Transcript ID:
- the cluster identification number with a sub-cluster identifier appended is the cluster identification number with a sub-cluster identifier appended.
- Sequence Derived From The accession number of the single sequence, or representative sequence on which the probe set is based. Refer to the "Sequence Source” field to determine the database used.
- Sequence ID For Exemplar sequences: Public accession number or GenBank identifier. For
- Consensus sequences Affymetrix identification number or public accession number.
- Sequence Source The database from which the sequence used to design this probe set was taken.
- GenBank® GenBank®, RefSeq, UniGene, TIGR (annotations from The Institute for Genomic Research).
- Gene Symbol and Title A gene symbol and a short title, when one is available. Such symbols are assigned by different organizations for different species. Affymetrix annotational data come from the UniGene record. There is no indication which species-specific databank was used, but some of the possibilities include for example HUGO: The Human
- the map location describes the chromosomal location when one is available.
- Unigene_Accession UniGene accession number and cluster type. Cluster type can be "full length” or
- This information represents the LocusLink accession number.
- Example 3 Sample preparation, processing and data analysis
- Microarray analyses were performed utilizing the GeneChip ® System (Affymetrix, Santa Clara, USA). Hybridization target preparations were performed according to recommended protocols (Affymetrix Technical Manual). In detail, at time of diagnosis, mononuclear cells were purified by Ficoll-Hypaque density centrifugation. They had been lysed immediately in RLT buffer (Qiagen, Hilden,
- RNA samples were thawed, homogenized (QIAshredder, Qiagen), and total RNA was extracted (RNeasy Mini Kit, Qiagen). Subsequently, 5-10 ⁇ g total RNA isolated from 1 x IO 7 cells was used as starting material for cDNA synthesis with oligo [(dT) 24 T7promotor] 65 primer (cDNA Synthesis System, Roche Applied Science, Mannheim, Germany). cDNA products were purified by phenol/chlorophorm/IAA extraction (Ambion, Austin, USA) and acetate/ethanol-precipitated overnight. For detection of the hybridized target nucleic acid biotin-labeled ribonucleotides were inco ⁇ orated during the following in vitro transcription reaction (Enzo BioArray HighYield
- RNA Transcript Labeling Kit Enzo Diagnostics
- 15 ⁇ g cRNA was fragmented by alkaline treatment (200 mM Tris-acetate, pH 8.2/500 mM potassium acetate/150 mM magnesium acetate) and added to the hybridization cocktail sufficient for five hybridizations on standard GeneChip microarrays (300 ⁇ l final volume). Washing and staining of the probe arrays was performed according to the recommended Fluidics Station protocol (EukGE-WS2v4).
- Affymetrix Microarray Suite software (version 5.0.1) extracted fluorescence signal intensities from each feature on the microarrays as detected by confocal laser scanning according to the manufacturer's recommendations.
- Expression analysis quality assessment parameters included visiual array inspection ofthe scanned image for the presence of image artifacts and correct grid alignment for the identification of distinct probe cells as well as both low 375' ratio of housekeeping controls (mean: 1.90 for GAPDH) and high percentage of detection calls (mean: 46.3% present called genes).
- the 3' to 5' ratio of GAPDH probesets can be used to assess RNA sample and assay quality. Signal values ofthe 3' probe sets for GAPDH are compared to the Signal values of the corresponding 5' probe set.
- the ratio of the 3' probe set to the 5' probe set is generally no more than 3.0.
- a high 3' to 5' ratio may indicate degraded RNA or inefficient synthesis of ds cDNA or biotinylated cRNA (GeneChip ® Expression Analysis Technical Manual, www.affymetrix.com).
- Detection calls are used to determine whether the transcript of a gene is detected (present) or undetected (absent) and were calculated using default parameters of the Microarray Analysis Suite MAS 5.0 software package.
- Bone marrow (BM) aspirates are taken at the time of the initial diagnostic biopsy and remaining material is immediately lysed in RLT buffer (Qiagen), frozen and stored at -80 C until preparation for gene expression analysis.
- RLT buffer Qiagen
- the GeneChip System (Affymetrix, Santa Clara, CA, USA) is used.
- the targets for GeneChip analysis are prepared according to the current Expression Analysis.
- RNA extracted RNA extracted from 1 x 10⁷ cells is used as starting material in the subsequent cDNA-Synthesis using Oligo-dT-T7-Promotor Primer (cDNA synthesis Kit, Roche Molecular Biochemicals).
- the cDNA is purified by phenol-chlorophorm extraction and precipitated with 100% Ethanol over night.
- biotin-labeled ribonucleotides are inco ⁇ orated during the in vitro transcription reaction (Enzo® Bio ArrayTM
- RNA Transcript Labeling Kit ENZO
- 15 ug are fragmented by alkaline treatment (200 mM Tris-acetate, pH 8.2, 500 mM potassium acetate, 150 mM magnesium acetate) and added to the hybridization cocktail sufficient for 5 hybridizations on standard GeneChip microarrays.
- Test3 Probe Arrays are chosen for monitoring of the integrity of the cRNA. Only labeled cRNA-cocktails which showed a ratio of the messured intensity of the 3' to the 5' end of the GAPDH gene less than 3.0 are selected for subsequent hybridization on HG-U133 probe arrays (Affymetrix). Washing and staining the Probe arrays is performed as described ( founded Affymetrix-Original- Literatur (LOCKHART und LIPSHUTZ). The Affymetrix software (Microarray Suite, Version 4.0.1) extracted fluorescence intensities from each element on the arrays as detected by confocal laser scanning according to the manufacturers recommendations.
- OVA One-Versus-AII
Landscapes
- Health & Medical Sciences (AREA)
- Life Sciences & Earth Sciences (AREA)
- Chemical & Material Sciences (AREA)
- Immunology (AREA)
- Engineering & Computer Science (AREA)
- Molecular Biology (AREA)
- Hematology (AREA)
- Organic Chemistry (AREA)
- Proteomics, Peptides & Aminoacids (AREA)
- Pathology (AREA)
- Analytical Chemistry (AREA)
- Physics & Mathematics (AREA)
- Genetics & Genomics (AREA)
- Microbiology (AREA)
- Zoology (AREA)
- Wood Science & Technology (AREA)
- Hospice & Palliative Care (AREA)
- Biotechnology (AREA)
- Biochemistry (AREA)
- General Health & Medical Sciences (AREA)
- Oncology (AREA)
- Biomedical Technology (AREA)
- Urology & Nephrology (AREA)
- General Physics & Mathematics (AREA)
- Biophysics (AREA)
- Cell Biology (AREA)
- Medicinal Chemistry (AREA)
- Food Science & Technology (AREA)
- Bioinformatics & Cheminformatics (AREA)
- General Engineering & Computer Science (AREA)
- Measuring Or Testing Involving Enzymes Or Micro-Organisms (AREA)
- Medicines That Contain Protein Lipid Enzymes And Other Medicines (AREA)
- Investigating Or Analysing Biological Materials (AREA)
Abstract
Description


Claims
Priority Applications (2)
| Application Number | Priority Date | Filing Date | Title |
|---|---|---|---|
| US10/575,635 US20070099190A1 (en) | 2003-11-04 | 2004-11-04 | Method for distinguishing leukemia subtypes |
| EP04797590A EP1682901A2 (en) | 2003-11-04 | 2004-11-04 | Method for distinguishing leukemia subtypes |
Applications Claiming Priority (2)
| Application Number | Priority Date | Filing Date | Title |
|---|---|---|---|
| EP03025336 | 2003-11-04 | ||
| EP03025336.3 | 2003-11-04 |
Publications (2)
| Publication Number | Publication Date |
|---|---|
| WO2005043161A2 true WO2005043161A2 (en) | 2005-05-12 |
| WO2005043161A3 WO2005043161A3 (en) | 2005-08-11 |
Family
ID=34530664
Family Applications (1)
| Application Number | Title | Priority Date | Filing Date |
|---|---|---|---|
| PCT/EP2004/012463 WO2005043161A2 (en) | 2003-11-04 | 2004-11-04 | Method for distinguishing leukemia subtypes |
Country Status (3)
| Country | Link |
|---|---|
| US (1) | US20070099190A1 (en) |
| EP (1) | EP1682901A2 (en) |
| WO (1) | WO2005043161A2 (en) |
Cited By (2)
| Publication number | Priority date | Publication date | Assignee | Title |
|---|---|---|---|---|
| EP2993473A1 (en) * | 2007-01-30 | 2016-03-09 | Pharmacyclics, Inc. | Methods for determining cancer resistance to histone deacetylase inhibitors |
| US9492423B2 (en) | 2011-09-13 | 2016-11-15 | Pharmacyclics Llc | Formulations of histone deacetylase inhibitor in combination with bendamustine and uses thereof |
Citations (2)
| Publication number | Priority date | Publication date | Assignee | Title |
|---|---|---|---|---|
| EP1043676A2 (en) * | 1999-04-09 | 2000-10-11 | Whitehead Institute For Biomedical Research | Methods for classifying samples and ascertaining previously unknown classes |
| WO2003039443A2 (en) * | 2001-11-05 | 2003-05-15 | Deutsches Krebsforschungszentrum | Novel genetic markers for leukemias |
Family Cites Families (7)
| Publication number | Priority date | Publication date | Assignee | Title |
|---|---|---|---|---|
| US5700637A (en) * | 1988-05-03 | 1997-12-23 | Isis Innovation Limited | Apparatus and method for analyzing polynucleotide sequences and method of generating oligonucleotide arrays |
| US5744101A (en) * | 1989-06-07 | 1998-04-28 | Affymax Technologies N.V. | Photolabile nucleoside protecting groups |
| US5143854A (en) * | 1989-06-07 | 1992-09-01 | Affymax Technologies N.V. | Large scale photolithographic solid phase synthesis of polypeptides and receptor binding screening thereof |
| US5210015A (en) * | 1990-08-06 | 1993-05-11 | Hoffman-La Roche Inc. | Homogeneous assay system using the nuclease activity of a nucleic acid polymerase |
| EP0695941B1 (en) * | 1994-06-08 | 2002-07-31 | Affymetrix, Inc. | Method and apparatus for packaging a chip |
| EP1033411B1 (en) * | 1996-06-04 | 2006-02-22 | University of Utah Research Foundation | Fluorescent donor-acceptor pair |
| CA2450379A1 (en) * | 2001-06-10 | 2002-12-19 | Irm Llc | Molecular signatures of commonly fatal carcinomas |
-
2004
- 2004-11-04 US US10/575,635 patent/US20070099190A1/en not_active Abandoned
- 2004-11-04 EP EP04797590A patent/EP1682901A2/en not_active Withdrawn
- 2004-11-04 WO PCT/EP2004/012463 patent/WO2005043161A2/en active Application Filing
Patent Citations (2)
| Publication number | Priority date | Publication date | Assignee | Title |
|---|---|---|---|---|
| EP1043676A2 (en) * | 1999-04-09 | 2000-10-11 | Whitehead Institute For Biomedical Research | Methods for classifying samples and ascertaining previously unknown classes |
| WO2003039443A2 (en) * | 2001-11-05 | 2003-05-15 | Deutsches Krebsforschungszentrum | Novel genetic markers for leukemias |
Non-Patent Citations (15)
| Title |
|---|
| ALIZADEH A ET AL: "THE LYMPHOCHIP: A SPECIALIZED CDNA MICROARRAY FOR THE GENOMIC-SCALE ANALYSIS OF GENE EXPRESSION IN NORMAL AND MALIGNANT LYMPHOCYTES" COLD SPRING HARBOR SYMPOSIA ON QUANTITATIVE BIOLOGY, BIOLOGICAL LABORATORY, COLD SPRING HARBOR, NY, US, vol. 64, no. 1, 1999, pages 71-78, XP001099007 ISSN: 0091-7451 * |
| DATABASE BIOSIS [Online] BIOSCIENCES INFORMATION SERVICE, PHILADELPHIA, PA, US; 16 November 2001 (2001-11-16), SCHOCH CLAUDIA ET AL: "AML with recurring chromosome abnormalities as defined in the new WHO-classification: Incidence of subgroups, additional genetic abnormalities, FAB subtype and age distribution in an unselected series of 1897 cytogenetically and moleculargenetically analysed AML" XP002269494 Database accession no. PREV200200241183 & BLOOD, vol. 98, no. 11 Part 1, 16 November 2001 (2001-11-16), pages 457a-458a, 43rd Annual Meeting of the American Society of Hematology, Part 1;Orlando, Florida, USA; December 07-11, 2001 ISSN: 0006-4971 * |
| DATABASE BIOSIS [Online] BIOSCIENCES INFORMATION SERVICE, PHILADELPHIA, PA, US; 16 November 2002 (2002-11-16), KERN WOLFGANG ET AL: "Expression Pattern of Apoptosis-Related Genes in Acute Myeloid Leukemia with Complex Aberrant Karyotype." XP002269819 Database accession no. PREV200300335836 & BLOOD, vol. 100, no. 11, 16 November 2002 (2002-11-16), page Abstract No. 1236, 44th Annual Meeting of the American Society of Hematology;Philadelphia, PA, USA; December 06-10, 2002 ISSN: 0006-4971 * |
| DATABASE BIOSIS [Online] BIOSCIENCES INFORMATION SERVICE, PHILADELPHIA, PA, US; 16 November 2002 (2002-11-16), KOHLMANN ALEXANDER ET AL: "A Gene Expression Study of 59 Acute Myeloid Leukemia (AML) Patients with Recurrent Cytogenetic Abnormalities." XP002269490 Database accession no. PREV200300335805 & BLOOD, vol. 100, no. 11, 16 November 2002 (2002-11-16), page Abstract No. 1205, 44th Annual Meeting of the American Society of Hematology;Philadelphia, PA, USA; December 06-10, 2002 ISSN: 0006-4971 * |
| DATABASE BIOSIS [Online] BIOSCIENCES INFORMATION SERVICE, PHILADELPHIA, PA, US; 16 November 2002 (2002-11-16), KOHLMANN ALEXANDER ET AL: "A Simplified and Partially Automated Target Preparation Method for Gene Expression Profiling." XP002269495 Database accession no. PREV200300367771 & BLOOD, vol. 100, no. 11, 16 November 2002 (2002-11-16), page Abstract No. 4287, 44th Annual Meeting of the American Society of Hematology;Philadelphia, PA, USA; December 06-10, 2002 ISSN: 0006-4971 * |
| DATABASE BIOSIS [Online] BIOSCIENCES INFORMATION SERVICE, PHILADELPHIA, PA, US; 16 November 2002 (2002-11-16), KOHLMANN ALEXANDER ET AL: "Gene Expression Profiles of t(11q23)/MLL Positive ALL and AML." XP002269818 Database accession no. PREV200300356357 & BLOOD, vol. 100, no. 11, 16 November 2002 (2002-11-16), page Abstract No. 308, 44th Annual Meeting of the American Society of Hematology;Philadelphia, PA, USA; December 06-10, 2002 ISSN: 0006-4971 * |
| DATABASE BIOSIS [Online] BIOSCIENCES INFORMATION SERVICE, PHILADELPHIA, PA, US; 16 November 2002 (2002-11-16), SCHOCH CLAUDIA ET AL: "AML with Complex Aberrant Karyotype Can Be Distinguished from All Other AML Subtypes by Gene Expression Profiles and Are Characterized by Higher Expression of Genes Involved in DNA Repair." XP002269820 Database accession no. PREV200300335804 & BLOOD, vol. 100, no. 11, 16 November 2002 (2002-11-16), page Abstract No. 1204, 44th Annual Meeting of the American Society of Hematology;Philadelphia, PA, USA; December 06-10, 2002 ISSN: 0006-4971 * |
| DUGAS M ET AL: "A comprehensive leukemia database: integration of cytogenetics, molecular genetics and microarray data with clinical information, cytomorphology and immunophenotyping" LEUKEMIA, MACMILLAN PRESS LTD, US, vol. 15, no. 12, December 2001 (2001-12), pages 1805-1810, XP002263731 ISSN: 0887-6924 * |
| DUGAS MARTIN ET AL: "Impact of integrating clinical and genetic information." IN SILICO BIOLOGY, vol. 2, no. 3, 2002, pages 383-391, XP001179418 ISSN: 1386-6338 (ISSN print) * |
| GIESELMANN VOLKMAR ET AL: "Molecular genetics of metachromatic leukodystrophy" HUMAN MUTATION, vol. 4, no. 4, 1994, pages 233-242, XP009025735 ISSN: 1059-7794 * |
| GOLUB T R ET AL: "Molecular classification of cancer: Class discovery and class prediction by gene expression monitoring" SCIENCE, AMERICAN ASSOCIATION FOR THE ADVANCEMENT OF SCIENCE,, US, vol. 286, no. 5439, 15 October 1999 (1999-10-15), pages 531-537, XP002207658 ISSN: 0036-8075 cited in the application * |
| HAFERLACH T ET AL: "The Diagnosis of 14 Specific Subtypes of Leukemia Is Possible Based on Gene Expression Profiles: A Study on 263 Patients with AML, ALL, CML, or CLL" BLOOD, W.B.SAUNDERS COMPAGNY, ORLANDO, FL, US, vol. 100, no. 11, 16 November 2002 (2002-11-16), page 139A, XP002263227 ISSN: 0006-4971 * |
| KOHLMANN A ET AL: "MOLECULAR CHARACTERIZATION OF ACUTE LEUKEMIAS BY USE OF MICROARRAY TECHNOLOGY" GENES, CHROMOSOMES & CANCER, XX, XX, vol. 37, no. 4, August 2003 (2003-08), pages 396-405, XP008025253 * |
| SCHOCH CLAUDIA ET AL: "Acute myeloid leukemias with reciprocal rearrangements can be distinguished by specific gene expression profiles" PROCEEDINGS OF THE NATIONAL ACADEMY OF SCIENCES OF USA, NATIONAL ACADEMY OF SCIENCE. WASHINGTON, US, vol. 99, no. 15, 23 July 2002 (2002-07-23), pages 10008-10013, XP002215484 ISSN: 0027-8424 * |
| TIPPING ALEX J ET AL: "Comparative gene expression profile of chronic myeloid leukemia cells innately resistant to imatinib mesylate." EXPERIMENTAL HEMATOLOGY (NEW YORK), vol. 31, no. 11, November 2003 (2003-11), pages 1073-1080, XP002269821 ISSN: 0301-472X (ISSN print) * |
Cited By (2)
| Publication number | Priority date | Publication date | Assignee | Title |
|---|---|---|---|---|
| EP2993473A1 (en) * | 2007-01-30 | 2016-03-09 | Pharmacyclics, Inc. | Methods for determining cancer resistance to histone deacetylase inhibitors |
| US9492423B2 (en) | 2011-09-13 | 2016-11-15 | Pharmacyclics Llc | Formulations of histone deacetylase inhibitor in combination with bendamustine and uses thereof |
Also Published As
| Publication number | Publication date |
|---|---|
| WO2005043161A3 (en) | 2005-08-11 |
| EP1682901A2 (en) | 2006-07-26 |
| US20070099190A1 (en) | 2007-05-03 |
Similar Documents
| Publication | Publication Date | Title |
|---|---|---|
| KR101566368B1 (en) | Urine gene expression ratios for detection of cancer | |
| WO2004097051A2 (en) | Methods for diagnosing aml and mds differential gene expression | |
| US20100261617A1 (en) | Gene expression signature for the prognosis, diagnosis, and therapy of prostate cancer and uses thereof | |
| EP1809765A2 (en) | Classification of acute myeloid leukemia | |
| US20150344962A1 (en) | Methods for evaluating breast cancer prognosis | |
| WO2006048266A2 (en) | Gene expression profiling of leukemias with mll gene rearrangements | |
| EP1682904A2 (en) | Method for distinguishing who classified aml subtypes | |
| WO2005043161A2 (en) | Method for distinguishing leukemia subtypes | |
| US20070275380A1 (en) | Method for Distinguishing Aml Subtypes With Aberrant and Prognostically Intermediate Karyotypes | |
| WO2006048270A2 (en) | Methods of detecting leukemia and its subtypes | |
| US20070122814A1 (en) | Methods for distinguishing prognostically definable aml | |
| WO2005043167A2 (en) | Method for distinguishing aml subtypes with differents gene dosages | |
| EP1682903A2 (en) | Method for distinguishing aml-specific flt3 length mutations from tkd mutations | |
| US20070207459A1 (en) | Method For Distinguishing Immunologically Defined All Subtype | |
| US20070212688A1 (en) | Method For Distinguishing Cbf-Positive Aml Subtypes From Cbf-Negative Aml Subtypes | |
| US20070212734A1 (en) | Method for Distinguishing T(11Q23)/Mll-Positive Leukemias From t(11Q23)/Mll Negative Leukemia | |
| US20070212687A1 (en) | Method For Distinguishing Mll-Ptd-Positive Aml From Other Aml Subtypes | |
| CN113322325A (en) | Application of gene group as detection index in oral squamous cell carcinoma diagnosis | |
| WO2005045438A2 (en) | METHOD FOR DISTINGUISHING AML SUBTYPE INV(3)(q21q26)/t(3;3)(q21q26) FROM OTHER AML SUBTYPES | |
| WO2006048273A1 (en) | Methods of validating gene expression assays | |
| EP1815012A2 (en) | Classifying leukemia with translocation (9;22) |
Legal Events
| Date | Code | Title | Description |
|---|---|---|---|
| AK | Designated states |
Kind code of ref document: A2 Designated state(s): AE AG AL AM AT AU AZ BA BB BG BR BW BY BZ CA CH CN CO CR CU CZ DE DK DM DZ EC EE EG ES FI GB GD GE GH GM HR HU ID IL IN IS JP KE KG KP KR KZ LC LK LR LS LT LU LV MA MD MG MK MN MW MX MZ NA NI NO NZ OM PG PH PL PT RO RU SC SD SE SG SK SL SY TJ TM TN TR TT TZ UA UG US UZ VC VN YU ZA ZM ZW |
|
| AL | Designated countries for regional patents |
Kind code of ref document: A2 Designated state(s): BW GH GM KE LS MW MZ NA SD SL SZ TZ UG ZM ZW AM AZ BY KG KZ MD RU TJ TM AT BE BG CH CY CZ DE DK EE ES FI FR GB GR HU IE IS IT LU MC NL PL PT RO SE SI SK TR BF BJ CF CG CI CM GA GN GQ GW ML MR NE SN TD TG |
|
| 121 | Ep: the epo has been informed by wipo that ep was designated in this application | ||
| WWE | Wipo information: entry into national phase |
Ref document number: 2004797590 Country of ref document: EP |
|
| WWE | Wipo information: entry into national phase |
Ref document number: 2007099190 Country of ref document: US Ref document number: 10575635 Country of ref document: US |
|
| WWP | Wipo information: published in national office |
Ref document number: 2004797590 Country of ref document: EP |
|
| WWP | Wipo information: published in national office |
Ref document number: 10575635 Country of ref document: US |