METHODS OF IDENTIFYING ANTINEOPLASTIC AGENTS
FIELD OF THE INVENTION
[01] The invention relates to identification of antineoplastic agents. More particularly, the invention relates to identification of Chkl inhibitors.
BACKGROUND OF THE INVENTION
[02] Control of the cell cycle is fundamental to the growth and maintenance of eukaryotic organisms. Eukaryotic cells have evolved control pathways, termed "checkpoints," which ensure that individual steps of the cell cycle are completed before the next step occurs. In response to DNA damage, cell survival is increased both by direct DNA repair mechanisms and by delaying progression through the cell cycle. Depending on the position of the cell within the cycle at the time of irradiation, DNA damage in mammalian cells can prevent passage from Gl into S phase, progression through S phase, or passage from G2 into mitosis. Such checkpoints are thought to prevent deleterious events, such as replication of damaged DNA and the segregation of fragmented chromosomes during mitosis. Hartwell & Kastan, Science 266, 1821-28, 1994.
[03] Mammalian cells treated with agents that inhibit DNA replication or cause DNA damage undergo cell cycle arrest due to the presence of multiple checkpoint response mechanisms. The regulation of cell cycle kinases, and in particular checkpoint kinase, has important implications for the control of proliferative diseases such as cancer. For example, in response to DNA damage in mammalian cells, the tumor suppressor p53 acts in a checkpoint pathway for cell cycle control by inducing the transcription of a cyclin-dependent kinase inhibitor resulting in Gl/S arrest.
[04] Cells deficient in p53 with damaged DNA, however, are unable to arrest in Gl/S, a condition that can lead to cancer. It has been estimated that p53 may be nonfunctional in at least 60% of human cancers. Greenblatt et al., Cane. Res. 54, 4855-
78, 1994. Cells lacking both p53 and Chkl checkpoint controls will re-enter the cell cycle without repairing DNA damage, and ultimately undergo apoptosis.
[05] Cells in which Chkl is inhibited become hypersensitive to DNA damaging agents because the cell cycle will not be arrested upon damage to the DNA. Thus, Chkl inhibitors can be useful as potentiators of DNA damaging agents for treating tumors. For example, the Chkl kinase inhibitor UCN-01 potentiates camptothecin-induced cytotoxicity. Graves et al., J. Biol. Chem. 275, 5600-05, 2000. There is a need in the art for effective model systems in which such agents can be identified and their potential efficacy assessed.
BRIEF DESCRIPTION OF THE FIGURES
[06] FIG. 1. FACS-based cell cycle analysis following treatment time of microarray experiment (18 hours of CPT treatment and/or 6 hours of treatment with CCR+).
[07] FIG. 2. Graphs showing differential expression patterns determined using quantitative RT-PCR. FIG. 2A, EGR1, DDIT3. FIG. 2B, CCNE1, CCNE2. FIG. 2C, CCNE2. FIG. 2D, DDIT3, EGR1.
[08] FIG. 3. Graphs showing dose-dependent effects of Chkl inhibitors on surrogate marker gene expression. FIG. 3A, cyclin E2. FIG. 3B, EGR1. FIG. 3C, DDIT3.
[09] FIG. 4. Graphs showing dose-dependent effects of Chkl inhibitors on surrogate marker gene expression. FIG. 4A, CCNE2. FIG. 4B, EGR1. FIG. 4C, DDIT3.
[10] FIG. 5. Graph showing cell cycle release fit using CCNE2, EGR1, and DDIT3.
DETAILED DESCRIPTION OF THE INVENTION
[11] We have found that expression of particular genes is altered in response to treatment of cancer cells with a DNA damaging agent and a Chkl inhibitor. Changes in expression of these genes, termed "surrogate marker genes," can be used to identify test compounds as potential antineoplastic agents and to assess the potential in vivo efficacy of such agents.
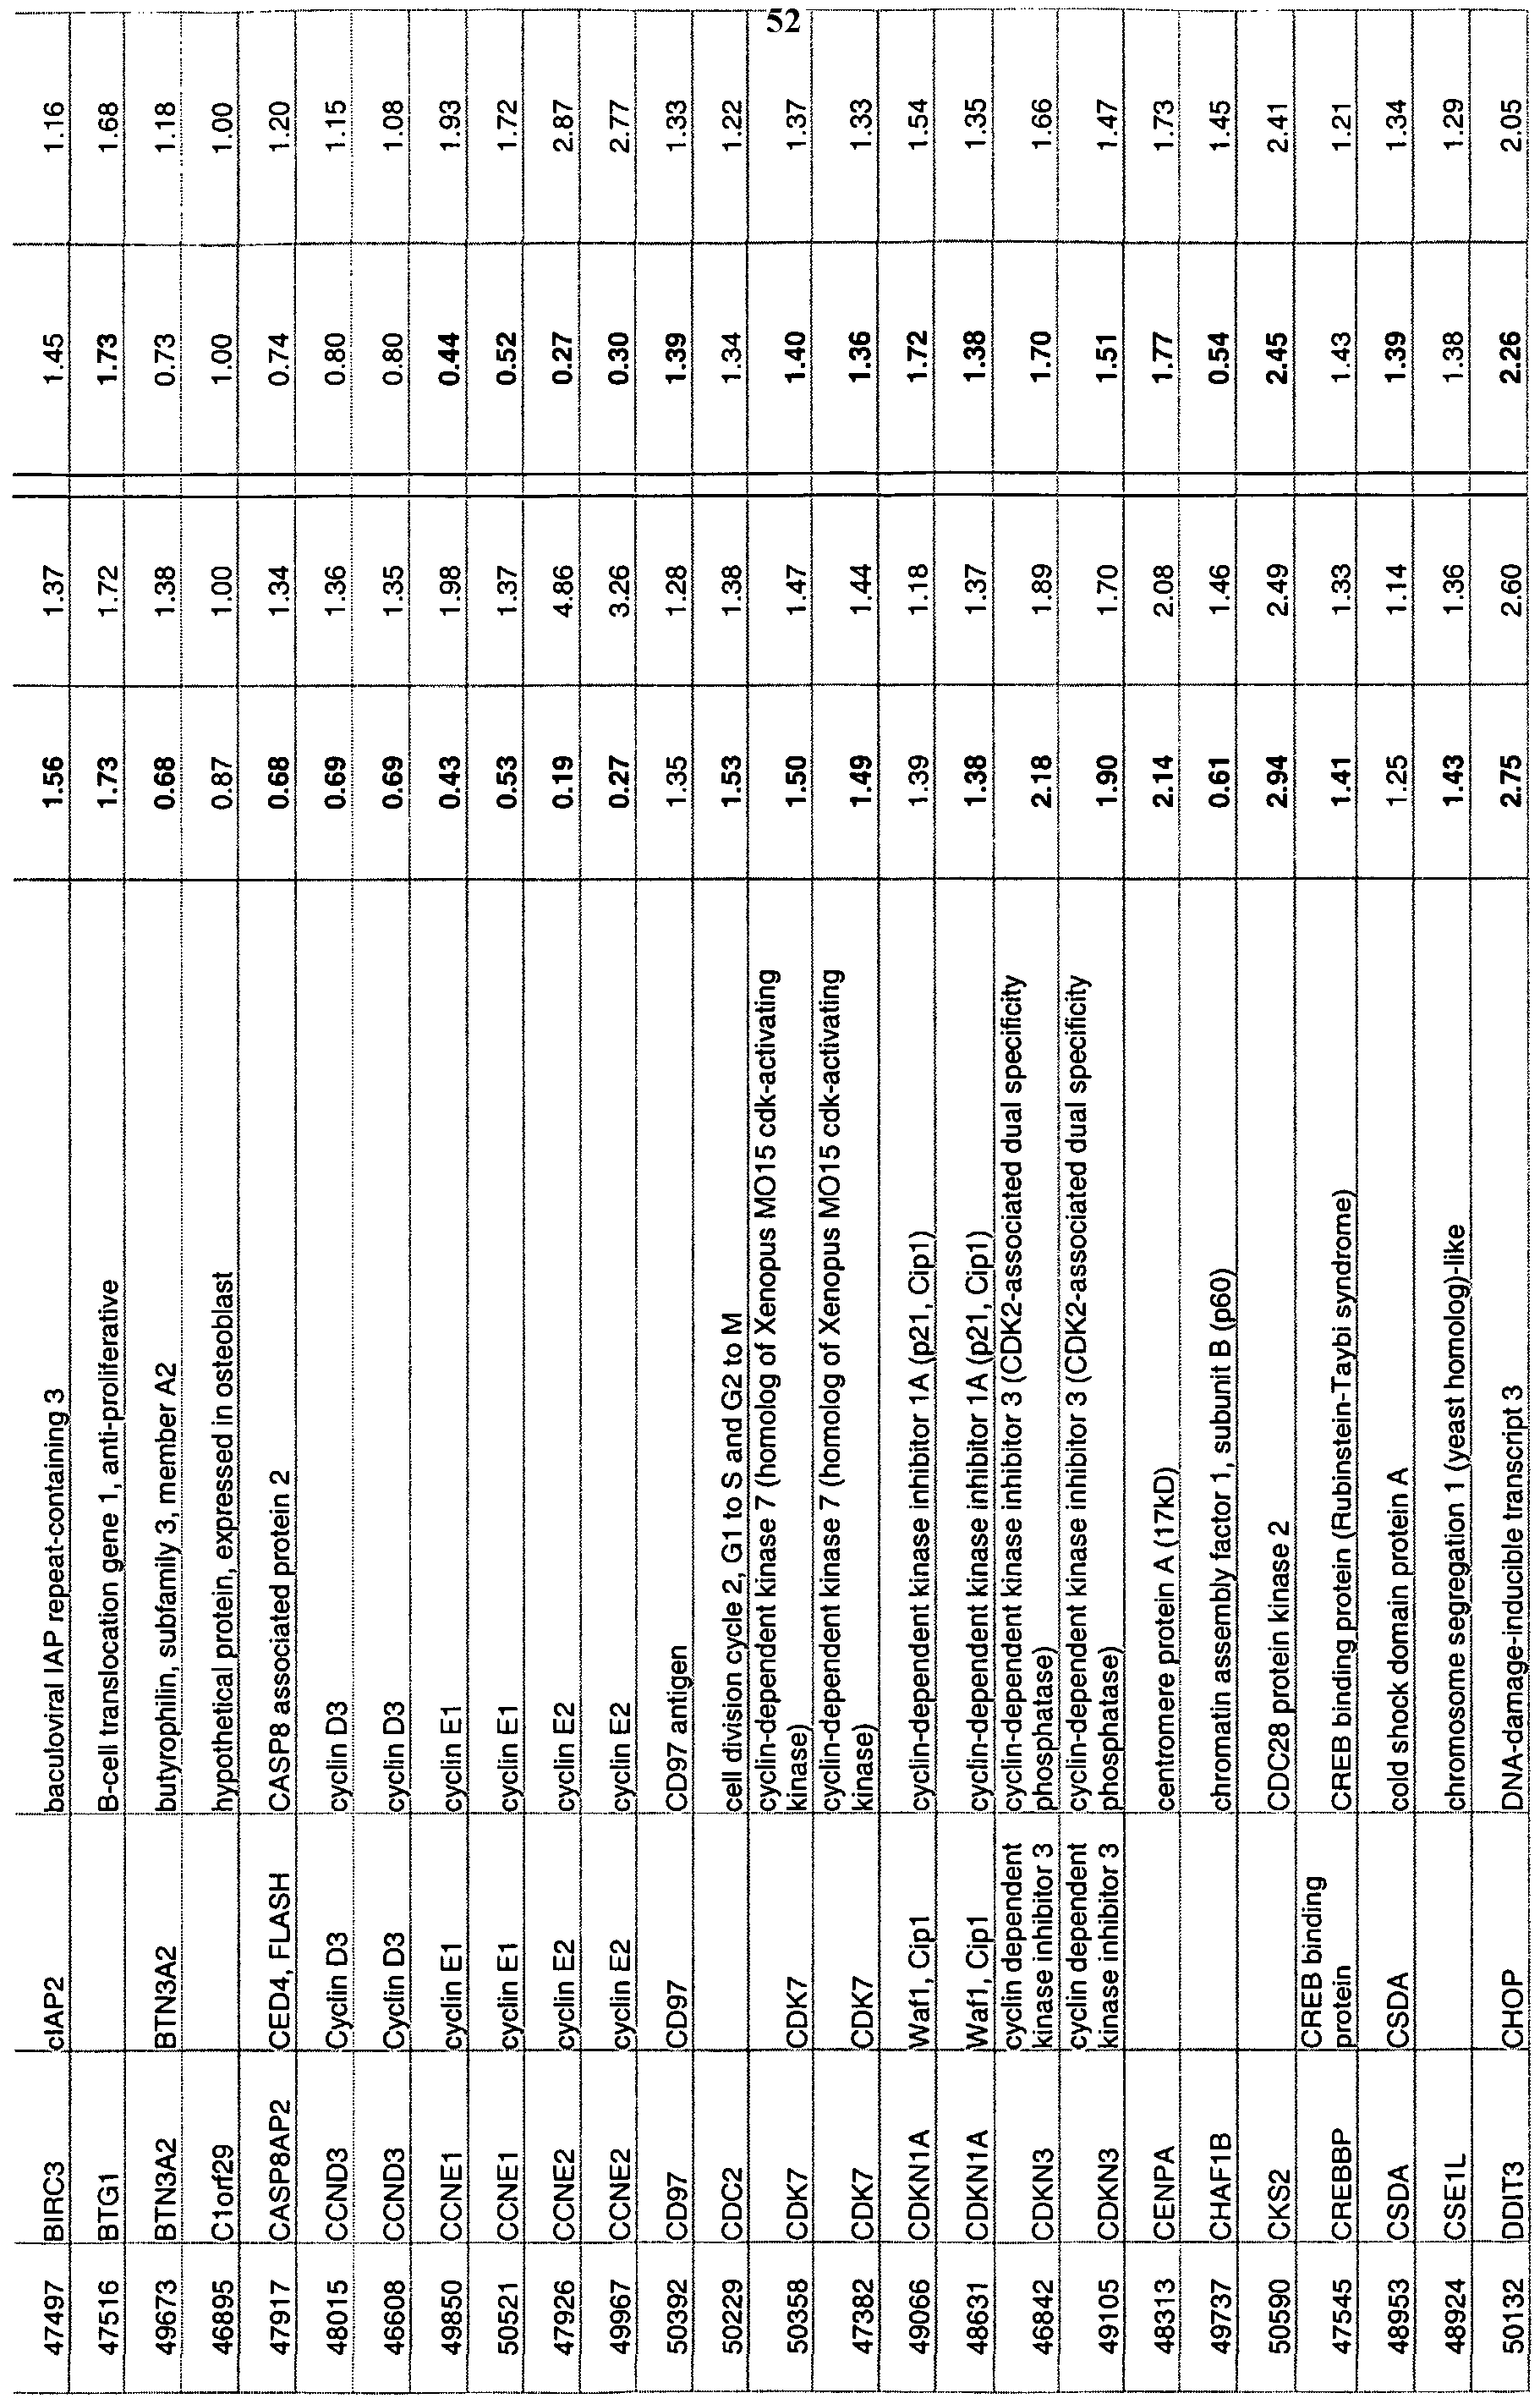
[12] Surrogate marker genes of the invention are differentially expressed in response to the combination of a DNA damaging agent and a test compound that inhibits Chkl. Expression of some surrogate marker genes is increased, whereas expression of others is decreased. Expression of surrogate marker genes of the invention preferably either increases or decreases by at least 1.3-fold in response to the combination of a DNA damaging agent and a test compound. Particularly useful surrogate marker genes are those identified in Tables 2, 3, and 6 for which the "wtd mean ratio" is in bold. Genes whose expression increases in response to a potential antineoplastic agent are those for which the "wtd mean ratio" is greater than 1. Genes whose expression decreases in response to a potential antineoplastic agent are those for which the "wtd mean ratio" is less than one. An especially preferred set of surrogate marker genes includes cyclin E2 (CCNE2), cyclin El (CCNEl), DDIT3, and EGR1.
[13] According to the invention, test compounds can be screened for potential use as antineoplastic agents by assessing their ability to affect expression of at least one surrogate marker gene in a cancer cell treated with a DNA damaging agent. If desired, expression of at least 2, 3, 4, 5, 6, 7, 8, 9, 10, 15, 20, 25, 30, 50, 75, or more surrogate marker genes can be determined.
[14] Surrogate marker genes can be selected from the group of surrogate marker genes identified in Tables 2, 3, and 6. Methods of the invention involve measuring expression of at least one of the surrogate marker genes identified in Tables 2, 3, and 6 after treatment of a cell with a DNA damaging agent and a test compound. The methods can be carried out either qualitatively or quantitatively and either in vitro or in vivo.
[15] Test compounds can be pharmacologic agents already known in the art or can be compounds previously unknown to have any pharmacological activity, including small molecules from compound libraries. Test substances can be naturally occurring or designed in the laboratory. They can be isolated from microorganisms, animals, or plants, or can be produced recombinantly or synthesized by chemical methods known in the art. The function of the test compound can be unknown. Alternatively, the test compound can be a known or suspected Chkl inhibitor.
[16] A DNA damaging agent is any chemical compound or treatment method that induces DNA damage when applied to a cell. DNA damaging agents include, but are not limited to, chemosensitizing agents and ionizing irradiation. Any DNA damaging agent can be used in assay methods of the invention.
[17] Chemosensitizing agents include topoisomerase inhibitors (e.g., camptothecin, daunorubicin or daunomycin, doxorubicin, idarubicin, irinotecan, mitoxantrone, teniposide (VM-26), topotecan), alkylating agents (e.g., mitomycin C, chlorambucil, cyclophosphamide, thiotepa, busulfan), and methylating agents (e.g., methylmethane sulfonate (MMS), temozolomide). Camptothecin is conveniently used.
[18] Ionizing irradiation that can be used includes, but is not limited to, X-irradiation, gamma-irradiation, UV irradiation, microwaves, electronic emissions, and the like.
[19] The cancer cell can be a cell of a primary or metastatic tumor, such as a tumor of the colon, breast, lung, prostate, brain, or kidney, or a melanoma, which is isolated from a patient. Alternatively, a cancer cell line, such as DLD-1 (colon), PC-3 (prostate), DU- 145 (prostate), H1299 (non-small cell lung), T47D (breast), MDA-MB-435 (breast), or SKOV3 (ovarian), can be used. The cancer cell can be in vitro (i.e., in a tissue culture system, including monolayer, aggregate, and explant systems) or in vivo, in an experimental animal model, such as a tumor-bearing mouse or rat. In such experimental animal models, the tumor can be naturally occurring or can be implanted, as is known in the art.
[20] Cancer cells can be contacted with the DNA damaging agent and the test compound simultaneously or sequentially in either order. A chemotherapeutic DNA damaging agent and a test compound can be in separate or in unitary compositions. The amount of DNA damaging agent used should be sufficient to damage the cell's DNA. Those of skill in the art are familiar with numerous DNA damaging agents and can easily identify useful amounts of any particular DNA damaging agent for use either in vivo or in vitro, as well as routes of administration. Several different concentrations of a test compound can be administered in an assay as part of the evaluation of each test compound.
[21] Either RNA or protein products can be detected to determine expression of surrogate marker genes, and can be obtained from the contacted cancer cells using well-known isolation methods. If the cancer cells are in vitro, the cells can simply be removed from the culture vessel. If the cancer cells are in a tumor in an experimental animal model, a biopsy sample of the tumor can be obtained. Alternatively, surrogate marker gene expression can be measured in blood cells, e.g., peripheral blood mononuclear cells (PBMCs).
[22] Detecting RNA products of gene expression can be carried out using a variety of methods well known in the art, including, but not limited to, RNA dot blots, slot blots, Northern blots, RT-PCR (including TaqMan RT-PCR), SAGE (serial analysis of gene expression), and electrochemical detection of nucleic acid hybridization (e.g., U.S. Patent 6,361,951). See also US 20030096782; Liang & Pardee, Science 257, 967, 1992; Higuchi et al, BioTechnology 10, 413-17, 1992, and Higuchi et al, BioTechnology 11, 1026-30, 1993; Holland et al, Proc. Natl. Acad. Sci. U.S.A. 88, 7276-80, 1991; Heid et al, Genome Resl 6, 986-94, 1996; and Gibson et al, Genome Res. 6, 995-1001, 1996. Alternatively, RNA products of expressed surrogate marker genes can be identified by contacting RNA with oligonucleotide probes unique to each of the surrogate marker genes whose expression is to be assayed, either in solution or immobilized on a solid support, such as a membrane or a gene expression "chip." As is well known, an array of oligonucleotide probes can be immobilized on a solid support so that expression of multiple surrogate marker genes can be detected in one assay. Such chips can be purchased commercially (e.g., from Affymetrix or Motorola) or can be custom made.
[23] Protein products of the disclosed surrogate marker genes can be detected using a variety of techniques known to the art, including immunochemical methods such as radioimmunoassay, Western blotting, and immunohistochemistry. Alternatively, protein synthesis can be determined in vivo, in a cell culture, or in an in vitro translation system by detecting incorporation of labeled amino acids into protein products.
[24] As demonstrated in Example 8, EC50 values calculated for Chkl inhibitors correlate well with the inhibitors' IC50. Thus, calculation of an EC50 value for a test compound's effect on expression of one or more surrogate marker genes can be used to estimate the potency of the test compound as a Chkl inhibitor. Such determinations are well suited to be carried out in a medium- to high-throughput format, for example using RT-PCR as is known in the art.
[25] Determination of expression of one or more surrogate marker genes also can be used to monitor clinical efficacy of treatment with a particular Chkl inhibitor or a particular dose of a Chkl inhibitor over time. Biological samples that can be tested to determine gene expression can be, for example, biopsies of the tumor being treated.
[26] All patents, patent applications, and references cited in this disclosure are expressly incorporated herein by reference. The above disclosure generally describes the present invention. A more complete understanding can be obtained by reference to the following specific examples, which are provided for purposes of illustration only and are not intended to limit the scope of the invention.
EXAMPLE 1
Demonstration of differential gene expression in response to camptothecin
[27] MDA-MB-435 breast carcinoma cells were pre-incubated with or without 50 nM camptothecin (CPT). Following pre-incubation and treatment, the cells were lysed, total RNA collected, and the poly-A+ mRNA fraction purified. The global transcription response to the various culture conditions was assessed by competitive hybridization to a cDNA microarray chip. The "Spot IDs" correspond to publicly available cDNA sequences for the region of the gene represented at that spot on the microarray chip. A subset of data obtained from this experiment is shown in Table 1.
[28] For hybridizations in this and in the subsequent examples, there are two columns - the weighted mean ratio (wtd mean ratio) and the minimum fold change (min fold change). The minimum fold change is the lower (towards a ratio of one), one-sided 95% confidence limit on the ratio. That is, it represents the minimum change we can
believe with 95% confidence. It can be estimated from the log ratio and standard deviation, assuming that the uncertainty in the ratio is normally distributed. Note that the minimum fold change can never be less than one (hence the minimum function). See also Cheng Li and Wing Hung Wong, "Model-based analysis of oligonucleotide arrays: model validation, design issues and standard error application," Genome Biology 2001 2(8):research0032.1-0032.11 (published 3 August 2001).
[29] For data analysis, all of the significance threshold criteria were set for the "min fold change" column, which ensured that the resulting genes would be differentially expressed by greater than the threshold value with 95% confidence (p value < 0.05). The lowest significance threshold used was 1.3-fold. The fold change threshold is an absolute number, and the direction of change (increased or decreased expression) is determined by the looking at the weighted mean ratio. The significance threshold criteria are included in parentheses in each "min fold change" column. The weighted mean ratios representing significant differentials (95% confidence, p value < 0.05) are in bold.
[30] Table 1 also includes data from an initial Chkl microarray experiment (Study #1). This experiment was a single replicate, so the algorithm to generate a weighted mean and min fold change could not be used. Because statistical significance could not be assigned by the min fold change calculation, the lowest threshold used as a significance cut-off was 1.5-fold differential expression. The differentials that meet this threshold are in bold.
[31] CPT treatment resulted in changes in gene expression consistent with its known mechanism of action (MOA). Differential gene expression was observed for genes in the following categories: genes involved in regulating apoptosis, genes involved in the DNA damage repair response, and cell cycle genes.
[32] There was significant overlap between the observed CPT-dependent differential gene response in Study #1 and the observed response in Study #2. Eighty-two percent of genes with a min fold change >1.5x in Study #2 (55 genes) also were differentially expressed in the Study #1 in response to CPT alone.
PATE PP19908.
Table 1 -Differential Gene Expression in Response to Camptothecin - Mechanism Related Functional Groups
Genes up- or down-regulated in response to camptothecin treatment in BOTH experiments (>1.5x in Study #1, >1.3x in Study #2)
Study #1 Study #2 min fold ch
SpotlD GeneSymbol GeneName GeneDesc (+/-) CPT (>1.5x) (+/-) CPT (>1.3 >
APOPTOSIS
50503 BCL1 B-cell CL ymphoma 1 1.5 1.5 1.42
49132 CASP1 caspase 1 , ICE caspase 1 , apoptosis-related cysteine protease 2 1.4 1.26
48267 CASP1 caspase 1 , ICE caspase 1, apoptosis-related cysteine protease 1.4 1.7 1.44
50721 CASP4 CASP4 caspase 4, apoptosis-related cysteine protease 1.8 1.4 1.27
49807 CASP4 CASP4 caspase 4, apoptosis-related cysteine protease 1.4 1.4 1.32
49295 FAF1 CGI-03 Fas (TNFRSF6) associated factor 1 0.4 0.5 1.75
48673 LRDD LRDD leucine rich repeat and death domain containing pr 3 2 1.45
47924 PIK3CB p110 (PI3K) phosphoinositide-3-kinase, catalytic, beta polypep 0.5 0.7 1.37
48988 PIK3CB p110 (PI3K) phosphoinositide-3-kinase, catalytic, beta polypep 0.5 0.7 1.36
DNA damage & repair
50633 ABL2 2.2 1.6 1.46
50132 DDIT3 D DNNAA--ddaarmage-inducible transcript 3 5.4 2.6 2.55
49433 DDIT3 DDNNAA--ddaarmage-inducible transcript 3 4.3 2.8 2.56
48615 GADD45B yD118 growth arrest and DNA-damage-inducible, beta 1.9 1.8 1.49
30128 PCNA proliferating cell nuclear antigen 1.6 N/A
49707 PCNA proliferating cell nuclear antigen 1.2 1.5 1.46
. o o o o.
_ 5 ϋ - b cp
-
2 _c:
£ Q Q ϋ ϋ
"δ c < < co α. c> o _. Q o
2 5 2 !5
!≤ jz lc jz c c c c i≥>
> co c c c c c r IS !_. 12 c o ^ cf c ^ cri ^ c_. co >. o o c c c c 2 cn c α. α.
UJ UJ UJ c c c c o >* o >. >. u >> o o >. >. > o. σ)
CD
Q o s S
!c c .c o c c
1* c c
-— -— c c o. g_ α.
LU UJ LU b ϋ c c c __: ,c c o
5 5 < <
UJ U LU Z z z Z o z Z Z .<: S-: 5«. CΛ
I- ϋ ϋ Q Q Q a ^ m ϋ ϋ ϋ ϋ O ϋ ϋ o o co co
3 co co cn co o
<» r- n co 5 •*>
0 υ)
EXAMPLE 2
Effect of compound A (supra-additive, cell cycle release) ("CCR+")
[33] MDA-MB-435 breast carcinoma cells were pre-incubated with or without 50nM CPT and then treated with or without 30nM Compound A. Compound A inhibits Chkl enzyme activity (ability to phosphorylate cdc25c) in a cell free assay (CFA) with an IC50 of 0.3nM. Compound A inhibits proliferation of MDA-MB-435 cells using a MTS-based proliferation assay with an EC50 of 80nM.
[34] Following pre-incubation and treatment, the cells were lysed, total RNA collected, and the poly-A+ mRNA fraction purified. The global transcription response to the various culture conditions was assessed by competitive hybridization to probes on a cDNA microarray chip.
[35] In the absence of DNA damaging agents, compound A altered expression of nine genes with a min fold change > 1.3. Only one gene had a min fold change > 1.5 (1.52x reduction in expression of an unidentified spot). This minimal effect is consistent with the anticipated result, because a Chkl inhibitor is not expected to have a significant effect in the absence of DNA damage.
[36] Eighty-nine genes were differentially expressed (> 1.3x min fold change) in response to compound A treatment in the presence of CPT (differentially expressed in comparison to CPT alone) (Table 2).
[37] As shown in Table 3, CPT + compound A treatment changed the expression of a number of cell cycle-related and DNA damage repair-related genes, compared to CPT treatment alone. In Study #1, cells were treated with compound A for 4 hours (following 18 hours of CPT treatment). In Study #2, cells were treated with Chkl inhibitors for 6 hours following CPT treatment. The overall response to CPT + compound A was similar between the two studies. Sixty-four percent of genes differentially expressed with > 1.5 min fold change in Study #2 (6hr) also were differentially expressed in Study #1 (4hr). The 6-hour Chkl inhibitor treatment resulted in an increase in the number of differentially expressed cell cycle-related
genes, compared to the 4 hour Chkl inhibitor treatment. This difference likely is related directly to the increased treatment time with the Chkl compound. Of particular note, in both studies (#1 and #2), compound A treatment reversed the CPT- dependent effect on the expression of cyclin El, E2, CDKN3, and CKS2.
[38] Table 3 also includes data from an initial Chkl microarray experiment (Study #1). As noted in Example 1, above, this experiment was a single replicate, so the algorithm to generate a weighted mean and min fold change could not be used. Because statistical significance could not be assigned by the min fold change calculation, the lowest threshold used as a significance cut-off was 1.5-fold differential expression. The differentials that meet this threshold are in bold.
Table 2 - Genes differentially expressed in response to CPT alone and CPT + Compou A
_ι»to© JL_ tae fi@ιαiiMe,Rtι >
PATEN PP19908.00
PATEN PP19908.00
PAT PP19908.
PATE PP19908.
PATE PP19908.
Table 3 - Genes Differentially Expressed in Response to CPT+ compound A 4-hour (Study #1) and CPT+ compound A 6-hour (Study #2), by mechanism-related functional group
Study #1 (4hr) Study #2 (6hr)
PATEN PP19908.00
EXAMPLE 3
Effect of compound B ("inactive, NEG")
[39] Compound B does not inhibit Chkl enzyme activity (ability to phosphorylate cdc25c) at or below lμM (CFA). Compound B is structurally similar to Compound A. Compound B at 30 nM is a control of non-specific, structure-related effects, because Chkl inhibitory effects would not be anticipated at the 30 nM concentration used in this experiment.
[40] MDA-MB-435 breast carcinoma cells were pre-incubated with or without 50nM CPT and then treated with or without 30nM compound B. Following pre-incubation and treatment, the cells were lysed, total RNA collected, and the poly-A+ mRNA fraction purified. The global transcription response to the various culture conditions was assessed by competitive hybridization to probes on a cDNA microarray chip.
[41] In the absence of DNA damaging agents, treatment with compound B showed minimal changes, and the genes that were differentially expressed had small changes. Thirty-seven genes were differentially expressed with a min fold change > 1.3. Twelve genes had > 1.5x min fold change. Two genes (DFNA5 and "hypothetical") had a min fold change >2x.
[42] Treatment with CPT and compound B resulted in differential expression of one gene (SerpinB2). Only one gene (SARM) differentially expressed by compound B alone or CPT+ compound B overlaps with differentially expressed genes from compound A or CPT+ compound A groups.
EXAMPLE 4
Effect of Compound C (additive, no cell cycle release) ("CCR ")
[43] Compound C inhibits Chkl enzyme activity (ability to phosphorylate cdc25c) in a CFA with an IC50 of 0.2nM. Compound C inhibits proliferation of MDA-MB-435 cells, using a MTS-based proliferation assay, with an EC50 of 98nM. MDA-MB-435
breast carcinoma cells were pre-incubated with or without 50 nM CPT and then treated with or without 30 nM Compound C. Following pre-incubation and treatment, the cells were lysed, total RNA collected, and the poly-A+ mRNA fraction purified. The global transcription response to the various culture conditions was assessed by competitive hybridization to probes on a cDNA microarray chip. The results are shown in Table 4.
[44] In the absence of DNA damaging agents, Compound C altered expression of eighty - eight genes with min fold change > 1.3x. Twenty-two genes had min fold change > 1.5x. More genes are differentially expressed in response to Compound C alone than in response to compound A alone, which may indicate off-target effects of Compound C. However, the majority of genes (66) had min fold change <1.5, indicating a relatively weak effect.
[45] Seventy-seven genes had a min fold change > 1.3x in response to Compound C treatment in the presence of CPT-dependent DNA damage (Table 4). Compound C (in the presence of CPT-dependent DNA damage) had a large effect on multiple cell cycle- and DNA repair-related genes, although this compound does not show CCR (see further discussion below, comparison w/CPT+ Compound A).
CPT+ compound A vs CPT + compound C - differences that could represent SA/CCR-specific effects
[46] In direct competitive hybridization, seven genes were differentially expressed, as shown in Table 5. These genes should represent genes that are differentially expressed in only one of the treatment groups. This direct competitive hybridization is the most stringent comparison of these two compounds, since a statistical p-value can be assigned to the differential expression ratio (min fold change is the change with 95% confidence).
[47] Only one gene (amphiregulin) has a min fold change >1.5 (1.9x). However, none of the 7 genes in Table 5 are differentially expressed in either the CPT vs. CPT+ compound A comparison or the CPT vs. CPT+ compound C comparison. None of these 7 genes appear to be related to the MOA of Chkl inhibition. This result
demonstrates that both Compound A and C have similar effects on Chkl activity and gene expression, although only Compound A caused release from DNA damage- induced arrest at 30 nM.
PATE PP19908.0
Table 4 - Differential gene expression in response to CPT alone and CPT+ compound C
PATEN PP19908.00
PATEN PP19908.00
PATEN PP19908.00
PATE PP19908.
00 o
< O .N e
PL,
PATEN PP19908.00
PATEN PP19908.00
Table 5 - Differential Gene Expression in Direct Competitive Hybridization CPT+ Compound A vs. CPT+ Compound C
EXAMPLE 5
[48] A manual comparison was done of expression responses to CPT+ compound A to CPT+ compound C. The results are shown in Table 6. This comparison serves as an internal control of the direct competitive hybridization, discussed above. However, this type of comparison is not as stringent as the direct comparison, since no p-value can be assigned to any observed differences.
[49] Twenty-four most highly regulated genes in CPT+ compound A (min fold change >1.67x) also are similarly regulated by CPT+ compound C. Sixty percent of all CPT+ compound A reg
NOT FURNISHED UPON FILING
[50] ulated genes (54 genes) also are differentially expressed in response to CPT+ compound C. The majority of the CPT+ compound A regulated genes that are not significantly regulated by CPT+ compound C show a similar expression trend in CPT+ compound C, although the degree of differential expression does not meet the cut-off criteria of >1.3.
Cell cycle and other MOA-related genes
[51] Most MOA-related genes differentially expressed in response to CPT+ compound A were similarly affected by CPT+ compound C (e.g., cycEl, cycE2, cdkn3, NFKB components, cks2, cdk7, p21). There are a few MOA-related genes differentially expressed only by CPT+ compound A. However, every gene but UBE2C (1.52x) and FosB (1.59x) has min fold change <1.5x, so these differential responses are weak. Although a few genes do miss the threshold cut off in the CPT+ compound C group, expression of these genes shows a similar trend of min fold change to that seen in CPT+ compound A.
NOT FURNISHED UPON FILING
PATENT PP19908.004
PATENT PP19908.004
NOT FURNISHEL
58JPON FILING
EXAMPLE 6
Cell cycle release assay
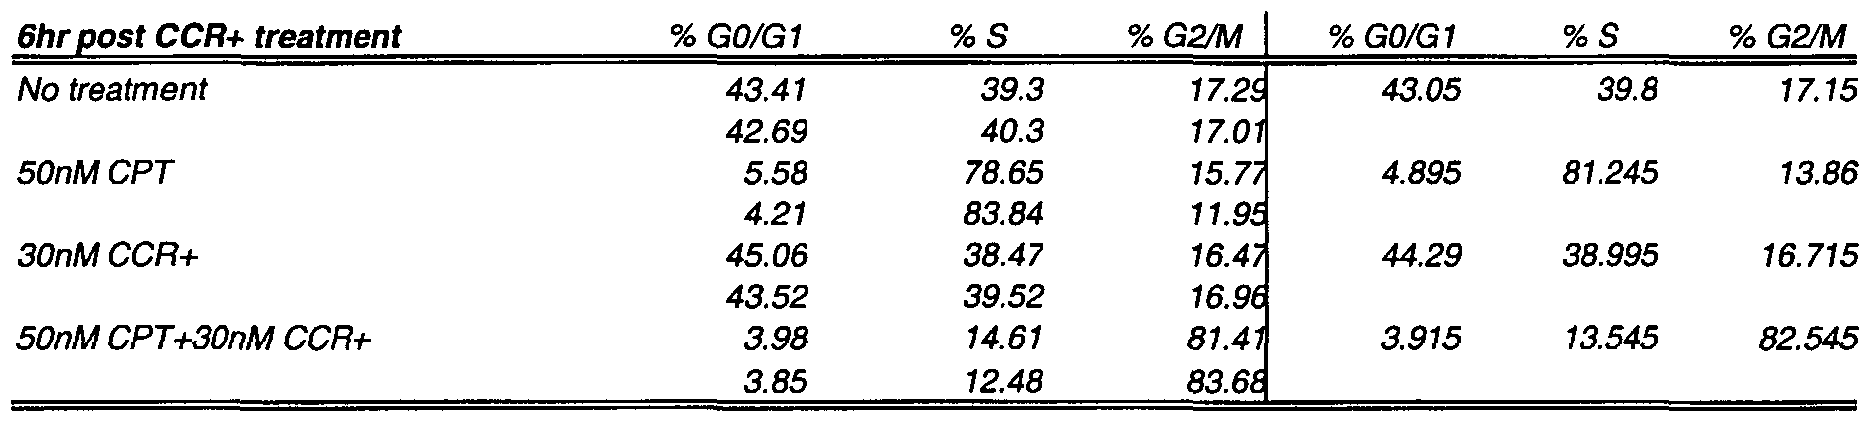
[52] To confirm the ability of the CCR+ compound to release cells from CPT-induced cell cycle arrest, cells were treated with 50 nM CPT for 18 hours, followed by 6 hours of CCR+. As shown in Figure 1 and Table 7, CPT induced S phase arrest with 81% of cells accumulating in S phase. Following 6 hours of incubation with the CCR+ compound, cells were released from CPT-induced S-phase arrest and progressed into G2/M. The ability of CCR+ to release cells from CPT-induced arrest after 6 hours suggested that transcriptional changes in response to 6 hours of CCR+ treatment would be relevant to the compound's MO A, and differentially expressed genes could be considered as reasonable biomarkers of Chkl inhibitor activity.
Table 7
EXAMPLE 7
Validation of Chkl inhibition surrogate marker genes by quantitative RT-PCR
[53] Validation of several surrogate markers of Chkl inhibition, including cyclin El (CCNE1), cyclin E2 (CCNE2), DDIT3, and EGR1, was carried out using quantitative RT-PCR (qRT-PCR). qRT-PCR using the same mRNA used for the transcriptional profiling confirmed the transcriptional changes of the surrogate marker genes. RNA was prepared using the RNeasy kit (Qiagen Corp., Valencia, CA) according to manufacturer's instructions, then two-step qRT-PCR was carried out. cDNA was generated by combining 4 μl of eluted RNA with the reaction buffer containing MMLV RT lOx buffer (Ambion, Inc., Austin, TX), 10 pmoles oligo dT (Ambion), 10 pmoles random decamers
(Ambion), 125 μM each dNTP (Roche Applied Science, Indianapolis, IN), 20 units RNase inhibitor (Ambion), and 50 units of MMLV reverse transcriptase (Ambion). The reaction was incubated for 1 hour at 42°C, and 2 μl of the cDNA was then used for the PCR reaction.
[54] Cyclin El, cyclin E2, DDIT3, EGRl, and GAPDH PCR primers and probes were from Assays-on-Demand Gene Expression Kits (Applied Biosystems, Foster City, CA). The PCR reaction was done according to the Assays-on-Demand protocol for a 50 μl reaction, with 22.5 μl from the cDNA preparation used for each PCR reaction. The reaction parameters were as follows: 10 minute hold at 95°C, 45 cycles of 15 seconds at 95°C, 1 minute at 60°C.
[55] As shown in Figures 2A and 2B, the differential expression pattern for these markers confirmed the array results.
[56] To further confirm the reproducibility of the array results, three of these markers (CCNE2, DDIT3, and EGRl) were selected for further validation. A new experiment was performed in a 96-well plate format, under the same treatment conditions as that used for the transcriptional profiling. RNA was harvested following incubation with CPT, the Chkl inhibitor compounds, and the inactive control compound. qRT-PCR was then performed as described above.
[57] As shown in Figures 2C and 2D, the observed expression changes in response to CPT+compounds compared to CPT alone for the three markers were similar to changes observed in both the initial array results and the confirmatory qRT-PCR (Figures 2A and 2B).
EXAMPLE 8
Chkl inhibitors have dose dependent effect on surrogate marker gene expression
[58] The qRT-PCR data from the 96-well plate experiment (Figures 2C and 2D) suggested that the active Chkl inhibitors (CCR+ and CCR", i.e., compounds A and C) altered the
CPT-dependent changes in surrogate marker mRNA expression to different degrees. For example, CPT+CCR+ appeared to induce CCNE2 to a greater extent than CPT+CCR" (compared to CPT alone).
[59] A dose response study was performed to investigate whether these markers could be used to rank compounds according to their potency against Chkl. For the initial dose response experiment (with CCR+, CCR", and inactive compounds), cells were seeded at 5 x 10 cells/well in 96-well flat bottom plates in OptiMEM I + 4% FBS. Cells were pre- incubated with 50 nM CPT for 18 hours, and then incubated with 1, 3, 10, 30, 100, and 300 nM of the CCR+, CCR", or inactive compound for 6 hours.
[60] As shown in Figure 3, while the inactive compound (in the presence of CPT) had no effect on gene expression, the three markers showed a dose-dependent response to the active compounds (CCR+ and CCR") in the presence of DNA damage. Further, the CCR+ compound had a larger effect on gene expression than the CCR" compound, consistent with the observation that CCR+ was more effective in the functional cell cycle release assay.
[61] To further investigate the potential to use these surrogate markers to rank the potency of Chkl inhibitor compounds, cells were treated with an additional 15 compounds. MDA- MB-435 cells were seeded at 5 x 10⁴ cells/well in 96-well flat bottom plates in OptiMEM I + 4% FBS. Cells were pre-incubated with 50 nM CPT for 18 hours and then incubated with 5, 15, 50, 150, 450, and 1000 nM of the experimental compounds for 6 hours. A broader range of concentrations was used in this experiment compared to the initial study to allow detection of a dose-response across the range of IC50 values of this set of compounds. Twelve active Chkl inhibitors and three inactive compounds were selected for this expanded validation study.
[62] The results for a subset of compounds are shown in Figure 4. Similar to the results with the initial compounds in Figure 3, these additional compounds also showed a range of efficacies in their ability to alter gene expression. Based on the dose-response analyses, EC50 values were generated for the initial 3 compounds (CCR+, CCR-, inactive/NEG) as well as for the additional 15 compounds (Table 8). The results of this expanded study
indicate that these markers are dose responsive for multiple compounds. Further, the ranking of the compounds based on the gene expression EC50 generally reflects the in vitro enzyme IC50. Therefore, it is possible to use gene expression as measured by RT- PCR to determine rank order of potency of inhibitors against an enzyme in situ, in this case Chkl.
[63] Table 8
EXAMPLE 9
Surrogate marker expression correlates with compounds' effects on in vitro cell cycle assay.
[64] The direct in vitro measure of functional Chkl inhibition is the ability of an inhibitor to release MDA-MB-435 cells from CPT-induced S phase arrest. To confirm that the selected Chkl inhibitor compounds were acting through the correct mechanism and were able to release cells from CPT-induced cell cycle arrest, cell cycle analyses were done using all 18 compounds included in the surrogate marker study. The EC5o generated for each compound is included in Table 9.
[65] A correlation analysis was carried out between the EC50S generated from the qRT-PCR dose response experiments (Table 8) and from the cell cycle release assay (Table 9) to
determine how well the selected markers of Chkl inhibition correlated with a direct functional in vitro cell cycle release assay. A plot of predicted EC50 (based on RT-PCR results) and experimental EC50 (detected by FACS) are shown in Figure 5.
[66] Spearman correlation analysis demonstrated that the EC50S of the surrogate markers correlated well with the cell cycle release EC50s, indicating that the selected surrogate markers are predictive of the ability of the Chkl inhibitor compounds to release cells from CPT-induced cell cycle arrest with p values of <0.02.
[67] While the use of a direct functional assay is sometimes preferable to indirect methods for the evaluation of novel, targeted small molecule inhibitors, it is not always feasible to use such an assay, particularly if medium or high throughput is desirable. In the case of Chkl inhibitors, the cell cycle release assay, while a direct measure of Chkl inhibition, is very labor intensive, particularly if dose response analyses are done. As a result, identification of biomarkers whose changes in expression correlate well with the functional effect of these inhibitors has clear utility. For example, RT-PCR can be used to assay many compounds rapidly in 96-well or other multiplexed format, as demonstrated here.
[68] As experimental Chkl inhibitors advance into in vivo models and through to clinical trials, there will be an ongoing need for markers that are significantly correlated with Chkl inhibition and more importantly, the functional effect of this inhibition on release of DNA-damage cells from cell cycle arrest. The biomarkers identified here appear to be effective in ranking the potency of the compounds in inhibiting Chkl and in their ability to release cells from DNA damage-induced cell cycle arrest. In the clinical setting, these markers could be used to monitor drug exposure and efficacy, where direct measurement of efficacy is often not possible or practical.
[69] Table 9