WO2004011903A2 - Monitoring molecular interactions using photon arrival-time interval distribution analysis - Google Patents
Monitoring molecular interactions using photon arrival-time interval distribution analysis Download PDFInfo
- Publication number
- WO2004011903A2 WO2004011903A2 PCT/US2003/023252 US0323252W WO2004011903A2 WO 2004011903 A2 WO2004011903 A2 WO 2004011903A2 US 0323252 W US0323252 W US 0323252W WO 2004011903 A2 WO2004011903 A2 WO 2004011903A2
- Authority
- WO
- WIPO (PCT)
- Prior art keywords
- species
- photons
- photon
- labeled
- paid
- Prior art date
- Legal status (The legal status is an assumption and is not a legal conclusion. Google has not performed a legal analysis and makes no representation as to the accuracy of the status listed.)
- Ceased
Links
Classifications
-
- G—PHYSICS
- G01—MEASURING; TESTING
- G01N—INVESTIGATING OR ANALYSING MATERIALS BY DETERMINING THEIR CHEMICAL OR PHYSICAL PROPERTIES
- G01N21/00—Investigating or analysing materials by the use of optical means, i.e. using sub-millimetre waves, infrared, visible or ultraviolet light
- G01N21/62—Systems in which the material investigated is excited whereby it emits light or causes a change in wavelength of the incident light
- G01N21/63—Systems in which the material investigated is excited whereby it emits light or causes a change in wavelength of the incident light optically excited
- G01N21/64—Fluorescence; Phosphorescence
- G01N21/6428—Measuring fluorescence of fluorescent products of reactions or of fluorochrome labelled reactive substances, e.g. measuring quenching effects, using measuring "optrodes"
-
- G—PHYSICS
- G01—MEASURING; TESTING
- G01J—MEASUREMENT OF INTENSITY, VELOCITY, SPECTRAL CONTENT, POLARISATION, PHASE OR PULSE CHARACTERISTICS OF INFRARED, VISIBLE OR ULTRAVIOLET LIGHT; COLORIMETRY; RADIATION PYROMETRY
- G01J1/00—Photometry, e.g. photographic exposure meter
- G01J1/42—Photometry, e.g. photographic exposure meter using electric radiation detectors
-
- G—PHYSICS
- G01—MEASURING; TESTING
- G01J—MEASUREMENT OF INTENSITY, VELOCITY, SPECTRAL CONTENT, POLARISATION, PHASE OR PULSE CHARACTERISTICS OF INFRARED, VISIBLE OR ULTRAVIOLET LIGHT; COLORIMETRY; RADIATION PYROMETRY
- G01J3/00—Spectrometry; Spectrophotometry; Monochromators; Measuring colours
- G01J3/28—Investigating the spectrum
- G01J3/44—Raman spectrometry; Scattering spectrometry ; Fluorescence spectrometry
- G01J3/4406—Fluorescence spectrometry
-
- G—PHYSICS
- G01—MEASURING; TESTING
- G01N—INVESTIGATING OR ANALYSING MATERIALS BY DETERMINING THEIR CHEMICAL OR PHYSICAL PROPERTIES
- G01N21/00—Investigating or analysing materials by the use of optical means, i.e. using sub-millimetre waves, infrared, visible or ultraviolet light
- G01N21/62—Systems in which the material investigated is excited whereby it emits light or causes a change in wavelength of the incident light
- G01N21/63—Systems in which the material investigated is excited whereby it emits light or causes a change in wavelength of the incident light optically excited
- G01N21/64—Fluorescence; Phosphorescence
- G01N21/6408—Fluorescence; Phosphorescence with measurement of decay time, time resolved fluorescence
-
- G—PHYSICS
- G01—MEASURING; TESTING
- G01N—INVESTIGATING OR ANALYSING MATERIALS BY DETERMINING THEIR CHEMICAL OR PHYSICAL PROPERTIES
- G01N21/00—Investigating or analysing materials by the use of optical means, i.e. using sub-millimetre waves, infrared, visible or ultraviolet light
- G01N21/62—Systems in which the material investigated is excited whereby it emits light or causes a change in wavelength of the incident light
- G01N21/63—Systems in which the material investigated is excited whereby it emits light or causes a change in wavelength of the incident light optically excited
- G01N21/64—Fluorescence; Phosphorescence
- G01N21/645—Specially adapted constructive features of fluorimeters
- G01N21/6456—Spatial resolved fluorescence measurements; Imaging
- G01N21/6458—Fluorescence microscopy
-
- G—PHYSICS
- G01—MEASURING; TESTING
- G01N—INVESTIGATING OR ANALYSING MATERIALS BY DETERMINING THEIR CHEMICAL OR PHYSICAL PROPERTIES
- G01N21/00—Investigating or analysing materials by the use of optical means, i.e. using sub-millimetre waves, infrared, visible or ultraviolet light
- G01N21/62—Systems in which the material investigated is excited whereby it emits light or causes a change in wavelength of the incident light
- G01N21/63—Systems in which the material investigated is excited whereby it emits light or causes a change in wavelength of the incident light optically excited
- G01N21/64—Fluorescence; Phosphorescence
- G01N2021/6417—Spectrofluorimetric devices
- G01N2021/6419—Excitation at two or more wavelengths
-
- G—PHYSICS
- G01—MEASURING; TESTING
- G01N—INVESTIGATING OR ANALYSING MATERIALS BY DETERMINING THEIR CHEMICAL OR PHYSICAL PROPERTIES
- G01N21/00—Investigating or analysing materials by the use of optical means, i.e. using sub-millimetre waves, infrared, visible or ultraviolet light
- G01N21/62—Systems in which the material investigated is excited whereby it emits light or causes a change in wavelength of the incident light
- G01N21/63—Systems in which the material investigated is excited whereby it emits light or causes a change in wavelength of the incident light optically excited
- G01N21/64—Fluorescence; Phosphorescence
- G01N2021/6417—Spectrofluorimetric devices
- G01N2021/6421—Measuring at two or more wavelengths
-
- G—PHYSICS
- G01—MEASURING; TESTING
- G01N—INVESTIGATING OR ANALYSING MATERIALS BY DETERMINING THEIR CHEMICAL OR PHYSICAL PROPERTIES
- G01N21/00—Investigating or analysing materials by the use of optical means, i.e. using sub-millimetre waves, infrared, visible or ultraviolet light
- G01N21/62—Systems in which the material investigated is excited whereby it emits light or causes a change in wavelength of the incident light
- G01N21/63—Systems in which the material investigated is excited whereby it emits light or causes a change in wavelength of the incident light optically excited
- G01N21/64—Fluorescence; Phosphorescence
- G01N21/6428—Measuring fluorescence of fluorescent products of reactions or of fluorochrome labelled reactive substances, e.g. measuring quenching effects, using measuring "optrodes"
- G01N2021/6439—Measuring fluorescence of fluorescent products of reactions or of fluorochrome labelled reactive substances, e.g. measuring quenching effects, using measuring "optrodes" with indicators, stains, dyes, tags, labels, marks
- G01N2021/6441—Measuring fluorescence of fluorescent products of reactions or of fluorochrome labelled reactive substances, e.g. measuring quenching effects, using measuring "optrodes" with indicators, stains, dyes, tags, labels, marks with two or more labels
Definitions
- the present invention relates generally to fluorescence correlation spectroscopy (FCS). Particularly, the present invention relates to improved data analysis of photon arrival and photon count data typically supplied to FCS analysis by utilizing Photon Arrival time Interval Distribution (PAID) analysis techniques.
- FCS fluorescence correlation spectroscopy
- PAID Photon Arrival time Interval Distribution
- FCS-related methods Fluorescence correlation spectroscopy (FCS) and related single-molecule methods are important tools for the in vitro analysis of macromolecular interactions, and are potentially useful for in vivo analysis [6, 7]. FCS-related methods can detect these interactions in a distance-independent fashion, unlike FRET. [8]. FCS-related methods detect macromolecular interactions by monitoring fluorescence fluctuations that result when fluorescent molecules diffuse or flow across a tightly focused laser excitation volume (femtoliter confocal detection volume). At concentrations less than 1 nM, the average molecular occupancy of the detection volume is smaller than one, allowing the detection of photon-bursts generated by single molecules. This is commonly referred to as the "low occupancy" regime.
- a "photon burst” is the set of all photons detected from a single molecule during its transit through the confocal detection volume. Analysis of these photon-bursts has been used to measure the distribution of molecular properties, such as fluorescence lifetime, polarization anisotropy, and fluorescence resonance energy transfer (FRET) [9-12]. At concentrations between 1 nM-100 nM, the molecular occupancy is still low enough to be sensitive to the addition or subtraction of one molecule within that volume. This is referred to as the "intermediate occupancy" regime.
- the resulting fluctuating fluorescence signal contains dynamic information about several processes such as translational diffusion [13], rotational diffusion [14], intersystem crossing to triplet states [15], and photobleaching [16].
- concentrations greater than 100 nM many molecules occupy the detection volume and the fluctuations are averaged out. This is known as the "high occupancy" regime.
- the primary drawback of using FCS-related methods for monitoring macromolecular interactions is the dynamic range over which binding can be detected. These methods are most sensitive in the nM concentration regime, whereas binding constants of protein- protein interactions often correspond to higher concentrations (this limitation is partially offset by the ability of FCS-related methods to detect small subpopulations).
- FIG. 1 shows how the properties of the sample translate into features of the fluorescence signal for a detection volume with low occupancy. Macromolecular interactions such as homo-dimerization and aggregation can be measured using single-channel methods.
- Fig. IA depicts a single-channel measurement on a sample containing a mixture of monomers carrying one yellow fluorescent label and tetramers carrying four yellow fluorescent labels in solution. The laser excitation profile (shown in green) and the detection pinhole define the effective detection volume. As these molecules diffuse in and out of the laser excitation profile, bursts of fluorescence photons are detected, shown as an intensity time trace to the right.
- the three basic characteristics of a single- channel photon burst are: (1) the brightness of the bursts (blue arrows), which is proportional to the number of fluorescence labels detected, (2) the duration of the burst (red arrows), which is related to the diffusion time of the molecule across the laser beam, and (3) the time between bursts of the same species (green arrows) which is inversely proportional to the concentration of that species.
- the same characteristics apply for the fluctuation analysis used at higher concentrations (intermediate occupancy).
- the fluorescence signal from an interacting pair of molecules or an aggregate has different characteristics than that from a free single molecule.
- the complex or aggregate has a larger hydrodynamic radius, which results in a longer diffusion time.
- FCS Fluorescence Correlation Spectroscopy
- PCH Photon Counting Histogram
- FIDA Fluorescence Intensity Distribution Analysis
- FIDA has been used to probe receptor-ligand interactions in a format compatible with ultra-high throughput screening [29, 30].
- the PCH and FIDA methods contain information about the brightness and occupancy of fluorescent species, but lack the information on dynamics contained in the correlation function.
- FCS and PCH or FIDA on the same data set to extract both the brightness and diffusion time [31].
- a method that simultaneously tracks diffusion time and brightness is necessary to address such heterogeneous samples.
- Fluorescence Intensity Multiple Distribution Analysis By using a series of photon count histograms with multiple time bin widths, it is possible to obtain the same temporal information as FCS while gaining the information on brightness [32, 79]. This is because the shape of the photon count histogram is affected by the fluctuations that occur on the time scale of the time bin width. This method is termed Fluorescence Intensity Multiple Distribution Analysis (FIMDA). Macromolecular interactions can be tracked using FIMDA by monitoring brightness and diffusion time simultaneously.
- FCS concentration and diffusion time (and other temporal dynamics), but not brightness
- FIMDA concentration, brightness, and diffusion time (and other temporal dynamics).
- Multiple-channel data reduction and analysis Coincident detection of two fluorophores of different colors is a more sensitive indicator of binding events than brightness or diffusion time used in single-channel studies [8]. This is because: (1) coincident bursts are only detected when two molecules are associated, (2) it is less sensitive to quenching of fluorescence, and (3) coincident detection in two channels benefits from the properties of ratiometric measurement.
- Dual-color cross-correlation FCS In dual-color cross-correlation FCS, interactions between molecules labeled with two different colors are monitored using the cross-correlation amplitude [8, 33-35]. Significant correlation amplitudes result only when a diffusing species contributes to both channels.
- Ratiometric single-molecule methods [multi-parameter fluorescence detection (MFD), two-dimensional fluorescence intensity distribution analysis (2D-FDDA), single-pair Fluorescence Resonance Energy Transfer (spFRET)]: Photon burst analysis based on ratiometric methods has been developed for monitoring FRET, polarization anisotropy, and spectral fluctations [11, 36]. If the distance between two labeled molecules is in the 2-8 nm range, FRET can be used to monitor the interaction. For example, single-pair FRET has been used to monitor the cleavage of DNA by a restriction enzyme in solution [12].
- MFD Multi-parameter fluorescence detection
- 2D-FIDA perform tasks similar to the ratiometric single-molecule methods, with additional capabilities.
- MFD has the additional ability to measure fluorescence lifetime [9, 37, 38], and can also be used to obtain the brightness information available with PCH and FIDA [10].
- the single-molecule measurements with fluorescence lifetime were performed with a single detector, although now they have been extended to multiple channels.
- 2D-FIDA is the extension of the single-channel FIDA method described above to two channels. In extracting the occupancy and brightness in each channel, it takes advantage of both the ratiometric and brightness information. It can be used for samples in the low and intermediate occupancy regimes [39]. [0020]
- Cross-correlation FCS extracts coincidence, concentration and diffusion time (and other temporal dynamics), but not brightness
- MFD can detect coincidence and extract brightness and ratiometric information for multiple channels, and diffusion time, however, it can only work with low occupancy samples
- 2D-FIDA can detect coincidence, and extract brightness and ratiometric information for multiple channels. It can work with low and intermediate occupancy samples, but does not extract diffusion time (or other temporal dynamics).
- PAID a new multi-dimensional data analysis method termed PAID that allows the extraction of information about temporal fluctuations (diffusion), brightness, and coincidence between multiple channels in a unified manner, so that all of the characteristics of each species can be used for identification and for separation from other species.
- PAID also presents a convenient visual representation of the data that is useful because it focuses on photon-rich regions.
- Photon Arrival time Interval Distribution is a new method for monitoring both molecular and macromolecular interactions capable of independent and simultaneous determination of coincidence, brightness, diffusion time, and concentration of fluorophore-labeled molecules undergoing diffusion within a confocal detection volume. The method is based on recording the time of arrival of all detected photons, and then forming a multi-dimensional histogram of photon pairs, where one axis is the time interval between two photons and the second axis is the number of other photons detected between that photon pair.
- PAID is related to cross-correlation Fluorescence Correlation Spectroscopy (FCS) by a projection of this histogram onto the time axis.
- FCS Fluorescence Correlation Spectroscopy
- PAID extends cross-correlation FCS by measuring brightness in addition to diffusion time. Data-fitting analysis based on Monte Carlo simulations of diffusion paths through the detection volume is provided that can be used to simultaneously extract brightness, diffusion time, and concentration from experimental and simulated data. The performance of PAID was compared to other FCS-related methods, such as FIDA, PCH, FIMDA and cross- correlation FCS. The statistical accuracy of the parameters extracted using PAID compares favorably with the FCS-related methods, while providing additional information.
- FCS-related methods such as FIDA, PCH, FIMDA and cross- correlation FCS.
- the present invention provides methods for analyzing/monitoring the properties of molecules, including marcromolecule, that are labeled with fluorophores.
- the method uses a detector to detect a plurality of photons in a photon burst or other photon stream. The arrival time of each of the detected photons is determined. The interval of time between various photon pairs is then determined to provide photon pair intervals. The number of photons that have arrival times within the photon pair intervals is also determined. The photon pair intervals are then used in combination with the corresponding counts of intervening photons to analyze properties and interactions of the molecules including brightness, concentration, coincidence and diffusion.
- FIG. 1 is a diagrammatic representation of the detection of macromolecular interactions using fluorescence fluctuation signals.
- FIG. IA left panel two monomers and a tetramer of a fluorescently-labeled species traverse the laser excitation profile (in green).
- FIG. IA right panel corresponding fluorescence bursts along with their major properties: width (red arrows; related to the size of species); height or intensity (blue arrows; related to the number of fluorophores on species); and time interval between bursts from identical species (green arrows; related to the occupancy of species).
- red arrows related to the size of species
- height or intensity blue arrows; related to the number of fluorophores on species
- time interval between bursts from identical species green arrows; related to the occupancy of species.
- IB left panel two different molecules (one labeled with a red fluorophore, and the other with a yellow fluorophore) interact to form a complex.
- free species emit only in one color; complexes emit in both colors.
- Coincident detection of red and yellow fluorescence indicates a complex.
- FIG. 2 is a schematic representation of exemplary instrumentation that is used for two-color cross-correlation measurements.
- Two laser sources (514 and 633 nm) are introduced into an inverted microscope; reflected by a dichroic mirror (DM1), and focused into a sample cell assembled using two glass coverslips separated by a lmm-thick silicone gasket by a 1.3 NA oil-immersion objective. Fluorescence from the sample is collected through the objective, transmitted through DM1, and focused onto a pinhole (PH) by the microscope tube lens (LI). After a second lens (L2), the fluorescence is split by a dichroic mirror (DM2) into red and yellow channels.
- DM1 dichroic mirror
- Red and yellow fluorescence pass through bandpass filters (BP1 and BP2, respectively), and are detected using APD1 and APD2, respectively.
- the APDs emit an electronic pulse for every photon detected, and the pulses are time- stamped using a counter-timer board and stored in a PC (the timed photons are represented in the figure as bars where the color of the bar represents whether the red or yellow channel detected the photon).
- FIG. 3 shows how a PAID histogram in accordance with the present invention is generated.
- FIG. 3A depicts photon streams from 3 channels (start, stop, and monitor). Time axis is shown in discrete clock units. A filled square indicates photon detection at that specific time position. Start photons are identified with different colors, stop photons with different letters, and monitor photons with different numbers. Each photon in the start channel is paired with each stop-channel photon occurring later in time.
- FIG. 3B depicts a PAID histogram, x-axis, time interval between the start and stop photons; y-axis, number of monitor photons counted in the time interval between the start and stop photons.
- Example photon pair the blue start photon is paired with stop photon "d".
- the time interval between these two photons is 7 clock units, and there are 3 monitor photons (numbers 1,2, and 3) between them.
- the corresponding entry into the histogram in B is coded with the blue background and the letter "d".
- FIG. 4 depicts the generation of 2D-PAID histograms with log time-interval axis and log or quasi-log monitor photon count axis.
- FIG. 4A photons detected in the start, monitor, and stop channels (filled squares) in the time axis (shown with discrete clock units, FIG. 3).
- the time interval bins are shown as gray and white bands between the start channel and the monitor channel.
- the bins are log-spaced, with 2,4,8,16,...clock units.
- the monitor photon count bins are shown as gray and white bands between the monitor channel and the stop channel.
- bins are also log-spaced, with 1,2,4,8,... photon counts.
- the gray and white bands below the stop photon channel show how the time interval and monitor photon count bins combine to form the two-dimensional histogram bins.
- Each bin is labeled with the number of stop photons counted within the bin, subsequently transferred to the histogram in FIG. 4B.
- FIG. 5A shows the structure of the arrays with quasi-logarithmic spacing used for fast convolutions.
- FIGS. 5B and 5C illustrate how the convolution of two series of such arrays is performed.
- FIG. 5D the convolution of two-step functions is shown.
- FIG. 6 shows the effects of changes in the characteristics of diffusing molecules on the single-channel PAID histogram.
- the diffusion time is r
- D 100 ⁇ s
- FIGS. 6B-F illustrate how changes in the parameters of the diffusing species, the background count rate, and the sample composition affect the PAID histogram.
- FIG. 6B the occupancy is increased 10-fold, c[ - 10 x c, .
- FIG. 6G autocorrelations, corresponding to the collapse of the PAID histograms in FIGS. 6A-F onto the time interval axis, are shown for comparison with FCS.
- FIG. 7 shows an exemplary PAID fit from Table 1.
- the PAID histogram for the simulation is depicted (parameters as in Fig. 6A).
- FIG. 7B shows the fitted PAID histogram.
- FIG. 7C shows horizontal slices of PAID histograms.
- FIG. 7D shows vertical slices of PAID histograms. Slices of the simulation, black; slices of the fit, red.
- FIG. 8 shows dual-channel PAID histograms for simulations containing the species expected in an interaction study. Symbols r and y, red and yellow fluorophores, respectively. R and Y, red and yellow detector channels, respectively. FIGS.
- FIGS. 8B, E, H, and K the mixture does not contain the complex (A y B r ) present in FIGS. 8A, D, G, and J.
- FIG. 9 shows two-channel, two monitor channel PAID histograms for the same simulations as in Fig. 8.
- the red channel is assigned as the start channel and the first monitor channel along the horizontal axis.
- the yellow channel is assigned as the stop channel and the second monitor channel along the vertical axis. Because the start and stop channels are assigned to different channels, these histograms emphasize the species that emits in both channels, the complex.
- FIG. 9A both free species and complex are present.
- ⁇ - I ras slice, a cartoon of each diffusing species is placed next to the contribution from that species.
- FIG. 9B the complex is absent.
- FIG. 10 shows dual-channel PAID histograms for samples containing species of labeled DNA fragments corresponding to those expected in an interaction study.
- the histograms chosen are the same as in FIGS. 8A, D, G, and J, are PAID histograms RYR, RRR, RRY, and YYR of a DNA Cy5,1T , DNA Cy3 ' 65B , and DNA cy5, ⁇ /cy3,6 5 B mi ⁇ ture
- FIGS 10Bj Ej Hj and Kj are p AID histograms of a
- FIG. 11 A is the PAID histogram for the data.
- FIG. 1 IB is the fit to PAID histogram (1 of 8 histograms fitted simultaneously). Horizontal slices of both are shown in FIG. 11C, and vertical slices are shown in FIG. 11D. The slices of the simulation are shown in black with error bars, and the slices of the fit are shown in red.
- FIG. 12 shows fluorescence-based gel images showing the major species present in RNAP+DNA samples.
- Image A shows species with TMR-based signals (532 excitation, 585BP60 emission); species identified as aggregates (found in the wells of the gel), RNAP-DNA complex and ⁇ -associated species are visible.
- Image B shows species with Cy5-based signals (633 excitation, 650LP emission); species identified as RNAP-DNA complex and DNA are visible.
- Image C shows an overlay of images A (green color) and B (red color); coincidence of red and green signal is shown as orange. The only species showing coincidence is the RNAP-DNA complex.
- FIG. 13 is an illustration showing flow of PAID model calculation.
- the kernels are stretched using the scaling law in Eqs. (36) and (46).
- the expressions k aS ⁇ pm ( ⁇ (r) are calculated using Eqs.
- Equation (77) is used to sum over all species, and then the final expression is obtained by converting from cumulative intensity space to photon count space (described at end of section 2.4.3). During a model fit, this final expression is compared with the data (for example by calculating ⁇ 1 ), then the model parameters are adjusted.
- PAID in accordance with the present invention is based on the discrete format of single photon-timing data (Fig. 2), which treats signals as photons streams, rather than analog signals.
- Fig. 2 single photon-timing data
- APDs avalanche photodiode detectors
- streams of electronic pulses corresponding to single photons are generated, and the arrival time of each pulse is recorded, resulting in streams of photon-arrival times, where t M is the arrival time of the / th photon from APD-channel A.
- the photon stream is represented as a sum of Dirac delta functions (which allow representation of discrete events over the continuous variable (t):
- N ⁇ is the total number of photons detected in channel A ; the number of
- FCS and FCCS the relationship between a photon stream at one time I s (t) and a second photon stream at a later time I ⁇ (t+ ⁇ ) as a function of the time interval ⁇ is measured using the cross-correlation (auto-correlation is a specialization of this function),
- angle brackets can be evaluated as time averages: (•••) -» lim — _ ⁇ -") -
- Eq. (3) is converted into the following histogram used to estimate the cross-correlation (the hat denotes an estimator)
- the cross-correlation histogram can be viewed as a distribution of time intervals between photon arrivals (since swapping the roles of I s and I ⁇ is equivalent to changing the sign of ⁇ , we can specify ⁇ > 0 without loss of generality).
- PAID adds a new photon-counting dimension n to the cross-correlation histogram of FCS, showing the contribution of each species to the cross-correlation amplitude.
- the number of photons n M that arrive between times t Si and t TJ are counted (Eq. (4)) in an additional photon stream I M (t) (the "monitor" photon stream), with photon arrival times t l M. k •
- I M (t) is formally distinct from/ s and I ⁇ , but can be set to be identical to one or both.
- the cross-correlation estimate is spread over the photon- counting dimension n , providing an additional history of the interval between the detection of the start and stop photons.
- the PAID function is
- This fimction can be graphed in two dimensions (n and ⁇ ), where the additional n axis slices the cross-correlation into strips with different numbers of counted monitor photons along the vertical axis.
- the PAID function acts as a photon-count distribution of correlations.
- Eq. (6) can be estimated by a digital double summation histogram
- the PAID histogram C STM ( ⁇ ,n) describes the distribution of count rate in the stop channel over the number n of intei ⁇ ening photons in the monitor channel within a time interval ⁇ since receiving a start photon.
- Fig. 3 shows how a PAID histogram is formed from the start, stop, and monitor photon streams using Eq. (7).
- log or quasi-log axes are used for the histograms.
- This special case of the PAID histogram is written for a finite experiment of duration T ,
- This PAID histogram is the series of waiting-time distributions to the n* photon (useful concept for autocorrelations that cannot be extended to cross-correlations); similar constructions with a single value of n were used as criteria in sifting for bursts [10].
- Equation (7) is extended to include higher order temporal correlations, or more monitor photon streams, by adding factors of the form ⁇ ( ⁇ 2 ,t ⁇ J -t Sj .) for temporal correlations, and factors of the form for additional monitor photon streams (S 2 , T 2 , and M 2 : additional formal photon streams; n 2 and ⁇ 2 : additional photon counting and time interval variables).
- Higher-order temporal correlations are useful for monitoring non-Markovian dynamics [41], and multiple monitor photon count axes in a single histogram can take advantage of ratiometric measurements for better separation of species.
- Bin specification and normalization for PAID histogram When forming a PAID histogram for the large number of photons obtained in fluorescence fluctuation experiments, it is more meaningful to place events in bins than to make a scatter plot. In choosing the size and spacing of bins, one needs to consider that fluorescence fluctuations occur over a large range of time scales. To cover a large range of time scales with a minimum number of histogram bins, log or quasi-log time bins are commonly used in FCS. For the PAID histogram, one chooses the bins for the time interval ⁇ axis to be log-spaced, with 10 bins per decade.
- Efficient algorithms for constructing PAID histograms A direct algorithm to form PAID histograms from photon streams compares each photon from the start channel with each photon in the stop channel, then calculates the number of monitor photons that fall between each start and stop photon. If there are N j photons in the start channel, and N T photons in the stop channel, there are
- This algorithm uses the fact that the start, stop, and monitor channels are ordered lists (each successive photon is at a later time) by performing binary searches.
- a modified search algorithm that uses increments of increasing size from the initial search index to bracket the desired value before performing a standard binary search was found to be most effective (see description of hunt in [44].) Also, because of the log spacing on both axes, a small number of binary searches can cover a large dynamic range. The algorithm is extendable to multiple monitor channels.
- the tightly-focused laser excitation and detection pinhole define the effective detection volume F eff .
- Exc(x) is the excitation profile of the laser beam
- CEF(x) is the collection efficiency function of the collection optics [45].
- V el ⁇ is defined by the detectivity, which is the product of the excitation and detection efficiency :
- V eS For simulations, a Gaussian detectivity is assumed
- the only parameter is [k 0A ] , the count rate in each channel.
- PAID histograms are fitted to extract all the listed parameters for the diffusing species.
- Other properties extractable from fluorescence fluctuation measurements based on extensions of PAID modeling, include rates for intersystem crossing, triplet-state lifetimes, photobleaching rates, singlet-state lifetimes, and photon antibunching [46].
- Application of PAD3 to molecular interactions The simplest molecular interactions are those between two species A and B, each with only one interaction site for the other.
- K d [A][B]/[AB], where K d is the dissociation constant [47].
- Macromolecular interactions are studied by fitting PAID histograms and extracting occupancy, diffusion time, and brightness for A, B, and AB. Since occupancies are directly proportional to concentration of species, they can be used to assess the affinity of the interaction; e.g., the K ⁇ j can be determined by applying PAID to a series of measurements using increasing concentrations of B with respect to A.
- the F diffusing species are A, B, and AB.
- a and B are labeled with the same fluorophore, they are distinguishable from AB because of differences in brightness (AB carries two fluorophores whereas A and B carry only one), and diffusion time. If A and B are labeled with fluorophores with distinct emissions detected by two different detection channels, they are also distinguishable from AB because of the difference in the relative number of photons detected in each channel (AB carries both fluorophores and is detected in both channels, whereas A and B carry only one and are detected in only one channel; see Introduction).
- the encounter rate of any molecule of species A with molecules of the species B is s "1 , >100-fold slower than typical diffusion times.
- the encounter rate of any molecule of species B with molecules of the species A is also /c encounter ⁇ lO s "1 .
- the dissociation rate k_ must be similar to or slower than the encounter rate. So, at nM concentrations, any association or dissociation events are extremely rare within the diffusion timescale, therefore, one only observes A, B, and AB (but not any association/dissociation events) and can treat the diffusing species as "static" species.
- Model for PAID The model for the PAID function will now be described in detail. As an introduction, a general outline and the guiding principles of the model are given, which are used to fit the data using non-linear least squares method.
- the expressions for single molecules are approximated by Monte Carlo simulation of possible diffusion paths through the confocal detection volume [48].
- a scaling law is used to model changes in brightness or diffusion time (Eq. (36) and Eq. (46)).
- the confocal detection volume is set as an analytical Gaussian detection volume, as a numerical approximation, or as an experimentally measured detection volume, allowing the direct application of the expected detection volume to the model.
- the PAID model is able to account for the possible diffusion paths through that volume, in contrast to either FIDA or FIMDA [24, 32].
- FIDA or FIMDA only the volume density for a given brightness value is required. This indeed simplifies these two models, but comes at the expense of not being able to model the possible diffusion paths.
- a model of the PAID function in accordance with the present invention is provided for several species of diffusing molecules with a Poisson background in a tightly focused laser excitation volume.
- the PAID function is expressible in terms of the photon counting probability distributions and the PAID function for single molecules.
- the photon count probability distribution and the PAID function for single molecules are expressed in terms of four path integrals, which estimate using Monte Carlo simulations of diffusion paths. These path integrals need only be calculated once; changes in the diffusion time and brightness parameters can be accounted for by a scaling law. This means that, although the model is not expressed in closed form, it can still be used in a fitting routine.
- CEF(x) in general varies as a function of detection wavelength. For simplicity, one uses the same Exc( ) and CEF(x) for each excitation and each detection wavelength.
- the detectivity is defined as the product of the excitation and detection efficiency profiles ⁇ (x) - ⁇ Exc(x)CEF(x) .
- ⁇ (x) exp ⁇ -2(x 2 + y 2 )/ ⁇ 2 -2z 2 /I 2 I , where -y is the l/e 2 width of the confocal volume in the x and ⁇ directions, and / is length of the volume in the z direction.
- confocal detection volume for the oil immersion objective described below. With the new definitions, Eq. (11) can be written
- the effective detection volume is defined as in [20, 22, 49]:
- the occupancy c a is the average number of molecules of species a within the detection volume. If there are N a molecules of the diffusing species a > 0 in solution, and the volume of the solution isV ⁇ , ] V eff , then the following relationship
- the average count rate k aA from a diffusing species a in detection channel A is the product of the occupancy c a and the average brightness q aA .
- the total average count rate in detector A is the sum of the average rate of photons of all species and background
- the probability that a start photon is received from the molecule at a specific spatial position is directly proportional to the intensity in the start detection channel of the molecule at that position. So, the probability distribution V (x) for the position of a molecule of species a when it emits a photon can be obtained by dividing the intensity ⁇ aS (x) by its integral over all space,
- dV dxdydz is an infinitesimal volume element. This expression assumes that there is no triplet state saturation, and that there is no significant diffusion within the fluorescence lifetime.
- corr means correlated, signifying that the subsequent photons coming from this molecule are correlated with the start photon.
- the cross-correlation measures the average rate of photons received in the stop detection channel T upon receiving a photon in the start detection channel S , normalized by the average count rate in the stop detection channel.
- the main task in calculating the cross-correlation we obtain the average rate of receiving stop photons from a source ⁇ a time interval ⁇ after receiving a start photon from source c. ,/c ⁇ S ⁇ jSJ ( ⁇ ) . This is the rate averaged over all possible initial spatial positions as well as all possible later spatial positions.
- the density of molecules at a later time can be calculated by integration against the Green's function for three-dimensional diffusion of species ⁇ [50],
- the total count rate on the stop detector T for photons coming from molecules of species ⁇ given that the start photon was from species , k aS ⁇ r (r), is equal to the integral over space of the number density for molecules of species ⁇ multiplied by the intensity in the stop photon stream of a molecule of species ⁇ as a function of spatial position lg j , (x) :
- the first term is the contribution of the uncorrelated molecules of species ⁇ that did not emit the start photon.
- Equations (25) and (26) give us the average count rate in the stop detector channel T given that a photon was received in the start detector channel S from source . These can be used to calculate the cross-correlation function by summing k a ⁇ ( ⁇ ) over all sources/? , as well as all possible sources a for the start photon.
- the probability distribution for the initial position is given by Eq.
- the probability for the path / is obtained by multiplying the probability density for the initial position by the transition probabihty to every subsequent position spaced by a time interval ⁇ r .
- the transition probability is the Green's function for three- dimensional diffusion given in Eq. (21).
- This equation gives the rate of change in the probability that n photons have been detected at a time r .
- the first term on the right gives the increase in this probability due to a photon detected when n - 1 had previously been received.
- the rate of such photons is given by multiplying the total count rate ⁇ ⁇ m ( ⁇ ) by the probability to have detected n -1 photons, l ? ⁇ M (n -l
- the second term gives the decrease in the probability to have detected n photons due to a photon detected when n had previously been detected.
- the rate of such photons is given by multiplying the total
- Equation (30) is an infinite series of coupled first order differential equations.
- the photon count probability distribution at a time r for a particular path depends only on the cumulative intensity A ⁇ M ( ⁇ ) , which depends on the history of the intensity path in a way not seen with the cross-correlation in the previous section. There, the evolution of the instantaneous spatial probability distribution was sufficient to calculate the correlation function. Here, it is necessary to know not only the probability distribution for where the molecules are at the time intervals , but where they have been since the start photon was detected.
- Photon count probability distribution for all paths of a single molecule When all possible intensity paths are taken into account, the photon counting probability distribution for a molecule of species/,?, 'P ⁇ (n
- --) is the Poisson transform ofP ⁇ (A
- There are two possible spaces to work in the photon count n -space and the cumulative intensity A -space. Functions in A space are denoted with a tilde.
- r) is given by the expression
- a scaling in the time interval ⁇ axis accounts for a change in diffusion time in that expression.
- the scaling in A is also necessary since A ⁇ Ml ( ⁇ ) is a cumulative integral over time which increases proportionally with a scaling in the time interval axis. If l ⁇ M ( ⁇
- Photon count probability distribution for all molecules in solution The photon count probability distributions for single molecules is combined to obtain the photon count probability distribution for all molecules in solution.
- the molecules are assumed to be non-interacting (at least within the diffusion time), so one can assume independence when the photon count distributions are combined. This means that the photon count distribution for the combined source of all molecules and background is the convolution of the photon count distributions for all molecules and background (section 2.4.1.8).
- the photon count distribution of probability for all molecules in solution given that molecule h - 1 of species a emitted a start photon is then,
- the weighting factor - ⁇ - is the probability that the start photon came from k s source a .
- FIMDA uses a series of photon counting histograms with different time bin widths to extract the occupancy, diffusion time, and brightness of several diffusing species simultaneously.
- a modification of Eq. (39) can be used to model the FIMDA histogram.
- PAID a photon is received at the start of each counting interval. Because of this, there is a distinction between correlated and uncorrelated molecules. However, in FIMDA, the start of the counting interval is uncorrelated with the photon sequence. If the correlated photon count distribution in Eq. (39) is removed, one obtains a model for the FIMDA histogram. The single-molecule photon count distributions used in this model are calculated as described above.
- Photon count distribution of stop channel intensity for a single molecule in solution To model the PAID function, one can combine the expressions for the photon count distribution with the cross-correlation given in the previous sections. The primary task is to calculate the distribution of the intensity in the stop detection channel TOver the monitor photon count variable n at a time interval ⁇ ,
- r) is related to the PAID function considering only a single species ⁇ by a constant factor: a normalization is applied t0 s ⁇ ⁇ TM ( n ) > similar to Eq. (27),
- the monitor photon count distribution of the stop channel intensity is calculated by multiplying the rate in the stop channel by the probability to have received n monitor photons, The superscript 1 indicates that the expression is for a single molecule.
- the total intensity in the stop channel is ⁇ ⁇ ( ⁇ ) .
- r) is given by Eq. (28), and S is the set of paths from all initial positions to all final positions after a time interval ⁇ .
- Eq. (43) can be rewritten as an integration of the Poisson distribution against the contribution to the stop channel intensity for a given value of cumulative intensity A ,
- PAID function for all molecules in solution To account for all of the other molecules in solution, 1 k ⁇ Mr convolved with the photon count probability distribution for all other molecules and background. If the molecule in question emitted the start photon, then
- the first factor is the background photon count probability distribution.
- the second factor is the monitor photon count distribution of stop channel intensity for the molecule that emitted the start photon.
- the rest of the factors come from the molecules of all the species that did not emit the photon.
- the pre-factor is how many molecules of species ⁇ there are in solution.
- the first convolved factor is the background photon count probability distribution.
- the second convolved factor is the monitor photon count probability distribution for the molecule that emitted the start photon.
- the third convolved factor is the monitor photon count distribution of stop channel intensity for the molecule of species /? that did not emit the start photon.
- the rest of the convolved factors come from the molecules of all the species that did not emit the photon.
- the first factor is the monitor photon count distribution of stop channel intensity for the background.
- the second factor is the monitor photon count probability distribution for the molecule that emitted the start photon.
- the first term on the right is for any contribution that is correlated with the start photon, and the second term is for the contribution that is uncorrelated with the start photon.
- n 2 n-n j .
- the probability to have n. counts from source 1 isP. (n. )
- n. ) P 2 (n -n. ) , and Eq. (54) reduces to a convolution,
- r) ⁇ f(n'
- r) (56) n' 0
- Each source may be a single molecule, or more than one molecule.
- the monitor photon count distribution of the stop channel intensity is calculated by multiplying the rate in the stop channel by the probability to have received n momtor photons,
- the total intensity in the stop channel is ⁇ T ⁇ ⁇ ) as a function of time interval ⁇ .
- ⁇ ) gives how much of that intensity on average is detected for a given value of monitor photon counts n .
- r) is interpreted similarly.
- the monitor photon count distributions of the stop channel intensity are weighted averages over all paths of k M l T ⁇ (n
- r) is the probability for a given intensity path?/
- S 1 is the set of all intensity paths from up to a time interval?: .
- r) and S 2 are defined analogously.
- the momtor photon count distribution of the stop channel intensity is calculated by multiplying the rate in the stop channel by the probability to have
- z") is k MT ⁇ n ⁇ ⁇ O ( ⁇ )V 1 ( ⁇ ) 2 O ( ⁇ )P 2 ⁇ k MT ⁇ (n ⁇ ) (65)
- the monitor photon count probability distribution for the combined source is the convolution of the distributions for the individual sources.
- This equation convolves the monitor photon count distribution of stop channel intensity for each source with the photon count distribution of the other, and then adds the results.
- This equation along with Eq. (66) can be applied successively to combine many sources,
- This expression is used in this description to combine the monitor photon count distributions of stop channel intensity for all of the molecules in solution.
- ⁇ r ( A ) > 1 KM ( ⁇ ) and 1 K M ⁇ ⁇ A ⁇ T ) for the standard species ⁇ are evaluated using Monte Carlo generation of possible diffusion paths / , a modification of the simulations described.
- the uncorrelated distributions are formed from simulations restricted to a finite box of size V bm wit periodic boundary conditions. Since the probability density for the initial uncorrelated spatial position is a constant with respect to spatial position, the size of the simulation box must be restricted to have a significant number of diffusion-driven crossings of the detection volume. The periodic boundary conditions are necessary to avoid a drain in the number of the molecules from the simulation box. For the correlated distribution, there is no restriction on the simulation box size.
- the probability density for the initial correlated spatial position is restricted to the detection volume, and the exit of the molecule from the region of the detection volume causes the average number of molecules per detection volume to return its uncorrelated value.
- the joint probability for the whole path up to time interval ⁇ is given by the following expression (Eq. (28) without the limit):
- the cumulative intensity ⁇ At each time interval ⁇ in the logarithmically spaced series, the cumulative intensity ⁇
- An entry of 1 is entered at the corresponding ( ⁇ " , ⁇ ) bin in the cumulative intensity probability distribution, 1 P ⁇ ( ⁇
- an entry ⁇ ⁇ Tl ( ⁇ ) is added to the corresponding ( ⁇ , ⁇ ) bin in the cumulative intensity distribution of stop channel intensity, ( ⁇
- Eqs. (49)-(52) are used to calculate the monitor photon count distributions of stop channel intensity for all of the categories of molecules. For each diffusing species ⁇ > 0, there is a distribution for the correlated and uncorrelated molecules.
- the simulations used to form the distributions for correlated initial positions are not restricted to a finite simulation box. Initially, the molecules are inside the detection volume, but the molecules are allowed to diffuse out of the detection volume without restriction as the simulation time passes. Because the size of the simulation box is unrestricted, the difference between N and N r - ⁇ ( ⁇ , ⁇ ) is ignored: in Eqs. (49)-(52), the expression ⁇ ( ⁇ , ⁇ ) is dropped. [0096] The simulations used to form the distributions for uncon-elated initial positions are restricted to a box with a volume V box , which is larger than the effective detection volume: V bm ⁇ V eS . The box has harmonic boundary conditions, so that a molecule that comes out of one side reenters the other side. The fundamental concentration for the distributions formed from these simulations is . Successive convolution of the distribution 'P ⁇ ( ⁇
- Equation (50) which is for the uncorrelated molecules, is rewritten
- Equation (51), which is for the background, is rewritten
- N box ⁇ is not an integer
- This keeps the total count rate from the species ⁇ constant, while using the closest integer for the number of molecules in the simulation box.
- the adjusted value for the brightness q ⁇ ' M is used only for the expressions for the uncorrelated molecules, not the con-elated molecules.
- the kernels used as the basis for the model have finite sized bins in A , which are indexed by b and have . Because of the finite bin size,
- the interpolated values are averaged over the rectangle ⁇ bounded by ⁇ min , ⁇ max , A b min , and ⁇ ax . Note that more than one bin may contribute to the averaging.
- the integral on the right can be expressed in terms of the incomplete gamma
- the bin spacing is kept fixed, so the integrals in Eq.(80) need to be performed only once to create the matrix.
- Fig. 5 A The structure of these vectors is shown in Fig. 5 A.
- the arrays are of length 8 (rather than 64) for each factor of 2 in resolution.
- the array with the smallest spacing is shown at the left.
- the first four elements are each made up of a sum of two elements from the first array.
- this structure to successively lower resolution one obtains a series of linearly spaced arrays that can efficiently span a large dynamic range. [0103] In Figs.
- the function to be convolved can be approximated by a series of steps; over the range of each bin, the function is assumed to be constant.
- the function is assumed to be constant.
- two such steps are convolved, one gets a triangle, shown in Fig. 5D.
- the convolution of the two steps leaks into the next bin.
- the discrete convolutions shown in Figs. 5B and 5C do not account for this because they assume that the function is nonzero only at discrete values.
- the convolution is shifted one- half bin up after each FFT-based convolution in Figs. 5B and 5C.
- D ⁇ A Preparation of D ⁇ A: We used fluorescently-labeled D ⁇ A fragments as model systems for exploring the capabilities of PAID.
- the fluorophores used were Cy3B ( ⁇ ex ⁇ 560 nm, ⁇ em ⁇ 580 nm), Cy3 ( ⁇ ex ⁇ 550 nm, ⁇ em ⁇ 570 nm) and Cy5 ( ⁇ ex ⁇ 650 nm, ⁇ em ⁇ 670 nm).
- concentration of DNA Cy5 ' 1T was determined using UN- Vis spectrophotometry and fluorescence spectrophotometry to calibrate concentrations determined from FCS measurements. Higher concentration (10-25 nM) samples were prepared for all D ⁇ A fragments, and occupancies and diffusion times were extracted using FCS as a basis for dilutions.
- R ⁇ AP and R ⁇ AP-D ⁇ A Complex were prepared from Escherichia coli R ⁇ AP core was purchased from Epicentre (Milwaukee, WI), and R ⁇ AP ⁇ subunit ( ⁇ Cys569 ) was purified and labeled at amino acid Cys569 using tetramethylrhodamine (TMR) as described [56].
- TMR tetramethylrhodamine
- R ⁇ AP holoenzyme and R ⁇ AP-D ⁇ A complexes were formed essentially as described [56], using D ⁇ A Cy5 ' 65B for the formation of the complex; the complex was diluted to 1 nM nominal concentration for the PAID measurements.
- RNAP-DNA open complex precludes FRET between the fluorophores [57].
- the sample was loaded in non-denaturing 5% polyacrylamide gels and was electrophoresed at 10 V/cm for 1 hour; the resulting gels were imaged using an x-y fluorescence imager (Molecular imager FX, Biorad, Hercules, CA) equipped with 532-nm and 633-nm excitation lasers (for excitation of "yellow” and “red” fluorophores respectively), and 585BP60 and 640LP emission filters (for detecting "yellow” and “red” channel emissions, respectively).
- x-y fluorescence imager Molecular imager FX, Biorad, Hercules, CA
- the laser excitation is focused 20 ⁇ m inside the solution by a lOOx 1.3 NA Zeiss Neofluar oil-immersion objective. Fluorescence from the detection volume is focused by the microscope tube lens (LI) on a 100 ⁇ m pinhole (PH) and split with a dichroic mirror (DM2; 630 DMLP, Omega Optical) into two detection channels: the Cy5 channel [filtered using a 650LP filter (BP1), Omega Optical], and the TMR/Cy3/Cy3B channel [filtered using a 580DF60 filter (BP2), Omega Optical].
- LI microscope tube lens
- PH 100 ⁇ m pinhole
- DM2 dichroic mirror
- Silicon avalanche photodiodes detect fluorescence photons, photon-associated electronic pulses are timed by a counter-timer board (PCI-6602, National Instruments, Austin, TX), and stored in a PC.
- PCI-6602 National Instruments, Austin, TX
- the diffusion-step-generation distribution is taken directly from the Green's function for 3D-diffusion [50].
- a series of pseudo-random numbers is generated with an exponential distribution with a decay rate ⁇ that depends on the excitation rate for the molecule's position until time ⁇ t is passed, thereby generating a series of arrival times for emitted photons; the fluorescence lifetime is assumed to be zero, thus ignoring saturation and other photophysical effects.
- a second pseudorandom number is generated to determine if the photon is detected, and, if it is, which channel detects the photon. The time of arrival and detection channel of each detected photon is saved.
- the resulting photon sequences can be subjected to any of the possible data reduction and analysis methods.
- the idealized conditions - described above are used for the simulations since they are well-modeled by each of the data analysis methods.
- Fitting routine The Levenberg-Marquardt nonlinear least squares fitting procedure [59] is used to extract the parameters from the data, calculating the necessary partial derivatives numerically.
- the model used is described in detail above.
- To estimate the standard deviation of errors we use ten independent instances of the histogram to calculate an estimate of the statistical errors of each bin. The statistical errors are used as weights in the fitting routine (this method is used for FCS in [58]. If a bin is nonzero in fewer than ten instances, it is excluded from the fit. Without this restriction, we found that only a few points dominate the value for ⁇ 2 (the ⁇ 2 merit function is not ideal for sparsely populated bins in histograms).
- the peaks of the excitation profile and detection profile were translated with respect to each other to assure good overlap in the z direction (adjustment of the pinhole or the APDs along the emission light path to maximize the signal would produce similar results).
- the size of the calculated effective detection volume is 3.2 ⁇ m 3 .
- a concentration of 1 nM corresponds to an occupancy of 1.9.
- r 25 °C
- -9 3.9xl0 "7 cm 2 /s
- RNAP holoenzyme dimensions 120x140x150 A, [57]
- the expected diffusion time is 0.9-1.1 ms.
- Fitting routine The Levenberg-Marquardt nonlinear least squares fitting procedure [59] is used to extract the parameters from the PAID histograms, calculating the necessary partial derivatives numerically. To estimate the standard deviation of errors, we use ten independent instances of the histogram to calculate an estimate of the statistical errors of each bin. The statistical errors are used as weights in the fitting routine [58]. If a bin is nonzero in fewer than ten instances, it is excluded from the fit. Without this restriction, we found that only a few points dominate the value for ⁇ 2 (the ⁇ 2 merit function is not ideal for sparsely populated bins in histograms).
- the ten independent instances were individually fitted (with a variety of initial conditions, checking for convergence), extracting the means and standard errors of the model parameters.
- the same procedure is used for FIMDA, FCS, and FIDA.
- the model used was specialized to diffusion within a Gaussian detection volume (excluding triplet state fluctuations or other dynamics).
- FIMDA histograms were formed using the same bins as the PAID histograms, and the spacing between counted intervals was set to 10 ⁇ s for all time bin widths.
- the histogram for all 300 s was fitted, and subsequent bootstrap sampling was used to obtain error estimates for the extracted parameters [64].
- the data were split into 10 30-s sections; 10 of these sections were randomly selected with replacement (the same section can be selected multiple times, or omitted).
- the PAID histograms for the selected sections were then averaged.
- Graphical representation of single-channel examples using PAID The PAID histogram in accordance with the present invention is useful simultaneous measurements of diffusion time, brightness, and occupancy.
- the autocorrelation amplitude from FCS is
- Fig. 6G shows the autocorrelations for each of the simulations in Figs. 6A-6F.
- PAID performed well in both series, with average error for each parameter ⁇ 2% (Table 1); see Fig. 7 for a representative PAID fit for a low-occupancy simulation from Table 1.
- FIMDA extracts values with accuracy similar to PAID, but with a significantly worse fit ( ⁇ 2 ⁇ 4; mainly for time delay>diffusion time [66]).
- the fits are good ( ⁇ 2 ⁇ l), and the extracted parameters are close to the simulation values (except for a 5% downward bias in the diffusion time).
- the accuracy of FCS-extracted parameters was similar to PAID and FIMDA.
- the errors of the FIDA-extracted parameters were similar to the errors found using the other methods.
- the time bin width used for the simulations was chosen to be 1/5 of the shortest diffusion time (20 ⁇ s ), since FIDA assumes the molecules are stationary during the counting interval.
- Table 1 Parameters Extracted using PAID, FIMDA, FCS, and FIDA fits for single-channel, one-component simulations in a Gaussian detection volume
- FCS fits with fixed brightness did not converge for either high- or low-occupancy simulations; significantly different results with the same ⁇ 2 were found with the same data set.
- the errors of the parameters extracted from the two-species simulations were larger for FIDA than for PAID or FIMDA.
- the measured diffusion times match well to the calculated diffusion time (710 ⁇ s).
- the measured background rates for three of the samples (0.2-0.4 kHz) are consistent with buffer-only measurements (0.24 kHz); the exception is the background in the intermediate- occupancy sample of DNA Cy3B ' 1T Cy3B ' 65B ; however, the background makes up ⁇ 1% of the signal.
- DNA Cy3B,lT DNA Cy3B,lT J)]j A Cy3B,lT;Cy3B,6SB j ⁇ j A Cy3B,lT/Cy3B,-5B DNA c, 3B , ⁇ .
- DNA Cy3B ' 1T DNA Cy3B ' 1T ,
- the occupancies are allowed to vary; the brightness values for the two components are set to be 1 and 2 times the brightness from the single-labeled species in Table 3, the diffusion times are taken from the same species, and the background is taken from separate, buffer-only measurements (not shown).
- the single-species samples only one component is fitted with a significant occupancy for most of the fits (ratio of occupancies >10:1); the only exception is the "fixed ratio fit" of the intermediate occupancy sample of DNA Cy3B ' 1T Cy3B,65B (ratio is 4:1; however, the restricted fit has a ratio of 12:1).
- the mixture samples significant occupancies are fitted for both components for all of the fits.
- the expected occupancies for the mixture By dividing the single-species occupancies (extracted in Table 3) by 2, we obtain the expected occupancies for the mixture; the expected occupancies of DNA C y 3B , ⁇ and DNA Cy3 B , ⁇ /C y 3B ,65B _ ⁇ Q respectively 0.10 and 0.07 for the low- occupancy samples and 1.1 and 1.2 for the intermediate occupancy samples.
- the occupancies extracted from the low-occupancy mixture match the expected occupancies within 10% (except the lower brightness species is fit with a 30% higher occupancy with the restricted fit).
- the occupancies extracted from the intermediate occupancy mixture are biased toward the lower brightness species (identified with DNA Cy3B,IT ; 30% and 80% higher in the fixed ratio fit and restricted fit, respectively), decreasing the amount detected in the higher brightness species (identified with DNA cy3B ' 1T/cy3B ' 65B ; 20% lower and 50% lower in the fixed ratio fit and the restricted fit, respectively).
- These biases are most likely due to inadequate modeling of the detection volume; spurious components or biases are generally the result of imperfect overlap of model and data [68]. Improvements are expected upon measurement of the confocal detection volume and modeling of additional photophysical properties of fluorophores.
- the assigmnents of the start and stop channels select species of interest, which emit photons in both the start and stop channels.
- the choice of monitor channel determmes the fluorophore which will be analyzed in terms of brightness using the PAID histogram.
- Figs. 8A, 8D, 8G, and 8J show histograms for a dual-channel experiment if background, A'' , B' , and AT.' are present.
- Figs. 8B, 8E, 8H, and 8K show the histograms if AT.' ' is absent.
- the cartoons of the free molecules and complexes indicate which species contribute to any large correlation density peak. Figs.
- the RYR, RYY, YRR, and YRY histograms determine the occupancy, diffusion time, and brightness in the 7 and R channels of A T (these are direct extensions of the cross-correlation functions used in FCCS).
- the RYR histogram monitors the brightness of r (Fig.
- Fig. 8A RYR with AT.' ' present
- Fig. 8B RYR with no AT.' "
- the correlation density peak in Fig. 8A corresponding to A T is absent in Fig. 8B (the small correlation peak in Fig. 8B corresponds to the contribution of y into R).
- the R77 histogram (not shown) monitors the brightness of;;, and is similar to RYR.
- the YRR and 7R histograms (not shown) are also similar to the RYR histogram in this case. [0127]
- a PAID histogram with two monitor channels has three axes: the time interval axis ⁇ , the number of photons in the red channel n R , and the number of photons counted in the yellow channel n y .
- Fig. 9A shows three slices of this histogram at different time intervals when A y , B r , and A' ⁇ ' " are present, and Fig. 9B shows the same three slices when A y B' " is absent.
- the histograms in Figs. 8A and 8B are the collapse of Figs. 9A and 9B, respectively, summing along the yellow monitor channel axis, while keeping the time interval and red monitor channels axes. For an isolated burst, the number of photons counted depends on the diffusion path taken through the detection volume, whereas the ratio between two channels does not.
- the fitting model can be extended to account for two momtor channels, if desired.
- Table 5 Parameters Extracted using PAID and FCCS fits for two- channel, three-component simulations in a Gaussian detection volume at low occupancy
- Table 6 Parameters Extracted using PAID and FCCS fits for two- channel, three-component simulations in a Gaussian detection volume at intermediate occupancy
- the 1 st fit (Tables 5 and 6, 3 rd column) uses PAID with all parameters unrestricted.
- the 2 nd fit (Tables 5 and 6, 4 th column) also uses PAID, with all parameters of the free components except for the occupancies being fixed.
- For the 1 st and 2 n fits all combinations of the dual- channel PAID histogram are fitted simultaneously; since each histogram emphasizes different species, parameters for all species can be extracted.
- the 3 rd fit (Tables 5 and 6, 5 th column) uses FCCS to simultaneously fit the autocorrelations of the red and yellow channels and the two cross-correlations, with all brightness and background values fixed.
- the occupancies for the intermediate-occupancy samples were expected to be 0.85 ⁇ 0.09 for DNA ⁇ 5 ' 17 , 1.15 ⁇ 0.05 for DNA Cy3,65B , and 0.84 ⁇ 0.03 for DNA y5,1T Cy > 5B
- the fragments were prepared as free components and in the following mixtures: DNA Cy5 ' IT /DNA Cy3,65B (to simulate non-interacting species); and DN A Cy5 ' IT/C 3 ' 65B /DNA Cy5,1T /DNA Cy3 ' 65B (to simulate interacting species).
- the same samples were also prepared for 10-fold lower occupancies (low-occupancy samples).
- DNA Cy5,1T Cy3 ' 65B was found by analyzing the Cy3 fluorescence, so the occupancy quoted includes DNA Cy5,1T/Cy3 ' 65B and DNA Cy5 ⁇ , ⁇ /Cy3 )6 5B ⁇ non . uorescent Cy5 - as seen in previous studies [12,
- Fig. 10 shows how to visually detect the presence of the double-labeled
- Table 8 Parameters extracted using PAID fits for two -channel, single- species, intermediate occupancy experiments
- DNA Fragment 1 DNAW DNA QS.6B DNA cStlar M Tci > 6SB
- DNA Fragment 1 DNA cys, ⁇ mA cysjr DNA C ⁇ " DNA C > ,SJT
- Figure 11 shows a representative fit of the RYY histogram (emphasizing DNA Cy5 ' IT Cy3,65B ) for the low-occupancy mixture sample (Table 9); this is one of the eight histograms fitted simultaneously over time intervals between 10 ⁇ s and 1 s. The peak toward higher photon counts in the vertical slice is caused by DNA Cy5,1T Cy3)65B . The fit is generally within the error bars, and follows the data to within 10%. [0136] As shown in Tables 7-10, we obtained fits with ⁇ 2 in the range 10>/ 2 >1
- Tables 7 and 8 show fitted values for the samples containing only one species of labeled DNA, where the background rates, occupancies, diffusion times, and brightness in each channel were fitted parameters.
- DNA Cy5 ' 1T/Cy3 ' 65B two components were necessary, one with Cy3-only and another with Cy3 and Cy5. This is due to non-fluorescent Cy5; single-species fits and inspection of time traces both indicate the presence of a species emitting only in Cy3 channel [12, 69].
- parameters corresponding to DNA Cy5 ' 1T were added to check if there was a species with non-emitting Cy3 (restricted to fit emission only in R), there was only a small occupancy fitted ( ⁇ 0.001, not shown).
- the occupancies extracted using the unrestricted fit from DNA Cy3 ' 65B and DNA Cy5 ' 1T Cy3 ' 65B in the three-fragment mixture are different from those obtained with the restricted fit (a 33% decrease and a 160% increase).
- the diffusion times extracted for D NA Cy5 ' 1T/Cy3,65B and DNA Cy3,65B are similar to the theoretical one (500-700 ⁇ s vs. 710 ⁇ s).
- the diffusion times for DNA Cy5,1T are shorter (-400 ⁇ s).
- the consistency found for brightness is excellent for all fits (typically -10%).
- FCS triplet state fluctuations and fluorescence saturation [15], photobleaching [16, 70], and photo-induced isomerization [67] are well- characterized in FCS; many of these features are evident in the data analyzed here.
- Tables 8 and 10 were analyzed using FCS over the same range of time intervals, modeling only diffusion (not shown). Variations in diffusion time that correlated with those in Table 8 and.10 were found, indicating that the photophysical properties that affect FCS have similar effects on PAID. Improvement of accuracy and consistency of fitted values is expected when these effects are incorporated into the PAID model.
- RNA polymerase - DNA interactions PAID was used to study the formation of RNA polymerase complexes with DNA, and to show that PAID can resolve and quantitate species with differences in brightness and/or diffusion time.
- DNA was labeled with Cy5 (as the "red" fluorophore r) to yield DNA Cy5 , 65B.
- TMR as ⁇ e « ye ii ow » fluorophore y
- RNAP+DNA sample shows the presence of 4 major species that are also observed after resolution of RNAP+DNA samples on polyacrylamide gels (Fig. 12).
- distinct species can be identified on the basis of their gel mobility and their 7;R emission ratio (note that electrophoretic mobility depends on size and charge, and is not simply related to free translational diffusion measured by PAID).
- the major species are characterized as i) free DNA; ii) ⁇ - associated species; iii) RNAP-DNA complex; and iv) aggregates (a heterogeneous species with large variety of sizes ranging from smaller oligomers to large aggregates).
- aggregates a heterogeneous species with large variety of sizes ranging from smaller oligomers to large aggregates.
- Species 1 has properties consistent with those of free DNA Cy5 ' 65B (emission only at the R channel, corresponding to a single copy of Cy5); we identify this species as "free-DNA”.
- Species 2 shows emission only at the Y channel (corresponding to a single copy of TMR), and diffusion time smaller than the RNAP-DNA complex or holo enzyme, but similar to DNA (compared with the 600- 700 ⁇ s found with Cy3 in previous sections); we identify this species as a combination of a " ⁇ -associated species" generated during the preparation of RNAP- DNA complex (Materials and methods), and of RNAP-DNA complex with non- fluorescent Cy5 (analogous to DNA CyM ⁇ '* ,!T/Cy3 ' 65B in the previous section).
- Species 3 shows comparable emission at both Y and R channels (corresponding to a single copy of TMR and a single copy of Cy5), and diffusion time (790 ⁇ s) slightly larger than the free holoenzyme (710 ⁇ s) and larger than free DNA (440-480 ⁇ s with Cy5 attached, 550-700 ⁇ s with Cy3); we identify this species as "RNAP-DNA complex”.
- Species 4 shows emission only at the Y channel, with high brightness (corresponding to a mean of -3 copies of TMR per species), and has the longest average diffusion time (850 ⁇ s) of all species; we identify this species as "aggregates”.
- Species 4 is a heterogeneous species, likely containing aggregates with varying numbers of subunits; different sections of data contained bursts of highly variable height and duration (most of the bright bursts from species 4 are of -1 ms duration; however, we have observed "yellow"-labeled species that generated bursts longer that 1 s with a peak height of 60 kHz). This variability is manifested in the PAID fits by the larger uncertainties found for the brightness and diffusion time of species 4. PAID also recovered the occupancy of the various species; however, since PAID measurements are performed in a different concentration regime, matrix, and buffer than the gel mobility assays, quantitative agreement of PAID results with the gel results is not expected. Therefore, this comparison was not performed.
- PAID reliably separates the species by extracting the relative brightness in the two channels; the diffusion time assists in the separation, but also proves very useful in species identification. For example, the diffusion time provides additional evidence for the discrimination between the aggregates and the dimmer, ⁇ -associated species that emit in the same channel.
- Fluorescence fluctuation methods are valuable tools for in vitro and in vivo analysis of macromolecular interactions. The most significant advantage of these methods is the ability to detect distinct subpopulations and extract their individual properties. The subpopulations are best identified and characterized by analysis methods that measure several of each species' properties.
- PAID is a multidimensional method that is applicable to multiple channels. The above examples demonstrate that PAID provides robust and simultaneous extraction of occupancy, diffusion time, and brightness in single- and dual-channel formats for multiple species. The examples show that PAID matches or exceeds the statistical accuracy of existing methods.
- FCS is not able to detect heterogeneity in brightness, and relies on using diffusion time differences to detect subpopulations.
- PCH/FIDA detect brightness heterogeneity, but do not account for diffusion (which can differentiate aggregates with quenched fluorescence from monomers without quenched fluorescence). The time bin size must be kept shorter than the diffusion time, preventing full use of the photon data stream.
- FIMDA has capabilities similar to single-channel PAID. PAID and FIMDA show similar accuracy for most of the simulations, but FIMDA shows lower accuracy for the parameters extracted from simulations in low-occupancy conditions (an experimental comparison has not been performed). On the other hand, FIMDA already accounts for triplet-state fluctuations, whereas these remain to be inco ⁇ orated into the PAID model.
- FCS Fluorescence-Activated Spectra-Specific FCS
- FIDA/PCH fixes the occupancy and brightness of two species to their correct values
- FCS is not able to extract the values for the diffusion times as reliably as PAID or FIMDA (Table 2).
- PAID single-channel PAID can be applied to areas such as assembly and stoichiometry of membrane proteins (receptors, ion channels) [71, 72], and amyloid plaque formation [73-75].
- FCS has been applied to the characterization of amyloid ⁇ -peptide polymerization [76, 77]; a fixed concentration (10 nM) of labeled monomer was combined with a varying concentration of unlabeled monomer. The presence of aggregates was detected as large changes in diffusion times. Single- channel PAID allows both brightness and diffusion time to be quantified, providing two observables for the degree of aggregation.
- Dual-channel methods provide improved sensitivity over single-channel methods for the analysis of the interactions using fluorescence fluctuation methods [8].
- the examples demonstrate PAID-based extraction of coincidence, diffusion time, brightness, and occupancy of several species in a single data set. Control experiments were used to restrict many parameters, increasing confidence in the remaining fitted parameters.
- the PAID analysis of the RNAP-DNA interaction demonstrates the ability of PAID to analyze complex systems, detecting concentration, brightness and diffusion time for multiple species present in a mixture. This ability allows quantitation of the various free and bound species present in equilibrium binding reactions, thus paving the way for generating binding constants between interacting partners in a high-throughput, low-volume assay format.
- FCCS color information
- leakage and background can hamper extraction of the occupancy of complexes [33]; although control experiments can extract leakage and background, it is often essential to extract all parameters from one data set, requiring control experiments only for checking consistency.
- PAID simultaneously extracts parameters, and is useful in cases where precise control experiments are impractical or impossible. For example, cellular autofluorescence changes as a function of position, preventing background measurements for a particular spatial position in a cell that contains different fluorescent species. PAID can replace FCCS when it is necessary to extract the brightness of a species in addition to occupancy and diffusion time.
- FCCS Cy2- and Cy5-labeled cholera toxin
- PAID can be used by picking a series of histograms with channel assignments STM.
- single-pair FRET measurements were used to monitor the folded and unfolded subpopulations of the protein Chymotrypsin Inhibitor 2 at different concentrations of denaturant [69].
- fluorescence anisotropy can be used in conjunction with FRET to obtain more accurate distance measurements [36].
- the single-molecule burst identification methods used in these studies can suffer from biases due to unequal detection efficiencies for different channels since the burst searching algorithms preferentially exclude dimmer species.
- PAID In extracting occupancies, brightness and diffusion time in all four channels, PAID can provide unbiased estimates critical for characterization of protein folding. Moreover, while single-molecule burst-analysis methods are restricted to low-occupancy samples, PAID is applicable to low- and intermediate-occupancy samples, expanding the dynamic range of the analysis of interactions. In addition, with appropriate extensions to the PAID model, conformational dynamics of individual subpopulations on time scales shorter than diffusion may be monitored. [0152] PAID provides a convenient visual representation of important features of diffusing species over a large dynamic range. This is advantageous, since clear visual features in histograms provide the first clues to interesting findings (such as additional subpopulations) or experimental problems.
- the PAID histogram focuses on photon-rich time intervals, retaining the intuitive nature of correlation functions, while simultaneously providing information available from photon counting histograms.
- the photon counting histograms used in FIDA/PCH and FIMDA weigh all time intervals equally; at low occupancy, most of the bins correspond to time intervals when no molecule is present and few photons are counted.
- the log axes used in PAID allow for easy visualization of effects over a large dynamic range.
- the model used for the detection volume has a large impact on the accuracy of the method. Using our theoretical model for the detection volume rather than a Gaussian detection volume improved the ⁇ 2 considerably. Similar effects are found in FCS and other FFS methods [68]. Improvement in the quality of PAID fits will come from improved characterization of the detection volume.
- the FIDA family of methods model the detection volume as a volume density per intensity level; a polynomial expression is used whose parameters are determined using experiments on a standard sample. While attractive for its simplicity, this prevents the modeling of possible trajectories through the detection volume.
- the model used for PAID is able to account for different possible trajectories through the detection volume.
- PAID can impact measurements where simultaneous determination of coincidence and diffusion (or other temporal dynamics) are critical.
- PAID can be used to monitor protein-protein interactions, such as protein oligomerization.
- the PAID model can also be extended to include photophysical properties of the dyes (triplet-state induced blinking, singlet and triplet state saturation, photobleaching), and to incorporate an experimentally-measured detection volume; these improvements will increase confidence and might uncover additional dynamics or species not assumed in the fit.
- the model can be extended to account for two monitor channels, and to become compatible with studies of immobilized molecules and systems involving flow. These extensions of PAID will allow in vitro analysis of dynamics (such as aspects of protein folding), protein-protein interactions and protein-DNA interactions, as well as analysis of interactions in a cellular environment.
- Transit time for the purposes of this specification includes diffusion time and/or flow time of species within the detection volume.
- fluorophore is intended to cover not only organic fluorescent fluorophores, but also any label or tag, intrinsic or extrinsic, that emits or scatters photons when subjected to light excitation.
- the PAID method is also useful for measuring temporal dynamics of species within the detection volume.
Landscapes
- Physics & Mathematics (AREA)
- Health & Medical Sciences (AREA)
- Spectroscopy & Molecular Physics (AREA)
- General Physics & Mathematics (AREA)
- Chemical & Material Sciences (AREA)
- Immunology (AREA)
- Biochemistry (AREA)
- Life Sciences & Earth Sciences (AREA)
- Analytical Chemistry (AREA)
- Nuclear Medicine, Radiotherapy & Molecular Imaging (AREA)
- General Health & Medical Sciences (AREA)
- Pathology (AREA)
- Optics & Photonics (AREA)
- Chemical Kinetics & Catalysis (AREA)
- Investigating, Analyzing Materials By Fluorescence Or Luminescence (AREA)
Abstract
Description





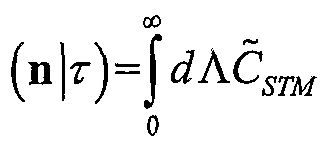


Claims
Priority Applications (2)
| Application Number | Priority Date | Filing Date | Title |
|---|---|---|---|
| US10/521,632 US7599059B2 (en) | 2002-07-25 | 2003-07-25 | Monitoring molecular interactions using photon arrival-time interval distribution analysis |
| AU2003263811A AU2003263811A1 (en) | 2002-07-25 | 2003-07-25 | Monitoring molecular interactions using photon arrival-time interval distribution analysis |
Applications Claiming Priority (2)
| Application Number | Priority Date | Filing Date | Title |
|---|---|---|---|
| US39895502P | 2002-07-25 | 2002-07-25 | |
| US60/398,955 | 2002-07-25 |
Publications (2)
| Publication Number | Publication Date |
|---|---|
| WO2004011903A2 true WO2004011903A2 (en) | 2004-02-05 |
| WO2004011903A3 WO2004011903A3 (en) | 2005-02-24 |
Family
ID=31188523
Family Applications (1)
| Application Number | Title | Priority Date | Filing Date |
|---|---|---|---|
| PCT/US2003/023252 Ceased WO2004011903A2 (en) | 2002-07-25 | 2003-07-25 | Monitoring molecular interactions using photon arrival-time interval distribution analysis |
Country Status (3)
| Country | Link |
|---|---|
| US (1) | US7599059B2 (en) |
| AU (1) | AU2003263811A1 (en) |
| WO (1) | WO2004011903A2 (en) |
Cited By (4)
| Publication number | Priority date | Publication date | Assignee | Title |
|---|---|---|---|---|
| WO2005119265A1 (en) * | 2004-06-03 | 2005-12-15 | Cambridge University Technical Services Limited | Protein detection |
| DE102007033737A1 (en) * | 2007-07-18 | 2009-01-22 | MAX-PLANCK-Gesellschaft zur Förderung der Wissenschaften e.V. | A method for determining a measurement based on single molecule events |
| DE102008004549B4 (en) * | 2008-01-15 | 2013-04-18 | PicoQuant GmbH. Unternehmen für optoelektronische Forschung und Entwicklung | Apparatus and method for simultaneous time resolved single photon registration from a plurality of detection channels |
| CN115389474A (en) * | 2022-08-17 | 2022-11-25 | 华南师范大学 | A three-dimensional super-resolution microscopy imaging method and device excited by near-infrared evanescent waves |
Families Citing this family (28)
| Publication number | Priority date | Publication date | Assignee | Title |
|---|---|---|---|---|
| US7739225B2 (en) | 2006-02-09 | 2010-06-15 | Ebay Inc. | Method and system to analyze aspect rules based on domain coverage of an aspect-value pair |
| US9443333B2 (en) | 2006-02-09 | 2016-09-13 | Ebay Inc. | Methods and systems to communicate information |
| US7849047B2 (en) | 2006-02-09 | 2010-12-07 | Ebay Inc. | Method and system to analyze domain rules based on domain coverage of the domain rules |
| US7725417B2 (en) * | 2006-02-09 | 2010-05-25 | Ebay Inc. | Method and system to analyze rules based on popular query coverage |
| US7640234B2 (en) * | 2006-02-09 | 2009-12-29 | Ebay Inc. | Methods and systems to communicate information |
| US8180572B2 (en) | 2007-10-25 | 2012-05-15 | Canon U.S. Life Sciences, Inc. | High-resolution melting analysis |
| US20100104513A1 (en) * | 2008-10-28 | 2010-04-29 | General Electric Company | Method and system for dye assessment |
| WO2010085548A2 (en) * | 2009-01-22 | 2010-07-29 | Li-Cor, Inc. | Single molecule proteomics with dynamic probes |
| WO2010111674A2 (en) | 2009-03-27 | 2010-09-30 | Life Technologies Corporation | Methods and apparatus for single molecule sequencing using energy transfer detection |
| CA2807683C (en) * | 2010-08-16 | 2020-02-18 | Cognoptix, Inc. | System and method for detecting amyloid proteins |
| US9284218B1 (en) * | 2012-06-29 | 2016-03-15 | Corning Incorporated | Methods for chemically strengthening glass articles |
| CA2906233C (en) * | 2013-03-15 | 2021-08-31 | Zymeworks Inc. | Systems and methods for identifying thermodynamic effects of atomic changes to polymers |
| DE102013213362A1 (en) * | 2013-07-08 | 2015-01-08 | Fraunhofer-Gesellschaft zur Förderung der angewandten Forschung e.V. | Method for identifying and quantifying emitting particles in systems |
| US9618450B2 (en) * | 2013-09-27 | 2017-04-11 | Ecolab USA, Inc. | Multi-channel fluorometric sensor and method of using same |
| US10282874B2 (en) * | 2014-09-17 | 2019-05-07 | Circonus, Inc. | Efficient time-series histograms |
| US10970879B2 (en) | 2018-04-26 | 2021-04-06 | Ppg Industries Ohio, Inc. | Formulation systems and methods employing target coating data results |
| US10871888B2 (en) * | 2018-04-26 | 2020-12-22 | Ppg Industries Ohio, Inc. | Systems, methods, and interfaces for rapid coating generation |
| US11874220B2 (en) | 2018-04-26 | 2024-01-16 | Ppg Industries Ohio, Inc. | Formulation systems and methods employing target coating data results |
| US11119035B2 (en) | 2018-04-26 | 2021-09-14 | Ppg Industries Ohio, Inc. | Systems and methods for rapid coating composition determinations |
| US10599576B2 (en) * | 2018-07-23 | 2020-03-24 | International Business Machines Corporation | Hybrid memory access frequency |
| JP7208052B2 (en) * | 2019-02-15 | 2023-01-18 | 株式会社豊田中央研究所 | optical rangefinder |
| US12400741B2 (en) * | 2020-02-28 | 2025-08-26 | Howard University | Selective extraction of late exponentials |
| US11941857B2 (en) * | 2020-05-26 | 2024-03-26 | Hi Llc | Systems and methods for data representation in an optical measurement system |
| EP4188205A4 (en) * | 2020-08-03 | 2024-10-02 | Technion Research & Development Foundation Limited | DIAGNOSTIC METHODS |
| US20230395185A1 (en) * | 2020-10-14 | 2023-12-07 | The Regents Of The University Of California | Systems for and methods of determining protein-protein interaction |
| CN113281716B (en) * | 2021-03-16 | 2023-08-08 | 中国人民解放军战略支援部队信息工程大学 | A denoising method for photon counting lidar data |
| US12320694B2 (en) | 2021-12-30 | 2025-06-03 | Technion Research Development Foundation Limited | Homodyne time-domain acousto-optic imaging for low-gain photodetectors |
| WO2025068668A1 (en) * | 2023-09-29 | 2025-04-03 | The University Of Sheffield | Single-molecule fluorescence detection system and method |
Family Cites Families (6)
| Publication number | Priority date | Publication date | Assignee | Title |
|---|---|---|---|---|
| WO1998023941A2 (en) * | 1996-11-27 | 1998-06-04 | Max-Planck-Gesellschaft zur Förderung der Wissenschaften e.V., Berlin | Method and device for determining predetermined properties of target particles of a sample medium |
| EP0884583A1 (en) | 1997-06-10 | 1998-12-16 | Evotec BioSystems GmbH | A method for characterizing samples in at least two dimensional space of specific physical properties |
| WO1999021063A1 (en) | 1997-10-16 | 1999-04-29 | The Victoria University Of Manchester | Timing circuit |
| GB9813613D0 (en) * | 1998-06-25 | 1998-08-26 | Univ Manchester | Pulse response assessment |
| US20030096433A1 (en) * | 1999-03-03 | 2003-05-22 | Evotec Analytical Systems Gmbh | Homogeneous fluorescence assay |
| US6965113B2 (en) * | 2000-02-10 | 2005-11-15 | Evotec Ag | Fluorescence intensity multiple distributions analysis: concurrent determination of diffusion times and molecular brightness |
-
2003
- 2003-07-25 US US10/521,632 patent/US7599059B2/en not_active Expired - Fee Related
- 2003-07-25 WO PCT/US2003/023252 patent/WO2004011903A2/en not_active Ceased
- 2003-07-25 AU AU2003263811A patent/AU2003263811A1/en not_active Abandoned
Cited By (4)
| Publication number | Priority date | Publication date | Assignee | Title |
|---|---|---|---|---|
| WO2005119265A1 (en) * | 2004-06-03 | 2005-12-15 | Cambridge University Technical Services Limited | Protein detection |
| DE102007033737A1 (en) * | 2007-07-18 | 2009-01-22 | MAX-PLANCK-Gesellschaft zur Förderung der Wissenschaften e.V. | A method for determining a measurement based on single molecule events |
| DE102008004549B4 (en) * | 2008-01-15 | 2013-04-18 | PicoQuant GmbH. Unternehmen für optoelektronische Forschung und Entwicklung | Apparatus and method for simultaneous time resolved single photon registration from a plurality of detection channels |
| CN115389474A (en) * | 2022-08-17 | 2022-11-25 | 华南师范大学 | A three-dimensional super-resolution microscopy imaging method and device excited by near-infrared evanescent waves |
Also Published As
| Publication number | Publication date |
|---|---|
| WO2004011903A3 (en) | 2005-02-24 |
| AU2003263811A8 (en) | 2004-02-16 |
| AU2003263811A1 (en) | 2004-02-16 |
| US7599059B2 (en) | 2009-10-06 |
| US20060176479A1 (en) | 2006-08-10 |
Similar Documents
| Publication | Publication Date | Title |
|---|---|---|
| US7599059B2 (en) | Monitoring molecular interactions using photon arrival-time interval distribution analysis | |
| Laurence et al. | Photon arrival-time interval distribution (PAID): a novel tool for analyzing molecular interactions | |
| US7456954B2 (en) | Modulated excitation fluorescence analysis | |
| Ries et al. | Fluorescence correlation spectroscopy | |
| EP1254362B1 (en) | Fluorescence intensity and lifetime distribution analysis | |
| Gomes et al. | Insights into the conformations and dynamics of intrinsically disordered proteins using single-molecule fluorescence | |
| WO2000066985A9 (en) | A method of characterizing fluorescent molecules or other particles using generating functions | |
| Weidemann et al. | Dual-color fluorescence cross-correlation spectroscopy with continuous laser excitation in a confocal setup | |
| US20240295498A1 (en) | Simultaneous multi-species super-resolution imaging via temporal multiplexing and single- photon detector array | |
| Macháň et al. | Statistical filtering in fluorescence microscopy and fluorescence correlation spectroscopy | |
| Hendrix et al. | Implementation and application of pulsed interleaved excitation for dual-color FCS and RICS | |
| CN113933275B (en) | Quantitative analysis methods, separation methods, devices and equipment based on biological imaging | |
| US20250314638A1 (en) | Oblique line scanner systems and methods for high throughput single molecule tracking in living cells | |
| Gregor et al. | Pattern-based linear unmixing for efficient and reliable analysis of multicomponent TCSPC data | |
| Földes-Papp et al. | A new dimension for the development of fluorescence-based assays in solution: from physical principles of FCS detection to biological applications | |
| Ivanchenko et al. | Fluorescence correlation spectroscopy: principles and developments | |
| Macháň et al. | Fluorescence correlation spectroscopy (fcs) | |
| Laurence | Photon-counting single-molecule spectroscopy for studying conformational dynamics and macromolecular interactions | |
| Sparrenberg et al. | The Mean Single Molecule Rate (mSMR) in the Analysis of Fluorescence Fluctuations: Measurements on DNA Mixtures of Defined Composition | |
| Cullinane | Solution-Phase Studies of Fast Conformational Dynamics at the Single-Molecule Level | |
| Buehler et al. | The Integration of Single Molecule Detection Technologies into Miniaturized Drug Screening: Current Status and Future Perspectives | |
| EP4619810A1 (en) | Oblique line scanner systems and methods for high throughput single molecule tracking in living cells | |
| Ernst et al. | Disentangling Timescales of Molecular Kinetics with spFRET using ALEX-FCS | |
| WO2024138095A1 (en) | Oblique line scanner systems and methods for high throughput single molecule tracking in living cells | |
| WO2024138093A1 (en) | Oblique line scanner systems and methods for high throughput single molecule tracking in living cells |
Legal Events
| Date | Code | Title | Description |
|---|---|---|---|
| AK | Designated states |
Kind code of ref document: A2 Designated state(s): AE AG AL AM AT AU AZ BA BB BG BR BY BZ CA CH CN CO CR CU CZ DE DK DM DZ EC EE ES FI GB GD GE GH GM HR HU ID IL IN IS JP KE KG KP KR KZ LC LK LR LS LT LU LV MA MD MG MK MN MW MX MZ NO NZ OM PH PL PT RO RU SC SD SE SG SK SL TJ TM TN TR TT TZ UA UG US UZ VC VN YU ZA ZM ZW |
|
| AL | Designated countries for regional patents |
Kind code of ref document: A2 Designated state(s): GH GM KE LS MW MZ SD SL SZ TZ UG ZM ZW AM AZ BY KG KZ MD RU TJ TM AT BE BG CH CY CZ DE DK EE ES FI FR GB GR HU IE IT LU MC NL PT RO SE SI SK TR BF BJ CF CG CI CM GA GN GQ GW ML MR NE SN TD TG |
|
| 121 | Ep: the epo has been informed by wipo that ep was designated in this application | ||
| 122 | Ep: pct application non-entry in european phase | ||
| ENP | Entry into the national phase |
Ref document number: 2006176479 Country of ref document: US Kind code of ref document: A1 |
|
| WWE | Wipo information: entry into national phase |
Ref document number: 10521632 Country of ref document: US |
|
| NENP | Non-entry into the national phase |
Ref country code: JP |
|
| WWW | Wipo information: withdrawn in national office |
Country of ref document: JP |
|
| WWP | Wipo information: published in national office |
Ref document number: 10521632 Country of ref document: US |