US9864051B2 - Method of estimating a local plot density in a radar system; a plot density estimator and a radar system with a plot density estimator - Google Patents
Method of estimating a local plot density in a radar system; a plot density estimator and a radar system with a plot density estimator Download PDFInfo
- Publication number
- US9864051B2 US9864051B2 US14/441,156 US201314441156A US9864051B2 US 9864051 B2 US9864051 B2 US 9864051B2 US 201314441156 A US201314441156 A US 201314441156A US 9864051 B2 US9864051 B2 US 9864051B2
- Authority
- US
- United States
- Prior art keywords
- plot
- plots
- corresponding coefficients
- basis functions
- adjusting
- Prior art date
- Legal status (The legal status is an assumption and is not a legal conclusion. Google has not performed a legal analysis and makes no representation as to the accuracy of the status listed.)
- Active, expires
Links
Images


Classifications
-
- G—PHYSICS
- G01—MEASURING; TESTING
- G01S—RADIO DIRECTION-FINDING; RADIO NAVIGATION; DETERMINING DISTANCE OR VELOCITY BY USE OF RADIO WAVES; LOCATING OR PRESENCE-DETECTING BY USE OF THE REFLECTION OR RERADIATION OF RADIO WAVES; ANALOGOUS ARRANGEMENTS USING OTHER WAVES
- G01S13/00—Systems using the reflection or reradiation of radio waves, e.g. radar systems; Analogous systems using reflection or reradiation of waves whose nature or wavelength is irrelevant or unspecified
- G01S13/02—Systems using reflection of radio waves, e.g. primary radar systems; Analogous systems
- G01S13/50—Systems of measurement based on relative movement of target
- G01S13/52—Discriminating between fixed and moving objects or between objects moving at different speeds
- G01S13/522—Discriminating between fixed and moving objects or between objects moving at different speeds using transmissions of interrupted pulse modulated waves
- G01S13/524—Discriminating between fixed and moving objects or between objects moving at different speeds using transmissions of interrupted pulse modulated waves based upon the phase or frequency shift resulting from movement of objects, with reference to the transmitted signals, e.g. coherent MTi
- G01S13/5248—Discriminating between fixed and moving objects or between objects moving at different speeds using transmissions of interrupted pulse modulated waves based upon the phase or frequency shift resulting from movement of objects, with reference to the transmitted signals, e.g. coherent MTi combining a coherent MTI processor with a zero Doppler processing channel and a clutter mapped memory, e.g. MTD (Moving target detector)
-
- G—PHYSICS
- G01—MEASURING; TESTING
- G01S—RADIO DIRECTION-FINDING; RADIO NAVIGATION; DETERMINING DISTANCE OR VELOCITY BY USE OF RADIO WAVES; LOCATING OR PRESENCE-DETECTING BY USE OF THE REFLECTION OR RERADIATION OF RADIO WAVES; ANALOGOUS ARRANGEMENTS USING OTHER WAVES
- G01S13/00—Systems using the reflection or reradiation of radio waves, e.g. radar systems; Analogous systems using reflection or reradiation of waves whose nature or wavelength is irrelevant or unspecified
- G01S13/66—Radar-tracking systems; Analogous systems
- G01S13/72—Radar-tracking systems; Analogous systems for two-dimensional tracking, e.g. combination of angle and range tracking, track-while-scan radar
-
- G—PHYSICS
- G01—MEASURING; TESTING
- G01S—RADIO DIRECTION-FINDING; RADIO NAVIGATION; DETERMINING DISTANCE OR VELOCITY BY USE OF RADIO WAVES; LOCATING OR PRESENCE-DETECTING BY USE OF THE REFLECTION OR RERADIATION OF RADIO WAVES; ANALOGOUS ARRANGEMENTS USING OTHER WAVES
- G01S7/00—Details of systems according to groups G01S13/00, G01S15/00, G01S17/00
- G01S7/02—Details of systems according to groups G01S13/00, G01S15/00, G01S17/00 of systems according to group G01S13/00
- G01S7/28—Details of pulse systems
- G01S7/285—Receivers
- G01S7/292—Extracting wanted echo-signals
Definitions
- This invention relates to method of estimating a local plot density in a radar system; a plot density estimator and a radar system with a plot density estimator.
- this invention relates to a method of estimating a local plot density in a radar system observing an observation volume and configured to generate plots with plot attributes, where the method comprises:
- Radars in general provides a lot of potential target detections, called plots, some are false and some are true detections of real targets.
- Patent application EP 2 386 874 disclose a method of estimating a plot density in a radar system.
- improved estimates of plot density can achieve this.
- the disclosure in EP 2 386 874 may be improved.
- the plot density as a threshold for splitting of basis functions will lead to a recursive and splitting of sub-cells or basis functions representing the largest clutter density or local plot density in areas with clutter density over the threshold.
- the statistical uncertainty in these recursively divided cells has been found not find a good balance between the statistical uncertainty in the local plot density estimate and the resolution of the map.
- One such condition could be when the basis functions extend or minimal size, typically a given resolution in the radar system.
- the method can be used in a radar system with a radar that works by transmitting a signal such as radio or microwave signal and listens to the echoes scattered off various objects in the observation volume of the radar.
- the radar system can be equipped with a plot extractor, which analyses the output of the radar and identifies peaks in the radar return signal—typically after some signal pre-processing—as plots which is interpreted as potential observations of targets.
- a radar plot, p has a set of attributes z p , features or measures. These attributes can be range and bearing relative to the radar site, but plot features such as intensity, as the intensity of the echo from the radar, and radial (Doppler) velocity are also common.
- the set of used plot attributes constitutes a measurement space and the number of attributes used determines the dimension (M) of the measurement space.
- a subspace can be a spatial space that can be 1D, 2D, or 3D and can be with temporal dependencies.
- the coordinate representation of a 3D-spatial space can be 2D-Cartesian with a 3 rd elevation or equivalent.
- a subspace also, and importantly, comprises dimensions based on intensity measures.
- D(z) the false plot density of plots
- the unit of this number is the inverse of the combined units of the measurement space. For instance, if the measurement space consists of range and bearing, the unit of the density would be m ⁇ 1 rad ⁇ 1 when SI units are chosen. Other measures can be established based on the plot attributes and their units will be used.
- the method can be applied in a radar system with a tracker that is configured to combine plots into tracks of supposedly real targets.
- the method and variants of the method is advantageous. Furthermore, a person skilled in the art will be inclined to adjust, modify, or adapt physical equipment to produced data in a required format to make use of the method. Likewise, the person skilled in the art will be inclined to adjust, modify or adapt the method as required to implement the method in existing radar equipment.
- the basis functions are localized to minimize the couplings between coefficients to limit the computational load.
- c and s are parameter constants chosen to make the estimate as conservative as needed.
- S(p, p o ) is the difference in scans as measured in number of scans between the newly arrived plot p and the oldest considered plot p o .
- the method starts out by having one cell covering the whole measurement space.
- S(p, p 0 ) can be calculated as the total amount the antenna have rotated from one plot to the other calculated in radians divided by 2 ⁇ .
- the number of frames or simply the time difference between the plots divided by a typical revisiting time, can be used.
- Another advantage of partitioning the space to maintain a desirable number of plots in each partitioned cell as compared to just splitting and merging on the basis of, say, an estimated plot density is that undesirable defects are eliminated or reduced.
- splitting a cell once the plot density is too high or if a cell has a clutter density over a limit will result in that the clutter density in at least one of the two sub-boxes is also over the same limit. This will result in a new cell that would have to be split as well, etc. This process will continue until a cell reaches the minimum size.
- c>1 is useful to compensate for the clutter not being uniformly distributed inside a cell.
- the method is advantageous when adjusting the basis functions, and adjusting or modifying the corresponding coefficients comprises a step of splitting the basis functions and corresponding coefficients.
- splitting is performed to partition the measurement space in such a way as to obtain or maintain a certain number, or stay within an interval, of plots in each partition or cell.
- the method is advantageous wherein adjusting the basis functions and corresponding coefficients comprises a step of updating at least one coefficient when a plot is removed.
- the method is advantageous wherein adjusting the basis functions and corresponding coefficients comprises a step of joining basis functions and modifying the corresponding coefficients.
- this step is performed to maintain a predetermined number of plots or to maintain a number of plots per basis function within a certain interval.
- the method is advantageous wherein the basis functions are normalised.
- a further advantage is that computational artefacts resulting from subtraction and addition is minimized and thus results in more reliable estimates.
- the method is advantageous wherein the method further includes at least one step of adjusting the basis functions and corresponding coefficients based on a feedback of a track, t.
- the unit of this number is the inverse of the combined units of the measurement space. For instance, if the measurement space consists of range and bearing, the unit of the density would be m-1 rad-1 when SI units are chosen. When the intensity attribute is included, the unit is m ⁇ 1 rad ⁇ 1 dB ⁇ 1 .
- each potential track, t can be predicted into the future.
- the result of this prediction is a probability density function l(z
- association likelihood which provides information to the tracker how likely this particular plot is to represent a specific target, t.
- the likelihood for a track representing a real target is multiplied with this number, when it is decided that the plot and track do associate.
- a track is typically declared real when the likelihood exceeds a certain limit.
- the method is advantageous wherein the measurement space at least comprises one measure of intensity of an echo from the radar system.
- the intensity measure is combined with at least one spatial measure.
- the choice of extraction threshold directly influences the D(z p ).
- D(z p ) For low intensity plots close to the extraction threshold, D(z p ) is simply higher than for plots with high intensity.
- the only limitation is the bandwidth and computational resources.
- the plot density is much more non-homogenous. Far from the radar, there will be a narrow band of white noise plots close to the plot extraction threshold, whereas closer to the radar there will be a span of clutter plots having a much broader spread in intensity.
- the plot density, D(z) can also be used in a plot discriminator without performing tracking: Let f(z) be a known density function of wanted targets. If, for instance, the measurement space consists of range, azimuth and intensity this describes the density of targets according to position and intensity. Now in accordance to the Neyman-Pearson lemma comparing f(z)/D(z) against a fixed threshold will provide the best discrimination of false and true plots.
- the method is advantageous wherein the method comprises a further step of removing old plots.
- the removing of old plots is performed in order to maintain a predetermined number of plots based on a first-last-out memory of plots.
- plots, p o are removed whenever on S(p,p o )>N, p being the newest arriving plot. N is some number of scans.
- n h ⁇ N If there is a real target present, it will over N scans generate N almost identical plots and thus result in at least a cell smaller than the uncertainty of the plot around the real target, thereby yielding a very high plot density for these plots. An effect of this is that a tracker cannot pick up the target.
- the method is advantageous wherein the method further includes at least one step of fading memory where the contribution from a plot is adjusted by a weight of the plot that decays over time.
- the coefficients from a weighted combination of plots with a weight that decays over time are deriving.
- the method is advantageous wherein the fading memory weight decays exponentially.
- One such exponential decay can be as exp( ⁇ S(p,p 1 )/S 0 ).
- the decay can be reciprocally; such as 1/S(p,p 0 ) or 1/(S 0 (1 ⁇ S(p,p 0 )/S 0 ).
- the method is advantageous wherein at least a sub-dimension of the basis functions is a cell with a finite value inside the cell and 0 (zero) outside.
- a preferred value is 1/V c inside the cell, where V c is the volume of the cell.
- Other non-unity normalisations can be used. Thereby the evaluation is simplified and in cases reduced to merely counting.
- the method is advantageous wherein adjusting the cells and corresponding coefficients is performed by any of the following steps:
- the adjusting is splitting or joining/merging as disclosed.
- the splitting of a cell is performed cyclically between an X-axis and a Y-axis in a 2D-space. This is computationally simple and effective.
- Where to split or join is determined based using a measure or a metric that can be based on a distance or likelihood measure.
- the method is advantageous wherein adjusting of a cell and corresponding coefficients in a dimension performed at a position determined by any of the following metrics on at least one cell
- the metric determines the centre position
- the metric determines the average plot position
- the metric determines the median plot position
- the metric determines the plot maximum likelihood position
- Using the centre method is advantageous as it is simple to implement and deterministic with respect to performance.
- the complexity of inserting and removing plots is O(log 2 of the total volume divided by the minimum cell volume).
- the centre method provides a fast and simple way of determining a plot density.
- the average method provides a simple approximation to median method and is a compromise between centre and median splitting.
- each basis function represents a M-dimensional cell in the measurement space attaining a constant value within the cell and zero outside, and the set of basis functions are non-overlapping in the M-dimensional measurement space.
- This particular embodiment is further implemented so that a single cell is split, when the corresponding single cell basis function coefficient represents a number of plots, which exceed a threshold number for splitting.
- the splitting can be performed by splitting a single cell into two or more non-overlapping cells filling the same volume in measurement space as the single cell, and with two or more new basis function coefficients representing the same number of plots as the basis function coefficient for the single cell.
- the splitting of a single cell can be performed by dividing the cell into two cells by an intersecting plane in the measurement space.
- the intersecting plane is perpendicular to one of the M axis in the measurement space and called the splitting axis.
- the splitting of an axis is done cyclically alternating between the M dimensions in measurement space.
- Splitting of an axis can be selected as the axis along where the average plot position is most distant from a centre position of the cell under consideration.
- splitting axis is selected as the axis along where the median plot position is most distant from the centre position of the cell under consideration.
- splitting axis is selected as the axis along where the maximum likelihood splitting position is most distant from the centre position of the cell under consideration.
- cells can be merged or joined using the same, but opposite, principles.
- An object of the invention is achieved by a plot density estimator comprising a computational unit configured to perform a method of estimating a local plot density according as disclosed herein.
- An object of the invention is achieved by a radar system comprising a radar configured to communicate with a radar transceiver and a plot extractor;
- a plot density estimator configured to receive plots from the plot extractor and configured as disclosed herein and further configured to at least output:
- plot density estimates to a plot discriminator preferably configured with output means to output usable plots to a user; and/or
- plots to a tracker preferably configured with output means to output usable tracks to a user.
- a radar system that is configured to implement and perform the disclosed of the disclosed steps in the method.
- FIG. 1 shows an overview of an embodiment of a radar system with a plot density estimator
- FIG. 2 shows a schematic overview of a method of estimating plot density
- FIG. 3 shows a particular overview of a method of estimating plot density
- FIG. 4 illustrates an addition of a plot to a cell
- FIG. 5 illustrates an adjustment based on a centre metric
- FIG. 6 illustrates an adjustment based on an average metric
- FIG. 7 illustrates an adjustment based on a median metric
- FIG. 8 illustrates an adjustment based on likelihood metric
- FIG. 9 illustrates the differences adjusting or splitting using different metrics for a particular distribution of plots in a space
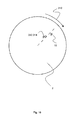
- FIG. 10 shows a rotating radar system generating new plots and removing old plots
- FIG. 11 shows a prediction of a target from a tracker
- FIG. 12 show a schematic overview of a method of estimating plot density integrating adding and removing plots.
- FIG. 13 shows an alternative partition of measurement space using finite element functions.
- FIG. 1 shows a schematic overview of a radar system 1 arranged to scan an observation volume 2 for objects 31 , which objects 3 can be a target 4 or clutter 5 , noise.
- the radar system 1 comprises an radar antenna 10 connected to a radar transceiver 12 with a plot extractor 14 , that can be embedded or peripheral, and configured to feed a stream of plots 15 to a plot density estimator 16 .
- the plot density estimator 16 is further configured to feed plot density estimates 17 , 17 ′, . . . to a plot discriminator 18 with output means for plots to a user 20 .
- the plot density estimator 16 is further configured to augment a plot density estimate 17 to each plot 17 , 17 ′ and feed these augmented plots 17 to a plot discriminator 18 with output 20 of most likely target plots to a user by suppressing publication of plots with a plot density 17 exceeded a plot publication threshold.
- plot density estimator 16 is further configured to feed plot density estimates to a tracker 22 configured to feed tracks 23 to output means for tracks to a user 24 .
- an optional tracker feedback 26 from the tracker 22 to the plot density estimator 16 which is further configured to utilise the tracker feedback for eliminating the true plots in the plot density 17 .
- FIG. 2 shows a method 100 of estimating a local plot density 17 in a plot density estimator 16 in a radar system 1 .
- the method 100 comprises a step of establishing 200 a non-empty set of basis functions 202 and corresponding coefficients 204 in a M-dimensional measurement space 206 ; a step of updating coefficients 210 ; a step of adjusting 220 basis functions and/or coefficients; and estimating plot density 230 .
- the method can comprise a further step of removing 240 old plots.
- the method requires stream of plots 15 from a radar with an radar antenna 10 and generates a plot density 17 ; which in this embodiment is provided as an output along with the plot 15 .
- FIG. 3 shows a particular embodiment of the method 100 of estimating a local plot density 17 .
- the figure illustrates a case, where cells 212 are chosen as basis functions 202 .
- a plot 15 , p is received from the radar system 1 with an antenna 10 and the plot 15 , p is added to a cell 212 enclosing the plot 15 , p.
- the cell 212 will be detailed later.
- the step of adjusting 220 cells 212 and coefficients 204 is performed if the number of plots 222 , nc, in a cell 212 is greater than a splitting threshold nh, which is an adjustment number 224 , here defining an upper end, of an adjustment interval 226 .
- adjusting 220 is a step of splitting 228 the cell 212 .
- the optional step of removing 240 of old plots 15 will have a step of adjusting 202 that includes merging 242 cells or joining 242 basis functions 202 .
- FIG. 4 graphically illustrates an addition of a plot 15 to cell 212 , c, that has been obtained by a series of splittings 228 ′, 228 ′′ and potential splitting 228 ′′′ of a basis functions 202 being a cell 212 , c enclosing a plot p, 15 .
- the cell 212 ′′′, c, enclosing the plot 15 , p is found by starting with the top (in a hierarchy) most cell 212 . If that cell 228 is split 228 ′, then the next cell 212 ′ is tried; if that next cell 212 ′ is also, split 228 ′′, then the process continues until the cell 212 ′′′ is reached.
- the adjusting 220 or splitting 228 is limited by some minimum size for each dimension 206 at which minimum size the adjusting 220 or splitting 228 is terminated.
- a natural minimum size is the sensor resolution or a minimum size directly derived thereof.
- FIGS. 5 to 8 illustrate alternative ways of adjusting 220 where the adjusting 220 is splitting 228 of a 2-dimensional 206 normalised basis 202 that is normalised i.e. in a (z 1 , z 2 )-coordinate system 110 ′, 110 ′ representing the measurement space 110 .
- the same plots 15 are distributed in the measurement space 110 in the figures.
- Adjusting 220 is performed at an adjusting position 301 determined by a metric 300 .
- the splitting 228 is performed cyclic in the M dimensions 206 . In this embodiment that is alternating between the z 1 -axis and the z 2 -axis.
- FIG. 5 illustrates a metric 300 of splitting 228 based on dividing each cell 212 using a centre metric 302 that defines a centre position 303 on the measurement dimensions 110 ′ 110 ′′ in a cyclic way or here alternating way. That is dividing each cell 212 in half.
- the splittings 228 ′, 228 ′′, 228 ′′′ result in the cells 212 , 212 ′, 212 ′′, 212 ′′′ each having a number of plots 222 that is in the adjusting interval 226 .
- FIG. 6 illustrates a splitting 228 based on an average metric 304 that defines an average position 305 on the bases 202 ′, 202 ′′.
- the splittings 228 ′, 228 ′′ result in three cells 212 , 212 ′, 212 ′′ each having a number of plots 222 that is in the adjusting interval 226 .
- FIG. 7 illustrates, very similar to the average metric 304 , a splitting 228 based on a median metric 306 that defines a median position 307 on the bases 202 ′, 202 ′′.
- the splittings 228 ′, 228 ′′ result in three cells 212 , 212 ′, 212 ′′ each having a number of plots 222 that is in the adjusting interval 226 .
- FIG. 8 illustrates a splitting 228 based on a likelihood metric 308 , in particular a maximum likelihood metric that defines a likelihood position 309 on the bases 202 ′, 202 ′′.
- the splittings 228 ′ 228 ′′ result in three cells 212 , 212 ′, 212 ′′ each having a number of plots 222 that is in the adjusting interval 226 .
- FIG. 9 summarises the different partitions of the space 110 populated by a number of plots 15 by splitting the z 2 -axis 202 ′′ using different metrics 300 as outlined.
- FIG. 10 Illustrates how a rotating antenna in radar system 1 configured for a 360-degrees rotation, scans 310 an observation volume 2 and detects and generates new plots 15 , p, that are S(p,p o )>N scans newer.
- S(p, p 0 ) is calculated as the total amount the radar antenna has rotated from one plot 15 to the other calculated in radians divided by 2 ⁇ .
- the number of frames or simply the time difference between the plots divided by a typical revisiting time, can be used.
- FIG. 11 shows a prediction 320 output from a tracker 22 .
- t) reflects the likelihood density of the target to generate a plot from the radar having the attributes z 104 . That is—equivalently—the likelihood l(z
- t)/D(z p ) is important and used as an association likelihood, which tells the tracker 22 how likely this particular plot is representing the specific target 4 , t.
- FIG. 12 shows a method 100 of estimating a local plot density 17 in a plot density estimator 16 in a radar system 1 .
- the top part of the flow diagram is essentially a variation of the flow diagram illustrated in FIG. 2 .
- the illustrated embodiment takes into account removing 240 of plots 15 , and in this case, removal of the oldest points 242 .
- this embodiment outlines a fully adaptive method for estimating plot density 17 continuously as new plots 15 arrive and plots become obsolete and are disregarded as old plots 242 or diminishing value due to fading weights.
- FIG. 13 shows an alternative method 100 using finite elements functions 400 .
- the figure illustrates a two-dimensional measurement space 110 .
- the measurement space 110 is split by boundaries 404 running between mesh points 402 .
- a basis function 202 which is 0 at the bold boundaries 404 ′ defines a cell.
- New mesh points B 402 ′ or C 402 ′′ and new dash-dotted 404 ′′ or dotted boundaries 404 ′′′ can be introduced when there is too many plots 15 close to the mesh point A 402 .
Landscapes
- Engineering & Computer Science (AREA)
- Radar, Positioning & Navigation (AREA)
- Remote Sensing (AREA)
- Computer Networks & Wireless Communication (AREA)
- Physics & Mathematics (AREA)
- General Physics & Mathematics (AREA)
- Radar Systems Or Details Thereof (AREA)
Abstract
Description
-
- establishing a non-empty set of M-dimensional basis functions and corresponding coefficients; hereinafter repeatedly
- updating at least one coefficient based on at least one plot as obtained from the radar system;
- adjusting the basis functions and corresponding coefficients to represent a number of plots in a predetermined adjusting interval
- estimating the local plot density at a given point in the observation volume.
-
- establishing a set of basis functions spanning a M-dimensional measurement space and corresponding coefficients to represent the local plot density; hereinafter repeatedly
- updating at least one coefficient based on at least one plot as obtained from the radar system;
- adjusting the basis functions and corresponding coefficients to represent a number of plots in a predetermined adjusting interval;
- estimating the local plot density, which can be at any given point representing the observation volume.
D(z)=Σa i e i(z), [1]
∫e i dV=1, [2]
then ai is simply counting the number of plots represented by basic function ei.
Δa i =e i(z p)/(Σj e j(z p)) [3]
and the reverse when a plot is removed.
D(z p)=c(n c +ssqrt(n c+1))/(V c S(p,p o)) [4]
where nc is the number of the plots within the cell and Vc is the volume of the cell and measured in for instance m rad. sqrt(nc+1) is the statistical uncertainty of the number of plots in the cell.
D(z p)=n c/(V b S(p,p o)) [5]
-
- adjusting cells and corresponding coefficients by cyclically alternating dimensions in which the cells are to be adjusted;
- adjusting cells and corresponding coefficients in the dimension yielding an average plot position that is most distant from a centre position;
- adjusting cells and corresponding coefficients in the dimension yielding an median plot position that is most distant from a centre position;
- adjusting cells and corresponding coefficients in the dimension yielding a plot maximum likelihood;
or any combination thereof.
log L=−n+n 1 log(n 1 /V 1)+n 2 log(n 2 /V 2). [6]
| Detailed Description |
| | Feature | |
| 1 | |
| 2 | |
| 3 | |
| 4 | |
| 5 | False target, |
| 10 | |
| 12 | |
| 14 | |
| 15 | |
| 16 | |
| 17 | |
| 18 | |
| 20 | Output means for plots to |
| 22 | |
| 23 | |
| 24 | Output means for tracks to |
| 26 | |
| 100 | Method |
| 102 | Plot density, D(z) |
| 104 | Plot Attributes, zp |
| 106 | Plot density, |
| 108 | False plot density, D(z) |
| 110 | Measurement space |
| 112 | Volume of |
| 200 | Establishing |
| 202 | Basis function |
| 204 | Basis function coefficients/coefficients |
| 206 | M-dimensional |
| 210 | |
| 212 | Cell/Box |
| 214 | Volume of Cell, |
| 220 | Adjusting |
| 222 | Number of plots in cell c, |
| 224 | Adjusting number |
| 226 | |
| 228 | |
| 230 | |
| 240 | Removing |
| 242 | |
| 244 | Merging/Joining |
| 300 | Metric |
| 301 | |
| 302 | |
| 303 | Centre Plot Position |
| 304 | |
| 305 | Average Plot Position |
| 306 | Median Metric |
| 307 | |
| 308 | |
| 309 | |
| 310 | Scan |
| 312 | Fading Memory |
| 320 | Target likelihood/Prediction, I(z|t) |
| 322 | Likelihood ratio, I(zp|t)/D(zp), |
| 400 | Finite Elements Functions |
| 402 | Mesh points |
| 404 | Boundaries |
log L=−Σ i a i +Σp log(ΣIa i e i(z p)) [7]
is maximized.
Claims (19)
Applications Claiming Priority (4)
| Application Number | Priority Date | Filing Date | Title |
|---|---|---|---|
| EP12191629.0 | 2012-11-07 | ||
| EP12191629.0A EP2730941B1 (en) | 2012-11-07 | 2012-11-07 | A method of estimating a local plot density in a radar system; a plot density estimator and a radar system with a plot density estimator |
| EP12191629 | 2012-11-07 | ||
| PCT/EP2013/073043 WO2014072285A1 (en) | 2012-11-07 | 2013-11-05 | A method of estimating a local plot density in a radar system; a plot density estimator and a radar system with a plot density estimator |
Publications (2)
| Publication Number | Publication Date |
|---|---|
| US20150301170A1 US20150301170A1 (en) | 2015-10-22 |
| US9864051B2 true US9864051B2 (en) | 2018-01-09 |
Family
ID=47146240
Family Applications (1)
| Application Number | Title | Priority Date | Filing Date |
|---|---|---|---|
| US14/441,156 Active 2034-08-03 US9864051B2 (en) | 2012-11-07 | 2013-11-05 | Method of estimating a local plot density in a radar system; a plot density estimator and a radar system with a plot density estimator |
Country Status (4)
| Country | Link |
|---|---|
| US (1) | US9864051B2 (en) |
| EP (1) | EP2730941B1 (en) |
| ES (1) | ES2622287T3 (en) |
| WO (1) | WO2014072285A1 (en) |
Cited By (1)
| Publication number | Priority date | Publication date | Assignee | Title |
|---|---|---|---|---|
| US20220146667A1 (en) * | 2022-01-25 | 2022-05-12 | Intel Corporation | Apparatus, system and method of radar tracking |
Families Citing this family (1)
| Publication number | Priority date | Publication date | Assignee | Title |
|---|---|---|---|---|
| CN111010590B (en) * | 2018-10-08 | 2022-05-17 | 阿里巴巴(中国)有限公司 | Video clipping method and device |
Citations (4)
| Publication number | Priority date | Publication date | Assignee | Title |
|---|---|---|---|---|
| US4992795A (en) | 1988-10-11 | 1991-02-12 | Thomson-Csf | Method and device for the validation of plots, for radar, with self-adaptive updating |
| DE10238896A1 (en) | 2002-08-24 | 2004-03-11 | Eads Deutschland Gmbh | Probabilistic identification of targets and track initiation, for radar data with clutter, separates clutter and compares calculated probability functions with significance thresholds |
| EP2386874A1 (en) | 2010-05-04 | 2011-11-16 | BAE SYSTEMS plc | Tracker false alarm rate control |
| US20140347208A1 (en) * | 2013-05-24 | 2014-11-27 | Robert Bosch Gmbh | Method for evaluating obstacles in a driver assistance system for motor vehicles |
-
2012
- 2012-11-07 ES ES12191629.0T patent/ES2622287T3/en active Active
- 2012-11-07 EP EP12191629.0A patent/EP2730941B1/en active Active
-
2013
- 2013-11-05 US US14/441,156 patent/US9864051B2/en active Active
- 2013-11-05 WO PCT/EP2013/073043 patent/WO2014072285A1/en not_active Ceased
Patent Citations (4)
| Publication number | Priority date | Publication date | Assignee | Title |
|---|---|---|---|---|
| US4992795A (en) | 1988-10-11 | 1991-02-12 | Thomson-Csf | Method and device for the validation of plots, for radar, with self-adaptive updating |
| DE10238896A1 (en) | 2002-08-24 | 2004-03-11 | Eads Deutschland Gmbh | Probabilistic identification of targets and track initiation, for radar data with clutter, separates clutter and compares calculated probability functions with significance thresholds |
| EP2386874A1 (en) | 2010-05-04 | 2011-11-16 | BAE SYSTEMS plc | Tracker false alarm rate control |
| US20140347208A1 (en) * | 2013-05-24 | 2014-11-27 | Robert Bosch Gmbh | Method for evaluating obstacles in a driver assistance system for motor vehicles |
Non-Patent Citations (1)
| Title |
|---|
| Reed, C.M., "Bayesian Track and Plot Management" in IEE Colloquium. Target Tracking: Algorithms and Applications, Nov. 11-12, 1999, pp. 8/1-8/6. |
Cited By (2)
| Publication number | Priority date | Publication date | Assignee | Title |
|---|---|---|---|---|
| US20220146667A1 (en) * | 2022-01-25 | 2022-05-12 | Intel Corporation | Apparatus, system and method of radar tracking |
| US12265150B2 (en) * | 2022-01-25 | 2025-04-01 | Intel Corporation | Apparatus, system and method of radar tracking |
Also Published As
| Publication number | Publication date |
|---|---|
| WO2014072285A1 (en) | 2014-05-15 |
| US20150301170A1 (en) | 2015-10-22 |
| EP2730941A1 (en) | 2014-05-14 |
| EP2730941B1 (en) | 2017-02-22 |
| ES2622287T3 (en) | 2017-07-06 |
Similar Documents
| Publication | Publication Date | Title |
|---|---|---|
| CN107861107B (en) | Double-threshold CFAR (computational fluid dynamics) and trace point agglomeration method suitable for continuous wave radar | |
| US8405540B2 (en) | Method for detecting small targets in radar images using needle based hypotheses verification | |
| CN108318864B (en) | Method and device for eliminating multipath target in radar target detection | |
| CN113866755B (en) | A radar weak fluctuating target tracking-before-detection method based on multi-Bernoulli filtering | |
| EP1588188A1 (en) | Method of detecting a target | |
| CN113376613B (en) | Constant false alarm detection method and device for radar detection and electronic equipment | |
| Sahal et al. | Comparison of CFAR methods on multiple targets in sea clutter using SPX-radar-simulator | |
| JP5491924B2 (en) | Target detection apparatus and target detection method | |
| US9864051B2 (en) | Method of estimating a local plot density in a radar system; a plot density estimator and a radar system with a plot density estimator | |
| CN110837079A (en) | Target detection method and device based on radar | |
| CN106249241B (en) | A kind of self-adapting clutter power statistic algorithm | |
| CN114355324A (en) | Flight path generation method | |
| GB2610389A (en) | Radar system and associated apparatus and methods | |
| CN107976663A (en) | It is a kind of based on the external illuminators-based radar of subspace projection to targeted compression detection method | |
| CN118011383A (en) | Indoor multi-target tracking method, device, equipment and storage medium | |
| CN109239677B (en) | An Environmental Adaptive Constant False Alarm Detection Threshold Determination Method | |
| US5854601A (en) | Methods for estimating the number of emitters and their parameters | |
| CN114280568B (en) | Wall contour recognition method and device | |
| Fonseca | Improving the scan statistic to design sensor detection systems | |
| RU2297014C1 (en) | Mode of detection of an object's trajectory | |
| Park et al. | Adaptive selection method for generalized likelihood ratio test | |
| US5995038A (en) | Wake filter for false alarm suppression and tracking | |
| CN115407315B (en) | Point cloud denoising method, point cloud denoising device, detection radar and storage medium | |
| CN119126145B (en) | Active target detection method and device based on laser radar | |
| WO2025194543A1 (en) | System and method using 5g positioning with non-line of sight information from sensors |
Legal Events
| Date | Code | Title | Description |
|---|---|---|---|
| AS | Assignment |
Owner name: TERMA A/S, DENMARK Free format text: ASSIGNMENT OF ASSIGNORS INTEREST;ASSIGNOR:NIELSEN, ESBEN;REEL/FRAME:036906/0689 Effective date: 20151021 |
|
| STCF | Information on status: patent grant |
Free format text: PATENTED CASE |
|
| CC | Certificate of correction | ||
| MAFP | Maintenance fee payment |
Free format text: PAYMENT OF MAINTENANCE FEE, 4TH YEAR, LARGE ENTITY (ORIGINAL EVENT CODE: M1551); ENTITY STATUS OF PATENT OWNER: LARGE ENTITY Year of fee payment: 4 |
|
| MAFP | Maintenance fee payment |
Free format text: PAYMENT OF MAINTENANCE FEE, 8TH YEAR, LARGE ENTITY (ORIGINAL EVENT CODE: M1552); ENTITY STATUS OF PATENT OWNER: LARGE ENTITY Year of fee payment: 8 |