US9864033B1 - Free induction decay based magnetic resonance imaging methods - Google Patents
Free induction decay based magnetic resonance imaging methods Download PDFInfo
- Publication number
- US9864033B1 US9864033B1 US14/469,228 US201414469228A US9864033B1 US 9864033 B1 US9864033 B1 US 9864033B1 US 201414469228 A US201414469228 A US 201414469228A US 9864033 B1 US9864033 B1 US 9864033B1
- Authority
- US
- United States
- Prior art keywords
- fid
- magnetic field
- pulse
- sample
- field gradient
- Prior art date
- Legal status (The legal status is an assumption and is not a legal conclusion. Google has not performed a legal analysis and makes no representation as to the accuracy of the status listed.)
- Active, expires
Links
Images


Classifications
-
- G—PHYSICS
- G01—MEASURING; TESTING
- G01R—MEASURING ELECTRIC VARIABLES; MEASURING MAGNETIC VARIABLES
- G01R33/00—Arrangements or instruments for measuring magnetic variables
- G01R33/20—Arrangements or instruments for measuring magnetic variables involving magnetic resonance
- G01R33/44—Arrangements or instruments for measuring magnetic variables involving magnetic resonance using nuclear magnetic resonance [NMR]
- G01R33/48—NMR imaging systems
- G01R33/50—NMR imaging systems based on the determination of relaxation times, e.g. T1 measurement by IR sequences; T2 measurement by multiple-echo sequences
-
- G—PHYSICS
- G01—MEASURING; TESTING
- G01N—INVESTIGATING OR ANALYSING MATERIALS BY DETERMINING THEIR CHEMICAL OR PHYSICAL PROPERTIES
- G01N24/00—Investigating or analyzing materials by the use of nuclear magnetic resonance, electron paramagnetic resonance or other spin effects
- G01N24/08—Investigating or analyzing materials by the use of nuclear magnetic resonance, electron paramagnetic resonance or other spin effects by using nuclear magnetic resonance
- G01N24/081—Making measurements of geologic samples, e.g. measurements of moisture, pH, porosity, permeability, tortuosity or viscosity
-
- G—PHYSICS
- G01—MEASURING; TESTING
- G01R—MEASURING ELECTRIC VARIABLES; MEASURING MAGNETIC VARIABLES
- G01R33/00—Arrangements or instruments for measuring magnetic variables
- G01R33/20—Arrangements or instruments for measuring magnetic variables involving magnetic resonance
- G01R33/44—Arrangements or instruments for measuring magnetic variables involving magnetic resonance using nuclear magnetic resonance [NMR]
- G01R33/48—NMR imaging systems
- G01R33/4816—NMR imaging of samples with ultrashort relaxation times such as solid samples, e.g. MRI using ultrashort TE [UTE], single point imaging, constant time imaging
-
- G—PHYSICS
- G01—MEASURING; TESTING
- G01R—MEASURING ELECTRIC VARIABLES; MEASURING MAGNETIC VARIABLES
- G01R33/00—Arrangements or instruments for measuring magnetic variables
- G01R33/20—Arrangements or instruments for measuring magnetic variables involving magnetic resonance
- G01R33/44—Arrangements or instruments for measuring magnetic variables involving magnetic resonance using nuclear magnetic resonance [NMR]
- G01R33/48—NMR imaging systems
- G01R33/54—Signal processing systems, e.g. using pulse sequences ; Generation or control of pulse sequences; Operator console
- G01R33/56—Image enhancement or correction, e.g. subtraction or averaging techniques, e.g. improvement of signal-to-noise ratio and resolution
-
- G—PHYSICS
- G01—MEASURING; TESTING
- G01V—GEOPHYSICS; GRAVITATIONAL MEASUREMENTS; DETECTING MASSES OR OBJECTS; TAGS
- G01V3/00—Electric or magnetic prospecting or detecting; Measuring magnetic field characteristics of the earth, e.g. declination, deviation
- G01V3/14—Electric or magnetic prospecting or detecting; Measuring magnetic field characteristics of the earth, e.g. declination, deviation operating with electron or nuclear magnetic resonance
Definitions
- the present invention relates generally to the field of magnetic resonance imaging (“MRI”), and more specifically, to the field of free induction decay (“FID”) based MRI and associated methods.
- MRI magnetic resonance imaging
- FID free induction decay
- FID Free induction decay
- Single point imaging uses a pulse sequence first introduced by Emid and Creyghton [9] and extensively analyzed by Choi et al. [10].
- SPI and SPRITE [5] an advanced SPI method, are FID based MRI methods which have proven to be ideal for imaging short relaxation time systems.
- the images acquired employing SPI methods are not distorted by artifacts due to B 0 inhomogeneity, chemical shift and susceptibility variations [6].
- the significant disadvantage is a long acquisition time, due to low flip angle RF pulses and the very limited number of FID points acquired after each excitation pulse [7].
- multipoint k-space mapping proposed by Cho and Ro [8].
- the present invention relates to a pure phase encode measurement method where the FID signal is encoded by a brief pure phase encode magnetic field gradient pulse. Data collection occurs once the gradient is turned off. Multiple free induction decay points are then acquired which are identically encoded such that a full k space data set is acquired for each FID point. Fourier transformation of these data sets generates one dimensional images with identical fields of view. The image series which results may be fit to a T 2 * decay function and the T 2 * magnetic resonance (“MR”) lifetime mapped. Fluid content (proton density) images may also be generated by this simple fitting procedure. Mapping multiple FID points results in more accurate fluid content images when pore fluid is being imaged in a solid matrix.
- MR magnetic resonance
- K space may be scanned in a centric manner, k space origin data acquired first, or in a sequential linear fashion. This is determined by the order of the phase encode gradient amplitudes applied.
- One dimensional profile imaging may be acquired and may be extended to two and three spatial dimensions in the same manner as for conventional FID based MRI methods.
- a one dimensional (“1-D”) phase-encoding sequence for T 2 * mapping for imaging a porous medium and for providing fluid content distribution in porous media.
- the phase-encoding sequence results in a series of individual T 2 * weighted images, acquired following a RF excitation and a pulsed phase-encoding gradient.
- Key to the performance of methods according to embodiments of the present invention (sometimes referred to herein as “FID-SPI”, is high quality control of the magnetic field gradient pulse to ensure each FID point has identical spatial encoding.
- FID-SPI is intended for a quantitative determination of the spatially resolved fluid content in heterogeneous porous media, having the ability to determine the T 2 * decay for each image pixel.
- T 2 * mapping aids in estimation of the local fluid content.
- FID based MRI methods of the present invention may be used for a variety of purposes including proton density imaging and T 2 * of physical systems.
- Such physical systems include, without limitation, solid matrices, including porous media such as subterranean formations, reservoir rock, sedimentary rock, mortar and concrete and wherein the porous media may contain a fluid such as water and/or a hydrocarbon, and other physical and biological systems with short T 2 .
- a method of MRI including providing a sample space, providing a sample in the sample space, applying a static magnetic field to the sample space, applying an RF pulse to the sample space, applying a gradient magnetic pulse to the static field, and measuring a FID signal of the sample space after the RF and gradient magnetic pulses have ceased.
- the RF pulse may be a 90 degree pulse or a low flip angle RF pulse.
- the FID signal is sampled at a series of times separated by a dwell time.
- the step of applying an RF pulse to the sample space may be repeated along with the step of applying a gradient magnetic pulse to the static field wherein the strength of the gradient magnetic pulse is increased or decreased (and may be increased or decreased in a series of increments) relative to the previously applied gradient pulse sequence.
- the gradient magnetic pulse encodes the FID signal in one, two or three directions and may further include applying a Fourier transform to generate a plurality of images, one image at each dwell time on the FID.
- the FID signal may be used to generate an image of the content of the pores comprising fitting a specified image pixel as a function of dwell time to yield a local value of a time constant (such as T 2 *) describing the local FID decay.
- the zero time intercept is proportional to fluid content in a porous media.
- a method of MRI including providing a sample space, providing a sample in the sample space, applying a static magnetic field to the sample space, applying an RF pulse to the sample space, applying a phase-encode magnetic field gradient pulse to the static field thereby providing spatial encoding, measuring a FID signal of the sample space after the RF and magnetic field gradient pulses have ceased, repeating the steps of: applying an RF pulse, applying a phase-encode magnetic field gradient pulse and measuring a FID signal of the sample, wherein the step of applying a phase-encode magnetic field gradient pulse, when repeated, further comprises incrementally increasing or decreasing the phase-encode magnetic field gradient pulse relative to the last applied phase-encode magnetic field gradient pulse, and deriving an image of the sample from the FID signal measurements comprising applying a Fourier transform to generate a plurality of images, one image at each dwell time on the FID.
- Each RF pulse may be a 90 degree pulse or a low flip angle RF pulse.
- the FID signals may be a series of times separated by a dwell time. The repeated steps may be repeated a sufficient number of times in order to derive an image of interest of the sample.
- the method may further include providing simultaneously two orthogonal magnetic field gradient pulses and wherein the image derived from the sample is a 2-D image.
- the method may further include providing simultaneously three orthogonal magnetic field gradient pulses and wherein the plurality of images derived from the sample is a 3-D image.
- the magnetic field gradient pulses may have durations which are as short as possible such that the plurality of images have consistent FOVs.
- the plurality of images may be used to generate an image of proton density comprising fitting a specified image pixel as a function of dwell time to yield a local value of a time constant describing the local FID decay.
- the time constant may correspond to a bi-exponential decay, an exponential decay, or a non-exponential decay.
- FIG. 1 is a depiction of a sequential FID pulse sequence according to an embodiment of the present invention
- FIG. 2 is a depiction of a prior art SPI pulse sequence
- FIG. 3 is a depiction of a centric scan FID pulse sequence according to an embodiment of the present invention.
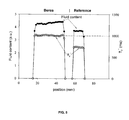
- FIG. 4 are depictions of experimental profiles of a brine-saturated Berea core plug and a reference
- FIG. 5 is an axial spin-density map (solid circles) for the brine-saturated Berea sandstone core plug and the reference of FIG. 4 and the derived T 2 * maps (open circles);
- FIG. 6 are Semilog plots of signal decay for the central pixel of each of the profiles of brine-saturated Berea sandstone (solid circles) and the reference (open circles) of FIG. 4 ;
- FIG. 7 is a plot of an output gradient waveform and a pre-equalized gradient waveform.
- the present invention relates to a FID based MRI method including a FID pulse sequence.
- the FID pulse sequence of the present invention is an improved SPI pulse sequence wherein, a full spatially encoded FID is acquired after RF pulse excitation, and after the phase-encoding gradient pulse is turned off.
- Each FID point, appropriately phase encoded yields a 1D image (profile) upon Fourier transformation.
- the 1-D T 2 * distribution map and the spin density through back extrapolation to time zero. Fitting is most readily undertaken employing a single exponential function, although the temporal resolution of the experiment would permit fitting to more complicated decay functions.
- a high quality, rapidly switched, shaped magnetic field gradient pulse is required to ensure spatial encoding is the same for all FID points.
- a shaped gradient waveform that delivers a trapezoidal gradient pulse to the sample volume with gradient rise and fall times, in the sample space, of less than 200 microseconds may be used.
- This 1-D imaging sequence can be easily modified for acquiring 2-D and 3-D FID-SPI T 2 * weighted images.
- a 1-D FID pulse sequence is depicted in FIG. 1 , and may be used to generate a one-dimensional image for each of the acquired complex data points during the FID of the spin system.
- the phase encoding gradient G z applied for the encoding time t p , is stepped with a 90° RF pulse applied prior to each of the magnetic field gradient amplitudes employed during the measurement, as illustrated in FIG. 1 .
- the gray rectangle indicates the acquisition time window for the measurement.
- the free induction decay (FID) signal is observed not only at a singular fixed time, as in a conventional SPI pulse sequence, but at a series of fixed times, separated by the dwell time ⁇ .
- the pulse sequence is applied repeatedly and each time the strength of the magnetic field gradient pulse is incremented.
- a series of 1-D, T 2 *-weighted profiles result after Fourier transformation of the acquired data set.
- the signal amplitude variations of the acquired k-space points correspond both to the T 2 * decay and the phase accumulated as a function of the systematically increasing phase-encoding gradient for the duration of the encoding time t p .
- a certain region (z 0 ) generates an NMR signal given by:
- the signal amplitude variations of the acquired phase encoding in the direction of interest is achieved by applying a gradient pulse for time t p .
- the resolution in phase encoding imaging depends on the gradient pulse “area” ⁇ 0 t p G max(t) dt, where G max(t) is the gradient waveform for the largest gradient strength needed, for all the T 2 *-weighted profiles, the resolution is the same, regardless of the shape of the gradient pulses.
- a centric scan version of a FID pulse sequence is depicted in FIG. 3 .
- a set of FID points is acquired after a low flip angle RF pulse, ⁇ .
- the phase encoding gradient G z is stepped with an RF pulse at every gradient amplitude.
- the encoding time is t P
- RD is the relaxation delay
- the repetition time, TR is the time between subsequent RF pulses.
- the gray rectangles in FIG. 3 indicate the acquisition time windows for each half of the k-space line.
- the centric scan idea was successfully integrated in the SPRITE imaging technique [11], [12], [13].
- the RF pulse repetition time is TR and the delay RD between the k-space halves is set to be 2-5 times the longest T 1 of the sample, so that the centre of k-space is acquired when the longitudinal magnetization has equilibrium value M 0 .
- T 1 instead manifests itself as a blurring factor.
- a recently developed pre-equalization technique [14] may be employed to calculate an input gradient waveform that yields a desired output gradient waveform, based on measurements of the system impulse response.
- the Berea sandstone core plug under test was saturated with 1% (w/w) solution of NaCl in distilled water. Natural drying during the experiment was minimized by wrapping the core with Teflon tape and a plastic film.
- the Berea sandstone (Kokurek Industries, Caldwell, Tex.) core plug is a coarse-grained, quasi-homogeneous sandstone, considered a standard porous medium for laboratory experiments.
- the local image intensity was calibrated with an external reference (a solution of 37.2% (w/w) H 2 O, 62.1% (w/w) D 2 O and 0.7% (w/w) MnSO 4 .H 2 O), simulating 40% porosity.
- the bulk T 1 measurement gave 252 ms (73%) and 36 ms (27%), when fit to a bi-exponential recovery model.
- the results presented here were acquired with shaped gradient pulses generated with a recently developed pre-equalization technique [14].
- the first profile was acquired 250 ⁇ s after the RF pulse.
- 1-D, 2-D and 3-D FID pulse sequences were implemented on a 3-D 8.52 MHz Maran DRX-HF imaging system (Oxford Instruments, Abingdon, UK), equipped with a 1000-watt RF amplifier (Tomco Technologies, Stepney, Australia), AE Techron 7782 gradient amplifiers (AE Techron, Elkhart, Ind.) and water cooled gradients (for the chosen direction, the maximum gradient strength was 24 G/cm).
- the 44 mm inner diameter home-made RF probe provided 90° RF pulses with a duration of 10.9 ⁇ s for an input RF power of 300 watts.
- the phase cycle, for all FID-SPI experiments was set x, y, ⁇ x, ⁇ y for the RF pulse and the same for the receiver.
- the filter dead time was 19.2 ⁇ s.
- the image reconstruction and data fitting were performed using various packages developed in the IDL programming environment (Exelis, Boulder, Colo.) and the final images were generated in SigmaPlot (Systat Software, San Jose, Calif.). Prior to Fourier transformation, the k-space data was smoothed with a Hanning low pass k-space filter.
- the 1-D FID pulse sequence of FIG. 1 was employed.
- the 64-pixel primary data with a field of view of 96 mm had a nominal resolution of 1.5 mm/pixel and a total of 64 profiles were acquired, separated by t of 50 ⁇ s.
- t p 250 ⁇ s
- the highest magnetic field gradient was 10.25 G/m.
- the measurement time was 10.83 minutes for 8 scans.
- the centric scan 1-D FID-SPI pulse sequence of FIG. 3 was employed.
- the encoding time was 250 ⁇ s
- the highest magnetic field gradient was 10.25 G/m
- the relaxation delay 1.26 seconds.
- a relatively wide filter width of 125 kHz was employed in both 1-D experiments described above, in order to take advantage of a short filter deadtime, namely 19.2 ⁇ s.
- Centric scan 2-D FID-SPI experiments were undertaken to explore higher dimensionality imaging.
- the heterogeneous Locharbriggs sample (Centre for Materials Science and Engineering, University of Edinburgh) had a diameter of 37 mm and a length of 39 mm. It was a fine-to-medium grained, red-brown quartz sandstone with a bedding plane structure.
- the bulk T 1 measurement gave 201.5 ms (74%) and 18.2 ms (26%), when fit to a bi-exponential recovery model.
- the bulk T 2 * from a single exponential bulk FID for the same sample was 1470 ⁇ s.
- the local image intensity was calibrated with the external reference, simulating 40% porosity, employed in the 1-D FID-SPI experiments.
- the encoding time t p was 250 ⁇ s, and the first profile was acquired 480 ⁇ s after the RF pulse. 50 images, separated by ⁇ of 32 ⁇ s, were acquired in 10.5 min by averaging 32 scans.
- the receiver filter width was 31.25 kHz.
- the sample consisted of a whole walnut immersed in honey contained in 38.10-mm inner diameter polycarbonate cylinder; the height of the honey column was 39.25 mm (including the meniscus).
- the bulk relaxation times were measured before immersion.
- the bulk T 1 measurement gave 140.2 ms (72%) and 21.1 ms (28%), when fit to a bi-exponential recovery model.
- the bulk T 2 * from a single exponential fit for the same sample was 6.6 ms.
- honey the bulk T 1 measurement gave 4.2 ms, when fit to a single exponential recovery model and the bulk T 2 * from a single exponential fit for the same sample was 1.1 ms.
- the encoding time t p was 250 ⁇ s, and the first image was acquired 532 ⁇ s after the RF pulse.
- a receiver filter width of 31.25 kHz was employed.
- FIG. 6 displays the mono-exponential fitting curves for the central pixels of each of the profiles of the Berea sandstone core plug and the reference.
- FIG. 5 depicts an axial spin-density map (solid circles) for the brine-saturated Berea sandstone core plug and the reference and the derived T 2 * maps (open circles). Uncertainty in the data points is determined through data fitting. Uncertainty in the T 2 * and the fluid content maps is generally half the data point size. All FID points and related profiles have identical fields of view (checked by projecting all the profiles into the time zero plane).
- FIG. 6 depicts semilog plots of signal decay for the central pixel of each of the profiles of brine-saturated Berea sandstone (solid circles) and the reference (open circles).
- the T 2 * decay is single exponential for each sample.
- the solid lines represent the corresponding monoexponential fitting curves.
- the derived amplitude of the profiles for these two central pixels were obtained by the extrapolation of the decay curve to zero time.
- the effective spin-spin relaxation times are 1,020 ⁇ s for Berea and 740 ⁇ s for the reference sample.
- the pixel average T 2 * calculated from the T 2 * map of the homogeneous Berea was 1010 ⁇ 10 ⁇ s (see FIG. 5 ).
- the bulk T 2 * from a single exponential fit for the same sample was 995 ⁇ 1 ⁇ s. Uncertainty in the data points was determined by the fitting. The quality of data is such that more complicated fitting is possible, if required.
- the T 2 * fitting with multiple FID points yields a reliable spin density estimate, especially when t p ⁇ T 2 *.
- the porosity of the Berea sandstone core was found to be 20.7 ⁇ 0.5%. This is in close agreement with the known gravimetric result of 21.0 ⁇ 0.1%.
- the FID based MRI methods according to the present invention permit faster and more accurate spin-density mapping by acquiring hundreds of FID points and images to fit, in comparison with the earlier SPRITE mapping technique [2], where one would acquire 8 to 16 FID points and images, each requiring a separate SPRITE experiment.
- the centric scan 3-D FID-SPI pulse sequence was implemented and tested to prove its ability to acquire a series of 3-D T 2 *-weighted images of a complex sample.
- Both FID-SPI methods according to embodiments of the present invention, and prior art SPRITE techniques are capable of generating reliable spin density maps of porous media, based on T 2 * mapping measurements. The circumstances under which these measurements are performed reveal the advantage of choosing one method over the other. Assuming the minimum encoding time t p is always selected, there are three experimental regimes for quantitative density imaging [17]:
- FID-SPI imaging methods are advantageous especially for case (3), since it permits faster and more accurate spin-density mapping by acquiring tens and hundreds of FID points and images to fit, in comparison with SPRITE, which requires a separate experiment for each acquired FID point and image [2].
- the duration of the phase-encode magnetic field gradient pulse should be as short as possible consistent with the functional limitations of the MRI hardware used to apply the phase-encode magnetic field gradient pulse and be consistent with a high quality phase-encode magnetic field gradient pulse.
- a high quality phase-encode magnetic field gradient pulse is one that is well-controlled.
- a well-controlled phase-encode magnetic field gradient pulse is one in which images generated from individual FID dwell times during induction decay have a consistent FOV.
- the durations in certain of the above examples is 250 ⁇ s. However, in certain embodiments of the present invention, the duration may be more than or less than 250 ⁇ s depending upon the MRI hardware used.
- the duration may be 200 ⁇ s. In still further embodiments, the duration may be 175 ⁇ s. In still further embodiments, the duration may be 150 ⁇ s. In still further embodiments, the duration may be 100 ⁇ s. In still further embodiments, the duration may be between about 150 ⁇ s and about 250 ⁇ s.
- the magnetic field gradient waveform monitoring technique [15] directly measures the temporal evolution of the magnetic field gradient from a step-like input function and extracts the system impulse response. The impulse response is used to determine a pre-equalized (optimized) input waveform that provides a desired gradient response in the sample space.
- the pre-equalized waveform with a duration of 8 ms, and the waveform experienced by the sample are shown in FIG. 7 .
- the pre-equalized waveform has a quasi-trapezoidal shape such that the gradient amplifier slew rate and bandwidth limitations (25 kHz) are not exceeded.
- the maximum possible gradient error was calculated based on gradient area accumulated during the acquisition of the first two FID point profiles. Error which would lead to a variation in the FOV of less than one pixel means a maximum residual gradient of less than 3.8%. With a maximum gradient of 7.6 G/cm, this means an instantaneous gradient error between the first two FID points detected of less than 0.29 G/cm. The same calculation was undertaken for the first and the eleventh FID points. These two data points differ by 500 ⁇ s. The maximum possible gradient error which would lead to a FOV difference of one pixel is 0.48%. The maximum gradient error is thus 0.036 G/cm for the strongest phase encode gradient (7.6 G/cm), at the midpoint between the first and the eleventh FID points.
Landscapes
- Physics & Mathematics (AREA)
- High Energy & Nuclear Physics (AREA)
- General Physics & Mathematics (AREA)
- Life Sciences & Earth Sciences (AREA)
- Condensed Matter Physics & Semiconductors (AREA)
- Engineering & Computer Science (AREA)
- Health & Medical Sciences (AREA)
- Environmental & Geological Engineering (AREA)
- Geology (AREA)
- General Life Sciences & Earth Sciences (AREA)
- General Health & Medical Sciences (AREA)
- Nuclear Medicine, Radiotherapy & Molecular Imaging (AREA)
- Remote Sensing (AREA)
- Geochemistry & Mineralogy (AREA)
- Chemical & Material Sciences (AREA)
- Analytical Chemistry (AREA)
- Biochemistry (AREA)
- Geophysics (AREA)
- Immunology (AREA)
- Pathology (AREA)
- Radiology & Medical Imaging (AREA)
- Signal Processing (AREA)
- Magnetic Resonance Imaging Apparatus (AREA)
Abstract
Description
is dominated by the susceptibility difference between the pore fluid and solid matrix of the porous media sample, resulting in an effective single exponential T2* decay, that scales with B0. This occurs even when T2 (the spin-spin relaxation time) and T1 (the spin-lattice relaxation time) are multi-exponential due to the distribution of pore sizes [4].
where n is the resolution [6]. In FID for the 1-D pulse sequence depicted in
- [1] Q. Chen, A. E. Marble, B. G. Colpitts and B. J. Balcom, The internal magnetic field distribution, and single exponential magnetic resonance free induction decay in rocks, J. Magn. Reson. 175 (2005) 300-308.
- [2] F. Marica, Q. Chen, A. Hamilton, C. Hall, T. Al and B. J. Balcom, Spatially Resolved Measurement of Rock Core Porosity, J. Magn. Reson. 178 (2006) 136-141.
- [3] B. J. Balcom, J. C. Barrita, C. Choi, S. D. Beyea, D. J. Goodyear and T. W. Bremner, Single-point magnetic resonance imaging (MRI) of cement based materials, Materials and Structures 36 (2003) 166-182.
- [4] R. L. Kleinberg, W. E. Kenyon and P. P. Mitra, Mechanism of NMR relaxation of fluids in rock, J. Magn. Reson. A108 (1994) 206-214.
- [5] B. J. Balcom, R. P. MacGregor, S. D. Beyea, D. P. Green, R. L. Armstrong and T. W. Bremner, Single Point Ramped Imaging with T1 Enhancement (SPRITE), J. Magn. Reson. A123 (1996) 131-134.
- [6] S. Gravina and D. G. Cory, Sensitivity and resolution of constant-time imaging, J. Magn. Reson. B104 (1994) 53-61.
- [7] M. Halse, J. Rioux, S. Romanzetti, J. Kaffanke, B. MacMillan, I. Mastikhin, N. J. Shah, E. Aubanel and B. J. Balcom, Centric Scan SPRITE Magnetic Resonance Imaging: Optimization of SNR, resolution and relaxation time mapping, J. Magn. Reson. 169 (2004) 102-117.
- [8] Z. H. Cho and Y. M. Ro, Multipoint K-space point mapping (KPM) technique for NMR microscopy, Magnetic Resonance in Medicine 32(2) (1994) 258-262.
- [9] S. Emid and J. Creyghton, High resolution NMR imaging in solids, Physica 128B (1985) 81-83.
- [10] S. Choi, X.-W. Tang and D. G. Cory, Constant time imaging approaches to NMR microscopy, International Journal of Imaging Systems and Technology 8(3) (1997) 263-276.
- [11] I. V. Mastikhin, H. Mullally, B. MacMillan and B. J. Balcom, Water content profiles with a 1D centric SPRITE acquisition, J. Magn. Reson. 156 (2002) 122-130.
- [12] M. Halse, D. J. Goodyear, B. MacMillan, P. Szomolanyi, D. Matheson and B. J. Balcom, Centric scan SPRITE magnetic resonance imaging, J. Magn. Reson. 165 (2003) 219-229.
- [13] K. Deka, M. B. MacMillan, A. V. Ouriadov, I. V. Mastikhin, J. J. Young, P. M. Glover, G. R. Ziegler and B. J. Balcom, Quantitative density profiling with pure phase encoding, J. Magn. Reson. 178 (2006) 25-32.
- [14] F. G. Goora, B. Colpitts and B. J. Balcom, Arbitrary Magnetic Field Gradient Waveform Correction using an Impulse Response Based Pre-Equalization Technique, J. Magn. Reson. 2013 (submitted).
- [15] H. Han, R. P. MacGregor and B. J. Balcom, Pure Phase Encode Magnetic Field Gradient Monitor, J. Magn. Reson. 201 (2009) 212-217.
- [16] B. J. Balcom, M. Bogdan, R. L. Armstrong, Single point imaging of gradient rise, stabilization, and decay, J. Magn. Reson. A 118 (1996) 122-125.
- [17] C. E. Muir, B. J. Balcom, Pure Phase Encode Magnetic Resonance Imaging of Fluids in Porous Media, in: G. Webb (Ed.), Annual Reports on NMR Spectroscopy, vol. 77, Academic Press, Burlington, 2012, pp. 81-113.
Claims (12)
Priority Applications (1)
| Application Number | Priority Date | Filing Date | Title |
|---|---|---|---|
| US14/469,228 US9864033B1 (en) | 2013-08-26 | 2014-08-26 | Free induction decay based magnetic resonance imaging methods |
Applications Claiming Priority (2)
| Application Number | Priority Date | Filing Date | Title |
|---|---|---|---|
| US201361870011P | 2013-08-26 | 2013-08-26 | |
| US14/469,228 US9864033B1 (en) | 2013-08-26 | 2014-08-26 | Free induction decay based magnetic resonance imaging methods |
Publications (1)
| Publication Number | Publication Date |
|---|---|
| US9864033B1 true US9864033B1 (en) | 2018-01-09 |
Family
ID=60813511
Family Applications (1)
| Application Number | Title | Priority Date | Filing Date |
|---|---|---|---|
| US14/469,228 Active 2035-11-28 US9864033B1 (en) | 2013-08-26 | 2014-08-26 | Free induction decay based magnetic resonance imaging methods |
Country Status (1)
| Country | Link |
|---|---|
| US (1) | US9864033B1 (en) |
Cited By (3)
| Publication number | Priority date | Publication date | Assignee | Title |
|---|---|---|---|---|
| CN112384817A (en) * | 2018-07-03 | 2021-02-19 | 皇家飞利浦有限公司 | MRI method for B0 mapping |
| CN112834543A (en) * | 2020-04-28 | 2021-05-25 | 苏州纽迈分析仪器股份有限公司 | One-dimensional space-selected slice T2 spectrum measurement method based on pulse gradient hardware structure |
| US11486949B1 (en) * | 2019-08-01 | 2022-11-01 | University Of New Brunswick | Method and apparatus for T1-T2* relaxation correlation magnetic resonance measurement of materials |
Citations (14)
| Publication number | Priority date | Publication date | Assignee | Title |
|---|---|---|---|---|
| US4516075A (en) * | 1983-01-04 | 1985-05-07 | Wisconsin Alumni Research Foundation | NMR scanner with motion zeugmatography |
| US4654593A (en) * | 1985-02-13 | 1987-03-31 | University Of Cincinnati | Method for chemical and tomographic analysis of a moving object by nuclear magnetic resonance |
| US4684891A (en) * | 1985-07-31 | 1987-08-04 | The Regents Of The University Of California | Rapid magnetic resonance imaging using multiple phase encoded spin echoes in each of plural measurement cycles |
| US4709211A (en) * | 1985-07-11 | 1987-11-24 | Kabushiki Kaisha Toshiba | Nuclear magnetic resonance system |
| USRE32701E (en) * | 1983-01-04 | 1988-06-21 | Wisconsin Alumni Research Foundation | NMR scanner with motion zeugmatography |
| US5121059A (en) * | 1989-06-22 | 1992-06-09 | U.S. Philips Corporation | Magnetic resonance spectroscopie imaging method |
| US5122748A (en) * | 1990-08-13 | 1992-06-16 | The Trustees Of Columbia University In The City Of New York | Method and apparatus for spatial localization of magnetic resonance signals |
| US7230424B1 (en) * | 2005-06-17 | 2007-06-12 | Fonar Corporation | Magnetic resonance imaging |
| US20080150525A1 (en) * | 2006-12-20 | 2008-06-26 | Schlumberger Technology Corporation | Method and apparatus to improve nmr spectral resolution in an inhomogeneous magnetic field |
| US20110249881A1 (en) * | 2008-12-26 | 2011-10-13 | Hitachi Medical Corporation | Magnetic resonance imaging apparatus and method of compensation for readout gradient magnetic field error |
| US20120076383A1 (en) * | 2010-09-27 | 2012-03-29 | David Grodzki | Magnetic resonance system and method to automatically generate a selective mr image |
| US20120074938A1 (en) * | 2010-09-27 | 2012-03-29 | David Grodzki | Magnetic resonance method and system to generate an image data set |
| US20130076357A1 (en) * | 2011-09-28 | 2013-03-28 | David Grodzki | Method and magnetic resonance apparatus to generate a series of mr images to monitor a position of an interventional device |
| US20140232400A1 (en) * | 2011-10-26 | 2014-08-21 | Korea Research Institute Of Standards And Science | Object discrimination method using ultra-low magnetic field nuclear magnetic resonance and an object discrimination apparatus of the same |
-
2014
- 2014-08-26 US US14/469,228 patent/US9864033B1/en active Active
Patent Citations (14)
| Publication number | Priority date | Publication date | Assignee | Title |
|---|---|---|---|---|
| US4516075A (en) * | 1983-01-04 | 1985-05-07 | Wisconsin Alumni Research Foundation | NMR scanner with motion zeugmatography |
| USRE32701E (en) * | 1983-01-04 | 1988-06-21 | Wisconsin Alumni Research Foundation | NMR scanner with motion zeugmatography |
| US4654593A (en) * | 1985-02-13 | 1987-03-31 | University Of Cincinnati | Method for chemical and tomographic analysis of a moving object by nuclear magnetic resonance |
| US4709211A (en) * | 1985-07-11 | 1987-11-24 | Kabushiki Kaisha Toshiba | Nuclear magnetic resonance system |
| US4684891A (en) * | 1985-07-31 | 1987-08-04 | The Regents Of The University Of California | Rapid magnetic resonance imaging using multiple phase encoded spin echoes in each of plural measurement cycles |
| US5121059A (en) * | 1989-06-22 | 1992-06-09 | U.S. Philips Corporation | Magnetic resonance spectroscopie imaging method |
| US5122748A (en) * | 1990-08-13 | 1992-06-16 | The Trustees Of Columbia University In The City Of New York | Method and apparatus for spatial localization of magnetic resonance signals |
| US7230424B1 (en) * | 2005-06-17 | 2007-06-12 | Fonar Corporation | Magnetic resonance imaging |
| US20080150525A1 (en) * | 2006-12-20 | 2008-06-26 | Schlumberger Technology Corporation | Method and apparatus to improve nmr spectral resolution in an inhomogeneous magnetic field |
| US20110249881A1 (en) * | 2008-12-26 | 2011-10-13 | Hitachi Medical Corporation | Magnetic resonance imaging apparatus and method of compensation for readout gradient magnetic field error |
| US20120076383A1 (en) * | 2010-09-27 | 2012-03-29 | David Grodzki | Magnetic resonance system and method to automatically generate a selective mr image |
| US20120074938A1 (en) * | 2010-09-27 | 2012-03-29 | David Grodzki | Magnetic resonance method and system to generate an image data set |
| US20130076357A1 (en) * | 2011-09-28 | 2013-03-28 | David Grodzki | Method and magnetic resonance apparatus to generate a series of mr images to monitor a position of an interventional device |
| US20140232400A1 (en) * | 2011-10-26 | 2014-08-21 | Korea Research Institute Of Standards And Science | Object discrimination method using ultra-low magnetic field nuclear magnetic resonance and an object discrimination apparatus of the same |
Non-Patent Citations (19)
| Title |
|---|
| B.J. Balcom, J.C. Barrita, C. Choi, S.D. Beyea, D.J. Goodyear, T.W. Bremner, "Single-point magnetic resonance imaging (MRI) of cement based materials", Materials Structures 36 (2003) 166-182. |
| B.J. Balcom, M. Bogdan, R.L. Armstrong, "Single point imaging of gradient rise, stabilization, and decay", Journal of Magnetic Resonance A 118 (1996) 122-125. |
| B.J. Balcom, R.P. MacGregor, S.D. Beyea, D.P. Green, R.L. Armstrong, T.W. Bremner, "Single point ramped imaging with T1 enhancement"(SPRITE), Journal of Magnetic Resonance A123 (1996) 131-134. |
| C.E. Muir, B.J. Balcom, "Pure Phase Encode Magnetic Resonance Imaging of Fluids in Porous Media", in: G. Webb (Ed.), Annual Reports on NMR Spectroscopy, vol. 77, Academic Press, Burlington, 2012, pp. 81-113. |
| F. Marica, Q. Chen, A. Hamilton, C. Hall, T. Ai, B.J. Balcom, "Spatially resolved measurement of rock core porosity", Journal of Magnetic Resonance 178 (2006) 136-141. |
| F.G. Goora, B. Colpitts, B.J. Balcom, "Arbitrary magnetic field gradient waveform correction using an impulse response based pre-equalization technique", Journal of Magnetic Resonance 238 (2014) 70-76. |
| H. Han, R.P. MacGregor, B.J. Balcom, "Pure phase encode magnetic field gradient monitor", Journal of Magnetic Resonance 201 (2009) 212-217. |
| I.V. Mastikhin, H. Mullally, B. MacMillan, B.J. Balcom, "Water content profiles with a 1D centric SPRITE acquisition", Journal of Magnetic Resonance 156 (2002) 122-130. |
| K. Deka, M.B. MacMillan, A.V. Ouriadov, I.V. Mastikhin, J.J. Young, P.M. Glover, G.R. Ziegler, B.J. Balcom, "Quantitative density profiling with pure phase encoding and a dedicated 1D gradient", Journal of Magnetic Resonance 178 (2006) 25-32. |
| K. Romanenko, B.J. Balcom, "Permeability mapping in naturally heterogeneous sandstone cores by magnetization prepared centric"-scan SPRITE, AlChE Journal, vol. 58, No. 12 ( Dec. 2012) 3916-3926. |
| K. Romanenko, B.J. Balcom, "Permeability mapping in naturally heterogeneous sandstone cores by magnetization prepared centric"—scan SPRITE, AlChE Journal, vol. 58, No. 12 ( Dec. 2012) 3916-3926. |
| M. Halse, D.J. Goodyear, B. MacMillan, P. Szomolanyi, D. Matheson, B.J. Balcom, "Centric scan SPRITE magnetic resonance imaging", Journal of Magnetic Resonance 165 (2003) 219-229. |
| M. Halse, J. Rioux, S. Romanzetti, J. Kaffanke, B. MacMillan, I. Mastikhin, N.J. Shah, E. Aubanel, B.J. Balcom, "Centric scan SPRITE magnetic resonance imaging: optimization of SNR, resolution and relaxation time mapping", Journal of Magnetic Resonance 169 (2004) 102-117. |
| Q. Chen, A.E. Marble, B.G. Colpitts, B.J. Balcom, "The internal magnetic field distribution, and single exponential magnetic resonance free induction decay in rocks", Journal of Magnetic Resonance 175 (2005) 300-308. |
| R.L. Kleinberg, W.E. Kenyon, P.P. Mitra, "Mechanism of NMR relaxation of fluids in rock", Journal of Magnetic Resonance A108 (1994) 206-214. |
| S. Choi, X.-W. Tang, D.G. Cory, "Constant time imaging approaches to NMR microscopy", Department of Nuclear Engineering, Massachusetts Institute of Technology, vol. 8 (3) (1997) 263-276. |
| S. Emid, J. Creyghton, "High resolution NMR imaging in solids", Physica 128B (1985) 81-83. |
| S. Gravina, D.G. Cory, "Sensitivity and resolution of constant-time imaging", Journal of Magnetic Resonance B104 (1994) 53-61. |
| Z.H. Cho, Y.M. Ro, "Multipoint K-space point mapping (KPM) technique for NMR microscopy", Magn. Reson. Med. 32 (2) (1994) 258-262. |
Cited By (4)
| Publication number | Priority date | Publication date | Assignee | Title |
|---|---|---|---|---|
| CN112384817A (en) * | 2018-07-03 | 2021-02-19 | 皇家飞利浦有限公司 | MRI method for B0 mapping |
| US11486949B1 (en) * | 2019-08-01 | 2022-11-01 | University Of New Brunswick | Method and apparatus for T1-T2* relaxation correlation magnetic resonance measurement of materials |
| CN112834543A (en) * | 2020-04-28 | 2021-05-25 | 苏州纽迈分析仪器股份有限公司 | One-dimensional space-selected slice T2 spectrum measurement method based on pulse gradient hardware structure |
| CN112834543B (en) * | 2020-04-28 | 2024-05-14 | 苏州纽迈分析仪器股份有限公司 | One-dimensional space layer selection T based on pulse gradient hardware structure2Spectrum testing method |
Similar Documents
| Publication | Publication Date | Title |
|---|---|---|
| US9018950B2 (en) | Spin echo SPI methods for quantitative analysis of fluids in porous media | |
| US4431968A (en) | Method of three-dimensional NMR imaging using selective excitation | |
| Mitchell et al. | Quantitative in situ enhanced oil recovery monitoring using nuclear magnetic resonance | |
| US5652516A (en) | Spectroscopic magnetic resonance imaging using spiral trajectories | |
| EP3080634B1 (en) | Zero echo time mr imaging with water/fat separation | |
| US6815952B1 (en) | Magnetic resonance diffusion imaging with eddy-current compensation | |
| US9702953B1 (en) | Method of sampling in pure phase encode magnetic resonance imaging | |
| US7328054B2 (en) | Perfusion magnetic resonance imaging using encoded RF tagging pulses | |
| CN111537928B (en) | Magnetic resonance system gradient field measurement method based on diffusion effect | |
| GB2420859A (en) | NMR measurement of flowing fluids | |
| US9389193B1 (en) | Spatially resolved magnetic resonance spin-spin relaxation distribution measurement methods | |
| US8717022B2 (en) | Magnetic field gradient monitor apparatus and method | |
| WO2021184471A1 (en) | Non-uniform field magnetic resonance system-based apparent diffusion coefficient measurment method | |
| CN118688242B (en) | A construction management method based on extremely weak magnetic monitoring | |
| WO2008037994A1 (en) | Method for radiofrequency mapping in magnetic resonance imaging | |
| Chelcea et al. | Distributions of transverse relaxation times for soft-solids measured in strongly inhomogeneous magnetic fields | |
| US9864033B1 (en) | Free induction decay based magnetic resonance imaging methods | |
| Marica et al. | FID-SPI pulse sequence for quantitative MRI of fluids in porous media | |
| Casanova et al. | Multi-echo imaging in highly inhomogeneous magnetic fields | |
| US5309099A (en) | Method of determining real-time spatially localized velocity distribution using magnetic resonance measurements | |
| US5905377A (en) | Method and apparatus for correcting gradient system and static magnetic field in magnetic resonance imaging | |
| US6239598B1 (en) | Process for rapid sample trajectory calibration for magnetic resonance imaging | |
| CN116106354B (en) | Multidimensional nuclear magnetic resonance T1-T2 imaging method | |
| Kittler et al. | Real-time fluid transport characterization through direct acquisition of the averaged propagator | |
| US5387866A (en) | Methods for high-speed measurement of spin-lattice relaxation times |
Legal Events
| Date | Code | Title | Description |
|---|---|---|---|
| AS | Assignment |
Owner name: UNIVERSITY OF NEW BRUNSWICK, CANADA Free format text: ASSIGNMENT OF ASSIGNORS INTEREST;ASSIGNORS:MARICA, FLOREA;BALCOM, BRUCE;REEL/FRAME:034068/0782 Effective date: 20130903 |
|
| STCF | Information on status: patent grant |
Free format text: PATENTED CASE |
|
| MAFP | Maintenance fee payment |
Free format text: PAYMENT OF MAINTENANCE FEE, 4TH YR, SMALL ENTITY (ORIGINAL EVENT CODE: M2551); ENTITY STATUS OF PATENT OWNER: SMALL ENTITY Year of fee payment: 4 |
|
| AS | Assignment |
Owner name: GREEN IMAGING TECHNOLOGIES INC., CANADA Free format text: ASSIGNMENT OF ASSIGNORS INTEREST;ASSIGNOR:THE UNIVERSITY OF NEW BRUNSWICK;REEL/FRAME:055355/0574 Effective date: 20210219 |
|
| MAFP | Maintenance fee payment |
Free format text: PAYMENT OF MAINTENANCE FEE, 8TH YR, SMALL ENTITY (ORIGINAL EVENT CODE: M2552); ENTITY STATUS OF PATENT OWNER: SMALL ENTITY Year of fee payment: 8 |