US9582897B2 - Lifeform image analysis system, lifeform image analysis method, and lifeform image analysis program - Google Patents
Lifeform image analysis system, lifeform image analysis method, and lifeform image analysis program Download PDFInfo
- Publication number
- US9582897B2 US9582897B2 US14/377,581 US201314377581A US9582897B2 US 9582897 B2 US9582897 B2 US 9582897B2 US 201314377581 A US201314377581 A US 201314377581A US 9582897 B2 US9582897 B2 US 9582897B2
- Authority
- US
- United States
- Prior art keywords
- lifeform
- image
- color
- extracted
- converted
- Prior art date
- Legal status (The legal status is an assumption and is not a legal conclusion. Google has not performed a legal analysis and makes no representation as to the accuracy of the status listed.)
- Active, expires
Links
Images


Classifications
-
- G—PHYSICS
- G06—COMPUTING OR CALCULATING; COUNTING
- G06T—IMAGE DATA PROCESSING OR GENERATION, IN GENERAL
- G06T7/00—Image analysis
- G06T7/90—Determination of colour characteristics
-
- G06T7/408—
-
- G06K9/0014—
-
- G06K9/4652—
-
- G—PHYSICS
- G06—COMPUTING OR CALCULATING; COUNTING
- G06T—IMAGE DATA PROCESSING OR GENERATION, IN GENERAL
- G06T11/00—Two-dimensional [2D] image generation
- G06T11/10—Texturing; Colouring; Generation of textures or colours
-
- G—PHYSICS
- G06—COMPUTING OR CALCULATING; COUNTING
- G06T—IMAGE DATA PROCESSING OR GENERATION, IN GENERAL
- G06T7/00—Image analysis
- G06T7/0002—Inspection of images, e.g. flaw detection
- G06T7/0012—Biomedical image inspection
-
- G06T7/0081—
-
- G—PHYSICS
- G06—COMPUTING OR CALCULATING; COUNTING
- G06V—IMAGE OR VIDEO RECOGNITION OR UNDERSTANDING
- G06V10/00—Arrangements for image or video recognition or understanding
- G06V10/40—Extraction of image or video features
- G06V10/56—Extraction of image or video features relating to colour
-
- G—PHYSICS
- G06—COMPUTING OR CALCULATING; COUNTING
- G06V—IMAGE OR VIDEO RECOGNITION OR UNDERSTANDING
- G06V20/00—Scenes; Scene-specific elements
- G06V20/60—Type of objects
- G06V20/69—Microscopic objects, e.g. biological cells or cellular parts
- G06V20/695—Preprocessing, e.g. image segmentation
-
- G—PHYSICS
- G06—COMPUTING OR CALCULATING; COUNTING
- G06T—IMAGE DATA PROCESSING OR GENERATION, IN GENERAL
- G06T2207/00—Indexing scheme for image analysis or image enhancement
- G06T2207/10—Image acquisition modality
- G06T2207/10024—Color image
-
- G—PHYSICS
- G06—COMPUTING OR CALCULATING; COUNTING
- G06T—IMAGE DATA PROCESSING OR GENERATION, IN GENERAL
- G06T2207/00—Indexing scheme for image analysis or image enhancement
- G06T2207/30—Subject of image; Context of image processing
- G06T2207/30004—Biomedical image processing
-
- G—PHYSICS
- G06—COMPUTING OR CALCULATING; COUNTING
- G06T—IMAGE DATA PROCESSING OR GENERATION, IN GENERAL
- G06T2207/00—Indexing scheme for image analysis or image enhancement
- G06T2207/30—Subject of image; Context of image processing
- G06T2207/30004—Biomedical image processing
- G06T2207/30024—Cell structures in vitro; Tissue sections in vitro
Definitions
- the present invention relates to a lifeform image analysis system, a lifeform image analysis method, and a lifeform image analysis program for analyzing a captured image of a lifeform sample.
- Patent Literature (PTL) 1 describes a method of extracting a gland duct from a lifeform image.
- PTL 2 describes an image processing device for correcting a lifeform image depending on an image reading device.
- the image processing device described in PTL 2 determines the type of lifeform (biological) tissue included in the lifeform image, and corrects the lifeform image depending on the identification information of the image reading device and the type of lifeform tissue.
- a lifeform image could differ in color from another lifeform image, due to differences in image capture device, lifeform sample staining, and the like. There is a problem in that a significant color difference causes lower accuracy of extracting the lifeform tissue from the lifeform image.
- the use of the image processing device described in PTL 2 enables absorbing the error of reading performance between image reading devices, and thus improves the lifeform image analysis accuracy.
- the same color distribution cannot always be ensured between lifeform images, due to the image capture environment and the staining state.
- the staining state could be different between different hospitals or different pathology laboratory companies.
- the daily staining state for the lifeform sample could be different. It is therefore desirable to improve the lifeform image analysis accuracy even in the case where a lifeform image with a different color distribution is included in the analysis object.
- the present invention has an exemplary object of providing a lifeform image analysis system, a lifeform image analysis method, and a lifeform image analysis program that can improve the lifeform image analysis accuracy even in the case where a lifeform image with a different color distribution is included in the analysis object.
- a lifeform image analysis system includes: an image input means which inputs a lifeform image which is a captured image of a lifeform sample; a structure standard color storage means which stores a standard color of a structure included in the lifeform image; a structure extraction means which extracts a target structure from the lifeform image; a structure color computation means which computes, from an image of the structure extracted by the structure extraction means, a color of the structure; and a color distribution conversion means which converts a color distribution of the input lifeform image so that a difference between the color of the structure computed by the structure color computation means and the standard color of the corresponding structure stored in the structure standard color storage means is reduced.
- a lifeform image analysis method includes: inputting a lifeform image which is a captured image of a lifeform sample; extracting a target structure from the lifeform image; computing, from an image of the extracted structure, a color of the structure; and converting a color distribution of the input lifeform image so that a difference between the computed color of the structure and a standard color of the corresponding structure is reduced.
- a lifeform image analysis program causes a computer to execute: an image input process of inputting a lifeform image which is a captured image of a lifeform sample; a structure extraction process of extracting a target structure from the lifeform image; a structure color computation process of computing, from an image of the extracted structure, a color of the structure; and a color distribution conversion process of converting a color distribution of the input lifeform image so that a difference between the computed color of the structure and a standard color of the corresponding structure is reduced.
- the lifeform image analysis accuracy can be improved even in the case where a lifeform image with a different color distribution is included in the analysis object.
- FIG. 1 It depicts a block diagram depicting a configuration example of Exemplary Embodiment 1 of a lifeform image analysis system according to the present invention.
- FIG. 2 It depicts an explanatory diagram depicting an example of a histogram matching method.
- FIG. 3 It depicts an explanatory diagram depicting an example of a pathological image to be analyzed and an extracted structure.
- FIG. 4 It depicts a flowchart depicting an operation example of the lifeform image analysis system.
- FIG. 5 It depicts an explanatory diagram depicting another example of the pathological image to be analyzed and the extracted structure.
- FIG. 6 It depicts an explanatory diagram depicting an example of a system for analyzing lifeform images captured in a plurality of facilities.
- FIG. 7 It depicts a block diagram depicting a configuration example of Exemplary Embodiment 2 of the lifeform image analysis system according to the present invention.
- FIG. 8 It depicts an explanatory diagram depicting an example of a lifeform image displayed by an extraction object display device 16 .
- FIG. 9 It depicts a block diagram schematically depicting the lifeform image analysis system according to the present invention.
- FIG. 1 is a block diagram depicting a configuration example of Exemplary Embodiment 1 of a lifeform image analysis system according to the present invention.
- the lifeform image analysis system in this exemplary embodiment includes an image input device 11 , a structure extraction device 12 , a color distribution distance computation device 13 , a color distribution conversion device 14 , and a structure standard color holding device 15 .
- the image input device 11 inputs a captured image (lifeform image) of a lifeform sample.
- the lifeform image is also referred to as “pathological image”.
- the image input device 11 may be an input device such as a keyboard for receiving a user's input.
- the image input device 11 may be a storage device such as a magnetic disk for storing the lifeform image beforehand.
- the image input device 11 may be realized by a network interface or the like.
- the structure standard color holding device 15 stores a standard color of a structure included in the lifeform image.
- structure includes the structure included in the lifeform image and a predetermined region specified by the structure
- color of the structure means a color representing the structure and the predetermined region specified by the structure.
- the standard color is expressed in, for example, an RGB system. Note that the method of expressing the standard color is not limited to the RGB system, and the standard color may be expressed by any other method that allows comparison with the color of the input image.
- the standard color of each structure is learned based on the structure included in images captured by a typically used scanner or the like, and stored in the structure standard color holding device 15 beforehand.
- An example of the normal color C 0 is an average value of colors in the region of the structure.
- the information indicating the standard color is not limited to the average value and the standard deviation, and the standard color may be indicated by any other information representing the feature of the color of the structure.
- a range D of color determined as the normal color is also set in the structure standard color holding device 15 .
- the structure standard color holding device 15 may store the distance d of the color determined as the normal color, as the range D.
- the structure extraction device 12 extracts a target structure from the lifeform image.
- the structure extraction device 12 specifies in which part of the lifeform image and in which shape, color, and size the target structure is present.
- Examples of the structure included in the lifeform image include: a lifeform tissue such as stroma, lymphocyte, erythrocyte, histiocyte, gland duct, blood vessel, adipocyte, or fibroblast; and a background outside a tissue. A background outside a tissue is typically displayed in white color.
- the structure extraction device 12 performs image processing corresponding to such a target structure, to extract the structure from the lifeform image.
- the structure extraction device 12 extracts the structure using image processing such as pattern matching.
- the structure extraction device 12 determines whether or not the color of the part to be extracted is within the range of the standard color and, in the case where the color is within the range of the standard color, extracts the part as the target structure.
- the structure extraction device 12 may determine whether or not the color is within the range of the standard color, based on whether or not the distance d computed according to Expression 1 shown above is included in the range D of color determined as the standard color.
- the color distribution distance computation device 13 computes, from the structure extracted by the structure extraction device 12 , the color of the structure.
- the color distribution distance computation device 13 computes, from the picture elements (hereafter also referred to as “pixels”) included in the region of the structure extracted by the structure extraction device 12 , an average color C k and a standard deviation ⁇ k as the color of the structure.
- the information computed by the color distribution distance computation device 13 is not limited to the average color C k and the standard deviation ⁇ k .
- the color distribution distance computation device 13 may compute other information as the color of the structure, so long as the information can indicate the difference from the above-mentioned standard color.
- the color distribution conversion device 14 converts the color distribution of the input lifeform image so that the difference between the color of the target structure computed by the color distribution distance computation device 13 and the standard color of the corresponding structure stored in the structure standard color holding device 15 is reduced.
- the color distribution conversion device 14 may convert the color distribution of the lifeform image so that the average color and the standard deviation in the region of the structure extracted by the structure extraction device 12 respectively match the normal color C 0 and the standard deviation ⁇ 0 of the structure stored in the structure standard color holding device 15 .
- the process of converting the color distribution is represented by, for example, the following Expression 2.
- X′ ⁇ 0 ( X ⁇ )/ ⁇ + ⁇ 0 (Expression 2).
- X is the current RGB value of a pixel
- X′ is the converted RGB value of the pixel
- the color distribution conversion device 14 may perform the conversion process using Expression 2 shown above as an example, on each value of R, G, and B indicated by each pixel in the lifeform image.
- the converted value r i ′ is computed according to the following Expression 3.
- r i ′ ⁇ 0r ( r i ⁇ R )/ ⁇ r +R 0 (Expression 3).
- the color distribution conversion device 14 may convert the color distribution of the lifeform image so that the color distribution (histogram) in the region of the structure extracted by the structure extraction device 12 matches the histogram of the standard color of the structure.
- the structure standard color holding device 15 holds the histogram of the standard color, instead of the normal color and the standard deviation of the structure.
- FIG. 2 is an explanatory diagram depicting an example of the histogram matching method.
- the structure standard color holding device 15 stores a one-dimensional histogram for each of R, G, and B. This histogram (hereafter referred to as “standard histogram H 0 ”) is given beforehand (see (b) in FIG. 2 ).
- the color distribution conversion device 14 computes a color histogram H k of the pixels included in the extracted structure, for the luminance of each of R, G, and B (see (a) in FIG. 2 ).
- the color distribution conversion device 14 converts the computed color histogram H k to a cumulative distribution (cumulative histogram), and computes the corresponding luminance.
- FIG. 2 depicts an example of a cumulative distribution F k obtained by converting the current color histogram
- FIG. 2 depicts an example of a standard cumulative distribution F 0 obtained by converting the standard histogram.
- a pixel value x in the currently acquired structure corresponds to a cumulative number y in the cumulative distribution F k in (c) in FIG. 2
- the pixel value of the cumulative number y is x 0 in the standard cumulative distribution F 0 in (d) in FIG. 2
- the pixel value x in the currently acquired structure corresponds to x 0 in the standard histogram.
- the color distribution conversion device 14 accordingly converts the pixel value x in the currently acquired structure to x 0 .
- F ⁇ 1 0 is an inverse function of the standard cumulative distribution.
- the color distribution conversion device 14 inputs the converted lifeform image to the structure extraction device 12 .
- the structure extraction device 12 again extracts the target structure from the converted lifeform image.
- the color distribution distance computation device 13 determines whether or not the difference between the color of the structure extracted from the image before the conversion and the color of the structure extracted from the converted image is within a predetermined threshold ⁇ .
- the color distribution distance computation device 13 may compute the distance d using the above-mentioned Expression 1 as the difference between the colors, and determine whether or not the distance is within the predetermined threshold ⁇ .
- the color distribution distance computation device 13 may compute the distance d between the distributions as the difference between the colors, and determine whether or not the distance is within the predetermined threshold ⁇ . For instance, the Kullback-Leibler divergence computed according to the following Expression 5, the total variation distance computed according to the following Expression 6, or the Hellinger distance computed according to the following Expression 7 is available as the distance d between the distributions.
- p 0 (x) and p(x) each denote a frequency of normalizing the value x.
- the lifeform image can be more appropriately converted and thus the lifeform image analysis accuracy can be improved.
- the color distribution conversion process is performed on the whole lifeform image. In the case where the original lifeform image is large, however, sequentially performing the color conversion process on all pixels could require a lot of time. Hence, the color distribution conversion device 14 may perform the color distribution conversion process on a part of the lifeform image.
- the color distribution conversion device 14 may compute a conversion parameter based on the conversion process performed on a partial region of the image and, in the case of determining that the image has been converted to an image with a normal color distribution, apply the computed conversion parameter to the whole lifeform image.
- the structure extraction device 12 extracts the target structure from a part of the lifeform image specified by a predetermined position and size.
- the color distribution conversion device 14 converts the color distribution of the part of the lifeform image so that the difference between the color of the structure and the standard color is reduced. In the case where the change of the converted color distribution is less than a predetermined criterion, the color distribution conversion device 14 converts the color distribution of the whole lifeform image.
- the color distribution conversion device 14 may use, for example, the above-mentioned threshold ⁇ as the criterion for the change of the color distribution.
- the color distribution conversion device 14 may end the conversion process on the part of the lifeform image in the case where there is no more significant change of the color distribution, and convert the color distribution of the whole lifeform image. The time required for the conversion process can be reduced in this way.
- the structure extraction device 12 , the color distribution distance computation device 13 , and the color distribution conversion device 14 are realized by a CPU of a computer operating according to a program (lifeform image analysis program).
- the program may be stored in a storage unit (not depicted) in each device, with the CPU (Central Processing Unit) reading the program and, according to the program, operating as the structure extraction device 12 , the color distribution distance computation device 13 , and the color distribution conversion device 14 .
- the structure extraction device 12 , the color distribution distance computation device 13 , and the color distribution conversion device 14 may each be realized by dedicated hardware, as in the lifeform image analysis system in this exemplary embodiment.
- the structure extraction device 12 , the color distribution distance computation device 13 , and the color distribution conversion device 14 may be realized as one device.
- FIG. 3 is an explanatory diagram depicting an example of the pathological image to be analyzed and the extracted structure.
- a pathological image 21 depicted in (a) in FIG. 3 as an example is an image captured by the typically used scanner.
- a structure of nuclei 22 is appropriately extracted using a standard parameter learned beforehand.
- a pathological image 23 depicted in (b) in FIG. 3 as an example is an image captured by a scanner different from the typically used scanner.
- the pathological image is captured with a color distribution different from that of the typically captured image, due to scanner performance and the like. It is therefore difficult to appropriately extract the structure of the nuclei 22 using the standard parameter learned beforehand.
- a process of enabling extraction of the nuclei 22 depicted in (a) in FIG. 3 as an example from the pathological image depicted in (b) in FIG. 3 as an example is described below.
- FIG. 4 is a flowchart depicting an operation example of the lifeform image analysis system in this exemplary embodiment.
- FIG. 5 is an explanatory diagram depicting another example of the pathological image to be analyzed and the extracted structure. The following describes the case of extracting the nuclei in the pathological image as the structure, though the structure to be extracted is not limited to the nuclei.
- the pathological image depicted in (a) in FIG. 5 as an example is input to the image input device 11 (step S 1 in FIG. 4 ).
- the structure extraction device 12 extracts the target structure (the nuclei in this example) from the input pathological image (step S 2 ). For instance, nuclei 26 depicted in (b) in FIG. 5 as an example are extracted.
- the color distribution distance computation device 13 computes the color of the extracted structure (step S 3 ). For example, the color distribution distance computation device 13 computes an average color and a standard deviation from colors in the region of the extracted nuclei 26 . The color distribution distance computation device 13 may compute a color histogram in the region of the extracted nuclei 26 .
- the color distribution distance computation device 13 determines whether or not the difference between the color of the structure extracted from the image before the conversion and the color of the structure extracted from the converted image is within the predetermined threshold ⁇ (step S 4 ).
- the color distribution conversion device 14 converts the color distribution of the pathological image so that the difference between the color computed from the target structure and the standard color is reduced (step S 5 ).
- the color distribution of the pathological image is converted as depicted in (c) in FIG. 5 as an example.
- the lifeform image analysis system then repeats the process from step S 2 , for the pathological image whose color distribution has been converted.
- the structure extraction device 12 again extracts the target structure (the nuclei in this example) from the pathological image whose color distribution has been converted (step S 2 ). Since the color distribution has been converted, for instance, nuclei 28 depicted in (d) in FIG. 5 as an example are extracted. As is clear from the comparison between (b) and (d) in FIG. 5 , the target structure can be more appropriately extracted from the converted pathological image.
- the color distribution distance computation device 13 computes the color of the structure extracted from the converted pathological image (step S 3 ), and determines whether or not the difference between the color of the structure extracted from the image before the conversion and the color of the structure extracted from the converted image is within the predetermined threshold ⁇ (step S 4 ). In the case where the difference between the colors is within the predetermined threshold ⁇ (Yes in step S 4 ), the color distribution distance computation device 13 ends the process, and outputs the lifeform image whose color distribution has been converted.
- the structure extraction device 12 extracts the target structure from the lifeform image, and the color distribution distance computation device 13 computes the color of the extracted structure.
- the color distribution conversion device 14 then converts the color distribution of the lifeform image so that the difference between the computed color of the structure and the standard color is reduced. The lifeform image analysis accuracy can thus be improved even in the case where a lifeform image with a different color distribution is included in the analysis object.
- FIG. 6 is an explanatory diagram depicting an example of a system for remotely analyzing lifeform images captured in a plurality of facilities.
- Specimens 62 lifeform samples taken in these facilities 61 could differ in color distribution due to differences in staining, image capture device, and the like, as mentioned earlier.
- the lifeform image analysis system in this exemplary embodiment is introduced in an analysis center 63 .
- the difference in color distribution between the lifeform images captured in these facilities can be absorbed in the case where these specimens 62 are transmitted to the analysis center 63 via an Internet network 64 .
- the structure extraction device 12 may output an image obtained by superimposing the extracted structure on the input lifeform image.
- Such a configuration enhances the visibility of the target structure even in the case where there is a difference in color distribution between slides. This contributes to higher lifeform image analysis accuracy for doctors and the like.
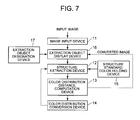
- FIG. 7 is a block diagram depicting a configuration example of Exemplary Embodiment 2 of the lifeform image analysis system according to the present invention.
- the lifeform image analysis system in this exemplary embodiment includes the image input device 11 , the structure extraction device 12 , the color distribution distance computation device 13 , the color distribution conversion device 14 , the structure standard color holding device 15 , an extraction object display device 16 , and an extraction object designation device 17 .
- the lifeform image analysis system in this exemplary embodiment differs from the lifeform image analysis system in Exemplary Embodiment 1 in that the extraction object display device 16 and the extraction object designation device 17 are further included.
- the same components as those in Exemplary Embodiment 1 are given the same reference signs as in FIG. 1 , and their description is omitted.
- the extraction object display device 16 displays the lifeform image input to the image input device 11 .
- the extraction object designation device 16 also displays the lifeform image as a result of the color distribution conversion process.
- the extraction object designation device 17 receives, for the lifeform image displayed by the extraction object display device 16 , the user's designation of the range subjected to the color distribution conversion process and the structure to be extracted, and notifies the extraction object display device 16 of the designation.
- the extraction object display device 16 displays the input lifeform image.
- the extraction object display device 16 inputs information indicating the designated structure to be extracted and an image of the designated range, to the structure extraction device 12 .
- the extraction object display device 16 also displays the image of the range in which the color distribution has been converted, together with the lifeform image.
- the extraction object display device 16 may superimpose the image whose color distribution has been converted on the original lifeform image, or separately display the original lifeform image and the image whose color distribution has been converted.
- the superimposition of the image whose color distribution has been converted on the original lifeform image by the extraction object display device 16 has an advantageous effect of enhancing the visibility of the size, shape, color distribution, and the like of the structure.
- the extraction object designation device 17 is realized by, for example, an input device such as a pointing device.
- the extraction object display device 16 is realized by, for example, a display device such as a display.
- the extraction object display device 16 and the extraction object designation device 17 may be integrally formed as an input/output device such as a touch panel.
- FIG. 8 is an explanatory diagram depicting an example of the lifeform image displayed by the extraction object display device 16 .
- the extraction object display device 16 is realized by a display
- the extraction object designation device 17 is realized by a mouse.
- the extraction object designation device 17 receives the user's designation of the extraction object.
- the range of the image is designated by dragging the mouse.
- candidates for the structure to be extracted are displayed by clicking the right mouse button, and the structure to be extracted is designated by selecting the extraction object from the candidates.
- the extraction object display device 16 displays “lymphocyte” and “cell nucleus” as the candidates for the structure to be extracted, and “cell nucleus” is selected from the candidates.
- the extraction object display device 16 then superimposes an image 31 whose color distribution has been converted, on the original input image.
- the extraction object designation device 17 receives, for the lifeform image, the user's designation of the range of the lifeform image subjected to the color distribution conversion process and the structure to be extracted from the lifeform image.
- the structure extraction device 12 extracts the designated structure from the lifeform image of the designated range.
- the extraction object display device 16 displays the converted lifeform image together with the original lifeform image.
- FIG. 9 is a block diagram schematically depicting the lifeform image analysis system according to the present invention.
- the lifeform image analysis system according to the present invention includes: an image input means 81 (e.g. the image input device 11 ) which inputs a lifeform image which is a captured image of a lifeform sample; a structure standard color storage means 82 (e.g. the structure standard color holding device 15 ) which stores a standard color (e.g. the normal color C 0 and the standard deviation ⁇ 0 of the structure, the color histogram of the structure) of a structure included in the lifeform image; a structure extraction means 83 (e.g. the structure extraction device 12 ) which extracts a target structure (e.g.
- an image input means 81 e.g. the image input device 11
- a structure standard color storage means 82 e.g. the structure standard color holding device 15
- a standard color e.g. the normal color C 0 and the standard deviation ⁇ 0 of the structure, the color his
- a structure color computation means 84 (the color distribution distance computation device 13 ) which computes, from an image of the structure extracted by the structure extraction means 83 , a color of the structure; and a color distribution conversion means 85 (e.g. the color distribution conversion device 14 ) which converts a color distribution of the input lifeform image so that a difference between the color of the structure computed by the structure color computation means 84 and the standard color of the corresponding structure stored in the structure standard color storage means 82 is reduced.
- the structure extraction means 83 may extract the target structure from the lifeform image whose color distribution has been converted by the color distribution conversion means 85 .
- the lifeform image analysis accuracy can be improved even in the case where a lifeform image with a different color distribution is included in the analysis object.
- the structure color computation means 84 may determine whether or not a difference between the color of the structure extracted from the lifeform image before the conversion by the color distribution conversion means 85 and the color of the structure extracted from the lifeform image converted by the color distribution conversion means 85 is within a predetermined threshold (e.g. the threshold ⁇ ), and the color distribution conversion means 85 may convert the color distribution of the converted lifeform image, in the case where the difference exceeds the predetermined threshold.
- a predetermined threshold e.g. the threshold ⁇
- the structure extraction means 83 may extract the target structure from a part of the lifeform image
- the color distribution conversion means 85 may convert the color distribution of the part of the lifeform image so that the difference between the color of the structure and the standard color of the corresponding structure is reduced and, in the case where a change of the color distribution is less than a predetermined criterion (e.g. in the case where there is no more significant change of the color distribution), convert the color distribution of the whole lifeform image.
- a predetermined criterion e.g. in the case where there is no more significant change of the color distribution
- the structure color computation means 84 may compute, from pixels included in a region of the structure extracted by the structure extraction means 83 , an average color and a standard deviation as the color of the structure, and the color distribution conversion means 85 may convert the color distribution of the lifeform image so that the average color and the standard deviation match the standard color of the structure.
- the structure color computation means 84 may compute a histogram of pixels included in a region of the structure extracted by the structure extraction means 83 , as the color of the structure, and the color distribution conversion means 85 may convert the color distribution of the lifeform image so that the computed histogram matches the standard color of the structure.
- the structure standard color storage means 82 may store a range (e.g. the range D) of color determined as the standard color of the structure, and the structure extraction means 83 may extract, in the case where a color of a part to be extracted is within the range, the part as the target structure.
- a range e.g. the range D
- the structure extraction means 83 may extract, in the case where a color of a part to be extracted is within the range, the part as the target structure.
- the lifeform image analysis system may include: an extraction object designation means (e.g. the extraction object designation device 17 ) which receives, for the input lifeform image, a designation of a range of the lifeform image subjected to a color distribution conversion process and a designation of a structure to be extracted from the lifeform image; and a display means (e.g. the extraction object display device 16 ) which displays the lifeform image whose color distribution has been converted, together with the original lifeform image.
- the structure extraction means 83 may extract the designated structure from the lifeform image of the range designated by the extraction object designation means.
- the extraction result can be displayed in a visually understandable manner.
- the present invention is suitably used for a lifeform image analysis system for analyzing a captured image of a lifeform sample.
Landscapes
- Engineering & Computer Science (AREA)
- Physics & Mathematics (AREA)
- General Physics & Mathematics (AREA)
- Theoretical Computer Science (AREA)
- Health & Medical Sciences (AREA)
- General Health & Medical Sciences (AREA)
- Computer Vision & Pattern Recognition (AREA)
- Multimedia (AREA)
- Nuclear Medicine, Radiotherapy & Molecular Imaging (AREA)
- Radiology & Medical Imaging (AREA)
- Quality & Reliability (AREA)
- Medical Informatics (AREA)
- Life Sciences & Earth Sciences (AREA)
- Biomedical Technology (AREA)
- Molecular Biology (AREA)
- Image Processing (AREA)
- Image Analysis (AREA)
- Investigating Or Analysing Biological Materials (AREA)
Abstract
Description
- PTL 1: Japanese Patent Application Laid-Open No. 2009-229203
- PTL 2: Japanese Patent Application Laid-Open No.
d=[(R 0 −R)2+(G 0 −G)2+(B 0 −B)2]1/2 (Expression 1).
X′=σ 0(X−μ)/σ+μ0 (Expression 2).
r i′=σ0r(r i −R)/σr +R 0 (Expression 3).
y=F k(x)
x 0 =F −1 0(y) (Expression 4).
-
- 11 image input device
- 12 structure extraction device
- 13 color distribution distance computation device
- 14 color distribution conversion device
- 15 structure standard color holding device
- 16 extraction object display device
- 17 extraction object designation device
- 21, 23 pathological image
- 22, 26, 28 nuclei
Claims (13)
Applications Claiming Priority (3)
| Application Number | Priority Date | Filing Date | Title |
|---|---|---|---|
| JP2012026066 | 2012-02-09 | ||
| JP2012-026066 | 2012-02-09 | ||
| PCT/JP2013/000307 WO2013118436A1 (en) | 2012-02-09 | 2013-01-23 | Lifeform image analysis system, lifeform image analysis method, and lifeform image analysis program |
Publications (2)
| Publication Number | Publication Date |
|---|---|
| US20150023592A1 US20150023592A1 (en) | 2015-01-22 |
| US9582897B2 true US9582897B2 (en) | 2017-02-28 |
Family
ID=48947216
Family Applications (1)
| Application Number | Title | Priority Date | Filing Date |
|---|---|---|---|
| US14/377,581 Active 2033-02-05 US9582897B2 (en) | 2012-02-09 | 2013-01-23 | Lifeform image analysis system, lifeform image analysis method, and lifeform image analysis program |
Country Status (3)
| Country | Link |
|---|---|
| US (1) | US9582897B2 (en) |
| JP (1) | JP5910637B2 (en) |
| WO (1) | WO2013118436A1 (en) |
Families Citing this family (3)
| Publication number | Priority date | Publication date | Assignee | Title |
|---|---|---|---|---|
| JP5557091B2 (en) * | 2010-03-30 | 2014-07-23 | 日本電気株式会社 | Image processing apparatus, image reading apparatus, image processing method, and image processing program |
| SE538435C2 (en) * | 2014-05-14 | 2016-06-28 | Cellavision Ab | Method, device and computer program product for determining color transforms between images comprising a plurality of image elements |
| JP7666292B2 (en) * | 2021-10-27 | 2025-04-22 | トヨタ自動車株式会社 | Determination device, determination method, and determination program |
Citations (7)
| Publication number | Priority date | Publication date | Assignee | Title |
|---|---|---|---|---|
| JPH07198714A (en) | 1993-12-28 | 1995-08-01 | Asahi Breweries Ltd | Cell activity determination method and device |
| JP2003116593A (en) | 2001-10-17 | 2003-04-22 | Hakuju Inst For Health Science Co Ltd | Method for judging microorganism and device therefor |
| US20050276457A1 (en) | 2002-08-15 | 2005-12-15 | Qinetiq Limited | Histological assessment |
| JP2009229203A (en) | 2008-03-21 | 2009-10-08 | Nec Corp | Pathologic image diagnostic system, pathologic image diagnostic method and program |
| JP2010060564A (en) | 2002-08-15 | 2010-03-18 | Qinetiq Ltd | Histological assessment |
| JP2011210156A (en) | 2010-03-30 | 2011-10-20 | Nec Corp | Image processing apparatus, image reading apparatus, image processing method and image processing program |
| US9014443B2 (en) * | 2010-01-04 | 2015-04-21 | Nec Corporation | Image diagnostic method, image diagnostic apparatus, and image diagnostic program |
-
2013
- 2013-01-23 WO PCT/JP2013/000307 patent/WO2013118436A1/en not_active Ceased
- 2013-01-23 JP JP2013557398A patent/JP5910637B2/en active Active
- 2013-01-23 US US14/377,581 patent/US9582897B2/en active Active
Patent Citations (8)
| Publication number | Priority date | Publication date | Assignee | Title |
|---|---|---|---|---|
| JPH07198714A (en) | 1993-12-28 | 1995-08-01 | Asahi Breweries Ltd | Cell activity determination method and device |
| JP2003116593A (en) | 2001-10-17 | 2003-04-22 | Hakuju Inst For Health Science Co Ltd | Method for judging microorganism and device therefor |
| US20050276457A1 (en) | 2002-08-15 | 2005-12-15 | Qinetiq Limited | Histological assessment |
| JP2010060564A (en) | 2002-08-15 | 2010-03-18 | Qinetiq Ltd | Histological assessment |
| JP2009229203A (en) | 2008-03-21 | 2009-10-08 | Nec Corp | Pathologic image diagnostic system, pathologic image diagnostic method and program |
| US9014443B2 (en) * | 2010-01-04 | 2015-04-21 | Nec Corporation | Image diagnostic method, image diagnostic apparatus, and image diagnostic program |
| JP2011210156A (en) | 2010-03-30 | 2011-10-20 | Nec Corp | Image processing apparatus, image reading apparatus, image processing method and image processing program |
| US20130011036A1 (en) * | 2010-03-30 | 2013-01-10 | Nec Corporation | Image processing apparatus, image reading apparatus, image processing method and information storage medium |
Non-Patent Citations (1)
| Title |
|---|
| International Search Report and Written Opinion of ISA mailed May 14, 2013. |
Also Published As
| Publication number | Publication date |
|---|---|
| US20150023592A1 (en) | 2015-01-22 |
| WO2013118436A1 (en) | 2013-08-15 |
| JPWO2013118436A1 (en) | 2015-05-11 |
| JP5910637B2 (en) | 2016-04-27 |
Similar Documents
| Publication | Publication Date | Title |
|---|---|---|
| US11989882B2 (en) | Histological image analysis | |
| Ginley et al. | Computational segmentation and classification of diabetic glomerulosclerosis | |
| US10885365B2 (en) | Method and apparatus for detecting object keypoint, and electronic device | |
| CN109791693B (en) | Digital pathology systems and related workflows for providing visual whole-slice image analysis | |
| US9383347B2 (en) | Pathological diagnosis results assessment system, pathological diagnosis results assessment method, and pathological diagnosis results assessment device | |
| US9014443B2 (en) | Image diagnostic method, image diagnostic apparatus, and image diagnostic program | |
| US8605972B2 (en) | Automatic image alignment | |
| JP7479387B2 (en) | Confidence measures for deployed machine learning models | |
| EP2859833A1 (en) | Image processing device, image processing method, and image processing program | |
| Lavdas et al. | Machine learning in whole-body MRI: experiences and challenges from an applied study using multicentre data | |
| US11417021B2 (en) | System and method for color deconvolution of a slide image to assist in the analysis of tissue specimen | |
| US9424640B2 (en) | Pathological diagnosis support apparatus and pathological diagnosis support method | |
| Chen et al. | Microscope 2.0: an augmented reality microscope with real-time artificial intelligence integration | |
| US9582897B2 (en) | Lifeform image analysis system, lifeform image analysis method, and lifeform image analysis program | |
| Awan et al. | Deep feature based cross-slide registration | |
| KR102528405B1 (en) | Method and Apparatus for Classify Images using Neural Network Trained for Image Classification | |
| CN118134890A (en) | Brain age prediction method and device based on deep double-branch network and electronic equipment | |
| KR102075454B1 (en) | Web-based system and method for providing 3d brain neural circuit image | |
| Lin et al. | Addition of a threshold mechanism to model observers for medical image quality assessment | |
| CN115359066A (en) | Focus detection method and device for endoscope, electronic device and storage medium | |
| US9972085B2 (en) | Antinuclear antibody image analysis system, antinuclear antibody image analysis method, and antinuclear antibody image analysis program | |
| US10304671B2 (en) | Method for computer-assisted analysis of one or more tissue sections of the human or animal body | |
| Tong et al. | Interactive non-uniformity correction and intensity standardization of MR images | |
| JP7148794B2 (en) | LEARNING DATA GENERATION PROGRAM, LEARNING DATA GENERATION DEVICE, AND LEARNING DATA GENERATION METHOD | |
| Senbi et al. | Towards Ground-truth-free Evaluation of Any Segmentation in Medical Images |
Legal Events
| Date | Code | Title | Description |
|---|---|---|---|
| AS | Assignment |
Owner name: NEC CORPORATION, JAPAN Free format text: ASSIGNMENT OF ASSIGNORS INTEREST;ASSIGNOR:KIYUNA, TOMOHARU;REEL/FRAME:033494/0420 Effective date: 20140606 |
|
| STCF | Information on status: patent grant |
Free format text: PATENTED CASE |
|
| MAFP | Maintenance fee payment |
Free format text: PAYMENT OF MAINTENANCE FEE, 4TH YEAR, LARGE ENTITY (ORIGINAL EVENT CODE: M1551); ENTITY STATUS OF PATENT OWNER: LARGE ENTITY Year of fee payment: 4 |
|
| MAFP | Maintenance fee payment |
Free format text: PAYMENT OF MAINTENANCE FEE, 8TH YEAR, LARGE ENTITY (ORIGINAL EVENT CODE: M1552); ENTITY STATUS OF PATENT OWNER: LARGE ENTITY Year of fee payment: 8 |