US9488582B2 - Methods for measuring concentrations of chlorinated solvents through raman spectroscopic observation of the vibrational modes of water - Google Patents
Methods for measuring concentrations of chlorinated solvents through raman spectroscopic observation of the vibrational modes of water Download PDFInfo
- Publication number
- US9488582B2 US9488582B2 US14/656,136 US201514656136A US9488582B2 US 9488582 B2 US9488582 B2 US 9488582B2 US 201514656136 A US201514656136 A US 201514656136A US 9488582 B2 US9488582 B2 US 9488582B2
- Authority
- US
- United States
- Prior art keywords
- chlorinated solvent
- raman
- turbid
- concentration
- water
- Prior art date
- Legal status (The legal status is an assumption and is not a legal conclusion. Google has not performed a legal analysis and makes no representation as to the accuracy of the status listed.)
- Active
Links
Images


Classifications
-
- G—PHYSICS
- G01—MEASURING; TESTING
- G01N—INVESTIGATING OR ANALYSING MATERIALS BY DETERMINING THEIR CHEMICAL OR PHYSICAL PROPERTIES
- G01N21/00—Investigating or analysing materials by the use of optical means, i.e. using sub-millimetre waves, infrared, visible or ultraviolet light
- G01N21/62—Systems in which the material investigated is excited whereby it emits light or causes a change in wavelength of the incident light
- G01N21/63—Systems in which the material investigated is excited whereby it emits light or causes a change in wavelength of the incident light optically excited
- G01N21/65—Raman scattering
-
- G—PHYSICS
- G01—MEASURING; TESTING
- G01N—INVESTIGATING OR ANALYSING MATERIALS BY DETERMINING THEIR CHEMICAL OR PHYSICAL PROPERTIES
- G01N33/00—Investigating or analysing materials by specific methods not covered by groups G01N1/00 - G01N31/00
- G01N33/18—Water
- G01N33/182—Specific anions in water
-
- Y—GENERAL TAGGING OF NEW TECHNOLOGICAL DEVELOPMENTS; GENERAL TAGGING OF CROSS-SECTIONAL TECHNOLOGIES SPANNING OVER SEVERAL SECTIONS OF THE IPC; TECHNICAL SUBJECTS COVERED BY FORMER USPC CROSS-REFERENCE ART COLLECTIONS [XRACs] AND DIGESTS
- Y10—TECHNICAL SUBJECTS COVERED BY FORMER USPC
- Y10T—TECHNICAL SUBJECTS COVERED BY FORMER US CLASSIFICATION
- Y10T436/00—Chemistry: analytical and immunological testing
- Y10T436/19—Halogen containing
- Y10T436/193333—In aqueous solution
Definitions
- the present disclosure generally relates to methods and apparatus for determining concentrations of chlorinated solvents in aqueous solutions of chlorinated solvents through Raman spectroscopy, and in particular by Raman spectroscopic observation of vibrational modes of water.
- in-situ is used to describe a situation in which the measurement or action is or can be performed directly at the source of a sample in the field.
- in-situ can be used interchangeably with each of “in the field”, “on-site, “in-line” and “in-flow”.
- TCE contamination Compounds such as trichloroethylene (TCE) and tetrachloroethene (PCE) are found at approximately 80% of all Superfund sites with groundwater contamination (852 facilities) and more than 3000 Department of Defense (DoD) sites in the U.S. The net result is that these solvents pose a considerable threat as groundwater contaminants and account for a significant proportion of the more than 90 contaminants of drinking water listed by the EPA.
- TCE trichloroethylene
- PCE tetrachloroethene
- Chlorinated solvents are Dense Non-Aqueous Phase Liquids (DNAPLs) and are denser than water and thus when spilled or released into the environment tend to migrate downward in the subsurface. Their migration through the vadose zone can lead to residual pockets of contaminants in soil pore spaces (source zones), the release of vapors in soil pore space, dissolution in groundwater (to the extent possible) in the capillary fringe and below the groundwater table, and pooling above an aquitard, as well as continued infiltration into fractures in boundary rock layers. The tendency for these compounds to partition (i.e. capable of going into solution) makes them exceptionally menacing pollutants.
- DNAPLs Dense Non-Aqueous Phase Liquids
- the sporadic and localized concentration of chlorinated solvents in regions such as soil pores and retarded pools also serves as a recalcitrant contaminant source which can often frustrate remediation attempts.
- GC-MS gas chromatography-mass spectrometry
- MC-ICPMS carrier gas extraction to GC multiple collector inductively coupled plasma-source mass spectrometry
- remote sensing techniques provide general information on field conditions or inferential indications of contaminant presence (such as foliage discoloration or depletion), yet offer limited resolution (typically several square meters), and provide virtually no insight into subsurface conditions.
- Geophysical methods such as electrical resistivity imaging and non-linear complex-resistivity cross-hole imaging, can successfully indicate the presence of chlorinated solvents in-situ, but typically at limited depths, spatial resolution, and sensitivity.
- Concepts that involve the introduction of foreign materials, such as graphite, Zeolite, or Samms particles, into the subsurface to enhance geophysical signatures have been proposed.
- Portable GC/MS units have also emerged commercially, but again require considerable sample handling.
- sensors are incorporated into cone penetrometer-type devices, and used to make direct field measurements.
- These instruments provide flexibility by enabling the investigator to rapidly examine multiple points in the field, both spatially and at depth, while limiting the errors that can often accompany sample extraction techniques, and thus their use has become increasingly common in practice.
- the majority of these direct penetrometer-based systems make use of optical spectroscopic phenomenon.
- Near-infrared (NIR) probes have been explored, as well as optical fiber sensors that rely on evanescent field phenomenon.
- NIR Near-infrared
- these devices by their very nature apply only to compounds which absorb at the frequency of the system excitation source.
- UV Ultra-violet
- CW continuous wave
- the Raman probe was reported to be effective at detecting PCE at the “highest levels of contamination” in saturated zones ( ⁇ 1,500 ppm by mass), and was less reliable in the vadose zone.
- Later work made use of a 300 mW 785 nm CW laser and successfully detected the presence of TCE in-situ in proximity to a solvent storage tank at locations with depth that were later verified in the laboratory to contain concentrations of 200-750 ppm by mass TCE, but failed to detect TCE in other zones with concentrations on the order of 50 ppm by mass. No major advances in in-situ Raman analysis of chlorinated solvents have been reported for the last decade.
- a method for determining concentration of a chlorinated solvent in a non-turbid aqueous solution sample containing the chlorinated solvent includes providing a set of non-turbid aqueous chlorinated solvent calibration solutions.
- Each of the non-turbid calibration solutions includes solutions of water and a chlorinated solvent and each non-turbid calibration solution has a concentration of the chlorinated solvent within a predetermined concentration range.
- at least two of the chlorinated solvent calibration solutions in the set have different concentrations of the chlorinated solvent within the predetermined concentration range.
- the intensity of Raman return at a predetermined Raman shift associated with O—H stretching region of water for each of the non-turbid aqueous chlorinated solvent calibration solutions is measured.
- a calibration profile for non-turbid solutions is then developed relating chlorinated solvent concentrations of the non-turbid aqueous chlorinated solvent calibration solutions in the set to these measured intensities.
- the non-turbid aqueous solution sample which contains the chlorinated solvent, and whose chlorinated solvent concentration has to be determined, is obtained.
- Intensity of Raman return at the predetermined Raman shift associated with O—H stretching region of the non-turbid aqueous solution sample is measured.
- the intensity of Raman return at the predetermined Raman shift associated with O—H stretching region of the non-turbid aqueous solution sample is then compared to the calibration profile for non-turbid solutions, and the concentration of the chlorinated solvent in the non-turbid aqueous solution sample is determined.
- the method includes providing a set of non-turbid aqueous chlorinated solvent calibration solutions.
- Each of the non-turbid calibration solutions includes solutions of water and a chlorinated solvent and each non-turbid calibration solution has a concentration of the chlorinated solvent within a predetermined concentration range.
- at least two of the chlorinated solvent calibration solutions in the set have different concentrations of the chlorinated solvent within the predetermined concentration range.
- the intensity of Raman return at a predetermined Raman shift associated with O—H stretching region of water for each of the non-turbid aqueous chlorinated solvent calibration solutions is measured.
- a calibration profile for non-turbid solutions is then developed relating chlorinated solvent concentrations of the non-turbid aqueous chlorinated solvent calibration solutions in the set to these measured intensities.
- the turbid aqueous solution sample which contains the chlorinated solvent, and whose chlorinated solvent concentration has to be determined, is obtained.
- Intensity of Raman return at the predetermined Raman shift associated with O—H stretching region of the turbid aqueous solution sample is measured.
- a turbidity correction is made to the measured intensity of Raman return at the predetermined Raman shift associated with O—H stretching region of the turbid aqueous solution sample to obtain a turbidity-corrected intensity of Raman return at the predetermined Raman shift associated with O—H stretching region of the turbid aqueous solution sample.
- the turbidity-corrected intensity is then compared to the calibration profile for non-turbid solutions, and the concentration of the chlorinated solvent in the turbid aqueous solution sample is determined.
- the method includes providing a set of turbid aqueous chlorinated solvent calibration solutions.
- Each of the turbid calibration solutions includes solutions of water and a chlorinated solvent and each turbid calibration solution has a concentration of the chlorinated solvent within a predetermined concentration range.
- at least two of the chlorinated solvent calibration solutions in the set have different concentrations of the chlorinated solvent within the predetermined concentration range.
- each of the turbid calibration solutions has a turbidity value in a predetermined turbidity range.
- Intensity of Raman return at a predetermined Raman shift associated with O—H stretching region of water for each of the turbid aqueous chlorinated solvent calibration solutions is measured.
- a calibration profile for turbid solutions is then developed relating chlorinated solvent concentrations of the turbid aqueous chlorinated solvent calibration solutions in the set to these measured intensities.
- the turbid aqueous solution sample, which contains the chlorinated solvent, and whose chlorinated solvent concentration has to be determined, is obtained.
- Intensity of Raman return at the predetermined Raman shift associated with O—H stretching region of the turbid aqueous solution sample is measured.
- the intensity of Raman return at the predetermined Raman shift associated with O—H stretching region of the non-turbid aqueous solution sample is then compared to the calibration profile for turbid solutions, and the concentration of the chlorinated solvent in the turbid aqueous solution sample is determined.
- FIG. 1 is a schematic representation of a 20 ⁇ J Raman measurement system.
- FIG. 2 is a representation of characteristic Raman Spectra of neat TCE, water, and 600 ppm TCE aqueous solution.
- FIG. 3 is a graph of Raman intensity vs. TCE concentration in aqueous solution at 381, 840 and 1242 cm ⁇ 1 .
- FIG. 4 is a representation of the relationship of TCE concentration in aqueous solution to the intensity of Raman vibrational modes in the O—H stretching region of water.
- FIG. 5 is a representation of the measured relationship between water line Raman counts at 3393 cm ⁇ 1 and TCE concentration in aqueous solution.
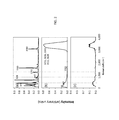
- FIG. 6 shows Raman spectra of TCE doped turbid supernatant bioassay.
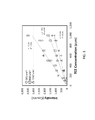
- FIG. 7 shows the relationship of water line Raman counts at 3393 cm ⁇ 1 to the TCE-concentration in simulated field samples consisting of doped turbid supernatant bioassay
- results demonstrating the method and usefulness of the disclosure are obtained using a research-oriented open-path variation of a closed-path fiber optically coupled Time-Resolved Raman Spectroscopy (TRRS) system specifically designed for application in field settings.
- TRRS Time-Resolved Raman Spectroscopy
- the system trades-off lower power and longer sampling times for reduced cost, simple reconfigurability, and the ability to manage multiple environmental interferences (e.g., fluorescence, turbidity, soil-solution interface).
- U.S. Pat. No. 8,325,337 issued to Joseph V. Sinfield and Oliver Colic on Dec. 4, 2012 the contents of which are incorporated herein by reference in their entirety, describes open- and closed-path system configurations for TRRS.
- the system as employed herein consists of eight primary components as shown in the schematic representation of the time-resolved Raman spectroscopy measurement system as shown in FIG. 1 .
- the tests and measurements leading to this disclosure were performed with an open-path 532 nm 20 ⁇ J pulsed laser (2 kHz repetition rate; ⁇ 0.4 ns pulse duration, Teem photonics PNG-002025-100).
- the 20 ⁇ J excitation beam 101 is directed to an ⁇ 25.4 mm dichroic laser beam filter (Edmund Optics) at 45 degree angle of incidence 102 which directs the excitation energy into an optical train that focuses the energy on a sample cuvette 103 .
- a ⁇ 45 mm AR aspheric lens 104 with Numerical Aperture (NA) 0.612 (Thorlabs) focuses the excitation on the sample and serves as a collection and focus optic for the 180 degree back scattered Raman photons from the sample back through the dichroic filter 102 to a ⁇ 50.8 mm AR achromatic doublet lens 205 (Thorlabs) with NA of 0.17.
- the achromatic lens in turn focuses Raman photons on the entrance slit of a monochromator 107 (Oriel 130 1 ⁇ 8 m, with flat-ruled 1200 lines/mm grating blazed at 500 nm).
- a 532 nm ⁇ 25.4 mm long-pass filter is placed at the monochromator entrance slit 106 to eliminate source wavelength background. Energy passing directly through the dichroic filter is focused through a convex lens 108 and used to create a data acquisition trigger via a photodiode 109 . Light passing through the monochromator is observed using a photomultiplier tube (PMT) (Hamamatsu H7422-40P) 210 operated in a photon counting mode. The PMT is observed via an impedance matched link to a pre-amplifier (Ortec 9326, operated at a gain of 20 ⁇ ) 111 and a 100-ps binned comparator (Ortec 9353) 112 . For all experiments performed with this system, spectra were collected with 25 ⁇ m slits, a step size of 0.1 nm, and 120 s observation time per wavelength. Other settings are possible.
- PMT photomultiplier tube
- aqueous equilibrium trichloroethylene concentration served as a stock solution for further dilution to lower aqueous concentrations and these diluted samples were tested immediately to minimize losses due to volatilization and degradation.
- the aqueous equilibrium solution of TCE was extracted through the use of a syringe and injected into a closed vial containing deionized water in an appropriate volume needed to make that particular concentration based on a molarity mass balance ratio, see Equation 1.
- C i V i C f V f (Equation 1)
- the concentration and volume are represented by C and V, while the subscripts i and f represent the initial and final target solution respectively, with consistent volumetric units.
- Test samples designed to simulate biodegradation in a field environment were prepared by first cultivating an anaerobic microbial population within a natural saturated soil sample. Soil for the experiment was obtained from a forested area near the intersection of Cherry Lane and McCormick in West Lafayette, Ind. and was characterized as silty clay that plots in the CL-ML region of a soil plasticity chart. It has a brownish gray color and a plastic and liquid limit of 8% and 26%, respectively. The soil was used as obtained from the site without any modifications.
- the soil was placed in a flask and saturated with a buffered solution and fed a solution consisting of of glucose (C6H12O6), methanol (CH3OH), and ethanol (C2H5OH).
- the soil was incubated in a foil covered (opaque to light) sealed vessel and monitored for microbial activity as evidenced by steady production of CO2 and CH4 gases.
- Glucose is easily and rapidly degradable by a diverse array of microbes, while ethanol and methanol are easily catabolized by acetogenic and methanogenic bacteria respectively, thus ensuring a rapid onset of anaerobic and methanogenic conditions needed to simulate groundwater conditions found at many contaminated sites.
- a steady pH of 7.2 was maintained daily and when needed the pH was adjusted with small additions of a concentrated buffer stock (per 100 ml; ammonium chloride (NH4Cl) 100 mg, potassium dihydrogen phosphate (KH2PO4) 500 mg and potassium hydrogen phosphate (K2HPO4) 2000 mg).
- the microbial bioassay created (supernatant liquid and slurry soil composition) was extracted using a pipette and combined with aqueous solutions of TCE on a volumetric basis, shaken, and allowed to equilibrate evenly in a Teflon sealed screwed cap vial. Extracts of the supernatant liquid were then used for testing the instrument performance in a simulated biologically active and complex environment.
- Trichloroethylene concentrations were validated by USEPA Method 8010 using a Stanford Research Instruments (SRI) Environmental Gas Chromatograph (GC 8610C chassis) equipped with a Photo Ionization Detector (PID) in series with a combination Flame Ionization Detector (FID) and a Dry Electrolytic Conductivity Detector (DELCD).
- SRI Stanford Research Instruments
- FID Flame Ionization Detector
- DELCD Dry Electrolytic Conductivity Detector
- the PID detector responds to compounds, whose ionization potential is below 10.6 eV, including aromatics and chlorinated molecules with double carbon bonds (TCE has an ionization potential of 9.45 eV).
- TCE has an ionization potential of 9.45 eV
- the FID detector responds to the hydrocarbons in the sample while the DELCD selectively detects the chlorinated and brominated compounds in the FID exhaust.
- the information obtained from the TRRS analysis can be portrayed in an x-y plot of the Raman intensity (counts) vs. Raman shift (cm ⁇ 1 ).
- Total counts were obtained by the progressive summation of returned Raman photon counts from the output of the photomultiplier tube (PMT) as observed by the time digitizer in one thousand 100 pico-second time bins that collect counts following incidence of the laser pulse at the sample.
- Signal to Noise Ratio (SNR) is defined as the average of the counts at the Raman peak (i.e. counts at which a given Raman vibrational mode occurs) minus the baseline divided by the standard deviation of the peak counts. Spectral subtraction, baseline removal, peak identification and smoothing were performed.
- Raman spectroscopy is an analytical technique that has seen broad application in research and industrial settings for the analysis of solids, liquids and gases.
- a monochromatic light source typically a laser
- inelastic photon-molecule collisions are observed.
- the difference in energy, ⁇ E is equivalent to the energy transferred between the incident photon and the sample, and corresponds to the vibrational and rotational energy states of the target molecule bonds.
- a reduction in energy of scattered photons leads to a reduction in frequency (increase in wavelength) known as a Stokes shift, and this is the basis for most conventional Raman spectroscopy.
- an increase in energy of the scattered photons can occur when an already excited bond transfers energy to the incoming incident photons causing an increase in the scattered photons' energy, and thus frequency. This phenomenon is called an anti-Stokes shift, but is not commonly observed. Conventionally these changes in energy, or shifts, are reported in units of wavenumber (cm ⁇ 1 ) with reference to the wavelength of the incident light.
- Raman spectrum The spectrum of observed scattered frequencies, known as the Raman spectrum, thus relates to the bonds in a molecule, and the relative intensity of lines in the spectrum is consistent with molecule stoichiometry.
- time-resolved Raman spectroscopy a pulsed, rather than a continuous wave, laser is employed to interrogate a sample and scattered photons are collected only during a brief period of time from the onset of the incident pulse until a point in time prior to the onset of significant fluorescence (if present). Time gating is thus typically performed on a time sale on the order of 10 ⁇ 9 seconds, or faster. Observations of scattered photons are then typically accumulated via photon counting techniques over repeated cycles of the laser pulse to enhance signal to noise ratios and develop a robust Raman spectrum.
- Chlorinated solvents are fundamentally composed of single, double or triple carbon-carbon bonds, carbon-chlorine bonds (C—Cl) and carbon-hydrogen bonds (CH). As explained above, bonds are associated with characteristic molecular vibrations and hence Raman frequencies. Previous studies have shown that C ⁇ C bonds give rise to characteristic shifts around the 1580-1664 cm ⁇ 1 region. Further, vibrations involving CH bonds give rise to vibrational frequencies that are characterized by molecular stretching identified at the 2840-3000 cm ⁇ 1 regions in a Raman spectrum. Shifts in groups at 730-840 cm ⁇ 1 and 1240-1360 cm ⁇ 1 are attributed to wagging and stretching of CH bonds, respectively.
- halogens such as chlorine atoms are identified by shifts in the frequency region of 550-760 cm ⁇ 1 .
- skeletal deformations associated with the C—Cl bonds relate to frequencies at 381 cm ⁇ 1 and 274 cm ⁇ 1 .
- the Raman spectrum of water is characterized by the intramolecular O—H stretching modes from 2700-3800 cm ⁇ 1 .
- O—H stretching is sometimes written as OH stretching.
- OH stretching and O—H stretching are used interchangeably.
- This broad response can be deconvolved into five peaks, 3051, 3233, 3393, 3511, 3628 cm ⁇ 1 .
- Deconvolving i.e. separating into contributing parts
- Deconvolving in this context refers to separating the aggregate Raman water signal over the range of 2700-3800 cm ⁇ 1 into the contributions from the five primary vibrational modes that comprise this signal.
- Raman spectroscopy could be used for the detection of pollutants in water
- IR Infra-Red
- Raman spectroscopy is tolerant of water because water is generally a weak Raman scatter and even water's stronger vibrational modes are notably displaced in the frequency domain from those of most target analytes.
- the observed spectrum is made up of signals arising from Raman scatter from the analyte, water, and various forms of background (for example elastic scattering, signatures from impurities, and, of course, electrical noise).
- Detection limits defined as the concentration observable at an SNR of 3, where SNR is defined as the average of the peak counts at the Raman line minus the baseline divided by the standard deviation of the peak counts, are approximately 70 ppm, 110 ppm, and 135 ppm, for the vibrations at 381, 840, and 1242 cm ⁇ 1 , respectively. While not representative of drinking water maximum contaminant levels, these detection limits are well within a range that can be useful and valuable for directional mapping of contaminant plumes, site characterization, and long term monitoring, even at the generally modest laser power of the employed system, indicating significant potential for use in environmental applications, especially given the typical contaminated site groundwater and plume TCE concentrations noted earlier.
- the Raman signature of water undergoes significant changes as the concentration of TCE in aqueous solution increases. Most notably, increases in TCE concentration drive marked reductions in the intensity of the water vibrational modes at the smaller shifts (65 and 162 cm ⁇ 1 ) associated with O—O—O bending, and O—O stretching along the O—H—O or hydrogen bond direction, as well as the O—H stretching region (2700-3800 cm ⁇ 1 ).
- FIG. 4 shows this effect in the O—H stretching region, which is particularly helpful because this region has little overlap with the Raman modes of chlorinated solvents.
- a second potential mechanism driving the observed changes in the water Raman return stems from more recent experimental and computer simulation work that has called into question the bulk “structure breaking” phenomenon and instead links water Raman intensity reductions to electric field effects resulting from O—H . . . X (here X ⁇ Cl) interactions in the first solvation shell surrounding the solute which drive strong orientation of hydrogen atoms in the water toward the solute and potentially reduced rotational mobility of the local water molecules, rather than formation of hydrogen bonds with other water molecules.
- a “calibration profile” for analysis of aqueous TCE samples, in this case, relating changes in TCE concentration to changes in the intensity of the most affected vibrational modes of water.
- the water Raman spectrum is distinguished by broad intermolecular O—H stretching modes from 2700-3800 cm ⁇ 1 , which can be deconvolved into five peaks.
- the 3393 cm ⁇ 1 peak which was deconvolved, was employed to develop a calibration profile used for the indirect monitoring of TCE concentration as it consistently yielded the highest SNR during TRRS measurements of TCE concentrations.
- the resulting calibration profile is shown in FIG. 5 which shows the measured relationship between water line Raman counts at 3393 cm ⁇ 1 and TCE concentration in aqueous solution.
- the profile specifically highlights the relationship between counts observed at the 3393 cm ⁇ 1 Raman line of water and the concentration of TCE in solution.
- the calibration profile has a negative slope and is steeper than those obtained from direct observation of TCE lines, thus providing a larger “calibration factor” as in the classic characterization of a sensor.
- a detection limit of ⁇ 8 ppm is achievable, again on the basis of maintaining an SNR ⁇ 3.
- FIG. 6 shows Raman spectra of TCE doped turbid supernatant bioassay.
- the elevated spectral range between 900-2000 cm ⁇ 1 may be attributed to group frequencies usually found in soil constituents, with spectral ranges between 950-1170 cm ⁇ 1 typically pertaining to C—O stretching of polysaccharides; 1450-1650 cm ⁇ 1 to COO-stretching, and 1630-1750 cm ⁇ 1 to C ⁇ O stretching.
- Glucose which is known to be present in the sample, can be anticipated to provide Raman returns appearing in the 400-550 cm ⁇ 1 range (most notably 397, 424, and 543 cm ⁇ 1 ) which have been attributed to the skeletal vibrations ⁇ (C—C—C), ⁇ (C—C—O), and ⁇ (C—O), respectively, and in the 850-950 cm ⁇ 1 range (notably 868 and 916 cm ⁇ 1 ) due to the ⁇ (C—C) and ⁇ (C1-H1) vibrations Vibrational bands between 1000-2000 cm ⁇ 1 are generally related to contributions from ⁇ (C—C) and ⁇ (C—O) stretching vibrations in soil functional groups and the microbe feed.
- the Raman spectrum of the supernatant liquid clearly showed the distinctive intramolecular O—H stretching modes of water from regions 2700-3800 cm ⁇ 1 . Contributions from the Raman vibrational modes of TCE are not obviously discerned upon visual examination. In addition, a non-time-gated analysis of the photon returns also confirmed that there is some contribution of fluorescence in the baseline of the signature, likely from fulvic and/or humic compounds present in the natural soil.
- TCE turbid supernatant bioassay.
- the turbidity value for each sample was also measured before TRRS analysis using a turbidimeter, and ranged from 20 to 150 NTU. (Note: NTU's are Nephelometric Turbidity Units.
- NTUs provide a standardized measure of the extent to which white light is scattered at an angle of 90° from the direction of an incident beam by particles suspended in a liquid relative to the same effect observed in a standard solution containing the polymer reaction byproduct of hydrazine sulfate and hexamethylenetetramine, in accordance with Environmental Protection Agency (EPA) Method 180.1.)
- FIG. 7 shows the relationship of water line Raman counts at 3393 cm ⁇ 1 to the TCE-concentration in simulated field samples consisting of doped turbid supernatant bioassay.
- the above detailed description contrasts direct and indirect means to assess TCE levels in aqueous solution using time-resolved Raman spectroscopy.
- the TRRS system employed herein was able to directly detect TCE at aqueous concentrations as low as 150 ppm in simple aqueous solution by monitoring the 381 cm ⁇ 1 Raman line corresponding to the ⁇ CCl vibrational mode.
- This level of sensitivity achieved with the outlined embodiment of the Raman system, while far from drinking water maximum contaminant limits, may have value in certain field monitoring applications such as plume delineation, warning of contaminant release, or the design of tailored monitoring approaches.
- the calibration profile will be a straight line, as is obvious for those skilled in the art.
- the calibration profile is generally non-linear, though linear relationships may be observed in some cases, such as when the concentration ranges for the solutions is narrow.
- non-turbid usually refers to a level of turbidity below which the influence of any suspended particles has negligible implications on the intensity of the observed Raman signals for a particular application.
- the method begins with providing or obtaining a set of non-turbid aqueous chlorinated solvent calibration solutions which are solutions of water and a chlorinated solvent.
- each calibration solution has a chlorinated solvent concentration falling in a predetermined concentration range.
- the set should contain at least two calibration solutions with different chlorinated solvent concentrations falling within the predetermined concentration range.
- This predetermined concentration range can be based on any prior information about the range concentrations expected in the solution sample.
- intensity of Raman return at a predetermined Raman shift associated with O—H stretching region of water for each of the plurality of non-turbid aqueous chlorinated solvent calibration solutions is measured.
- the predetermined Raman shift can be based on preliminary experiments in which Raman returns at different Raman shifts associated with O—H stretching region of water are measured, and specific Raman shift can be chosen based intensity, measurement sensitivity and error minimization.
- a calibration profile for non-turbid solutions is then developed relating chlorinated solvent concentrations of the plurality of the non-turbid aqueous chlorinated solvent calibration solutions in the set to the measured intensities of Raman return at the predetermined Raman shift associated with O—H stretching region of water for each of the non-turbid aqueous chlorinated solvent calibration solutions in the set of non-turbid aqueous chlorinated solvent samples.
- a non-turbid aqueous solution sample, the chlorinated solvent concentration of which has to be determined, containing the chlorinated solvent is then obtained. Then, intensity of Raman return at the predetermined Raman shift associated with O—H stretching region of the non-turbid aqueous solution sample is measured.
- This measured intensity of Raman return at the predetermined Raman shift associated with O—H stretching region of the non-turbid aqueous solution sample is then compared to the calibration profile calibration profile for non-turbid solutions described above. By this comparison, concentration of the chlorinated solvent in the non-turbid aqueous solution sample is determined.
- the aqueous solution sample may be turbid.
- Turbidity is a measure of the loss of optical transparency of a medium resulting from the presence of suspended solids or other interfering matter, which can limit the overall sensitivity of optical spectroscopic methods and make it challenging to perform quantitative analysis. Turbidity is measured by various methods known to those skilled in the art and is typically measured in NTUs (Nephelometric Turbidity Units).
- NTUs provide a standardized measure of the extent to which white light is scattered at an angle of 90° from the direction of the incident beam by particles suspended in a liquid relative to the same effect observed in a standard solution containing the polymer reaction byproduct of hydrazine sulfate and hexamethylenetetramine, in accordance with Environmental Protection Agency (EPA) Method 180.1, and are a standard measure of water quality in environmental science.
- EPA Environmental Protection Agency
- the method outlined above for non-turbid aqueous solution samples has to be modified to apply a turbidity correction to the intensity of Raman return at the predetermined Raman shift associated with O—H stretching region of the turbid aqueous solution sample, and the turbidity-corrected intensity is compared to the calibration profile to determine concentration of the chlorinated solvent in the turbid aqueous solution sample.
- Techniques of applying a turbidity correction have been described in literature and can be understood by those of ordinary skill in the art.
- a technique for correcting for turbidity includes determining a turbidity value for the turbid solution based on a Raman line intensity calibration data set for the solvent and determining a turbidity correction factor based on the turbidity value and a Raman line calibration data set for an analyte and applying the turbidity correction factor to the Raman line intensity of the analyte in the turbid solution and calculating a turbidity-corrected Raman line intensity for the analyte in the turbid solution.
- the turbidity-corrected Raman line intensity of the analyte in the turbid solution is then used to determine the concentration of the analyte in the turbid solution utilizing previously developed calibration data sets relating Raman line intensity to analyte concentration in solutions of negligible turbidity. Details of the technique are further described in U.S. patent application Ser. No. 14/597,614 on Jan. 15, 2015 by Joseph Victor Sinfield and Chukwukelue Kenneth Monwuba, and a technical paper titled “Assessment and Correction of Turbidity Effects on Raman Observations of Chemicals in Aqueous Solutions” by Joseph V. Sinfield and Chike K. Monwuba, APPLIED SPECTROSCOPY, Volume 68, Number 12, 2014, pages 1381-1392, both of which are incorporated herein by reference in their entirety.
- the modified method begins with providing or obtaining a set of non-turbid aqueous chlorinated solvent calibration solutions which are solutions of water and a chlorinated solvent.
- each calibration solution has a chlorinated solvent concentration falling in a predetermined concentration range.
- the set should contain at least two calibration solutions with different chlorinated solvent concentrations falling within the predetermined concentration range.
- This predetermined concentration range can be based on prior information about the range concentrations expected in the solution sample.
- intensity of Raman return at a predetermined Raman shift associated with O—H stretching region of water for each of the plurality of non-turbid aqueous chlorinated solvent calibration solutions is measured.
- the predetermined Raman shift can be based on preliminary experiments in which Raman returns at different Raman shifts associated with O—H stretching region of water are measured, and specific Raman shift can be chosen based intensity, measurement sensitivity and error minimization.
- a calibration profile for non-turbid solutions is then developed relating chlorinated solvent concentrations of the plurality of the non-turbid aqueous chlorinated solvent calibration solutions in the set to the measured intensities of Raman return at the predetermined Raman shift associated with O—H stretching region of water for each of the non-turbid aqueous chlorinated solvent samples in the set of non-turbid aqueous chlorinated solvent calibration solutions.
- a turbid aqueous solution sample, whose chlorinated solvent concentration has to be determined, is then obtained.
- intensity of Raman return at the predetermined Raman shift associated with O—H stretching region of the turbid aqueous solution sample is measured.
- a turbidity correction is then applied to the measured of Raman return at the predetermined Raman shift associated with O—H stretching region of the turbid aqueous solution sample from the geographic region of interest to obtain a turbidity-corrected intensity.
- This turbidity-corrected intensity is compared to the calibration profile for non-turbid solutions described above. By this comparison, concentration of the chlorinated solvent in the turbid aqueous solution sample is determined.
- This method begins with providing or obtaining a set of turbid aqueous chlorinated solvent calibration solutions which are solutions of water and a chlorinated solvent. Each sample in this set has a chlorinated solvent concentration falling in a predetermined concentration range. The set should contain at least two calibration solutions with different chlorinated solvent concentrations falling within the predetermined concentration range. This predetermined concentration range can be based on prior information about the range concentrations expected in the solution. Further, each calibration solution in this set has a turbidity value falling in a predetermined concentration range.
- This predetermined turbidity range can be based on prior information about the range of turbidity expected in the solution sample. Then intensity of Raman return at a predetermined Raman shift associated with O—H stretching region of water for each of the plurality of turbid aqueous chlorinated solvent calibration solutions in the set is measured.
- the predetermined Raman shift can be based on preliminary experiments in which Raman returns at different Raman shifts associated with O—H stretching region of water are measured, and specific Raman shift can be chosen based intensity, measurement sensitivity and error minimization.
- a calibration profile for turbid solutions is then developed relating chlorinated solvent concentrations of the plurality of the turbid aqueous chlorinated calibration solutions samples in the set to the measured intensities of Raman return at the predetermined Raman shift associated with O—H stretching region of water for each of the turbid aqueous chlorinated solvent calibration solutions in the set of non-turbid aqueous chlorinated solvent calibration solutions.
- a turbid aqueous solution sample whose chlorinated solvent concentration has to be determined is then obtained. Then, intensity of Raman return at the predetermined Raman shift associated with O—H stretching region of the turbid aqueous solution sample is measured.
- This measured intensity of Raman return at the predetermined Raman shift associated with O—H stretching region of the turbid aqueous solution sample is then compared to the calibration profile for turbid solutions described above. By this comparison, concentration of the chlorinated solvent in the turbid aqueous solution sample is determined.
- This method begins with providing or obtaining a set of turbid aqueous chlorinated solvent calibration solutions which are solutions of water and a chlorinated solvent.
- Each sample in this set has a chlorinated solvent concentration falling in a predetermined concentration range.
- the set should contain at least two calibration solutions with different chlorinated solvent concentrations falling within the predetermined concentration range. This predetermined concentration range can be based on prior information about the range concentrations expected in the solution. Further, each calibration solution in this set has a turbidity value falling in a predetermined concentration range.
- This predetermined turbidity range can be based on prior information about the range of turbidity expected in the solution sample. Then intensity of Raman return at a predetermined Raman shift associated with O—H stretching region of water for each of the plurality of turbid aqueous chlorinated solvent calibration solutions in the set is measured.
- the predetermined Raman shift can be based on preliminary experiments in which Raman returns at different Raman shifts associated with O—H stretching region of water are measured, and specific Raman shift can be chosen based intensity, measurement sensitivity and error minimization.
- a turbidity correction is then applied, following the techniques referred to above, to intensities of Raman return at a predetermined Raman shift associated with O—H stretching region of water for each of the plurality of turbid aqueous chlorinated solvent calibration solutions in the set.
- a turbidity-corrected calibration profile for turbid solutions is then developed relating chlorinated solvent concentrations of the plurality of the turbid aqueous chlorinated calibration solutions samples in the set to the turbidity-corrected intensities of Raman return at the predetermined Raman shift associated with O—H stretching region of water for each of the turbid aqueous chlorinated solvent calibration solutions in the set of turbid aqueous chlorinated solvent calibration solutions.
- a turbid aqueous solution sample whose chlorinated solvent concentration has to be determined is then obtained. Then, intensity of Raman return at the predetermined Raman shift associated with O—H stretching region of the turbid aqueous solution sample is measured. A turbidity correction is then applied to intensity of Raman return at the predetermined Raman shift associated with O—H stretching region of the turbid aqueous solution sample. This turbidity-corrected intensity of Raman return at the predetermined Raman shift associated with O—H stretching region of the turbid aqueous solution sample is then compared to the turbidity-corrected calibration profile for turbid solutions described above. By this comparison, concentration of the chlorinated solvent in the turbid aqueous solution sample is determined.
- the predetermined concentration range for the chlorinated solvent calibration solutions can advantageously include a chlorinated solvent concentration of zero.
- zero concentration is understood to mean pure water as is generally understood in laboratories and in the definition of reagent grades and no chlorinated solvent is introduced.
- the aqueous solution sample (containing a chlorinated solvent), whose chlorinated solvent concentration has to be determined, can be from a geographic region of interest.
- This geographic region of interest can be a well, a body of water, a subsurface water environment, an aquifer, a waste water stream, and an industrial process stream, or like situations.
- other possibilities exist for the source of the aqueous solution sample such as rain water, man-made samples and the like.
- Aqueous media encountered in geographic regions of interest and/or in natural environment often contain suspended solids that can interfere with spectroscopic measurements. Removal of these solids, for example via filtration, can have adverse effects on the extent to which subsequent measurements are representative of actual field conditions under which the aqueous media are collected. In such cases, the methods described above for turbid aqueous solution sample have to be employed.
- a chlorinated solvent of high interest is trichloroethylene or TCE.
- the methods described here are very much applicable to TCE.
- the chlorinated solvent in all of the above methods can be TCE.
- Non-limiting examples of other solvents, whose concentrations can be measured using the method of this disclosure, are carbon tetrachloride and perchloroethylene.
- the above methods describe determining concentration of chlorinated solvents in turbid or non-turbid aqueous solutions, it must be recognized that these methods are applicable when more than one chlorinated solvent is present. That is the methods are applicable when the aqueous solution of interest contains an aggregate of chlorinated solvents. It should be noted that in a very complex environment that may involve more than one chlorinated solvent, one could perform a traditional chemical analysis test on a sample of water from the site to determine the constituents, and then use the methods described here to determine the presence and concentration of the aggregate chlorinated solvents. Thus in all the above methods, the chlorinated solvent can be an aggregate of two or more chlorinated solvents.
- the Raman spectra generated in the above methods can be used to identify individual chlorinated solvents present in the solution sample, while the methods described above can be used to quantify the identified chlorinated solvents.
- the methods described here would quantify the aggregate chlorinated solvent with our method. Water and the OH range contain several Raman vibrations and some are more susceptible to some chlorinated solvents than others so there is the possibility that one could identify the chlorinated solvents with some detailed studies. In such case, one might use more than one water Raman line in the OH-region to facilitate multi-chlorinated solvent analysis.
- this disclosure describes techniques to detect as well as quantify chlorinated solvents in an aqueous solution containing chlorinated solvent or chlorinated solvents.
- chlorinated solvent concentrations can be adapted for analysis of aqueous systems containing other Group 7 elements of the periodic table such as fluorine, bromine, or iodine for determining and monitoring fluorine, bromine and iodine respectively.
- the relationship between chlorinated solvent concentration and the measured Raman intensity of O—H region of water in a chlorinated solvent solution is inverse. That is, as chlorinated solvent concentration increases, the measured Raman intensity of the O—H region of water in the chlorinated solvent solution decreases. It should be further recognized that this inverse relationship has an advantageous consequence of increased sensitivity when the chlorinated solvent concentration is low, giving a desirable high signal to noise ratio in measurements at low concentrations of the chlorinated solvent.
- the turbid solutions that are analyzed for the concentration of an analyte can be from a well, a body of water, a subsurface water environment, an aquifer, a waste water stream, and an industrial process stream. These are to be recognized as non-limiting examples for the source of the turbid solution.
- the methods described above will also work for samples obtained from the field. Care should be taken that samples so obtained from the field are representative of the field conditions, especially in terms of turbidity and concentration of the chlorinated solvents of interest.
- turbidity values that can use the methods described here have very wide range. It is expected that the methods described in this disclosure can be used for turbid solutions with turbidly values ranging from 3-300 NTUs. A higher value for the range is possible.
- the methods described here are convenient for “in-situ” measurements. Further, the methods described are especially suitable where the chlorinated solvent concentration is low and turbidity values for the solutions are high (40-200 NTUs as a non-limiting range). The methods described here can be used for chlorinated solvent concentrations as low as a few parts per million.
- the measurement techniques described in this disclosure can be used to detect the presence of one or more of chlorinated compounds by comparing the Raman intensity of the O—H stretching region at a predetermined Raman shift to that of water with no presence of chlorinated solvents. While such comparison of spectra leads to detecting the presence of the chlorinated compounds, quantification would require the methods described in this disclosure. Simple comparison techniques such as this for detection purposes can lead to inexpensive sensors for monitoring water quality.
Landscapes
- Health & Medical Sciences (AREA)
- Life Sciences & Earth Sciences (AREA)
- Chemical & Material Sciences (AREA)
- Biochemistry (AREA)
- Physics & Mathematics (AREA)
- Analytical Chemistry (AREA)
- General Health & Medical Sciences (AREA)
- General Physics & Mathematics (AREA)
- Immunology (AREA)
- Pathology (AREA)
- Nuclear Medicine, Radiotherapy & Molecular Imaging (AREA)
- Engineering & Computer Science (AREA)
- Food Science & Technology (AREA)
- Medicinal Chemistry (AREA)
- Investigating, Analyzing Materials By Fluorescence Or Luminescence (AREA)
Abstract
Description
C i V i =C f V f (Equation 1)
The concentration and volume are represented by C and V, while the subscripts i and f represent the initial and final target solution respectively, with consistent volumetric units.
ΔE=E o −E vib (Equation 2)
(Subscript o and vib represent incident and scattered photons, respectively)
-
- where,
- E=hν=hc/λ
- h is Planck's constant
- ν is the frequency of the light
- c is the speed of light
- λ is the wavelength of light
IR=IvibσCdzK (Equation 3)
-
- Where IR=measured Raman intensity, in photons per second;
- Ivib=laser intensity, in photons per second;
- σ=absolute Raman cross section, in cm2 per molecule
- dz=sample path length, in cm;
- C=concentration, in molecules per cm3
- K=measurement parameter (to account for experimental parameters such as optical collection efficiency and optical transmission of the Raman spectrometer which is unitless and instrument specific, determined from the optical configuration).
Claims (20)
Priority Applications (1)
| Application Number | Priority Date | Filing Date | Title |
|---|---|---|---|
| US14/656,136 US9488582B2 (en) | 2014-03-14 | 2015-03-12 | Methods for measuring concentrations of chlorinated solvents through raman spectroscopic observation of the vibrational modes of water |
Applications Claiming Priority (2)
| Application Number | Priority Date | Filing Date | Title |
|---|---|---|---|
| US201461953335P | 2014-03-14 | 2014-03-14 | |
| US14/656,136 US9488582B2 (en) | 2014-03-14 | 2015-03-12 | Methods for measuring concentrations of chlorinated solvents through raman spectroscopic observation of the vibrational modes of water |
Publications (2)
| Publication Number | Publication Date |
|---|---|
| US20150260655A1 US20150260655A1 (en) | 2015-09-17 |
| US9488582B2 true US9488582B2 (en) | 2016-11-08 |
Family
ID=54068575
Family Applications (1)
| Application Number | Title | Priority Date | Filing Date |
|---|---|---|---|
| US14/656,136 Active US9488582B2 (en) | 2014-03-14 | 2015-03-12 | Methods for measuring concentrations of chlorinated solvents through raman spectroscopic observation of the vibrational modes of water |
Country Status (1)
| Country | Link |
|---|---|
| US (1) | US9488582B2 (en) |
Cited By (2)
| Publication number | Priority date | Publication date | Assignee | Title |
|---|---|---|---|---|
| US20180188180A1 (en) * | 2017-01-04 | 2018-07-05 | Kaiser Optical Systems Inc. | Cost-effective raman probe assembly for single-use bioreactor vessels |
| US10640406B2 (en) | 2016-05-17 | 2020-05-05 | Texas Tech University System | Surface modification of zero valent iron material for enhanced reactivity for degrading chlorinated contaminants in water |
Families Citing this family (3)
| Publication number | Priority date | Publication date | Assignee | Title |
|---|---|---|---|---|
| CN109855913A (en) * | 2019-03-04 | 2019-06-07 | 中国地质科学院水文地质环境地质研究所 | Underground water-borne radioactivity inert gas nucleic surveys year sampling system and its method of sampling |
| CN115494043A (en) * | 2022-02-24 | 2022-12-20 | 中国科学院南京土壤研究所 | Method for determining soil stability organic carbon based on Raman spectrum characteristic peak detection |
| CN117347298A (en) * | 2022-06-29 | 2024-01-05 | 中国科学院西安光学精密机械研究所 | Seawater nitrate in-situ sensor and its measurement data processing method and calibration components |
-
2015
- 2015-03-12 US US14/656,136 patent/US9488582B2/en active Active
Non-Patent Citations (46)
| Title |
|---|
| Acha, V. et al., "Detoxification of a mixture of 663 aliphatic chlorinated hydrocarbons in a fixed-bed bioreactor: continuous on-line monitoring via an attenuated total reflection-Fourier transform infrared sensor." Water Science and 665 Technology,40(8), 41-4, 1999. |
| Bhattacharyya, J., et al., "Biosensor-based diagnostics of contaminated groundwater: Assessment and remediation 668 strategy." Environmental Pollution 34(3): 485-492, 2005. |
| Bilodeau, T. G., et al., "Fiber optic Raman probe detection of chlorinated hydrocarbons in standard soils." Proceedings of SPIE-The International Society for Optical Engineering, 2068, 258-270, 1994. |
| Bloch, J., et al., "Field test of a novel microlaser-based probe for in-situ fluorescence sensing of soil contaminants." Applied Spectroscopy, 52(10), 1299-1304, 1998. |
| Bradley, E. B., et al., "On the exploitation of laser Raman spectroscopy for detection and identification of molecular water pollutants." Water Research, v4, 125-128, 1970. |
| Burck, J., et al., "Fiber optic NIR evanescent wave absorption sensor systems for in situ monitoring of hydrocarbon compounds in waste and ground water." Proceedings of SPIE-The International Society for Optical Engineering, 3534, 222-233, 1999. |
| Burgess, S., et al., "Fluorescence suppression in time-resolved Raman spectra." Journal of Physics E: Scientific Instruments, 10, 617-620, 1977. |
| Busing, W. R., et al., The Effect of Dissolved KBr, KOH or HCI on the Rman Spectrum of Water. Journal of Physical Chemistry 65 (2) 284-29, 1960. |
| Carey, D. M., et al., "Measurement of the Rman spectrum of liquid water." Journal of Chemical Physics, v 108 (7) 2669-2675, 1998. |
| Coker, D. F., et al., "Structure and Vibrational spectroscopy of the water dimer using quantum simulation." Journal of Physical Chemistry, v 91, (10) 2513-18, 1987. |
| Conzen, J., et al., "Characterizaiton of a fiber-optic evanscent wave absorbance sensor for Nonpolar organic compounds." Applied Spcectroscopy, vol. 47, No. 6, 753-763, 1993. |
| Daley, P. F., et al., "Fiber optic sensor for continuous monitoring of chlorinated solvents in the vadose zone and in groundwater: field test results." Proceedings of SPIE-The International Society for Optical Engineering, 1587, 278-282, 1992. |
| Degrandpre, M. D., et al., "A fiber-optic FT-NIR evanescent field absorbance sensor." Applied Spectroscopy, 44(2), 273-279, 1990. |
| Fraser, R. et al., Resolution of overlapping bands: Functions for simulating band shapes. Analytical Chemistry 41(1), 37-39, 1969. |
| Ge, Y. et al., "Remote sensing of soil properties in precision agriculture: a review." Paper No. 061176, Annual International Meeting of the American Society of Agricultural and Biological Engineers, Jul. 9-12, 2006. Portland, OR. |
| Gobel, R. et al., "Infrared attenuated total reflection spectroscopic investigations of the diffusion behaviour of chlorinated 714 hydrocarbons into polymer membranes." Vibrational Spectroscopy, 8(2), 141-149, 1995. |
| Grimm, R., et al., "Nonlinear complex-resistivity survey for DNAPL at the savannah river site A-014 outfall." Journal of Environmental and Engineering Geophysics, 10(4), 351-364, 2005. |
| Holt, B. D., et al., "Extraction of chlorinated aliphatic hydrocarbons from groundwater at micromolar concentrations for isotopic analysis of chlorine." Environmental Pollution, 113(3), 263-269, 2001. |
| Howley, R., et al., "A study of the factors affecting the diffusion of chlorinated hydrocarbons into polyisobutylene and polyethylene-co-propylene for evanescent wave sensing." Vibrational Spectroscopy, 31(2) 271-278, 2001. |
| Idriss, A. (2001). "Study of aqueous acetone solution at various concentrations:low frequency Raman and molecular dynamics simulations." Journal of Physical Chemistry B, 105 (250 729 6004-9. |
| Jakusch, M., et al., "Towards a remote IR fiber-optic sensor system for the determination of chlorinated hydrocarbons in water." Sensors and Actuators B: Chemical, 38(1-3), 83-87, 1997. |
| Jorgensen, W. L. et al., "Ab Initio Study of Structures and Binding Energies for Anion-Water Complexes." Journal of American Chemical Society, 108, 478-479, 1987. |
| Kato, M., et al., "Use of SCAPS petroleum hydrocarbon sensor technology for real-time indirect DNAPL detection." Journal of Soil Contamination, 7 (1), 73-86, 1998. |
| Kram, M. L., et al. "DNAPL characterization methods and approaches, Part 1: Performance comparisons." Ground Water Monitoring and Remediation, 21(4), 109-123, 2001. |
| Kruse, J., et al., "Remote sensing of nitrogen stress in creeping bentgrass." Agronomy Journal, 98, 1640-1645, 2006. |
| Langford, J. I., "A Rapid Method for Analyzing the Breadths of Diffraction and Spectral Lines using the Voigt function." Journal of Applied Crystallolgy. 11, 10-14, 1978. |
| Li, R., et al., "Hydrogen bonded structure of water and aqueous solutions of sodium halides: a Raman spectroscopic study." Journal of Molecular Structure 707, 83-88, 2004. |
| Lin, J., et al., "Subsurface contaminant monitoring by laser fluorescence excitation-emission spectroscopy in a cone penetrometer probe." Proceedings of SPIE-The International Society for Optical Engineering, 2504, 59-67, 1995. |
| Malandain, C., et al., "Biosensors for the environment." Oil and Gas Science and Technology, 60 (6), 887-897, 2005. |
| Marcus, Y. "Effect of Ions on the Structure of Water: Structure making and Breaking." Chemical Reviews, 109, 1346-1370, 2009. |
| Mehran, M, et al., "Distribution Coefficient of Trichloroethylene in Soil-Water Systems." Ground Water 25(3): 275-282, 1987. |
| Miano, T., et al., Flourescence Spectroscopy of Humic Substances. Soil Sci. Soc. Am. J., 52(4), 1016-1019, 1988. |
| Monwuba, C. K., et al., The Effect of Turbidity on Raman Spectroscopic Analysis of Aqueous Chlorinated Samples. GeoCongress 2012 © ASCE 2012, 3408-3418. |
| Morris, M., D., et al., "Detection of Chlorinated Hydrocarbons in Aqueous Surfactant Solutions by Near-IR Raman Spectroscopy" Applied Spectroscopy, v49 (8) 1146-1150, 1995. |
| Mullen, K., et al., "Adsorption of Chlorinated Ethylenes at 1-Octadecanethiol-Modified Silver Surfaces." Analytical Chemistry 66(4): 478-483, 1994. |
| Pack, B. W., et al., "Determination of halogenated hydrocarbons by helium microwave plasma torch time-of-flight mass spectrometry coupled to gas chromatography." Analytical Chemistry, 70(18), 3957-3963, 1998. |
| Rossabi, J., et al., "Field tests of a DNAPL characterization system using cone penetrometer-based Raman spectroscopy." Ground Water Monitoring and Remediation, 20(4), 72-81, 2000. |
| Sinfield, J. V., et al., "A Low Cost Time-Resolved Spectrsocopic Sensing System Enabling Fluorescence Rejection," Applied Spectroscopy. 64 (2) 201-210, 2010. |
| Smith, J., D., et al., "The Effects of Dissolved Halide Anions on Hydrogen Bonding in Liquid Water." Journal of the American Chemical Society, 129, 13847-13856, 2007. |
| Soderholm, S., et al., "Raman Spectra of Fructose and Glucose in the Amorphous and Crystalline States." Journal of Raman Spectroscopy, 30, 1009-1018, 1999. |
| Stone, H., "Mathematical Resolution of Overlapping Spectral Lines." Journal of Optical Society of America. 52, 998-1000, 1962. |
| Storey, J., et al., "Electrochemical SERS Detection of Chlorinated Hydrocarbons in Aqueous Solutions", Applied Spectroscopy, 48, 10, pp. 1265-1271, 1994. |
| Syage, J. A., et al., "Field-portable, high-speed GC/TOFMS." Journal of the American Society for Mass Spectrometry, 12(6), 648-655, 2001. |
| Terpstra, P., et al., "Effect of salts on dynamics of water: A Raman spectroscopy study." Journal of Chemical Physics 92 (1) 65-70, 1990. |
| Van Vacker, et al., "GC/multiple collector-ICPMS method for chlorine stable isotope analysis of chlorinated aliphatic hydrocarbons." Analytical Chemistry, 78(13), 4663-4667, 2006. |
| Wahl, J. H., et al., "A portable multi-dimensional gas chromatographic system for field applications." Journal of Separation Science, 26(12-13), 1083-1090, 2003. |
Cited By (3)
| Publication number | Priority date | Publication date | Assignee | Title |
|---|---|---|---|---|
| US10640406B2 (en) | 2016-05-17 | 2020-05-05 | Texas Tech University System | Surface modification of zero valent iron material for enhanced reactivity for degrading chlorinated contaminants in water |
| US20180188180A1 (en) * | 2017-01-04 | 2018-07-05 | Kaiser Optical Systems Inc. | Cost-effective raman probe assembly for single-use bioreactor vessels |
| US10261020B2 (en) * | 2017-01-04 | 2019-04-16 | Kaiser Optical Systems Inc. | Cost-effective Raman probe assembly for single-use bioreactor vessels |
Also Published As
| Publication number | Publication date |
|---|---|
| US20150260655A1 (en) | 2015-09-17 |
Similar Documents
| Publication | Publication Date | Title |
|---|---|---|
| US9863881B2 (en) | Methods for measuring concentrations of analytes in turbid solutions by applying turbidity corrections to raman observations | |
| Wang et al. | The key factors for the fate and transport of petroleum hydrocarbons in soil with related in/ex situ measurement methods: an overview | |
| Ho et al. | Overview of sensors and needs for environmental monitoring | |
| US9488582B2 (en) | Methods for measuring concentrations of chlorinated solvents through raman spectroscopic observation of the vibrational modes of water | |
| Nahorniak et al. | Excitation-emission matrix fluorescence spectroscopy in conjunction with multiway analysis for PAH detection in complex matrices | |
| Tawfik et al. | Trace analysis of heavy metals in groundwater samples using laser induced breakdown spectroscopy (LIBS) | |
| Adamson et al. | Membrane interface probe protocol for contaminants in low‐permeability zones | |
| Bingari et al. | Application of near infrared spectroscopy in sub-surface monitoring of petroleum contaminants in laboratory-prepared soils | |
| Blaen et al. | Multitracer field fluorometry: Accounting for temperature and turbidity variability during stream tracer tests | |
| Seo et al. | Smartphone compatible on-site fluorescence analyzer for spilled crude oil based on CMOS image sensor | |
| Heath et al. | The effect of pressure and temperature on mid-infrared sensing of dissolved hydrocarbons in water | |
| Baumann et al. | Applications of a laser-induced fluorescence spectroscopy sensor in aquatic systems | |
| Gu et al. | Impact of soil water on the spectral characteristics and accuracy of energy-dispersive X-ray fluorescence measurement | |
| Kram et al. | Complex NAPL site characterization using fluorescence part 1: selection of excitation wavelength based on NAPL composition | |
| Lu | Identification of forensic information from existing conventional site-investigation data | |
| Grundl et al. | Demonstration of a method for the direct determination of polycyclic aromatic hydrocarbons in submerged sediments | |
| Sinfield et al. | Inferential monitoring of chlorinated solvents through Raman spectroscopic observation of the vibrational modes of water | |
| Tuli et al. | In Situ monitoring of soil solution Nitrate: Proof of concept | |
| Roch | Evaluation of total luminescence data with chemometrical methods:: a tool for environmental monitoring | |
| Koglin et al. | Emerging technologies for detecting and measuring contaminants in the vadose zone | |
| Monwuba | Geoenvironmental influences on Raman spectroscopic monitoring of chlorinated solvents natural attenuation | |
| Fu et al. | Advancing chlorophyll sensing in natural waters: Laser-induced fluorescence spectroscopy with continuous poisson distribution filtering | |
| Rathore | Comments on Large-Scale Uranium Contamination of Groundwater Resources in India | |
| Mainak et al. | Investigation of Fluorescence Quenching of Phenanthrene Using Carbon Tetrachloride and Nitromethane in Various Solvents at Room Temperature | |
| Davidson et al. | Examining the ultraviolet optical screening tool as a viable means for delineating a contaminated organic sediment |
Legal Events
| Date | Code | Title | Description |
|---|---|---|---|
| AS | Assignment |
Owner name: PURDUE RESEARCH FOUNDATION, INDIANA Free format text: ASSIGNMENT OF ASSIGNORS INTEREST;ASSIGNORS:SINFIELD, JOSEPH VICTOR;MONWUBA, CHUKWUKELUE KENNETH;SIGNING DATES FROM 20150413 TO 20150429;REEL/FRAME:035711/0485 |
|
| STCF | Information on status: patent grant |
Free format text: PATENTED CASE |
|
| FEPP | Fee payment procedure |
Free format text: SURCHARGE FOR LATE PAYMENT, SMALL ENTITY (ORIGINAL EVENT CODE: M2554); ENTITY STATUS OF PATENT OWNER: SMALL ENTITY |
|
| MAFP | Maintenance fee payment |
Free format text: PAYMENT OF MAINTENANCE FEE, 4TH YR, SMALL ENTITY (ORIGINAL EVENT CODE: M2551); ENTITY STATUS OF PATENT OWNER: SMALL ENTITY Year of fee payment: 4 |
|
| MAFP | Maintenance fee payment |
Free format text: PAYMENT OF MAINTENANCE FEE, 8TH YR, SMALL ENTITY (ORIGINAL EVENT CODE: M2552); ENTITY STATUS OF PATENT OWNER: SMALL ENTITY Year of fee payment: 8 |