US9466116B2 - Method and system for separating tissue classes in magnetic resonance images - Google Patents
Method and system for separating tissue classes in magnetic resonance images Download PDFInfo
- Publication number
- US9466116B2 US9466116B2 US13/088,171 US201113088171A US9466116B2 US 9466116 B2 US9466116 B2 US 9466116B2 US 201113088171 A US201113088171 A US 201113088171A US 9466116 B2 US9466116 B2 US 9466116B2
- Authority
- US
- United States
- Prior art keywords
- magnetic resonance
- resonance images
- intensity distribution
- images
- subject
- Prior art date
- Legal status (The legal status is an assumption and is not a legal conclusion. Google has not performed a legal analysis and makes no representation as to the accuracy of the status listed.)
- Active, expires
Links
Images


Classifications
-
- G06T7/0081—
-
- G—PHYSICS
- G06—COMPUTING OR CALCULATING; COUNTING
- G06T—IMAGE DATA PROCESSING OR GENERATION, IN GENERAL
- G06T7/00—Image analysis
- G06T7/10—Segmentation; Edge detection
- G06T7/11—Region-based segmentation
-
- G—PHYSICS
- G06—COMPUTING OR CALCULATING; COUNTING
- G06T—IMAGE DATA PROCESSING OR GENERATION, IN GENERAL
- G06T7/00—Image analysis
- G06T7/0002—Inspection of images, e.g. flaw detection
- G06T7/0012—Biomedical image inspection
-
- G—PHYSICS
- G06—COMPUTING OR CALCULATING; COUNTING
- G06F—ELECTRIC DIGITAL DATA PROCESSING
- G06F18/00—Pattern recognition
- G06F18/20—Analysing
- G06F18/23—Clustering techniques
-
- G06K9/6218—
-
- G—PHYSICS
- G06—COMPUTING OR CALCULATING; COUNTING
- G06T—IMAGE DATA PROCESSING OR GENERATION, IN GENERAL
- G06T2207/00—Indexing scheme for image analysis or image enhancement
- G06T2207/10—Image acquisition modality
- G06T2207/10072—Tomographic images
- G06T2207/10088—Magnetic resonance imaging [MRI]
-
- G—PHYSICS
- G06—COMPUTING OR CALCULATING; COUNTING
- G06T—IMAGE DATA PROCESSING OR GENERATION, IN GENERAL
- G06T2207/00—Indexing scheme for image analysis or image enhancement
- G06T2207/20—Special algorithmic details
- G06T2207/20081—Training; Learning
-
- G—PHYSICS
- G06—COMPUTING OR CALCULATING; COUNTING
- G06T—IMAGE DATA PROCESSING OR GENERATION, IN GENERAL
- G06T2207/00—Indexing scheme for image analysis or image enhancement
- G06T2207/30—Subject of image; Context of image processing
- G06T2207/30004—Biomedical image processing
- G06T2207/30016—Brain
Definitions
- the present embodiments relate to a method and system for separating tissue classes in magnetic resonance images.
- Radiation therapy is the medical use of ionizing radiation as a part of cancer treatment to control malignant cells and may be used as a primary or adjuvant modality.
- Radiation therapy (RT) planning may be based on computed tomography (CT) images.
- CT images provide the electron density information for dose calculation, which may be obtained almost directly and hence, is used for RT planning.
- CT images pose difficulties in RT planning.
- the presence of implants in the body of a patient may cause image artifacts.
- Magnetic resonance (MR) images may be used in RT planning for delineation of a tumor and organs at risk, due to better soft tissue contrast.
- the RT planning may be achieved by manual segmentation or atlas based segmentation of MR images.
- techniques such as generating a statistical model from CT images and fitting into MR images are present. These techniques fail to classify different tissues in the body of the patient (e.g., in the head). Other techniques such as fitting a statistical model obtained from the CT images to the MR images are unable to map the individual skull shape correctly.
- a method for separating tissue classes in MR images includes acquiring a plurality of magnetic resonance images of a subject with different acquisition parameters and generating a multi-dimensional intensity distribution model from the plurality of magnetic resonance images.
- the multi-dimensional intensity distribution model represents a distribution of intensities of voxels in each magnetic resonance image of the plurality, identifying clusters of correlated intensities in the multi-dimensional intensity model and assigning the clusters into one or more tissue classes based on the correlated intensities of each of the clusters.
- a system for separating tissue classes in magnetic resonance images includes a processor configured to acquire a plurality of magnetic resonance images of a subject with different acquisition parameters and generate a multi-dimensional intensity distribution model from the plurality of magnetic resonance images.
- the multi-dimensional intensity distribution model represents a distribution of intensities of voxels in each magnetic resonance image of the plurality.
- the processor is also configured to identify clusters of correlated intensities in the multi-dimensional intensity distribution model and assign the clusters into one or more tissue classes based on the correlated intensities of each of the clusters.
- a non-transitory computer readable medium includes instructions that, when executed by a processor, causes the processor to perform a method including acquiring a plurality of magnetic resonance images of a subject with different acquisition parameters and generating a multi-dimensional intensity distribution model from the plurality of magnetic resonance images.
- the multi-dimensional intensity distribution model represents a distribution of intensities of voxels in each magnetic resonance image of the plurality.
- the method also includes identifying clusters of correlated intensities in the multi-dimensional intensity model and assigning the clusters into one or more tissue classes based on the correlated intensities of each of the clusters.
- FIG. 1 is a flowchart illustrating one embodiment of a method of separating tissue classes in magnetic resonance images
- FIG. 2 is a flowchart illustrating another embodiment of a method of separating tissue classes in magnetic resonance images
- FIG. 3 illustrates a multi-dimensional intensity distribution model
- FIG. 4 shows one embodiment of a system for separating tissue classes in magnetic resonance images.
- FIG. 1 is a flowchart 200 that illustrates one embodiment of a method for separating tissue classes in magnetic resonance images.
- An MR imaging system operable to scan a subject and generate an image of the subject (e.g., a patient) is used to achieve the exemplary method.
- the exemplary embodiments illustrated are described in the context of imaging a head of the patient, the embodiments may also include other parts of the body of the patient.
- the exemplary embodiments illustrated and described hereinafter may find application in multi-modality imaging systems that employ an imaging system in conjunction with other imaging modalities, position-tracking systems or other sensor systems.
- the MR imaging system may generate ultra short echo time (UTE) pulse sequences that may be used for imaging tissues or tissue components.
- UTE ultra short echo time
- a plurality of MR images of the subject is acquired with different acquisition parameters.
- the different acquisition parameters may include parameters such as, for example, imaging parameters, repetition time, echo time, sampling bandwidth, scanning time and scanning range.
- the MR images are acquired using the UTE technique having different echo time (TE).
- TE echo time
- two images having different echo time are acquired such that a first image of the two images is acquired using smaller echo time, and a second image of the two images is acquired with a longer echo time compared to the first image.
- the first image is acquired using an ultra short TE of 0.07 ms
- the second image is acquired using an ultra short TE of about 2-5 ms.
- the head of the patient may include several tissues.
- the tissues may include bone, air, and cerebrospinal fluid and soft tissues such as tendons, ligaments, fascia, skin, fibrous tissue, and fat, for example.
- a multi-dimensional intensity distribution model is generated from the plurality of MR images.
- the multi-dimensional intensity distribution model represents a distribution of intensities of voxels in each magnetic resonance image of the plurality.
- the MR images are three-dimensional images that include volume elements (e.g., voxels).
- the voxels in each image of the plurality have different intensity values.
- the multi-dimensional intensity distribution model will be described in more detail with reference to FIG. 3 .
- the multi-dimensional intensity distribution model may be a Gaussian mixture model (GMM).
- GMM Gaussian mixture model
- Other techniques such as, for example, K-means classification, neural networks, and support vector machines may also be used for classification of the multi-dimensional intensity distribution model.
- a GMM is a parametric probability density function represented as a weighted sum of Gaussian component densities. GMM is used as a parametric model of the probability distribution of continuous measurements such as, for example, the intensity distribution of voxels in each MR image of the plurality.
- clusters in the multi-dimensional intensity distribution model are identified.
- the clusters are representative of correlated intensities of voxels from each MR image of the plurality.
- One or more clusters may thus be identified in the multi-dimensional intensity distribution model, where the one or more clusters are indicative of different tissue classes in the head of the patient.
- An image may be represented as a grid of matrix M ⁇ N, where M and N are natural or integer numbers. Each of these values represents a microdot or a pixel specifying a location of the pixel.
- the pixel may be represented by a grey value having a value from 0 to 255 (e.g., grey levels with value 0 as black and 255 as white), thus indicating the intensity of the pixel.
- the two images have intensity values that may be different for each of the pixels or the picture elements.
- the terms “pixel” and “voxel” are used interchangeably throughout the application.
- the identification of the clusters includes allocating a point in the multi-dimensional intensity distribution model to one of the clusters, such that a distance from the point to a center point of the one allocated cluster is lower than a distance to a center point of any of the other clusters.
- the multi-dimensional intensity distribution model is based upon a multi-dimensional Gaussian mixture model.
- the Gaussian distribution is a continuous probability distribution that is used as a first approximation to describe real valued random variables that tend to cluster around a single mean value.
- the graph of the associated probability density function is bell shaped (e.g., the Gaussian function or bell curve).
- the Gaussian function is represented by the following equation:
- ⁇ is the mean representing the location of the peak of the curve
- ⁇ 2 is the variance, which represents a measure of the width of the distribution.
- the cluster in the multi-dimensional intensity distribution model is in the form of a Gaussian function or bell curve as mentioned in equation (1).
- the multi-dimensional intensity distribution model includes one or more clusters, and each of the one or more clusters is represented in the form of the Gaussian function.
- a first cluster has a mean as ⁇ 1
- a second cluster has a mean as ⁇ 2 .
- a distance of a point from ⁇ 1 and ⁇ 2 is calculated. The point is allocated to the cluster, to which the distance is the least.
- the distance is a Mahalanobis distance of each voxel intensity pair from the two MR images to the centers of the two clusters (e.g., the first cluster and the second cluster).
- the clusters that have been identified in act 206 are assigned into one or more tissue classes.
- the assignment of the clusters into the one or more tissue classes is based on correlated intensities of each of the clusters.
- the one or more tissue classes include bone, air, cerebrospinal fluid, and/or soft tissues. Based upon the correlated intensities, the clusters are classified as representative of a tissue class in the multi-dimensional intensity distribution model.
- a data model of the subject (e.g., the patient) is created.
- the data model may be segmented into one or more regions of different tissue classes.
- the data model of the subject includes voxels. The voxels in each region of the one or more regions of the data model correspond to the clusters in the multi-dimensional intensity distribution model.
- the data model is used to generate an image of the subject with different tissue classes highlighted in the image.
- a flowchart 300 illustrating another embodiment of the method of separating tissue classes in MR images is shown.
- a plurality of MR images of the subject is acquired using different acquisition parameters.
- two ultra short echo time (UTE) MR images having different echo time are acquired.
- background voxels and foreground voxels in the plurality of MR images of the subject are separated.
- the background voxels are voxels surrounding the subject, and the foreground voxels are body voxels of the subject.
- the background voxels and the foreground voxels in the plurality of MR images are separated using an Otsu filter.
- the plurality of MR images is normalized.
- the plurality of MR images acquired using UTE technique show intensity inhomogeneities that are to be corrected.
- Some MR images of the plurality may show signal decay in a particular direction (e.g., a caudal direction), while other MR images of the plurality may show irregular intensity inhomogeneities.
- the intensity inhomogeneities may be corrected using normalization.
- a slice-wise normalization that involves dividing each transversal slice of the image by a maximum intensity value may be carried out.
- homomorphic filtering is applied to the plurality of MR images, thereby correcting the intensity inhomogeneities.
- a multi-dimensional intensity distribution model is generated from the plurality of MR images representing the distribution of the intensities of voxels in each MR image of the plurality.
- the multi-dimensional intensity distribution model is based on a multi-dimensional Gaussian mixture model and is fitted to a joint histogram for the plurality of MR images.
- the clusters of correlated intensities in the multi-dimensional intensity distribution model are identified, and the clusters are assigned into one or more tissue classes based on the correlated intensities of each of the clusters, as explained with reference to FIG. 1 .
- tissue class of the one or more tissue classes may be separated from the remaining tissue classes of the one or more tissue classes by acquiring an additional MR image.
- the one or more tissue classes may include air, bone and cerebrospinal fluid.
- the cerebrospinal fluid may be separated from the remaining tissues by using an additional MR image sequence.
- tissue classes are represented by one or two clusters together in the multi-dimensional intensity distribution model.
- an image of the subject is displayed with different tissue classes highlighted.
- the multi-dimensional intensity distribution model 320 is illustrated.
- the multi-dimensional intensity distribution model 320 is based on Gaussian mixture model (GMM).
- GMM Gaussian mixture model
- the multi-dimensional intensity distribution model is a joint histogram for the plurality of MR images.
- the GMM is a two-dimensional model with the two axes (e.g., the X axis 322 and the Y axis 324 ) representing the intensity of corresponding voxels from the two MR images: the X-axis 322 for the first MR image and the Y-axis for the second MR image.
- the GMM may be estimated using an algorithm such as, for example, an expectation-maximization algorithm.
- Reference numeral 326 is representative of a Z-axis in the multi-dimensional intensity distribution model 320 , indicating the probability that a certain combination of intensity values from the first image and the second image will occur for spatially corresponding image voxels.
- the GMM may also be extended to include more than two images. For example, if there are three images, the X, Y and Z axes may represent the three images, and the fourth axis may indicate a probability that a certain combination of intensity values from the three images occurs.
- the multi-dimensional intensity distribution model 320 contains one or more (e.g., three) clusters 328 , 330 , 332 .
- the three clusters 328 , 330 , 332 represent different tissue classes. For example, a first cluster 328 is representative of bone, a second cluster 330 is representative of air, and a third cluster 332 is representative of cerebrospinal fluid.
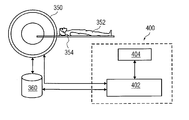
- FIG. 4 is a schematic diagram of one embodiment of a system 400 for separating tissue classes in MR images.
- the system 400 is a computer with software applications running on the computer.
- the system 400 is connected to an MRI scanner 350 that includes a bed 354 , on which the subject 352 (e.g., a patient) lies.
- the subject 352 is driven into the scanner 350 for acquiring MR images.
- the system 400 includes a processor 402 adapted to acquire a plurality of MR images of the subject 352 with different acquisition parameters, as mentioned with reference to FIG. 1 . That the system 400 may be a stand-alone computer with software applications running on the stand-alone computer. Alternatively, the system 400 may be an integral part of the MRI scanner 350 .
- a data repository 360 is connected to the MRI scanner 350 to store MR image data.
- This MR image data is accessed by the processor 402 of the system 400 for further processing.
- the system 400 includes a display unit 404 to display the processed image of the subject 352 .
- the display unit 404 is configured to display the image of the subject 352 with different tissue classes highlighted in the image.
- the image data may also be accessed from a picture archiving and communication system (PACS).
- the PACS may be coupled to a remote system such as a radiology department information system (RIS), a hospital information system (HIS) or an internal or external network, for example, so that image data may be accessed from different locations.
- RIS radiology department information system
- HIS hospital information system
- an internal or external network for example
- the processor 402 is configured to generate a multi-dimensional intensity distribution model from the plurality of MR images that are acquired using the UTE technique, as described with reference to FIGS. 1-3 .
- the multi-dimensional intensity distribution model 320 (see FIG. 3 ) is displayed on the display unit 404 .
- the processor 402 is further configured to identify clusters of correlated intensities in the multi-dimensional intensity distribution model and assign the clusters into one or more tissue classes based on the correlated intensities of each of the clusters.
- the processor 402 is configured to create a data model of the subject 352 .
- the data model is segmented into one or more regions of different tissue classes, such that voxels in each of the regions corresponds to the cluster in the multi-dimensional intensity distribution model.
- the exemplary method and the system for separating tissue classes in MR images, as described above, has several advantages.
- the method is fully automatic and may also improve accuracy in RT planning for certain indication such as, for example, existence of high-Z implants or for planning in low soft-tissue contrast regions where MR data is used when rigid fusion yields allows MRI and CT to be overlayed, which is not often the cases in real clinical practice.
- the methods of the present embodiments provide for directly planning the treatment based on the MR image.
Landscapes
- Engineering & Computer Science (AREA)
- Computer Vision & Pattern Recognition (AREA)
- Physics & Mathematics (AREA)
- General Physics & Mathematics (AREA)
- Theoretical Computer Science (AREA)
- Health & Medical Sciences (AREA)
- General Health & Medical Sciences (AREA)
- Medical Informatics (AREA)
- Nuclear Medicine, Radiotherapy & Molecular Imaging (AREA)
- Radiology & Medical Imaging (AREA)
- Quality & Reliability (AREA)
- Magnetic Resonance Imaging Apparatus (AREA)
Abstract
Description
where: μ is the mean representing the location of the peak of the curve, and
Claims (19)
Priority Applications (1)
| Application Number | Priority Date | Filing Date | Title |
|---|---|---|---|
| US13/088,171 US9466116B2 (en) | 2011-04-15 | 2011-04-15 | Method and system for separating tissue classes in magnetic resonance images |
Applications Claiming Priority (1)
| Application Number | Priority Date | Filing Date | Title |
|---|---|---|---|
| US13/088,171 US9466116B2 (en) | 2011-04-15 | 2011-04-15 | Method and system for separating tissue classes in magnetic resonance images |
Publications (2)
| Publication Number | Publication Date |
|---|---|
| US20120263361A1 US20120263361A1 (en) | 2012-10-18 |
| US9466116B2 true US9466116B2 (en) | 2016-10-11 |
Family
ID=47006411
Family Applications (1)
| Application Number | Title | Priority Date | Filing Date |
|---|---|---|---|
| US13/088,171 Active 2033-12-24 US9466116B2 (en) | 2011-04-15 | 2011-04-15 | Method and system for separating tissue classes in magnetic resonance images |
Country Status (1)
| Country | Link |
|---|---|
| US (1) | US9466116B2 (en) |
Families Citing this family (6)
| Publication number | Priority date | Publication date | Assignee | Title |
|---|---|---|---|---|
| US10114098B2 (en) * | 2014-04-01 | 2018-10-30 | Koninklijke Philips N.V. | Method estimating a pseudo Hounsfield Unit value |
| US10002423B2 (en) | 2015-09-04 | 2018-06-19 | Canon Kabushiki Kaisha | Medical image processing apparatus, medical image processing method, and medical image processing system |
| US11741747B2 (en) | 2021-01-13 | 2023-08-29 | Ford Global Technologies, Llc | Material spectroscopy |
| US11657589B2 (en) | 2021-01-13 | 2023-05-23 | Ford Global Technologies, Llc | Material spectroscopy |
| US20220222466A1 (en) * | 2021-01-13 | 2022-07-14 | Ford Global Technologies, Llc | Material spectroscopy |
| US11443527B2 (en) | 2021-01-13 | 2022-09-13 | Ford Global Technologies, Llc | Material spectroscopy |
Citations (9)
| Publication number | Priority date | Publication date | Assignee | Title |
|---|---|---|---|---|
| US5412563A (en) * | 1993-09-16 | 1995-05-02 | General Electric Company | Gradient image segmentation method |
| US20010031920A1 (en) * | 1999-06-29 | 2001-10-18 | The Research Foundation Of State University Of New York | System and method for performing a three-dimensional virtual examination of objects, such as internal organs |
| US20040013292A1 (en) * | 2002-05-17 | 2004-01-22 | Pfizer, Inc. | Apparatus and method for statistical image analysis |
| US20080132787A1 (en) * | 2004-12-22 | 2008-06-05 | Elekta Ab (Publ) | Radiotherapeutic Apparatus |
| US7636420B2 (en) * | 2005-05-26 | 2009-12-22 | Koninklijke Philips Electronics N.V. | Radio-therapeutic treatment planning incorporating functional imaging information |
| US20100124364A1 (en) * | 2008-11-19 | 2010-05-20 | Zhimin Huo | Assessment of breast density and related cancer risk |
| US20100198900A1 (en) * | 2009-02-05 | 2010-08-05 | Sean Gifford | Methods of multivariate data cluster separation and visualization |
| US20110002523A1 (en) * | 2008-03-03 | 2011-01-06 | Prakash Bhanu K N | Method and System of Segmenting CT Scan Data |
| US20120075440A1 (en) * | 2010-09-28 | 2012-03-29 | Qualcomm Incorporated | Entropy based image separation |
-
2011
- 2011-04-15 US US13/088,171 patent/US9466116B2/en active Active
Patent Citations (9)
| Publication number | Priority date | Publication date | Assignee | Title |
|---|---|---|---|---|
| US5412563A (en) * | 1993-09-16 | 1995-05-02 | General Electric Company | Gradient image segmentation method |
| US20010031920A1 (en) * | 1999-06-29 | 2001-10-18 | The Research Foundation Of State University Of New York | System and method for performing a three-dimensional virtual examination of objects, such as internal organs |
| US20040013292A1 (en) * | 2002-05-17 | 2004-01-22 | Pfizer, Inc. | Apparatus and method for statistical image analysis |
| US20080132787A1 (en) * | 2004-12-22 | 2008-06-05 | Elekta Ab (Publ) | Radiotherapeutic Apparatus |
| US7636420B2 (en) * | 2005-05-26 | 2009-12-22 | Koninklijke Philips Electronics N.V. | Radio-therapeutic treatment planning incorporating functional imaging information |
| US20110002523A1 (en) * | 2008-03-03 | 2011-01-06 | Prakash Bhanu K N | Method and System of Segmenting CT Scan Data |
| US20100124364A1 (en) * | 2008-11-19 | 2010-05-20 | Zhimin Huo | Assessment of breast density and related cancer risk |
| US20100198900A1 (en) * | 2009-02-05 | 2010-08-05 | Sean Gifford | Methods of multivariate data cluster separation and visualization |
| US20120075440A1 (en) * | 2010-09-28 | 2012-03-29 | Qualcomm Incorporated | Entropy based image separation |
Non-Patent Citations (19)
| Title |
|---|
| Abstract, "Classification of UTE-MR volumes of the head for use in radiotherapy planning," p. 1, Jul. 2010. |
| Crum, William R. "Spectral Clustering and Label Fusion for 3D Tissue Classification: Sensitivity and Consistency Analysis." Annals of BMVA. 2009.6 (2009): 1-12. Print. * |
| Dawant, et al. "Correction of Intensity Variations in MR Images for Computer-Aided Tissue Classification." IEEE Transactions on Medical Imaging. 12.4 (1993): 770-781. Print. * |
| Dominique Toepfer et al., "Classification of UTE-MR volumes of the head for use in radiotherapy planning," Oncology Care Systems, Healthcare Sector, Siemens AG, Germany, pp. 1-5, 2003. |
| Ferrari, et al. "Segmentation of the fibro-glandular disc in mammograms using Gaussian mixture modeling." Medical & Biological Engineering & Computing. 42. (2004): 378-387. Print. * |
| Greenspan et al. "Constrained Gaussian Mixture Model Framework for Automatic Segmentation of MR Brain Images." IEEE Transactions on Medical Imaging. 25.9 (2006): 1233-1245. Print. * |
| Huang et al. "MRI Brain Extraction with Combined Expectation Maximization and Geodesic Active Contours." IEEE International Symposium on Signal Processing and Information Technology. (2006): 107-111. Print. * |
| Jacobs et al. "A Model for Multiparametric MRI Tissue Characterization in Experimental Cerebral Ischemia With Histological Validation in Rat Part 1." Stroke: Journal of the American Heart Association. 32. (2001): 943-949. Print. * |
| Jager, et al. "Nonridig Registration of Joint Histograms for Intensity Standardization in Magnetic Resonance Imaging." IEEE Transactions on Medical Imaging. 28.1 (2009): 137-150. Print. * |
| Jonsson, et al. "Treatment Planning Using MRI Data: An Analysis of the Dose Calculation Accuracy for Different Treatment Regions." Radiation Oncology 5.62 (2010): 1-8. Print. * |
| Kapur, et al. "Segmentation of brain tissue from magnetic resonance images." Medical Image Analysis. 1.2 (1996): 109-127. Print. * |
| Mackiewich et al. "7.5 Correct Intensity." Simon Fraser University Computing Science. N.p., Aug. 19, 1995. Web. Jun. 7, 2014. . * |
| Mackiewich et al. "7.5 Correct Intensity." Simon Fraser University Computing Science. N.p., Aug. 19, 1995. Web. Jun. 7, 2014. <http://www.cs.sfu.ca/˜stella/papers/blairthesis/main/node45.html>. * |
| Mackiewich, Blair. "7.5 Correct Intensity." Simon Fraser University Computing Science. N.p., Aug. 19, 1995. Web. Jun. 7, 2014. . * |
| Mackiewich, Blair. "7.5 Correct Intensity." Simon Fraser University Computing Science. N.p., Aug. 19, 1995. Web. Jun. 7, 2014. <http://www.cs.sfu.ca/˜stella/papers/blairthesis/main/node45.html>. * |
| Prastawa, et al. "A Brain Tumor Segmentation Framework Based on Outlier Detection." Medical Image Analysis 8 (2004): 275-83. Print. * |
| Robson et al. "Magnetic Resonance: An Introduction to Ultrashort TE (UTE) Imaging." J Comput Assist Tomogr. 27.6 (2003): 825-846. Print. * |
| Shah, et al. "Effectiveness of Intensity Normalization on Human Brain MRIs with Multiple Sclerosis." MIAMS-Workshop on Medical Image Analysis on Multiple Sclerosis. (2009): 1-12. Print. * |
| Toepfer et al. "Classification of UTE-MR volumes of the head for use in radiotherapy planning," Oncology Care Systems, Healthcare Sector, Siemens AG, Germany, pp. 1-5, 2003. * |
Also Published As
| Publication number | Publication date |
|---|---|
| US20120263361A1 (en) | 2012-10-18 |
Similar Documents
| Publication | Publication Date | Title |
|---|---|---|
| Abdallah et al. | Research in Medical Imaging Using Image Processing | |
| CN100550004C (en) | A Method for Segmenting 3D Medical Images Containing Regions of Interest | |
| CN107545584B (en) | Method, device and system for positioning region of interest in medical image | |
| US9082169B2 (en) | Longitudinal monitoring of pathology | |
| US9336613B2 (en) | Apparatus for generating assignments between image regions of an image and element classes | |
| US20130190602A1 (en) | 2d3d registration for mr-x ray fusion utilizing one acquisition of mr data | |
| US8750584B2 (en) | Medical image display processing method, device, and program | |
| US12100157B2 (en) | Systems and methods for image processing | |
| US9466116B2 (en) | Method and system for separating tissue classes in magnetic resonance images | |
| Khalifé et al. | Subject-specific bone attenuation correction for brain PET/MR: can ZTE-MRI substitute CT scan accurately? | |
| US9245208B2 (en) | Patient modeling from multispectral input image volumes | |
| US20150356733A1 (en) | Medical image processing | |
| US10684339B2 (en) | Dual flip angle multi-echo ultra-short echo time (DUFA-MUTE) magnetic resonance imaging (MRI) systems and methods | |
| US10068351B2 (en) | Automatic detection and identification of brain sulci in MRI | |
| EP3170145B1 (en) | Imaging data statistical testing including a stereotactical normalization with a personalized template image | |
| US20190236776A1 (en) | Rib developed image generation apparatus, method, and program | |
| US20240242400A1 (en) | Systems and methods for medical imaging | |
| Opposits et al. | Population based ranking of frameless CT-MRI registration methods | |
| WO2017198518A1 (en) | Image data processing device | |
| Maduskar et al. | Automatic identification of intracranial hemorrhage in non-contrast CT with large slice thickness for trauma cases | |
| EP4439445A1 (en) | Device, system and method for generating a medical image of a region of interest of a subject indicating contrast-enhanced regions | |
| US11776154B2 (en) | Method and device for medical imaging for representing a 3D volume containing at least one introduced foreign object | |
| Prasad et al. | Volumetric tumour detection using improved region grow algorithm | |
| Debus | Medical Image Processing | |
| CN121337463A (en) | Electrode Anatomy Localization System Based on Multimodal Image Fusion |
Legal Events
| Date | Code | Title | Description |
|---|---|---|---|
| AS | Assignment |
Owner name: SIEMENS AKTIENGESELLSCHAFT, GERMANY Free format text: ASSIGNMENT OF ASSIGNORS INTEREST;ASSIGNORS:BOETTGER, THOMAS;TOEPFER, DOMINIQUE;SIGNING DATES FROM 20110519 TO 20110522;REEL/FRAME:026497/0324 |
|
| FEPP | Fee payment procedure |
Free format text: PAYOR NUMBER ASSIGNED (ORIGINAL EVENT CODE: ASPN); ENTITY STATUS OF PATENT OWNER: LARGE ENTITY |
|
| STCF | Information on status: patent grant |
Free format text: PATENTED CASE |
|
| AS | Assignment |
Owner name: SIEMENS HEALTHCARE GMBH, GERMANY Free format text: ASSIGNMENT OF ASSIGNORS INTEREST;ASSIGNOR:SIEMENS AKTIENGESELLSCHAFT;REEL/FRAME:040656/0054 Effective date: 20161104 |
|
| MAFP | Maintenance fee payment |
Free format text: PAYMENT OF MAINTENANCE FEE, 4TH YEAR, LARGE ENTITY (ORIGINAL EVENT CODE: M1551); ENTITY STATUS OF PATENT OWNER: LARGE ENTITY Year of fee payment: 4 |
|
| AS | Assignment |
Owner name: SIEMENS HEALTHINEERS AG, GERMANY Free format text: ASSIGNMENT OF ASSIGNORS INTEREST;ASSIGNOR:SIEMENS HEALTHCARE GMBH;REEL/FRAME:066088/0256 Effective date: 20231219 |
|
| AS | Assignment |
Owner name: SIEMENS HEALTHINEERS AG, GERMANY Free format text: CORRECTIVE ASSIGNMENT TO CORRECT THE ASSIGNEE PREVIOUSLY RECORDED AT REEL: 066088 FRAME: 0256. ASSIGNOR(S) HEREBY CONFIRMS THE ASSIGNMENT;ASSIGNOR:SIEMENS HEALTHCARE GMBH;REEL/FRAME:071178/0246 Effective date: 20231219 |
|
| MAFP | Maintenance fee payment |
Free format text: PAYMENT OF MAINTENANCE FEE, 8TH YEAR, LARGE ENTITY (ORIGINAL EVENT CODE: M1552); ENTITY STATUS OF PATENT OWNER: LARGE ENTITY Year of fee payment: 8 |