US9207318B2 - Damage proxy map from interferometric synthetic aperture radar coherence - Google Patents
Damage proxy map from interferometric synthetic aperture radar coherence Download PDFInfo
- Publication number
- US9207318B2 US9207318B2 US13/528,610 US201213528610A US9207318B2 US 9207318 B2 US9207318 B2 US 9207318B2 US 201213528610 A US201213528610 A US 201213528610A US 9207318 B2 US9207318 B2 US 9207318B2
- Authority
- US
- United States
- Prior art keywords
- coherence
- map
- damage
- slave
- master
- Prior art date
- Legal status (The legal status is an assumption and is not a legal conclusion. Google has not performed a legal analysis and makes no representation as to the accuracy of the status listed.)
- Active, expires
Links
- 230000006378 damage Effects 0.000 title claims abstract description 101
- 238000000034 method Methods 0.000 claims abstract description 42
- 230000008859 change Effects 0.000 claims description 31
- 238000012731 temporal analysis Methods 0.000 claims description 9
- 238000000700 time series analysis Methods 0.000 claims description 9
- 238000010200 validation analysis Methods 0.000 claims description 4
- 230000001131 transforming effect Effects 0.000 claims 1
- 238000004519 manufacturing process Methods 0.000 abstract description 4
- 230000003287 optical effect Effects 0.000 description 19
- 230000002123 temporal effect Effects 0.000 description 19
- 238000004590 computer program Methods 0.000 description 17
- 238000010276 construction Methods 0.000 description 14
- 238000001514 detection method Methods 0.000 description 8
- 230000006870 function Effects 0.000 description 7
- 238000012545 processing Methods 0.000 description 7
- 230000007423 decrease Effects 0.000 description 5
- 230000035945 sensitivity Effects 0.000 description 5
- 238000012360 testing method Methods 0.000 description 5
- 238000004458 analytical method Methods 0.000 description 4
- 230000008901 benefit Effects 0.000 description 4
- 238000004422 calculation algorithm Methods 0.000 description 4
- 238000004891 communication Methods 0.000 description 4
- 230000009977 dual effect Effects 0.000 description 4
- 230000010287 polarization Effects 0.000 description 4
- 230000008569 process Effects 0.000 description 4
- 239000007787 solid Substances 0.000 description 4
- 230000001427 coherent effect Effects 0.000 description 3
- 230000001186 cumulative effect Effects 0.000 description 3
- 230000000694 effects Effects 0.000 description 3
- 238000003384 imaging method Methods 0.000 description 3
- 239000004973 liquid crystal related substance Substances 0.000 description 3
- 238000013507 mapping Methods 0.000 description 3
- 238000005259 measurement Methods 0.000 description 3
- 230000004044 response Effects 0.000 description 3
- 230000002441 reversible effect Effects 0.000 description 3
- 238000009827 uniform distribution Methods 0.000 description 3
- 101150064138 MAP1 gene Proteins 0.000 description 2
- 238000013459 approach Methods 0.000 description 2
- 230000001174 ascending effect Effects 0.000 description 2
- 230000006399 behavior Effects 0.000 description 2
- 238000012512 characterization method Methods 0.000 description 2
- 230000008878 coupling Effects 0.000 description 2
- 238000010168 coupling process Methods 0.000 description 2
- 238000005859 coupling reaction Methods 0.000 description 2
- 238000013500 data storage Methods 0.000 description 2
- 238000009826 distribution Methods 0.000 description 2
- 238000002474 experimental method Methods 0.000 description 2
- 238000005305 interferometry Methods 0.000 description 2
- 230000000873 masking effect Effects 0.000 description 2
- 230000036961 partial effect Effects 0.000 description 2
- 230000002093 peripheral effect Effects 0.000 description 2
- 230000002829 reductive effect Effects 0.000 description 2
- 238000007634 remodeling Methods 0.000 description 2
- 238000011160 research Methods 0.000 description 2
- 230000003595 spectral effect Effects 0.000 description 2
- CCEKAJIANROZEO-UHFFFAOYSA-N sulfluramid Chemical group CCNS(=O)(=O)C(F)(F)C(F)(F)C(F)(F)C(F)(F)C(F)(F)C(F)(F)C(F)(F)C(F)(F)F CCEKAJIANROZEO-UHFFFAOYSA-N 0.000 description 2
- 230000000007 visual effect Effects 0.000 description 2
- 238000011179 visual inspection Methods 0.000 description 2
- 241001270131 Agaricus moelleri Species 0.000 description 1
- 238000012952 Resampling Methods 0.000 description 1
- NIXOWILDQLNWCW-UHFFFAOYSA-N acrylic acid group Chemical group C(C=C)(=O)O NIXOWILDQLNWCW-UHFFFAOYSA-N 0.000 description 1
- 230000009471 action Effects 0.000 description 1
- 230000002547 anomalous effect Effects 0.000 description 1
- 230000001413 cellular effect Effects 0.000 description 1
- 238000007635 classification algorithm Methods 0.000 description 1
- 238000005314 correlation function Methods 0.000 description 1
- 230000003247 decreasing effect Effects 0.000 description 1
- 238000013461 design Methods 0.000 description 1
- 238000011161 development Methods 0.000 description 1
- 238000011439 discrete element method Methods 0.000 description 1
- 238000005315 distribution function Methods 0.000 description 1
- 238000002592 echocardiography Methods 0.000 description 1
- 238000001914 filtration Methods 0.000 description 1
- 238000007667 floating Methods 0.000 description 1
- 230000014509 gene expression Effects 0.000 description 1
- 230000008571 general function Effects 0.000 description 1
- 239000011521 glass Substances 0.000 description 1
- 230000010354 integration Effects 0.000 description 1
- 238000002955 isolation Methods 0.000 description 1
- 239000000463 material Substances 0.000 description 1
- 238000012986 modification Methods 0.000 description 1
- 230000004048 modification Effects 0.000 description 1
- 238000011022 operating instruction Methods 0.000 description 1
- 238000003672 processing method Methods 0.000 description 1
- 206010037844 rash Diseases 0.000 description 1
- 238000011084 recovery Methods 0.000 description 1
- 238000002310 reflectometry Methods 0.000 description 1
- 238000009418 renovation Methods 0.000 description 1
- 238000012827 research and development Methods 0.000 description 1
- 238000012358 sourcing Methods 0.000 description 1
- 238000010561 standard procedure Methods 0.000 description 1
- 238000012876 topography Methods 0.000 description 1
- 238000012546 transfer Methods 0.000 description 1
- 230000001052 transient effect Effects 0.000 description 1
- 230000001960 triggered effect Effects 0.000 description 1
- 230000003442 weekly effect Effects 0.000 description 1
Images


Classifications
-
- G—PHYSICS
- G01—MEASURING; TESTING
- G01S—RADIO DIRECTION-FINDING; RADIO NAVIGATION; DETERMINING DISTANCE OR VELOCITY BY USE OF RADIO WAVES; LOCATING OR PRESENCE-DETECTING BY USE OF THE REFLECTION OR RERADIATION OF RADIO WAVES; ANALOGOUS ARRANGEMENTS USING OTHER WAVES
- G01S13/00—Systems using the reflection or reradiation of radio waves, e.g. radar systems; Analogous systems using reflection or reradiation of waves whose nature or wavelength is irrelevant or unspecified
- G01S13/88—Radar or analogous systems specially adapted for specific applications
- G01S13/89—Radar or analogous systems specially adapted for specific applications for mapping or imaging
- G01S13/90—Radar or analogous systems specially adapted for specific applications for mapping or imaging using synthetic aperture techniques, e.g. synthetic aperture radar [SAR] techniques
- G01S13/9021—SAR image post-processing techniques
- G01S13/9023—SAR image post-processing techniques combined with interferometric techniques
Definitions
- the present invention relates generally to damage assessment, and in particular, to a method, apparatus, and article of manufacture for generating a damage proxy map from radar signals.
- Major earthquakes cause buildings to collapse, often claiming the lives of many.
- a critical component of the situational awareness for rescue operations and disaster size estimation is rapid, accurate, and comprehensive detection of building damage.
- spaceborne and airborne remote sensing technique is crucial. So far, private companies and government agencies have been mostly manually interpreting high-resolution optical images acquired before and after the earthquake to create damage maps, and automation of this process is still an active research area.
- Radar remote sensing has a few advantages when compared to optical sensors: 1) it does not require sunlight; 2) there is no cloud cover in radar image (clouds are transparent to radar); and 3) coherence character of a radar signal makes it highly sensitive to surface scattering property change. For this reason, interferometric synthetic aperture radar (InSAR) coherence differencing has been tested for its usefulness to generate damage maps of urban areas hit by a major earthquake. However, it turns out that perpendicular and temporal baselines of interferometric pairs need to almost be the same in order for the technique to be useful.
- InSAR interferometric synthetic aperture radar
- Radar remote sensing has some advantages over optical remote sensing: 1) adar does not require sunlight, 2) clouds are transparent to radar signal, and 3) coherent character of radar makes it highly sensitive to surface property change. For these reasons, the use of synthetic aperture radar (SAR) and interferometric SAR (InSAR) have been explored by many groups. Brunner et al. (2010) used the similarity between post-event SAR images and predicted a SAR signature derived from pre-event high-resolution optical imagery [9]. 3-D model based ray tracing can also be used to simulate high-resolution reflectivity maps [10], [11]. These techniques have potential to improve the quality of SAR-based damage assessment. However, the model requires ground truth measurements or independent remote sensing data such as LiDAR (light detection and ranging) measurements.
- LiDAR light detection and ranging
- Coherence from repeat pass interferometry provides a quantitative measure of ground surface property change during the time span of the interferometric pair.
- Major damage to a building significantly increases the interferometric phase variance in the impacted resolution element. This change shows up as a decorrelation, or a decrease in coherence.
- Zebker et al. (1996) recognized the use of InSAR coherence to detect ground surface change due to lave flow on Kilauea volcano observed with Space Shuttle Imaging Radar-C (SIR-C) [12], and Dietterich et al. (2012) used coherence images from multiple tracks of Envisat satellite to track lava flow decorrelation on Kilauea volcano [13]. Simons et al.
- Interferometric coherence a measure of similarity between two radar echoes, has been used to estimate the quality of InSAR data. This statistical quantity is calculated as
- c 1 and c 2 are complex pixel values of two SAR images coregistered, and denotes ensemble average, an average over multiple realizations of a random variable, but practically calculated with spatial average assuming ergodicity [20].
- the quantity is called complex correlation (or coherence) function, a coherent sum of interferogram weighted with the product of the root mean square of the amplitude of two SAR images [22].
- correlation refers to mathematical similarity
- coherence refers to physical similarity.
- coherence is used as the magnitude of the complex correlation function.
- the coherence is determined by many factors such as radar systems, imaging geometry, ground surface property change, and InSAR processing methods.
- ⁇ B 's are coherences due to baselines (perpendicular, temporal, and spectral, respectively)
- ⁇ V is due to volume scattering
- ⁇ K is due to system thermal noise
- ⁇ P represents coherence due to processing, such as image focusing, coregistration, and interpolation.
- Each term takes a value between 0 and 1, and any process that decreases the coherence is called decorrelation, defined as 1 ⁇ X , where X is B p , B t , B f , V, K, or P [23].
- Embodiments of the invention provide a methodology that produces reliable damage proxy maps of building damage using InSAR coherence even in the presence of other decorrelation sources that are coupled to each other.
- the processed image of coherence change is referred to herein as a DPM, because it is derived from remotely sensed data without ground truth validation.
- the methodology produces robust damage maps despite the different perpendicular and temporal baseline conditions, using histogram matching and causality constraints.
- Three radar images are used to make two pairs of interferometric coherence maps, one pair before the damage (master pair) and the other pair spanning the damage (slave pair).
- the radar image processing is done using ROI PAC (Repeat Orbit Interferometry PACkage), an InSAR processing software package available from the assignee of the present invention or other InSAR processing software.
- the slave coherence map is registered to the master coherence map using cross-correlation of their amplitude images.
- the pixel values of the slave coherence map are modified using a histogram-matching algorithm, so that the histogram of the slave coherence exactly matches that of the master coherence.
- a causality constraint is applied to suppress background clutter.
- the resulting damage map is transformed onto a georeferenced coordinate system and overlaid on top of a virtual mapping and geographic information program (e.g., GoogleTM Earth) for easy interpretation.
- FIG. 1 shows a demolition site in Pasadena, Calif., where building demolition and construction records are maintained by the city and available to the public in accordance with one or more embodiments of the invention
- FIG. 2 illustrates the distribution of perpendicular baselines of the scenes used (vs. date) in accordance with one or more embodiments of the invention
- FIGS. 3A-3F illustrate coherence and coherence difference images in accordance with one or more embodiments of the invention
- FIG. 4 shows the workflow to produce DPMs in accordance with one or more embodiments of the invention
- FIGS. 5A and 5B illustrate the effect of histogram matching in accordance with one or more embodiments of the invention
- FIG. 6 illustrates cumulative coherence change time series in accordance with one or more embodiments of the invention
- FIG. 7 shows the time series/variation of the signal to noise ratio (SNR) of the demolition site in accordance with one or more embodiments of the invention
- FIG. 8A shows the DPM of larger area that includes downtown Pasadena, Calif. in accordance with one or more embodiments of the invention
- FIG. 8B illustrates a Google EarthTM image in accordance with one or more embodiments of the invention
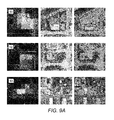
- FIGS. 9A-9C illustrate blowups of the sites in FIG. 8A in accordance with one or more embodiments of the invention.
- FIG. 10 shows past, present, and future radar missions (gray bars) and expected wait time (black curves) until the first radar satellite visits a disaster site in accordance with one or more embodiments of the invention.
- FIG. 11 is an exemplary hardware and software environment used to implement one or more embodiments of the invention.
- Embodiments of the invention provide a methodology that produces robust damage maps.
- embodiments of the invention were used to detect a building demolition project in downtown Pasadena, where 2.5 building blocks were demolished for new apartment complex. The results show clear detection of the demolition site both in space and in time. The anomalous signal starts showing up immediately after the building demolition began and clearly shows up as red blobs in the damage map. During the demolition period, the signal-to-noise ratio at the demolition site increased about 100 times.
- the developed methodology produced about 150% higher SNR on average, compared to conventional simple coherence differencing.
- the methodology was also used to detect other demolition and construction sites in Pasadena with high fidelity.
- ten (10) out of twelve (12) strong signals turn out to be associated with building demolition and construction.
- the detected changes show a wide range of size, including campus renovation of Pasadena City College and a room expansion of an individual house.
- the performance of detection and changes due to demolition and construction were confirmed with a virtual map and imaging system (e.g., GoogleTM Earth) using optical images with a time slider and records at City of Pasadena.
- the developed methodology was also applied to Victoria area, a real damage site hit by the M6.3 Victoria earthquake in February 2011.
- the results show clear detection of extensive liquefaction damages as well as building damages and landslide reported in major media.
- the methodology is being applied to M9.0 Tohoku, Japan earthquake and producing damage maps of tsunami inundation.
- One or more aspects of novelty may include the use of a histogram matching algorithm and the application of a causality constraint.
- Perpendicular and temporal baselines vary from pair to pair, and it is generally unlikely to have two pairs that have both perpendicular and temporal baselines almost the same.
- researchers have suggested theory- and experiment-driven expressions of coherence as a function of perpendicular and temporal baselines, the relationships are not robust enough to be used to adjust arbitrary slave coherence. Since conventional histogram matching algorithms only work for unsigned integer gray scale images, whereas coherence pixels have floating point numbers, a new histogram-matching methodology was developed for this work.
- the histogram matching of the invention guarantees that the slave coherence pixel values have exactly the same statistics of that of master coherence.
- the performance of a damage map is not as sensitive to the baseline conditions any more, and the results have significantly higher SNR (signal-to-noise radio) than standard methods can produce.
- Histogram matching also removes biases in coherence difference, which enables stacking and time series analysis of damage maps. It also enables application of a causality constraint that removes all negative changes (larger changes in the master pair than in the slave pair), which earthquakes are not likely to cause.
- the time series analysis of a damage map enables the development of an enhanced methodology, as the temporal behavior of each pixel can be characterized in coherence difference.
- the methodology is focused on spatial characterization to detect damages. Understanding the past history of coherence values of each pixel further improves the SNR thereby minimizing the false alarm rate.
- FIG. 1 shows a demolition site in Pasadena, Calif., where building demolition and construction records are maintained by the city and available to the public.
- the demolition project was carried out for a new apartment complex in downtown Pasadena.
- the rectangle 100 indicates the area affected by the demolition project.
- the site is composed of three building blocks, whose total dimension is 400 m(NS) ⁇ 150 m (EW).
- the demolition started on Apr. 23, 2007 and continued for nine months until Jan. 22, 2008.
- PALSAR phased array type L-band synthetic aperture radar
- fine beam mode i.e. strip-map mode
- ALOS advanced land observing satellite
- FIG. 2 Solid and open circles indicate single and dual polarization, respectively.
- the large black dot indicates the master scene (2008 Feb. 15), and the thick line connecting it to a slave scene (2006 Dec. 31) indicates the master pair.
- the thin line connecting the master scene and a slave scene (2008 Feb. 18) spans the demolition period.
- the solid and dashed vertical lines represent the beginning and the end of the demolition project, respectively.
- the InSAR data is processed taking four (4) looks in range and eight (8) looks in azimuth, with a resulting pixel size (in radar coordinates) of about 19 m in range and 28 m in azimuth.
- Geocoding is done based on a 1-arcsecond SRTM DEM (shuttle radar topography mission-digital elevation model), whose pixel size is about 26 m in EW and 30 m in NS. All interferometric pairs were made with a single master scene ( FIG. 2 ) and every interferometric coherence difference was made with respect to a single master pair ( FIG. 2 ).
- One example of a slave pair that spans the demolition period is drawn with a thin line in FIG. 2 .
- ALOS acquired dual polarization mode data (white dots) in summers.
- the range bandwidth in dual polarization mode (Fine Beam Dual: FBD) is 14 MHz, whereas the bandwidth of single polarization mode (Fine Beam Single: FBS) is 28 MHz.
- This difference in bandwidth means that the size of FBD's resolution element (resel) in range direction is twice that of FBS's, in other words, there are potentially twice as many decorrelation sources included in one resel.
- Maps of coherence indicate differences (or similarities) in the information of two SAR images. However, the decorrelation due to building demolition is often swamped by other surface property changes that vary from one data acquisition to another.
- FIGS. 3A-3F illustrate coherence and coherence difference images in accordance with one or more embodiments of the invention. More specifically, FIG. 3A illustrates the master coherence image (2006 Dec. 31-2007 Feb. 15) before the demolition began. FIG. 3B illustrates the slave coherence image (2007 Feb. 15-2008 Feb. 18) that spans the entire demolition period. FIG. 3C illustrates the slave coherence image after its histogram is matched to the master. FIG. 3D illustrates a coherence difference before histogram matching (i.e. (a)-(b)). FIG. 3E illustrates a coherence difference after histogram matching (i.e. (a)-(c)). FIG. 3F illustrates a coherence difference after causality constraint is applied.
- FIG. 3A illustrates the master coherence image (2006 Dec. 31-2007 Feb. 15) before the demolition began.
- FIG. 3B illustrates the slave coherence image (2007 Feb. 15-2008 Feb. 18) that spans the entire
- FIG. 3B shows the interferometric coherence map that spans the demolition period (the thin line segment in FIG. 2 ). Taking the difference of two coherence maps can help isolating the damage signals, as was shown in the study of Fielding et al. [15] for the 2003 Bam earthquake in Iran. The simple differencing works well when the spatial and temporal baselines of the two interferometric pairs are almost the same. However, there is no guarantee of finding a pre-seismic interferometric pair, whose baseline is similar to those of a coseismic pair. This limitation may be mitigated by applying a histogram matching methodology described below.
- the pixel values in the coherence difference map can be expressed as follows.
- the superscript 0 represents the time span of the master pair before damage
- the superscript 1 is for the slave pair spanning the damage.
- 1 ⁇ D 1 as the decorrelation due to building damage.
- FIG. 4 shows the workflow to produce DPMs in accordance with one or more embodiments of the invention.
- “Coherence Map 0 ” 402 is a master coherence image and “Coherence Map 1 ” 404 is a slave coherence image, both in radar coordinate system.
- the master coherence map 402 and slave coherence map 404 for areas before/subsequent to (i.e., including) a damage event are obtained (e.g., from an InSAR without ground truth validation).
- the slave 404 is registered to the master 402 (e.g., using cross-correlation of amplitude images).
- coherence differencing can produce significant high-frequency noise if image coregistration is not sufficiently accurate.
- three SAR images, or single-look complexes (SLCs) are required to produce one coherence difference image, where two slave SLCs are registered to a common master SLC. All three SLCs are processed with the master scene's doppler centroid to minimize the need for sub-pixel level resampling of the slave coherence image. All interferometric coherence images may be generated using ROI PAC, the InSAR software package developed by JPL/Caltech [24].
- pixel values of the slave coherence map are modified using histogram matching.
- the histogram matching results in the slave coherence map exactly matching the master coherence map (i.e., such that they are statistically identical). Details regarding the histogram matching are discussed in further detail below.
- a coherence difference between the slave and master coherence maps are computed to produce a damage proxy map.
- background clutter is suppressed by applying a causality constraint to the damage proxy map (see below for further details).
- the damage proxy map may then be transformed into a goereference coordinate system at 412 and overlayed onto a map/geographic information program (e.g., Google EarthTM) based on the georeference coordinate system (to produce the final damage assessment map 414 ).
- a map/geographic information program e.g., Google EarthTM
- coherence pixel values can be considered as a set of multiple realizations of a random variable X that follows a probability density function (PDF) of p X (x), which is the normalized histogram of the coherence pixel values.
- PDF probability density function
- CDF cumulative distribution function
- CDF has the following properties:
- FIGS. 5A and 5B The effect of the histogram matching at 408 is demonstrated in FIGS. 5A and 5B .
- FIG. 5A illustrates that as perpendicular and temporal baselines get larger, the statistics of coherence pixel values change, having a larger population of lower coherence (thick curve) compared to the original (thin line). Histogram matching 408 guarantees recovery of the original statistics.
- FIG. 5B illustrates that histogram matching 408 also ensures an unbiased coherence difference (thick curve), which enables a causality constraint, multi-looking, and time series analysis of the coherence change.
- the thin curve in FIG. 5A is the coherence histogram of the master pair 402 (i.e. before the demolition) and the thick curve is for the slave pair 404 (spanning the demolition). Since the slave pair 404 has a larger temporal baseline and a slightly larger perpendicular baseline than the master pair 402 , as shown in FIG. 2 , the shape of the slave pair histogram is significantly different from that of the master pair, skewing toward left.
- the histogram matching methodology 408 of embodiments of the invention adjusts pixel values of the slave coherence map 404 , so that it precisely matches the histogram of the master pair 402 (the dots in FIG. 5A ). Thus, the two coherence images become statistically identical.
- histogram matching 408 There are a few advantages of histogram matching 408 . If one takes the difference of the coherence maps without matching the histogram, the results are prone to a bias (the thin curve in FIG. 5B ). Removing the bias with histogram matching 408 enables unbiased time series analysis of coherence change, and it also makes it possible to take multiple looks at coherence difference maps to further suppress noise. In addition, the unbiased difference enables us the application of a causality constraint described below.
- Coherence difference values can range from ⁇ 1 to 1.
- damage detection it is not very interesting to highlight areas of negative decorrelation where coherence becomes higher in the slave pair 404 than in the master pair 402 , because damage in general does not improve coherence.
- Significant surface change such as building demolition/construction and temporary structure change, during the time span of the master pair 402 could appear as negative decorrelation. Since these pre-event changes are not the appropriate targets, they are removed by applying a causality constraint 410 , or negativity masking All negative pixel values in the coherence difference map are clipped to zero.
- FIGS. 3A-3F show the result of each step.
- the coherence image spanning the demolition ( FIG. 3B and FIG. 3C ) has extra decorrelation in the middle of the image, compared to the master coherence (of FIG. 3A ).
- the result of histogram matching 408 is shown in FIG. 3C , which is statistically identical to FIG. 3A , whereas FIG. 3B has significantly more blue pixels (illustrated as darker shaded pixels) than FIG. 3A does.
- FIG. 3D simple coherence difference
- the demolition site stands out against the background, but there is a high level of background noise including a number of false alarms.
- the background noise is reduced by the histogram matching 408 ( FIG.
- the SNR of the damage may be defined as the ratio of the intensity of coherence difference at the demolition site pixels to that of the entire image.
- the damage SNR at the demolition site is measured as 17.3 with simple difference ( FIG. 3D ).
- the SNR increased to 23.1 after histogram matching 408 ( FIG. 3E ) and to 44.6 with causality constraint 410 ( FIG. 3F ).
- a red blob (depicted as a darker grey blob) in the middle of the image grows with time with a big increase between 2008 Jul. 3 and 2007 Aug. 18. Even after the demolition project is over and as new buildings are being constructed in the area, the scattering property remains different from before the demolition began, so the strength of the red/darker blob does not change with statistical significance.
- the pairing does not have to be made with a single master. If the master and slave pairs are selected successively with small temporal baselines, one can highlight the change occurred only during the small time steps. For example, it is possible to separate the construction signal from the demolition signal by having another master after the demolition project is over. However, all these applications require that master pair maintain relatively high coherence (nothing much happened during master pair).
- FIG. 7 shows the time series/variation of the SNR of the demolition site.
- the white circles are simple coherence difference.
- the plus symbols are after histogram matching 408 .
- the black circles are after histogram matching 408 and causality constraint 410 .
- the signal starts showing up immediately after the beginning of the demolition (solid vertical line) and reaches the strongest level around the end of the demolition (dashed vertical line).
- Histogram matching 408 improved the SNR in all pairs except one, a little after the beginning of the demolition. Accordingly, the plot clearly shows the growing anomaly after the beginning of the demolition project (the solid vertical line), and it reaches the maximum toward the end of the project. Then it maintains a similar level.
- the SNR increases by a factor of 100, from 0.32 to about 32 on average.
- the average SNR increase due to the histogram matching is 30%, and the causality constraint brings additional 120%.
- the usability of SAR amplitude variation due to building damage can also be explored. It may be observed that the RMS (root mean squared) intensity ratio of the demolition area to the background decreased by a factor of 4.6 during the demolition. The intensity decrease may be due to the loss of corner reflection at the sides of the buildings toward the satellite. In this particular case, the sensitivity of SAR amplitude variation to the building demolition was about 22 times smaller than that of the coherence difference.
- the master coherence map 402 and slave coherence map 404 are obtained.
- the slave map 404 is registered to the master map 402 at 406 .
- the coherence difference between the two maps 402 and 404 is computed at 409 .
- histogram matching 408 may be performed on the slave map 404 .
- pre-event changes may be removed by applying a causality constraint at 410 .
- roads may be mapped out using geocoding 412 (or reverse geocoding to identify the road locations).
- the geocoding 412 is used to remove the amount of information transferred/stored in a damage assessment map 414 .
- geocoding 412 may be used to convert a raster image into coordinates or addresses.
- the result is the damage assessment map 414 that may be color coded and depicts blobs or other visual/audio-visual indicators of damage.
- Such a map 414 may be overlaid onto a geographic/satellite image (e.g., a Google EarthTM image) to provide a visual indicator of the location of the damage.
- the damage map 414 (including any GIS or satellite image) may also be stored/saved to a database.
- FIG. 8A shows the DPM of larger area that includes downtown Pasadena, Calif.
- the color scale of the coherence difference image ( FIG. 3 ) was adjusted to increase the color contrast, and the image was overlaid on a Google EarthTM image. Most of the clear red blobs (displayed as darker pixels) coincide with real demolition or construction projects.
- the DPM was created from a coherence difference pair with coherence images spanning 2006 Dec. 31-2007 Feb. 15 and 2007 Feb. 15-2008 Feb. 18.
- FIG. 8B illustrates a Google EarthTM image. Red/darker pixels in FIG. 8A were compared with optical images acquired on 2007 Oct. 23 and 2008 Jan. 9. White ellipses and circles 802 in FIG. 8B indicate correctly detected signals that are confirmed with optical images acquired on 2007 Oct. 23 and 2008 Jan. 9, available from Google EarthTM. Circles 804 are false alarms, and black ellipses 806 A and 806 B are undetected events.
- FIGS. 9A-9C Each of the numbered project sites S 1 -S 8 is shown in detail in FIGS. 9A-9C . Note that all of these demolition/construction sites are detected in FIG. 8A , indicating significant surface changes occurred between 2007 Oct. 23-2008 Jan. 9 (optical) and 2007 Feb. 15-2008 Feb. 18 (radar slave pair). Accordingly, eleven (11) demolition and construction projects out of the fourteen (14) strongest signals were confirmed. Other circles and ellipses are discussed below.
- FIG. 9A illustrates a blowup of FIG. 8A at sites 1 , 2 , and 3 .
- Site 1 shows that there used to be tennis courts in October 2007, but everything was removed in January 2008.
- site 2 a number of rectangular black materials were removed.
- site 3 a couple of small buildings were demolished on the right, and on the left, a new white flat-top building replaced an old brown shingled house.
- FIG. 9B illustrates a blowup of FIG. 8A at sites 4 and 5 .
- Site 4 is the original target area shown in FIG. 1 , where old buildings were all demolished for a new apartment complex.
- Site 5 shows a new foundation constructed that must have changed the radar scattering property. The new building was constructed from Winter 2006 to Summer 2008 as part of the Pasadena Convention Center expansion project.
- FIG. 9C illustrates a blowup of FIG. 8A at sites 6 , 7 , and 8 .
- Site 6 shows extensive remodeling of Pasadena City College, where they removed the parking lot, tennis courts, and a building.
- Site 7 shows two buildings constructed between 2007 Oct. 23 and 2008 Jan. 9.
- Site 8 shows an individual house that underwent a room extension.
- FIG. 8 there are red blobs/darker pixels in FIG. 8A that are not highlighted in the blowups of FIGS. 9A-9C . Such blobs are dimmer than those highlighted, and they turned out to be either correct detections or false alarms.
- the unnumbered white circles 802 U are due to 1) a dirt ground that was paved, 2) minor landscape work, and 3) a few trees cut+building top painted, respectively from left to right. Circles 804 represent potential false alarms. No obvious changes were confirmed from visual inspection of the optical images, although a more detailed analysis may indicate the source of the signal.
- the slave pair with a temporal baseline of 368 days was selected. For a disaster response, a shortest possible time span can be used for a slave pair, as a false alarm rate should decrease as the time span of coherence shrinks
- the two black ellipses 806 A and 806 B in FIG. 8B show the locations of noticeable large blobs of pink and/or white pixels, but the signal strength was not strong enough to be red (or dark pixels depending on the contrast and color settings). However, those pixels turned out to be real ground surface change.
- the ellipse 806 A in the middle of FIG. 8B was due to a single family house replaced with a couple of small 2- and 4-story buildings. The lot is narrow and long in E-W direction (15 m ⁇ 100 m) and immediately surrounded by 3-story buildings. This geometry may have caused reduced visibility in the radar line of sight (approximately east at about 38 degrees from the vertical).
- the second black ellipse 806 B towards the southeast also shows up in the DPM as a diffuse pink and white blob. This change is due to dirt ground that was covered with a building foundation, similar to what happened at site 5 but a little smaller in area.
- a list of addresses that underwent building demolition and construction projects during the time spans of interest may be collected/retrieved from the appropriate government agency.
- the range of color that may be displayed to a user can be determined empirically by visual inspection of the area with optical images provided by Google EarthTM.
- the timings of optical imagery and radar data acquisition may not exactly match.
- the difference in optical imagery shows changes in a single time span, whereas the difference in coherence shows relative changes in two time spans. Even though there was change observed in optical images, it is possible that the DPM methodology did not detect it, if there were similar amounts of decorrelation in the master pair as in the slave pair.
- Site 8 shows a room addition project of a single family house.
- the size of the added room was only about 4 m ⁇ 7 m, much smaller than the 4-range-look pixel size.
- the change appears in the DPM as a bright red/darker shaded blob. This high sensitivity was possible potentially because the house happened to align parallel to the along track direction of ALOS ascending orbit (i.e. perpendicular to the line-of-sight direction), making the house a dominant scatterer in a pixel. If that was the case, an optimal flight path of airborne measurements such as UAVSAR [26] for DPM should be parallel to building sides, dominantly north-south and east-west in Pasadena, for example.
- Differences in the traffic condition may be a source of false alarms.
- Cars backed up in the street affect the coherence. For example if there was a traffic jam only in the last scene (i.e. the slave scene of the slave pair), it can show up as red/darker shaded blobs in the DPM.
- GIS Geographical Information System
- a GIS could also be used to convert the latitude and longitude coordinates into a list of addresses, a process known as reverse geocoding 412 .
- Reverse geocoding 412 may be tested with “geopy” python script and Google's free geocoding engine to confirm that the converted address information matches the city records. Converting the raster image into coordinates or addresses dramatically reduces the size of information to be transferred. This can be useful during an emergency when communication bandwidth is often limited.
- Guidance to rescue operations may not be very useful if it does not become available within a few days after a major earthquake.
- the processing time of InSAR and DPM was about 90 minutes at a Linux machine with Intel Xeon CPU 2.67 GHz.
- the expected wait time in May 2012 for radar satellites to visit a damage site after an earthquake is about 10 hours at a latitude of 38°.
- FIG. 10 shows past, present, and future radar missions (gray bars) and expected wait time (black curves) until the first radar satellite visits a disaster site. Future InSAR missions may continue to keep the data acquisition latency within a day. If one ignores the latency of data transfer and orbit file generation, it is possible that DPMs could become available within a day after an earthquake.
- FIG. 11 is an exemplary hardware and software environment 1100 used to implement one or more embodiments of the invention.
- the hardware and software environment includes a computer 1102 and may include peripherals.
- Computer 1102 may be a user/client computer, server computer, or may be a database computer.
- the computer 1102 comprises a general purpose hardware processor 1104 A and/or a special purpose hardware processor 1104 B (hereinafter alternatively collectively referred to as processor 1104 ) and a memory 1106 , such as random access memory (RAM).
- processor 1104 a general purpose hardware processor 1104 A and/or a special purpose hardware processor 1104 B (hereinafter alternatively collectively referred to as processor 1104 ) and a memory 1106 , such as random access memory (RAM).
- RAM random access memory
- the computer 1102 may be coupled to, and/or integrated with, other devices, including input/output (I/O) devices such as a keyboard 1114 , a cursor control device 1116 (e.g., a mouse, a pointing device, pen and tablet, touch screen, multi-touch device, etc.) and a printer 1128 .
- I/O input/output
- computer 1102 may be coupled to, or may comprise, a portable or media viewing/listening device 1132 (e.g., an MP3 player, iPodTM, NookTM, portable digital video player, cellular device, personal digital assistant, etc.).
- the computer 1102 may comprise a multi-touch device, mobile phone, gaming system, internet enabled television, television set top box, or other internet enabled device executing on various platforms and operating systems.
- the computer 1102 operates by the general purpose processor 1104 A performing instructions defined by the computer program 1110 under control of an operating system 1108 .
- the computer program 1110 and/or the operating system 1108 may be stored in the memory 1106 and may interface with the user and/or other devices to accept input and commands and, based on such input and commands and the instructions defined by the computer program 1110 and operating system 1108 , to provide output and results.
- Output/results may be presented on the display 1122 or provided to another device for presentation or further processing or action.
- the display 1122 comprises a liquid crystal display (LCD) having a plurality of separately addressable liquid crystals.
- the display 1122 may comprise a light emitting diode (LED) display having clusters of red, green and blue diodes driven together to form full-color pixels.
- Each liquid crystal or pixel of the display 1122 changes to an opaque or translucent state to form a part of the image on the display in response to the data or information generated by the processor 1104 from the application of the instructions of the computer program 1110 and/or operating system 1108 to the input and commands.
- the image may be provided through a graphical user interface (GUI) module 1118 .
- GUI graphical user interface
- the GUI module 1118 is depicted as a separate module, the instructions performing the GUI functions can be resident or distributed in the operating system 1108 , the computer program 1110 , or implemented with special purpose memory and processors.
- the display 1122 is integrated with/into the computer 1102 and comprises a multi-touch device having a touch sensing surface (e.g., track pod or touch screen) with the ability to recognize the presence of two or more points of contact with the surface.
- multi-touch devices include mobile devices (e.g., iPhoneTM, Nexus STM, DroidTM devices, etc.), tablet computers (e.g., iPadTM, HP TouchpadTM), portable/handheld game/music/video player/console devices (e.g., iPod TouchTM, MP3 players, Nintendo 3DSTM, PlayStation PortableTM, etc.), touch tables, and walls (e.g., where an image is projected through acrylic and/or glass, and the image is then backlit with LEDs).
- mobile devices e.g., iPhoneTM, Nexus STM, DroidTM devices, etc.
- tablet computers e.g., iPadTM, HP TouchpadTM
- portable/handheld game/music/video player/console devices e.g., iPod TouchTM, MP3 players, Nintendo 3
- a special purpose processor 1104 B may be implemented in a special purpose processor 1104 B.
- the some or all of the computer program 1110 instructions may be implemented via firmware instructions stored in a read only memory (ROM), a programmable read only memory (PROM) or flash memory within the special purpose processor 1104 B or in memory 1106 .
- the special purpose processor 1104 B may also be hardwired through circuit design to perform some or all of the operations to implement the present invention.
- the special purpose processor 1104 B may be a hybrid processor, which includes dedicated circuitry for performing a subset of functions, and other circuits for performing more general functions such as responding to computer program 1110 instructions.
- the special purpose processor 1104 B is an application specific integrated circuit (ASIC).
- ASIC application specific integrated circuit
- the computer 1102 may also implement a compiler 1112 that allows an application or computer program 1110 written in a programming language such as COBOL, Pascal, C++, FORTRAN, or other language to be translated into processor 1104 readable code.
- the compiler 1112 may be an interpreter that executes instructions/source code directly, translates source code into an intermediate representation that is executed, or that executes stored precompiled code.
- Such source code may be written in a variety of programming languages such as JavaTM, PerlTM, BasicTM, etc.
- the application or computer program 1110 accesses and manipulates data accepted from I/O devices and stored in the memory 1106 of the computer 1102 using the relationships and logic that were generated using the compiler 1112 .
- the computer 1102 also optionally comprises an external communication device such as a modem, satellite link, Ethernet card, or other device for accepting input from, and providing output to, other computers 1102 .
- an external communication device such as a modem, satellite link, Ethernet card, or other device for accepting input from, and providing output to, other computers 1102 .
- Such input may include radar satellite based data, seismometer based data, GPS based data, etc.
- instructions implementing the operating system 1108 , the computer program 1110 , and the compiler 1112 are tangibly embodied in a non-transient computer-readable medium, e.g., data storage device 1120 , which could include one or more fixed or removable data storage devices, such as a zip drive, floppy disc drive 1124 , hard drive, CD-ROM drive, tape drive, etc.
- a non-transient computer-readable medium e.g., data storage device 1120 , which could include one or more fixed or removable data storage devices, such as a zip drive, floppy disc drive 1124 , hard drive, CD-ROM drive, tape drive, etc.
- the operating system 1108 and the computer program 1110 are comprised of computer program instructions which, when accessed, read and executed by the computer 1102 , cause the computer 1102 to perform the steps necessary to implement and/or use the present invention or to load the program of instructions into a memory, thus creating a special purpose data structure causing the computer to operate as a specially programmed computer executing the method steps described herein.
- Computer program 1110 and/or operating instructions may also be tangibly embodied in memory 1106 and/or data communications devices 1130 , thereby making a computer program product or article of manufacture according to the invention.
- the terms “article of manufacture,” “program storage device,” and “computer program product,” as used herein, are intended to encompass a computer program accessible from any computer readable device or media.
- any type of computer such as a mainframe, minicomputer, or personal computer, or computer configuration, such as a timesharing mainframe, local area network, or standalone personal computer, could be used with the present invention.
- embodiments of the invention provide a methodology to produce reliable damage proxy maps of building collapse using InSAR coherence.
- the standard differencing of InSAR coherence requires that two interferometric pairs have almost the same perpendicular and temporal baselines [15].
- Embodiments of the invention relaxed this requirement by introducing a robust histogram matching algorithm, which modifies the histogram of the slave pair coherence, so it becomes statistically identical to the master pair coherence.
- the histogram matching eliminates the bias in coherence difference, which enables the application of a causality constraint, multi-looking of coherence difference maps, and unbiased time series analysis of coherence change.
- InSAR missions may also have shorter repeat cycles, thereby enabling denser time series analysis and more reliable damage proxy maps.
- Higher resolution SAR data and DEMs and airborne capability will produce higher resolution DPMs, and different radar wave frequencies are expected to have different sensitivity. Further, with an understanding and characterization of the temporal behavior of the ground scatterers, better sensitivity and improved robustness may be achieved while minimizing the false alarm rate.
- the methodology is not limited to building damage due to earthquakes. As long as a pre-damage (master) interferometric pair maintains reasonable coherence, the methodology can be applied to any type of natural or anthropogenic damage that causes significant surface property change.
Landscapes
- Engineering & Computer Science (AREA)
- Remote Sensing (AREA)
- Radar, Positioning & Navigation (AREA)
- Physics & Mathematics (AREA)
- Electromagnetism (AREA)
- Computer Networks & Wireless Communication (AREA)
- General Physics & Mathematics (AREA)
- Image Processing (AREA)
Abstract
Description
where c1 and c2 are complex pixel values of two SAR images coregistered, and
γ=γB
where γB's are coherences due to baselines (perpendicular, temporal, and spectral, respectively), γV is due to volume scattering, γK is due to system thermal noise, and γP represents coherence due to processing, such as image focusing, coregistration, and interpolation. Each term takes a value between 0 and 1, and any process that decreases the coherence is called decorrelation, defined as 1−γX, where X is Bp, Bt, Bf, V, K, or P [23].
where the superscript 0 represents the time span of the master pair before damage and the superscript 1 is for the slave pair spanning the damage. We define 1−γD 1 as the decorrelation due to building damage. Note that Δγ contains the damage-induced decorrelation scaled by the original coherence (the first term) and the background coherence difference scaled by the damage-induced coherence (second term). Since Δγ=γ0−γ1 for undamaged areas (γD 1=1)), the background coherence difference should be minimized in order to maximize the isolation of the damage-induced decorrelation.
-
- For a continuous random variable X, Y=FX(X) is another continuous random variable that has a uniform distribution in [0, 1]. In this regard, let a random variable X follow a cdf F(x), where F (x) is continuous and increasing, and define Y=F (X). To find the cdf of Y:
-
-
- Thus, the random variable Y has a uniform distribution in [0,1], since,
-
-
- If a random variable Y has a uniform distribution in [0, 1], then Z=Fz −1(Y) has a pdf of pz(z).
Claims (16)
Priority Applications (1)
| Application Number | Priority Date | Filing Date | Title |
|---|---|---|---|
| US13/528,610 US9207318B2 (en) | 2011-06-20 | 2012-06-20 | Damage proxy map from interferometric synthetic aperture radar coherence |
Applications Claiming Priority (2)
| Application Number | Priority Date | Filing Date | Title |
|---|---|---|---|
| US201161498755P | 2011-06-20 | 2011-06-20 | |
| US13/528,610 US9207318B2 (en) | 2011-06-20 | 2012-06-20 | Damage proxy map from interferometric synthetic aperture radar coherence |
Publications (2)
| Publication Number | Publication Date |
|---|---|
| US20120319893A1 US20120319893A1 (en) | 2012-12-20 |
| US9207318B2 true US9207318B2 (en) | 2015-12-08 |
Family
ID=47353270
Family Applications (1)
| Application Number | Title | Priority Date | Filing Date |
|---|---|---|---|
| US13/528,610 Active 2033-11-10 US9207318B2 (en) | 2011-06-20 | 2012-06-20 | Damage proxy map from interferometric synthetic aperture radar coherence |
Country Status (1)
| Country | Link |
|---|---|
| US (1) | US9207318B2 (en) |
Families Citing this family (29)
| Publication number | Priority date | Publication date | Assignee | Title |
|---|---|---|---|---|
| US8917199B2 (en) * | 2011-04-13 | 2014-12-23 | Raytheon Company | Subterranean image generating device and associated method |
| ITTO20110526A1 (en) * | 2011-06-15 | 2012-12-16 | Thales Alenia Space Italia S P A C On Unico Socio | ACQUISITION OF IMAGES TO CALCULATE A ALTITUDE OR A DIGITAL ELEVATION MODEL VIA INTERFEROMETRIC PROCESSING |
| US10002339B2 (en) * | 2013-07-11 | 2018-06-19 | Fluor Technologies Corporation | Post-disaster assessment systems and methods |
| US10145972B2 (en) | 2014-08-15 | 2018-12-04 | California Institute Of Technology | Systems and methods for advanced rapid imaging and analysis for earthquakes |
| US10535127B1 (en) * | 2017-01-11 | 2020-01-14 | National Technology & Engineering Solutions Of Sandia, Llc | Apparatus, system and method for highlighting anomalous change in multi-pass synthetic aperture radar imagery |
| US10698104B1 (en) * | 2018-03-27 | 2020-06-30 | National Technology & Engineering Solutions Of Sandia, Llc | Apparatus, system and method for highlighting activity-induced change in multi-pass synthetic aperture radar imagery |
| JP7006781B2 (en) * | 2018-05-16 | 2022-01-24 | 日本電気株式会社 | Synthetic Aperture Radar Signal Analysis Device, Synthetic Aperture Radar Signal Analysis Method and Synthetic Aperture Radar Signal Analysis Program |
| CN109444879A (en) * | 2018-10-19 | 2019-03-08 | 西南交通大学 | A kind of nearly tomography coseismic deformation extracting method of DInSAR |
| CN110146885B (en) * | 2019-05-17 | 2022-04-05 | 华东师范大学 | New-terrestrial-region ultra-long deformation time sequence extraction method based on multi-satellite-platform MT-InSAR fusion |
| CN110058236B (en) * | 2019-05-21 | 2023-04-07 | 中南大学 | InSAR and GNSS weighting method oriented to three-dimensional surface deformation estimation |
| JP7335733B2 (en) * | 2019-07-01 | 2023-08-30 | 国際航業株式会社 | Building damage estimation system |
| CN110333508B (en) * | 2019-07-19 | 2021-02-19 | 中南大学 | Joint inversion method of post-coseismic spatiotemporal slip distribution based on multi-source SAR data |
| CN111191628B (en) * | 2020-01-06 | 2021-01-26 | 河海大学 | Remote sensing image earthquake damage building identification method based on decision tree and feature optimization |
| US20220411109A1 (en) * | 2020-03-25 | 2022-12-29 | Nec Corporation | Information processing device, information processing method, and computer-readablestorage medium |
| CN111626269B (en) * | 2020-07-07 | 2021-08-27 | 中国科学院空天信息创新研究院 | Practical large-space-range landslide extraction method |
| CN112711022B (en) * | 2020-12-18 | 2022-08-30 | 中国矿业大学 | GNSS chromatography-assisted InSAR (interferometric synthetic aperture radar) atmospheric delay correction method |
| JP7556411B2 (en) * | 2021-01-06 | 2024-09-26 | 日本電気株式会社 | Information processing device, information processing method, and program |
| CN113095130A (en) * | 2021-03-02 | 2021-07-09 | 广东电网有限责任公司广州供电局 | Radar coherence prediction method and device |
| US11477631B2 (en) * | 2021-03-16 | 2022-10-18 | Omidreza Ghanadiof | Earthquake damage warning system |
| CN113780422B (en) * | 2021-09-13 | 2023-06-27 | 北京环境特性研究所 | Background clutter similarity evaluation method and device |
| US20240201701A1 (en) * | 2021-09-24 | 2024-06-20 | Aloft Sensing, Inc. | System and method of relative navigation in a network of mobile vehicles |
| US11933883B2 (en) * | 2021-09-24 | 2024-03-19 | Aloft Sensing, Inc. | System and method for self-contained high-precision navigation |
| CN115079301A (en) * | 2022-07-21 | 2022-09-20 | 中铁工程设计咨询集团有限公司 | Remote sensing interpretation method for potential landslide |
| CN116168065B (en) * | 2022-12-08 | 2025-06-10 | 西安电子科技大学 | Heterogeneous image registration method and device based on feature joint driving |
| WO2024150737A1 (en) * | 2023-01-10 | 2024-07-18 | 日本電気株式会社 | Signal processing device, signal processing method, and recording medium |
| CN117437508B (en) * | 2023-11-10 | 2024-06-18 | 东南大学 | InSAR-based building group post-earthquake damage assessment method and system |
| CN117975277B (en) * | 2024-02-28 | 2025-09-26 | 长安大学 | Method, device, equipment and storage medium for identifying earthquake-damaged buildings |
| CN118089611B (en) * | 2024-04-17 | 2024-08-30 | 东南大学 | A three-dimensional displacement monitoring method and system for buildings integrating InSAR data and physical knowledge |
| CN118570585B (en) * | 2024-06-13 | 2025-02-07 | 临沂大学 | Intelligent Generation Method of SAR Target Data by Fusion of Geometric Information |
Citations (1)
| Publication number | Priority date | Publication date | Assignee | Title |
|---|---|---|---|---|
| US20050025357A1 (en) * | 2003-06-13 | 2005-02-03 | Landwehr Val R. | Method and system for detecting and classifying objects in images, such as insects and other arthropods |
-
2012
- 2012-06-20 US US13/528,610 patent/US9207318B2/en active Active
Patent Citations (1)
| Publication number | Priority date | Publication date | Assignee | Title |
|---|---|---|---|---|
| US20050025357A1 (en) * | 2003-06-13 | 2005-02-03 | Landwehr Val R. | Method and system for detecting and classifying objects in images, such as insects and other arthropods |
Non-Patent Citations (15)
| Title |
|---|
| Auer et al., "Ray-Tracing Simulation Techniques for Understanding High-Resolution SAR Images". IEEE Transactions on Geoscience and Remote Sensing, vol. 48, No. 3, Mar. 2010, pp. 1445-1456. |
| Booth et al., "Validating assessments of seismic damage made from remote sensing". Earthquake Spectra, vol. 27, No. S1, Oct. 2011, pp. S157-S177. |
| Brunner et at., "Earthquake Damage Assessment of Buildings Using VHR Optical and SAR Imagery," IEEE Transactions on Geoscience and Remote Sensing, vol. 48, No. 5, May 2010, pp. 2403-2420. |
| Coltuc et al., "Exact histogram specification." IEEE transactions on image processing, vol. 15, No. 5, May 2006, pp. 1143-1152. |
| Corbane, "A comprehensive analysis of building damage in the Jan. 12, 2010 Mw 7 Haiti earthquake using high-resolution satellite and aerial imagery," Photogrammetric Engineering and Remote Sensing, vol. 77, No. 10, 2011, pp. 997-1009. |
| Dell'acqua et al., "Earthquake damages rapid mapping by satellite remote sensing data: L'aquila Apr. 6, 2009 event". IEEE Journal of Selected Topics in Applied Earth Observation and Remote Sensing, vol. 4, No. 4, Dec. 2011, pp. 935-943. |
| Dietterich et al., "Tracking lava flow emplacement on the east rift zone of Kilauea, Hawaii, with synthetic aperture radar coherence". Geochemistry, Geophysics, Geosystems, vol. 13, No. 5, May 2012, pp. 1-17. |
| Fielding et al., "Surface ruptures and building damage of the 2003 Bam, Iran, earthquake mapped by satellite synthetic aperture radar interferometric correlation," Journal of Geophysical Research, vol. 110, 2005, No. B03302, pp. 1-15. |
| Ghosh et al., "Crowdsourcing for rapid damage assessment: The global earth observation catastrophe assessment network (GEO-CAN)". Earthquake Spectra, vol. 27, No. S1, Oct. 2011, pp. S179-S198. |
| Guida et al., "Model-based interpretation of high-resolution SAR images of buildings". IEEE Journal of Selected Topics in Applied Earth Observation and Remote Sensing, vol. 1, No. 2, Jun. 2008, pp. 107-119. |
| Hoffmann, "Mapping damage during the Bam (Iran ) earthquake us-ing interferometric coherence". International Journal of Remote Sensing, vol. 28, No. 6, 2007, pp. 1199-1216. |
| Kerle, "Remote sensing based post-disaster damage mapping-ready for a collaborative approach?" IECO/IEEE-Earthzine, Mar. 23, 2011, URL: http://www.earthzine.org/2011/03/23/remote-sensing-basedpost-disaster-damage-mapping-%E2%80%93-ready-for-acollaborative-approach. |
| Simons et al., "Coseismic deformation from the 1999 mw 7.1 hector mine, California, earthquake as inferred from INSAR and GPS observations". Bulletin of the Seismological Society of America, vol. 92, No. 4, May 2002, pp. 1390-1402. |
| Zebker et al., "Analysis of active lava flows on Kilauea volcano, Hawaii, using SIR-C radar correlation measurements," Geology, vol. 24, No. 6, 1996, pp. 495-498. |
| Zebker et al., "Decorrelation in Interferometric Radar Echoes," IEEE Transactions on Geoscience and Remote Sensing, vol. 30, No. 5, Sep. 1992, pp. 950-959. |
Also Published As
| Publication number | Publication date |
|---|---|
| US20120319893A1 (en) | 2012-12-20 |
Similar Documents
| Publication | Publication Date | Title |
|---|---|---|
| US9207318B2 (en) | Damage proxy map from interferometric synthetic aperture radar coherence | |
| Bekaert et al. | InSAR-based detection method for mapping and monitoring slow-moving landslides in remote regions with steep and mountainous terrain: An application to Nepal | |
| Fielding et al. | Surface ruptures and building damage of the 2003 Bam, Iran, earthquake mapped by satellite synthetic aperture radar interferometric correlation | |
| CN101501524B (en) | Disaster countermeasure support method | |
| Raucoules et al. | Use of SAR interferometry for detecting and assessing ground subsidence | |
| Stevens et al. | NASA EOS Terra ASTER: Volcanic topographic mapping and capability | |
| Song et al. | Landslide geometry and activity in Villa de la Independencia (Bolivia) revealed by InSAR and seismic noise measurements | |
| Vassileva et al. | Satellite SAR interferometric techniques in support to emergency mapping | |
| Fiaschi et al. | Testing the potential of Sentinel-1A TOPS interferometry for the detection and monitoring of landslides at local scale (Veneto Region, Italy) | |
| Mizuochi et al. | Detection of long-term slope displacement using time-series DInSAR and geological factor analysis for susceptibility assessment of landslides in northwestern Kyushu Island | |
| Yun et al. | Damage proxy map from interferometric synthetic aperture radar coherence | |
| Pan et al. | Damage information derived from multi-sensor data of the Wenchuan Earthquake of May 2008 | |
| Nofl et al. | Mapping surface displacements after the 6 February 2023 earthquake in Syria and Turkey using DInSAR and GIS techniques | |
| Ernst et al. | Advances in the remote sensing of volcanic activity and hazards, with special consideration to applications in developing countries | |
| Navalgund et al. | The science behind archaeological signatures from space | |
| Nikolakopoulos et al. | Emergency response to landslide using GNSS measurements and UAV | |
| Palmann et al. | Earth observation using radar data: an overview of applications and challenges | |
| Li et al. | Comparison of different atmospheric phase screen correction models in ground-based radar interferometry for landslide and open-pit mine monitoring | |
| Wilkinson et al. | How can new technologies help us with earthquake reconnaissance? | |
| Mahmoud | Monitoring Sand Dune Movement using Remote Sensing | |
| Byrraju | Landslide Detection Using Remote Sensing Methods A Review of Current Techniques | |
| Bisenic | A Scenario Based Fire Susceptibility Approach for Remote Sensing Platform Comparison: Los Angeles County Area, Southern California, USA | |
| Wang et al. | Deformation monitoring and evaluation of unstable slope based on ground-based and spaceborne SAR images | |
| Baghermanesh | SAR-based flood detection in urban areas | |
| 葛平兰 | GIS-based Susceptibility Analysis and SAR-based Detection for the Landslides Triggered in 2018 Hokkaido Eastern Iburi Earthquake |
Legal Events
| Date | Code | Title | Description |
|---|---|---|---|
| AS | Assignment |
Owner name: CALIFORNIA INSTITUTE OF TECHNOLOGY, CALIFORNIA Free format text: ASSIGNMENT OF ASSIGNORS INTEREST;ASSIGNORS:YUN, SANG-HO;FIELDING, ERIC J.;WEBB, FRANK H.;AND OTHERS;SIGNING DATES FROM 20120719 TO 20120815;REEL/FRAME:028838/0069 |
|
| FEPP | Fee payment procedure |
Free format text: PAYOR NUMBER ASSIGNED (ORIGINAL EVENT CODE: ASPN); ENTITY STATUS OF PATENT OWNER: SMALL ENTITY |
|
| STCF | Information on status: patent grant |
Free format text: PATENTED CASE |
|
| MAFP | Maintenance fee payment |
Free format text: PAYMENT OF MAINTENANCE FEE, 4TH YR, SMALL ENTITY (ORIGINAL EVENT CODE: M2551); ENTITY STATUS OF PATENT OWNER: SMALL ENTITY Year of fee payment: 4 |
|
| MAFP | Maintenance fee payment |
Free format text: PAYMENT OF MAINTENANCE FEE, 8TH YR, SMALL ENTITY (ORIGINAL EVENT CODE: M2552); ENTITY STATUS OF PATENT OWNER: SMALL ENTITY Year of fee payment: 8 |