US9047503B2 - System and method for automated biological cell assay data analysis - Google Patents
System and method for automated biological cell assay data analysis Download PDFInfo
- Publication number
- US9047503B2 US9047503B2 US13/811,399 US201113811399A US9047503B2 US 9047503 B2 US9047503 B2 US 9047503B2 US 201113811399 A US201113811399 A US 201113811399A US 9047503 B2 US9047503 B2 US 9047503B2
- Authority
- US
- United States
- Prior art keywords
- response
- images
- actual
- phenotypes
- cell
- Prior art date
- Legal status (The legal status is an assumption and is not a legal conclusion. Google has not performed a legal analysis and makes no representation as to the accuracy of the status listed.)
- Active, expires
Links
Images


Classifications
-
- G—PHYSICS
- G16—INFORMATION AND COMMUNICATION TECHNOLOGY [ICT] SPECIALLY ADAPTED FOR SPECIFIC APPLICATION FIELDS
- G16B—BIOINFORMATICS, i.e. INFORMATION AND COMMUNICATION TECHNOLOGY [ICT] SPECIALLY ADAPTED FOR GENETIC OR PROTEIN-RELATED DATA PROCESSING IN COMPUTATIONAL MOLECULAR BIOLOGY
- G16B20/00—ICT specially adapted for functional genomics or proteomics, e.g. genotype-phenotype associations
- G16B20/10—Ploidy or copy number detection
-
- G—PHYSICS
- G06—COMPUTING OR CALCULATING; COUNTING
- G06V—IMAGE OR VIDEO RECOGNITION OR UNDERSTANDING
- G06V20/00—Scenes; Scene-specific elements
- G06V20/60—Type of objects
- G06V20/69—Microscopic objects, e.g. biological cells or cellular parts
- G06V20/698—Matching; Classification
-
- G06K9/00147—
-
- G—PHYSICS
- G06—COMPUTING OR CALCULATING; COUNTING
- G06T—IMAGE DATA PROCESSING OR GENERATION, IN GENERAL
- G06T7/00—Image analysis
- G06T7/0002—Inspection of images, e.g. flaw detection
- G06T7/0012—Biomedical image inspection
- G06T7/0014—Biomedical image inspection using an image reference approach
-
- G—PHYSICS
- G16—INFORMATION AND COMMUNICATION TECHNOLOGY [ICT] SPECIALLY ADAPTED FOR SPECIFIC APPLICATION FIELDS
- G16B—BIOINFORMATICS, i.e. INFORMATION AND COMMUNICATION TECHNOLOGY [ICT] SPECIALLY ADAPTED FOR GENETIC OR PROTEIN-RELATED DATA PROCESSING IN COMPUTATIONAL MOLECULAR BIOLOGY
- G16B25/00—ICT specially adapted for hybridisation; ICT specially adapted for gene or protein expression
-
- G06F19/18—
-
- G06F19/20—
-
- G—PHYSICS
- G06—COMPUTING OR CALCULATING; COUNTING
- G06T—IMAGE DATA PROCESSING OR GENERATION, IN GENERAL
- G06T2207/00—Indexing scheme for image analysis or image enhancement
- G06T2207/30—Subject of image; Context of image processing
- G06T2207/30004—Biomedical image processing
- G06T2207/30024—Cell structures in vitro; Tissue sections in vitro
-
- G—PHYSICS
- G16—INFORMATION AND COMMUNICATION TECHNOLOGY [ICT] SPECIALLY ADAPTED FOR SPECIFIC APPLICATION FIELDS
- G16B—BIOINFORMATICS, i.e. INFORMATION AND COMMUNICATION TECHNOLOGY [ICT] SPECIALLY ADAPTED FOR GENETIC OR PROTEIN-RELATED DATA PROCESSING IN COMPUTATIONAL MOLECULAR BIOLOGY
- G16B20/00—ICT specially adapted for functional genomics or proteomics, e.g. genotype-phenotype associations
Definitions
- the present invention relates generally to a system and method for automated biological cellular assay data analysis.
- various methods may be used to apply curve fitting to fit measured cell phenotype data to a mathematical model or expression in order to try and obtain parameters indicative of cellular response to various stimuli to aid in drug discovery [1].
- Various other methods use comparisons of real and modelled image data in an attempt to quantify various biological phenotypes, such as spatiotemporal evolution of a given biological or physiological system [2, 3].
- a system for automated cellular assay data analysis comprising a virtual assay module (VAM) that is operable to generate simulated images of cell responses to one or more stimuli.
- VAM virtual assay module
- the system also comprises a comparator module that operable to compare the actual and simulated images, and an analysis module that is operable to quantify the differences between phenotypes represented by the actual and simulated images.
- a method for automated biological cell assay data analysis comprises acquiring one or more actual cell images, creating one or more virtual assay model images, comparing at least one of the actual cell images to at least one of the virtual assay model images, and quantifying any differences identified by comparing actual and virtual assay model images to provide at least one difference parameter.
- Various aspects and embodiments of present invention may account for stochastic variations in the response of single cells, to provide additional useful information relating to, for example, toxological effects and/or for use as part of a feedback mechanism to refine dynamically a virtual assay model such that it is not limited by way of there being only inadequate static fitting expressions available.
- FIG. 1 shows a system for automated cellular assay data analysis in accordance with an embodiment of the present invention
- FIG. 2 shows a flowchart depicting a method in accordance with various embodiments of the present invention
- FIG. 3 shows a virtual assay model image in accordance with an embodiment of the present invention
- FIG. 4 shows a further technique for analysing differences between phenotypes represented by actual and simulated images in accordance with an embodiment of the present invention
- FIG. 5 shows the dynamics of a single cell toxicological response
- FIG. 6 shows the dynamics of various single cell transient responses
- FIG. 7 shows first and second graphs showing how first and second field-of-view (FOV) averaged time-dependent assay responses are built-up;
- FOV field-of-view
- FIG. 8 shows first and second graphs showing various modelled field-of-view (FOV) averaged time-dependent assay distribution responses
- FIG. 9 shows the distribution of the FOV response at various time points
- FIG. 10 shows a graph illustrating conventional direct analysis of a time-dependent response by fitting
- FIG. 11 shows an experimental raw TOTO-3 response
- FIG. 12 shows the response of FIG. 11 with fitted data curves
- FIG. 13 shows an experimental TOTO-3 concentration response
- FIG. 14 shows a raw time-dependent TMRM response
- FIG. 15 shows the response of FIG. 14 with fitted data curves
- FIGS. 16 and 17 show concentration dependencies for the TMRM responses for two values of drug concentration.
- FIG. 1 shows a system 100 for automated cellular assay data analysis in accordance with an embodiment of the present invention.
- Cellular assay data analysis may, for example, be used for toxicological screening of pharmacological compounds by quantifying one or more phenotypes, such as cytoplasmatic membrane integrity, seen in images of treated cells.
- the system 100 may also be used, for example, for automated high-content screening (HCS) and/or high-throughput screening (HTS).
- HCS high-content screening
- HTS high-throughput screening
- the system 100 which is illustrated schematically for clarity, comprises a light source 102 for producing light 120 a .
- the light 120 a is focussed by a condenser 104 onto a test plate 108 .
- the test plate 108 may contain an array of wells or spots 109 to be imaged.
- the condenser 104 can focus the light 120 b in a focal plane at the test plate 108 .
- the test plate 108 may be provided as a consumable product, and the spots 109 might contain various materials that are able to interact with certain types of cells (e.g. mammalian cells).
- the test plate 108 may comprise at least one fiducial marker (not shown) provided to aid in aligning the test plate 108 within the system 100 .
- one or more coloured dyes may be provided within the spots 109 .
- Such coloured dyes can be identified by various imaging systems in order to derive data relating to the relative positioning of the test plate 108 within the system 100 .
- the system 100 may include a GE IN-Cell Analyzer 1000 that is commercially available from GE Healthcare Life Sciences, Little Chalfont, Buckinghamshire, U.K., and which can use four colour channels to image the test plate 108 .
- One colour channel may thus be dedicated to imaging coloured fiducial markers provided in various of the spots 109 in order to obtain data relating to the positioning of the test plate 108 within the system 100 .
- the system 100 also contains a detector system 112 and a translation mechanism (not shown).
- the translation mechanism is configured to move the focus of the light 120 b relative to the test plate 108 (e.g. by moving the test plate 108 in the x-y plane). This enables a plurality of actual images to be acquired from respective of the individual spots 109 .
- the translation mechanism may also be operable to move the test plate 108 in the z-direction shown in FIG. 1 , for example, in order to bring the spots 109 into focus.
- only one spot is imaged at a time.
- the images acquired are of sufficient magnification to resolve cells and sub-cellular morphology.
- this may entail use of a 20 ⁇ objective, the field of view of which is slightly smaller than a single spot.
- various methods of the invention would also work for lower power magnification imaging, e.g. on GE IN-Cell Analyzer 1000 using a 4 ⁇ objective to image 4-6 spots/image.
- An aperture stop 106 is optionally provided between the light source 102 and the detector system 112 , the size of which may be variable. For example, various differently sized movable apertures may be rotated into position or a continuously variable iris-type diaphragm may be provided. Image contrast can be controlled by changing the aperture setting of the aperture stop 106 .
- Focussed light 120 b passing through the aperture stop 106 passes through the sample test plate 108 in a transmission imaging mode.
- Emergent light 120 c modulated with image information relating to material adjacent to an individual spot 109 is collected by an objective lens 110 and focussed 120 d onto the detector system 112 , and is used to form an original image for that spot 109 .
- Various embodiments of methods of the present invention are independent of the imaging modality used, e.g. they can operate with transmission or reflection geometry.
- imaging an epi-fluorescence mode may be used, with both the fiducial marker spots and the assay signals from the cells being imaged at different excitation and emission wavelengths.
- the detector system 112 is operable to acquire a plurality of images from the test plate 108 .
- images may be obtained each representing different spots 109 or of the same spot 109 at different points in time. Differences between neighbouring spots 109 or temporal changes occurring within the same spot 109 can thus be analysed.
- the detector system 112 is also operably coupled to a processor 114 that in turn is operable to process the images. Analysis of the images may be used to provide for toxicological screening. Of course, such images may be generated by the system 100 itself or might be provided from storage and/or transmitted to the processor 114 from a remote location (not shown).
- the processor 114 is configured to provide a virtual assay module (VAM) 115 for generating simulated images of cell responses to various agents, a comparator module 116 for comparing the actual and simulated images, and an analysis module 117 for quantifying the differences between the actual and simulated images and adjusting the VAM in accordance with any such quantified differences.
- VAM virtual assay module
- the analysis module 117 is further operable to provide feedback to adjust the VAM 115 in accordance with the quantified differences such that the phenotypes of the actual and simulated images converge, and to quantify temporally the differences between the phenotypes represented by the actual and simulated images.
- This permits the analysis module 117 to determine a response or time-dependent cell/multi-cell reaction to application of a stimulus (such as, for example, a drug treatment etc.).
- a stimulus such as, for example, a drug treatment etc.
- a stimulus such as, for example, a drug treatment etc.
- the analysis module 117 is further operable to apply stochastical fitting to quantify one or more response properties of at least one single cell's response to the application of one or more stimuli. This further enables the analysis module 117 to quantify a multi-cellular system's heterogeneity during the response using a heterogeneity measurement parameter.
- FIG. 1 can be used to provide phenomenological response fitting for a high-throughput screening (HTS) analysis.
- the phenotypes are toxological phenotypes and the quantified differences are indicative of stimuli toxicity.
- HTS may be used to automatically analyse the actual images to quantify the amounts and/or types of cell membrane disruptions, micronuclei, etc., in order to indicate the relative toxicity of a candidate drug stimulus. Rapid and accurate automated HTS can thereby be provided to identify target non-toxic drug compounds warranting further scientific investigation.
- the processor 114 can be configured to control the translation mechanism (not shown) to move the focal position of the light source 102 relative to the spot plate 108 .
- the processor 114 may, for example, be provided as part of a conventional computer system appropriately programmed to implement one or more of the VAM module 115 , the comparator module 116 and the analysis module 117 , or may be provided by a digital signal processor (DSP), dedicated application specific integrated circuit (ASIC), appropriately configured firmware, etc.
- DSP digital signal processor
- ASIC dedicated application specific integrated circuit
- various embodiments of the invention may be used to automatically screen cells, for example, in order to detect and quantify specific events that are indicative of drug toxicity.
- Such improved automated screening can thereby reduce the need to test various compounds on human or animal models by identifying only those candidates having the lowest amount of toxicity specific phenotypes.
- system 100 as described above may be used to implement the following method that is described below in connection with FIG. 2 .
- FIG. 2 shows a flowchart depicting a method 200 that may be used in accordance with various embodiments of the present invention.
- the method 200 is for automated biological cell assay data analysis, and various more detailed examples are described below for illustrative purposes in connection with toxicology analysis.
- the method 200 comprises acquiring one or more actual cell images.
- the actual cell images may be acquired using, for example, a HTS or may include one or more stored images previously acquired locally and/or remotely.
- actual cell images can be generated at remote locations and transmitted to a central image processing facility, possibly via the Internet using a secured data link or virtual private network (VPN).
- VPN virtual private network
- the method 200 comprises creating one or more virtual assay model images.
- the virtual assay model images can be created using a stochastic model, i.e. a model that simulates a stochastic process whose behaviour is non-deterministic in that a next system state is determined both by the process's predictable events and by a random element.
- Various embodiments apply stochastic simulation techniques to the analysis of time-dependent responses in cellular assays.
- cellular assays can be treated as a statistical ensemble composed of many random dynamic cellular events.
- the preferred method uses a procedure of stochastically driven fitting for estimating the properties of a single cell's response, as well as assessing a cellular system's heterogeneity during the response.
- the assay response of a single cell is described in various terms such as time (duration), amplitude (extent) responses, and the distribution of the response starting times (e.g. the centre and margins of the distribution).
- time duration
- amplitude extent
- distribution of the response starting times e.g. the centre and margins of the distribution.
- the advantage of the temporal description is that it makes responses registered by different measurement tools (e.g. different fluorescent markers) immediately comparable, thereby allowing an interpretation of causality (e.g. for early/late reactions indicating the preceding and subsequent cellular processes).
- stochastic techniques are not used, such a method can be reduced to the fitting of a response to a phenomenological time-dependent expression.
- the method 200 comprises comparing at least one of the actual cell images to at least one of the virtual assay model images.
- Various techniques may be used, such as for example least squares fitting, entropy based techniques, etc. [2, 4].
- the method 200 comprises quantifying any differences identified by comparing ( 206 ) actual and virtual assay model images to provide at least one difference parameter.
- the difference parameter may, for example, correspond to the minimum value obtained when performing a least squares fit, entropy optimisation, etc. [2, 4] and can be used temporally quantify the differences between the phenotypes represented by the actual and virtual assay model images, for example, in single cells and/or for responses generated by collections of such cells (e.g. as quantified by a heterogeneity measurement parameter).
- the virtual image model can be modified in dependence thereon and an new set of one or more virtual assay model images recreated said using the modified virtual image model.
- This enables the method 200 to iteratively provide feedback to adjust the virtual assay model so as to minimise the values of the difference parameter in order that the phenotypes of the actual and virtual assay model images converge.
- a virtual assay can be provided that uses stochastic simulation and phenomenological response fitting suitable for HTS analyses.
- Various embodiments of the method 200 may be implemented in one or more of hardware, software and firmware.
- a system of the type described above in connection with FIG. 1 may be used, or software upgraded, for such a purpose.
- the method enables the provision of a quantitative software package that can combine one or more of the following functions: a) a dynamic description of a single cell transient response including its modelling and representation; b) stochastic simulations; and c) fitting and parameter estimation.
- a software package enables the generation of a flexible model of assay response and the comparison of simulated and measured data.
- the proposed technique may also be used without data fitting, to generate a “virtual assay” i.e. a simulation describing a cellular response.
- Such simulations might be arranged according to a hypothetical mechanism describing the action of any potential stimulus and thereby used to predict various complex system responses.
- TMRM mitochondrial marker
- the toxicity assays used well plate bio-microscopy imaging to obtain actual cell images, using fluorescent markers and a GE IN-Cell Analyzer instrument, with FOV related data.
- a characteristic duration ⁇ of the response can be an indicator of a mechanism or sub-mechanism sensed by a particular marker (e.g. fluorescent in this case).
- a particular marker e.g. fluorescent in this case.
- FIG. 3 shows a virtual assay model image 300 produced in accordance with an embodiment of the present invention.
- the virtual assay model image 300 shows an example of a toxicological response for cells stained with TMRM.
- Live cells are characterised by a punctuate, vesicular-type, distribution of TMRM whilst dead cells, compromised cells or drug treated cells may show a uniform distribution of TMRM in the cytoplasm.
- the virtual assay model image 300 thus shows a mixed distribution which is a combination of a vesicular image 302 (representing mitochondria) and a non-vesicular image 304 showing the uniform distribution of TMRM in the cytoplasm.
- V es The total intensity if the TMRM signal in the vesicular image 302 , V es is defined as:
- V es ⁇ vesicles ⁇ I ⁇ d s Equation ⁇ ⁇ 1
- I represents a pixel intensity value and ds spatial position of pixels in the image.
- V cytoplasm The total intensity if the TMRM signal in the non-vesicular image 304 , V cytoplasm is defined as:
- V cytoplasm ⁇ VAM ⁇ ⁇ image - vesicles ⁇ I ⁇ d s Equation ⁇ ⁇ 2
- V es_ratio ⁇ V es V es + V cytoplasm V es V VAM ⁇ ⁇ image Equation ⁇ ⁇ 3
- This relative intensity ratio V es — ratio is a useful parameter, in which any image proportionality factors applied are substantially cancelled out, and which can be used to measure the relative degree of mitosis in the VAM image 300 , thus: “dead” 0 ⁇ V es — ratio ⁇ 1 “alive” Equation 4
- a toxicological signature response can be built up by producing a V es —ratio histogram 306 .
- V es ratio histogram 306
- phenotypes may be toxological phenotypes and the quantified differences indicative of stimuli toxicity (e.g. cell membrane disruptions, presence of micronuclei, etc.).
- FIG. 4 shows a further technique for analysing differences between phenotypes represented by actual and simulated images. This technique applies a so-called “parent methodology” in which analysis is undertaken in terms of non-dynamic stochastic cellular events.
- Nuclear fluorescent images 400 , 402 are analysed by comparison to modelled data.
- Actual image 400 shows an image of diploid cells exhibiting a typical G1 S G2/M distribution, and actual image 402 an altered distribution characteristic of induced polyploidy. Both images were obtained using high throughput high content screening.
- J ⁇ nucleus ⁇ ⁇ Intensity ⁇ N fluorescent ⁇ ⁇ moleclues ⁇ a Equation ⁇ ⁇ 5
- J J 0 ⁇ a ⁇ ⁇ ( 1 + ⁇ ) , ⁇ ⁇ G ⁇ ( 0 , ⁇ ⁇ ) Equation ⁇ ⁇ 6
- ⁇ being determined from a measurement model.
- Graph 404 shows the modelled DNA content distribution having applied a two-thousand cell simulation at each fitting iteration.
- graph 406 shows the analogous case for polyploids.
- J integrated nuclear fluorescence
- FIG. 5 shows the dynamics of a single cell toxicological response response 1 in graph 500 .
- the toxicological response is transient and shows cell death.
- the transient response starts at time t 0 , lasts for a duration ⁇ and has an amplitude equal to B ⁇ A.
- the dynamic response can be defined as:
- FIG. 6 shows a graph 600 illustrating the dynamics of various possible single cell transient responses that can be modelled.
- the response is defined as per Equation 9, above.
- the response is defined as:
- the response is defined as:
- the response is defined as:
- the response is defined as:
- the response is defined as:
- analytical expressions involving some four to six parameters defining a single cell response such as start time, duration, amplitude and shape can all be adjusted to obtain a best analytical fit.
- the response, or responses can be made time-dependent for one or more cells, multi-cell, inter-cellular reactions, etc. to a stimulus (such as a drug treatment etc.).
- Such a temporal description thereby enables responses produced by different techniques (e.g. using different fluorescent markers, or even different image modalities) to be made directly comparable, hence allowing an interpretation of causality to be obtained.
- FIG. 7 shows first and second graphs 700 , 720 showing how first and second field-of-view (FOY) averaged time-dependent assay responses 712 , 732 are built-up.
- FOY field-of-view
- the responses 712 , 732 are generated on the assumption that the main variability in toxicological response is due to the t 0 distribution.
- the respective FOV-averaged time dependent responses FOV_response(t) are modelled with the help of response 1 (t) functions using differing time shifts, thus:
- the first FOV response 712 is built up from time shifted response 1 (t) functions 702 , 704 , 706 , 708 and 710 .
- the second FOV response 732 is built up from time shifted response 1 (t) functions 722 , 724 , 726 , 728 and 730 .
- FIG. 8 shows first and second graphs 800 , 810 showing modelled field-of-view (FOV) averaged time-dependent assay distribution responses 802 , 804 , 812 , 814 .
- FOV field-of-view
- the distribution responses 802 , 804 , 812 , 814 derive from a t 0 distribution.
- the t 0 distribution may, for example, be uniform (i.e. a box distribution) or Gaussian in nature.
- the modelling technique may thus be akin to a stochastic simulation.
- the second graph 810 shows a ⁇ /3 distribution response 812 and a ⁇ distribution response 814 .
- a stochastic fitting procedure can thus be applied for estimating:
- the shape of the response can be determined by studying individual cell response records, e.g. by using a cell tracking algorithm.
- FIG. 9 shows the distribution of the FOV response at various time points. The response distribution depends upon the mentioned parameters and the number of responding cells N cells imaged in the field-of-view.
- the response 1 (t) function had an exponential rising shape and the t 0 distribution is uniform (i.e. box shaped).
- FIG. 10 shows a graph 1000 illustrating conventional direct analysis of a time-dependent response by fitting.
- Raw data 1002 is fit mathematically to the curve 1004 .
- the first example analyzed the cytoplasmatic membrane integrity, as indicated by the TOTO-3 marker.
- TOTO-3 stains cell nuclei only after cell plasma membrane disruption.
- the response 1 (t) generated by disruption to the membrane is therefore a curve representing the increase of cell nuclei intensity in TOTO-3 channel. This intensity was measured by a microscopy HTS system. However, the exact moment when a particular membrane became disrupted was unpredictable.
- the analysis therefore used stochastic fitting involving a single time parameter (the width of the box-shaped distribution of starting times of the response).
- FIG. 11 represents the raw TOTO-3 response.
- the TOTO-3 response was taken for two values of drug concentration, denoted “high” and “low”.
- the bottom panel shows the response when treated with various control treatments (i.e. FCCP: p-trifluoromethoxy carbonyl cyanide phenyl hydrazone; CI: calcium ionophore A23187; Triton: Triton-X-100; Medium: culture medium; DMSO: dimethylsulphoxide).
- FCCP p-trifluoromethoxy carbonyl cyanide phenyl hydrazone
- CI calcium ionophore A23187
- Triton Triton-X-100
- Medium culture medium
- DMSO dimethylsulphoxide
- FCCP is an uncoupler of oxidative phosphorylation in mitochondria. It is capable of depolarizing plasma and mitochondrial membranes and is therefore used as a positive control for the TMRM stain. FCCP depolarises the mitochondrial membrane resulting in a TMRM signal decrease compared to negative controls.
- Calcium ionophore A23187 is highly selective for Calcium. This is a positive control for the Fluo4-AM stain. CI results in an overall increase in the intracellular Calcium levels therefore resulting in a signal increase in the Fluo4-AM intensity compared to negative controls.
- the deteregent/surfactant Triton-X-1000 acts as a positive control for the TOTO-3 stain. Triton will permeabilise the cell membranes resulting in a signal increase in the TOTO-3 intensity compared to negative controls.
- the culture medium acts as a negative control.
- DMSO is used a drug carrier and acts as negative control.
- FIG. 12 shows the response of FIG. 11 with fitted data curves.
- Data fitting was performed using a response 1 (t) function having an exponential rising shape.
- FIG. 13 shows an experimental TOTO-3 concentration response showing the logarithm of characteristic time (in hours) by TOTO-3 response (y-axis) as a function of logarithm of concentration (micromoles) (x-axis) for various drug compounds.
- FIGS. 11 to 13 demonstrate the utility of the analytical method since it allows for the classifying of drugs quantitatively by their mode of action in terms of fast/slow responders.
- three toxic drugs astemizole, tamoxifen and lovastatin
- These Figures also show that increasing concentration of these drugs makes the response even faster.
- the second example analyzed a mitochondrial marker (TMRM) response. This analysis did not take into account stochastic effects and was therefore reduced to the usual fitting procedure for the FOV-averaged response. It was assumed that all cells started reacting immediately after drug addition. The reaction of a mitochondrial potential to a perturbation (i.e. a drug) is considered to be potentially very diverse.
- TMRM mitochondrial marker
- Equation 16 The expression defined in Equation 16 above is very flexible, and uses as a fitting parameter the single time scale (“ ⁇ ”), amplitude (“range”) and another parameter (“ ⁇ ”) for controlling response nonlinearity.
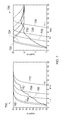
- FIG. 14 shows the raw time-dependent TMRM response.
- the TMRM response was taken for two values of drug concentration, denoted “high” and “low”.
- the bottom panel shows the response when treated with various control treatments (i.e. FCCP: p-trifluoromethoxy carbonyl cyanide phenyl hydrazone; CI: calcium ionophore A23187; Triton: Triton-X-100; Medium: culture medium; DMSO: dimethylsulphoxide).
- FCCP p-trifluoromethoxy carbonyl cyanide phenyl hydrazone
- CI calcium ionophore A23187
- Triton Triton-X-100
- Medium culture medium
- DMSO dimethylsulphoxide
- FIG. 15 shows the response of FIG. 14 with fitted data curves. Data fitting was performed using the technique discussed in relation to Equation 16, above.
- FIGS. 16 and 17 show rudimentary “concentration dependencies” (plotted for the two values of drug concentration, “high” and “low”) of the two important parameters “range” and “ ⁇ ”.
- FIGS. 14 to 17 demonstrate the utility of the fitting method since they allow for the classification of drugs quantitatively by their mode of action i.e. in terms of fast/slow and suppressing/stimulating characteristics.
- the latter characteristic is apparent and is an example of the hormesis exhibited by etoposide and amodiaquine (i.e. data >100% of the TMRM level, showing raised mitochondrial activity).
- the majority of the other drugs appear to suppress mitochondrial function and the drugs leflunomide and dantrolene have no effect.
- analysis of the characteristic time “ ⁇ ” as a parameter indicates that increasing drug concentration results in a faster TMRM response.
- Such extensions of the method using bistable responses, measurement noise introduction and/or ODE-modelled responses can, for example, be incorporated into a GE IN Cell Investigator software analysis tool.
- aspects and embodiments of the present invention may thus be used to perform virtual experimentation based upon one or more of: temporal multi-scale responses, single cell responses, transient responses, characteristic times, response amplitudes, response starting times, stochastic fitting, bistability, ODE analysis, etc.
- a virtual assay model VAM
- VAM virtual assay model
- Various techniques incorporating stochastic data and/or stochastic analysis may also be used.
- image acquisition may be provided to obtain actual images. This may be done in real-time or by using off-line processing to perform image analysis in order to compare VAM output data to measured responses.
Landscapes
- Engineering & Computer Science (AREA)
- Health & Medical Sciences (AREA)
- Physics & Mathematics (AREA)
- Life Sciences & Earth Sciences (AREA)
- Theoretical Computer Science (AREA)
- General Health & Medical Sciences (AREA)
- Medical Informatics (AREA)
- Bioinformatics & Cheminformatics (AREA)
- Molecular Biology (AREA)
- General Physics & Mathematics (AREA)
- Bioinformatics & Computational Biology (AREA)
- Spectroscopy & Molecular Physics (AREA)
- Biophysics (AREA)
- Genetics & Genomics (AREA)
- Biotechnology (AREA)
- Evolutionary Biology (AREA)
- Computer Vision & Pattern Recognition (AREA)
- Quality & Reliability (AREA)
- Radiology & Medical Imaging (AREA)
- Nuclear Medicine, Radiotherapy & Molecular Imaging (AREA)
- Proteomics, Peptides & Aminoacids (AREA)
- Analytical Chemistry (AREA)
- Chemical & Material Sciences (AREA)
- Biomedical Technology (AREA)
- Multimedia (AREA)
- Investigating Or Analysing Biological Materials (AREA)
- Measuring Or Testing Involving Enzymes Or Micro-Organisms (AREA)
Abstract
Description
- 1) very fast Δt=1 second (e.g. for analysing ion channel dynamics)
- 2) fast Δt=10 s (e.g. for analysing receptor-mediated protein kinase translocation)
- 3) intermediate Δt=100 s (e.g. for analysing receptor-mediated Rac-1 translocation)
- 4) slow Δt=1000 s (e.g. for analysing gene expression)
where I represents a pixel intensity value and ds spatial position of pixels in the image.
“dead”0≦V es
P 2n4n(a)=p 2n·δ(a−1)+p 2n-4n·Box(1,2)+p 4nδ·(a−2) Equation 7
P 2n4n8n(a)=p 2n·δ(a−1)+p 2n-4n·Box(1,2)+p 4n·δ(a−2)+p 4n-8n·Box(2,4)+p 8n·δ(a−4)
where natural time variable, y, is defined as
where ηi is an optionally added measurement noise parameter.
-
- 1) parameters of the distribution of the starting time t0 (e.g., μt0 and σt0);
- 2) response duration τ; and/or
- 3) response amplitude (B−A).
-
- with limits f(0)=A, f(∞)=A+range
- and where
where range, K and α are three fitting parameters, and A is fixed being assigned after inspection of the response on unperturbed cells (i.e. as a baseline).
-
- 1) direct fitting, which can be applied to many time dependencies recorded from cells with the help of cell tracking, or to FOV-averaged responses;
- 2) indirect fitting, by comparing measured and modelled FOV-averaged responses in the time domain; and/or
- 3) indirect fitting, by comparing measured and modelled distributions of the FOV responses at certain time points.
-
- 1) concentration dependencies of fitting parameters;
- 2) perturbations (or drugs) might be classified in the space defined by fitting parameters; and/or
- 3) responses of different markers can be ranked according to their characteristic times.
-
- 1) A bistable assay, i.e. in this system a composite response originates from two basic response1(t) curves. As an example one can fit the mixture of two responses with different timings (providing “high” and “low” levels of signal at t=∞). In this case, bimodal response distributions are possible. Such a method can be applied to stochastic simulations.
- 2) Generating the response1(t) with the help of intra-cellular kinetics modelling, for example by the ordinary differential equation (ODE) formalism. In this case, the set of parameters controlling the shape of the response1(t) curves coincide with parameters from the biochemical kinetic model.
- 1. WO 2005/007744 (GENE NETWORK SCIENCES, INC.)
- 2. WO 02/099736 (PHYSIOME SCIENCES, INC.)
- 3. US 2003/0018457 (PHYSIOME SCIENCES, INC.)
- 4. P. J. O'Brien, et al., “High Concordance of Drug-Induced Human Hepatotoxicity with In-Vitro Cytotoxicity Measured in a Novel Cell-Based Model Using High Content Screening,” Archives of Toxicology (2006), ISSN 0340-5761, vol. 80, no. 9, pp. 580-604, DOI 10.1007/s00204-006-0091-3
Claims (15)
Applications Claiming Priority (3)
| Application Number | Priority Date | Filing Date | Title |
|---|---|---|---|
| GB201012297A GB201012297D0 (en) | 2010-07-22 | 2010-07-22 | A system and method for automated biological cell assay data analysis |
| GB1012297.6 | 2010-07-22 | ||
| PCT/EP2011/062630 WO2012010691A1 (en) | 2010-07-22 | 2011-07-22 | A system and method for automated biological cell assay data analysis |
Publications (2)
| Publication Number | Publication Date |
|---|---|
| US20130121557A1 US20130121557A1 (en) | 2013-05-16 |
| US9047503B2 true US9047503B2 (en) | 2015-06-02 |
Family
ID=42752621
Family Applications (1)
| Application Number | Title | Priority Date | Filing Date |
|---|---|---|---|
| US13/811,399 Active 2031-12-12 US9047503B2 (en) | 2010-07-22 | 2011-07-22 | System and method for automated biological cell assay data analysis |
Country Status (3)
| Country | Link |
|---|---|
| US (1) | US9047503B2 (en) |
| GB (1) | GB201012297D0 (en) |
| WO (1) | WO2012010691A1 (en) |
Families Citing this family (4)
| Publication number | Priority date | Publication date | Assignee | Title |
|---|---|---|---|---|
| US9519823B2 (en) * | 2013-10-04 | 2016-12-13 | The University Of Manchester | Biomarker method |
| US9953417B2 (en) | 2013-10-04 | 2018-04-24 | The University Of Manchester | Biomarker method |
| JP6959218B2 (en) * | 2015-08-12 | 2021-11-02 | モレキュラー デバイシーズ, エルエルシー | Systems and methods for automatically analyzing cell phenotypic responses |
| WO2023231202A1 (en) * | 2022-05-31 | 2023-12-07 | 医渡云(北京)技术有限公司 | Method and apparatus for constructing digital cell model, medium, device, and system |
Citations (9)
| Publication number | Priority date | Publication date | Assignee | Title |
|---|---|---|---|---|
| US4343782A (en) * | 1978-04-20 | 1982-08-10 | Shapiro Howard M | Cytological assay procedure |
| US6219440B1 (en) | 1997-01-17 | 2001-04-17 | The University Of Connecticut | Method and apparatus for modeling cellular structure and function |
| US6251616B1 (en) * | 1999-01-14 | 2001-06-26 | Biocrystal Ltd. | Methods and assay kits for detecting altered mononuclear cell phenotype related to a pro-tumor immune response |
| US20020164063A1 (en) * | 2001-03-30 | 2002-11-07 | Heckman Carol A. | Method of assaying shape and structural features in cells |
| WO2002099736A1 (en) | 2001-03-13 | 2002-12-12 | Physiome Sciences, Inc. | Biological modeling utilizing image data |
| US20050074745A1 (en) * | 2002-06-14 | 2005-04-07 | Pfizer Inc | Metabolic phenotyping |
| US20060050946A1 (en) * | 2002-05-10 | 2006-03-09 | Mitchison Timothy J | Computer-assisted cell analysis |
| US7279338B2 (en) * | 2004-12-22 | 2007-10-09 | Cargill, Incorporated | Methods for determining cellular response to stimuli |
| US20090028413A1 (en) * | 2003-06-19 | 2009-01-29 | Applied Precision, Llc | System and method employing photokinetic techniques in cell biology imaging applications |
Family Cites Families (1)
| Publication number | Priority date | Publication date | Assignee | Title |
|---|---|---|---|---|
| US20040088116A1 (en) | 2002-11-04 | 2004-05-06 | Gene Network Sciences, Inc. | Methods and systems for creating and using comprehensive and data-driven simulations of biological systems for pharmacological and industrial applications |
-
2010
- 2010-07-22 GB GB201012297A patent/GB201012297D0/en not_active Ceased
-
2011
- 2011-07-22 US US13/811,399 patent/US9047503B2/en active Active
- 2011-07-22 WO PCT/EP2011/062630 patent/WO2012010691A1/en not_active Ceased
Patent Citations (11)
| Publication number | Priority date | Publication date | Assignee | Title |
|---|---|---|---|---|
| US4343782A (en) * | 1978-04-20 | 1982-08-10 | Shapiro Howard M | Cytological assay procedure |
| US6219440B1 (en) | 1997-01-17 | 2001-04-17 | The University Of Connecticut | Method and apparatus for modeling cellular structure and function |
| US6251616B1 (en) * | 1999-01-14 | 2001-06-26 | Biocrystal Ltd. | Methods and assay kits for detecting altered mononuclear cell phenotype related to a pro-tumor immune response |
| WO2002099736A1 (en) | 2001-03-13 | 2002-12-12 | Physiome Sciences, Inc. | Biological modeling utilizing image data |
| US20030018457A1 (en) * | 2001-03-13 | 2003-01-23 | Lett Gregory Scott | Biological modeling utilizing image data |
| US20020164063A1 (en) * | 2001-03-30 | 2002-11-07 | Heckman Carol A. | Method of assaying shape and structural features in cells |
| US20060050946A1 (en) * | 2002-05-10 | 2006-03-09 | Mitchison Timothy J | Computer-assisted cell analysis |
| US20050074745A1 (en) * | 2002-06-14 | 2005-04-07 | Pfizer Inc | Metabolic phenotyping |
| US20090028413A1 (en) * | 2003-06-19 | 2009-01-29 | Applied Precision, Llc | System and method employing photokinetic techniques in cell biology imaging applications |
| US7279338B2 (en) * | 2004-12-22 | 2007-10-09 | Cargill, Incorporated | Methods for determining cellular response to stimuli |
| US20080050756A1 (en) * | 2004-12-22 | 2008-02-28 | Paul Kim Chin H | Methods for determining cellular response to stimuli |
Non-Patent Citations (4)
| Title |
|---|
| Loew, L., et al., Trends in Biotechnology, 19:10 (2001) 401-406. |
| Slepchenko, B., et al., Annual Review of Biophysics and Biomolecular Structure, 31 (2002) 423-441. |
| Walker, D., et al., BMC Systems Biology, 2:1 (2008) 102. |
| Zhao, T., et al., Cytometry Part A., 71A:12 (2007) 978-990. |
Also Published As
| Publication number | Publication date |
|---|---|
| GB201012297D0 (en) | 2010-09-08 |
| WO2012010691A1 (en) | 2012-01-26 |
| US20130121557A1 (en) | 2013-05-16 |
Similar Documents
| Publication | Publication Date | Title |
|---|---|---|
| Elkins et al. | Variability in high-throughput ion-channel screening data and consequences for cardiac safety assessment | |
| EP2551665B1 (en) | Information processing apparatus, method and program for fitting a measured spectral distribution. | |
| Fenech et al. | HUMN project initiative and review of validation, quality control and prospects for further development of automated micronucleus assays using image cytometry systems | |
| Hartung et al. | Systems toxicology | |
| Cavero et al. | CiPA: Ongoing testing, future qualification procedures, and pending issues | |
| EP3590059B1 (en) | Method for identifying expression distinguishers in biological samples | |
| Shockley | Quantitative high-throughput screening data analysis: challenges and recent advances | |
| EP2422182B1 (en) | Method and apparatus for multi-parameter data analysis | |
| US9047503B2 (en) | System and method for automated biological cell assay data analysis | |
| US20120219204A1 (en) | Predicting toxicity of a compound over a range of concentrations | |
| Dertinger et al. | High information content assays for genetic toxicology testing: A report of the International Workshops on Genotoxicity Testing (IWGT) | |
| Rogers et al. | Cytometric fingerprinting: quantitative characterization of multivariate distributions | |
| Hasenauer et al. | Analysis of heterogeneous cell populations: a density-based modeling and identification framework | |
| Flores et al. | Functional extensions of Mandel's h and k statistics for outlier detection in interlaboratory studies | |
| Lots et al. | Virtual plates: Getting the best out of high content screens | |
| Li et al. | SOFisher: reinforcement learning-guided experiment designs for spatial omics | |
| Hernandez | In silico toxicology, a robust approach for decision-making in the context of next-generation risk assessment | |
| US20250013919A1 (en) | All-electronic analysis of biochemical samples | |
| Strömblad et al. | Using Systems Microscopy To Understand The Emergence Of Cell Migration From Cell Organization | |
| US11808760B1 (en) | System and methods for in vitro structural toxicity testing | |
| Wang et al. | Spatial IMIX: A Mixture Model Approach to Spatially Correlated Multi-Omics Data Integration | |
| Okabe et al. | Mapping molecular diffusion across the whole cell with spatial statistics-based FRAP | |
| Hawinkel et al. | Unified nonparametric analysis of single-molecule spatial omics data using probabilistic indices | |
| Libowitz | Letter from CAAT | |
| Ebbels et al. | Statistical methods in metabolomics |
Legal Events
| Date | Code | Title | Description |
|---|---|---|---|
| AS | Assignment |
Owner name: GE HEALTHCARE UK LIMITED, UNITED KINGDOM Free format text: ASSIGNMENT OF ASSIGNORS INTEREST;ASSIGNOR:ALEXANDROV, YURIY;REEL/FRAME:029666/0466 Effective date: 20110906 |
|
| FEPP | Fee payment procedure |
Free format text: PAYOR NUMBER ASSIGNED (ORIGINAL EVENT CODE: ASPN); ENTITY STATUS OF PATENT OWNER: LARGE ENTITY |
|
| STCF | Information on status: patent grant |
Free format text: PATENTED CASE |
|
| MAFP | Maintenance fee payment |
Free format text: PAYMENT OF MAINTENANCE FEE, 4TH YEAR, LARGE ENTITY (ORIGINAL EVENT CODE: M1551); ENTITY STATUS OF PATENT OWNER: LARGE ENTITY Year of fee payment: 4 |
|
| AS | Assignment |
Owner name: GLOBAL LIFE SCIENCES SOLUTIONS OPERATIONS UK LTD, UNITED KINGDOM Free format text: ASSIGNMENT OF ASSIGNORS INTEREST;ASSIGNOR:GE HEALTHCARE UK LIMITED;REEL/FRAME:053653/0001 Effective date: 20200331 |
|
| MAFP | Maintenance fee payment |
Free format text: PAYMENT OF MAINTENANCE FEE, 8TH YEAR, LARGE ENTITY (ORIGINAL EVENT CODE: M1552); ENTITY STATUS OF PATENT OWNER: LARGE ENTITY Year of fee payment: 8 |