US8871067B2 - Sensor for detecting hydrogen peroxide - Google Patents
Sensor for detecting hydrogen peroxide Download PDFInfo
- Publication number
- US8871067B2 US8871067B2 US13/673,710 US201213673710A US8871067B2 US 8871067 B2 US8871067 B2 US 8871067B2 US 201213673710 A US201213673710 A US 201213673710A US 8871067 B2 US8871067 B2 US 8871067B2
- Authority
- US
- United States
- Prior art keywords
- oxide
- ito
- cyt
- electrode
- hydrogen peroxide
- Prior art date
- Legal status (The legal status is an assumption and is not a legal conclusion. Google has not performed a legal analysis and makes no representation as to the accuracy of the status listed.)
- Expired - Fee Related
Links
Images


Classifications
-
- G—PHYSICS
- G01—MEASURING; TESTING
- G01N—INVESTIGATING OR ANALYSING MATERIALS BY DETERMINING THEIR CHEMICAL OR PHYSICAL PROPERTIES
- G01N27/00—Investigating or analysing materials by the use of electric, electrochemical, or magnetic means
- G01N27/02—Investigating or analysing materials by the use of electric, electrochemical, or magnetic means by investigating impedance
- G01N27/04—Investigating or analysing materials by the use of electric, electrochemical, or magnetic means by investigating impedance by investigating resistance
- G01N27/12—Investigating or analysing materials by the use of electric, electrochemical, or magnetic means by investigating impedance by investigating resistance of a solid body in dependence upon absorption of a fluid; of a solid body in dependence upon reaction with a fluid, for detecting components in the fluid
-
- G—PHYSICS
- G01—MEASURING; TESTING
- G01N—INVESTIGATING OR ANALYSING MATERIALS BY DETERMINING THEIR CHEMICAL OR PHYSICAL PROPERTIES
- G01N27/00—Investigating or analysing materials by the use of electric, electrochemical, or magnetic means
- G01N27/26—Investigating or analysing materials by the use of electric, electrochemical, or magnetic means by investigating electrochemical variables; by using electrolysis or electrophoresis
- G01N27/403—Cells and electrode assemblies
-
- C—CHEMISTRY; METALLURGY
- C07—ORGANIC CHEMISTRY
- C07K—PEPTIDES
- C07K17/00—Carrier-bound or immobilised peptides; Preparation thereof
- C07K17/14—Peptides being immobilised on, or in, an inorganic carrier
-
- G—PHYSICS
- G01—MEASURING; TESTING
- G01N—INVESTIGATING OR ANALYSING MATERIALS BY DETERMINING THEIR CHEMICAL OR PHYSICAL PROPERTIES
- G01N27/00—Investigating or analysing materials by the use of electric, electrochemical, or magnetic means
- G01N27/02—Investigating or analysing materials by the use of electric, electrochemical, or magnetic means by investigating impedance
- G01N27/04—Investigating or analysing materials by the use of electric, electrochemical, or magnetic means by investigating impedance by investigating resistance
- G01N27/12—Investigating or analysing materials by the use of electric, electrochemical, or magnetic means by investigating impedance by investigating resistance of a solid body in dependence upon absorption of a fluid; of a solid body in dependence upon reaction with a fluid, for detecting components in the fluid
- G01N27/125—Composition of the body, e.g. the composition of its sensitive layer
- G01N27/127—Composition of the body, e.g. the composition of its sensitive layer comprising nanoparticles
Definitions
- the present invention relates to a sensor for detecting hydrogen peroxide.
- H 2 O 2 hydrogen peroxide
- Many analytical methods have been developed for this purpose but amperometric enzyme-based biosensors have received considerable attention due to its convenience, high sensitivity and selectivity [3,4].
- a significant challenge in the development of sensitive and stable sensors is the effective immobilization of enzyme and/or any nanostructured materials (such as carbon nanotubes, quantum dots, nanoparticles, etc.) to solid electrode surfaces [5].
- Electrochemical biosensors for detection of H 2 O 2 are mostly designed based on immobilization of horseradish peroxidase (HRP) to carbon based electrode materials [6].
- HRP horseradish peroxidase
- HRP horseradish peroxidase
- the present inventors have made intensive efforts to develop a high-throughput sensor for detecting hydrogen peroxide with higher sensitivity useful in the industrial field. As a result, the present inventors have found that where hydrogen peroxide is contacted to an electrode comprising gold nanoparticles and cytochrome c on a conducting oxide substrate, current values are increased depending on concentrations of hydrogen peroxide, thereby permitting to detect hydrogen peroxide in more rapid and convenient manner.
- FIG. 1 represents the schematization of an electrode modification process for immobilizing cytochrome c (cyt c) on an indium-tin oxide (ITO)/gold nanoparticle (AuNP) electrode.
- FIG. 2 represents the SEM images.
- FIG. 2 , part (a) to FIG. 2 , part (c), represent a bare ITO surface, AuNPs on ITO surface and cyt c immobilized ITO/AuNP electrode surface, respectively.
- Scale bar represents 500 nm.
- FIG. 2 , part (d), represents the topographical image of ITO surface, scale bar 250 nm.
- FIG. 2 , part (g), represents the roughness analysis of FIG. 2 , part (d).
- FIG. 2 , part (e), represents the topographical image of AuNPs adsorbed on ITO/MPTMS surface.
- FIG. 2 , part (h), represents the roughness analysis of FIG. 2 , part (e).
- FIG. 2 , part (f), represents the topographical image of cyt c adsorbed on ITO/AuNP surface.
- FIG. 2 , part (i), represents the roughness analysis of FIG. 2 , part (f). Images were scanned at a rate of 1 Hz.
- R a Mean roughness
- R q RMS
- R max Max height
- R z 10 pt mean
- R p Max. peak height
- R pm Avg. max. height
- R ym Max. depth.
- FIG. 3 represents X-ray diffraction patterns of (a) AuNP/ITO; (b) cyt c/ITO, (c) cyt c/AuNP/ITO surface, respectively.
- FIG. 4 part (a), represents cyclic voltammograms for (i) bare ITO, (ii) ITO/AuNP, (iii) ITO/AuNP/cyt c electrode in HEPES buffer solution at pH 7 at a scan rate of 0.05 Vs ⁇ 1 .
- FIG. 4 part (b), represents cyclic voltammograms of ITO/AuNP/cyt c electrode in 10 mM, pH 7.0, HEPES buffer with increasing scan rate from 0.01 to 0.1 Vs ⁇ 1 .
- FIG. 5 part (a), represents a plot of the cathodic (i pa ) peak currents vs. scan rate.
- FIG. 5 part (b), represents a plot of the cathodic (i pc ) and anodic (i pa ) peak currents vs. log(scan rate) 1/2 .
- FIG. 5 part (c), represents a variation of peak potential (E pa and E pc ) vs. logarithm of scan rate of ITO/AuNP/cyt c electrode in 10 mM pH 7.0, HEPES buffer. Straight lines indicate the linear fit of the curves.
- FIG. 6 represents a differential pulse voltammetry of the ITO/AuNP/cyt c electrode as a function of H 2 O 2 upon successive additions of 5 ⁇ l aliquots of 100 mM H 2 O 2 in 5 ml solution of 10 mM HEPES buffer at pH 7.
- the features indicated in the box (0.4 mM etc.) correspond to the respective curves from the top down at the point of the vertical arrow.
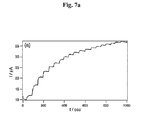
- FIG. 7 a represents a current-time curve obtained for ITO/AuNP/cyt c electrode upon successive additional of 20 ⁇ l aliquots of 200 mM H 2 O 2 to 5 ml stirred 10 mM HEPES buffer at pH 7 with an applied potential of ⁇ 0.1 V under nitrogen atmosphere.
- FIG. 7 b represents a chronoamperometric curve obtained for cyt c/ITO.
- FIG. 7 c represents AuNP/ITO obtained by the addition of 20 ⁇ l aliquots of 200 mM H2O2 in 5 ml stirred solution of 10 mM HEPES buffer at the potential of ⁇ 0.1 V under nitrogen atmosphere.
- a sensor for detecting hydrogen peroxide comprising: (a) a gold (Au) nanoparticle conjugated with a conducting oxide substrate comprising a conductive oxide; (b) a cytochrome c (cyt c) immobilized on the gold nanoparticle.
- the present inventors have made intensive efforts to develop a high-throughput sensor for detecting hydrogen peroxide with higher sensitivity useful in the industrial field. As a result, the present inventors have found that where hydrogen peroxide is contacted to an electrode comprising gold nanoparticles and cytochrome c on a conducting oxide substrate, current values are increased depending on concentrations of hydrogen peroxide, thereby permitting to detect hydrogen peroxide in more rapid and convenient manner.
- One of the most prominent features of the present invention is to prepare a conducting oxide electrode by depositing conductive oxides on a glass substrate.
- the electrode may be formed on the surface of the substrate by various methods known in the art.
- the method includes an electron beam evaporation, a vacuum evaporation, a thermal evaporation, a spin coating, a sputtering, a low pressure chemical vapor deposition, a sol-gel synthesis, an electrical plating and an electroless plating.
- conductive oxide refers to a conducting film which is optically transparent and electrically conductive.
- the conducting film for photovoltaic applications may be fabricated from both inorganic and organic materials.
- the inorganic films typically are made up of general conductive oxide layers such as indium-tin oxide, fluorine doped thin oxide, and doped zinc oxide.
- the organic films are being developed using carbon nanotube networks and graphene, which can be fabricated to highly transparent to the infrared light, along with networks of polymers such as poly(3,4-ethylenedioxythiophene) and its derivatives. Most of these films are fabricated with polycrystalline or amorphous microstructures. On average, these applications use electrode materials that have greater than 80% transmittance of incident light as well as conductivities higher than 10 3 S/cm for efficient carrier transport.
- the conductive oxide is selected from the group consisting of an indium-tin oxide, a indium-zinc oxide, a tin oxide, a zinc oxide, a copper-aluminum oxide, a copper-gallium oxide, a copper-scandium oxide, a copper-chrome oxide, a copper-indium oxide, a copper-yttrium oxide and a silver-indium oxide, more preferably, an indium-tin oxide (ITO).
- ITO indium-tin oxide
- ITO Indium-tin oxide
- tin-doped indium oxide used in the present invention is a solid material of indium (III) oxide (In 2 O 3 ) and tin (IV) oxide (SnO 2 ), generally 90% In 2 O 3 and 10% SnO 2 by weight.
- the indium-tin oxide shows low resistivity as electron concentration becomes increased due to electron generation in the replacement of In 3+ ions by Sn 4+ ions. As the replacement requires high energy, it is general knowledge to one of skill in the art that indium-tin oxide electrodes with low resistivity may be fabricated by heating a glass substrate over 300° C. to easily replace indium ions by tin ions.
- ITO is transparent and colorless in thin layers while in bulk form it is yellow to grey. In the infrared region of the spectrum it acts as a metal-like mirror.
- Indium-tin oxide is one of the most widely used transparent conductive oxides because of its electrical conductivity and optical transparency, as well as the ease with which it can be deposited as a thin film. As, with all transparent conducting films, a compromise must be made between conductivity and transparency, since increasing the thickness and increasing the concentration of charge carriers will increase the material's conductivity, but decrease its transparency.
- the ITO films are most commonly deposited on surfaces by an electron beam evaporation, a physical vapor deposition, or a range of sputter deposition techniques.
- Another feature of the present invention is to immobilize gold nanoparticles onto the surface of the conducting oxide substrate.
- the gold nanoparticle is indirectly conjugated with the conducting oxide substrate through a sulfhydryl group introduced to the surface of the conducting oxide substrate.
- the ITO substrate on a glass plate is incubated overnight in methanol containing 3-MPTMS (3-Mercaptopropyl trimethoxysilane) to generate —SH groups on the ITO surface.
- ITO/AuNP hybrid is prepared by immersing the ITO/MPTMS substrate in the gold colloidal solution for 2 hr, which produced the ITO/AuNP substrate through metal-thiol interactions.
- Another feature of the present invention is immobilization of cytochrome c (cyt c) on the conducting oxide/AuNP hybrid.
- the ITO/AuNP electrode is incubated with 30 mM 11-MUA (11-mercaptoundecanoic acid) and then activated with EDC(N-ethyl-N′-(3-(dimethylamino)propyl)carbodiimide) and NHS (N-hydroxysuccinimide).
- the ITO/AuNP/cyt c electrode is prepared by adding 20 ⁇ l of cyt c to the activated electrode surface and washed with distilled water to remove any unbound protein molecules, followed by drying under a N 2 stream.
- cytochrome c has a unique peroxidase activity and is not a oxygen-specific protein, it is not interfered with the presence of oxygen under applied voltage.
- the heme prosthetic group of cytochrome c is very unlikely to be lost in reactions in organic solvents, because it is covalently linked to the protein. Since cytochrome cis active over a wide range of pH from pH 2 to pH 11 and shows excellent thermo stability, it is able to perform biocatalytic reactions even at higher temperatures and after chemical modification. Furthermore, cytochrome c is economical in bulk biocatalysis due to its inexpensive price.
- cytochrome c is indirectly immobilized on the gold nanoparticle through an amino group introduced to the surface of the gold nanoparticle.
- the present invention relates to a sensor device for electrochemically detecting hydrogen peroxide by changing the oxidation and reduction state of immobilized proteins depending on the concentration of hydrogen peroxide.
- the substrate having the protein layer is incubated in an electrolyte solution, e.g. a HEPES electrolyte.
- the substrate is operated by connecting to a potentiostat as a working electrode, and a reference electrode (e.g., Ag/AgCl) and a counter electrode (e.g., Pt) are incorporated into the electrolyte.
- the reference electrode is a reference to read the potential changes of the working electrode in the potentiostat during voltage sweep.
- the counter electrode is a passage of electrons flowing as a result of the control of potential by the potentiostat.
- Such a three-electrode system is one of the most commonly used systems in the field of electrochemistry.
- a voltage-current curve is obtained using the cyclic voltammetry method.
- An open-circuit potential is measured to investigate the equilibrium potential of the electrochemical system constructed.
- the open-circuit potential refers to a potential difference formed due to the intrinsic property of the protein layer and the electrolyte in a voltage-free state, i.e. in a circuit-broken state, naturally reaching equilibrium in the constructed system.
- a system can be artificially made close to the equilibrium state by applying an open-circuit potential to the system if the open-circuit potential is known.
- the open-circuit potential allows to read the redox state of the protein layer.
- the senor further comprises a counter electrode and a reference electrode.
- the hydrogen peroxide-detecting sensor of this invention is capable of detecting hydrogen peroxide with higher sensitivity, preferably with a detection limit of 0.3-0.8 ⁇ M, more preferably 0.4-0.6 ⁇ M, still more preferably 0.5 ⁇ M.
- the present sensor is capable of reaching to a steady-state current in less than 10 sec, allowing to rapidly obtain detection results.
- a method for detecting hydrogen oxide in a sample comprising:
- sample includes, but not limited to, biological samples (e.g., tissues, cells, a body fluid, blood, plasma and serum) and environmental samples.
- biological samples e.g., tissues, cells, a body fluid, blood, plasma and serum
- environmental samples e.g., environmental samples.
- Cytochrome-Fe(II) is produced by electron release from cytochrome-Fe(III). Two molecules of cytochrome-Fe(II) and 2H + plus H 2 O 2 are then reacted to generate two molecules of cytochrome-Fe(III) and two water molecules in which hydrogen peroxide undergoes reduction to increase current values, thereby detecting the concentration of hydrogen peroxide.
- the present invention provides a high-throughput sensor capable of detecting hydrogen peroxide with much higher sensitivity.
- Cytochrome c used in the present sensor is not interfered with oxygen unlike to hemoglobin and myoglobin conventionally used in hydrogen peroxide sensors.
- cytochrome c is active over a wide range of pH from pH 2 to pH 11 and shows excellent thermo stability. Therefore, cytochrome c is capable of performing biocatalytic reactions at high temperatures and after chemical modification.
- Cytochrome c (cyt c) from horse heart was purchased from Sigma-Aldrich (cyt c, purity 99.7% based on H 2 O content 7.0%) and used as received without further purification.
- 3-Mercaptopropyl trimethoxysilane (3-MPTMS; purity: 85%) and gold colloid solution ( ⁇ 0.01% HAuCl 4 ) were purchased from Sigma-Aldrich.
- Glutaraldehyde solution, 11-mercaptoundecanoic acid (MUA, Aldrich) were purchased from Sigma and used as received without any further purification.
- N-hydroxysuccinimide (NHS), 1-ethyl-3-(3-diethylaminopropyl) carbodiimide hydrochloride (EDC) was obtained from Sigma. 30% hydrogen peroxide was brought from Daejung Materials and Chemicals, Korea and diluted in DI water to prepare molar solutions. 10 mM HEPES buffer solution (pH 7.0) was used in all electrochemical experiments. All solutions were prepared with water (18 M ⁇ cm) that was purified using a Milli-Q system (Millipore, Bedford, Mass.).
- ITO Indium-tin oxide
- 20 ⁇ /cm 2 Indium-tin oxide
- the transparent electrodes were cleaned by ultrasonic cleaning in successive solutions of Triton X-100/water (1:5, v/v), water, and ethanol for at least 40 min each.
- the ITO electrode was then heated in a 1:1:5 solution of NH 4 OH:H 2 O 2 :H 2 O for 40 min at 80° C., rinsed thoroughly with water, and dried under a stream of nitrogen gas to generate —OH groups on the surface [21].
- the —OH.terminated ITO substrates were incubated with 2% (v/v) 3-MPTMS in methanol overnight to generate —SH groups on the ITO surface. After rinsing thoroughly, the ITO/MPTMS substrates were immersed in the gold colloidal solution for 2 hr, which produced the ITO/AuNPs substrate through metal-thiol interactions.
- the ITO/AuNPs were incubated with 30 mM 11-MUA and activated with EDC and NHS. 20 ⁇ l of cyt c was then added to the activated electrode surface. The ITO/AuNP/cyt c were slightly washed with DI water to remove any unbound protein molecules and dried under a N 2 stream.
- ITO electrodes were incubated with a 2% APTES solution in ethanol for 6 hr. The samples were then washed with ethanol and DI water. Subsequently the substrates were immersed into 1% glutaric anhydride (GA) overnight at room temperature. The functionalized substrates were washed with DI water and then dried under a N 2 stream. 20 ⁇ l cyt c was then incubated on the substrate for 3 hr and slightly washed with DI water and dried under a N 2 stream.
- the electrode modification processes for cyt c immobilization on the ITO/AuNP electrode is represented in the schematic diagram of FIG. 1 .
- RMS root mean square
- R q is the most widely used amplitude roughness parameter, which gives the standard deviation of height.
- Amplitude parameters R z gives the extreme height deference for an image.
- the surface skewness R sk describes the asymmetry of the height distribution. A skewness value of zero represents a Gaussian-like surface. Negative values of R sk refer to a surface-porous sample, where the valleys dominate the peaks and positive R sk values indicate that the local summits dominate the valleys.
- the X-ray diffraction patterns of the prepared samples were recorded with Cu K ⁇ radiation ( ⁇ ) 1.54056 ⁇ of a Rigaku X-ray diffractometer at a scanning rate of 0.02° per second in 2 ⁇ .
- the X-ray diffractometer was operated at 40 kV and 150 mA.
- Cyclic voltammetry was performed with a three-electrode system using the ITO/AuNP/cyt c substrate as the working electrode, platinum coil as the counter electrode, and Ag/AgCl/KCl sat as the reference electrode.
- Experiments were performed using a CHI 660A potentiostat equipped with general purpose electrochemical software and operated in a potential range from 0.2 to ⁇ 0.4 V at a scan rate 50 mVs ⁇ 1 .
- the DPV and chronoamperometric experiments were performed using the ITO/AuNP/cyt c modified ITO electrodes with various concentrations of H 2 O 2 .
- the potential was set at ⁇ 0.10 V and the current-time curves were recorded after successive additions of 20 ⁇ l aliquots of 200 mM H 2 O 2 in 5 ml of 10 mM HEPES, pH 7.0.
- FIG. 2 a - c The topographical features of the ITO, ITO/AuNP and ITO/AuNP/cyt c surfaces were examined by SEM ( FIG. 2 a - c ).
- the AuNP was well attached on to the ITO surface and had a particle diameter of ⁇ 40 nm.
- FIG. 2 c which shows images of the particles after cyt c immobilization, had a larger diameter ( ⁇ 50 nm), confirming that the cyt c was attached to the AuNP on the ITO surface.
- 2 d - f shows typical AFM images of three different (ITO, ITO/AuNP and ITO/AuNP/cyt c) sample surfaces scanned at a rate of 1 Hz.
- the sizes of AuNPs immobilized on the MPTMS/ITO were two to three times larger than those of the AuNPs colloids. This was due to the aggregation of AuNPs and the well-known convolution of the AFM tip. However, the images clearly show that cyt c was conjugated to the AuNPs on the ITO substrates.
- the roughness parameters obtained from the scanned images were shown in FIG. 2 g - i and the selected roughness parameters of the three surfaces are given in Table 1.
- the height of the AuNP and cyt c was found to be 4 nm and 15 nm, respectively, while the bare ITO contained large clusters of particles.
- the observed diameter of the AuNP particles was 40 nm, which indicates that these structures were aggregates of ⁇ 2 particles.
- the size of single cyt c molecule is 3 nm [22]; which means that aggregated AuNPs had attached to the ITO substrate, resulting in the formation of an AuNP-cyt c hybrid with an average diameter of ⁇ 50 nm. From Table 1, it is clear that the RMS roughness decreased for each sample and was higher for the bare ITO surface.
- the ITO/AuNP/cyt c electrode showed a couple of well-defined and quasi-reversible redox peaks (curve iii) because of the Fe 3+/2+ redox center, which was responsible for electron exchange.
- the anodic peak potential (E pa ) and cathodic peak potential (E pc ) were located at 0.09 and 0.02 V (vs. Ag/AgCl) respectively, with a peak-to-peak separation ( ⁇ E p ) of 70 mV.
- the nanoparticles significantly enhanced the interfacial electrochemical electron transfer rate despite the increase in total distance between the redox center and the electrode surface.
- the surface concentration ( ⁇ ) of the cyt c molecules on the ITO/AuNP/cyt c electrode could be estimated based on the slope of Ip vs. using the following equation:
- I p n 2 ⁇ F 2 ⁇ A ⁇ ⁇ ⁇ ⁇ ⁇ u 4 ⁇ RT ( 3 )
- I p is the reduction peak current
- u is the scan rate and A is the electrode surface area, respectively.
- F is the Faraday constant
- R is the gas constant and T is the absolute temperature.
- ⁇ was calculated to be 4.2 10.10 mol/cm ⁇ 2 .
- FIG. 6 shows the differential pulse voltammogram in a buffer solution of 10 mM HEPES (pH 7.0), which clearly shows a well-defined higher differential pulse peak for the H 2 O 2 catalytic reduction current at ⁇ 0.1 V.
- the potential of ⁇ 0.1 V was selected because the complete reduction of cyt c occurs at ⁇ 0.1 V even though the reduction starts at 0.02 V.
- the current response increased when the H 2 O 2 concentration was increased from 0.1 mM to 0.4 mM.
- the magnitude of the current also increased linearly upon the addition of several concentrations of H 2 O 2 .
- Cyt c possesses intrinsic peroxidase activity due to its similarity with peroxidase for catalysis of H 2 O 2 [ 20].
- the electrocatalytic response of the ITO/AuNP/cyt c to H 2 O 2 was investigated and the principle of catalyzing H 2 O 2 can be described using the following equation. cyt c -Fe(III)+ e ⁇ ⁇ cyt c -Fe(II) (4) 2 cyt c -Fe(II)+2H + +H 2 O 2 ⁇ 2 cyt c -Fe(III)+2H 2 O (5)
- FIG. 7 a illustrates a typical current-time plot for the ITO/AuNP/cyt c on successive additions of 20 L aliquots of 200 mM H 2 O 2 in 5 ml of 10 mM HEPES at pH 7.
- the working electrode potential was set at 0.0.1 V
- the reduction current increased steeply and then reached a stable value and this response was observed for every addition over a long period.
- FIG. 7 c shows the amperometric curve for the ITO/AuNP in the absence of cyt c.
- the addition H 2 O 2 only resulted in a slight increase in the current but the response quickly saturated.
- the developed electrode sensor showed a linear response to H 2 O 2 concentration upto 6 mM.
- the current response vs. H 2 O 2 concentration shows a linear increase in the reduction current.
- the detection limit of the present electrode sensor was 0.5 ⁇ M, which was comparable to other electrodes in terms of detection limit.
- the electrode achieved a faster electron transfer rate.
- Table 2 summarizes the detection limit of the present electrode compared with previous studies. Furthermore, this system reached 95% of the steady-state current in less than 10 sec after the addition of H 2 O 2 . Thus, the electrode developed in this study showed a fast response for the detection of H 2 O 2 .
- ITO/AuNP/cyt c was fabricated and used as an electrode for direct electrochemistry of cyt c by forming a hybrid to detect H 2 O 2 .
- the surface morphologies and the roughness parameters were investigated by AFM.
- the electrochemical properties of the ITO/AuNP/cyt c were characterized by using CV and other electrochemical methods.
- ITO/AuNP/cyt c displayed good redox behavior with enhanced peak currents due to the incorporation of AuNPs.
- ITO/AuNP/cyt c displayed a good response in the electrocatalytic reduction of H 2 O 2 .
- the hybrid system with nanometer-sized AuNPs achieved direct electron transfer of cyt c, which allowed for the construction of an efficient biosensor for the detection of H 2 O 2 .
Landscapes
- Chemical & Material Sciences (AREA)
- Life Sciences & Earth Sciences (AREA)
- Health & Medical Sciences (AREA)
- General Health & Medical Sciences (AREA)
- Biochemistry (AREA)
- Organic Chemistry (AREA)
- Pathology (AREA)
- Chemical Kinetics & Catalysis (AREA)
- Immunology (AREA)
- General Physics & Mathematics (AREA)
- Analytical Chemistry (AREA)
- Physics & Mathematics (AREA)
- Electrochemistry (AREA)
- Molecular Biology (AREA)
- Biophysics (AREA)
- Proteomics, Peptides & Aminoacids (AREA)
- Medicinal Chemistry (AREA)
- Genetics & Genomics (AREA)
- Inorganic Chemistry (AREA)
- Nanotechnology (AREA)
- Engineering & Computer Science (AREA)
- Measuring Or Testing Involving Enzymes Or Micro-Organisms (AREA)
Abstract
Description
2cytc−Fe(II)+2H++H2O2→2cytc−Fe(III)+2H2O
| TABLE 1 |
| Values of selected roughness parameters measured from |
| the surface analysis of AFM topography images for |
| ITO, ITO/AuNP and ITO/AuNP/cyt c, respectively. |
| — | ITO surface | ITO/AuNP | ITO/AuNP/cyt c |
| Roughness average | 4.20 ± 0.365 | 3.35 ± 0.75 | 3.19 ± 1.09 |
| (Ra) (nm) | |||
| RMS roughness | 5.08 ± 0.386 | 4.40 ± 0.8 | 4.01 ± 1.04 |
| (Rq) (nm) | |||
| Peak to peak height | 32.3 ± 3.31 | 45.1 ± 3.2 | 147 ± 11.73 |
| (Ry) (nm) | |||
| Skewness (Rsk) | −0.36 ± 0.11 | 0.56 ± 0.3 | 0.25 ± 0.16 |
| Kurtosis (Rku) | 2.60 ± 0.314 | 3.13 ± 0.41 | 3.73 ± 0.433 |
| Max. peak height | 12.9 ± 0.87 | 16.8 ± 4.08 | 18.8 ± 2.01 |
| (Rp) (nm) | |||
| Particle height (section | 3.48 ± 0.74 | 4.05 ± 0.57 | 15.0 ± 1.89 |
| analysis) (nm) | |||
cyt c-Fe(III)+e − →cyt c-Fe(II) (4)
2cyt c-Fe(II)+2H++H2O2→2cyt c-Fe(III)+2H2O (5)
- [1] P. N. Bartlett, P. R. Birkin, J. H. Wang, F. Palmisano, G. D. Benedetto, Anal. Chem. 70 (1998) 3685.
- [2] J. Wang, Y. Lin, L. Chen, Analyst 118 (1993) 277.
- [3] T. T. Gu, Y. Hasebe, Biosens. Bioelectron. 21 (2006) 2121.
- [4] S. Chen, R. Yuan, Y. Chaff, L. Zhang, N. Wang, X. Li, Biosens. Bioelectron. 22 (2007) 1268.
- [5] D. Du, J. Ding, J. Cai, A. Zhang, Colloids Surf. B 58 (2007) 145.
- [6] F. Gao, R. Yuan, Y. Chaff, S. Chen, S. Cao, M. Tang, J. Biochem. Biophys. Methods 70 (2007) 407.
- [7] H. Qi, C. Zhang, X. Li, Sens. Actuators B 114 (2006) 364.
- [8] J. Jia, B. Wang, A. Wu, G. Cheng, Z. Li, S. Dong, Anal. Chem. 74 (2002) 2217.
- [9] A. Lindgren, T. Ruzgas, L. Gorton, E. Csoregi, G. B. Ardila, I. Y. Sakharov, I. G. Gazaryan, Biosens. Bioelectron. 15 (2000) 491.
- [10] B.-H. Liu, F. Yan, J.-L. Kong, J.-Q. Deng, Anal. Chim. Acta 386 (1999) 31.
- [11] E. E. Ferapontova, V. G. Grigorenko, A. M. Egorov, T. Borchers, T. Ruzgas, L. Gorton, Biosens. Bioelectron. 16 (2001) 147.
- [12] S. Q. Liu, H. X. Ju, Anal. Biochem. 307 (2002) 110.
- [13] H. Y. Gu, A. M. Yu, H. Y. Chen, J. Electroanal. Chem. 516 (2001) 119.
- [14] S. Liu, Z. Dai, H. Chen, H. Ju, Biosens. Bioelectron. 19 (2004) 963.
- [15] J.-J. Feng, G. Zhao, J.-J. Xu, H.-Y. Chen, Anal. Biochem 342 (2005) 280.
- [16] L. Chen, G. Lu, J. Electroanal. Chem. 597 (2006) 51.
- [17] S. K. Arya, A. K. Prusty, S. P. Singh, P. R. Solanki, M. K. Pandey, M. Datta, B. D. Malhotra, Anal. Biochem. 363 (2007) 210.
- [18] M. Zhang, Y. Wu, X. Feng, X. He, L. Chen, Y. Zhang, J. Mater. Chem. 20 (2010) 5835.
- [19] E. Laviron, J. Electroanal. Chem. 101 (1979) 19.
- [20] N. A. Belikova, Y. A. Vladimirov, A. N. Osipov, A. A. Kapralov, V. A. Tyurin, M. V. Potapovich, L. V. Basova, J. Peterson, I. V. Kurnikov, V. E. Kagan, Biochemistry 45 (2006) 4998.
- [21] S. K. Arya, A. K. Prusty, S. P. Singh, P. R. Solanki, M. K. Pandey, M. Datta, B. D. Malhotra, Anal. Biochem. 363 (2007) 210.
- [22] M. Zhang, Y. Wu, X. Feng, X. He, L. Chen, Y. Zhang, J. Master. Chem. 141 (2009) 518.
Claims (6)
Applications Claiming Priority (2)
| Application Number | Priority Date | Filing Date | Title |
|---|---|---|---|
| KR10-2012-0022832 | 2012-03-06 | ||
| KR1020120022832A KR101364250B1 (en) | 2012-03-06 | 2012-03-06 | Sensor for detecting Hydrogen Peroxidase |
Publications (2)
| Publication Number | Publication Date |
|---|---|
| US20130233729A1 US20130233729A1 (en) | 2013-09-12 |
| US8871067B2 true US8871067B2 (en) | 2014-10-28 |
Family
ID=49113091
Family Applications (1)
| Application Number | Title | Priority Date | Filing Date |
|---|---|---|---|
| US13/673,710 Expired - Fee Related US8871067B2 (en) | 2012-03-06 | 2012-11-09 | Sensor for detecting hydrogen peroxide |
Country Status (2)
| Country | Link |
|---|---|
| US (1) | US8871067B2 (en) |
| KR (1) | KR101364250B1 (en) |
Families Citing this family (11)
| Publication number | Priority date | Publication date | Assignee | Title |
|---|---|---|---|---|
| CN103792271A (en) * | 2014-01-24 | 2014-05-14 | 苏州新锐博纳米科技有限公司 | Hydrogen peroxide non-enzyme electrochemical sensor and preparation method thereof |
| KR20150114827A (en) * | 2014-04-02 | 2015-10-13 | 엘지전자 주식회사 | Method for detecting analytes |
| US10329396B2 (en) * | 2015-07-14 | 2019-06-25 | Nanosniff Technologies Pvt. Ltd. | Process for immobilizing one or more receptor biomolecules on one or more solid surfaces |
| CN105403696B (en) * | 2015-12-11 | 2017-09-19 | 扬州大学 | A label-free chemiluminescent immunosensor based on nano-mimetic enzymes and its preparation and analysis methods |
| KR101978683B1 (en) * | 2016-03-22 | 2019-05-15 | 고려대학교 세종산학협력단 | Method for detecting toxic metal ions in sample |
| KR101823114B1 (en) | 2017-01-31 | 2018-01-29 | 한국과학기술연구원 | Sensors for detecting hydrogen peroxide, and method of detecting hydrogen peroxide using the same |
| KR101953321B1 (en) | 2017-04-28 | 2019-05-17 | 양도현 | A hydrogen peroxide electrochemical sensor and preparation method of the same |
| CN109142487B (en) * | 2018-09-07 | 2019-12-03 | 上海应用技术大学 | A kind of functionalization black phosphorus base modified electrode and preparation method thereof for detecting sodium nitrite |
| KR102210105B1 (en) | 2019-06-24 | 2021-02-02 | 한국과학기술연구원 | Fluorescent sensor for detecting hydrogen peroxide comprising quantum dot nanoparticles, method for detecting hydrogen peroxide using the same, and method for manufacturing the same |
| JP7658980B2 (en) * | 2020-09-30 | 2025-04-08 | 日東電工株式会社 | electrode |
| KR102309584B1 (en) * | 2020-12-08 | 2021-10-06 | 가천대학교 산학협력단 | Hydrogen peroxide detection sensor and its manufacturing method |
Family Cites Families (1)
| Publication number | Priority date | Publication date | Assignee | Title |
|---|---|---|---|---|
| JP2007333714A (en) | 2006-06-15 | 2007-12-27 | Advanced Technology:Kk | Electrochemical biosensor for measuring ultratrace amount of histamine |
-
2012
- 2012-03-06 KR KR1020120022832A patent/KR101364250B1/en not_active Expired - Fee Related
- 2012-11-09 US US13/673,710 patent/US8871067B2/en not_active Expired - Fee Related
Non-Patent Citations (8)
| Title |
|---|
| Brown et al., "Morphology-Dependent Electrochemistry of Cytochrome c at Au Colloid-Modified SnO2 Electrodes," J. Am. Chem. Soc. 118: 1154-1157, 1996. |
| Dutta-Gupta et al., "Ultrasensitive system for the real time detection of H2O2 based on strong coupling in a bio-plasmonic system," Plasmonics in Biology and Medicine IX, edited by Tuan Vo-Dinh, Joseph R. Lakowicz, Proc. of SPIE vol. 8234, 82340K (pp. 82340K-1 to 82340K-6), 2012 SPIE, which was published on Feb. 16, 2012. * |
| Ju et al., "Electrochemistry of Cytochrome c Immobilized on Colloidal Gold Modified Carbon Paste Electrodes and Its Electrocatalytic Activity," Electroanalysis 14, No. 2: 141-147, 2002. |
| Lian et al., "A Hydrogen Peroxide Sensor Based on Electrochemically Roughened Silver Electrodes," Electrochimica Acta 54: 4334-4339, 2009. |
| Liu et al., "Optical Sensing of Electrochemical Reactions on a Bio Hybrid Nanoparticle," Nanobiophotonics and Biomedical Applications II, edited by Alexander N. Cartwright., Marek Osinski, Proceedings of SPIE vol. 5705 (SPIE, Bellingham, WA 2005)pp. 123-130. * |
| Yagati et al., "Amperometric Sensor for Hydrogen Peroxide Based on Direct Electron Transfer of Spinach Ferredoxin on Au Electrode," Bioelectrochemistry, 2010. |
| Yagati et al., "Electrochemical Performance of Gold Nanoparticle-Cytochrome C Hybrid Interface for H2O2 Detection," Biointerfaces 92: 161-167, 2012. |
| Yagati et al., "Nanoscale Biomemory Device Composed of Recombinant Azurin on Hexagonal Au Nanopattern," IEEE-Nanomed 2011 jointly organized with Biotronics 2011, 2011. |
Also Published As
| Publication number | Publication date |
|---|---|
| KR20130101807A (en) | 2013-09-16 |
| KR101364250B1 (en) | 2014-02-18 |
| US20130233729A1 (en) | 2013-09-12 |
Similar Documents
| Publication | Publication Date | Title |
|---|---|---|
| US8871067B2 (en) | Sensor for detecting hydrogen peroxide | |
| Yagati et al. | Electrochemical performance of gold nanoparticle–cytochrome c hybrid interface for H2O2 detection | |
| Deshmukh et al. | Non-enzymatic electrochemical glucose sensors based on polyaniline/reduced-graphene-oxide nanocomposites functionalized with silver nanoparticles | |
| Wei et al. | A highly sensitive non-enzymatic glucose sensor based on CuS nanosheets modified Cu2O/CuO nanowire arrays | |
| Raymundo-Pereira et al. | A nanostructured bifunctional platform for sensing of glucose biomarker in artificial saliva: synergy in hybrid Pt/Au surfaces | |
| Solanki et al. | Nanostructured metal oxide-based biosensors | |
| KR101188172B1 (en) | Electrochemical biosensor and method of fabricating the same | |
| Bui et al. | Electrocatalytic reduction of hydrogen peroxide by silver particles patterned on single-walled carbon nanotubes | |
| Kumar et al. | Preparation and characterization of copper nanoparticles/zinc oxide composite modified electrode and its application to glucose sensing | |
| Chen et al. | 3-mercaptopropylphosphonic acid modified gold electrode for electrochemical detection of dopamine | |
| Zhang et al. | Covalently immobilized biosensor based on gold nanoparticles modified TiO2 nanotube arrays | |
| Chen et al. | A new antibody immobilization technique based on organic polymers protected Prussian blue nanoparticles and gold colloidal nanoparticles for amperometric immunosensors | |
| Patil et al. | Facile synthesis of CuO nanostructures for non-enzymatic glucose sensor by modified SILAR method | |
| Emadoddin et al. | An antifouling impedimetric sensor based on zinc oxide embedded polyvinyl alcohol nanoplatelets for wide range dopamine determination in the presence of high concentration ascorbic acid | |
| Arora et al. | Effect of processing parameters for electrocatalytic properties of SnO 2 thin film matrix for uric acid biosensor | |
| Meng et al. | A sensitive non-enzymatic glucose sensor in alkaline media based on Cu/MnO2-modified glassy carbon electrode | |
| Du et al. | Immobilization of acetylcholinesterase based on the controllable adsorption of carbon nanotubes onto an alkanethiol monolayer for carbaryl sensing | |
| Xie et al. | Advancements of nanoscale structures and materials in impedimetric biosensing technologies | |
| Gong et al. | A glucose biosensor based on the polymerization of aniline induced by a bio-interphase of glucose oxidase and horseradish peroxidase | |
| McKenzie et al. | TiO2 phytate films as hosts and conduits for cytochrome c electrochemistry | |
| Jakubec et al. | Novel Fe@ Fe-O@ Ag nanocomposite for efficient non-enzymatic sensing of hydrogen peroxide | |
| Peng et al. | AgAuPt nanocages for highly sensitive detection of hydrogen peroxide | |
| D'Souza et al. | Immobilization and electrochemical redox behavior of cytochrome c on fullerene film-modified electrodes | |
| Hu et al. | Ni hierarchical structures supported on Titania nanowire arrays as efficient nonenzymatic glucose sensor | |
| Zanardi et al. | Effective catalytic electrode system based on polyviologen and Au nanoparticles multilayer |
Legal Events
| Date | Code | Title | Description |
|---|---|---|---|
| AS | Assignment |
Owner name: INDUSTRY-UNIVERSITY COOPERATION FOUNDATION SOGANG Free format text: ASSIGNMENT OF ASSIGNORS INTEREST;ASSIGNORS:CHOI, JEONG WOO;YAGATI, AJAY KUMAR;LEE, TAEK;AND OTHERS;REEL/FRAME:029331/0465 Effective date: 20121022 |
|
| STCF | Information on status: patent grant |
Free format text: PATENTED CASE |
|
| FEPP | Fee payment procedure |
Free format text: PAYOR NUMBER ASSIGNED (ORIGINAL EVENT CODE: ASPN); ENTITY STATUS OF PATENT OWNER: SMALL ENTITY |
|
| MAFP | Maintenance fee payment |
Free format text: PAYMENT OF MAINTENANCE FEE, 4TH YR, SMALL ENTITY (ORIGINAL EVENT CODE: M2551) Year of fee payment: 4 |
|
| FEPP | Fee payment procedure |
Free format text: MAINTENANCE FEE REMINDER MAILED (ORIGINAL EVENT CODE: REM.); ENTITY STATUS OF PATENT OWNER: SMALL ENTITY |
|
| LAPS | Lapse for failure to pay maintenance fees |
Free format text: PATENT EXPIRED FOR FAILURE TO PAY MAINTENANCE FEES (ORIGINAL EVENT CODE: EXP.); ENTITY STATUS OF PATENT OWNER: SMALL ENTITY |
|
| STCH | Information on status: patent discontinuation |
Free format text: PATENT EXPIRED DUE TO NONPAYMENT OF MAINTENANCE FEES UNDER 37 CFR 1.362 |
|
| FP | Lapsed due to failure to pay maintenance fee |
Effective date: 20221028 |